Embed Size (px)
Citation preview

SOFTWARE PROCESS—Improvement and PracticeSoftw. Process Improve. Pract. 4, 21–31 (1998)
The Quest for TechnicalControlling†
Christof Ebert*Alcatel, Switching Systems Division, Antwerp, Belgium
Practice Section
The need for a coherent approach towards technical controlling of software projects hasbeen prevalent for years. Many software projects, however, are still characterized by a moreintuitive than reproducible decision-making approach. Although metrics are collectedoccasionally, they are not used for driving decisions because they are inconsistent and focuson the wrong topics. Practical experience of the more successful players in the field clearlyindicates the benefits of technical controlling; progress metrics of work products and processmetrics related to ongoing activities provide insight into projects and at the same time intoprocess improvements. This article focuses on introducing and maintaining a corporatemetrics program in a highly distributed large organization. Experiences are shared that showhow the metrics program closely supports an ongoing SPI initiative. Results from Alcatel’sSwitching System Division are included to show practical impact. Copyright 1998 JohnWiley & Sons, Ltd.
KEY WORDS: CMM; process improvement; project management; software metrics; technical controlling
1. INTRODUCTION
‘Beyond high philosophy and grand themeslie the gritty details of practice.’
D. Gavin
Quantitative data are crucial for understandingsoftware development processes and to steer anyre-engineering activity. Management of a softwareprocess improvement (SPI) activity is not muchdifferent from managing a project. Unless sup-ported by metrics, it is impossible to fully under-
*Correspondence to: C. Ebert, Alcatel Telecom, Francis Welle-splein 1, 2018 Antwerp, Belgium†Parts of this article are based on an earlier version whichappeared in the International Journal of Project Management, 17(1),17–28 (1999), with permission from Elsevier Science.
CCC 1077-4866/98/010021-11$17.50Copyright 1998 John Wiley & Sons, Ltd.
stand what is happening and what will be theoutcomes of prospective changes. Quantitativemanagement of SPI is thus concerned with ident-ifying, measuring, accumulating, analysing andinterpreting project and process information forstrategy formulation, planning and tracking activi-ties, decision-making and cost accounting. As suchit is more than only ensuring overall technicalcorrectness of a project as earlier defined (Rook1986). Objectives are derived from these activities:
I Decision-making: What should I do?I Attention-directing: What should I look at?I Performance evaluation: How well am I doing?I Planning: What can we reasonably achieve in
a given period?I Target-setting: How much can we improve in
a given period?
SPI programs are different in nature and targetenvironment; they depend on the business goals

Practice Section C. Ebert
and the competitive situation of the company, itsproducts and the underlying processes. We willfocus in this article on the SPI program of Alcatel’sSwitching Systems Division. Telecommunicationswitching systems are among the biggest challengesin current software development because they aredistributed both during development time andduring runtime. Due to their considerable size(several MLOC), such systems are developed withinlocally distributed development units by globallyoperating companies. The Alcatel 1000 S12 is adigital switching system that is currently used inover 40 countries world-wide. It provides a widerange of functionality (small local exchanges, transitexchanges, international exchanges, network ser-vice centres, or intelligent networks) and scale-ability (from small remote exchanges to large localexchanges). Its typical size is about 2.5 MLOC ofwhich a big portion is customized for local networkoperators. The code used for S12 is realized inAssembler, C and CHILL. In terms of functionality,S12 covers almost all areas of software andcomputer engineering. This includes operatingsystems, database management and distributedreal-time software.
The paper is organized as follows. Section 2gives a brief overview of metrics used for decisionmaking in software project management. Section3 relates metrics activities to SPI. Starting acorporate metrics program in a distributed organi-zation as part of an SPI initiative is introducedin Section 4. Experiences are provided that areparticularly relevant from the perspective of organi-zational learning. Section 5 is a brief introductionto ROI calculation, as it is often requested formanagement decisions in an SPI program. Finally,Section 6 summarizes the results and gives anoutlook on how metrics and SPI will evolve overtime in an organization.
2. METRICS AND DECISION MAKING
The single best technology for getting some controlover deadlines and other resource constraints is toset formal objectives for quality and resources ina measurable way (Fenton and Pfleeger 1997, Starket al. 1994). Planning and control activities cannotbe separated. Managers control by tracking actualsagainst plans and acting on observed deviations.Controls should focus on significant deviationsCopyright 1998 John Wiley & Sons, Ltd. Softw. Process Improve. Pract. 4, 21–31 (1998)
22
from standards and at the same time suggestappropriate ways for fixing the problems. Typicallythese standards are schedules, budgets and qualitytargets established by the project plan. All criticalattributes should be established as both measurableand testable to ensure effective tracking. The worstacceptable level should be clear although theinternal target is in most cases higher.
The influence of metrics’ definition and appli-cation from project start (e.g. estimation, targetsetting and planning) to steering (e.g. tracking andbudget control, quality management) to mainte-nance (e.g. failure rates, operations planning) isvery well described in the relevant IEEE Standardfor Developing Software Life Cycle Processes (1992).This standard also helps in defining the differentprocesses that constitute the entire developmentprocess including relationships to managementactivities.
Although the corporate metrics program hasbeen set up and is maintained as part of theDivision’s SPI program, most benefits that werecorded were indeed related to project manage-ment:
I improved tracking and control of each develop-ment project based on uniform mechanisms;
I earlier identification of deviations from thegiven targets and plans;
I accumulation of history data from all differenttypes of projects that are reused for improvingestimations and planning of further projects;
I tracking process improvements and deviationsfrom processes.
Metrics are obviously the key to successfullymanaging an SPI program because they link theimprovement strategies, pilot results and variousprocess re-engineering efforts to the day-to-daybusiness that after all keeps the company alive.
One of the main targets of any kind of measure-ment is that it should provide an objective way ofexpressing information, free of value judgements.This is particularly important when the informationconcerned is ‘bad news’, for instance, related toproductivity or cost, and thus not necessarily tobe well received. Often the observed humantendency is to ignore any criticism related to one’sown area and direct attention to somebody else’s.Test articulates that ‘the design is badly structured’,while operations emphasize that ‘software hasnot been adequately tested’. Any improvement

Practice Section The Quest for Technical Controlling
activities must therefore be based on hard numericalevidence. The first use of metrics is most often toinvestigate the current state of the software process.Table 1 shows the most relevant metrics to differentlevels of process maturity. Basically, application ofmetrics is mainly restricted due to non-repeatableprocesses and thus a limited degree of consistencyacross projects.
With such a premise it is feasible to set up notonly a release-oriented phase end target but alsophase entry criteria that allow for rejection tomodule test or inspections if the system quality isinadequate. Related test process metrics includetest coverage, number of open fault reports byseverity, closure delay of fault reports, and otherproduct-related quality, reliability and stabilitymetrics. Such metrics allow judgements in situ-ations when, due to difficulties in testing, decisionson the nature and sequence of alternative pathsthrough the testing task should be made, whileconsidering both the entire testing plan and thepresent project priorities. For example, there arecircumstances in which full testing of a limited setof features will be preferred to an incomplete levelof testing across full (contracted) functionality.
Table 1. Appropriate metrics for different CMM levels
CMM Description Metrics
5 Continuous Process metrics for theimprovements are control of process changeinstitutionalized management
4 Products and processes Process metrics for theare quantitatively control of single processesmanaged
3 Appropriate techniques Defined and establishedare institutionalized product metrics; automatic
metric collection2 Project management is Defined and reproducible
established project metrics for planningand tracking (fault status,effort, size, progress); fewprocess metrics for SPIprogress tracking
1 Process is informal and Few project metrics (size,ad hoc effort, faults); however,
metrics are inconsistent andnot reproducible
Copyright 1998 John Wiley & Sons, Ltd. Softw. Process Improve. Pract. 4, 21–31 (1998)
23
3. SETTING OBJECTIVES – THE CASE FORPROCESS IMPROVEMENT
A primary business goal for any telecommunicationsystems supplier today is to control and reducesoftware development cost. Software developmentincreasingly contributes to product cost. It hasbeen shown within various companies that the SEICMM is an effective roadmap for achieving cost-effective solutions. Many of the problems that leadto project delays or failures are technical, howeverthe critical ones are managerial. Software develop-ment depends on work products, processes andcommunication. It is only structured if a structureis imposed and controlled. This is where the CMMfits in. Figure 1, which was compiled from differentindustrial databases, gives an overview of faultdetection within organizations according to theirrespective maturity level (effects on ROI are furtherexplained in Section 5). Obviously, what is doneright in software development is done early. Thereis little chance for catching up when things arediscovered to be going wrong later in the develop-ment.
Since the CMM provides both a guideline foridentifying strengths and weaknesses of thesoftware development process and a roadmapfor improvement actions, Alcatel also based itsimprovement activities on the CMM. Periodicassessments are conducted in all major develop-ment sites. The direct findings are analysed accord-ing to their prospective impacts on Alcatel’s busi-ness goals and then prioritized to select those areaswith highest improvement potential. Based onthis ranking a concrete planning of improvementactions is repeatedly refined, resulting in an action
Figure 1. Typical benchmark effects of detecting faultsearly in the life cycle

Practice Section C. Ebert
plan with detailed descriptions of improvementtasks with responsibilities, effort estimates etc.Checkpointing assessments of the same type arerepeatedly done to track the implementation ofthe improvement plan.
The improvement program within S12 develop-ment consumes roughly 5% of the total develop-ment effort for activities such as process control,pilots, tools improvements and enhanced trackingactivities. The metrics program is one core part ofthe entire improvement program (Figure 2). Severalachievements during the first part of the S12improvement program can be attributed to increas-ing visibility of project status, improved awarenessof work products’ quality and setting improvementtargets for results of each major development phase.
Our experiences with SPI include:
I Define a common process framework that isapplicable for all types of projects (perhapsafter some predefined degrees of tailoring) andthus build a common decision framework thatallows for sharing experience and learninglessons from other projects, both positive andnegative.
I Focus on quality which reflects that customers,when faced with a choice, will always selectquality when the functionality of the optionsis nearly equivalent.
I Freeze requirements at a distinct point duringdesign and decide on phased deliveries insteadof struggling with ever-changing requirementson a fixed schedule and budget.
I Involve customers in the process and itsimprovement since in many cases they arewilling to share their knowledge and experience.
I Understand the needs of the customer instead
Figure 2. The S12 software improvement activities andemphasis on the metrics program
Copyright 1998 John Wiley & Sons, Ltd. Softw. Process Improve. Pract. 4, 21–31 (1998)
24
of trying to stick to specifications that aretypically unclear to both sides upfront. For thesame reason customer satisfaction is much morerelevant from an SQA viewpoint than merespecification conformance.
Different groups typically work towards individu-ally controlled goals that build up to businessdivision level goals and corporate goals. Anexample for improved maintainability illustratesthis hierarchy. A business division level goalcould be to improve maintainability within legacysystems, as it is strategically important for alltelecommunication suppliers. Design managersmight break that down further to redesigningexactly those components that are at the edge ofbeing maintainable. Project managers, on the otherhand, face a trade-off with time to market andmight concentrate on incremental builds instead.Clearly, both need appropriate indicators to supporttheir selection processes which define the waytowards the metrics related to these goals. Obvi-ously one of the key success criteria for SPI is tounderstand the political context and various hiddenagendas behind technical decisions in order tomake compromises or weigh alternatives.
Objectives related to individual processes mustbe unambiguous and agreed by the respectivegroups. This is obvious for test and design groups.While the first are reinforced for finding defectsand thus focus on writing and executing effectivetest suites, design groups are targeting to deliveringcode that can be executed without defects. In thecase of defects they must be corrected efficiently,which allows for setting up another metric for adesign group which is the backlog of faults it hasto resolve.
It is thus important for process metrics toconsider different viewpoints and their individualgoals related to promotion, projects and the busi-ness. Most organizations have at least four: thepractitioner; the project manager; the departmenthead, and corporate executives. Their motivationand typical activities differ greatly and often createconfusing goals which at the worst level areresolved on the practitioner level. Reuse, forinstance, continuously creates trade-off discussions.When a project incurs expense due to keepingcomponents maintainable and to promote theirreusability, who pays for it and where is it recordedin a history database that compares efficiency

Practice Section The Quest for Technical Controlling
(e.g. bang per buck) of projects and thus oftheir management?
Managing and tracking SPI can be done ondifferent levels of abstraction. Senior managementis interested in the overall achievements based onwhat has been invested in the program (see Section4). Related metrics include the effectiveness of faultdetection because the obvious relationship to costof quality is directly related to the most commonbusiness goal of cost reduction. Lead-time reductionand effort reduction is related to reduced reworkand as such also related to fewer defects and earlydetection. On the project level, SPI managementincludes a variety of process metrics that compareefficiencies and thus relate on the microscopic levelto achieving the business goals (e.g. Figure 3).
4. SETTING UP A METRICS PROGRAM INA DISTRIBUTED ORGANIZATION
This section shares some selected experiences wehad while setting up a globally distributed metricsprogram in the different locations of the SwitchingSystems Division. The following key success factorswere identified:
I Start small and immediately (see initial time-table in Table 2). It is definitely not enoughonly to select goals and metrics. Tools andreporting must be in line, and all of this takesits time. It must, however, be clearly determinedwhat needs to be measured before decidingbased on what can be measured. Use externalconsultants where needed to get additionalexperience and authority.
I Motivate the metrics program with concreteand achievable improvement goals. Unless tar-gets are achievable and clearly communicated
Figure 3. Metrics for SPI management – example: codereading speed versus related fault rate in different yearsof the SPI program
Copyright 1998 John Wiley & Sons, Ltd. Softw. Process Improve. Pract. 4, 21–31 (1998)
25
Table 2. Timetable for setting up a corporate metric program
Activity Elapsed Durationtime
Initial targets set up 0 2 weeksCreation and kick-off of metric team 2 weeks 1 dayGoal determination for projects and 3 weeks 2 weeksprocessesIdentification of impact factors 4 weeks 2 weeksSelection of initial suite of metrics 5 weeks 1 weekReport definition 6 weeks 1 weekKick-off with management 6 weeks 2 hoursInitial tool selection and tuning 6 weeks 3 weeksSelection of projects/metric plan 6 weeks 1 weekKick-off with project teams/managers 7 weeks 2 hoursCollection of metric baselines 7 weeks 2 weeksMetric reports, tool application 8 weeks continuouslyReview and tuning of reports 10 weeks 1 weekMonthly metric-based status reports 12 weeks continuouslywithin projectsApplication of metrics for project 16 weeks continuouslytracking and process improvementControl and feedback on metric 24 weeks quarterlyprogramEnhancements of metric program 1 year continuously
to middle management and practitioners theywill only feel metrics as yet another instrumentof management control. Goals must be in linewith each other and on various levels. Businessgoals must be broken down to project goalsand those must be aligned with departmentgoals and contents of quality plans. Clearlycommunicated priorities might help with indi-vidual decisions.
I Provide training both for practitioners, whoafter all have to deliver the accurate raw data,and for management, who will use the metrics.The cost and effort of training often stops itseffective delivery. Any training takes time,money, and personnel to prepare, update,deliver or receive it.
I Establish focal points for metrics in each projectand department. Individual roles and responsi-bilities must be made clear to ensure a sus-tainable metrics program that endures initialSPI activities (see below for an explanation ofFigure 4).
I Define and align the software processes toenable comparison of metrics. While improvingprocesses or setting up new processes, ensurethat the related metrics are maintained at the

Practice Section C. Ebert
Figure 4. Roles and responsibilities within metricsprogram
same time. Once estimation moves from effortto size to functionality, clearly the relatedproduct metrics must follow.
I Collect objective and reproducible data. Ensurethe chosen metrics are relevant for the selectedgoals (e.g. tracking to reduce milestone delay)and acceptable for the target community (e.g.it is not wise to start with productivity metrics).
I Get support from management. Enduring buy-in of management can only be achieved if theresponsibility for improvements and the spanof necessary control are aligned with realistictargets. Since in many cases metrics beyondtest tracking and faults are new instrumentsfor parts of management, this group must alsobe provided with the necessary training.
I Avoid abuse of metrics by any means. Metricsmust be ‘politically correct’ in a sense that theyshould not immediately target persons or satisfyneeds for personal blame. Metrics might hurtbut should not blame. Certainly limited visi-bility and access to the metrics helps in creatingcredibility among practitioners (Table 3). Beforeintroducing metrics, however, it is even moreimportant to indicate the application of the
Table 3. Visibility, access and timing of metrics
Private data for practitioner Private data for project team Corporate dataImmediate access (i.e. minutes) Hourly or daily access Weekly or monthly access
Fault rates of individuals Fault rates in subsystems Fault rates in projectFault rates in module before integration New/changed code per module Failure rates in projectFault rates during coding Estimated effort and new/changed size New/changed code in projectNumber of local compile runs per module Effort per projectEffort spent for single module Number of repeated reviews and Effort per delivered code size (efficiency)
inspections Effort per faultFault rates during design Effort per phase and in processes
Elapse time per process and phases
Copyright 1998 John Wiley & Sons, Ltd. Softw. Process Improve. Pract. 4, 21–31 (1998)
26
metrics (such as individual improvements withindividual data) based on a supportive climate.It is often helpful to change perspective towardsthe one providing raw data: is the activityadding value to her daily work? Statistical issuesmight not automatically align with emotionalpriorities. Remember that their perception istheir reality.
I The targets of any improvement program mustbe clearly communicated and perceived by alllevels as realistic enough to fight for. Eachsingle process change must be accompaniedwith the respective goals and supportive metricsthat are aligned. Those affected need to feelthat they have some role in setting targets.Where goals are not shared and the climate isdominated by threats and frustration, the met-rics program is more likely to fail.
I Communicate success stories where metricsenabled better tracking or cost control. Thisincludes identifying metrics advocates that helpin selling the measurement program. Cham-pions must be identified at all levels of manage-ment, especially at senior level, that really usemetrics and thus help to support the program.Metrics can even tie in an individual’s work tothe bigger picture if communicated adequately.
I Slowly enhance the metric program. Thisincludes defining ‘success criteria’ to be usedto judge the results of the program. Since thereis no perfect metrics program it is necessary todetermine something like a ‘80% available’acceptance limit that allows declaration ofsuccess when that is achieved.
I Do not overemphasize the numbers. What theybring to light is much more relevant, such asemerging trends or patterns. After all, the

Practice Section The Quest for Technical Controlling
focus is on successful projects and efficiencyimprovement and not on metrics.
Metrics need to make sense to everybody withinthe organization who will be in contact with them.Therefore, the metrics should be piloted andevaluated after some time. Potential evaluationquestions include:
I Are the selected metrics consistent with theoriginal improvement targets? Do the metricsprovide added value? Do they make sense fromdifferent angles and can that meaning becommunicated without many slides? If metricsare considering what is measurable but do notsupport improvement tracking, they are perfectfor hiding issues but should not be labelled met-rics.
I Do the chosen metrics send the right messageabout what the organization considers relevant?Metrics should spotlight by default and withoutcumbersome investigations of what might bebehind. Are the right things being spotlighted?
I Do the metrics clearly follow a perspectivethat allows comparisons? If metrics includeambiguities or heterogeneous viewpoints theycannot be used as history data.
4.1. The Metrics Process, Roles andResponsibilities
Obviously the introduction of metrics to projectshas to follow a stepwise approach that must becarefully coached. Each new metric that needstools support must be piloted first in order to findout whether definitions and tools description aresufficient for the collection. Then the institutionaliz-ation must be planned and coached in order toobtain valid data. For that reason the followingthree roles are established:
1. Project metrics responsible within each singleproject as a focal point for engineers or theproject management in the project (Figure4). They ensure that the metric program isuniformly implemented and understood. Therole includes support for data collection acrossfunctions and analysis of the project metrics.The latter is most relevant for a project managerbecause he must be well aware of progress,deviations and risks with respect to quality ordelivery targets. By creating the role of pro-
Copyright 1998 John Wiley & Sons, Ltd. Softw. Process Improve. Pract. 4, 21–31 (1998)
27
ject metrics responsible we guaranteed that theresponsibility was clearly assigned as of projectstart, while still allowing for distributed(functional) metrics collection.
2. Local metric teams in each location to be afocal point for all metrics-related questions ina location, to synchronize metrics activities, toemphasize commonality, and to collect localrequirements from the different projects. Be-sides being the focal point for the metricsprogram in a single location, they providetraining and coaching of management andpractitioners on metrics, their use and appli-cation. In addition they ensure that hetero-geneous tools are increasingly aligned or thattools and forms for data collection and analysisare made available to the projects and func-tional organization.
3. A central (business division) metric team cre-ated by representatives of the local metricteams of the organization. They together ensurethat rationalization and standardization of acommon set of metrics and the related toolsand charts are accelerated. Upon buildinga corporate metrics program and aligningprocesses with the software process improve-ment activities, the creation of a history datab-ase for the entire organization is an importantprerequisite of improving estimates.
This structure guarantees that each single changeor refinement of metrics and underlying tools, andalso needs from projects, can be easily communi-cated through the whole organization. Use of teamsshould, however, be done cautiously. While a teamhas the capability to take advantage of diversebackgrounds and expertise, the effort is mosteffective when there are no more than three peopleinvolved. Larger teams spend too much timebacktracking on metrics choices. We also foundthat when potential users worked jointly to developthe metrics set with the metrics support staff, theprogram was more readily accepted.
The related metrics process is applicable in theday-to-day project environment. It is based on aset of defined metrics and supports the setting upand tracking of project targets and improvementgoals (Figure 5):
1. Based on a set of predefined corporate metrics,the first step is to select metrics suitable forthe project.

Practice Section C. Ebert
Figure 5. Integrated measurement process overview
2. Then the raw data is collected to calculatemetrics. Be aware of the operational systemsthat people work with that need to supplydata. If the data is not available easily chancesare high that the metric is inaccurate andpeople tend to ignore further metrics requests.People might then even comply with the letterof the definition but not with the spirit ofthe metric.
3. Metrics are then analysed and reported throughthe appropriate channels. Analysis includestwo steps. First data is validated to make sureit is complete, correct, and consistent withthe goals it addresses. Do not assume thatautomatic metrics are always trustworthy. Atleast perform sample checks. The real challengeis the second step, which investigates whatis behind the metrics. Some conclusions arestraightforward, while others require an in-depth understanding of how the metrics relatewith each other. Consolidating metrics andaggregating results must be done with greatcaution, even if apples and apples might fitneatly, so to speak. Results are useless unlessmajor observations are reported back to thepeople who make improvements or decisions.
4. Finally, the necessary decisions and actions aremade based on the results of the analysis. Thesame metrics might trigger different decisionsdepending on the target audience. While seniormanagement may just want to get an indicationhow well the improvement program is doing,the local SEPG leader might carefully studyprocess metrics to eliminate deficiencies.
Copyright 1998 John Wiley & Sons, Ltd. Softw. Process Improve. Pract. 4, 21–31 (1998)
28
4.2. Metrics Selection and Definition
Each metric’s definition should ensure consistentinterpretation and collection across the organiza-tion. Capturing precise metrics information notonly helps with communicating what is behindthe figures but also builds the requirements forautomatic tools support and provides basic materialfor training course development. We have used thefollowing sections within the definition template:
I name and identifier of the metric;I brief description;I relationships to goals or improvement targets;I definition with precise calculation;I tools support (links and references to the
supporting tools, such as databases, spread-sheets etc.);
I visualization with references to templates;I collection period and reporting frequency;I alarm levels for interpretation;I configuration control with links to storage of
(periodically collected) metrics.
A project-specific measurement plan links thegeneric metric’s definition to concrete projects withtheir individual project goals and responsibilities.Additional metrics to be used only in that projectare referred to in the measurement plan. Themeasurement plan is linked to the quality plan tofacilitate alignment of targets.
Often terminology must be reworked, especiallywhen the projects are scattered in a distributedorganization, such as Alcatel. The standard defi-nition might include several sections applicable fordifferent project types. Project size as well as
Practice Section The Quest for Technical Controlling
design paradigms influence definitions and metriccalculation, even if the metric goals and underlyingrationales are the same, such as with deliverablestracking.
5. ROI CALCULATION
ROI is difficult to calculate in software develop-ment. This is not so much due to not havingcollected effort figures, but rather due to dis-tinguishing the actual effort figures that relate toinvestment (which otherwise would not have beendone) and the returns (in comparison to whatwould have happened if there had been noinvestment). For many years ROI data was reportedbut in most cases not backed up by real data, orwhere real data existed, it was counter to the currentmainstream viewpoints (Fenton and Pfleeger 1997).Only recently several studies have been publishedthat try to compare results of software processimprovement activities (McGibbon 1996, Jones1995).
For calculating ROI effects the following rulesshould be considered:
I Samples should consider projects before andafter the start of the improvement program tobe evaluated with ROI.
I Controlling should be able to provide historydata (e.g. effort).
I Aggregated or combined effort or cost figuresmust be separated (i.e. prevention, appraisalcost, cost of non-performance, cost of perform-ance – which are typically spent in any case).
I Include only those effects which trace back toroot causes that were part of the originalimprovement planning.
I Check cost data on consistency within oneproject and across projects.
ROI is most efficiently presented according to thefollowing flow:
1. current results (these are the potentials, i.e.problems, cost, causes);
2. known effects in other (competing) companies(i.e. improvement programs in other compa-nies, benchmarking data, cost-benefit esti-mation for these companies);
3. ROI calculation (calculate cost of quality permonth for several sample projects, calculate
Copyright 1998 John Wiley & Sons, Ltd. Softw. Process Improve. Pract. 4, 21–31 (1998)
29
the savings since start of the improvementprogram, extrapolate these savings for allaffected projects – which is benefit – comparethe benefit with the cost of the improvementprogram – which is ROI – never include costof performance since this is regular effort).
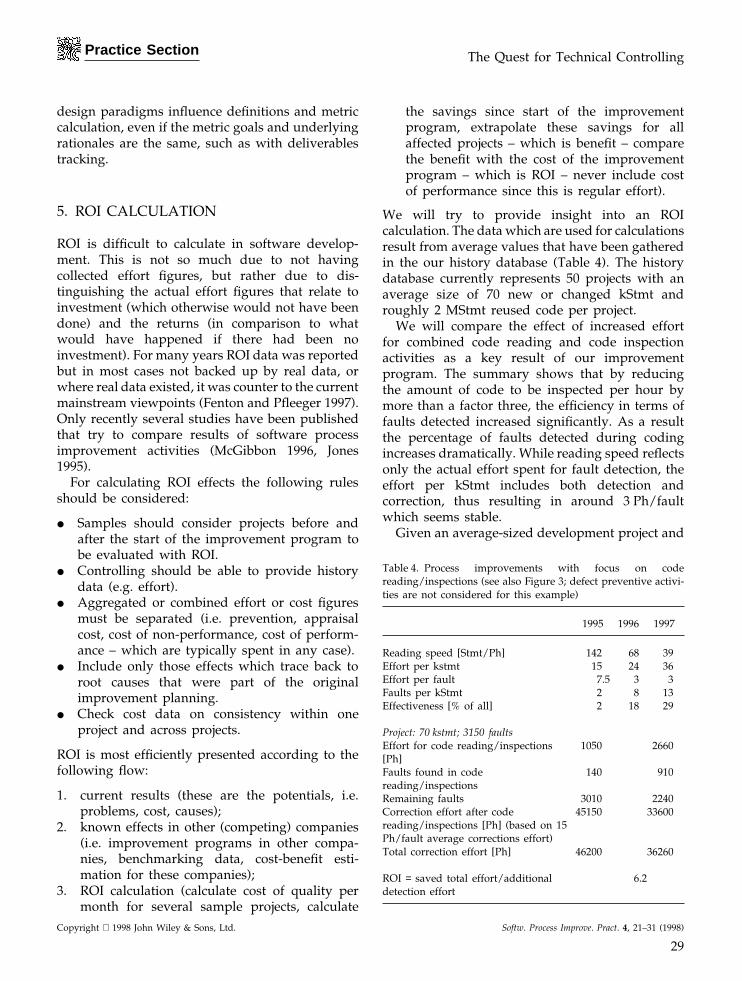
We will try to provide insight into an ROIcalculation. The data which are used for calculationsresult from average values that have been gatheredin the our history database (Table 4). The historydatabase currently represents 50 projects with anaverage size of 70 new or changed kStmt androughly 2 MStmt reused code per project.
We will compare the effect of increased effortfor combined code reading and code inspectionactivities as a key result of our improvementprogram. The summary shows that by reducingthe amount of code to be inspected per hour bymore than a factor three, the efficiency in terms offaults detected increased significantly. As a resultthe percentage of faults detected during codingincreases dramatically. While reading speed reflectsonly the actual effort spent for fault detection, theeffort per kStmt includes both detection andcorrection, thus resulting in around 3 Ph/faultwhich seems stable.
Given an average-sized development project and
Table 4. Process improvements with focus on codereading/inspections (see also Figure 3; defect preventive activi-ties are not considered for this example)
1995 1996 1997
Reading speed [Stmt/Ph] 142 68 39Effort per kstmt 15 24 36Effort per fault 7.5 3 3Faults per kStmt 2 8 13Effectiveness [% of all] 2 18 29
Project: 70 kstmt; 3150 faultsEffort for code reading/inspections 1050 2660[Ph]Faults found in code 140 910reading/inspectionsRemaining faults 3010 2240Correction effort after code 45150 33600reading/inspections [Ph] (based on 15Ph/fault average corrections effort)Total correction effort [Ph] 46200 36260
ROI = saved total effort/additional 6.2detection effort

Practice Section C. Ebert
only focusing on the new and changed softwarewithout taking into account any defect-preventiveresults over time, the following calculation can bederived. Effort spent for code reading and inspec-tion activities increases by 1610 Ph. Assuming aconstant average combined appraisal cost and costof non-performance (i.e. detection and correctioneffort) after coding of 15 Ph/fault, the total effectis 9940 Ph less spent in 1997. This results in anROI value of 6.2 (i.e. each additional hour spentduring code reading and inspections yields 6.2saved hours of appraisal and non-performanceactivities afterwards).
We had the following experiences with ROI calcu-lations:
I It is better to collect the different effort figuresduring a project rather than afterwards.
I Activities related to distinct effort figures mustbe defined (activity-based costing helps a lot).
I Cost and effort must not be estimated, butrather collected in projects (typically the inputsto the estimation are questioned until the entirecalculation is not acceptable any more).
I Detailed quality cost are helpful for root causeanalyses and related defect prevention activities.
I Tangible cost savings are the single best supportfor a running improvement program.
I Cost of non-performance is a perfect triggerfor an SPI program.
I Obvious management and software engineeringpractices are typically no ROI topics.
I There are many ‘hidden’ ROI potentials thatare often difficult to quantify (e.g. customersatisfaction, improved market share because ofbetter quality, delivery accuracy and lowerper feature costs, opportunity costs, reducedmaintenance costs in follow-on projects,improved reusability, employee satisfaction,resources are available for new projects insteadof wasting them for firefighting).
I There are also hidden investments that mustbe accounted (e.g. training, infrastructure,coaching, additional metrics, additional man-agement activities, process maintenance).
I Without any metrics managers do not need tobe convinced (poor managers entirely believein qualitative reasoning and call it ‘intuition’and take it as an excuse for lack of motivation –without metrics no improvement and withoutimprovement no metrics).
Copyright 1998 John Wiley & Sons, Ltd. Softw. Process Improve. Pract. 4, 21–31 (1998)
30
Not all ROI calculations are based on monetarybenefits. Depending on the business goals, it canbe directly presented in reduced lead time orhigher efficiency and productivity.
6. CONCLUSIONS
Software process improvement is now a big issueon the agenda of all organizations with softwareas a core business. As such it is also a majorresearch topic, that may continue to grow inimportance well into the 21st century. However,some software technologies have a shorter lifetimeand management attention is focused more onshort-term achievements with impact to the scorecard. Unless tangible results can be achieved inthe relative short timeframe, interest in SPI willquickly wane.
We have presented the introduction of a corpor-ate metrics program as part of the SPI initiative ofAlcatel’s Switching Systems Division. Any datapresented here on effort or value of SPI are onlyapproximate and closely linked to the environmentthey were extracted from. It is obvious by nowthat the more advanced the corporate processmaturity, the more various and specific the metricsthat are used. While maintaining the metricsprogram it must be emphasized that metrical needsevolve over time. The critical precondition of anySPI program is the focus on metrics and theireffective exploitation.
So far many of the industrial discussions andarticles related to SPI are based on facts, whileresearch is targeting theories and small-scaleexamples. Both are valid – from the respectiveviewpoints. It would, however, be helpful to bridgethe gap with corporate studies related to answeringthe two important questions:
I What does it cost to improve software pro-cesses?
I How long will it take to make tangible improve-ments?
Answering such questions of course needs researchfocus on areas such as quality improvement,better productivity, shorter lead-time or highercustomer satisfaction.

Practice Section The Quest for Technical Controlling
REFERENCES
Fenton, N.E. and S.L. Pfleeger. 1997. Software Metrics:A Practical and Rigorous Approach. Chapman & Hall,London, UK.
IEEE Standard for Developing Software Life Cycle Processes.1992. IEEE Std 1074–1991, IEEE, Piscataway, USA.
Jones, T.C. 1995. Return on investment in softwaremeasurement. Proc. 6. Int. Conf. Applications of SoftwareMeasurement, Orlando, FL, USA.
Copyright 1998 John Wiley & Sons, Ltd. Softw. Process Improve. Pract. 4, 21–31 (1998)
31
McGibbon, T. 1996. A Business Case for SoftwareProcess Improvement. DACS State-of-the-Art Report. RomeLaboratory, http://www.dacs.com/techs/roi.soar/soar.html#research.
Rook, P. 1986. Controlling software projects. SoftwareEngineering Journal, 1 7–16.
Stark, G., R.C. Durst and C.W. Vowell. 1994. Usingmetrics in management decision making. IEEE Computer,27, 42–48.