Embed Size (px)
Citation preview
The quantitative impact of armed conflict on education in Nigeria: counting the human and financial costs
Amir Jones
Ruth Naylor
The quantitative impact of armed conflict on education in Nigeria: case study
Welcome to CfBT Education Trust
CfBT Education Trust is a top 30* UK charity providing education services for public benefit in the UK and internationally. Established over 40 years ago, CfBT Education Trust has an annual turnover exceeding £100 million and employs more than 2,000 staff worldwide. We aspire to be the world’s leading provider of education services, with a particular interest in school effectiveness.
Our work involves school improvement through inspection, school workforce development and curriculum design for the UK’s Department for Education, the Office for Standards in Education, Children’s Services and Skills (Ofsted), local authorities and an increasing number of independent and state schools, free schools and academies. We provide services direct to learners in our schools and in young offender institutions.
Internationally we have successfully implemented education programmes for governments in the Middle East, Sub-Saharan Africa and South East Asia and work on projects funded by donors such as the Department for International Development, the European Commission, the Australian Department of Foreign Affairs and Trade, the World Bank and the US Agency for International Development, in low- and middle-income countries.
Surpluses generated by our operations are reinvested in our educational research programme.
Visit www.cfbt.com for more information.
*CfBT is ranked 27 out of 3,000 charities in the UK based on income in Top 3,000 Charities 2010/11 published by Caritas Data
About PEIC
Protect Education in Insecurity and Conflict (PEIC) was founded by Her Highness Sheikha Moza Bint Nasser in 2009 to promote and protect the right to education in areas affected by crisis, conflict and insecurity. Based in Doha, Qatar, PEIC is a policy, research, capacity-building and advocacy programme of Education Above All, and brings together practitioners and specialists in education, international law and child protection. PEIC envisions a world where all who wish to learn, teach and research – at all levels of education systems – can do so in peace, security and dignity.
Visit http://educationandconflict.org for more information.
Front cover photograph: William Fernando Martinez.
The views and opinions expressed in this publication are those of the authors and do not necessarily represent the views of CfBT Education Trust or PEIC.
© CfBT Education Trust 2014

1
The quantitative impact of armed conflict on education in Nigeria: case study
Contents
About the authors 2
Acknowledgements 2
Acronyms and abbreviations 3
1 Introduction 4
2 Conflict history 5
3 The human costs of conflict to education: out-of-school children in Nigeria 7
3.1 Data sources on OOSC 7
3.2 Numbers of OOSC 8
3.3 Gender, conflict and access to education 9
3.4 Geographical distribution of conflict and OOSC 10
3.5 The effects of conflict on access to education 12
3.6 Estimating the full impact of conflict: enrolment trends over time 13
3.7 Summary 17
4 The financial costs of conflict to education in Nigeria 19
4.1 Direct monetary cost of conflict to education 19
4.2 Broader impacts of conflict on education 25
4.3 Indirect cost of conflict through missed education 29
4.4 Summary 30
5 Conclusion 32
References 34
Statistical data sources on conflict and enrolment 36

2
The quantitative impact of armed conflict on education in Nigeria: case study
About the authors
Amir Jones is an Associate Consultant with CfBT Education Trust. His expertise lies in education planning, financing and policy analysis and he has worked with a range of developing country governments, donors and non-governmental organisations (NGOs). He has also undertaken research in numerous areas, including a detailed case study of education and leadership in Ghana for the Developmental Leadership Program.
Ruth Naylor is a Senior International Advisor with CfBT Education Trust. Her expertise lies in education in conflict-affected countries, education statistics, girls’ education and monitoring and evaluation. She has worked as a consultant, advisor, researcher and trainer and has worked with a range of developing-country governments, donors and non-governmental organisations (NGOs). She is a member of the Interagency Network on Education in Emergencies Working Group on Education and Fragility. She has led a number of large evaluations including a global evaluation of the impact of Save the Children’s Rewrite the Future programme on the quality of education in conflict-affected countries, with case studies in Afghanistan, Angola, Nepal and South Sudan. She has also worked in Cambodia, Ethiopia, Kenya, Nigeria, Papua New Guinea, Rwanda, Sierra Leone, Sudan, Solomon Islands, Tanzania and Uganda. She has evaluated and advised on programmes in primary schools, secondary schools, teacher training colleges, higher education, accelerated learning classes and community-based schools.
Acknowledgements
The authors would like to thank PEIC, and Margaret Sinclair, Fatma Al Madheed and Mark Richmond in particular, for commissioning this work and for their support and guidance in its development. We are also very grateful to Susy Ndaruhutse for her extensive input into the research. Special thanks go to a number of colleagues who generously provided access to data and insightful comments along the way. These include Paul Atherton, Shelley Collins, Janice Dolan, Kurt Moses, Diya Nijhowne, Pauline Rose, Martyn Shannon, Robin Shields and Jennifer Sklar.

3
The quantitative impact of armed conflict on education in Nigeria: case study
Acronyms and abbreviations
BRD Battle-related death
DHS Demographic and Health Survey
DRC Democratic Republic of the Congo
EMIS Education management information system
EPDC Education Policy and Data Center
GCPEA Global Coalition to Protect Education from Attack
IDMC Internal Displacement Monitoring Centre
IDP Internally displaced person
ISCED International Standard Classification of Education
MICS Multiple Indicator Cluster Survey
NAR Net attendance rate
NEDS Nigeria Education Data Survey
NER Net enrolment rate
NHES Nigeria Household Expenditure Survey
OOSC Out-of-school children
PEIC Protect Education in Insecurity and Conflict
ROI Return on investment
UBE Universal Basic Education
UCDP Uppsala Conflict Data Program
UIS UNESCO Institute for Statistics
UNESCO United Nations Organization for Education, Science and Culture
UNHCR United Nations High Commissioner for Refugees
UPE Universal Primary Education
4
The quantitative impact of armed conflict on education in Nigeria: case study
1 Introduction
This case study accompanies the report The quantitative impact of armed conflict on education: counting the human and financial costs commissioned by Protecting Education in Insecurity and Conflict, part of the Education Above All Foundation. It is one of three country case studies conducted for this research. The other case study countries are the Democratic Republic of the Congo and Pakistan.
That report outlines how conflict affects education, noting ten main channels through which conflict can impact on access to education and learning:
• School closure due to targeted attacks, collateral damage and military use of school buildings
• Death and injury to teachers and students
• Fear of sending children to school, and teachers’ fear of attending due to targeted attacks, threats of attacks or general insecurity reducing freedom of movement
• Recruitment of teachers and students by armed forces (state and non-state)
• Forced population displacement leading to interrupted education
• Public health impacts of conflict which reduce access and learning
• Increased demand for household labour
• Reduction in returns to education
• Reduced educational expenditure (public and private) due to overall reduction in resources and shifting priorities
• Reduced public capacity to deliver education
This case study investigates the extent to which conflict has impacted on education in Nigeria. Using a variety of data sources, it considers the evidence of the impact of conflict on education via the various channels listed above, and attempts to quantify the impact in terms of numbers of out-of-school children (OOSC) and the financial implications of the damage done to the education system. It should be noted that the conflict situation in Nigeria is highly dynamic and that any statistic relating to the number of OOSC can only give a snapshot at one particular point in time. Similarly the financial costs of the impact depend on the timing and length of the period of conflict being considered. A further challenge in Nigeria is that data quality is often limited and there are considerable gaps between data collection points. For these reasons the figures given in this case study are very rough estimates, exploring the approximate range in which the ‘actual’ number, often a highly transitory statistic, might lie.
The report firstly sets the context by outlining the conflict history. Section 3 explores the effect of conflict on numbers of OOSC. The fourth section explores the direct costs to the education sector, broader impacts to the sector and costs borne in the longer term as a result of schooling missed due to conflict. The conclusion considers the relative scale of the different channels of impact, both in terms of cost and enrolment.
5
The quantitative impact of armed conflict on education in Nigeria: case study
2 Conflict history
Nigeria became an independent country in 1960. A coup and counter-coup in 1966 triggered a massacre of Igbo living in the north, which prompted a secessionist movement in the eastern (predominantly Igbo) states. The subsequent Biafran war (1967–1970) resulted in around 75,000 battle-related deaths (BRDs) and the number of civilian deaths is estimated to be in the millions.
Over the next 30 years, attempts to establish a lasting democracy were unsuccessful. Changes in government tended to occur through coups rather than elections. Despite the political turmoil, the period was relatively peaceful in terms of state conflict, with only 150 BRDs recorded by UCDP (from border disputes with Chad in 1983, and with Cameroon in 1996). After 15 years of military government, civilian rule returned with the presidential elections of 1999.
The UCDP database lists three conflicts since 2000, with the conflict in the north east escalating to the intensity of over 1,000 BRDs in 2013:
Northern Nigeria: In 2004, the government fought with Ahlul Sunna Jamaa (Followers of the Prophet) who were fighting for the establishment of an independent Islamic state in northern Nigeria. The conflict resulted in around 50 BRDs.
Niger Delta: clashes between the government and the Niger Delta People’s Volunteer Force led to an estimated 100 BRDs in 2004, although the upper estimate is far higher (555 deaths).
Boko Haram: In 2009, violent clashes broke out in north-eastern Nigeria between an Islamist insurgent group, Boko Haram, and the government of Nigeria. Between 2009 and 2012, there were around 1,500 BRDs associated with this conflict. In 2013, the government called a state of emergency and launched a large-scale military offensive against the insurgents. The intensity of the conflict increased to that of a war, with around 1,600 BRDs over the course of one year. In addition, it is estimated that attacks by Boko Haram on civilians led to the deaths of around 650 civilians between 2010 and 2012. According to Amnesty International (2014), more than 1,500 people were killed in northern Nigeria in the first three months of 2014.
In addition to conflicts involving government forces (state conflict), UCDP lists around 50 civilian conflicts since 1989, mostly inter-tribal. Over 10,000 deaths are recorded for these conflicts. The most deadly of these were clashes between Christians and Muslims between 1991 and 2012. The Fulani have been involved in a number of tribal conflicts, the most deadly being the Fulani-Tarok conflict in 2004 (1,200 deaths). Plateau state has the highest rate of communal, non-state violence (ACLED, 2013). Violence in the Delta region flared up in 1993, 1999 and 2003. Overall, the most violent years have been 1999, 2004 and then escalating since 2010 (UCDP).

6
The quantitative impact of armed conflict on education in Nigeria: case study
Figure 1: BRDs in Nigeria, 1989–2013
State
North, non-state
Delta, non-state
Other, non-state
1996
1995
1994
1993
1992
1991
1990
1989
1997
1998
1999
2000
2001
2003
2005
2007
2009
2002
2004
2006
2008
2010
2011
2013
2012
2500
2000
1500
1000
500
0
Source: Uppsala Conflict Data Program (Date of retrieval: 11/4/14) UCDP Conflict Encyclopedia: www.ucdp.uu.se/database, Uppsala University. Note that non-state conflict data for 2013 were not available at the time of writing.

7
The quantitative impact of armed conflict on education in Nigeria: case study
3 The human costs of conflict to education: out-of-school children in Nigeria
3.1 Data sources on OOSCThe most recent data on the number of OOSC published by the UNESCO Institute for Statistics (UIS) are for 2010. These data predate the recent escalation of the conflict in the north of Nigeria. The estimate uses Education Management Information System (EMIS) data, collected using a school census, and population census data to estimate the school age population size. The school census is an administrative source collected by the State Ministries of Education and collated at the federal level. The census covers both public and registered private schools but there are often poor returns from private schools (NPC and RTI, 2011) so these figures may underestimate the number of students in the private sector. Most data on OOSC refer only to children of primary school age (6–11). Data on access to post-primary education are more limited. UIS does not publish recent estimates for net enrolment or out-of-school figures for children of secondary school age (12–17). Figures in this case study are only for primary school age children unless otherwise stated.
In contexts like Nigeria where there is a thriving but weakly regulated private education sector, and where collecting enrolment data from private schools is problematic, household surveys can provide a more accurate estimate of enrolment rates and OOSC. Surveys often report on attendance rates rather than enrolment rates, since households are asked whether their children have attended school that year. If all enrolled students attend school at some point in the year, these two statistics should be equivalent. The main sources of survey data on school enrolment include the following:
• Multiple Indicator Cluster Survey (MICS) 2007, 2011
• Nigeria Education Data Survey (NEDS) 2010
• Nigeria Demographic and Health Survey (NDHS) 1990, 2003, 2008
• National Household Expenditure Survey (NHES) 2010
• Population and Housing Census (2006)
UNICEF, in collaboration with UIS, used the three latter surveys in this list, together with school census data, to develop a report on OOSC in Nigeria (UNICEF, 2012).
The graph on the following page compares the estimates of the net enrolment rate/net attendance rate (NER/NAR) measured from these various sources over recent years. The primary NER, as reported by UIS, fell between 2006 and 2008, during a period of relative calm in terms of violent conflict. Gross enrolment ratios saw an even sharper drop during this period. The higher attendance ratios reported by the survey sources indicate that EMIS data may be underestimating school participation, and overestimating the number of OOSC. The drop in enrolment rates in 2006–2008 may simply be due to changes in the data collection process. A new EMIS system was piloted in 2006 before being rolled out to 16 states, then nationally (Cambridge Education, 2006).

8
The quantitative impact of armed conflict on education in Nigeria: case study
Figure 2: Net enrolment/attendance rates for primary school, Nigeria, various sources
NDHS/NEDS NAR
MICS NAR
UIS NER
2003
2004
2005
2006
2007
2008
2009
2010
2011
80%
70%
60%
50%
40%
30%
20%
10%
0%
Based on these various sources, we can conclude that between 30% and 40% of primary school aged children were not attending formal school in 2011. This equates to between 7.9 million (lower estimate based on MICS 2011) and 10.5 million (upper estimate based on UIS 2010).
Nigeria has a high rate of population growth. UIS bases its school population projections on an estimate of over 3% annual growth. Based on the trends in enrolment up to 2010, the enrolment rates do not appear to be increasing. If enrolment rates stayed constant at around 60% since 2010, then the numbers of OOSC would have continued to rise due to population growth. Based on the UIS figure for OOSC in 2010, this would mean that there were 11.5 million OOSC in 2013 and that there would be over 12 million by 2015.
3.1.1 School system and data issuesNigeria has a 6-3-3-4 system, with primary education starting at age 6, and lower secondary at age 12. According to the Universal Basic Education Act passed in 2004, primary and lower secondary education, i.e. education for children aged 6–14, is free and compulsory (UNICEF, 2012). The Education Policy Data Centre (EPDC) uses the age band of 7–14 when estimating the number of OOSC. This is more closely aligned to Nigeria’s compulsory school age band than the UIS calculation of OOSC which only takes primary school aged children into account (EPDC, undated).
3.2 Numbers of OOSCThe table on the following page shows a range of estimates for the number of OOSC in Nigeria. The UIS estimate is higher than the estimates from survey sources. This may be due to undercounting of children attending unregistered non-state schools. Even based on the lowest estimate, Nigeria has by far the largest number of OOSC of any country worldwide.

9
The quantitative impact of armed conflict on education in Nigeria: case study
Table 1: National estimates of OOSC in Nigeria from various sources
Primary school aged (6–11)
Secondary school aged (12–17)
7–14 year olds
UIS 2010 10,500,000 n/a
UNICEF 2012 7,300,000
2,800,000 (lower secondary,
12–14 only)
MICS 2011 7,900,000 5,300,000*
NEDS 2010 9,900,000
DHS 2008 (EPDC 2013)
7,500,000 8,300,000
DHS extrapolated to 2012 (EPDC, 2013)
8,300,000 n/a 9,200,000
Out-of-school rate (UIS) girls
44% n/a
Out-of-school rate (UIS) boys
39% n/a
* According to MICS 2011, 54.2% of children of secondary school age are attending secondary school or higher; 20.8% are attending primary school. This estimate assumes that the remaining 25% are out of school and is based on the UIS 2011 secondary school aged population estimate.
3.3 Gender, conflict and access to educationThe sex-disaggregated statistics for Nigeria at the national level hide much more complex gendered patterns of access at the state level. At the national level, 52% of OOSC are girls, and the out-of-school rate for girls is 5 percentage points higher than for boys (UIS, 2013). In the southern states, girls have higher enrolment rates than boys (both at primary and secondary levels), whereas in the northern states enrolment rates for boys are significantly higher than for girls. The gender disparity is greater in the north west than in the more conflict-affected north east (MICS 2011). According to state-level EMIS data, there were less than half as many girls as boys enrolled in primary school in Zamfara state in 2011/12 (Naylor, 2012).
In the attacks on education by Boko Haram, which have intensified and become more deadly since the start of 2012 (see Section 4), most of the students who have been killed are males. In the attack on Buni Yadi, the students who were killed were adolescent boys. The female students were reportedly told by Boko Haram to go away and get married and to abandon their education.1 Amnesty reported another attack on a girls’ secondary school in Borno in February 2014 (Amnesty International, 2014), but instead of killing the students, the insurgents reportedly kidnapped between 30 and 40 girls. Kidnapping of women and young girls is an emerging tactic of Boko Haram, used
1 “Nigeria school raid in Yobe state leaves 29 dead”, BBC News, 25 February 2014, http://www.bbc.co.uk/news/world-africa-26338041

10
The quantitative impact of armed conflict on education in Nigeria: case study
increasingly since 2013 (Zenn and Pearson, 2014). At the time of writing, Boko Haram were holding over 200 girls kidnapped from a high school in Chibok, Borno state.
3.4 Geographical distribution of conflict and OOSCAs discussed in the conflict history above, the Nigerian state was involved in only a few low-intensity violent conflicts between 1971 and 2008. However, there have been numerous and often intense bouts of communal violence, particularly in the Niger Delta region, Plateau state and the north east of the country.
The conflict with Boko Haram has mainly taken place in the north east zone, focused around Borno state but extending into Yobe, Gombe and Adamawa states, as well as terrorist attacks in the federal capital, Abuja, and elsewhere. The north eastern states have some of the lowest enrolment rates in Nigeria. According to MICS, 2011, states in the north west had very similar low levels of school attendance rates, with just under half of primary school age children attending school, and less than a quarter of secondary school aged children attending (see Figure 3). Based on the 2008 DHS, EPDC estimates that there were 2.2 million OOSC aged between 7 and 14 in the north east zone in 2008, representing 25% of all OOSC in Nigeria (EPDC Nigeria OOSC profile). UNICEF estimated that there were 1.9 million OOSC of primary school age in the north east, 26% of the estimated total number of OOSC (UNICEF, 2012). The estimated number of OOSC for the three states that have been most affected (Adamawa, Borno and Yobe) was just over one million, but the data predate the main conflict. The north west, which is more populous, but much less conflict-affected, accounts for around half of all OOSC in the country.
Figure 3: NARs by geographical zone
North east
North west
North central
South east
South south
South west
100%
90%
80%
70%
60%
50%
40%
30%
20%
10%
0%
Primary NAR
Secondary NAR
Source: MICS 2011

11
The quantitative impact of armed conflict on education in Nigeria: case study
Given that the fighting with Boko Haram has intensified since the most recent available survey data (2011), it is possible that future surveys might find greater differences in enrolment between the north east and north west. However, the low enrolment rates observed in the north east in 2011 are unlikely to be directly caused by this conflict (see Section 3.5).
Plateau state, which saw some of the most intense communal violence between Muslims and Christians, is in the north central zone. Plateau state’s primary NAR in the 2011 MICS was recorded as 79%, higher than other states in the zone with less civil unrest.
The delta states have also experienced civil unrest but these states are in the south zone and have relatively high primary NARs (see Figure 5).
In general, the distribution of states with low enrolment does not appear to match closely to the distribution of states experiencing conflict (Figures 4 and 5).
Figure 4: Conflict-affected states in Nigeria, 2001–2011
AbiaImo
Adamawa
Taraba
AkwaRivers
Bauchi
Plateau
Nasarawa
Kaduna
Abuja
Niger
Kogi
Kwara
Bayelsa
Benue
Borno
YobeJigawa
Kano
Katsina
Zamfara
Sokoto
Kebbi
CrossRiverDelta
EbonyiEdo
OndoLagos
Ogun
EkitiOsun
Oyo
Enugu
Gombe
Anambra
Sectarian/communal
Delta violence
Boko Haram conflict
12
The quantitative impact of armed conflict on education in Nigeria: case study
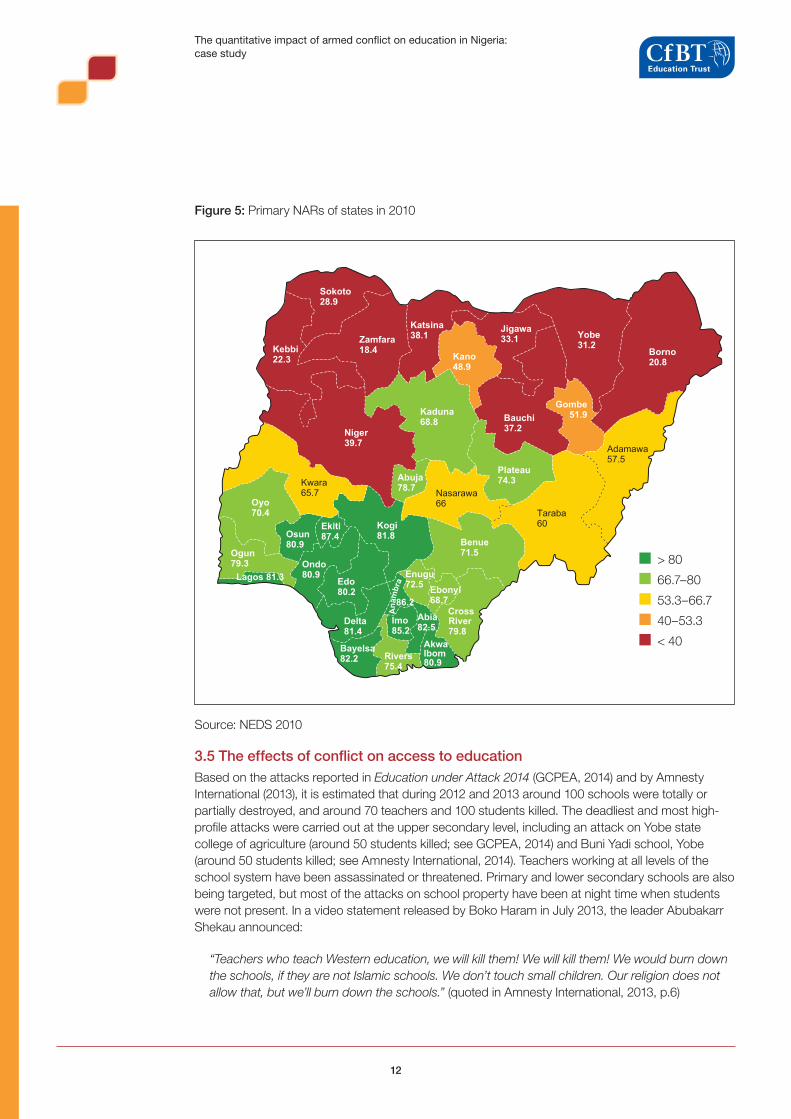
Figure 5: Primary NARs of states in 2010
Abia82.5
Imo85.2
Adamawa57.5
Taraba60
AkwaIbom80.9
Rivers75.4
Bauchi37.2
Plateau74.3
Nasarawa66
Kaduna68.8
Abuja78.7
Niger39.7
Kogi81.8
Kwara65.7
Bayelsa82.2
Benue71.5
Borno20.8
Yobe31.2
Jigawa33.1
Kano48.9
Katsina38.1Zamfara
18.4
Sokoto28.9
Kebbi22.3
Cross86.2
River79.8
Delta81.4
Ebonyi68.7
Edo80.2
Ondo80.9Lagos 81.3
Ogun79.3
Ekiti87.4Osun
80.9
Oyo70.4
Enugu72.5
Gombe51.9
Anam
bra
> 80
66.7–80
53.3–66.7
40–53.3
< 40
Source: NEDS 2010
3.5 The effects of conflict on access to educationBased on the attacks reported in Education under Attack 2014 (GCPEA, 2014) and by Amnesty International (2013), it is estimated that during 2012 and 2013 around 100 schools were totally or partially destroyed, and around 70 teachers and 100 students killed. The deadliest and most high-profile attacks were carried out at the upper secondary level, including an attack on Yobe state college of agriculture (around 50 students killed; see GCPEA, 2014) and Buni Yadi school, Yobe (around 50 students killed; see Amnesty International, 2014). Teachers working at all levels of the school system have been assassinated or threatened. Primary and lower secondary schools are also being targeted, but most of the attacks on school property have been at night time when students were not present. In a video statement released by Boko Haram in July 2013, the leader Abubakarr Shekau announced:
“Teachers who teach Western education, we will kill them! We will kill them! We would burn down the schools, if they are not Islamic schools. We don’t touch small children. Our religion does not allow that, but we’ll burn down the schools.” (quoted in Amnesty International, 2013, p.6)
13
The quantitative impact of armed conflict on education in Nigeria: case study
In 2013, around 15,000 children in Borno state were reported to be temporarily out of school as a direct result of attacks on schools and closure of schools for security reasons (Amnesty International, 2013). A further 120,000 older students were affected by the closure of all 85 high schools in Borno state in early 2014. However, these numbers are relatively small when compared to the 2.2 million children aged 7–14 estimated to be out of school in the north east in 2008, preceding the conflict with Boko Haram (EPDC, undated).2
Many teachers and families have fled the most conflict-affected areas of north east Nigeria. In 2013, the Nigerian Teachers Union reported that over 1,000 teachers had fled the north since 2012 (Amnesty International, 2013). The Internal Displacement Monitoring Centre (IDMC) estimates that between 2010 and December 2013 there were around 3.3 million people in Nigeria who had been internally displaced due to conflict (IDMC, 2013). But this may include those who were only displaced for short periods and who have since returned home. In February 2014, UNHCR estimated that around 520,000 people had fled the fighting in the north eastern states since the state of emergency was called in May 2013 (UNHCR, 2014). If we estimate that a third of the displaced population was of school age (6–17), this could mean that as many as 1.1 million school aged children, and around 0.6 million primary school aged children have been displaced as a result of conflict in Nigeria. Many of these will have had their schooling disrupted due to the displacement. However, given that the north east had some of the lowest enrolment rates in the country prior to the conflict, it is possible that internally displaced families found better access to education in their host communities.
Given that Boko Haram has spoken openly against Western-style education, and that the name ‘Boko Haram’ translates as ‘Western education is forbidden’, fear of attack is potentially a major barrier to access to schooling. UNICEF’s country study on OOSC (UNICEF, 2012) gives parents’ concerns for their children’s safety on the way to and at school as a barrier to enrolment and attendance, pointing to the impact of bombings by Boko Haram. When parents of children who had never attended school were asked about their reasons for their children not going to school, 16% of parents cited fears about their children’s safety when travelling to school as one of the reasons for non-enrolment. The rate was slightly greater for boys than girls (17% compared to 15%). North east Nigeria had one of the highest rates of reporting lack of safety travelling to school as a barrier to access (21.5%), but the south west had the same high rate for this response and is one of the least conflict-affected regions of Nigeria, presumably reflecting a wider sense of insecurity. Distance to school was the most common reason given for non-enrolment. Opportunity costs, monetary costs and low quality of school were all reported more frequently as a barrier to access than concerns over safety. For school drop-outs, concerns over safety were only given as a reason for drop-out in a small minority of cases (2.6%) (NPC and RTI, 2011). It should be noted that these data were collected before the Boko Haram campaign against schools intensified.
3.6 Estimating the full impact of conflict: enrolment trends over timeOther indirect effects of conflict on education are more difficult to measure, as they are likely to be more diffuse and only become apparent over time. Looking at the enrolment trends over time in Nigeria, and comparing these with enrolment in the rest of Sub-Saharan Africa, Nigeria appears to have made relatively little progress in increasing access to education since the late 1990s (Figure 6). By comparison, enrolment rates across the rest of the continent were rising during this period. Nigeria’s enrolment rate had been above the continental average since the late 1970s but fell below it in 2007.
2 “Nigerian state closes schools amid fears of Boko Haram attacks” The Guardian, Tuesday 18 March 2014, downloaded from http://www.theguardian.com/world/2014/mar/18/nigeria-state-closes-schools-fears-boko-haram

14
The quantitative impact of armed conflict on education in Nigeria: case study
Figure 6: GERs, 1970–2010
Nigeria
Sub-Saharan Africa
1970
1972
1974
1976
1978
1980
1982
1984
1986
1988
1990
1992
1994
1996
1998
2000
2002
2004
2006
2008
2010
120%
100%
80%
60%
40%
20%
0%
Source: UIS
In 1976, a Universal Primary Education (UPE) programme was launched and school fees abolished. The UPE programme and subsequent rise in enrolment mirrored policies and progress elsewhere in Africa. Progress floundered in the 1980s and 1990s, in Nigeria and elsewhere. During much of this period, Nigeria was under military rule. It might be expected that a military government would prioritise military spending over education spending. However, regression analyses indicate that there was a positive correlation between the two, meaning that as military spending increased, so did education spending (Adebiyi and Oladele, 2004; Omojimite, 2012).
In 1999, democracy was restored in Nigeria and in 2004 the Universal Basic Education (UBE) Act was passed, granting every child free primary and lower secondary education and setting aside a proportion of funds to implement this (UNICEF, 2012). However, the data from EMIS and household surveys do not show a subsequent increase in enrolment at primary or secondary level, implying that the UBE Act was not well implemented.
The sharp drop in enrolment seen between 2006 and 2008 has been attributed to a prolonged mass teacher strike in 2007, and the discontinuation of a school feeding programme (NPC and RTI, 2011), but may also be due to inconsistencies with the collection and collation of EMIS data (see above).
The household surveys listed above give net attendance rates at zonal and, in some cases, state level. The NDHS data series are not directly comparable with the MICS data series, so are considered separately. Using the NDHS/NEDS data (see Figure 7), primary school attendance rates appear to have stayed relatively static in most parts of the country between 2003 and 2008. The drop seen in enrolments measured by administrative data between 2006 and 2008 may have been missed due to the gap between the surveys, or may have been due to changes in the data collection processes rather than an actual drop in enrolment. Between 2008 and 2010, there were falls in enrolment rates in all zones except the south west and south south. There is no evidence of

15
The quantitative impact of armed conflict on education in Nigeria: case study
school attendance in conflict-affected zones diverging from the pattern of enrolment over time for less conflict-affected zones. For example, statistics for the north east very closely matched those for the north west. However, there may have been a further fall in enrolment in the north east since 2010 as a result of the conflict.
Figure 7: Primary NARs for geographic zones over time
2002 2004 2006 2008 2010 2012
90%
80%
70%
60%
50%
40%
30%
20%
10%
0%
North east
North west
North central
South east
South south
South west
Source: DHS
The MICS data cover an overlapping period which, however, extends to 2011. According to these data, primary enrolment in the north east appears to have shown a sharp increase against a fall in enrolment rates in the north central and southern states. This would imply that up to 2011, Boko Haram had not had a negative impact on school enrolments, despite being active since 2009. But comparison of the zonal data with DHS survey data indicates that the 2007 MICS data for north eastern states may be anomalous, and should be treated with caution.

16
The quantitative impact of armed conflict on education in Nigeria: case study
Figure 8: NARs for geographic zones over time
2006 2007 2008 2009 2010 20122011
100%
90%
80%
70%
60%
50%
40%
30%
20%
10%
0%
North east
North west
North central
South east
South south
South west
Source: MICS
Changes in zonal level secondary NARs show a similar pattern. The changes do not clearly map to the areas and periods of conflict.
Once the next round of DHS/MICS data are collected it will be possible to compare the enrolment trajectories of the more conflict-affected areas of the north east with those of the less conflict-affected parts of the country. However, currently enrolment trend data are only available up to the start of the Boko Haram conflict.
Although the different data sources on enrolment give rather different absolute enrolment rates, all show a lack of progress in access to education in Nigeria between 2000 and 2010. Inequality in access to education between the north and the south has become even more pronounced (Figure 7). Although Nigeria suffered considerable communal conflict during the period, it experienced relatively limited state conflict. Also, the areas experiencing the most intense communal conflict (Plateau state, the Delta area) do not appear to have fared differently, in terms of access to education, from more peaceful areas. It is therefore difficult to claim that a significant proportion of the many millions of OOSC in Nigeria in 2011, or even the millions of OOSC in the north east, were out of school as a result of conflict. This is likely to change when new data emerge from areas suffering from the conflict with Boko Haram.
The 2013/14 Education For All Global Monitoring Report (UNESCO, 2014) attributes the lack of progress in education in Nigeria to poor accountability. It points out that Nigeria is a federation with limited central control over states. It points to the absence of clear data on public spending on education, and a lack of norms for the resources that schools should receive. Similarly, the 2009 Global Monitoring Report points to the poor performance of the education system in Nigeria as “the price of weak governance” (UNESCO, 2009). In the case of Nigeria, up to 2011, weak governance

17
The quantitative impact of armed conflict on education in Nigeria: case study
and state fragility appear to be major contributing factors both to the persistently large population of OOSC and to the level of conflict experienced, rather than the conflict being a major cause of children being out of school. With the advent of the Boko Haram insurgency, conflict in the north east has meant that children there are indeed out of school as a result of conflict. However, calculating the relative scale of the impact of the conflict on education is not possible until further enrolment data become available.
3.7 SummaryNigeria is home to more OOSC than any other country, with around 10 million OOSC of primary school age (see table below). It is also conflicted-affected, with the conflict in the north east escalating since 2011. However, the problem of low enrolments preceded the conflict and the high rate of OOSC prior to 2011 cannot be attributed to the conflict, but is more likely to be due to issues of weak governance.
Table 2: Summary of estimates of OOSC in Nigeria
Absolute numbers Rates and notes
OOSC aged 6–11 (primary school age)
7,900,000 (MICS 2011) to 10,500,000 (UIS 2010)
30–40% of all children of primary school age; higher rate for girls
OOSC of lower secondary age (12–14)
2,800,000 (UNICEF 2012) to 5,300,000 (MICS 2011)
OOSC aged 7–14 living in conflict- affected provinces (EPDC, undated, based on DHS, 2008)
2,200,000 25% of all OOSC
Children temporarily out of school due to attacks on schools (Amnesty International, 2013)
15,000 Includes primary and secondary school ages
High school students in Borno state affected by school closure in 2014 (Guardian newspaper 18 March 2014)
Approx 100,000 Children over 15, so outside normal OOSC age range
Primary school aged children (6–11) affected by forced displacement (2010–2014, IDMC)
600,000 Schooling status before and after displacement is not known
Estimate of OOSC (primary school age) due to conflict
Not possible to calculate but likely to be relatively low (<5% of all OOSC) prior to 2011

18
The quantitative impact of armed conflict on education in Nigeria: case study
In 2010, around a quarter of Nigeria’s out-of-school population lived in the north east (approximately 2.5 million children of primary school age, and a further 0.7 million of lower secondary school age). Since then, this region has become highly conflict-affected with numerous targeted attacks on education and threats to teachers and students by Boko Haram insurgents. The conflict with Boko Haram has led many schools to close and caused families and teachers to flee or stop attending school due to fear of attacks. However, the numbers directly impacted are relatively low compared to the millions out of school nationwide for other reasons. The full quantitative impact of this conflict on access to education in the north east will not be possible to measure until further data on enrolments become available.

19
The quantitative impact of armed conflict on education in Nigeria: case study
4 The financial costs of conflict to education in Nigeria
As noted in Section 1, conflict impacts on education in ways that have a direct cost to the sector, as well as more indirectly through reducing demand for and/or supply of education.
Direct attacks and collateral damage create clear costs for the sector in terms of rebuilding schools and replacing personnel, and it is relatively straightforward to generate some rough estimates of the impact of these attacks on the education system wherever they are reported. But the impact that conflict has on access to learning also represents a cost to society, both in itself and through its impact on wider societal and economic goals. These impacts are much harder to monetise, but there is a growing body of literature on the quantitative impact of conflict on education to draw upon.
Taking descriptions of attacks to education from Education under Attack 2014 (GCPEA, 2014) as a starting point, we examine the monetary cost of direct attacks and collateral damage to education for the period 2009–2012. We then attempt to quantify other impacts on education that do not create a direct financial burden, such as the impact on access and learning. Finally we take these quantitative estimates of the impact on education and attempt to quantify the long-term costs of conflict to the economy as a result of reduced levels of education.
Explanation of our approach is provided below, and in more detail in the accompanying report, The quantitative impact of armed conflict on education: counting the human and financial costs (Jones and Naylor, 2014).
4.1 Direct monetary cost of conflict to education4.1.1 Targeted attacks on education GCPEA (2014) documents attacks on schools, universities and educational personnel in Nigeria for the period 2009–2012. Some representative descriptions are:
“In Jos, in July 2011, a rocket was fired at a co-educational Muslim-owned school during student examinations, though responsibility for the attack was unconfirmed. The city had a long history of violence between Christian and Muslim communities.” (GCPEA, 2014, p.165)
“From January to March 2012, Boko Haram claimed responsibility for the damage and destruction of 12 schools in and around Maiduguri, the capital of Borno state, citing retribution for state security force attacks on a Tsangaya (Koranic) school and the arrest of Koranic students in January 2012.” (GCPEA, 2014, p.166)
“In the north, one lecturer from the University of Maiduguri was also shot and killed, reportedly by Boko Haram.” (GCPEA, 2014, p.167)

20
The quantitative impact of armed conflict on education in Nigeria: case study
Table 3: Targeted attacks on education in Nigeria, 2009–2012
Dates Schools damaged/ destroyed
Impact on students/ teachers
Notes
July 2009 1 or 57 destroyed (depending on reports)
Temporary closure, not all schools rehabilitated a year later
Maiduguri, Borno state (Boko Haram)
2010–2012 6 university personnel kidnapped, one killed
Various universities, mainly in the south
September 2010
Kidnappings of 15 young students
Abia state (extortion)
October 2010 Kidnapping of a headteacher
Eket, south east (extortion)
October 2010 Muslim cleric and his student killed
(Boko Haram)
December 2011
1 school damaged At least 7 students injured
Reprisals against Muslims
April 2011 4 students and 1 lecturer killed
Nuhu Bamalli Polytechnic, Kaduna state (mob supporting former military leader Mohammadu Buhari, who backed the imposition of Sharia law)
July 2011 1 school damaged Rocket fired at Muslim school
July 2011 2 lecturers killed Maiduguri University, Borno state (Boko Haram)
January–March 2012
12 schools destroyed
“At least” 5,000 students denied access
Maiduguri, Borno state (Boko Haram)
January–October 2012
7 university staff members kidnapped, 1 died in custody
Federal College of Education, Rivers state
April 2012 1 university building damaged
20 students killed Bayero University, Kano state; Gombe University, Gombe state (Boko Haram)

21
The quantitative impact of armed conflict on education in Nigeria: case study
May 2012 2 schools damaged Kano state (Boko Haram)
May–November 2012
“At least a dozen” schools damaged
Borno state (Boko Haram)
October 2012 25 people killed, mostly students
Mubi, Adamawa state (Boko Haram)
October 2012 1 headteacher killed Potiskum, Yobe state (perpetrators and motives unknown)
Estimated total impact
13 or 69 schools destroyed, at least 16 schools damaged and 1 university building damaged
12 university staff kidnapped, 5 killed; 1 Muslim cleric killed; 2 headteachers killed; 50 students killed, at least 7 injured and 15 kidnapped; at least 5,000 students denied access to education
In order to cost the destruction and damage to schools we make a number of assumptions:
• The number of schools destroyed is the mid-point of 13 and 69, i.e. 41
• The cost of repairing a damaged school is equal to half the cost of constructing a school
• Schools average eight classrooms3
• The cost of repairing a university building is same as that of one school
Classroom construction costs, of course, vary greatly by location and materials used. Theunyck (2009) conducted regressional analysis on classroom construction projects across Sub-Saharan Africa and found that costs are in the region of $150 per square metre. Assuming a classroom is 50 square metres would give us an estimated cost per classroom of $7,500. However, the only cost estimate for Nigeria accessed in our research, that of DFID (2014), puts the classroom construction costs higher, at $12,500. We assume eight classrooms (and buildings) per school, giving us a total school construction cost of $100,000. This gives us a cost for replacing destroyed schools of $4.1m and that for repairing damaged schools of $850,000 (based on the assumptions above), leading to a total construction cost to the sector of $4.95m.
In addition to this, there will also be a cost in replacing damaged or looted equipment and teacher materials. If we assume that for each of the 58 schools attacked $5,000 worth of equipment needs replacing,4 then the cost would be $290,000. If we add this to the construction costs we arrive at a total cost from targeted attacks on buildings of $5.24m.
3 This is based on an assumption of one classroom for each of the six primary grades plus two other buildings. 4 NB: this is a rough estimate as no sources of estimates were found.
22
The quantitative impact of armed conflict on education in Nigeria: case study
Table 4 records the murder and kidnapping of 20 educational personnel between 2009 and 2012. In addition to the great personal loss suffered by their families, this also represents a burden to the education sector. In order to cost this impact we make the following assumptions:
• All murdered and kidnapped teachers need to be replaced
• The cost of replacing educational personnel is based on the cost of replacing a standard teacher
A minimum estimate for the cost of losing teachers is the cost of training their replacements. The cost of training a new teacher in Nigeria was cited as approximately $900 in a World Bank publication of 2008. Assuming some inflation since then, we can round this to $1,000, meaning a lower bound estimate of the cost of replacing the 20 education personnel is $20,000.
A potentially greater cost to education than the direct damage is the restriction of access that conflict-related school closures mean. Attacks on schools and military use of buildings mean disruption to school schedules for weeks, months or even years. As well as the indirect cost of potential lost schooling (see below), these interruptions can have a direct cost in that teaching staff still have to be paid despite not teaching. According to GCPEA (2014, p.166), “at least” 5,000 students were unable to attend school as a result of attacks in 2012 during which 12 schools were destroyed. We might assume that access to education was also restricted as a result of all the other attacks on education outlined in Table 3. In order to cost this impact, we make the following assumptions:
• A school consists of 200 students5
• Each school attacked is closed for 100 days
So for the 5,000 students, we estimate that 500,000 schooling days were missed. For the other attacks, including destruction and damage to a further 46 schools, we estimate that 920,000 schooling days were missed. If we assume that the pupil-teacher ratio in these schools is 30,6 we estimate there are approximately 47,300 lost teacher days. If a teacher’s salary is $2,000/year or $10/day7 then the cost in lost teaching time is $473,000.
Table 4 summarises these calculations and shows that the total cost to the education sector of documented attacks on education 2009–2012 in Nigeria is estimated at $5.73m.
5 Based on the assumption that each school consists of six sections of over 30 students.6 This is the national average for secondary (UNESCO, 2014).7 This is the lower bound from DFID (2014), assuming 200 working days a year.

23
The quantitative impact of armed conflict on education in Nigeria: case study
Table 4: Summary of the direct costs of conflict on education in Nigeria, 2009–2012
Cost Quantity Unit cost Cost estimate
Cost of replacing destroyed infrastructure
41 schools $100,000 $4,100,000
Cost of replacing damaged infrastructure
17 schools $50,000 $850,000
Cost of replacing damaged and looted equipment
58 schools $5,000 $290,000
Cost of replacing lost teaching force (teacher training)
20 education personnel
$1,000 $20,000
Cost due to lost teaching time 47,300 lost teaching days
$10/day $473,000
Total cost $5,733,000
GCPEA (2014) also provides some accounts of attacks on education in 2013. This reporting does not follow the same methodology as that of 2009–2012, so we present the data separately. Since there has been a recent escalation in violence by Boko Haram, we supplement this with data for early 2014 from another source, Amnesty International (2014).
24
The quantitative impact of armed conflict on education in Nigeria: case study
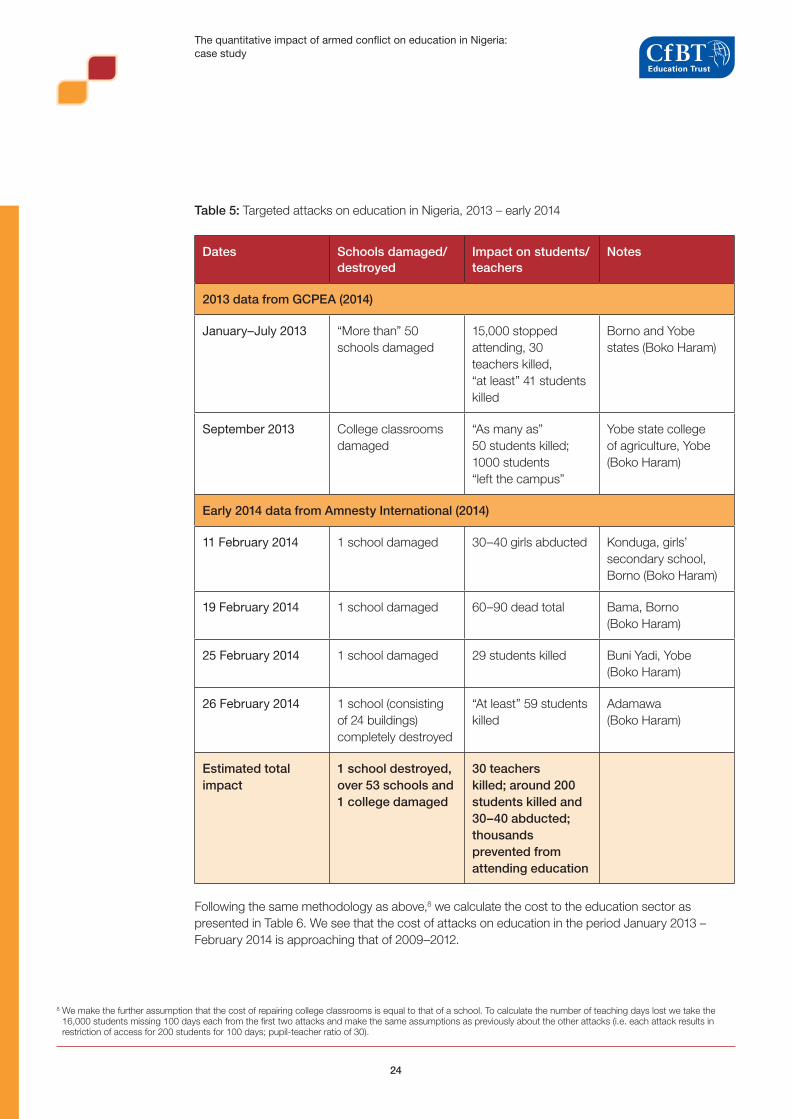
Table 5: Targeted attacks on education in Nigeria, 2013 – early 2014
Dates Schools damaged/ destroyed
Impact on students/ teachers
Notes
2013 data from GCPEA (2014)
January–July 2013 “More than” 50 schools damaged
15,000 stopped attending, 30 teachers killed, “at least” 41 students killed
Borno and Yobe states (Boko Haram)
September 2013 College classrooms damaged
“As many as” 50 students killed; 1000 students “left the campus”
Yobe state college of agriculture, Yobe (Boko Haram)
Early 2014 data from Amnesty International (2014)
11 February 2014 1 school damaged 30–40 girls abducted Konduga, girls’ secondary school, Borno (Boko Haram)
19 February 2014 1 school damaged 60–90 dead total Bama, Borno (Boko Haram)
25 February 2014 1 school damaged 29 students killed Buni Yadi, Yobe (Boko Haram)
26 February 2014 1 school (consisting of 24 buildings) completely destroyed
“At least” 59 students killed
Adamawa (Boko Haram)
Estimated total impact
1 school destroyed, over 53 schools and 1 college damaged
30 teachers killed; around 200 students killed and 30–40 abducted; thousands prevented from attending education
Following the same methodology as above,8 we calculate the cost to the education sector as presented in Table 6. We see that the cost of attacks on education in the period January 2013 – February 2014 is approaching that of 2009–2012.
8 We make the further assumption that the cost of repairing college classrooms is equal to that of a school. To calculate the number of teaching days lost we take the 16,000 students missing 100 days each from the first two attacks and make the same assumptions as previously about the other attacks (i.e. each attack results in restriction of access for 200 students for 100 days; pupil-teacher ratio of 30).

25
The quantitative impact of armed conflict on education in Nigeria: case study
Table 6: Summary of the total estimated direct costs of conflict on education, 2013
Cost Quantity Unit cost Cost estimate
Cost of replacing destroyed infrastructure
1 school $100,000 $100,000
Cost of replacing damaged infrastructure
54 schools $50,000 $2,700,000
Cost of replacing damaged and looted equipment
55 schools $5,000 $275,000
Cost of replacing lost teaching force (teacher training)
30 education personnel
$1,000 $30,000
Cost due to lost teaching time 56,000 lost teaching days
$10/day $560,000
Total estimated cost $3,161,000
4.1.2 Untargeted attacks on educationAccording to the Council on Foreign Relations (CFR, 2014), there have been around 18,600 deaths due to violent conflicts (including sectarian violence) in Nigeria between May 2011 and March 2014. Adding to the estimate of 1,200 BRDs for 2009 and 2010 recorded by UCDP, this gives an estimate of around 19,800 deaths. According to Amnesty International (2014), at least half of the deaths in the conflict with Boko Haram were civilians killed by Boko Haram. If we estimate that 50% of all violent conflict deaths were civilians, this means that during the period 2009–2014, there were approximately 9,900 civilian deaths due to conflict. We also know that the teaching force of Nigeria is approximately 0.5% of the population.9 We can therefore speculate that the number of teachers killed as ‘collateral damage’ from communal violence and the conflict with Boko Haram is around 50. This would imply a lower bound cost to the sector of $50,000. Adding to the documented teacher casualties (see Tables 3 and 5 above) gives us a total (lower bound) estimate of $100,000 for 2009–2014.
4.2 Broader impacts of conflict on education4.2.1 Impact on access and learning
As well as the direct costs to education, conflict also impacts on access to education and learning. In the introduction, we outlined the main channels through which conflict impacts on access to education.
Whilst we will consider the impact of some of these channels individually, in intense and/or long conflicts, the combination of all these factors – and their interaction with other barriers to education such as poverty and weak governance – can have a significant impact on educational achievement for a whole generation. If this is the case, it could represent a cost to education far greater than the direct costs of rebuilding schools and training teachers.
9 According to UNESCO (2014) there are around 850,000 primary and secondary school teachers in a population of around 170 million. No figures for pre-primary and tertiary teachers are available.

26
The quantitative impact of armed conflict on education in Nigeria: case study
As noted above, the result of the attacks on education documented by GCPEA (2014) is likely to have led to around 1.4 million lost student learning days during 2009–2012.
Student deaths and kidnapping also contribute to a reduction in human capital. Estimates from GCPEA (2014) and Amnesty International (2014) suggest that nearly 200 children were killed in attacks on schools between January and March 2014. Kidnapping of students, especially girls, has also been a tactic of Boko Haram, with many children still in captivity. Although the personal cost of these attacks is great, they do not represent a cost to the education sector.
Displacement is often a major channel through which conflict can affect educational opportunity. Above, we estimated that as many as 1.1 million 6–17 year olds, and around 0.6 million primary school aged children have been displaced as a result of conflict in Nigeria between 2010 and 2014 (see Section 3.5). However, given that the north east had some of the lowest enrolment rates in the country prior to the violence, it is possible that internally displaced families find better access to education in their host communities.
Child soldiering is often another mechanism through which access and enrolment can be impacted during conflict, but no evidence of this in Nigeria was accessed.
If school closure leads to permanent drop-out, then the cost to the individual student, and society as a whole, is very great. The ‘bottom up’ accounting approach based on GCPEA (2014) developed above does not lead to robust estimates of the total impact of conflict on education – as well as an underestimation bias in the direct impacts, it also cannot account for the less direct impacts and interactions with other factors which create multiple barriers to education. We therefore now turn to statistical estimation of the impact on education outcomes.
The impact of conflict on access to schooling in Nigeria is considered in Section 3 of this case study. The result of the analysis is inconclusive. Although there is evidence of mass displacement because of conflict, no impact on primary NARs is discernible. This is not to say that conflict has had no impact, however – data are only available to 2011, before the recent escalation of violence in the north, and the fact that Nigeria has such high rates of OOSC makes the isolation of any one cause of access restriction difficult to discern.
Given these issues, we might turn to work carried out in other conflict-affected countries to guide our estimation of the magnitude of costs. There is a growing body of literature which aims to isolate the impact of conflict on education, for example by exploiting district-level variation in conflict exposure.10 A number of these studies are described in our main report (see Jones and Naylor, 2014). Although such analysis has been carried out for a variety of civil wars, estimates of the net impact of conflict on years of schooling have tended towards a 0.5 year reduction.
Given that recent levels of conflict in the north of Nigeria categorise the conflict as a civil war, we might speculate that it will have a similar impact on educational access for children in the three worst affected states, Borno, Yobe and Adamawa. These regions account for 7.4% of Nigeria’s school age population (UNICEF, 2012); we can therefore speculate that the impact of the current conflict in Nigeria will be to reduce educational attainment by a national average of 0.04 school years.11 However, it must be noted that Borno and Yobe had very low levels of access even before the escalation of violence in 2011 and so this may be an overestimation of the potential of conflict to further impact on access.
10 District-level conflict exposure can plausibly be argued to be exogenous from district-level variation in educational outcomes, whereas national or regional variation cannot.
11 7.4% multiplied by 0.5 school years.
27
The quantitative impact of armed conflict on education in Nigeria: case study
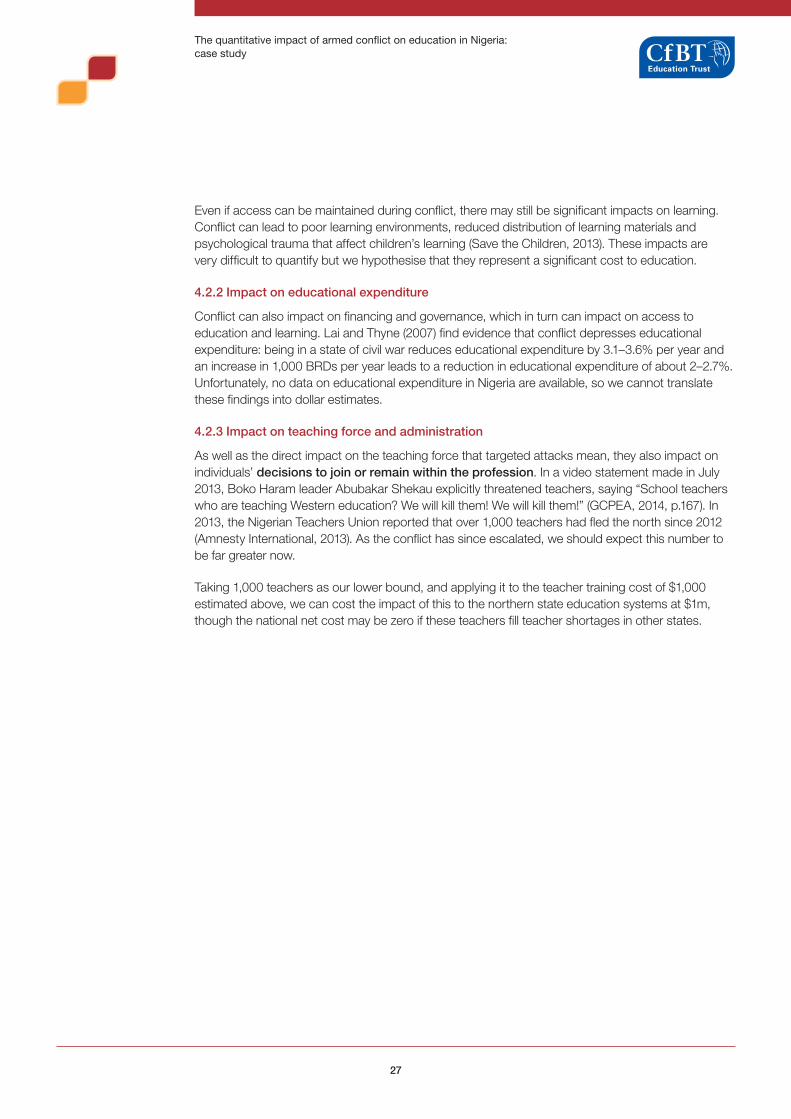
Even if access can be maintained during conflict, there may still be significant impacts on learning. Conflict can lead to poor learning environments, reduced distribution of learning materials and psychological trauma that affect children’s learning (Save the Children, 2013). These impacts are very difficult to quantify but we hypothesise that they represent a significant cost to education.
4.2.2 Impact on educational expenditure
Conflict can also impact on financing and governance, which in turn can impact on access to education and learning. Lai and Thyne (2007) find evidence that conflict depresses educational expenditure: being in a state of civil war reduces educational expenditure by 3.1–3.6% per year and an increase in 1,000 BRDs per year leads to a reduction in educational expenditure of about 2–2.7%. Unfortunately, no data on educational expenditure in Nigeria are available, so we cannot translate these findings into dollar estimates.
4.2.3 Impact on teaching force and administration
As well as the direct impact on the teaching force that targeted attacks mean, they also impact on individuals’ decisions to join or remain within the profession. In a video statement made in July 2013, Boko Haram leader Abubakar Shekau explicitly threatened teachers, saying “School teachers who are teaching Western education? We will kill them! We will kill them!” (GCPEA, 2014, p.167). In 2013, the Nigerian Teachers Union reported that over 1,000 teachers had fled the north since 2012 (Amnesty International, 2013). As the conflict has since escalated, we should expect this number to be far greater now.
Taking 1,000 teachers as our lower bound, and applying it to the teacher training cost of $1,000 estimated above, we can cost the impact of this to the northern state education systems at $1m, though the national net cost may be zero if these teachers fill teacher shortages in other states.

28
The quantitative impact of armed conflict on education in Nigeria: case study
Table 7: Summary of other impacts of conflict on education in Nigeria, 2009–2013
Impact Monetary impact
Estimate Notes Estimate Notes
Lost student days
3,000,000 Summary of GCPEA (2014) data with assumption of average school closure 100 days
Students killed 100 Summary of GCPEA (2014) and Amnesty International data
Students injured
163 Summary of GCPEA (2014) data
Students kidnapped
Number unknown
Displaced students
Up to 1.1 million school-aged children displaced
This study, Section 3
See source for details on calculations
Recruitment of students to armed forces
No evidence
Number of children out of school because of conflict
Relatively few 2009–2011. Data beyond 2011 is limited
This study, Section 3
Impact of conflict on average years of schooling
0.037 years Assuming 0.5 years’ impact in Borno, Yobe and Adamawa
These states had existing low levels of access so this may be an overestimate
Impact on learning
Not quantifiable
29
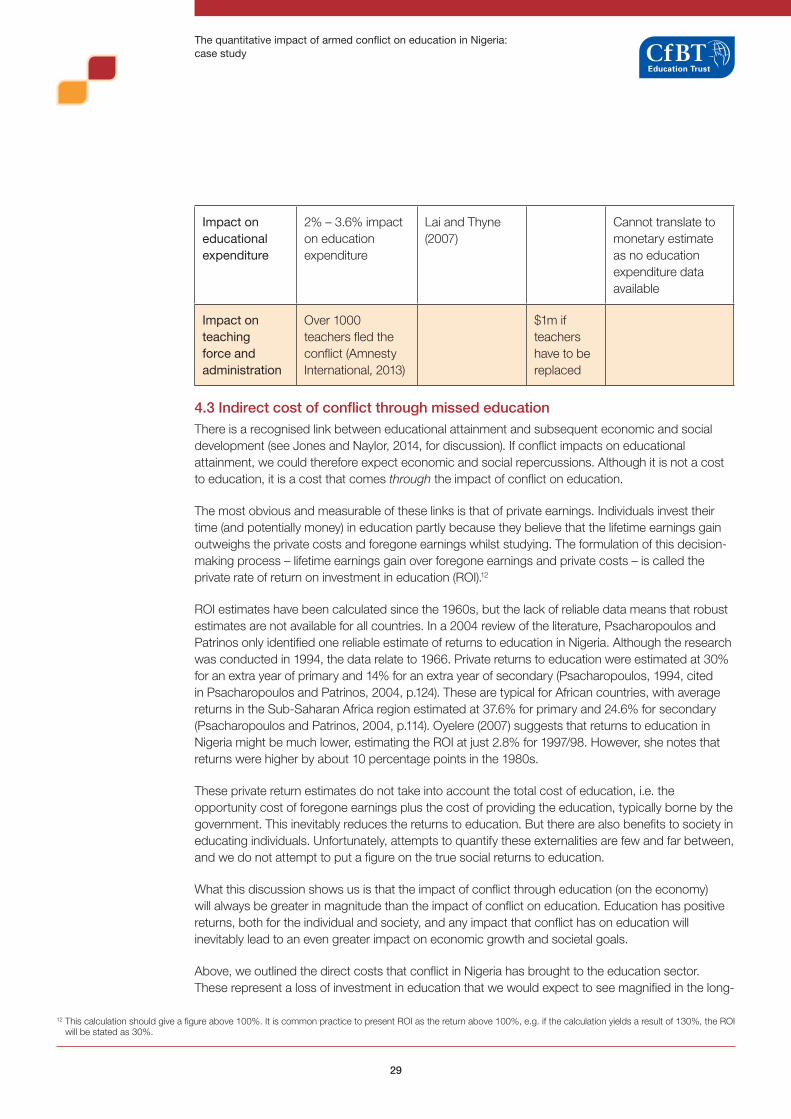
The quantitative impact of armed conflict on education in Nigeria: case study
Impact on educational expenditure
2% – 3.6% impact on education expenditure
Lai and Thyne (2007)
Cannot translate to monetary estimate as no education expenditure data available
Impact on teaching force and administration
Over 1000 teachers fled the conflict (Amnesty International, 2013)
$1m if teachers have to be replaced
4.3 Indirect cost of conflict through missed educationThere is a recognised link between educational attainment and subsequent economic and social development (see Jones and Naylor, 2014, for discussion). If conflict impacts on educational attainment, we could therefore expect economic and social repercussions. Although it is not a cost to education, it is a cost that comes through the impact of conflict on education.
The most obvious and measurable of these links is that of private earnings. Individuals invest their time (and potentially money) in education partly because they believe that the lifetime earnings gain outweighs the private costs and foregone earnings whilst studying. The formulation of this decision-making process – lifetime earnings gain over foregone earnings and private costs – is called the private rate of return on investment in education (ROI).12
ROI estimates have been calculated since the 1960s, but the lack of reliable data means that robust estimates are not available for all countries. In a 2004 review of the literature, Psacharopoulos and Patrinos only identified one reliable estimate of returns to education in Nigeria. Although the research was conducted in 1994, the data relate to 1966. Private returns to education were estimated at 30% for an extra year of primary and 14% for an extra year of secondary (Psacharopoulos, 1994, cited in Psacharopoulos and Patrinos, 2004, p.124). These are typical for African countries, with average returns in the Sub-Saharan Africa region estimated at 37.6% for primary and 24.6% for secondary (Psacharopoulos and Patrinos, 2004, p.114). Oyelere (2007) suggests that returns to education in Nigeria might be much lower, estimating the ROI at just 2.8% for 1997/98. However, she notes that returns were higher by about 10 percentage points in the 1980s.
These private return estimates do not take into account the total cost of education, i.e. the opportunity cost of foregone earnings plus the cost of providing the education, typically borne by the government. This inevitably reduces the returns to education. But there are also benefits to society in educating individuals. Unfortunately, attempts to quantify these externalities are few and far between, and we do not attempt to put a figure on the true social returns to education.
What this discussion shows us is that the impact of conflict through education (on the economy) will always be greater in magnitude than the impact of conflict on education. Education has positive returns, both for the individual and society, and any impact that conflict has on education will inevitably lead to an even greater impact on economic growth and societal goals.
Above, we outlined the direct costs that conflict in Nigeria has brought to the education sector. These represent a loss of investment in education that we would expect to see magnified in the long-
12 This calculation should give a figure above 100%. It is common practice to present ROI as the return above 100%, e.g. if the calculation yields a result of 130%, the ROI will be stated as 30%.

30
The quantitative impact of armed conflict on education in Nigeria: case study
term economic impact. If we assume 25% returns to education investment then the $5.7m direct cost calculated in Section 4.1 for 2009–2012 would translate to a $7.2m impact on national income.
But we also outlined how conflict’s impact on education is much broader than the monetary impacts to the sector. Conflict results in a reduction in access which ultimately leads to permanent reductions in average educational attainment. In Nigeria, however, we find that it is not possible to isolate the impact of conflict on access and years of schooling since low levels of enrolment predate the recent escalations in violence.
A gender dimension to conflict can mean that some of the costs of poor educational achievement are exacerbated. The gains of improved maternal and child health and decreased fertility that come with basic education for girls would be lost.
Table 8: Estimates of the long-term economic impact of current conflicts in Nigeria
Estimates Sources
Returns to education 2.8% – 38% Oyelere, 2007; Psacharopoulos, 1994; cited in Psacharopoulos and Patrinos, 2004
Opportunity cost of damaged infrastructure and personnel
$7.2m Calculations from 4.1; assuming 25% ROI based on above
4.4 SummaryWe have tried to list the major channels through which conflict impacts on education, from the immediate impacts of a bombed school to the long-term impacts on the economy of reduced national education levels. These estimates have drawn on different data and theoretical sources, each with their own methodological issues.
When trying to account for physical damage, we are likely to face an underestimation bias as we take documented accounts as our starting point; amidst the danger and confusion that has reigned in certain parts of Nigeria during the reporting period of our principal source, Education under Attack 2014, it is likely that there have been further costs unidentified. Although we have tried to account for these, we have only done so where there is hard evidence to back up our claims.
We took a very different approach when it came to the indirect costs of conflict, as there simply is no hard evidence. Our estimates are by necessity highly speculative, intended to give an idea of the possible order of magnitude, and to demonstrate that the impact of conflict on society through the channel of education is greater than the damage to bricks, mortar and budget lines. Damage to buildings, equipment and materials, and the loss of teaching staff brings harm to the long-term progress of the sector. Access to education is denied for thousands of children, permanently impacting on national educational attainment. Since education typically exhibits positive returns, these effects are magnified in the long term on the economy. And the social benefits of education are also foregone, having a long-term impact on maternal and child health, for example.
Where possible we have drawn on a variety of theoretical approaches in order to provide validation or alternative estimates. Our findings are summarised in the table on the following page.

31
The quantitative impact of armed conflict on education in Nigeria: case study
Table 9: Summary of cost of conflict on and through education
Impact Estimate
Direct cost to the education sector of targeted attacks on education, 2009–2012 $5.7m
Opportunity cost of lost investments (long-term impact of the previous impact) $7.2m
Of course, all these calculations are highly speculative and cannot embody the complex interaction of various factors such as education, conflict, poverty, inequality and religious difference. It may well be that Nigeria’s low levels of education are more a cause of conflict than conflict is a cause of low levels of education, but the more likely truth is that they interact with each other in ways that make it impossible to put a figure on the cost. What we have attempted here is to demonstrate the potential order of magnitude of the cost that conflict might have on education, and the impact that this then has on economic and social development.

32
The quantitative impact of armed conflict on education in Nigeria: case study
5 Conclusion
This study set out to investigate the impact that conflict has on education in Nigeria, and to account for this quantitatively firstly by looking at the number of OOSC and secondly by monetising the damage done to national education systems, in terms of both material damage and loss of human capital. In order to do this the study has looked at both the macro, econometric data and detailed country evidence that considers the local context and dynamic nature of conflict. It has considered both the immediate, direct costs and the longer-term more indirect costs that can only be determined by looking at changing enrolment and conflict trends over periods of time.
The most visible channel through which conflict impacts on education – the one that makes the newspaper headlines, and is documented by the UN and GCPEA – is the targeted attacks on education that have been increasing in frequency in recent months. In our main report we speculate that, at the global level, these targeted attacks represent just the ‘tip of the iceberg’ and that collateral damage and more indirect effects would represent far greater impacts. In Nigeria, the centrality of ‘Western’ education to Boko Haram’s campaign means that the scale of the damage done to education through targeted attacks is similar to that of collateral damage. For example, the number of teachers killed in targeted attacks (30–40) is similar in scale to our estimate of the numbers killed due to collateral damage (approximately 50) over the same period. However, the scale of the impact on education through indirect channels is still far greater than the direct effects. For example, whilst tens of thousands of children have had their schooling disrupted due to school closure as a result of attacks, hundreds of thousands have had their education disrupted due to forced displacement.
The high rates of OOSC in Nigeria predate the conflict and, based on the most recent data available (2011), it is difficult to discern any effect that conflict has had on enrolment rates, even when the conflict-affected north east is considered separately from the rest of the country. Weak governance, lack of investment in education and the low demand for Western-style education, particularly for girls in the north of the country, appear to be much more significant drivers of the high OOSC rates. In the future, enrolment data collected since 2012 may show a link between OOSC rates and the conflict in the north east. However, it should be noted that much of the targeting by Boko Haram has been at post-primary level, and the impact on enrolment at primary level may be very hard to discern against the already very low enrolment rates in the region.
Targeted attacks on education during conflict create real costs to the sector. Schools have to be repaired or rebuilt, furniture and teaching materials restocked and lost personnel replaced. When schools are closed there may also be the cost of paying teachers who are not teaching. For the period 2009–2012, we estimate the sum of these costs for Nigeria to be $5.7m. For the fourteen months to February 2014 we estimate further costs of $3.1m, and attacks on schools are continuing.
In a country with the mineral wealth of Nigeria, these figures are just a drop in the ocean. But the fear that these attacks are designed to create, is likely to be far more significant. It is too early to discern the impact on access to education, but if current levels of conflict continue – Nigeria is technically in a state of civil war – we can imagine a long-term impact on educational levels as a direct result of conflict. Econometric analysis identified a long-term impact of 20% less schooling directly as a result of the 100-day genocide in Rwanda. In our other case studies on DRC and Pakistan we speculate that the length and intensity of conflicts there will also have a significant long-term impact on human capital accumulation in their conflict-affected regions. We might soon be saying the same thing about Borno, Yobe and Adamawa states.

33
The quantitative impact of armed conflict on education in Nigeria: case study
The current conflict in Syria and the fear of a ‘lost generation’ have created a sense in the mind of the public of what denial of education on a massive scale means. Levels of OOSC in Nigeria have long dwarfed that of Syria’s present predicament. Boko Haram’s war against education can only make the matter worse.

34
The quantitative impact of armed conflict on education in Nigeria: case study
References
ACLED (2013) Country report Nigeria. http://www.acleddata.com/wp-content/uploads/2013/04/ACLED-Country-Report_Nigeria_April-2013.pdf
Adebiyi, M.A. and Oladele, O. (2004) Public education expenditure and defence spending in Nigeria: An empirical investigation. Lagos, Nigeria: Department of Economics, University of Lagos.
Amnesty International (2013) ‘Keep away from schools or we’ll kill you: Right to education under attack in Nigeria’. Amnesty International October 2013, London.
Amnesty International (2014) ‘Nigeria: more than 1,500 killed in armed conflict in North Eastern Nigeria in early 2014’. Amnesty International, 31 March 2014, London.
Cambridge Education (2006) Education management information system: a short case study of Nigeria. Working paper no. 5, Infodev, downloaded from http://www.infodev.org/infodev-files/resource/InfodevDocuments_503.pdf
CFR (2014) Global conflict tracker. New York: Council on Foreign Relations. http://www.cfr.org/global
DFID (2014) Memorandum to the committee of public accounts: results and value for money: year two progress update on DFID’s education portfolio. London: Department for International Development.
EPDC (undated) Nigeria out of school profile. http://www.epdc.org/country/nigeria Downloaded 11/3/2014.
GCPEA (2014) Education under Attack 2014. New York: Global Coalition to Protect Education from Attack.
IDMC (2013) Nigeria: Internal displacement in brief. http://www.internal-displacement.org/sub-saharan-africa/nigeria/ Downloaded 11/3/2014.
Jones, A. and Naylor, R. (2014) The quantitative impact of armed conflict on education: counting the human and financial costs. Doha: PEIC. Available at http://educationandconflict.org/
Lai, B. and Thyne, C. (2007) ‘The effect of civil war on education 1980–97’. Journal of peace research. Vol. 44, No. 3, 2007, pp.277–292.
National Population Commission (NPC) and RTI International (2011) Nigeria Demographic and Health Survey (DHS) EdData profile 1990, 2003, and 2008: education data for decision-making. Washington, DC, USA: National Population Commission and RTI International.
Naylor, R. (2012) Review of Girls’ Education Project 3 Monitoring and Reporting System: recommendations for change. CfBT Education Trust for DFID.
Nigeria National Bureau of Statistics, UNICEF and United Nations Population Fund (2013) Nigeria multiple indicator cluster survey 2011. Abuja/New York: Nigeria National Bureau of Statistics.
35
The quantitative impact of armed conflict on education in Nigeria: case study
Omojimite, B. (2012) ‘Public education and defence spending in Nigeria: implications for economic growth’, in Journal of education and social research, Vol 12 (1) Jan 2012, pp.59–72.
Oyelere, R. (2007) Africa’s education enigma? The Nigerian story. Discussion Paper No. 3097, Institute for the Study of Labor (IZA).
Psacharopoulos, G., and Patrinos, H. (2004) ‘Returns to investment in education: a further update’, Education economics, 12(2), pp.111–34.
Save the Children (2013) Attacks on education: the impact of conflict and grave violations on children’s futures. London: Save the Children.
Theunyck, S. (2009) School construction strategies for universal primary education in Africa: should communities be empowered to build their schools? Africa Human Development Series. Washington DC: World Bank.
UCDP (2014) Conflict encyclopedia: www.ucdp.uu.se/database, Uppsala University.
UNESCO (2009) Overcoming inequality: why governance matters. Education for All Global Monitoring Report 2009. Paris: UNESCO.
UNESCO (2014) Teaching and learning: achieving quality for all. Education for All Global Monitoring Report 2013/14. Paris: UNESCO.
UNHCR (2014). Sahel operation: Nigeria crisis. Update as of February 2014 http://reliefweb.int/sites/reliefweb.int/files/resources/NigeriaSituationOverview-Regional_February_2014.pdf
UNICEF (2012) Nigeria country study: global initiative on out-of-school children. UNICEF.
World Bank (2008) Nigeria: a review of the costs and financing of public education. World Bank Human Development Unit Africa Region.
Zenn, J and Pearson, E. (2014) ‘Women, gender and the evolving tactics of Boko Haram’, Journal of terrorism research, Vol. 5 Issue 1 (special issue) pp.46–57. St Andrews: The Centre for the Study of Terrorism and Political Violence.

36
The quantitative impact of armed conflict on education in Nigeria: case study
Statistical data sources on conflict and enrolment
UCDP (2014)Conflict Encyclopedia, http://www.ucdp.uu.se/database, Uppsala University.
EPDCNigeria Out of School Profile, http://www.epdc.org/country/nigeria
NEDS (2010)Nigeria Education Data Survey 2010, https://www.eddataglobal.org/household/index.cfm?fuseaction=showDatasetDir&A2=NG
MICS (2007, 2011)Nigeria Multiple Indicator Cluster Survey.
NDHS (2003, 2008)Nigeria Demographic and Health Survey (DHS), http://www.dhsprogram.com/Where-We-Work/Country-Main.cfm?ctry_id=30&c=Nigeria&Country=Nigeria&cn=&r=1
UISUNESCO Institute for Statistics (year of data given in brackets), http://www.uis.unesco.org

CfBT Education Trust60 Queens RoadReadingBerkshireRG1 4BS
+44 (0)118 902 1000
www.cfbt.com PM
S 6
640
10/
14
ISB
N: 9
78-1
-909
437-
55-5


![EDT/Collect for DigitalMicrograph · 2017-01-31 · [1] P. Oleynikov. Automated Quantitative 3D Electron Diffraction Rotation Tomography. In: Uniting Electron Crystallography and](https://img.pdfslide.us/doc/110x75/5f778d86c79dc727f2733122/edtcollect-for-digitalmicrograph-2017-01-31-1-p-oleynikov-automated-quantitative.jpg)