Embed Size (px)
Citation preview
The Quality of Fertilizer Traded in West Africa: Evidence for Stronger Control
March 2013
The Quality of Fertilizer Traded in West Africa: Evidence for Stronger Control

The Quality of Fertilizer Traded in West Africa: Evidence for Stronger Control
by Joaquin Sanabria, Georges Dimithe and Emmanuel K.M. Alognikou
With the collaboration of:
IFDC Country levelAmit RoyJohn AllgoodPeter HeffernanRick Austin
Kouadio Jean Esse (Côte d’Ivoire)Affouet Martine Aboin Kouame (Côte d’Ivoire)Felicia Ansah-Amprofi (Ghana)Ernest Osei Assibey (Ghana)Olayiwola Samuel Oluyomi (Nigeria) Isah Adamu (Nigeria)Yacine Ndour Ndeye (Senegal)Ibrahima Dieme (Senegal)Bikpéta Anakoma (Togo)Koumana Kpemou (Togo)
International Fertilizer Development Center
With financial assistance from the Directorate-General for International Cooperation (DGIS)
A Joint ECOWAS, UEMOA and IFDC ReportMarch 2013
Library of Congress Cataloging-in-Publication Data
Sanabria, Joaquin. The quality of fertilizer traded in West Africa : evidence for stronger control / by Joaquin Sanabria, Georges Dimithè and Emmanuel K.M. Alognikou ; with the collaboration of: IFDC ... [et al.]. p. cm. ISBN 978-0-88090-173-41. Fertilizer industry--Africa, West--Quality control. 2. Fertilizer industry--Government policy--Africa, West. 3. Fertilizers--Africa, West--Analysis. I. Dimithè, Georges, 1959- II. Alognikou, Emmanuel K. M., 1959- III. International Fertilizer Development Center. IV. Netherlands. Directoraat-Generaal Internationale Samenwerking. V. Title. HD9483.A3582S26 2013 631.8028’7--dc23 2013020728
Foreword
One of the key pieces of the integration of the economies of West African States is the development of regional markets. Considering the overriding role agriculture plays in the development of these economies, strengthening agricultural inputs and produce markets is central to West Africa’s economic integration. This is clearly articulated in the agricultural policy UEMOA adopted in 2000 and reaffirmed subsequently in 2005 in the ECOWAS agricultural policy. The liberalization of national economies in the 1980s and 1990s aimed to unleash the power of the private sector to drive economic development through greater participation in economic activities. Many now recognize that, in each country, this was done without a definition of the “rules of the game” and, in most cases, without proper recognition that national markets are too small to attract significant private sector investments to fill the gap the withdrawal of the public sector created. It was therefore not surprising that in all countries, concern emerged over the quality of products being offered for sale, particularly fertilizers.
In their effort to facilitate the development of a regional agro-input market, the ECOWAS and UEMOA Commissions made the adoption of market-friendly regional regulatory frameworks that institute the quality control of agro-inputs traded one of the priorities in the implementation of their regional agricultural policy. For fertilizer, this effort is also part of the implementation of the regional strategy for promoting fertilizer use that the Commissions adopted in 2006, prior to the Africa Fertilizer Summit.
This report is a contribution to national and regional efforts aimed at intensifying the use of inorganic and organic fertilizers, an input African Heads of States and Governments declared, at the Summit held in Abuja in 2006, “a strategic commodity in achieving the African Green Revolution to end hunger.” The report also reminds policymakers that while promoting greater fertilizer use, it is equally important to effectively control its quality to promote fair competition among sellers. This would ensure that farmers get what they paid for because they will use fertilizers only if these fertilizers are of good quality. Finally, the study will serve as a baseline for assessing the performance of the quality control and regulatory mechanism that is being instituted with the adoption of the regional framework.
Although many individuals and organizations contributed to the design and completion of this study, the support, guidance and cooperation of fertilizer
iii
importers and agro-dealers in the target countries were critical. Similarly, the funding support of DGIS through MIR Plus, a joint ECOWAS and UEMOA project implemented by IFDC, was equally critical. The ECOWAS Commission and IFDC gratefully acknowledge these supports.
Dr. Amit H. RoyPresident and CEOIFDC
Dr. Marc L. AtougaCommissioner for Agriculture, Environment and Water ResourcesECOWAS Commission
iv
Table of Contents
Acronyms .......................................................................................................xExecutive Summary ......................................................................................xiIntroduction .................................................................................................. 1Section 1. Methodology .............................................................................. 5
1.1. Data and Sample Collection .............................................................. 51.1.1. Sampling of Fertilizer Dealers ................................................... 61.1.2. Random Sampling of Fertilizers and Collection of Data ........... 6
1.2. Chemical and Physical Analyses of Fertilizer Samples ..................... 71.2.1. Selection of the Laboratory ...................................................... 71.2.2. Chemical Analysis of Fertilizers ................................................ 81.2.3. Physical Analysis of Fertilizers ............................................. 8
1.3. Data Analysis and Interpretation .................................................10 1.3.1. Nutrient Content Compliance .............................................101.3.2. Bag Weight Verification ....................................................... 131.3.3. Evaluation of Fertilizer Physical Attributes ........................131.3.4. Factors Influencing Fertilizer Quality ................................14
Section 2. Results and Discussion ..........................................................152.1. Distribution of Fertilizer Samples ...............................................152.2. Fertilizer Nutrient Content Compliance ............................................17
2.2.1. NPK 15:15:15 Blend and Compound .................................182.2.2. NPK 16:16:16 Compound ................................................... 222.2.3. NPK 20:10:10 Blend ............................................................ 222.2.4. NPK 6:20:10 Blend .............................................................. 222.2.5. NPK 15:10:10 Blend ............................................................ 232.2.6. Asaase Wura Blend (0:22:18+9CaO+7S+5MgO) ............. 232.2.7. Cocoa Feed Blend (0:30:20) ............................................... 242.2.8. Urea (46:0:0) ......................................................................... 242.2.9. Ammonium Sulfate (21:0:0+24S) ....................................... 242.2.10. Sulfan (24:0:0+6S) ............................................................. 252.2.11. NPK 23:10:5 Compound ................................................... 252.2.12. Single Superphosphate (SSP) .......................................... 25
2.3. Fertilizer Bag Weight Compliance ................................................... 272.4. Factors Influencing Nutrient Content .............................................. 28
2.4.1. Market Characteristics ............................................................ 282.4.2. Dealer Characteristics ............................................................. 292.4.3. Physical Attributes of Fertilizers .............................................. 31
2.5. Adulteration of Fertilizers ................................................................. 36Conclusions and Recommendations ....................................................... 38
v
Appendices ................................................................................................. 43Appendix A. Procedures for Data Collection and Fertilizer Sampling and
Sample Reduction .............................................................................. 43Appendix B. Summary of Chemical Methodologies for Fertilizer
Analysis .............................................................................................. 51Appendix C. ECOWAS Tolerance Limits for Plant Nutrients and
Bag Weight ......................................................................................... 56Appendix D. Figures for Nutrient Content Compliance .......................... 57Appendix E. Figures for Departure from Total Grade of Bulk-Blended
Fertilizers ............................................................................................ 64Appendix F. Non-Significant Results from Association Test Between
Market, Dealer and Fertilizer Characteristics with Nutrient Content Quality ................................................................................................ 66
vi
List of Tables
Table 1. Probability for Out-of-Nutrient Content Compliance of All Fertilizers Samples Analyzed .................................................................. 17Table 2. Probability for Out-of-Nutrient Content Compliance of NPK 15:15:15 Sampled in Four Countries of the ECOWAS Sub-Region ............. 20Table 3. Probability of Fertilizer Bags Being Out of Weight Compliance ...... 28Table 4. Relationship Between Factors from Market Characteristics and Content Quality of at Least One of the Primary Nutrients ...................... 28Table 5. Relationship Between Factors from Fertilizer Dealer Characteristics and Content Quality of at Least One of the Primary Nutrients ............... 30Table 6. Relationship Between Fertilizer Physical Attributes and Content Quality of at Least One of the Primary Nutrients .................................... 36Table A.1. Characteristics of Markets, Dealers, Storage and Fertilizer Products Collected During Visit to Fertilizer Dealers .............................. 49Table A.2. Qualitative Assessment of Fertilizer Physical Attributes .............. 50Table A.3. Sample Fertilizer Label ................................................................ 50Table F.1. Market, Dealer and Fertilizer Physical Attributes That Present No Significant Association with Fertilizer Nutrient Content Quality ............. 66
vii
List of Figures
Figure 1. General Methodology for the Quality Assessment of Fertilizers Commercialized in the ECOWAS Countries .............................................. 5Figure 2. Breakdown of the Number of Samples Collected by Country ...... 15Figure 3. Breakdown of Fertilizer Samples by Country and Type of Fertilizer ............................................................................................... 16Figure 4. Mineralogy X-Ray Analysis of a Single Superphosphate (SSP) Fertilizer Sample ...................................................................................... 26Figure 5. Compliance Analysis for the Fertilizer Bag Weight ....................... 27Figure 6. Granular Integrity Comparisons Between Blended and Compound Fertilizers .............................................................................. 32Figure 7. Comparison Across Countries of Granular Integrity for 15:15:15 Blended and Compound Fertilizer ........................................... 33Figure 8. Contrast of Moisture Levels for Several Fertilizer Products .......... 34Figure 9. Urea Caking and Type of Fertilizer Bag Levels Across the Five Countries Sampled .................................................................................. 35Figure 10. Evidence of Adulteration as Reported by Sampling Teams During Data Collection ............................................................................ 37Figure A.1. Sampler for Solid Bagged Fertilizers ......................................... 45Figure A.2. Sampling Technique for Bagged Fertilizers ............................... 46Figure A.3. Sampling Technique from an Open Bag .................................... 46Figure A.4. A Riffle Splitter with 20 Chutes and Two Collecting Pans ......... 48Figure D.1. ECFDF for the Nutrient Content Compliance Analysis of NPK 15:15:15 .......................................................................................... 57Figure D.2. ECFDF for Nutrient Content Compliance Across Countries of Blended and Compound NPK 15:15:15 ............................................. 58Figure D.3. ECFDF for the Nutrient Compliance Analysis of 16:16:16 ........ 59Figure D.4. ECFDF for the Analysis of Nutrient Content Compliance of NPK 20:10:10 ...................................................................................... 59Figure D.5. ECFDF for the Analysis of Nutrient Content Compliance of NPK 6:20:10 ........................................................................................ 60Figure D.6. ECFDF for the Analysis of Nutrient Content Compliance of NPK 15:10:10 ...................................................................................... 60Figure D.7. ECFDF for the Analysis of Nutrient Content Compliance of Asaase Wura ....................................................................................... 61Figure D.8. ECFDF for the Analysis of Nutrient Content Compliance of Cocoa Feed ........................................................................................ 61Figure D.9. ECFDF for the Analysis of Nutrient Content Compliance of Urea .................................................................................................... 62
viii
Figure D.10. ECFDF for the Analysis of Total Nitrogen Content Compliance of Ammonium Sulfate ......................................................... 62Figure D.11. ECFDF for the Analysis of Nutrient Content Compliance of Sulfan .................................................................................................. 63Figure D.12. ECFDF for the Analysis of Nutrient Content Compliance of NPK 23:10:5 ........................................................................................ 63Figure E.1. ECFDF for the Departure from Total Grade of Blended Fertilizers ................................................................................................. 64Figure E.2. ECFDF for the Departure from Total Grade of Blended 15:15:15 Across Three Countries ............................................................ 65
ix
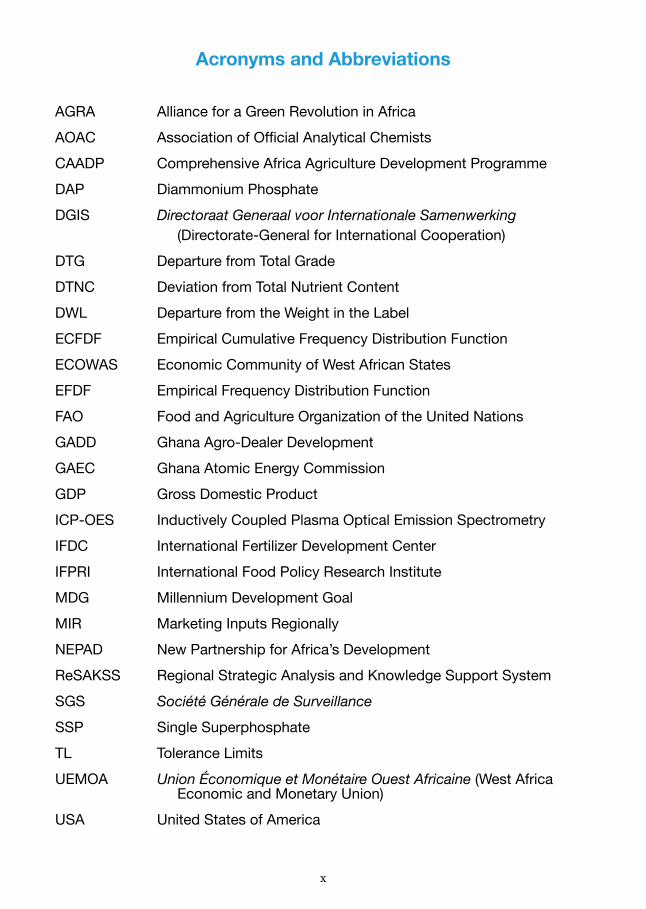
Acronyms and Abbreviations
AGRA Alliance for a Green Revolution in AfricaAOAC Association of Official Analytical ChemistsCAADP Comprehensive Africa Agriculture Development ProgrammeDAP Diammonium Phosphate DGIS Directoraat Generaal voor Internationale Samenwerking
(Directorate-General for International Cooperation)DTG Departure from Total GradeDTNC Deviation from Total Nutrient ContentDWL Departure from the Weight in the LabelECFDF Empirical Cumulative Frequency Distribution FunctionECOWAS Economic Community of West African StatesEFDF Empirical Frequency Distribution FunctionFAO Food and Agriculture Organization of the United NationsGADD Ghana Agro-Dealer DevelopmentGAEC Ghana Atomic Energy CommissionGDP Gross Domestic ProductICP-OES Inductively Coupled Plasma Optical Emission SpectrometryIFDC International Fertilizer Development CenterIFPRI International Food Policy Research InstituteMDG Millennium Development GoalMIR Marketing Inputs Regionally NEPAD New Partnership for Africa’s DevelopmentReSAKSS Regional Strategic Analysis and Knowledge Support SystemSGS Société Générale de SurveillanceSSP Single SuperphosphateTL Tolerance LimitsUEMOA Union Économique et Monétaire Ouest Africaine (West Africa
Economic and Monetary Union)USA United States of America
x
The Quality of Fertilizer Traded in West Africa: Evidence for Stronger Control
Executive SummaryThe Commissions of the Economic Community of the West African States (ECOWAS) and the West African Economic and Monetary Union (UEMOA) are developing a regional legal framework for controlling the quality of fertilizer traded in West Africa. The main purpose of this framework is to safeguard the interests of farmers against nutrient deficiencies, adulteration, misleading claims and short weight as well as to contribute to the creation of an enabling environment for private sector investment in the fertilizer industry. To determine the basis for assessing the effectiveness of this framework once it is implemented, the ECOWAS and UEMOA Commissions initiated, through the Marketing Inputs Regionally (MIR) Plus project, a study to assess the quality of fertilizer traded in West Africa as well as factors influencing fertilizer quality.
The study was carried out by trained inspectors from the national fertilizer regulatory services in five West African countries – Côte d’Ivoire, Ghana, Nigeria, Senegal and Togo. The sampling methodology consisted of two steps. The first step focused on obtaining a random sample of 5 to 10 percent of fertilizer dealers in each country either from maps (Ghana and Nigeria) that geo-reference the location of each dealer or from lists of dealers available at the ministry in charge of agriculture (Côte d’Ivoire, Senegal and Togo). The second step was the collection of random samples of fertilizers from each of dealers selected in the first step. Fertilizer sampling and collection were conducted following an agreed-upon protocol. In addition, pretested questionnaires were used to record conditions of storage, physical attributes of fertilizers and characteristics of markets and dealers.
A total of 2,037 fertilizer samples was collected from 827 wholesalers, government depots and retailers of various sizes in the five countries. The distribution of these fertilizer samples is a good representation of the relative importance of the different fertilizer products in the five countries. Urea and the NPK 15:15:15 blend were the only products collected from each of the five countries. Urea, the compound NPK 15:15:15, the compound NPK 16:16:16, the compound NPK 23:10:5, the blend NPK 15:15:15 and ammonium sulfate (AS) account for 79 percent of the samples collected.
xi
The chemical analyses of the fertilizer samples focused on determining the content of primary plant nutrients (total nitrogen, available phosphorus and soluble potassium). However, analyzing samples for secondary nutrients (calcium, magnesium and sulfur) was considered, but only the sulfur content in the samples of Sulfan collected in Ghana was analyzed.
Statistical analyses described in Section 1 were applied to data on nutrient content, physical attributes and characteristics of markets and dealers, and storage conditions to determine the quality of the different fertilizer products and to associate fertilizer quality with market and dealer characteristics. To be meaningful, the nutrient content compliance was analyzed with inferential statistical methods only for the fertilizer products with at least 23 samples and these accounted for 93 percent of all the samples collected in the study. Fertilizers that were collected with a sample size lower than 23 were analyzed only descriptively. Nutrient content compliance was assessed based on newly adopted ECOWAS standards.
Blends and Compounds Present Cases of Poor Quality, but This is Most Severe for BlendsThe chemical analyses carried out show that NPK fertilizers manufactured through blending present the most frequent cases of poor quality compared with compound products. More specifically, 51 percent of the 106 samples of the 15:15:15 blend were out of compliance with the newly adopted ECOWAS tolerance limits for nutrient content deviations. Similarly, other products that failed to meet the ECOWAS quality standards were 86 percent of the 90 samples of the 20:10:10 blend, 12 percent of the 30 samples of the 6:20:10 blend, 96 percent of the 27 samples of the 15:10:10 blend, 31 percent of the 23 samples of Asaase Wura (0:22:18+9CaO+7S+5MgO) and 26 percent of the 27 samples of Cocoa Feed (0:30:20).
In contrast to the blended products, the only compound products that failed to meet the ECOWAS quality standard were 4 percent of the 534 samples of urea, 10 percent of the 356 samples of the compound 15:15:15, 16 percent of the 162 samples of AS (21:0:0+24S), 15 percent of the 162 samples of compound 16:16:16, 1 percent of the 103 samples of compound 23:10:5 and 4 percent of the 90 samples of Sulfan (24:0:0+6S). While the proportions of non-compliant samples observed in the compound products are lower than the ones observed in blended products, these can still be considered high for imported products. This result confirms the finding of a previous assessment IFDC carried out in West Africa in 1995 indicating that 10 of the 29 samples of NPK compounds examined were nutrient-deficient.
xii
Of the 10 samples of single superphosphate (SSP) collected from several locations in Nigeria, seven of them were found to contain no phosphorus (P2O5) but contained mainly quartz (SiO2). The chemical and X-ray mineralogical analyses indicate that the samples with no phosphorus come from spurious materials without fertilizer characteristics that are commercialized as SSP.
Country-to-Country Comparisons Show Variable Product QualityCountry-to-country comparisons made between Côte d’Ivoire, Ghana and Togo for the 15:15:15 blend and between Ghana, Nigeria and Togo for the 15:15:15 compound show a great deal of variability between countries. The overall out-of-nutrient content compliance probability of the 15:15:15 blend was the highest in Côte d’Ivoire (0.87), followed by Ghana (0.42) and Togo (0.06). For the 15:15:15 compound, the overall out-of-nutrient content compliance probability was the highest in Nigeria (0.16), followed by Ghana (0.10) and Togo (0.03). The low proportion of non-compliant samples observed in Togo may be attributed to the fact that, of the three countries, Togo might be expected to have low variability in the importation sources and a relatively simple distribution chain due to government control of importation and distribution.
Nutrient Deficiencies in Blended Products are Not Simply an Issue of Segregation The analysis indicated that the main reason for nutrient content deficiencies in Asaase Wura is the uneven distribution of nutrients in the fertilizer bags caused by granule segregation. Nutrient content deficiencies are also attributed to segregation of the fertilizer components used in the bulk blend for half of the NPK 15:15:15, two-thirds of the Cocoa Feed and one-third of the NPK 6:20:10 samples. These results suggest that the high proportion of nutrient-deficient cases found in these products can be avoided by using fertilizers of uniform granule size for the manufacture of these blends and by utilizing appropriate equipment and procedures to make the blends.
The effect of segregation in the NPK blends 15:10:10 and 20:10:10, which have the highest proportion of non-compliant samples, is found to be minimal. This indicates that the lack of nutrient compliance in these products is caused primarily by insufficient nutrient input in the blend manufacture. Reduction of nutrient content along the distribution chain could be another explanatory factor, but evidence of such cases was not documented in this study for these products.
xiii
Evidence of Adulterated Products in the Collected Samples is Weak Trained inspectors reported evidence of adulteration in 31 of 134 (23 percent) samples collected in Côte d’Ivoire but only 14 of 414 (3.4 percent) samples from Nigeria. However, the only cases of completely proven adulteration are the seven samples of SSP from Nigeria that were found to have no P2O5 content or any of the minerals that carry P in phosphate rock. While high percentages of nutrient deficient samples in some NPK blends found in some countries could be interpreted as fraud during manufacturing or along the distribution chain, this is not substantiated by findings of this study; the lack of or poor control of blending procedures and use of inadequate blending equipment are also possible explanations.
Short Weight Fertilizer Bags are Common in the Market An analysis of the weight of 1,055 fertilizer bags collected from all five countries indicates that there is a 41 percent chance that the bag weight does not comply with the ECOWAS tolerance limit in Nigeria, a 28 percent chance in Côte d’Ivoire, 13 percent in Senegal, 12 percent in Ghana and 7 percent in Togo. The two probable reasons for underweight bags are deliberate acts of underweighting and poor process control during the bagging of imported products or during rebagging along the distribution chain.
Market Characteristics are Associated with the Quality of Products A statistically significant association between market characteristics and fertilizer quality categories (good or bad) was found only for NPK 15:15:15 blends when samples from all countries were combined. This was probably because under this scenario (aggregating samples), there is enough variability in the samples collected between the two categories (“Bad” and “Good”) for this particular product. The rural markets are associated with a significantly higher percentage (87.5 percent) of “Good” quality fertilizer than the urban markets (56.5 percent). Statistical analysis results also showed that permanent markets tend to have a significantly higher percentage of “Good” quality NPK 15:15:15 blends than periodic markets. Similarly, markets with a high concentration of agro-dealers tend to have a significantly higher percentage of “Good” quality products than isolated agro-dealers.
When data were analyzed by country, the pattern of the associations between market characteristics and fertilizer quality differed from the pattern identified when the aggregated data from the five countries were analyzed. This was either because some associations could not be evaluated due to insufficient sample size or because of insufficient quality variability within fertilizers
xiv
with appropriate sample size. With country-level analysis, a statistically significant association between market characteristics and fertilizer quality categories (good or bad) was found only for the 15:15:15 blend in Ghana and for the 15:15:15 compound in Nigeria. In Nigeria, the urban markets showed significantly higher frequency of good quality than the rural markets. In Ghana, the permanent markets and the dealers that sell mainly to large-scale farmers presented significantly higher frequency of good quality than temporary markets and dealers that sell mainly to small-scale farmers, respectively.
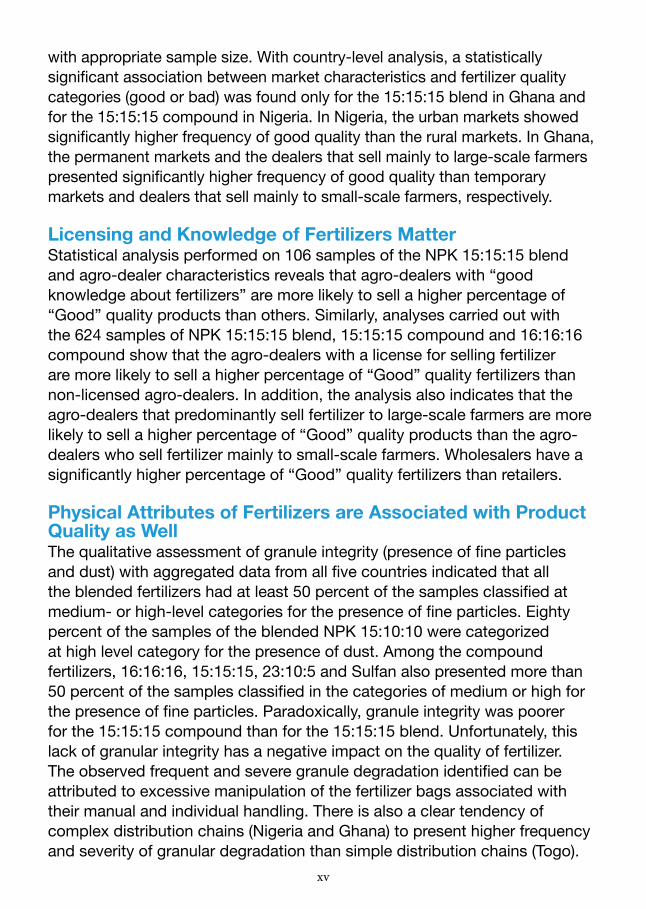
Licensing and Knowledge of Fertilizers Matter Statistical analysis performed on 106 samples of the NPK 15:15:15 blend and agro-dealer characteristics reveals that agro-dealers with “good knowledge about fertilizers” are more likely to sell a higher percentage of “Good” quality products than others. Similarly, analyses carried out with the 624 samples of NPK 15:15:15 blend, 15:15:15 compound and 16:16:16 compound show that the agro-dealers with a license for selling fertilizer are more likely to sell a higher percentage of “Good” quality fertilizers than non-licensed agro-dealers. In addition, the analysis also indicates that the agro-dealers that predominantly sell fertilizer to large-scale farmers are more likely to sell a higher percentage of “Good” quality products than the agro-dealers who sell fertilizer mainly to small-scale farmers. Wholesalers have a significantly higher percentage of “Good” quality fertilizers than retailers.
Physical Attributes of Fertilizers are Associated with Product Quality as WellThe qualitative assessment of granule integrity (presence of fine particles and dust) with aggregated data from all five countries indicated that all the blended fertilizers had at least 50 percent of the samples classified at medium- or high-level categories for the presence of fine particles. Eighty percent of the samples of the blended NPK 15:10:10 were categorized at high level category for the presence of dust. Among the compound fertilizers, 16:16:16, 15:15:15, 23:10:5 and Sulfan also presented more than 50 percent of the samples classified in the categories of medium or high for the presence of fine particles. Paradoxically, granule integrity was poorer for the 15:15:15 compound than for the 15:15:15 blend. Unfortunately, this lack of granular integrity has a negative impact on the quality of fertilizer. The observed frequent and severe granule degradation identified can be attributed to excessive manipulation of the fertilizer bags associated with their manual and individual handling. There is also a clear tendency of complex distribution chains (Nigeria and Ghana) to present higher frequency and severity of granular degradation than simple distribution chains (Togo).
xv
As expected, the study found a strong association between high moisture levels and high caking levels for both the blended fertilizers and the compound fertilizers. In addition, the importance of appropriate bagging was underscored by findings in Senegal where 41 percent of the bags were found to be outer woven without plastic inner lining, and 61 percent of the samples presented medium to high degrees of urea caking. Low frequency of caking in urea was closely associated with the use of laminated bags or bags with plastic lining in Ghana, Nigeria and Togo.
Among the physical attributes of fertilizer considered in the study, the moisture content and the segregation showed significant relationships with nutrient content quality only in the NPK 15:15:15 blend.
Effective Implementation of the Adopted ECOWAS Fertilizer Regulatory System is CriticalThe study results clearly suggest that effectively implementing the adopted ECOWAS fertilizer regulatory system is likely to ensure that products supplied to the market meet high quality standards. The system calls for licensing of agro-dealers as well as inspection, sampling and analysis of fertilizers at importation points and along the distribution chain.
Assessing the Economics of Fertilizer Quality Deficiencies for Farmers and National Economies is NeededThe study found high frequencies of poor-quality fertilizer in the target countries. These deficiencies have a direct effect on revenues at the farmer and country levels. Analyzing these effects will be an important contribution.
Addressing the Quality Challenges of the Blends is NeededThe fact that blends show the most frequent and severe cases of poor quality suggests that it is imperative to identify the origin of their quality problems and to propose appropriate solutions. In addition, there is a clear need to enhance the manufacturing knowledge and equipment for manufacturing blends.
Building the Capacity of Agro-Dealers is Necessary The study results equally suggest the need to train distributors on the appropriate storage and handling of fertilizer products as well as their physical and chemical properties. Doing so will contribute to reducing the effect of physical attributes of fertilizer on product quality.
xvi
1
IntroductionWith the exception of Cape Verde and, to a lesser degree, Senegal, the agricultural sector has a dominant position in the national economies of the Economic Community of West African States (ECOWAS) member countries.1 Agriculture accounts for 25 to 65 percent of the gross domestic product (GDP) and employs an average of 40 to 77 percent of the active population, making it the main source of employment and revenue for the majority of the population. Moreover, agriculture generates up to 66 percent of export revenues in many countries and its growth stimulates demand from other economic sectors.
A performance assessment carried out by the Regional Strategic Analysis and Knowledge Support System (ReSAKSS) in 2009 shows that in West Africa, more than half of a 1 percent reduction in poverty at national and rural levels can be attributed to growth in the agricultural sector. Consequently, the agricultural sector is the cornerstone of any food security and poverty reduction strategy in the region, particularly for the rural population. This sector is unfortunately characterized by low productivity on the majority of farms, especially for food crops. This low productivity level stems largely from the fact that soil nutrients that are absorbed by crops are not sufficiently replaced by external sources, leading to an impoverishment of soils that are already naturally poor.2
Indeed, fertilizer consumption, estimated to be about 1.5 million metric tons (mt) per year at the regional level, is low and variable from one country to the other. Fertilizer is primarily used on cash crops with an organized subsector. Its supply is dominated by imports, either of raw materials that often are fertilizers themselves, which are blended locally to produce NPK blend fertilizers, or of finished compound granulated fertilizer products. With an average of less than 8-9 kilograms (kg) of nutrients used annually per hectare (ha) of arable land, fertilizer consumption in West Africa is among the lowest in the world.
The Food and Agriculture Organization (FAO) of the United Nations 3 estimates that the average fertilizer application rate should increase from the current 8-9 kg/ha/year to 23 kg/ha/year by 2015 to meet the objective of 6 percent annual growth in agricultural production that was set by the Comprehensive Africa Agriculture Development Programme (CAADP), a framework the New
1 Agriculture accounts for 12 percent of Cape Verde’s GDP and less than 18 percent of Senegal’s compared with at least 65 percent and 51 percent for their tertiary sectors, respectively.2 These soils have often developed from heavily leached, old rocks. Their carrying capacity tends to be very low, either because of low water availability or low nutrient availability (Roy, A.H., and J.H. Allgood. 1999. “IFDC’s Experience in Development Programmes in Developing Economies with Special Reference to Africa,” FSSA Journal).3 FAO. 2004. “Fertilizer Development in Support of the Comprehensive Africa Agriculture Development Programme,” 23ème conférence régionale, FAO.
2
Partnership for Africa’s Development (NEPAD) adopted in 2003. According to ReSAKSS4 and the International Food Policy Research Institute (IFPRI),5 even with an annual growth rate of 6 percent, most West African countries will not achieve the first Millennium Development Goal (MDG) of halving poverty and hunger by 2015; an increase in the consumption of fertilizers to 23 kg/ha/year by 2015 will be insufficient as well. Recognizing that the use of fertilizers is vital to achieve the African Green Revolution, particularly in view of the rapid population growth and rate of urbanization as well as the declining soil fertility, Member States of the African Union pledged, at the Africa Fertilizer Summit held in June 2006, “…to increase the level of fertilizer use from the current annual average of 8 kilograms of nutrients per hectare to at least 50 kilograms per hectare by 2015.”
In 2006, prior to the Africa Fertilizer Summit and in collaboration with the West Africa Economic and Monetary Union (UEMOA), ECOWAS adopted a fertilizer strategy6 with the general objective of promoting their increased and efficient use with a view to sustainably improving agricultural productivity. This regional strategy hinges on four pillars or specific objectives: 1. Improve the physical environment for the optimal use of fertilizers.2. Improve the institutional, regulatory and business environment of the
regional fertilizer market.3. Stimulate effective demand.4. Stimulate supply.
Through the second specific objective, which is to improve the regulatory, institutional and business environment of the regional market of fertilizers, ECOWAS is focusing on creating favorable conditions for the development of the fertilizer sector. Indeed, West African national fertilizer markets are underdeveloped and too narrow to generate a sufficient dynamism and competitiveness. The extension of national markets to the ECOWAS region through the harmonization of national regulatory frameworks is likely to further stimulate private investment in this sector. The effective implementation of a regional framework that harmonizes national regulatory frameworks governing the production and trade of fertilizers and instituting and organizing quality control will protect farmers and render fertilizer trade more attractive to private investment by expanding national markets beyond national borders and by stimulating fair competition with quality products.
The liberalization of the importation and distribution of fertilizers in several West African countries without appropriate control led to the emergence of 4 Johnson, M., et al. 2008. “Regional Strategic Alternatives for Agriculture-Led Growth and Poverty Reduction in West Africa,” ReSAKSS Working Paper No. 22.5 IFPRI. 2009. ECOWAP/CAADP Implementation: Agricultural Growth and Poverty Reduction Performance and Outlook Synthesis of National Agricultural Investment Programs.6 ECOWAS. 2006. Stratégie Régionale de Promotion des Engrais en Afrique de l’Ouest.
3
quality problems in products traded in the region. These problems could impede efforts to boost agricultural productivity and to restore or maintain soil fertility. There are very few systematic studies on the quality of fertilizers marketed in West Africa. The most recent,7 which dates back to 1995 and was conducted by IFDC, showed that although in general the physical attributes of marketed fertilizers were acceptable, 43 percent of products were nutrient deficient and 58 percent were deficient in weight. However, the study found no evidence of the common forms of adulteration.8 There are several cases that confirm that these problems persist9 in markets and, consequently, a considerable quantity of fertilizers traded in West Africa is of poor quality. These quality problems will increase if the market should continue growing without effective control; significant environmental hazards may also occur. In addition, only quality products can enable farmers to maximize the returns from their investments and encourage them to continue using fertilizers.
The urgency of adopting a regional legal framework is therefore a priority for ECOWAS and UEMOA in the context of the implementation of the regional fertilizer strategy adopted in 2006. To support the development of this framework and to serve as a basis for assessing the impact of the regional regulatory framework following its adoption and implementation, ECOWAS and UEMOA initiated in 2010 an assessment of the quality of fertilizer traded in West Africa as well as factors that influence the quality of fertilizers in the region through the Marketing Inputs Regionally (MIR) Plus project.10
7 Cinty Visker, David Rutland and Kossi Dahoui. 1995. “The Quality of Fertilizer in West Africa (1995),” IFDC Miscellaneous Fertilizer Studies No. 13.8 These forms are to: (a) change the appearance of the product; (b) add “miracle” substances; and (c) sell an outright fake product. These problems are typically found at the retail distribution level. The 1995 study was conducted only at port and wholesaler levels.9 In Nigeria, for example, Zimbabwean farmers in Kwara State purchased considerable quantities of compound NPK fertilizers (12-12-11, 20-10-10 and 15-15-15) in 2006. Laboratory analysis results from Zimbabwe and South Africa showed that these fertilizers instead contained 11.7-1.4-5.8, 16.2-1.3-3.8 and 15.5-1.38-7.2, respectively.10 The MIR Plus project is a joint ECOWAS-UEMOA project implemented by IFDC with the overall objective of facilitating the development of a regional agro-input market in West Africa in support of the implementation of their regional agricultural policies.

5
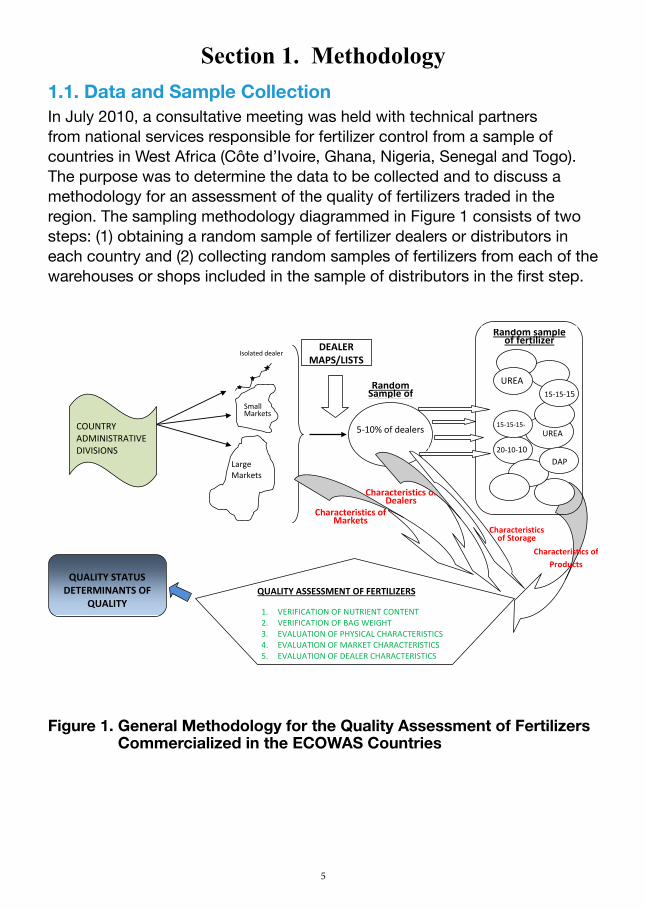
Section 1. Methodology1.1. Data and Sample Collection In July 2010, a consultative meeting was held with technical partners from national services responsible for fertilizer control from a sample of countries in West Africa (Côte d’Ivoire, Ghana, Nigeria, Senegal and Togo). The purpose was to determine the data to be collected and to discuss a methodology for an assessment of the quality of fertilizers traded in the region. The sampling methodology diagrammed in Figure 1 consists of two steps: (1) obtaining a random sample of fertilizer dealers or distributors in each country and (2) collecting random samples of fertilizers from each of the warehouses or shops included in the sample of distributors in the first step.
5-10% of dealers
Characteristics of Products
20-10-10
UREA
15-15-15-
1515 UREA
15-15-15
DAP
Random sample of fertilizer
products DEALER MAPS/LISTS
Isolated dealer
alerDealers
Large Markets
COUNTRY ADMINISTRATIVE DIVISIONS
QUALITY ASSESSMENT OF FERTILIZERS
1. VERIFICATION OF NUTRIENT CONTENT 2. VERIFICATION OF BAG WEIGHT 3. EVALUATION OF PHYSICAL CHARACTERISTICS 4. EVALUATION OF MARKET CHARACTERISTICS 5. EVALUATION OF DEALER CHARACTERISTICS
Characteristics of Dealers
Random Sample of
dealers
Characteristics of Markets
QUALITY STATUS DETERMINANTS OF
QUALITY
Characteristics of Storage
Small Markets
Figure 1. General Methodology for the Quality Assessment of Fertilizers Commercialized in the ECOWAS Countries
6
1.1.1. Sampling of Fertilizer Dealers Information about the location and characteristics of the fertilizer markets was collected for the different administrative divisions in each country. After identification and characterization of the markets, an inventory of dealers inside each market was conducted. The purpose of the dealer inventory was to identify and delimit the population of dealers to sample. The dealer population was defined using maps11 (Ghana and Nigeria) that geo-reference the location of each dealer within the different markets, or with lists of dealers that were available at the ministry of agriculture (Côte d’Ivoire, Senegal and Togo). In each country, a sample of dealers was obtained by randomly selecting 5-10 percent of the dealers from the maps or the lists. Special care was taken to make sure that the sample followed the same geographical distribution patterns as the population of fertilizer dealers. Classification of dealers by market size was done ex post facto during data analysis.
1.1.2. Random Sampling of Fertilizers and Collection of Data When the study teams visited the dealers that were part of the sample, they recorded the characteristics of markets and dealers in a pretested main questionnaire (Table A.1 in Appendix A). Inside the dealer’s warehouse or shop, the field personnel sampled every type of fertilizer found following specific procedures for sampling, collecting, inspecting and labeling every fertilizer sample. Characteristics of the fertilizer sampled were recorded in the main questionnaire (Table A.1) and in the questionnaire for physical attributes (Table A.2 in Appendix A). Together with the fertilizer sample collection at each dealer or distribution point that was selected in the first step of the methodology, the inspectors recorded the following information in Table A.1 and Table A.2:• Characteristics of the market (country, state or region, town, type of
market, concentration of dealers, periodicity of the market).• Identification and characteristics of the dealer (fertilizer owner or
attendant, knowledge about fertilizers, training in fertilizer, possession of license, type of customer, business status and size).
• Characteristics of storage (approximate dimensions, ventilation, temperature, product handling equipment, use of pallets, height of stacks, general housekeeping).
11 Maps were developed by the Alliance for a Green Revolution in Africa (AGRA)-funded agro-dealer development projects implemented by IFDC.
7
• Characteristics of fertilizer products (type, category of supplier, quantity in hands, bag type, bag weight, evidence of quality problems).
• Qualitative assessment of physical attributes (segregation, estimated amount of filler and impurities, granule integrity [fines and dust], caking, moisture content).
In each of the distribution points visited, fertilizer products were sampled, labeled and packed using the sampling protocol described in Appendix A. Samples from a country or group of countries were taken to a central location where they were reduced to about 100 grams (g) each using a riffle (Figure A.4) for chemical analysis of nutrient content.
1.2. Chemical and Physical Analyses of Fertilizer Samples 1.2.1. Selection of the Laboratory Laboratories with experience in the analysis of soil, plant, water and fertilizer operating in the region were considered to analyze the fertilizer samples. Based on information available at IFDC and past experiences, two of these laboratories stood out: the SGS Environmental Laboratory of Tema in Ghana and the Ghana Atomic Energy Commission (GAEC) laboratories in Accra. Project technical personnel visited the two laboratories and agreed on the following process to select one of them to perform the analysis.1. Assessment of the laboratory’s familiarity with and/or agreement on
the procedures: Each of the laboratories was given a copy of the draft analysis manual ECOWAS was developing for Member States to assess if they were comfortable with the procedures described in the manual for analyzing the samples. The procedures are based on the methods of the Association of Official Analytical Chemists (AOAC) and are similar to those used in the laboratory selected for reference analyses (i.e., IFDC laboratory in Alabama, USA).
2. Estimation of the time required to complete the analysis: To determine this, it was agreed that the laboratories should take into account that samples were to be analyzed in batches of 100-150 and an interim report submitted to project technical staff at the end of the analysis of each batch.
3. Estimation of the total cost of the analysis: The laboratories were asked to submit a cost proposal for analysis to project technical staff.
4. Testing phase: Before embarking on the analysis of the samples, the two laboratories were asked to analyze five samples that project technical staff provided to test their familiarity with the procedures. These test
8
samples include NPK products (obtained both through physical blends and compound granulation) from the study’s collection. They were also given five fertilizer materials of known nutrient content from the Magruder Fertilizer Check Sample Program.
After undergoing the aforementioned process, the SGS Environmental Laboratory at Tema, Ghana, was selected to analyze the samples. Samples from the Magruder Fertilizer Check Sample Program were used as standards by this laboratory for validation-calibration of their methodologies.
1.2.2. Chemical Analysis of Fertilizers Given the limited resources available for this assessment, the priority in the chemical analysis of the fertilizer samples focused on determination of their primary plant nutrient content: total nitrogen (N), available phosphorus (P2O5) and soluble potassium (K2O). However, a few samples were considered for determination of secondary nutrients: calcium (Ca), magnesium (Mg) and sulfur (S). The nutrient content of these samples was determined using analytical methods that are summarized in Appendix B.
1.2.3. Physical Analysis of Fertilizers In each country, prior to the field work, the project technical staff trained members of the sampling teams on the qualitative evaluation of the fertilizer physical attributes described below. The training consisted of explaining the concepts associated with each physical attribute and how to use the qualitative scale for each. The qualitative scales and the format to record fertilizer attributes are presented in Table A.2.
1.2.3.1. Segregation Segregation is the physical separation of granules from the different components of bulk blends due to their granule size differences. Uneven distribution of the blend components can occur due to shaking during transportation and handling in warehouses and shops. Segregation is the result of small granules moving downward between spaces left by larger granules. The larger the granule size differences, the larger the segregation could be. The qualitative evaluation of the fertilizer samples was conducted using a scale with the categories: none, low, medium and high.
9
1.2.3.2. Granule Integrity Granule integrity refers to the capability of the fertilizer granules to remain whole, resisting fracture or abrasion. Poor granule integrity may indicate manufacturing deficiencies, excessive handling or product aging. The lack of granule integrity is estimated through quantification of fines (particles smaller than the original granule size) and dustiness.
Fines are defined as the portion of the sample that visually appears to have particles smaller in size than the bulk of the sample. The determination for fines was made by observing the samples and assigning to the sample a category from the scale as: none, low, medium or high.
Dustiness is defined as the level of visible dust as the sample is being poured into a resealable plastic bag; the quantity of dust can be estimated by the amount of dust deposited at the bottom of the plastic bag after shaking. Dustiness was qualitatively rated: none, low, medium or high.
1.2.3.3. Moisture Content The moisture content was qualitatively assessed by observation, feeling and examination of the fluidity of the fertilizer sample. NPK fertilizers tend to become darker than their original color when they have absorbed moisture from the environment. Medium to high humidity of a fertilizer can be felt when touched. Similarly, fertilizer granules with medium to high humidity do not flow freely; they can get clogged in the sample probe. To preserve the original moisture content, each sample was packed in two plastic bags with perfect sealing. Moisture content was qualitatively rated as adequate, medium or high.
1.2.3.4. Caking Caking occurs when the individual granules of the product fuse to form larger aggregates. In extreme cases of caking, entire bags become one solid body. Caking usually takes place when the fertilizer product comes in contact with water or when it is stored at high relative humidity. Another factor contributing to caking is the pressure exerted by stacked bags. Caking was qualitatively assessed through observation and by feeling the fertilizer bags and rated as none, low, medium or high.
1.2.3.5. Impurities and Fillers Impurities are foreign substances that become mixed with the fertilizer during deficient manufacturing procedures or as a result of management
10
practices that compromise quality. When products are spread on the ground (a practice among small retailers to dry, break conglomerates and make blends), they may be contaminated with soil, plant materials or other materials. The difference between fillers and impurities should not be confused. Fillers are materials added to fertilizers to help in the uniform distribution of nutrients within a given volume of the fertilizer product. Impurities are foreign substances that are mixed with the fertilizer during deficient manufacturing procedures or as a result of management practices that compromise quality. Fillers are present in relatively large quantities and tend to be uniformly distributed in the entire volume of fertilizer. Impurities are present in small quantities and their distribution is not uniform.
Large amounts of fillers in blended NPK products may be a sign of product adulteration. Usually the compound granulated NPK products and crystalline products such as urea, ammonium sulfate and potassium chloride (KCl) do not have fillers; the presence of fillers in bags of these products may be evidence of adulteration. The presence of fillers or impurities was recorded as “yes” or no in the questionnaires.
1.3. Data Analysis and Interpretation For the fertilizer products with at least 23 samples, statistical methods were applied on data about nutrient content, bag weight, physical attributes and characteristics of markets, dealers and storage conditions to determine the quality of the different fertilizer products and to associate fertilizer quality with market and dealer characteristics. Then, the quality problems were interpreted as a result of manufacture deficiency, mismanagement, adulteration or a combination of these three categories. The complete statistical methodology was applied separately to each of the five countries and to all countries combined.
1.3.1. Nutrient Content ComplianceFor a single nutrient fertilizer, the tolerance limits (TL)12 ECOWAS adopted require compliance to the individual nutrient content criterion (Appendix C). For NPK fertilizers, compliance with both the individual nutrient content and with the content of all nutrients combined is required. A fertilizer is deemed “nutrient deficient” if the content of at least one of the individual nutrients is below the individual nutrient content TL and if the total deviation in nutrient content (hereafter referred to as total deviation) for all nutrients combined is below TL. The total deviation for all nutrients combined is calculated from the addition of deviations for nutrients with content lower than the label specification; compensation from nutrients with content higher than specified 12 The term “tolerance limits” means allowances for variations inherent in the collection, preparation and analysis of a fertilizer sample. It does not include an allowance for manufacturing variation.
11
to balance deficiency of another nutrient is not allowed. For example, in a 15:15:15 sample that showed total N, P2O5 and K2O contents to be 15, 13.8 and 14, respectively, only deviations in nutrient content associated with the P2O5, and K2O are added to calculate the total deviation for all nutrients combined. In this example, the total deviation for all nutrients combined is -2.2.
The guarantee13 for phosphate is measured in terms of available phosphate, which is phosphate soluble in water, plus phosphate soluble in neutral ammonium citrate; the guarantee for nitrogen is in terms of total nitrogen; and the guarantee for potassium is in terms of soluble potash.
The assessment of nutrient compliance is commonly made through the count of cases not meeting standards set in the regulations. This approach has limitations for expression of quality in probabilistic statements and for evaluations of hypotheses that involve different sets of fertilizer samples. Alternatively, for continuous variables such as individual nutrient content, total nutrient content, deviations from total nutrient content of the fertilizers or the weight of the fertilizer bags, the empirical cumulative frequency distribution function (ECFDF) is used to develop probabilistic statements about nutrient content compliance or for the fertilizers to be out of compliance. The ECFDF allows to observe and infer about the behavior of the entire population of individual nutrient content (or deviation from total nutrient content) values and to develop probability statements of nutrient content out of compliance with respect to specific tolerance limits or intervals of tolerance limits. On the ECFDF, by using values lower than the tolerance limit, different degrees of severity of out-of-compliance content and their probabilities can be estimated. The ECFDF is also a valuable tool to compare the behavior of complete populations, such as when countries or types of manufacturers are compared with respect to nutrient content compliance of specific fertilizer products. Probability values are directly obtained from the graphical representation of the ECFDF.
The ECFDF is depicted by a continuous ascending line in a coordinated system in which the nutrient contents resulting from chemical analysis or the weight differences are in the abscissa and the cumulative frequencies of occurrence (%) are in the ordinate. The dotted lines on the ECFDF indicate the percentage of samples associated with the values for total nitrogen, available P2O5 or soluble K2O content or bag weight that are below the TL.
13 A guarantee for a nutrient is the percentage of that plant nutrient claimed on the label.
12
The probability values are directly obtained transforming the percentage frequency into probability values between 0 and 1.
The diagnostic about the nutrient content compliance of fertilizers commercialized in the ECOWAS sub-region was made using the regulation adopted by ECOWAS and the tolerance limits specified in Appendix C. The out-of-nutrient content compliance is expressed in probability statements following this procedure:A. Determination of probability for “out of compliance of individual
nutrient contents”: pN, pP, or pK are obtained from the ECFDF developed for individual nutrients contained in each fertilizer. ECFDFs were built using the appropriate tolerance limits depending on whether the fertilizer contains a single nutrient or multiple nutrients. Values from the ECFDF are expressed in probability using the expression:
P(Individual Nutrient Content ≤ x) = p Where x= Nutrient Content in Label – TL – 0.1. A nutrient content is out of compliance when it has a deficit of at least TL + 0.1. p is a probability with values in the range 0 to 1.Example: The probabilistic statement for a 15:15:15 out of compliance for total nitrogen content is P(Total Nitrogen ≤ 13.8)=p
B. Calculation of the probability that “at least one of the nutrients is out of compliance”: p(N+P+K) is done by adding the individual nutrient content probabilities obtained in the first step. This probability for an NPK fertilizer is the sum of the probabilities for nitrogen out of compliance (pN) plus the probability for phosphorus out of compliance (pP) plus the probability of potassium out of compliance (pK). p(N+P+K) = pN + pP + pK. When the addition of the probability for out of compliance from individual nutrients is higher than one, a probability equal to one is adopted as the probability of at least one of the nutrients out of compliance.
C. Calculation of the probability for “out of compliance of deviations from total nutrient content”: pDTNC was obtained from the ECFDFs for deviations from total nutrient content. Using the following expression:
P(DTNC ≤ - 2.6)=pWhere DTNC is the deviation from total nutrient content and 2.6 is the TL for total nutrient content compliance with value of 2.5 plus 0.1. The 0.1 is added because for the DTNC to be out of compliance it has to be lower than the TL.
D. Calculation of the probability for “overall out-of-nutrient content compliance”: pooc for a fertilizer is obtained as the product of the probability for out of compliance of at least one of the nutrients times the
13
probability for out of compliance of deviations from total nutrient content: p(N+P+K) *pDTNC.
E. Calculation of probability of segregation: pSEG (Table 1) for blended fertilizers was obtained from the ECFDF’s for the deviations from the total grade in the blended fertilizers, using the expression P(-2.5 ≤ DTG ≤ 2.5)=p where DTG is departure from total grade and 2.5 is the tolerance limit for total nutrient content. Total grade (TG) is the addition of the individual grades of the NPK components. For example, the TG of a 15:15:15 is 45.
1.3.2. Bag Weight Verification Prior to sampling fertilizer products, a random sample of fertilizer bags was selected, and individual bags were weighed for the verification of the weight declared on the fertilizer label in each fertilizer shop or warehouse included in the dealer’s random sample. The departure from weight on the label was recorded in the survey questionnaire (Table A.1), and the data were used for development of the ECFDF per country. The ECFDF graphs have the departure from the weight on the label (DWL) in the abscissa and the cumulative frequency (%) in the ordinate. The probability statements for DWL were made using the following general expression:
P(DWL ≤ 1.0) = pThe tolerance limit suggested by ECOWAS for weight departure from the label specified net weight is 1 percent of the bag weight. For 50-kg bags, the tolerance is 0.5 kg. Since the bag weights reported in the questionnaires are integers with no decimals, 1.0 kg was adopted as the weight at which a fertilizer bag starts to be out of weight compliance.
1.3.3. Evaluation of Fertilizer Physical Attributes Given the discrete nature of the fertilizer physical attribute variables, the probabilistic statements associated with the different categories of the physical attributes were obtained from the empirical frequency distribution function (EFDF), which is represented by a bar graph with the physical attributes categories in the abscissa and the frequencies (%) in the ordinate. In this case, the probability statements have the following form:
P(Physical Attributes = c) = p Where c is the category of the physical attributes and p is the probability value obtained directly from the frequency associated with a category in the EFDF figure.
14
Segregation of the bulk blend fertilizers was estimated qualitatively through observation by inspectors of the samples collected and through the use of the total grade concept for blended fertilizers. The probability of segregation was calculated in the manner described in Section 1.3.1).
1.3.4. Factors Influencing Fertilizer Quality Factors considered in this analysis are characteristics of fertilizer markets, characteristics of fertilizer distributors, characteristics of storage conditions and characteristics of fertilizer products. These characteristics are listed in the questionnaire presented in Table A.1 (Appendix A) that inspectors used to record the data and information needed.
From the evaluation of nutrient content compliance, a categorical variable named “Quality” with two categories (“Bad”14 or “Good”) was developed. When a fertilizer presented nutrient content deviation below the tolerance limit, the “Quality” variable took the category value “Bad”, otherwise it took the category value “Good”.
Two-way contingency tables of each of the characteristic’s variables listed in the questionnaire (Table A.1) against the “Quality” variable developed (“Bad” or “Good”) were constructed to identify possible relationships. A Chi-square test was then applied to test the hypothesis of independence between the “Quality” variable and each of the variables defining the aforementioned characteristics. The significant results from Chi-square, identified by probabilities equal to or lower than 0.1, indicate a possible relationship between characteristics of markets, dealers, storage and products with the nutrient content of the fertilizers. Only products with a large number of samples and enough variability between the categories of the characteristics tested for association were included in this analysis. Fertilizers in which the nutrient content compliance is dominantly “Bad” or dominantly “Good” do not allow to test the association hypotheses between nutrient content quality and factors such as characteristics of markets, dealers and products.
14 In this study, a fertilizer is classified as Bad due to no nutrient content compliance. This does not mean that the product is bad in itself; it is a good product with different nutrient content, which is why the regulation requires that such fertilizer be relabeled.
15
Section 2. Results and Discussion
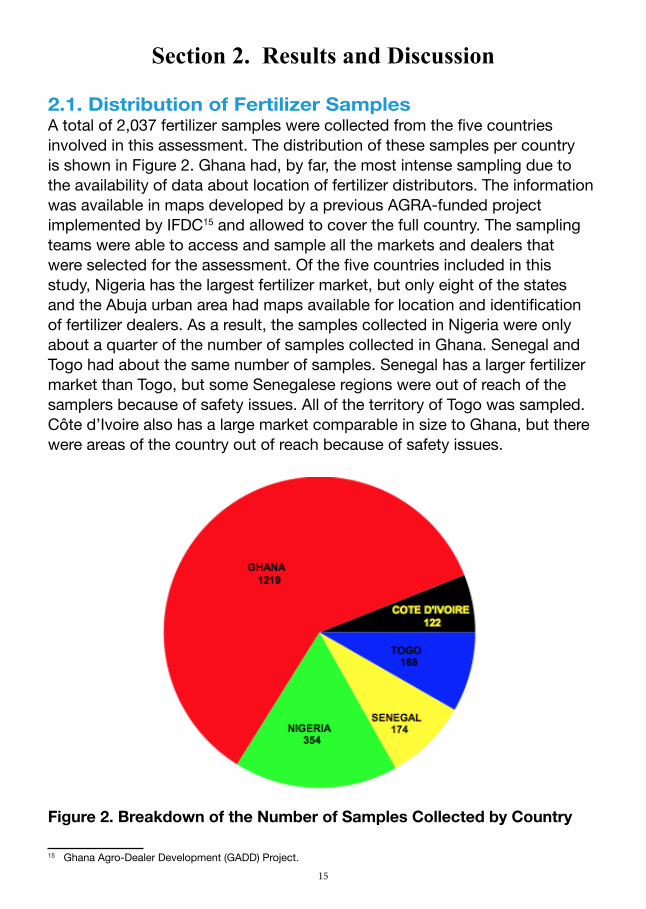
2.1. Distribution of Fertilizer Samples A total of 2,037 fertilizer samples were collected from the five countries involved in this assessment. The distribution of these samples per country is shown in Figure 2. Ghana had, by far, the most intense sampling due to the availability of data about location of fertilizer distributors. The information was available in maps developed by a previous AGRA-funded project implemented by IFDC15 and allowed to cover the full country. The sampling teams were able to access and sample all the markets and dealers that were selected for the assessment. Of the five countries included in this study, Nigeria has the largest fertilizer market, but only eight of the states and the Abuja urban area had maps available for location and identification of fertilizer dealers. As a result, the samples collected in Nigeria were only about a quarter of the number of samples collected in Ghana. Senegal and Togo had about the same number of samples. Senegal has a larger fertilizer market than Togo, but some Senegalese regions were out of reach of the samplers because of safety issues. All of the territory of Togo was sampled. Côte d’Ivoire also has a large market comparable in size to Ghana, but there were areas of the country out of reach because of safety issues.
Number of Fertilizer Samples per CountryTotal number of samples = 2028
GHANA 1219
COTE D'IVOIRE 122
TOGO 168
SENEGAL 174NIGERIA
354
Figure 2. Breakdown of the Number of Samples Collected by Country
15 Ghana Agro-Dealer Development (GADD) Project.
16
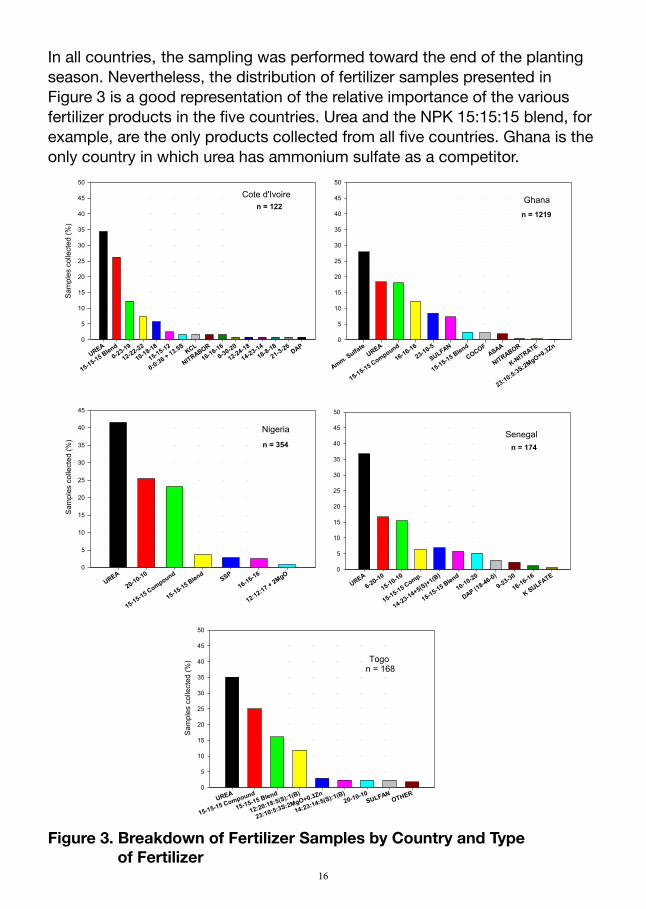
In all countries, the sampling was performed toward the end of the planting season. Nevertheless, the distribution of fertilizer samples presented in Figure 3 is a good representation of the relative importance of the various fertilizer products in the five countries. Urea and the NPK 15:15:15 blend, for example, are the only products collected from all five countries. Ghana is the only country in which urea has ammonium sulfate as a competitor.
Figure 3. Breakdown of Fertilizer Samples by Country and Type of Fertilizer
Cote d'Ivoire
UREA
15-15-15 Blend0-23-19
12-22-22
10-18-18
15-15-12
0:0:36 + 13.5SKCL
NITRABOR
16-16-160-30-20
12-24-18
14-23-1418-8-18
21-3-26DAP
Sam
ples
col
lect
ed (%
)
0
5
10
15
20
25
30
35
40
45
50
n = 122Ghana
Amm. SulfateUREA
15-15-15 Compound
16-16-1623-10-5
SULFAN
15-15-15 BlendCOCOF
ASAA
NITRABOR
K-NITRATE
23:10:5:3S:2MgO+0.3Zn0
5
10
15
20
25
30
35
40
45
50
n = 1219
Nigeria
UREA
20-10-10
15-15-15 Compound
15-15-15 BlendSSP
16-16-16
12:12:17 + 2MgO0
5
10
15
20
25
30
35
40
45
n = 354
Sam
ples
col
lect
ed (%
)
Togo n = 168
UREA
15-15-15 Compound
15-15-15 Blend
12:20:18:5(S):1(B)
23:10:5:3S:2MgO+0.3Zn
14:23:14:5(S):1(B)20-10-10
SULFANOTHER
0
5
10
15
20
25
30
35
40
45
50
Sam
ples
col
lect
ed (%
)
Senegal
UREA6-20-10
15-10-10
15-15-15 Comp.
14-23-14+5(S)+1(B)
15-15-15 Blend
10-10-20
DAP (18-46-0)
9-23-30
16-16-16
K SULFATE0
5
10
15
20
25
30
35
40
45
50
n = 174
17
The second most frequently found fertilizer after urea was the NPK 15:15:15 compound sampled in Ghana, Nigeria, Senegal and Togo. Another product with high occurrence frequency was NPK 16:16:16 (mainly in Ghana). Sulfan, Cocoa Feed and Asaase Wura are produced and distributed only for the Ghana market. A few samples of Sulfan were found in Togo.
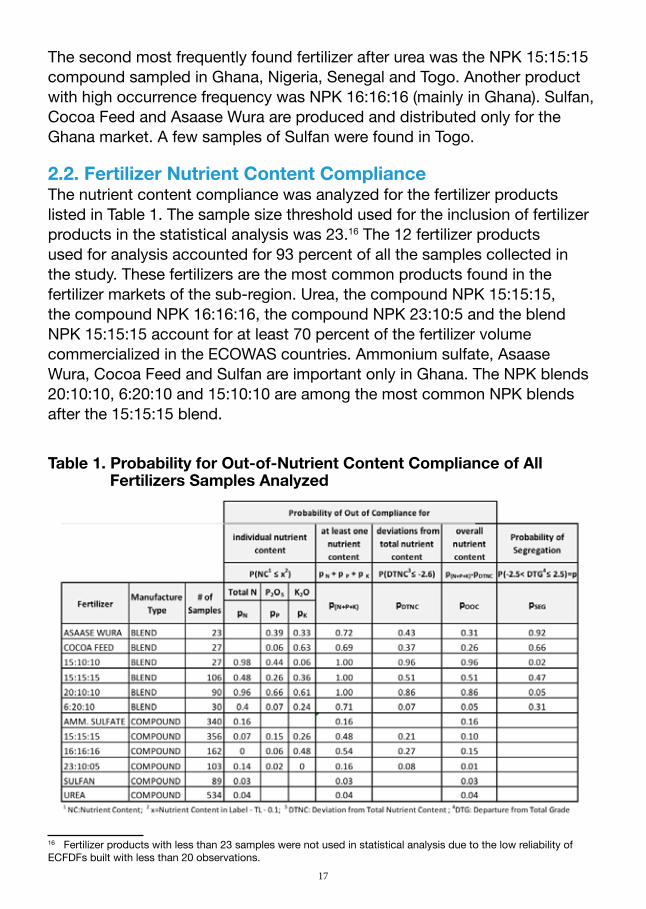
2.2. Fertilizer Nutrient Content Compliance The nutrient content compliance was analyzed for the fertilizer products listed in Table 1. The sample size threshold used for the inclusion of fertilizer products in the statistical analysis was 23.16 The 12 fertilizer products used for analysis accounted for 93 percent of all the samples collected in the study. These fertilizers are the most common products found in the fertilizer markets of the sub-region. Urea, the compound NPK 15:15:15, the compound NPK 16:16:16, the compound NPK 23:10:5 and the blend NPK 15:15:15 account for at least 70 percent of the fertilizer volume commercialized in the ECOWAS countries. Ammonium sulfate, Asaase Wura, Cocoa Feed and Sulfan are important only in Ghana. The NPK blends 20:10:10, 6:20:10 and 15:10:10 are among the most common NPK blends after the 15:15:15 blend.
Table 1. Probability for Out-of-Nutrient Content Compliance of All Fertilizers Samples Analyzed
16 Fertilizer products with less than 23 samples were not used in statistical analysis due to the low reliability of ECFDFs built with less than 20 observations.
18
2.2.1. NPK 15:15:15 Blend and CompoundThe overall out of compliance probability of 0.51 (Table 1 and Figure D.1) indicates that half of the 106 samples of the 15:15:15 blend were out of compliance both with respect to the individual nutrient content and with respect to the total nutrient content. The probability of 1.0 for at least one of the nutrients out of compliance in the 15:15:15 blend indicates that all the 106 samples from this fertilizer had nutrient deficiencies in at least one of the three nutrients. The 0.51 probability for the out of compliance with respect to deviations of the total nutrient content indicates that half of the 106 samples had total nutrient content shortages beyond the tolerance limit of -2.5 percent. The 0.47 probability of segregation (Table 1 and Figure E.1A) suggests that in 47 percent of the 106 samples collected from the 15:15:15 blend, the individual nutrient content deficiencies of this fertilizer can be attributed to segregation of the fertilizer components used in the bulk blend. This was mainly due to granule size differences between blend components. The most likely explanation for nutrient content shortages in the remaining 53 percent of the fertilizer samples is insufficient input of nutrients during the blending to produce the 15:15:15 grade.
The overall out of compliance for nutrient content of the compound 15:15:15 was 0.10 (Table 1) indicating that 10 percent of the samples collected from this product showed nutrient content deficiencies both in terms of individual nutrient content deficiencies and in terms of deviations from the total nutrient content. This result confirms the finding of a previous assessment carried out in 199517 indicating that 10 of the 29 samples of NPK compounds examined were deficient. The probability of at least one nutrient out of compliance for the compound 15:15:15 was 0.48, which means that 48 percent of the 356 samples of the fertilizers had nutrient deficiencies for at least one of the three nutrients. The probability for out of compliance with respect to deviations from the total nutrient content was 0.21, meaning that from the 356 samples, 21 percent of them had total nutrient content shortages beyond the ECOWAS tolerance limit of -2.5 percent. The 10 percent of overall nutrient deficiencies in this imported product can be explained by the combination of two factors. The first is the importation from countries known for relaxed manufacturing quality standards, such as some Asian and East European countries. The second factor is associated with intentional or unintentional nutrient dilutions that can occur along the distribution chain of the fertilizers. Some management practices like re- bagging, manual manipulation of fertilizer bags and storage under inappropriate
17 Cinty Visker, David Rutland and Kossi Dahoui. 1995. “The Quality of Fertilizer in West Africa (1995),” IFDC Miscellaneous Fertilizer Studies No. 13.
19
conditions can cause degradation of fertilizer physical attributes and have the potential of affecting nutrient content distribution in the fertilizer bags.
Figure D.1 compares the nutrient content compliance of the two types of manufacture in NPK 15:15:15, namely the blend identified by the interrupted line and the compound by the solid line. The compound granulated 15:15:15 is the most commonly found NPK fertilizer in West Africa. A total of 356 samples of this fertilizer were collected from Ghana, Nigeria, Senegal, and Togo. For the NPK 15:15:15 blend, 106 samples were collected from the five countries included in the study.
The vertical dotted line in Figure D.1 marks the nutrient content below the tolerance limits at which an individual nutrient is considered deficient (Figure D.1A to D.1C) or all nutrients combined (total grade) are considered deficient (Figure D.1D).18 The horizontal dotted lines indicate the frequency associated with deficient nutrient content for an individual nutrient or for the three nutrients combined. Frequencies of nutrient deficiencies are expressed as probabilities in Table 1.
Figure D.1A shows a large difference between the ECFDFs from the two types of products (blend and compound) especially for total nitrogen contents lower than 15 percent. The probability of nitrogen content out of compliance is 0.07 for the compound granulated product and 0.48 for the blend. In other words, the fertilizer analysis results indicate that there is a 7 percent chance that the nitrogen content of an NPK 15:15:15 compound product sold in West Africa will be out of compliance with ECOWAS tolerance limit and a 48 percent chance for this to occur for a blended product.
The ECFDFs for nutrient content compliance of P2O5 (Figure D.1B) and K2O (Figure D.1C) do not present large differences between the two types of product as they do for total nitrogen. Nevertheless, the blended product shows a higher percentage of samples out of compliance for these two nutrients. The probability of P2O5 out of compliance for the blended 15:15:15 is 0.26 and for the compound granulated 15:15:15 is 0.15 (Table 1). The probability of K2O out of compliance for the blended product is 0.36 while the same probability for the compound granulated is 0.26 (Table 1). The results therefore indicate that, by far, the more serious individual nutrient deficiency in the blended 15:15:15 is total nitrogen while the most serious nutrient deficiency in compound granulated 15:15:15 is K2O. Frequent total nitrogen 18 For complex fertilizers, the maximum tolerance limit in the ECOWAS regulation is 1.1 units for individual nutrients and 2.5 percent for all nutrients combined.
20
deficiencies in NPK blends may be explained by the use of prilled urea and its high chances of segregation from other fertilizer sources of P2O5 and K2O due to the smaller granule size of prilled urea. Frequent K2O deficiencies in compound NPKs may be explained by low water solubility of KCl, which creates problems when adding the K during the granulation process, especially when the K2O grade is higher than 10 percent.
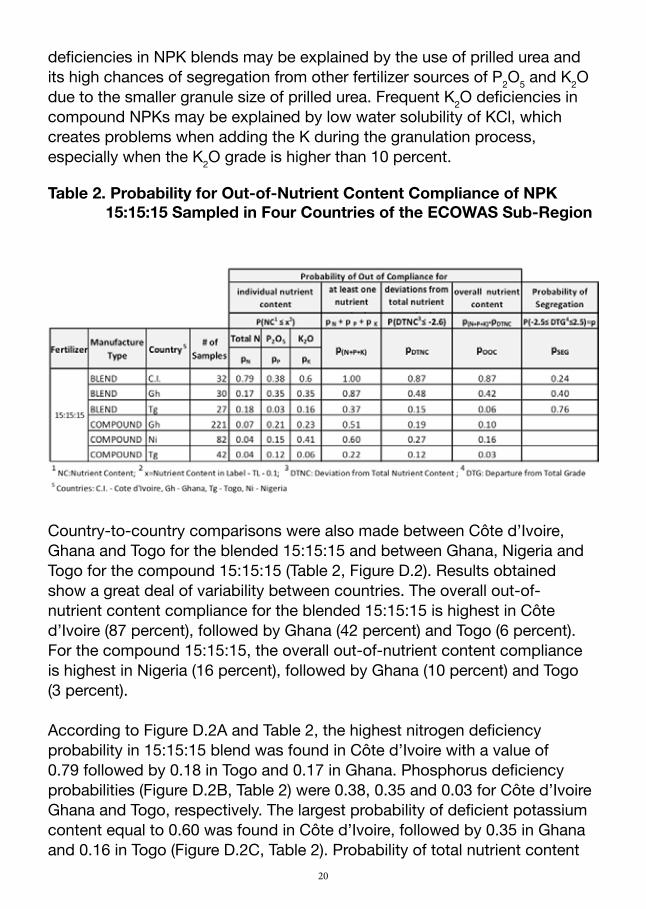
Table 2. Probability for Out-of-Nutrient Content Compliance of NPK 15:15:15 Sampled in Four Countries of the ECOWAS Sub-Region
Country-to-country comparisons were also made between Côte d’Ivoire, Ghana and Togo for the blended 15:15:15 and between Ghana, Nigeria and Togo for the compound 15:15:15 (Table 2, Figure D.2). Results obtained show a great deal of variability between countries. The overall out-of-nutrient content compliance for the blended 15:15:15 is highest in Côte d’Ivoire (87 percent), followed by Ghana (42 percent) and Togo (6 percent). For the compound 15:15:15, the overall out-of-nutrient content compliance is highest in Nigeria (16 percent), followed by Ghana (10 percent) and Togo (3 percent).
According to Figure D.2A and Table 2, the highest nitrogen deficiency probability in 15:15:15 blend was found in Côte d’Ivoire with a value of 0.79 followed by 0.18 in Togo and 0.17 in Ghana. Phosphorus deficiency probabilities (Figure D.2B, Table 2) were 0.38, 0.35 and 0.03 for Côte d’Ivoire Ghana and Togo, respectively. The largest probability of deficient potassium content equal to 0.60 was found in Côte d’Ivoire, followed by 0.35 in Ghana and 0.16 in Togo (Figure D.2C, Table 2). Probability of total nutrient content
21
deviations from the 2.5 percent tolerance limit (Figure D.2D, Table 2) are far higher in Côte d’Ivoire (0.87) than in Ghana (0.48) and Togo (0.16).
As indicated in Table 2, the nutrient contents out of compliance in Togo may be explained by segregation with 0.76 probability, while the nutrient contents out of compliance in Ghana and Côte d’Ivoire can be explained by segregation with probabilities of 0.40 and 0.24, respectively. The lower the probability associated with segregation assessment, the higher the chances of blending manufacture problems caused by factors such as using products of different particle size and/or inappropriate blending equipment or procedures. Low segregation probabilities mean that the deficient nutrient contents in the final product are mainly the result of using insufficient quantities of the fertilizer materials that contribute one or more nutrients. The 0.76 probability associated with segregation assessment in Togo suggests that 76 percent of the nutrient deficient cases of blended 15:15:15 can be avoided using fertilizers of uniform granule size for the manufacture of the blend and utilizing appropriate equipment and procedures to make the blends.
Comparisons of nutrient deficiencies per element of the compound NPK 15:15:15 across three countries are illustrated in graphs E to H of Figure D.2 and Table 2. In all countries, the probability of nitrogen deficiency (Figure D.2E, Table 2) was minimal and ranged from 0.04 in Nigeria and Togo to 0.07 in Ghana. Probabilities of phosphorus deficiencies (Figure D.2F, Table 2) were higher – 0.12, 0.15 and 0.21 for Togo, Nigeria and Ghana, respectively. Potassium deficiency probabilities (Figure D.2G, Table 2) presented the highest variability between countries. Togo had the lowest with 0.06, followed by Ghana with 0.23 and Nigeria with 0.41. Finding an explanation for the differences of nutrient deficiency probabilities between countries and for the high probability of out-of-nutrient content compliance P2O5 and K2O contents is not easy. The dominant factor in the variability between countries may be the different importation sources used by the countries, followed by the complexity of the distribution chain in the different countries. A more complex distribution chain can be associated with greater chances of compound products experiencing nutrient content dilutions either accidentally or deliberately.
From the country comparisons, Togo might be expected to have low variability in the importation sources and a relative simple distribution chain due to the government control of importation and distribution. Fewer importation sources and a simple distribution chain with no intermediaries may explain the low percentage of samples out of nutrient compliance in
22
Togo. The high percentages of samples out of K2O content compliance in Nigeria and Ghana may be partially explained by the technical difficulties of incorporating KCl to the fertilizer during the granulation process due to low water solubility of KCl.
2.2.2. NPK 16:16:16 CompoundThe overall out-of-nutrient content compliance of 16:16:16 was 0.15 (Table 1). About half of the 162 samples of this product presented K2O contents lower than the ECOWAS tolerance; K2O deficiencies occurred with 0.48 probability. The high probability for potassium content out of compliance in this compound granulated product is consistent with the difficulties of adding the KCl to the fertilizer granules during granulation of products with high K2O grade. As discussed earlier regarding compound 15:15:15, the problem of nutrient deficiencies can also be explained by some West Africa imports from countries that are known for their relaxed standards in fertilizer manufacture.
The compound 16:16:16 had the second largest number of samples after the compound 15:15:15 (Table 1). Of the 162 samples collected from this product, 151 were obtained in Ghana. There was no nitrogen deficiency in this fertilizer (Figure D.3A, Table 1); the probability of phosphorus deficiency was only 0.06 (Figure D.3B, Table 1).
2.2.3. NPK 20:10:10 BlendThe overall out-of-nutrient content compliance for this fertilizer had a probability of 0.86 (Table 1). This indicates that 86 percent of the 90 samples failed to meet the quality requirements for individual nutrient content and for total nutrient content. The probability of at least one of the individual nutrients being out of compliance was 1.0, meaning that all of the 90 samples had nutrient deficiencies in at least one of the three nutrients (Figure D.4). Since the probability of segregation was only 0.05 (Figure E.1B, Table 1), the most logical explanation of the nutrient deficiencies is the insufficient quantities of the NPK sources used for the bulk blending. From the 90 samples of blended 20:10:10 collected, 87 were from Nigeria and three from Togo.
2.2.4. NPK 6:20:10 BlendNutrient content compliance of blended 6:20:10 is shown in Figure D.5 and Table 1. All 30 samples were collected from Senegal. The probability for the overall out-of-nutrient content compliance for this fertilizer was 0.12. The high probability of at least one nutrient out of compliance of 0.71 is mainly due to the high probability values of total N and K2O deficiencies, which occurred with 0.4 and 0.24 probabilities, respectively. The 0.31 segregation
23
probability (Figure E.1C, Table 1) indicates that about one-third of the 30 samples collected had nutrient deficiencies due to segregation of the components of the blend. This was because of large granule-size differences in the input fertilizer products used for the bulk blend.
2.2.5. NPK 15:10:10 BlendAll 27 samples from this fertilizer were from Senegal. The probability of overall nutrient content out of compliance is 0.96 (Figure D.6, Table 1). The probability for deficiency of nitrogen content is 0.98, while the probabilities for phosphorus and potassium deficiencies were 0.44 and 0.06, respectively. The 0.02 probability for segregation (Figure E.1D, Table 1) indicates that the poor nutrient contents of the NPK 15:10:10 blends could not be attributed to segregation but to other blending manufacture problems not related to lack of granule-size uniformity of the blended components. An insufficient amount of the fertilizers that contribute nutrients to produce the expected fertilizer grade is the most likely explanation for the high probability of overall out-of-nutrient content compliance.
2.2.6. Asaase Wura Blend (0:22:18+9CaO+7S+5MgO)The overall out-of-nutrient content compliance of the fertilizer was 0.31 (Table 1), which resulted from a probability of 0.72 for at least one of the fertilizer nutrients being out of compliance and 0.43 probability of out of compliance with respect to the total nutrient content (Figure D.7C). The 0.92 probability of segregation (Figure E.1E) is strong evidence that lack of compliance with respect to individual nutrient content is mainly associated with segregation of the constituents of the blend. The segregation probability is about two times the probability of out of compliance for deviations from total nutrient content because the segregation probability is obtained from the portions of the frequency distribution that are both below -2.5 percent and above 2.5 percent. Nevertheless, the probability associated with lack of compliance of total nutrient content includes only the fraction of the distribution frequency below the tolerance limit.
The individual nutrient deficiency probabilities are 0.39 for phosphorus content (Figure D.7A) and 0.33 for potassium content (Figure D.7B). In contrast with other NPK blends that show serious quality problems in terms of nutrient content, Asaase Wura presents evidences that nutrient deficiencies are not due to insufficient input of the nutrient sources but to separation of the blend components. Important improvements in nutrient content compliance can be achieved by the manufacturer through the use of blend components with similar granule size.
24
2.2.7. Cocoa Feed Blend (0:30:20)The overall nutrient compliance probability for this product is 0.26 (Table 1), which comes from 0.69 probability of at least one of the individual nutrients being out of compliance and 0.37 probability for out of compliance with respect to the total nutrient content compliance. The segregation probability is 0.66 (Figure E.1F, Table 1) suggesting that nutrient deficiencies in two-thirds of the 27 samples may be attributed to segregation of the blend components. The 0.63 probability of potassium deficiencies (Figure D.8B) indicates that this nutrient has been affected by the segregation to a larger extent than phosphorus, which has an out-of-nutrient content compliance probability of only 0.06 (Figure D.8A). There is a high chance that small KCl granules move downward through larger granules of the P2O5 source as the fertilizer bags are manipulated during transportation, storage and sales. Studies to evaluate effect of particle size differences in the segregation of bulk-blended fertilizers would be beneficial.
2.2.8. Urea (46:0:0)The quality of the 534 samples of urea collected from all five countries was good in general; the probability for out of compliance of total nitrogen content was only 0.04 (Figure D.9A, Table 1). The ECOWAS tolerance limit for a single nutrient fertilizer like urea is 0.5 units; consequently, the total nitrogen content at which the out of compliance starts is 45.4 percent. According to Figure D.9B and Table 2 where total nitrogen content is compared across countries, this 4 percent nitrogen deficiency was entirely attributed to Ghana. The deficiency level in the remaining four countries was zero. All urea consumed in ECOWAS countries is produced in Nigeria or imported, and the results of the analyses carried out in this study suggest that both sources seem to have appropriate manufacturing procedures.
2.2.9. Ammonium Sulfate (21:0:0+24S)The 340 samples of ammonium sulfate are all from Ghana. Use of this fertilizer in the Ghana acidic soils is questionable due to the soil acidification properties of this fertilizer. Only total nitrogen was analyzed in this product; the probability for out of compliance for total nitrogen content is 0.16 (Figure D.10, Table 1). Eighteen percent of the ammonium sulfate samples were found to have degrees of caking ranging from low to high (Figure 8D).
A possible explanation for low nitrogen content in 16 percent of the samples could be the sulfuric acid with metal impurities from the metal industry reused by fertilizer manufacturers. Cations present in the acid would displace ammonium ions in the ammonium sulfate manufacture.
25
2.2.10. Sulfan (24:0:0+6S)All 90 samples of Sulfan were found in Ghana and presented the probability of 0.03 for total nitrogen content out of compliance (Figure D.11A, Table 1) and 0.04 probability of sulfur content out of compliance (Figure D.11B, Table 1). It can be said that Sulfan is among the few products with good quality found in this study. One factor that could mitigate against the use of this product in the acidic soils of Ghana is the 12 percent nitrogen in ammonium form, which produces additional soil acidification during the nitrification process. 2.2.11. NPK 23:10:5 CompoundThe 103 samples of this product were all collected in Ghana. The overall out-of-nutrient content compliance was 0.01 (Table 1), which resulted from a 0.16 probability for out of compliance for at least one of the three nutrients and a 0.08 probability for out of compliance with respect to the total nutrient content (Figure D.12D). Nitrogen deficiencies were found with 0.14 probability (Figure D.12A), which can be considered high for an imported compound NPK. Explanation of the nitrogen deficiencies could be deficient manufacture in countries where quality standards are known to be relaxed or intentional or accidental dilution of the nutrient through the distribution chain in Ghana.
The difficulties of adding KCl to compound NPKs during the granulation process increase with the K2O grade of the fertilizer. The pattern of K2O content deficiency expressed in the probabilities 0, 0.26 and 0.48 associated for the compound NPKs 23:10:5, 15:15:15 and 16:16:16 (Table 1) may be interpreted as evidence of potassium deficiencies originated in the manufacture of these imported fertilizers.
2.2.12. Single Superphosphate (SSP)Ten samples of single superphosphate (SSP) were collected from several locations in Nigeria: Bauchi (2), Kaduna (4), Kwara (1) and Taraba (3). Chemical analysis of these samples found three of them with appropriate P2O5 contents (either not significantly lower than 16 percent or higher than 16 percent) and seven of the samples with no detectable amounts of P2O5. Chemical analysis initially done by the SGS laboratory was verified by the IFDC laboratory in Alabama, USA. X-ray mineralogical analysis was performed in four of the samples that showed no phosphorus content. The typical mineralogical spectrum obtained from the four samples is shown in Figure 4.
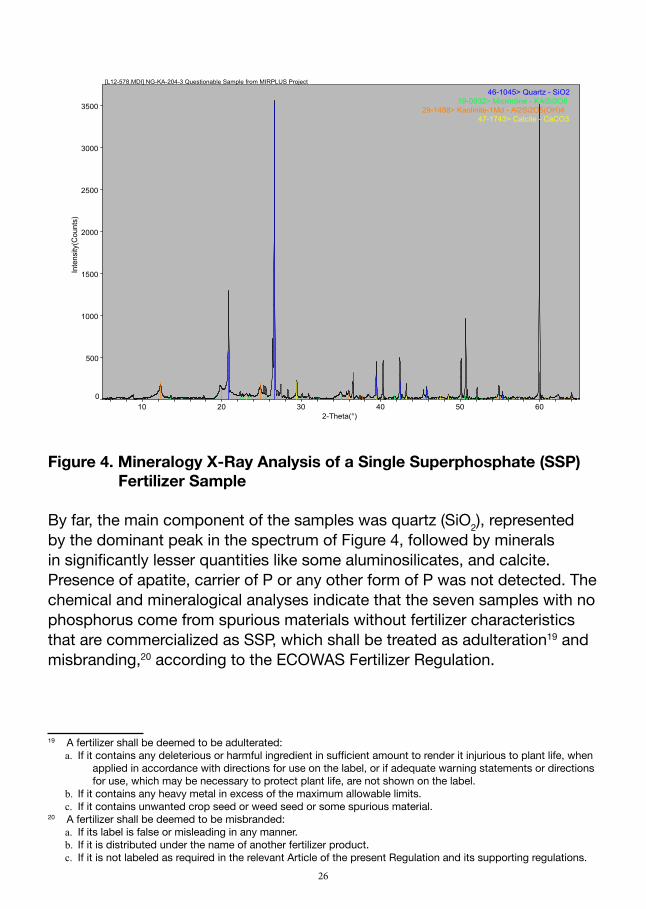
26
10 20 30 40 50 602-Theta(°)
0
500
1000
1500
2000
2500
3000
3500
Inte
nsity
(Cou
nts)
[L12-578.MDI] NG-KA-204-3 Questionable Sample from MIRPLUS Project
46-1045> Quartz - SiO219-0932> Microcline - KAlSi3O8
29-1488> Kaolinite-1Md - Al2Si2O5(OH)447-1743> Calcite - CaCO3
Figure 4. Mineralogy X-Ray Analysis of a Single Superphosphate (SSP) Fertilizer Sample
By far, the main component of the samples was quartz (SiO2), represented by the dominant peak in the spectrum of Figure 4, followed by minerals in significantly lesser quantities like some aluminosilicates, and calcite. Presence of apatite, carrier of P or any other form of P was not detected. The chemical and mineralogical analyses indicate that the seven samples with no phosphorus come from spurious materials without fertilizer characteristics that are commercialized as SSP, which shall be treated as adulteration19 and misbranding,20 according to the ECOWAS Fertilizer Regulation.
19 A fertilizer shall be deemed to be adulterated: a. If it contains any deleterious or harmful ingredient in sufficient amount to render it injurious to plant life, when
applied in accordance with directions for use on the label, or if adequate warning statements or directions for use, which may be necessary to protect plant life, are not shown on the label.
b. If it contains any heavy metal in excess of the maximum allowable limits. c. If it contains unwanted crop seed or weed seed or some spurious material.
20 A fertilizer shall be deemed to be misbranded: a. If its label is false or misleading in any manner.b. If it is distributed under the name of another fertilizer product.c. If it is not labeled as required in the relevant Article of the present Regulation and its supporting regulations.
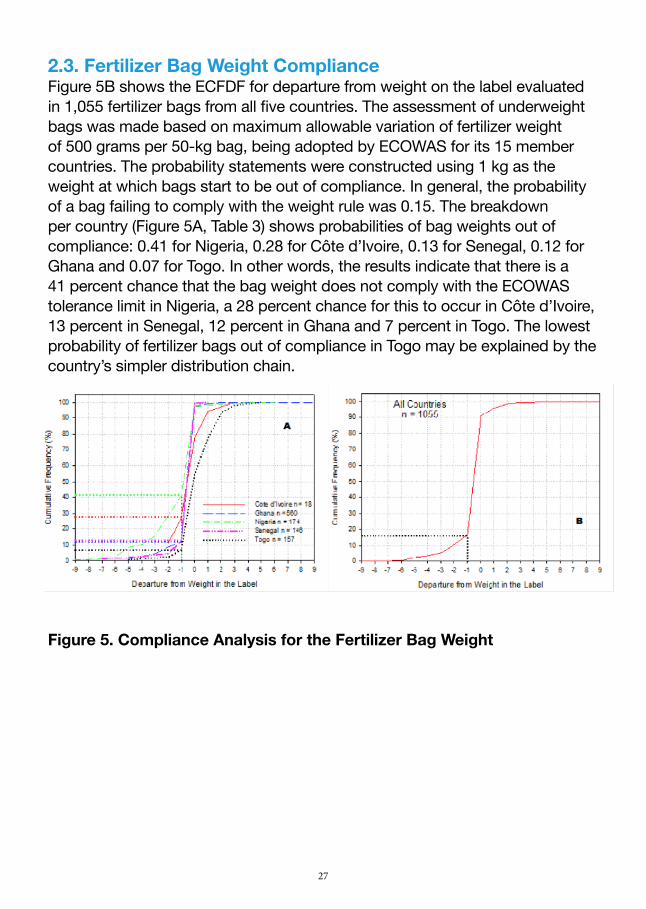
27
2.3. Fertilizer Bag Weight ComplianceFigure 5B shows the ECFDF for departure from weight on the label evaluated in 1,055 fertilizer bags from all five countries. The assessment of underweight bags was made based on maximum allowable variation of fertilizer weight of 500 grams per 50-kg bag, being adopted by ECOWAS for its 15 member countries. The probability statements were constructed using 1 kg as the weight at which bags start to be out of compliance. In general, the probability of a bag failing to comply with the weight rule was 0.15. The breakdown per country (Figure 5A, Table 3) shows probabilities of bag weights out of compliance: 0.41 for Nigeria, 0.28 for Côte d’Ivoire, 0.13 for Senegal, 0.12 for Ghana and 0.07 for Togo. In other words, the results indicate that there is a 41 percent chance that the bag weight does not comply with the ECOWAS tolerance limit in Nigeria, a 28 percent chance for this to occur in Côte d’Ivoire, 13 percent in Senegal, 12 percent in Ghana and 7 percent in Togo. The lowest probability of fertilizer bags out of compliance in Togo may be explained by the country’s simpler distribution chain.
Figure 5. Compliance Analysis for the Fertilizer Bag Weight
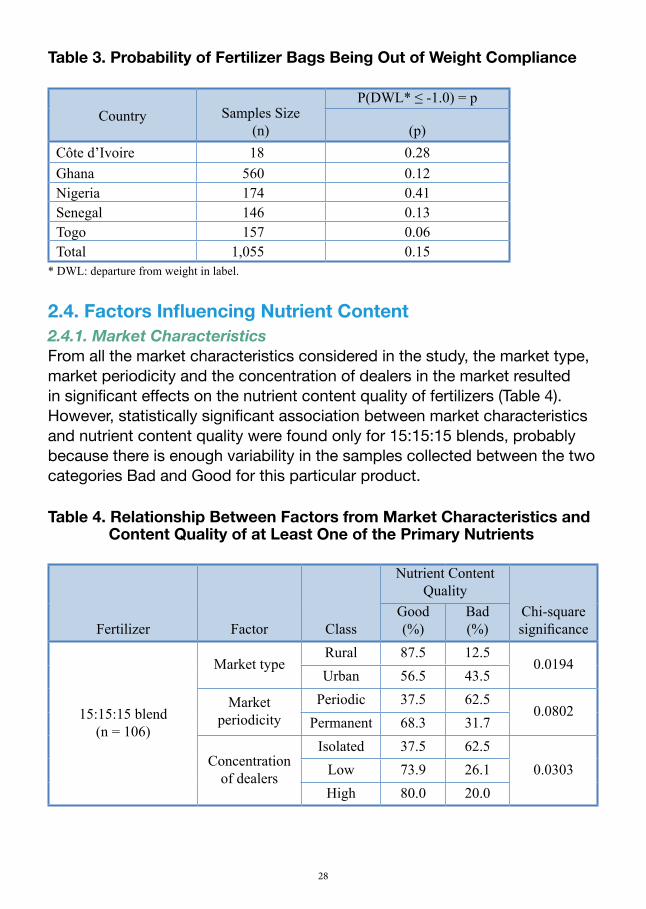
28
Table 3. Probability of Fertilizer Bags Being Out of Weight Compliance
Country Samples Size(n)
P(DWL* ≤ -1.0) = p
(p)Côte d’Ivoire 18 0.28Ghana 560 0.12Nigeria 174 0.41Senegal 146 0.13Togo 157 0.06Total 1,055 0.15
* DWL: departure from weight in label.
2.4. Factors Influencing Nutrient Content2.4.1. Market Characteristics From all the market characteristics considered in the study, the market type, market periodicity and the concentration of dealers in the market resulted in significant effects on the nutrient content quality of fertilizers (Table 4). However, statistically significant association between market characteristics and nutrient content quality were found only for 15:15:15 blends, probably because there is enough variability in the samples collected between the two categories Bad and Good for this particular product.
Table 4. Relationship Between Factors from Market Characteristics and Content Quality of at Least One of the Primary Nutrients
Fertilizer Factor Class
Nutrient Content Quality
Chi-square significance
Good (%)
Bad(%)
15:15:15 blend(n = 106)
Market typeRural 87.5 12.5
0.0194Urban 56.5 43.5
Market periodicity
Periodic 37.5 62.50.0802
Permanent 68.3 31.7
Concentration of dealers
Isolated 37.5 62.50.0303Low 73.9 26.1
High 80.0 20.0
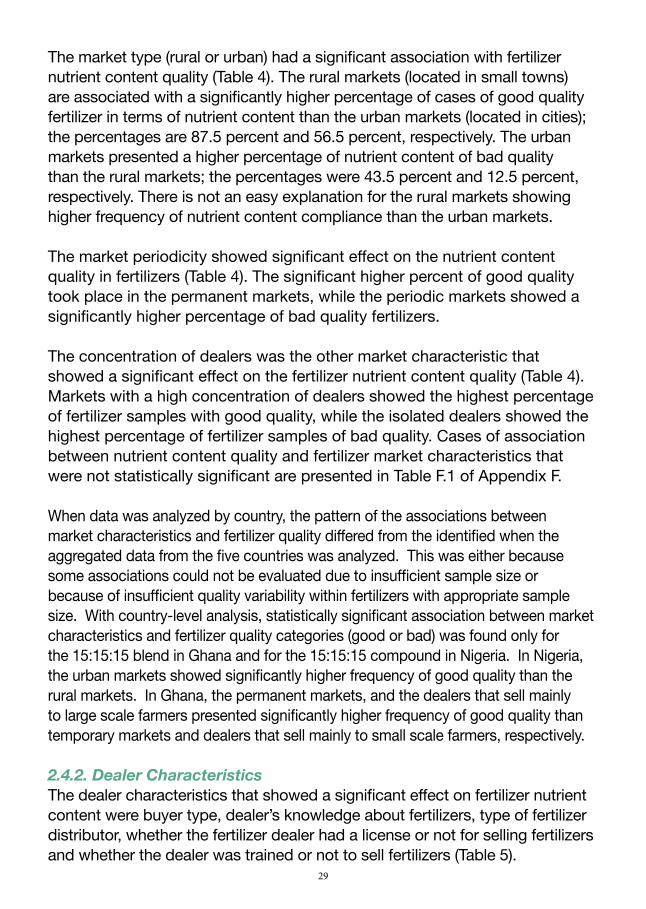
29
The market type (rural or urban) had a significant association with fertilizer nutrient content quality (Table 4). The rural markets (located in small towns) are associated with a significantly higher percentage of cases of good quality fertilizer in terms of nutrient content than the urban markets (located in cities); the percentages are 87.5 percent and 56.5 percent, respectively. The urban markets presented a higher percentage of nutrient content of bad quality than the rural markets; the percentages were 43.5 percent and 12.5 percent, respectively. There is not an easy explanation for the rural markets showing higher frequency of nutrient content compliance than the urban markets.
The market periodicity showed significant effect on the nutrient content quality in fertilizers (Table 4). The significant higher percent of good quality took place in the permanent markets, while the periodic markets showed a significantly higher percentage of bad quality fertilizers.
The concentration of dealers was the other market characteristic that showed a significant effect on the fertilizer nutrient content quality (Table 4). Markets with a high concentration of dealers showed the highest percentage of fertilizer samples with good quality, while the isolated dealers showed the highest percentage of fertilizer samples of bad quality. Cases of association between nutrient content quality and fertilizer market characteristics that were not statistically significant are presented in Table F.1 of Appendix F.
When data was analyzed by country, the pattern of the associations between market characteristics and fertilizer quality differed from the identified when the aggregated data from the five countries was analyzed. This was either because some associations could not be evaluated due to insufficient sample size or because of insufficient quality variability within fertilizers with appropriate sample size. With country-level analysis, statistically significant association between market characteristics and fertilizer quality categories (good or bad) was found only for the 15:15:15 blend in Ghana and for the 15:15:15 compound in Nigeria. In Nigeria, the urban markets showed significantly higher frequency of good quality than the rural markets. In Ghana, the permanent markets, and the dealers that sell mainly to large scale farmers presented significantly higher frequency of good quality than temporary markets and dealers that sell mainly to small scale farmers, respectively.
2.4.2. Dealer CharacteristicsThe dealer characteristics that showed a significant effect on fertilizer nutrient content were buyer type, dealer’s knowledge about fertilizers, type of fertilizer distributor, whether the fertilizer dealer had a license or not for selling fertilizers and whether the dealer was trained or not to sell fertilizers (Table 5).
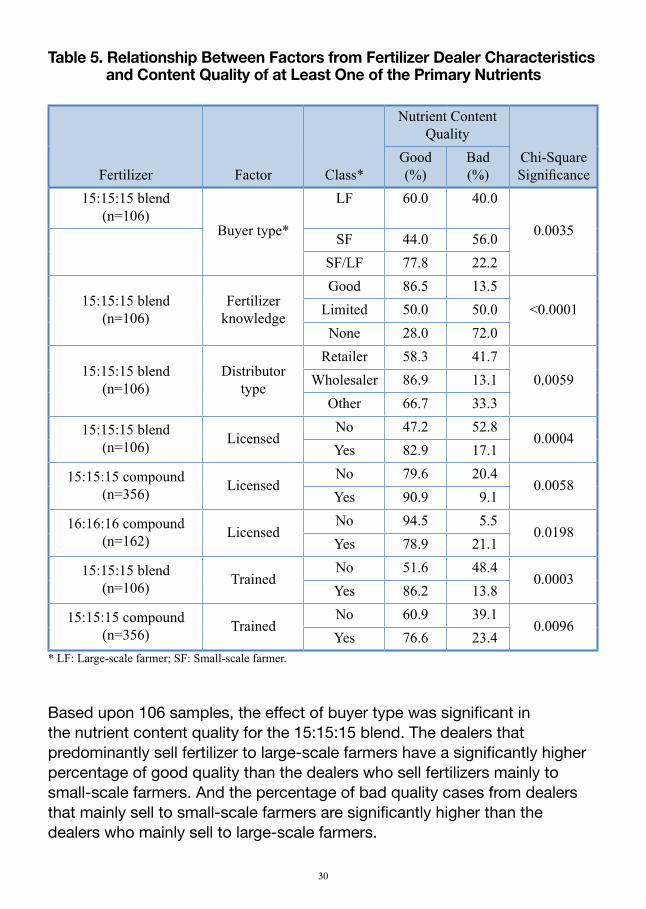
30
Table 5. Relationship Between Factors from Fertilizer Dealer Characteristics and Content Quality of at Least One of the Primary Nutrients
Fertilizer Factor Class*
Nutrient Content Quality
Chi-Square Significance
Good (%)
Bad(%)
15:15:15 blend(n=106)
Buyer type*
LF 60.0 40.0
0.0035SF 44.0 56.0SF/LF 77.8 22.2
15:15:15 blend(n=106)
Fertilizer knowledge
Good 86.5 13.5<0.0001Limited 50.0 50.0
None 28.0 72.0
15:15:15 blend(n=106)
Distributor type
Retailer 58.3 41.70.0059Wholesaler 86.9 13.1
Other 66.7 33.3
15:15:15 blend(n=106) Licensed
No 47.2 52.80.0004
Yes 82.9 17.1
15:15:15 compound(n=356) Licensed
No 79.6 20.40.0058
Yes 90.9 9.1
16:16:16 compound (n=162) Licensed
No 94.5 5.50.0198
Yes 78.9 21.1
15:15:15 blend(n=106) Trained
No 51.6 48.40.0003
Yes 86.2 13.8
15:15:15 compound(n=356) Trained
No 60.9 39.10.0096
Yes 76.6 23.4* LF: Large-scale farmer; SF: Small-scale farmer.
Based upon 106 samples, the effect of buyer type was significant in the nutrient content quality for the 15:15:15 blend. The dealers that predominantly sell fertilizer to large-scale farmers have a significantly higher percentage of good quality than the dealers who sell fertilizers mainly to small-scale farmers. And the percentage of bad quality cases from dealers that mainly sell to small-scale farmers are significantly higher than the dealers who mainly sell to large-scale farmers.
31
The effect of a dealer’s knowledge about fertilizers on nutrient content quality of 15:15:15 blend was also significant. There was a significant tendency of the category “good knowledge” with a high percentage of good quality, while there was a significant tendency of high percentages of bad quality associated with the fertilizer knowledge category “None.”
The effect of type of distributor was significant in the nutrient content quality of the 15:15:15 blend. The wholesalers had a significant tendency to have a higher percentage of good quality fertilizers than the retailers, and the retailers had a significant tendency to have a larger number of bad quality fertilizers than the wholesalers.
The effect of the dealer having a license for selling fertilizer became significant on the nutrient content quality of the 15:15:15 blend, 15:15:15 compound and 16:16:16 compound. For both 15:15:15 fertilizers, the dealers that responded “Yes” had a significant tendency to have higher percentages of good quality fertilizers, and the dealers that responded “No” had a significant tendency to have higher percentages of fertilizers of bad quality. For the 16:16:16 fertilizer, the association of high percentages of dealers that do not have a license with higher percentage of bad quality samples was significant.
The effect of training to sell fertilizers became significant in the nutrient content quality of the 15:15:15 blend and the 15:15:15 compound. With both fertilizers, the tendency of higher percentages of good quality products to be associated with the “Yes” answer and the tendency of higher percentages of bad quality products to be associated with the “No” answer were significant.
Cases of not significant association between fertilizer nutrient content quality and dealer characteristics are presented in Table F.1 of Appendix F.
2.4.3. Physical Attributes of FertilizersEstimates of segregation done through qualitative evaluation were highly inconsistent with the assessment of segregation with the total grade concept of blended fertilizers. Only the estimates of segregation done with the total grade concept, and the probabilities estimated from ECFDFs for the total grade deviation from the tolerance limits were used for discussion of nutrient content quality of the different fertilizers (Table 1, Table 2 and Appendix E). Presence of impurities and fillers was not statistically analyzed due to lack of variability in the data collected by the sampling teams.
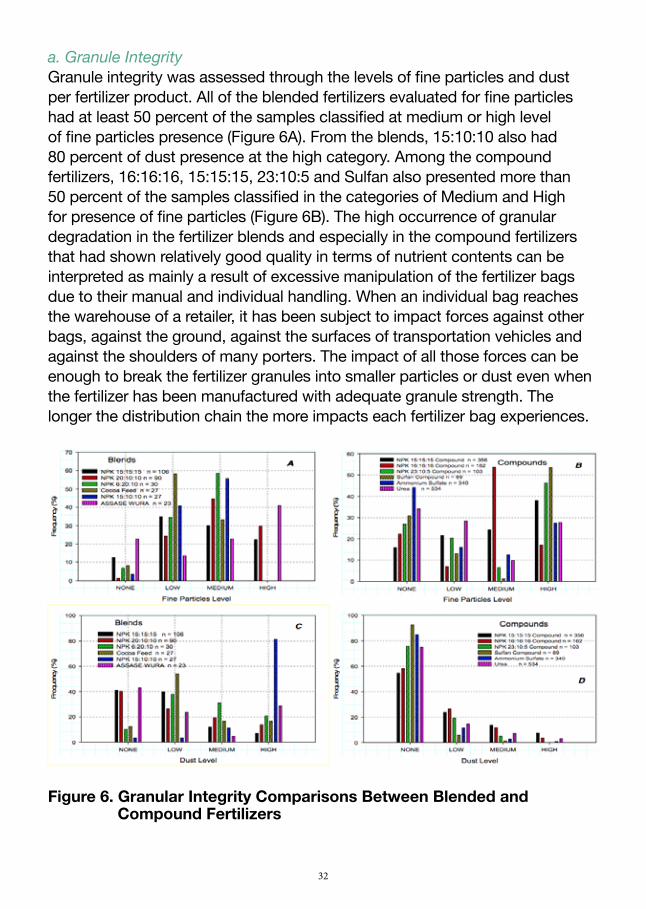
32
a. Granule IntegrityGranule integrity was assessed through the levels of fine particles and dust per fertilizer product. All of the blended fertilizers evaluated for fine particles had at least 50 percent of the samples classified at medium or high level of fine particles presence (Figure 6A). From the blends, 15:10:10 also had 80 percent of dust presence at the high category. Among the compound fertilizers, 16:16:16, 15:15:15, 23:10:5 and Sulfan also presented more than 50 percent of the samples classified in the categories of Medium and High for presence of fine particles (Figure 6B). The high occurrence of granular degradation in the fertilizer blends and especially in the compound fertilizers that had shown relatively good quality in terms of nutrient contents can be interpreted as mainly a result of excessive manipulation of the fertilizer bags due to their manual and individual handling. When an individual bag reaches the warehouse of a retailer, it has been subject to impact forces against other bags, against the ground, against the surfaces of transportation vehicles and against the shoulders of many porters. The impact of all those forces can be enough to break the fertilizer granules into smaller particles or dust even when the fertilizer has been manufactured with adequate granule strength. The longer the distribution chain the more impacts each fertilizer bag experiences.
Figure 6. Granular Integrity Comparisons Between Blended and Compound Fertilizers
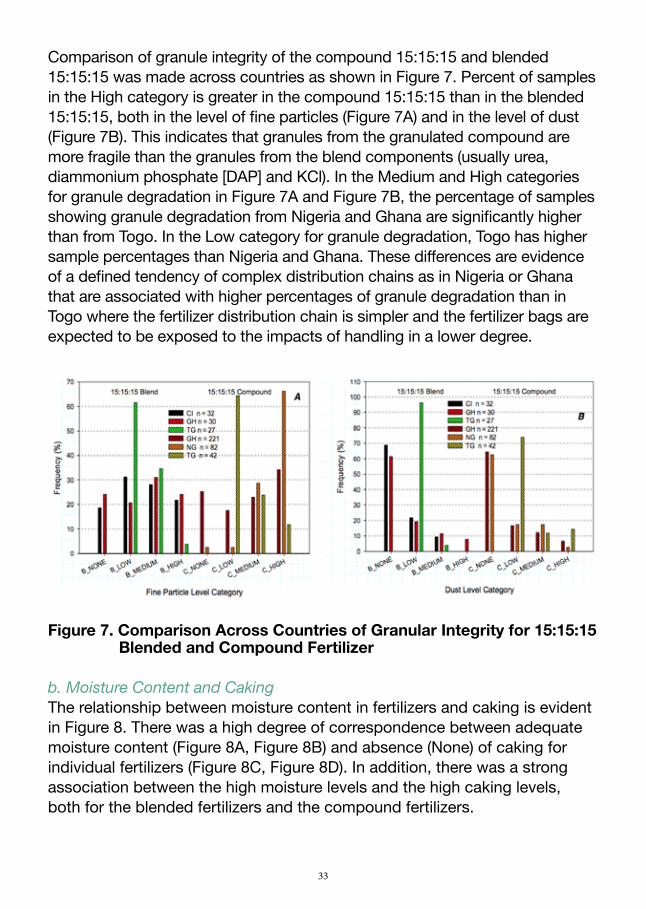
33
Comparison of granule integrity of the compound 15:15:15 and blended 15:15:15 was made across countries as shown in Figure 7. Percent of samples in the High category is greater in the compound 15:15:15 than in the blended 15:15:15, both in the level of fine particles (Figure 7A) and in the level of dust (Figure 7B). This indicates that granules from the granulated compound are more fragile than the granules from the blend components (usually urea, diammonium phosphate [DAP] and KCl). In the Medium and High categories for granule degradation in Figure 7A and Figure 7B, the percentage of samples showing granule degradation from Nigeria and Ghana are significantly higher than from Togo. In the Low category for granule degradation, Togo has higher sample percentages than Nigeria and Ghana. These differences are evidence of a defined tendency of complex distribution chains as in Nigeria or Ghana that are associated with higher percentages of granule degradation than in Togo where the fertilizer distribution chain is simpler and the fertilizer bags are expected to be exposed to the impacts of handling in a lower degree.
Figure 7. Comparison Across Countries of Granular Integrity for 15:15:15 Blended and Compound Fertilizer
b. Moisture Content and CakingThe relationship between moisture content in fertilizers and caking is evident in Figure 8. There was a high degree of correspondence between adequate moisture content (Figure 8A, Figure 8B) and absence (None) of caking for individual fertilizers (Figure 8C, Figure 8D). In addition, there was a strong association between the high moisture levels and the high caking levels, both for the blended fertilizers and the compound fertilizers.
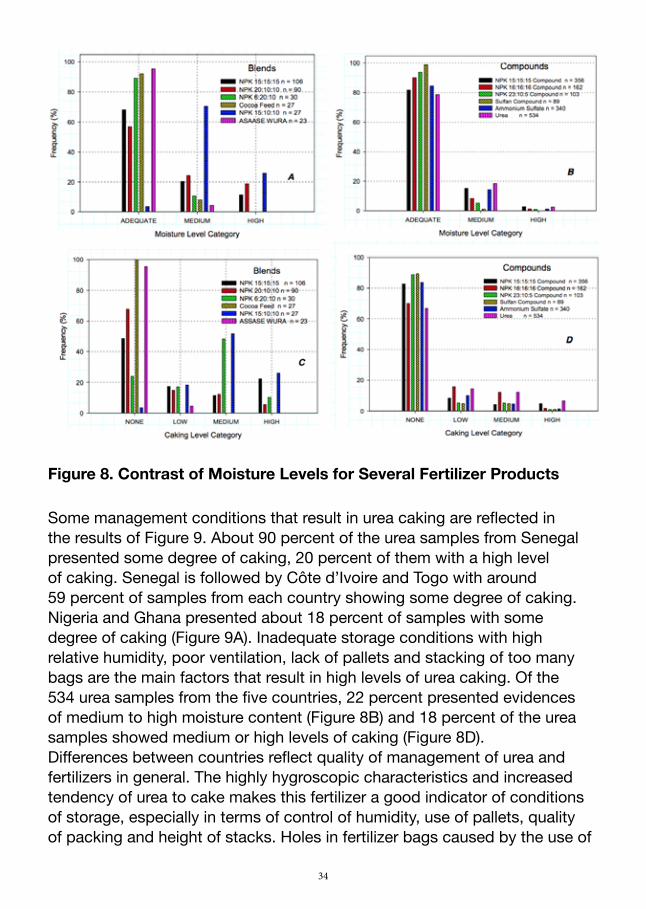
34
Figure 8. Contrast of Moisture Levels for Several Fertilizer Products
Some management conditions that result in urea caking are reflected in the results of Figure 9. About 90 percent of the urea samples from Senegal presented some degree of caking, 20 percent of them with a high level of caking. Senegal is followed by Côte d’Ivoire and Togo with around 59 percent of samples from each country showing some degree of caking. Nigeria and Ghana presented about 18 percent of samples with some degree of caking (Figure 9A). Inadequate storage conditions with high relative humidity, poor ventilation, lack of pallets and stacking of too many bags are the main factors that result in high levels of urea caking. Of the 534 urea samples from the five countries, 22 percent presented evidences of medium to high moisture content (Figure 8B) and 18 percent of the urea samples showed medium or high levels of caking (Figure 8D). Differences between countries reflect quality of management of urea and fertilizers in general. The highly hygroscopic characteristics and increased tendency of urea to cake makes this fertilizer a good indicator of conditions of storage, especially in terms of control of humidity, use of pallets, quality of packing and height of stacks. Holes in fertilizer bags caused by the use of
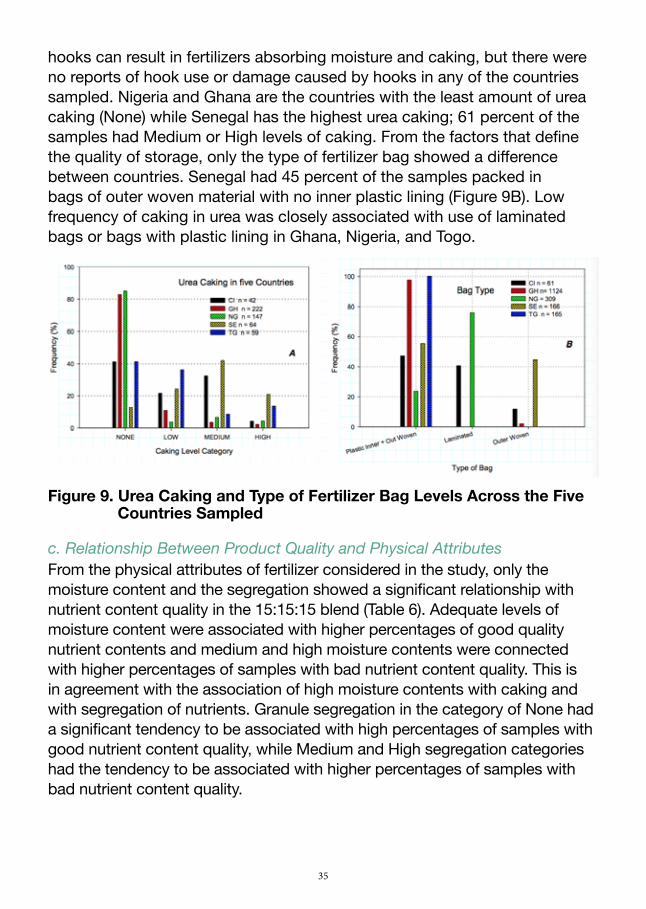
35
hooks can result in fertilizers absorbing moisture and caking, but there were no reports of hook use or damage caused by hooks in any of the countries sampled. Nigeria and Ghana are the countries with the least amount of urea caking (None) while Senegal has the highest urea caking; 61 percent of the samples had Medium or High levels of caking. From the factors that define the quality of storage, only the type of fertilizer bag showed a difference between countries. Senegal had 45 percent of the samples packed in bags of outer woven material with no inner plastic lining (Figure 9B). Low frequency of caking in urea was closely associated with use of laminated bags or bags with plastic lining in Ghana, Nigeria, and Togo.
Figure 9. Urea Caking and Type of Fertilizer Bag Levels Across the Five Countries Sampled
c. Relationship Between Product Quality and Physical AttributesFrom the physical attributes of fertilizer considered in the study, only the moisture content and the segregation showed a significant relationship with nutrient content quality in the 15:15:15 blend (Table 6). Adequate levels of moisture content were associated with higher percentages of good quality nutrient contents and medium and high moisture contents were connected with higher percentages of samples with bad nutrient content quality. This is in agreement with the association of high moisture contents with caking and with segregation of nutrients. Granule segregation in the category of None had a significant tendency to be associated with high percentages of samples with good nutrient content quality, while Medium and High segregation categories had the tendency to be associated with higher percentages of samples with bad nutrient content quality.
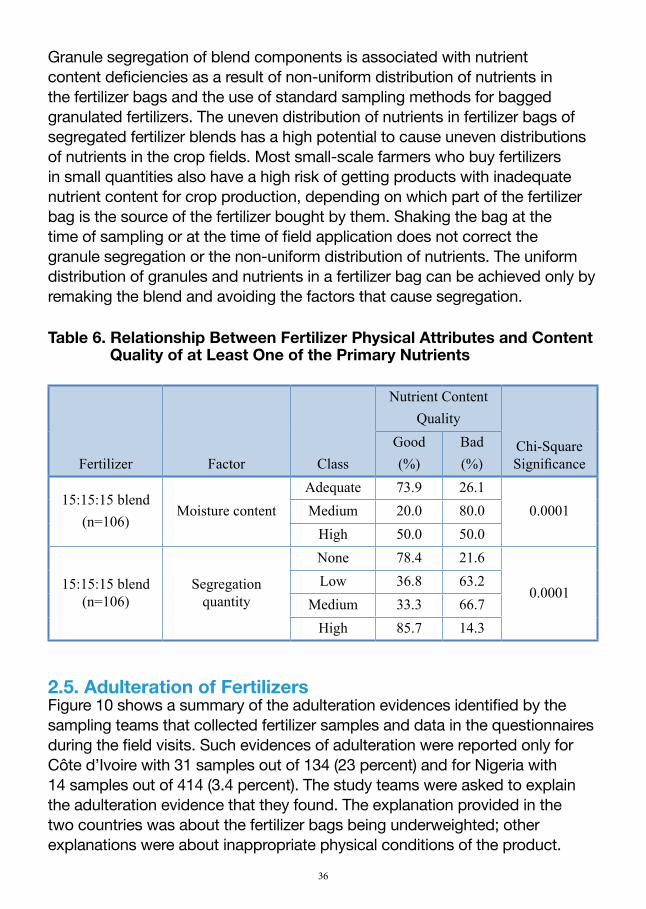
36
Granule segregation of blend components is associated with nutrient content deficiencies as a result of non-uniform distribution of nutrients in the fertilizer bags and the use of standard sampling methods for bagged granulated fertilizers. The uneven distribution of nutrients in fertilizer bags of segregated fertilizer blends has a high potential to cause uneven distributions of nutrients in the crop fields. Most small-scale farmers who buy fertilizers in small quantities also have a high risk of getting products with inadequate nutrient content for crop production, depending on which part of the fertilizer bag is the source of the fertilizer bought by them. Shaking the bag at the time of sampling or at the time of field application does not correct the granule segregation or the non-uniform distribution of nutrients. The uniform distribution of granules and nutrients in a fertilizer bag can be achieved only by remaking the blend and avoiding the factors that cause segregation.
Table 6. Relationship Between Fertilizer Physical Attributes and Content Quality of at Least One of the Primary Nutrients
Fertilizer Factor Class
Nutrient Content Quality
Chi-Square Significance
Good (%)
Bad (%)
15:15:15 blend(n=106)
Moisture contentAdequate 73.9 26.1
0.0001Medium 20.0 80.0High 50.0 50.0
15:15:15 blend(n=106)
Segregation quantity
None 78.4 21.6
0.0001Low 36.8 63.2
Medium 33.3 66.7High 85.7 14.3
2.5. Adulteration of FertilizersFigure 10 shows a summary of the adulteration evidences identified by the sampling teams that collected fertilizer samples and data in the questionnaires during the field visits. Such evidences of adulteration were reported only for Côte d’Ivoire with 31 samples out of 134 (23 percent) and for Nigeria with 14 samples out of 414 (3.4 percent). The study teams were asked to explain the adulteration evidence that they found. The explanation provided in the two countries was about the fertilizer bags being underweighted; other explanations were about inappropriate physical conditions of the product.
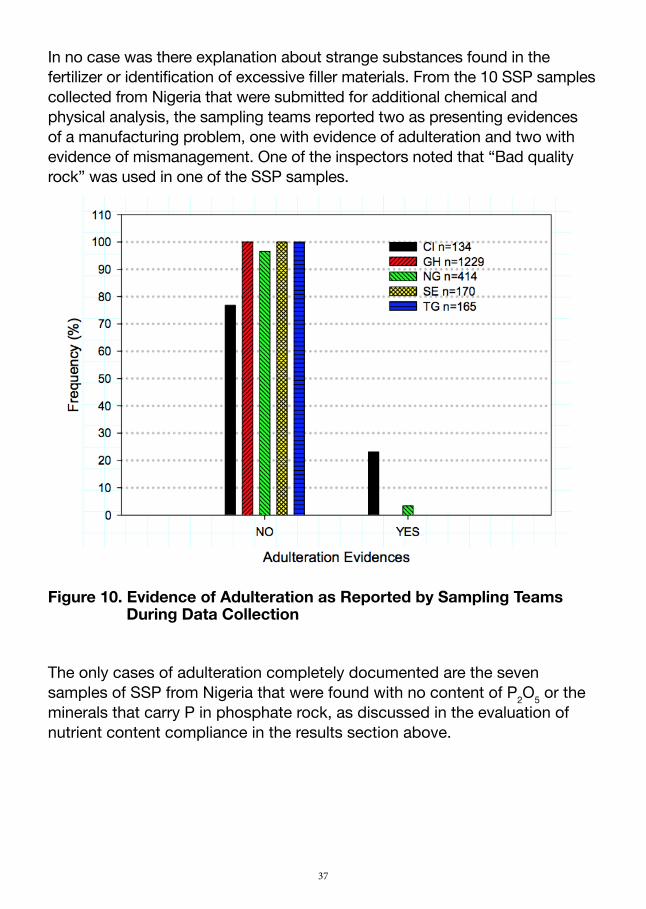
37
In no case was there explanation about strange substances found in the fertilizer or identification of excessive filler materials. From the 10 SSP samples collected from Nigeria that were submitted for additional chemical and physical analysis, the sampling teams reported two as presenting evidences of a manufacturing problem, one with evidence of adulteration and two with evidence of mismanagement. One of the inspectors noted that “Bad quality rock” was used in one of the SSP samples.
Figure 10. Evidence of Adulteration as Reported by Sampling Teams During Data Collection
The only cases of adulteration completely documented are the seven samples of SSP from Nigeria that were found with no content of P2O5 or the minerals that carry P in phosphate rock, as discussed in the evaluation of nutrient content compliance in the results section above.
38
Conclusions and RecommendationsA total of 2,037 fertilizer samples were collected from 827 distributors that included wholesalers, government depots and retailers of various sizes across all five countries involved in this assessment. The distribution of these fertilizer samples is a good representation of the relative importance of the different fertilizer products in the five countries. Urea and the NPK 15:15:15 blend are the only products common to the five countries.
The chemical analysis of the fertilizer samples focused on determination of their content of primary plant nutrients (total nitrogen, available phosphorus and soluble potassium). However, analysis of secondary nutrient content (calcium, magnesium and sulfur) was considered, but only the sulfur in the samples of Sulfan collected in Ghana was analyzed
Statistical analyses were applied to data on nutrient content, physical attributes of fertilizers, characteristics of markets and dealers and storage conditions to determine the quality of the various fertilizer products as well as to associate fertilizer quality with market and dealer characteristics. Then, the quality problems were interpreted as a result of manufacturing deficiency, mismanagement, adulteration or a combination of these three categories. To be meaningful, the nutrient content compliance was analyzed with inferential statistical methods only for the fertilizer products with at least 23 samples, and these accounted for 93 percent of all the samples collected in the study. Nutrient content compliance was assessed based on newly adopted ECOWAS standards.
The main findings of this assessment can be summarized as follows:1. The NPK fertilizers manufactured through blending present the most
frequent cases of poor quality compared with compound products. The study found, for example, that 51 percent of the 106 samples of the 15:15:15 blend were out of compliance, both with respect to the individual nutrient content and with respect to the total nutrient content, compared with only 10 percent of the 356 samples of the 15:15:15 compound product collected.
2. The main reason for nutrient deficiencies in some blends, such as Asaase Wura, Cocoa Feed and NPK 15:15:15, is the uneven distribution of nutrients in the fertilizer bags caused by granule segregation. When nutrients do not have uniform distribution in the volume of the fertilizer bag, the nutrient content of the entire bag may match the label
39
specification, but the non-uniform distribution of nutrients in the bags will result in uneven distribution of nutrients in the crop fields. Another consequence of non-uniform distribution of nutrients in fertilizer bags is that a high percentage of subsistence farmers will not receive products with the nutrient content required by their crops because they often purchase fertilizers in quantities lower than the 50-kg bag.
3. Nutrient deficiencies in compound NPKs may be explained by problems during product granulation and/or dilution (intentional or accidental) of nutrient content through the distribution chain.
4. With a probability of out of compliance of 0.04, the total N content compliance of urea was good. Yet, there is a perception that urea is being mixed with non-fertilizer materials in the region, which the study results did not confirm. A specific assessment is required to further verify this claim.
5. Sulfan, which is a relatively new product in the market and mainly distributed in Ghana, also was good quality, with a probability of out of compliance of 0.03 for total nitrogen and 0.04 for sulfur. However, given the small size of the sample of Sulfan analyzed in this study, this result does not necessarily mean that the likelihood for a farmer to buy Sulfan of poor quality in those countries is zero or extremely low. Analysis of a larger sample is likely to yield a better representation of the quality of Sulfan traded.
6. The perception that fake or adulterated fertilizers in West African markets is a dominant quality concern is not supported by the findings of this study. Only one case of a product containing materials with no fertilizer properties was found (SSP sold in Nigeria). However, the issue merits further investigation.
7. Underweight fertilizer bags are a serious problem, with probabilities of bag weights out of compliance of 41 percent in Nigeria, 28 percent in Côte d’Ivoire, 13 percent in Senegal, 12 percent in Ghana and 7 percent in Togo.
8. Characteristics of the market, such as concentration of dealers, periodicity of the markets and type of market, impact fertilizer quality. Isolated dealers, periodic markets and urban markets showed higher frequency of samples out-of-nutrient content compliance.
9. Characteristics of the fertilizer dealer, such as type of customers, knowledge and training about fertilizers, type of distributor and possession of license to sell fertilizers, impact quality. Unlicensed retail
40
dealers who sell mainly to small-scale farmers and have no knowledge or training about fertilizers presented a higher frequency of samples out-of-nutrient content compliance.
10. There was a clear pattern of association between the complexity of the distribution chain and fertilizer granule integrity. Large and complex distribution chains, like in Nigeria and Ghana, experience higher frequencies of granule degradation of compound NPK 15:15:15 than simpler distribution chains, like in Togo. Fertilizer bags are exposed to an accumulation of forces that cause fracture and abrasion of fertilizer granules along large distribution chains, especially when bags are handled manually and individually, like in West Africa.
11. The study found a strong association between high moisture levels and high caking levels for both the blended fertilizers and the compound fertilizers. In addition, the importance of appropriate bagging was underscored by findings in Senegal, where 41 percent of the bags were found to be outer woven without plastic inner lining, and 61 percent of the samples presented medium-to-high degrees of urea caking. Low frequency of caking in urea was closely associated with the use of laminated bags or bags with plastic lining in Ghana, Nigeria and Togo.
The results of this study indicate that the quality of fertilizers in West Africa can be enhanced through a series of actions:1. Effectively implementing the adopted ECOWAS fertilizer regulatory
system by the member countries to encourage participants across the value chain to address the quality issues, thereby ensuring that products supplied to the market meet high quality standards. The adopted ECOWAS fertilizer regulatory system calls for adequate inspection, sampling and analysis of fertilizers at importation points and along the distribution chain.
2. Conducting studies to identify the origin of the quality problems of bulk-blended fertilizers and proposing appropriate solutions.
3. Analyzing the economic impact of the high frequencies of poor quality fertilizer found in the target countries both at farmer and country levels.
4. Enhancing manufacturing knowledge and equipment for manufacturing blends, including:a. Sufficient use of NPK inputs for proper blend formulation.b. Maintenance of equipment/calibration.c. Implementation of technical knowledge and training.d. Use of high-quality and appropriately sized ingredients for blending to
41
reduce segregation.e. Standardization of blending plants as part of the implementation of a
regulatory system.5. Training of distributors on the following topics:
a. Appropriate handling of fertilizer products. Fines and dust in compound fertilizers can be reduced with less manual manipulation. Use of pallets and mechanical equipment for handling bags can reduce degradation.
b. Physical and chemical properties of fertilizers.c. Appropriate storage of fertilizer products.
6. Improving packaging with plastic lining to reduce caking and nutrient deficiency.

43
Appendices
Appendix A. Procedures for Data Collection and Fertilizer Sampling and Sample Reduction
1. Data CollectionThe procedure for data collection and sampling of fertilizers in each of the dealer’s shops visited is described step-by-step as follows:1. Self introduction of inspectors to the shop owner or keeper.2. Fill out the following sections of the Questionnaire (Table A.1): General
identification (Questionnaire #, Country, State), Characteristics of the Market, Identification and Characteristics of the Dealer and Characteristics of Storage. Take pictures of the storage area.
3. Find out which of the four fertilizer products selected for the state under consideration are sold in the shop.
4. Locate the fertilizers and the different lots of each fertilizer in the shop/warehouse. For this survey, the lot of a particular fertilizer product is defined as all product of that fertilizer that was ordered from a particular source at the same time and supplied to the agro-dealer on the same container or vehicle.
5. List products and lots in the first column of the section “Characteristics of Fertilizer Products” in the Questionnaire (Table A.1). A product can be listed more than once if there is more than one lot of that fertilizer or if there is one open bag of the same product for retailing in small quantities.
6. Fill out the section “Characteristics of Fertilizer Products” in the Questionnaire (Table A.1) for every product and lot listed.
7. Pick at random one bag from each product and lot listed in the questionnaire for weight verification. Take a picture of the bag label. Weigh the bag. Record in the questionnaire weight on the label and actual weight of the bag.
8. Take a sample from every product listed in the questionnaire:4 If there are less than five bags in the product lot, take a subsample
from every bag.4 If there are between five and 20 bags in a product lot, pick at random
five bags and take a subsample from each of the five bags.
44
4 If the product lot has more than 20 bags, pick 10 bags at random and take a subsample from each of them.
4 Take a sample from every open bag used to retail in small quantities.
2. Fertilizer SamplingTaking a sample from closed bagsFertilizer bags must be in a horizontal position. Subsamples are taken directly from bags in the stacks. You may need a ladder to reach high bags.4 Insert the sampling probe or bag sampler (Figure 1) through a corner
of the bag (Figure 2). The sampling probe must have the slots down during the insertion. When the sampling probe has reached the opposite bag corner, turn it 180° to get the slots upward. Extract the sampling probe.
4 Empty the content of the sampling probe in a bucket. That is a subsample.
4 Patch with tape the hole left by the sampling probe in the bag.4 Repeat this operation in each of the bags selected at random from the
lot. The accumulated subsamples in the bucket make up the sample.4 Transfer the sample to a plastic bag using a funnel. Seal the bag
completely to avoid moisture loss.4 Fill out the sample label (Table A.1).4 Fill out the form “Qualitative Assessment of Physical Attributes” (Table
A.2) to evaluate physical attributes of the sample.4 Place sample and label in a second larger bag. Seal the bag perfectly
to preserve moisture content in the sample.4 Wipe sampling probe, bucket and funnel with a dry rag to remove any
fertilizer residue.4 Move to another lot of the same product or to a lot of different product
and repeat the sampling procedure.
Taking a sample from an open bag4 Scoop out three subsamples: one from the top, another from the
middle and another from the bottom of the bag (Figure A.3). Place the three subsamples in a bag. Seal bag perfectly.
4 Fill out the sample label, making sure to market the “Open Bag” box on the label.
4 Place label and sample in a second larger bag. Seal it completely.
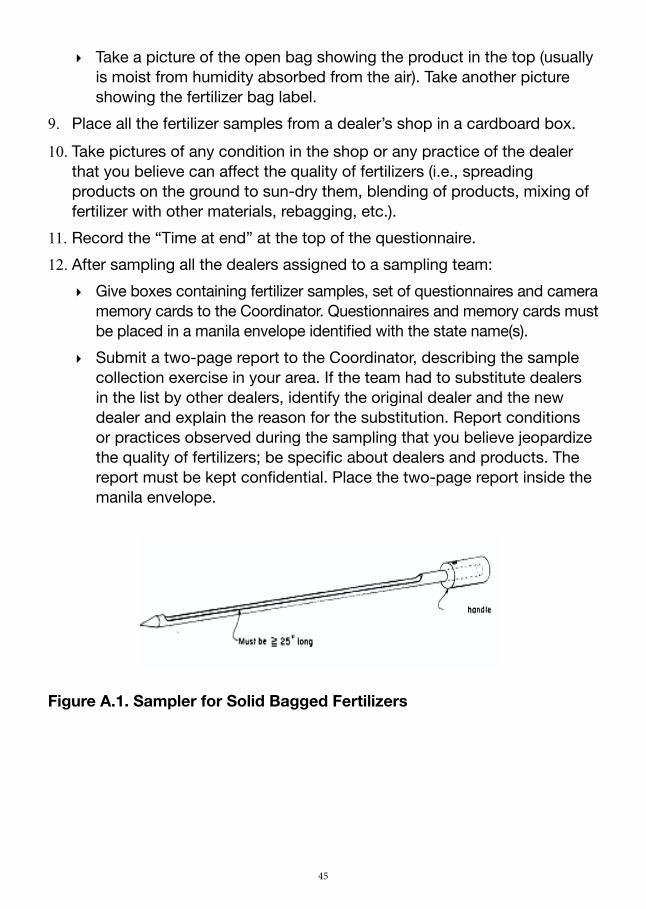
45
4 Take a picture of the open bag showing the product in the top (usually is moist from humidity absorbed from the air). Take another picture showing the fertilizer bag label.
9. Place all the fertilizer samples from a dealer’s shop in a cardboard box.10. Take pictures of any condition in the shop or any practice of the dealer
that you believe can affect the quality of fertilizers (i.e., spreading products on the ground to sun-dry them, blending of products, mixing of fertilizer with other materials, rebagging, etc.).
11. Record the “Time at end” at the top of the questionnaire.12. After sampling all the dealers assigned to a sampling team:4 Give boxes containing fertilizer samples, set of questionnaires and camera
memory cards to the Coordinator. Questionnaires and memory cards must be placed in a manila envelope identified with the state name(s).
4 Submit a two-page report to the Coordinator, describing the sample collection exercise in your area. If the team had to substitute dealers in the list by other dealers, identify the original dealer and the new dealer and explain the reason for the substitution. Report conditions or practices observed during the sampling that you believe jeopardize the quality of fertilizers; be specific about dealers and products. The report must be kept confidential. Place the two-page report inside the manila envelope.
Figure A.1. Sampler for Solid Bagged Fertilizers
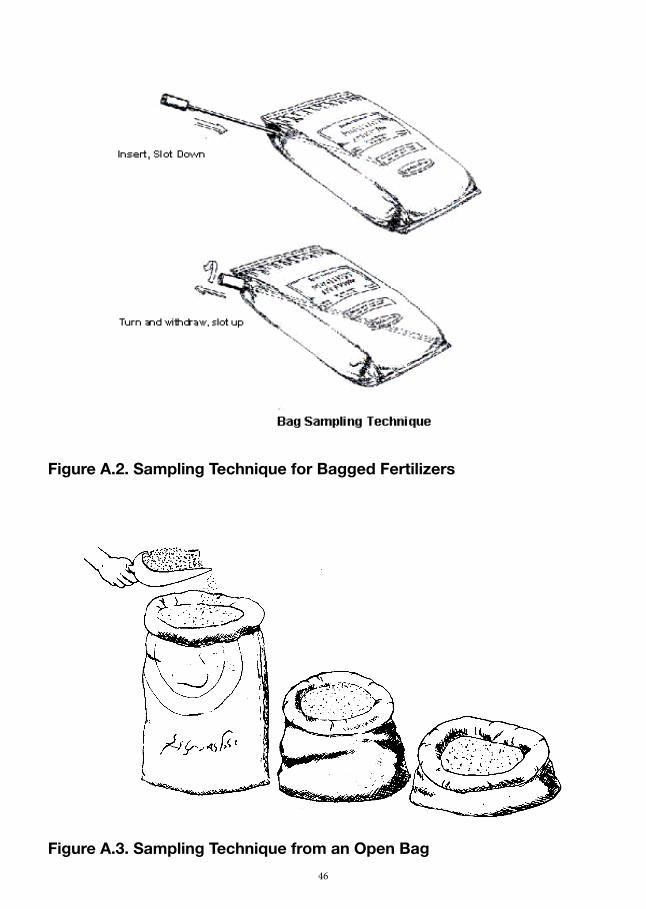
46
Figure A.2. Sampling Technique for Bagged Fertilizers
Figure A.3. Sampling Technique from an Open Bag
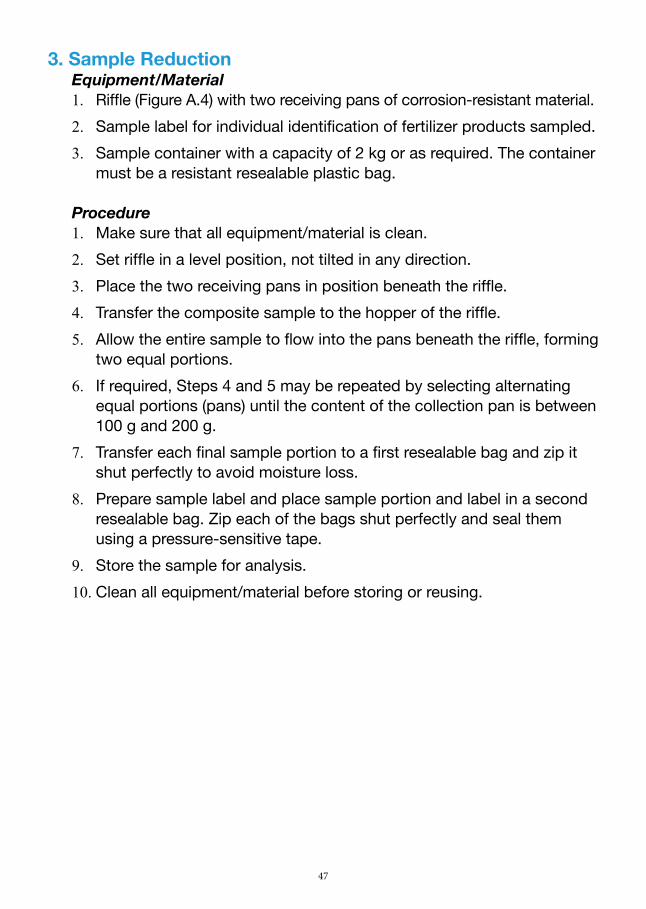
47
3. Sample ReductionEquipment/Material1. Riffle (Figure A.4) with two receiving pans of corrosion-resistant material.2. Sample label for individual identification of fertilizer products sampled.3. Sample container with a capacity of 2 kg or as required. The container
must be a resistant resealable plastic bag.
Procedure1. Make sure that all equipment/material is clean.2. Set riffle in a level position, not tilted in any direction.3. Place the two receiving pans in position beneath the riffle.4. Transfer the composite sample to the hopper of the riffle. 5. Allow the entire sample to flow into the pans beneath the riffle, forming
two equal portions.6. If required, Steps 4 and 5 may be repeated by selecting alternating
equal portions (pans) until the content of the collection pan is between 100 g and 200 g.
7. Transfer each final sample portion to a first resealable bag and zip it shut perfectly to avoid moisture loss.
8. Prepare sample label and place sample portion and label in a second resealable bag. Zip each of the bags shut perfectly and seal them using a pressure-sensitive tape.
9. Store the sample for analysis.10. Clean all equipment/material before storing or reusing.
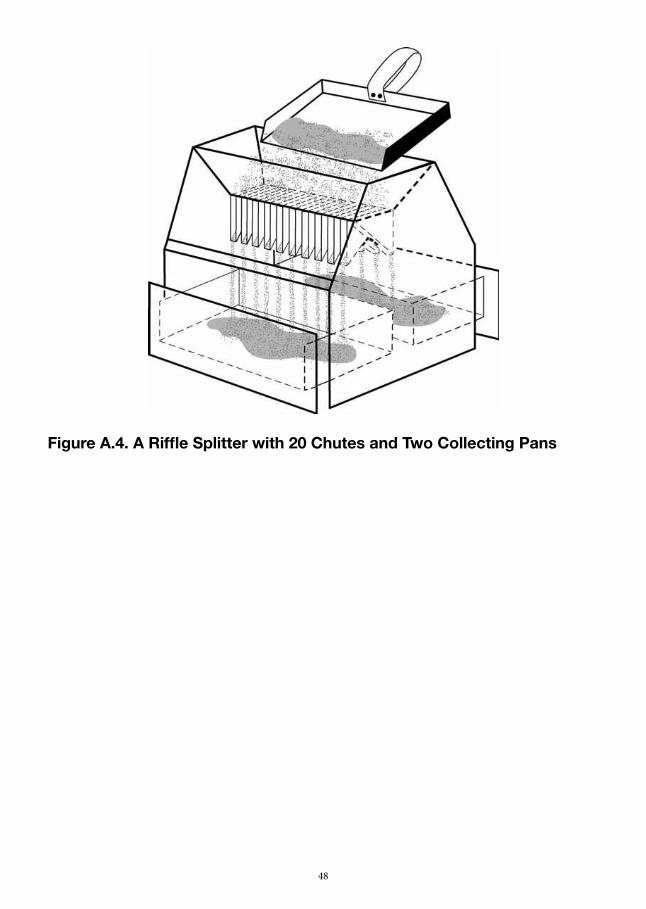
48
Figure A.4. A Riffle Splitter with 20 Chutes and Two Collecting Pans
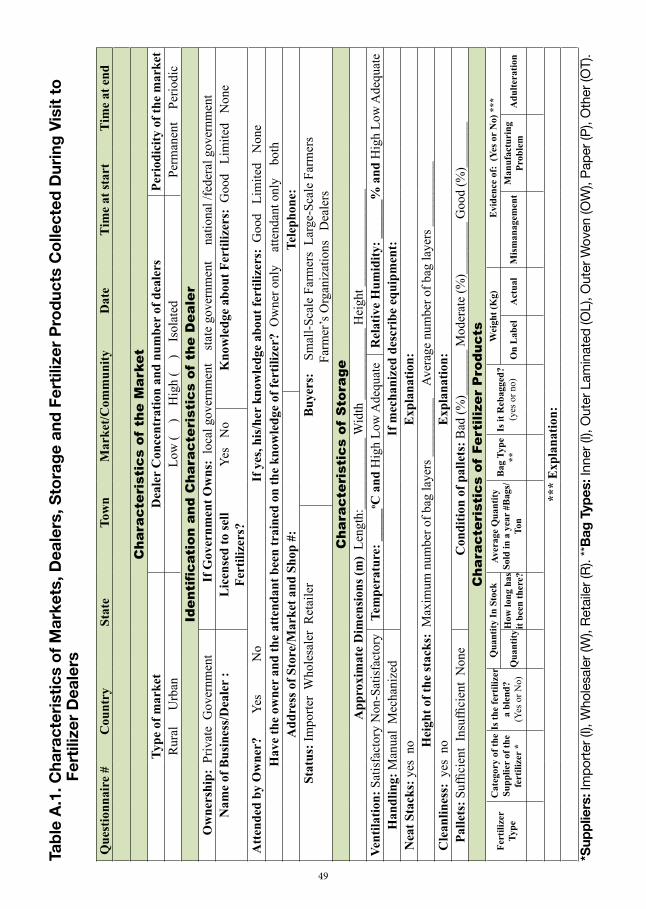
49
Que
stio
nnai
re #
Cou
ntry
Stat
eTo
wn
Mar
ket/C
omm
unity
Dat
eTi
me
at st
art
Tim
e at
end
Cha
ract
eris
tics
of
the
Mar
ket
Type
of m
arke
tD
eale
r C
once
ntra
tion
and
num
ber
of d
eale
rsPe
riod
icity
of t
he m
arke
tR
ural
U
rban
Low
(
) H
igh
( )
Is
olat
edPe
rman
ent
Per
iodi
cId
enti
ficat
ion
and
Cha
ract
eris
tics
of
the
Dea
ler
Ow
ners
hip:
Priv
ate
Gov
ernm
ent
If G
over
nmen
t Ow
ns:
loca
l gov
ernm
ent
sta
te g
over
nmen
t
natio
nal /
fede
ral g
over
nmen
tN
ame
of B
usin
ess/
Dea
ler
:L
icen
sed
to se
ll Fe
rtili
zers
?Ye
s N
oK
now
ledg
e ab
out F
ertil
izer
s: G
ood
Lim
ited
Non
e
Att
ende
d by
Ow
ner?
Yes
No
If y
es, h
is/h
er k
now
ledg
e ab
out f
ertil
izer
s: G
ood
Lim
ited
Non
eH
ave
the
owne
r an
d th
e at
tend
ant b
een
trai
ned
on th
e kn
owle
dge
of fe
rtili
zer?
Ow
ner o
nly
at
tend
ant o
nly
bo
thA
ddre
ss o
f Sto
re/M
arke
t and
Sho
p #:
Tele
phon
e:St
atus
: Im
porte
r W
hole
sale
r R
etai
ler
Buy
ers:
S
mal
l-Sca
le F
arm
ers
Larg
e-Sc
ale
Farm
ers
Farm
er’s
Org
aniz
atio
ns
Dea
lers
Cha
ract
eris
tics
of
Sto
rage
App
roxi
mat
e D
imen
sion
s (m
) Le
ngth
:___
____
____
Wid
th _
____
____
__ H
eigh
t ___
____
____
____
Vent
ilatio
n: S
atis
fact
ory
Non
-Sat
isfa
ctor
yTe
mpe
ratu
re: _
____
o C a
nd H
igh
Low
Ade
quat
eR
elat
ive
Hum
idity
: ___
___%
and
Hig
h Lo
w A
dequ
ate
Han
dlin
g: M
anua
l M
echa
nize
dIf
mec
hani
zed
desc
ribe
equ
ipm
ent:
Nea
t Sta
cks:
yes
no
Exp
lana
tion:
Hei
ght o
f the
stac
ks:
Max
imum
num
ber o
f bag
laye
rs _
____
____
A
vera
ge n
umbe
r of b
ag la
yers
___
____
___
Cle
anlin
ess:
yes
no
Exp
lana
tion:
Palle
ts: S
uffic
ient
Ins
uffic
ient
Non
eC
ondi
tion
of p
alle
ts: B
ad (%
)___
____
Mod
erat
e (%
)___
____
_ G
ood
(%)_
____
__C
hara
cter
isti
cs o
f Fe
rtili
zer
Pro
duct
sFe
rtili
zer
Type
Cat
egor
y of
the
Supp
lier
of th
e fe
rtili
zer
*
Is th
e fe
rtili
zer
a bl
end?
(Yes
or N
o)
Qua
ntity
In S
tock
Aver
age
Qua
ntity
So
ld in
a y
ear
#Bag
s/To
n
Bag
Typ
e **
Is it
Reb
agge
d?(y
es o
r no)
Wei
ght (
Kg)
Evi
denc
e of
: (Y
es o
r N
o) *
**
Qua
ntity
How
long
has
it
been
ther
e?O
n L
abel
Act
ual
Mis
man
agem
ent
Man
ufac
turi
ng
Prob
lem
Adu
ltera
tion
***
Exp
lana
tion:
*Sup
plie
rs: I
mpo
rter (
I), W
hole
sale
r (W
), Re
taile
r (R)
. **B
ag T
ypes
: Inn
er (I
), O
uter
Lam
inat
ed (O
L), O
uter
Wov
en (O
W),
Pape
r (P)
, Oth
er (O
T).
Tabl
e A.
1. C
hara
cter
istic
s of
Mar
kets
, Dea
lers
, Sto
rage
and
Fer
tiliz
er P
rodu
cts
Col
lect
ed D
urin
g Vi
sit t
o
Fert
ilize
r Dea
lers
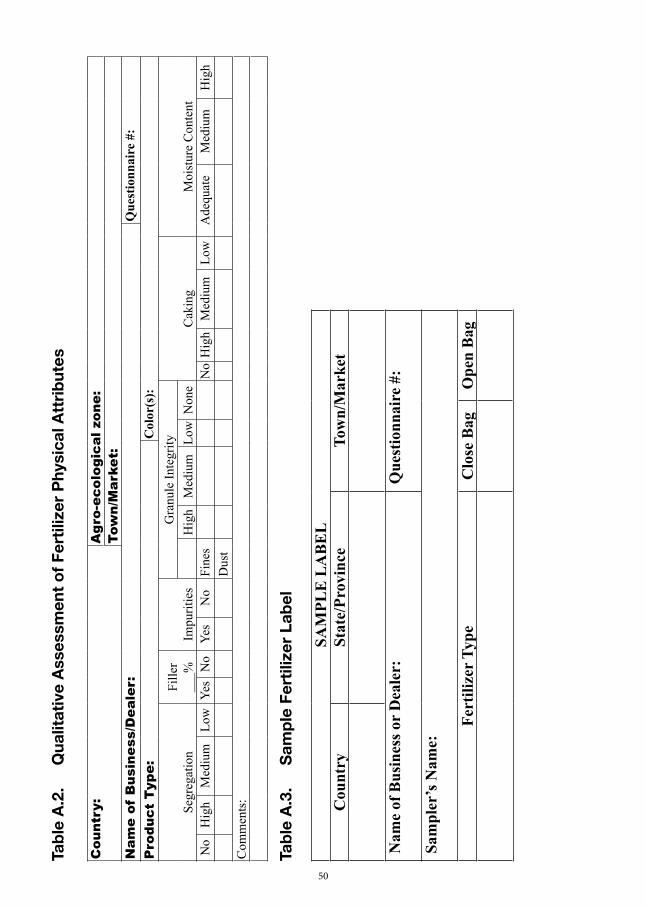
50
Tabl
e A.
2.
Qua
litat
ive
Asse
ssm
ent o
f Fer
tiliz
er P
hysi
cal A
ttrib
utes
Tabl
e A.
3.
Sam
ple
Fert
ilize
r Lab
el
Cou
ntry
:A
gro-
ecol
ogic
al z
one:
Tow
n/M
arke
t:N
ame
of B
usin
ess/
Dea
ler:
Que
stio
nnai
re #
:P
rodu
ct T
ype:
Col
or(s
):
Segr
egat
ion
Fille
r__
_%Im
purit
ies
Gra
nule
Inte
grity
Cak
ing
Moi
stur
e C
onte
ntH
igh
Med
ium
Low
Non
eN
oH
igh
Med
ium
Low
Yes
No
Yes
No
Fine
sN
oH
igh
Med
ium
Low
Ade
quat
eM
ediu
mH
igh
Dus
tC
omm
ents
:
SAM
PLE
LA
BE
LC
ount
rySt
ate/
Prov
ince
Tow
n/M
arke
t
Nam
e of
Bus
ines
s or
Dea
ler:
Que
stio
nnai
re #
:
Sam
pler
’s N
ame:
Fert
ilize
r Typ
eC
lose
Bag
Ope
n B
ag
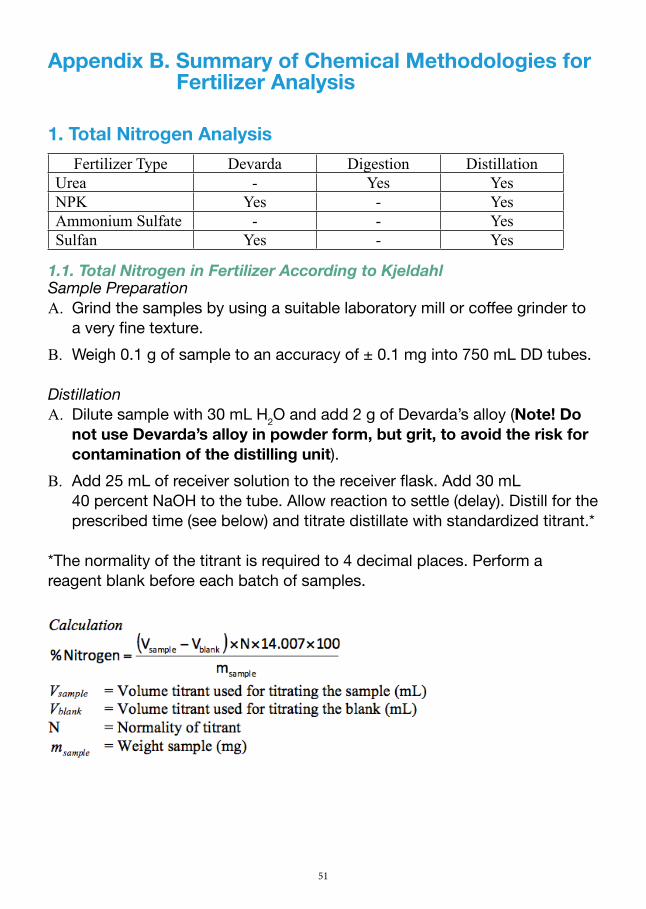
51
Appendix B. Summary of Chemical Methodologies for Fertilizer Analysis
1. Total Nitrogen AnalysisFertilizer Type Devarda Digestion Distillation
Urea - Yes YesNPK Yes - YesAmmonium Sulfate - - YesSulfan Yes - Yes
1.1. Total Nitrogen in Fertilizer According to KjeldahlSample PreparationA. Grind the samples by using a suitable laboratory mill or coffee grinder to
a very fine texture.B. Weigh 0.1 g of sample to an accuracy of ± 0.1 mg into 750 mL DD tubes.
DistillationA. Dilute sample with 30 mL H2O and add 2 g of Devarda’s alloy (Note! Do
not use Devarda’s alloy in powder form, but grit, to avoid the risk for contamination of the distilling unit).
B. Add 25 mL of receiver solution to the receiver flask. Add 30 mL 40 percent NaOH to the tube. Allow reaction to settle (delay). Distill for the prescribed time (see below) and titrate distillate with standardized titrant.*
*The normality of the titrant is required to 4 decimal places. Perform a reagent blank before each batch of samples.
Calculation
( )sample
blanksample
m10014.007NVV
Nitrogen %×××−
=
Vsample = Volume titrant used for titrating the sample (mL)Vblank = Volume titrant used for titrating the blank (mL)N = Normality of titrant
samplem = Weight sample (mg)
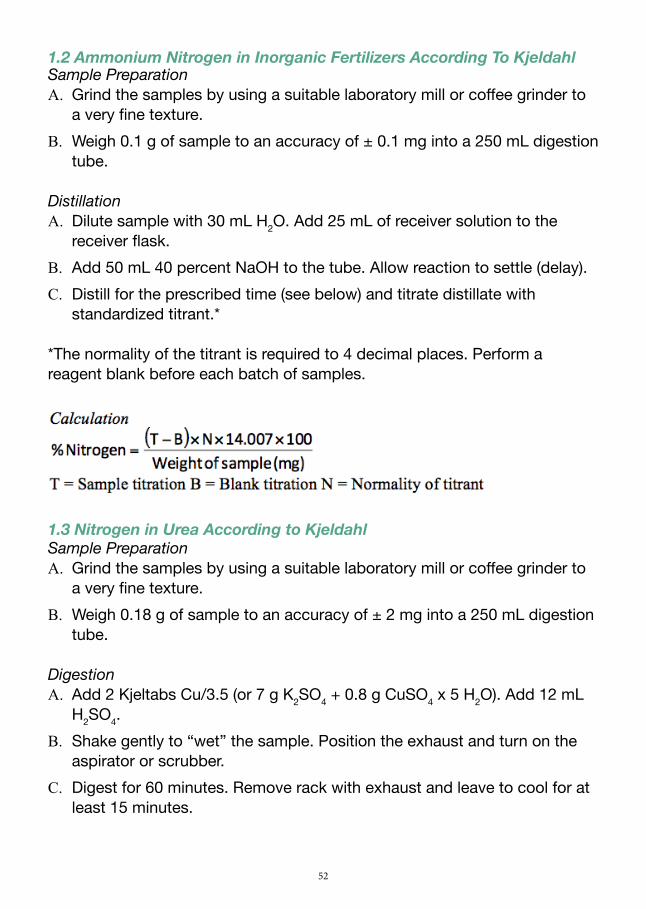
52
1.2 Ammonium Nitrogen in Inorganic Fertilizers According To KjeldahlSample PreparationA. Grind the samples by using a suitable laboratory mill or coffee grinder to
a very fine texture.B. Weigh 0.1 g of sample to an accuracy of ± 0.1 mg into a 250 mL digestion
tube.
DistillationA. Dilute sample with 30 mL H2O. Add 25 mL of receiver solution to the
receiver flask.B. Add 50 mL 40 percent NaOH to the tube. Allow reaction to settle (delay). C. Distill for the prescribed time (see below) and titrate distillate with
standardized titrant.*
*The normality of the titrant is required to 4 decimal places. Perform a reagent blank before each batch of samples.
Calculation()
(mg) sampleof Weight10014.007NBTNitrogen % ×××−
=
T = Sample titration B = Blank titration N = Normality of titrant
1.3 Nitrogen in Urea According to Kjeldahl Sample PreparationA. Grind the samples by using a suitable laboratory mill or coffee grinder to
a very fine texture.B. Weigh 0.18 g of sample to an accuracy of ± 2 mg into a 250 mL digestion
tube.
DigestionA. Add 2 Kjeltabs Cu/3.5 (or 7 g K2SO4 + 0.8 g CuSO4 x 5 H2O). Add 12 mL
H2SO4. B. Shake gently to “wet” the sample. Position the exhaust and turn on the
aspirator or scrubber. C. Digest for 60 minutes. Remove rack with exhaust and leave to cool for at
least 15 minutes.
53
DistillationOn some systems part or all of this is performed automatically.A. Dilute cooled digest with 75 mL H2O. B. Add 25 mL of receiver solution to the receiver flask. Add 50 mL
40 percent NaOH to the tube. Allow reaction to settle (delay). Distill for the prescribed time (see below) and titrate distillate with standardized titrant.*
* The normality of the titrant is required to 4 decimal places. Perform a reagent blank before each batch of samples.
Calculation()
(mg) sampleof Weight10014.007NBTNitrogen % ×××−
=
T = Sample titration B = Blank titration N = Normality of titrant
2. Analysis of Phosphorus as P2O5, Potassium as K2O, Sulfur as SO4, Calcium and Magnesium
These nutrients were analyzed with Inductively Coupled Plasma-Optical Emission Spectrometer (ICP-OES), which uses a high energy argon plasma to convert elements in a solution into a gaseous, excited state form that emits electromagnetic radiation at characteristic wavelengths. The colors of the emitted light and the light intensity can be used to identify the element and determine how much of the element is present in a sample. The ICP-OES uses an array detector so that many elements in a sample can be determined simultaneously.
2.1. Digestion of Fertilizer Sample for Analysis with ICPA. Weigh a 1-g sample (4 decimal places), record weight on Attachment 1
worksheet and transfer to a 250-mL beaker.B. Determine if the sample contains urea. If it does, add 5 mL HCl acid
and 50 mL distilled water to the beaker, place on a hot plate and boil for 5 min. Remove beaker and cool. If the sample does not contain urea, proceed directly to Step 3.
C. Add 5 mL of HNO3 and 10 mL of HClO4 acids to the beaker. Cover beaker with a watch glass, place beaker on hot plate and digest sample. If brown HNO3 acid fumes appear, continue adding HNO3 acid dropwise until they no longer persist. Continue with digestion until strong white HClO4 acid fumes appear.
54
D. Remove beaker and allow to cool. Add 100 mL of distilled water, place back on hot plate and bring to a boil for 5 minutes. (Note: This “Note” applies to K2O analysis only. K2O may form potassium perchlorates (indicated by white crystalline grains, “feathers” or specks) when digesting to strong HClO4 fumes. These perchlorates should go into solution during the boiling procedure. If the perchlorates do go into solution, proceed to Step 5. If they do not dissolve in the boiling water, then proceed as follows: weigh (record weight to 4 decimal places on Attachment 1 worksheet) a 2.5 g sample into a 400-mL beaker. Add 50 mL of 4 percent (saturated) ammonium oxalate solution to the beaker. Add 125 mL distilled water to the beaker, place beaker on hot plate and boil for 30 minutes. This sample is for K2O analysis only. Proceed with Step 5.
E. Remove from hot plate, allow to cool and filter through a Whatman No. 42 filter paper into a 500-mL fertilizer flask. Bring to volume with distilled water. (Filter only if needed – solution contains sand or rock particles, or is non-clear.)
F. Determine the analytes of interest (e.g., total P2O5, potassium and other elements). Dilution of the sample solution may be necessary. Record sample weight, sample volume, aliquot and analytical procedure to be employed for analyte of interest.
An ICP works by injecting a nebulized mist from a liquid into the center of an argon plasma. A plasma is created from a flow of gas within a high energy field. A strong alternating current of RF energy flowing in a coil just outside of the gas flow ionizes the gas and causes intense heating. When the mist of the fertilizer solution sample enters the plasma, the intense heat causes the dissociation of most chemical compounds and the energy that the component atoms absorb causes them to undergo excitation and ionization energy transitions. These transitions produce spectral emissions characteristic of the elements being excited. The spectra produced by the plasma is broken down into individual spectral lines by the ICP’s spectrometer and the ICP’s computer translates the spectral lines into concentrations for the nutrient elements in the fertilizer samples.
3. Quality ControlA. At least two (2) separate Magruder check standards are used to check
accuracy of test per each batch of 50 samples or less.B. At least 5 percent of samples are selected at random as replicate to
check precision of test per each batch of 50 samples or less.
55
C. At least 5 percent method blanks are performed per each batch of 50 samples or less.
4. Reference MethodologiesA. AOAC957.02+APHA3120B – Determination by ICP-OES following AOAC
Official Method 957.02, 18th Ed (2005) sample preparation for fertilizer.B. AOAC988.05 – Total Nitrogen determination by Kjeldahl/modified
Kjeldahl.
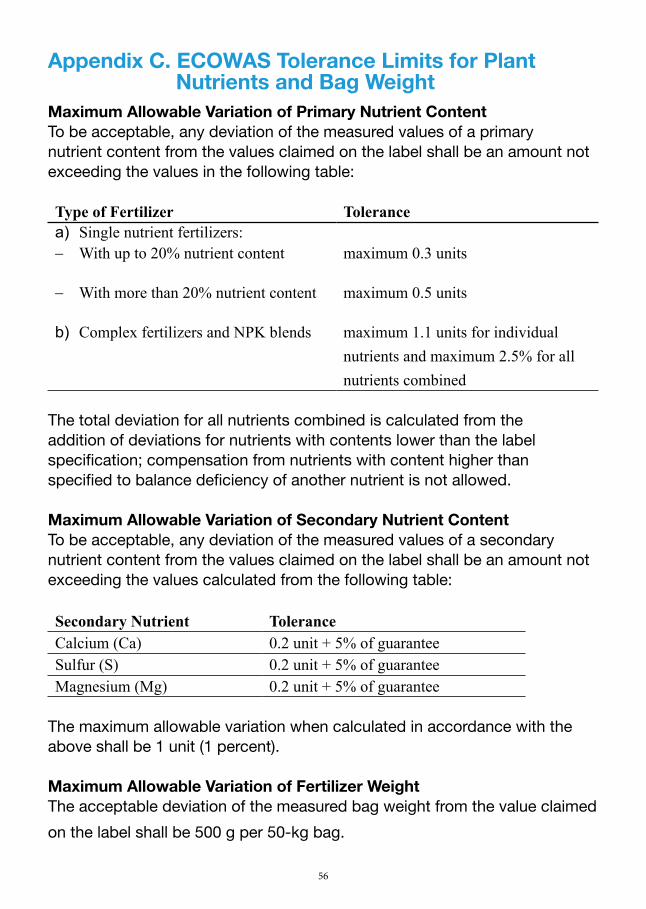
56
Appendix C. ECOWAS Tolerance Limits for Plant Nutrients and Bag WeightMaximum Allowable Variation of Primary Nutrient ContentTo be acceptable, any deviation of the measured values of a primary nutrient content from the values claimed on the label shall be an amount not exceeding the values in the following table:
Type of Fertilizer Tolerance a) Single nutrient fertilizers:− With up to 20% nutrient content maximum 0.3 units
− With more than 20% nutrient content maximum 0.5 units
b) Complex fertilizers and NPK blends maximum 1.1 units for individual nutrients and maximum 2.5% for all nutrients combined
The total deviation for all nutrients combined is calculated from the addition of deviations for nutrients with contents lower than the label specification; compensation from nutrients with content higher than specified to balance deficiency of another nutrient is not allowed.
Maximum Allowable Variation of Secondary Nutrient ContentTo be acceptable, any deviation of the measured values of a secondary nutrient content from the values claimed on the label shall be an amount not exceeding the values calculated from the following table:
Secondary Nutrient ToleranceCalcium (Ca) 0.2 unit + 5% of guaranteeSulfur (S) 0.2 unit + 5% of guaranteeMagnesium (Mg) 0.2 unit + 5% of guarantee
The maximum allowable variation when calculated in accordance with the above shall be 1 unit (1 percent).
Maximum Allowable Variation of Fertilizer WeightThe acceptable deviation of the measured bag weight from the value claimed on the label shall be 500 g per 50-kg bag.
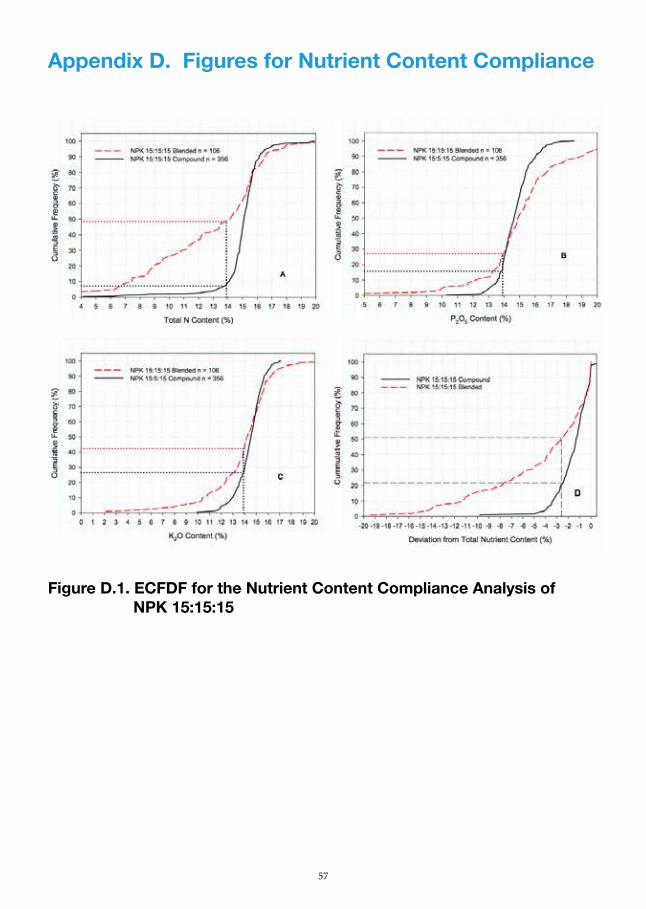
57
Appendix D. Figures for Nutrient Content Compliance
Figure D.1. ECFDF for the Nutrient Content Compliance Analysis of NPK 15:15:15
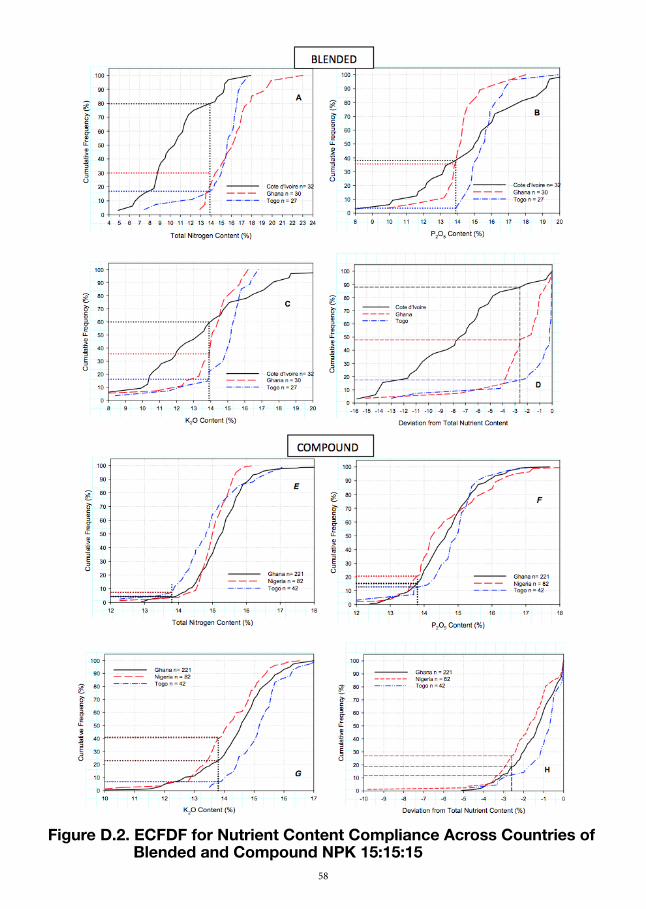
58
Figure D.2. ECFDF for Nutrient Content Compliance Across Countries of Blended and Compound NPK 15:15:15
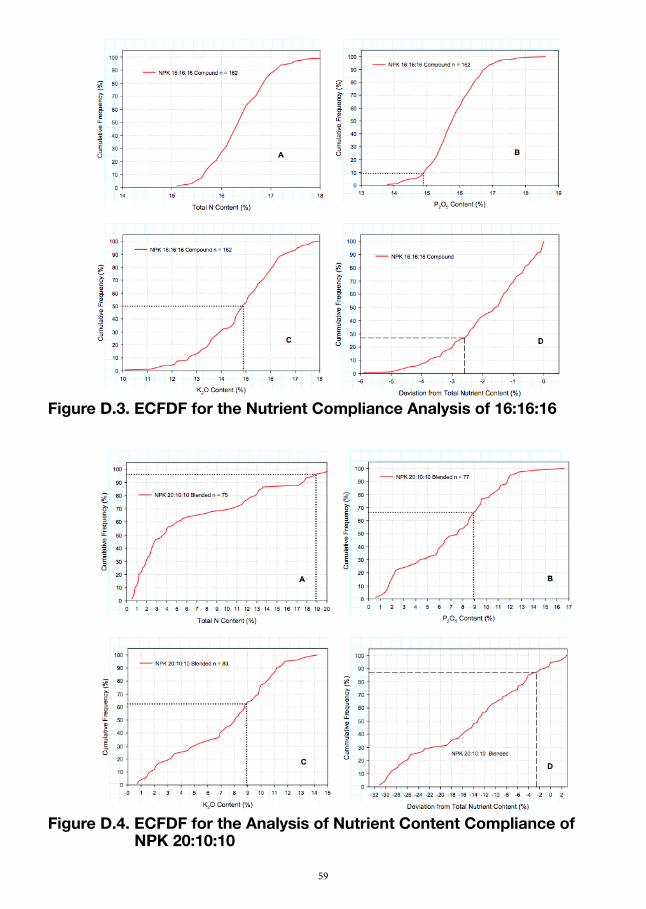
59
Figure D.3. ECFDF for the Nutrient Compliance Analysis of 16:16:16
Figure D.4. ECFDF for the Analysis of Nutrient Content Compliance of NPK 20:10:10
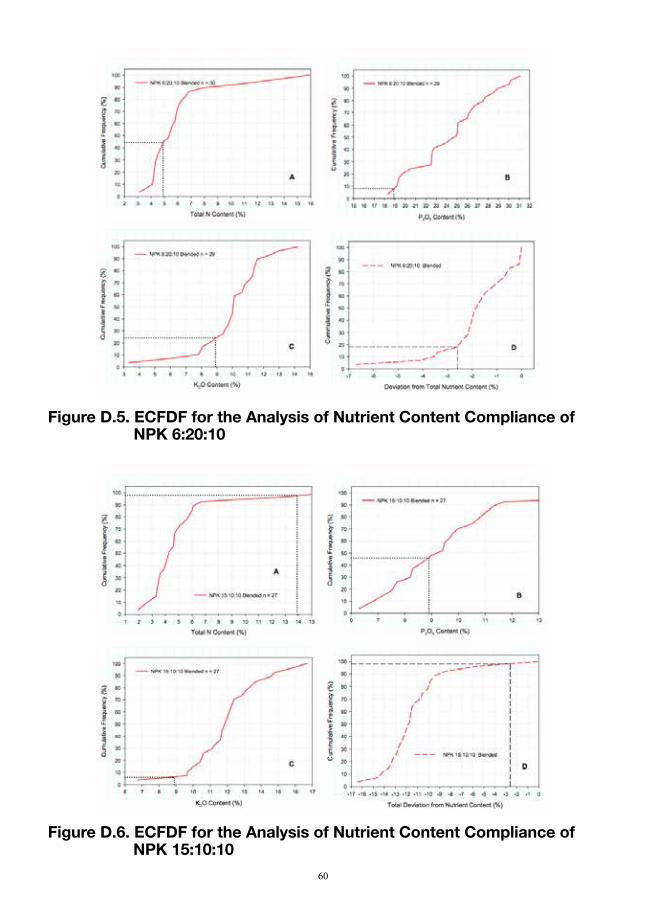
60
Figure D.5. ECFDF for the Analysis of Nutrient Content Compliance of NPK 6:20:10
Figure D.6. ECFDF for the Analysis of Nutrient Content Compliance of NPK 15:10:10

61
Figure D.7. ECFDF for the Analysis of Nutrient Content Compliance of Asaase Wura
Figure D.8. ECFDF for the Analysis of Nutrient Content Compliance of Cocoa Feed
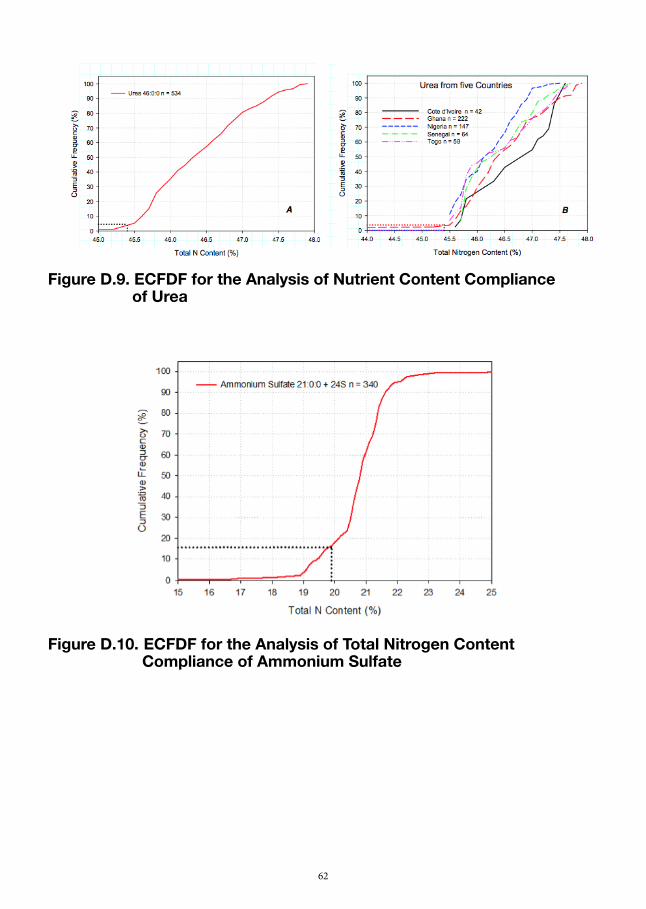
62
Figure D.9. ECFDF for the Analysis of Nutrient Content Compliance of Urea
Figure D.10. ECFDF for the Analysis of Total Nitrogen Content Compliance of Ammonium Sulfate
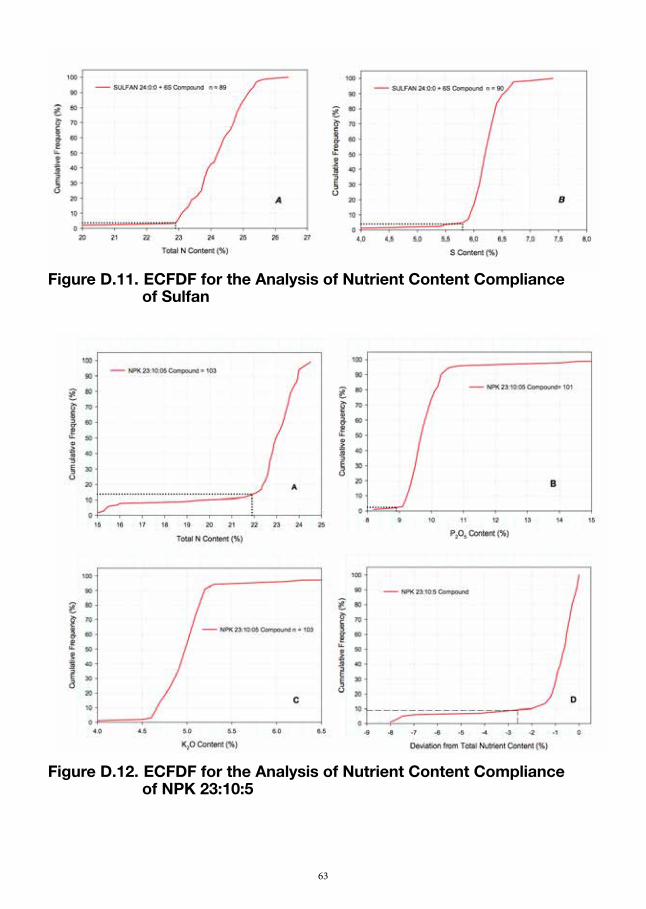
63
Figure D.11. ECFDF for the Analysis of Nutrient Content Compliance of Sulfan
Figure D.12. ECFDF for the Analysis of Nutrient Content Compliance of NPK 23:10:5
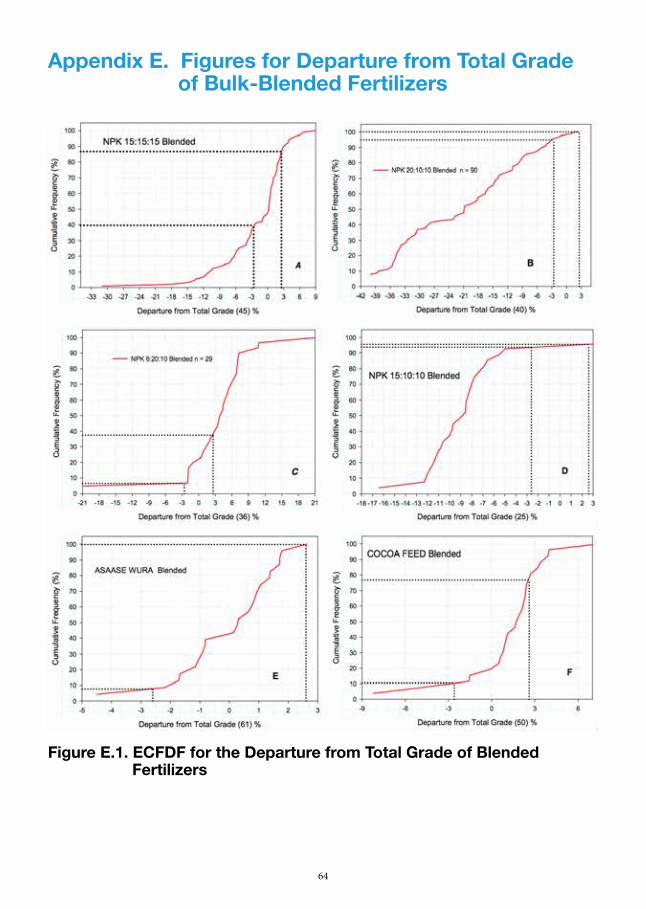
64
Appendix E. Figures for Departure from Total Grade of Bulk-Blended Fertilizers
Figure E.1. ECFDF for the Departure from Total Grade of Blended Fertilizers
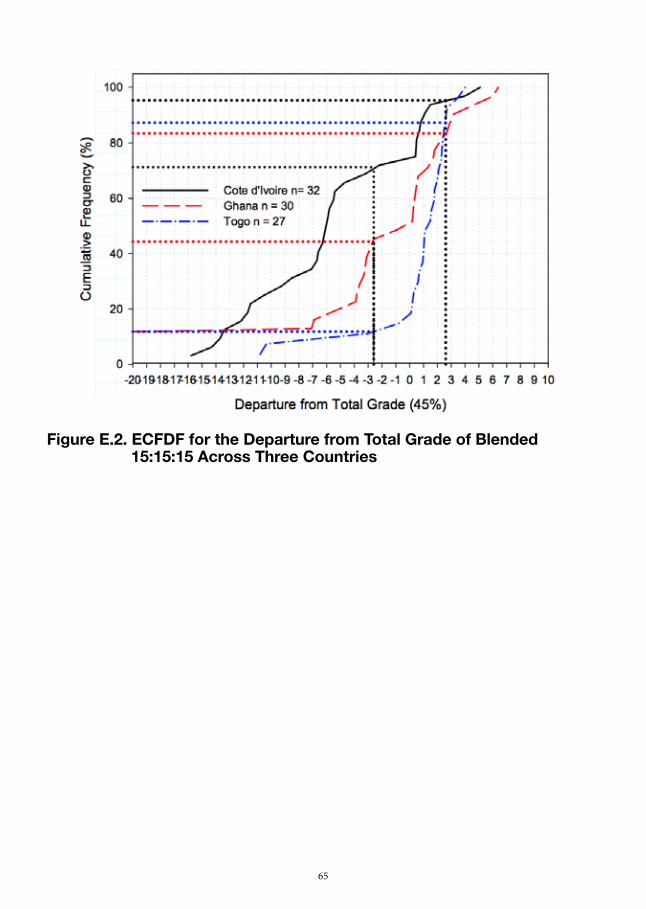
65
Figure E.2. ECFDF for the Departure from Total Grade of Blended 15:15:15 Across Three Countries
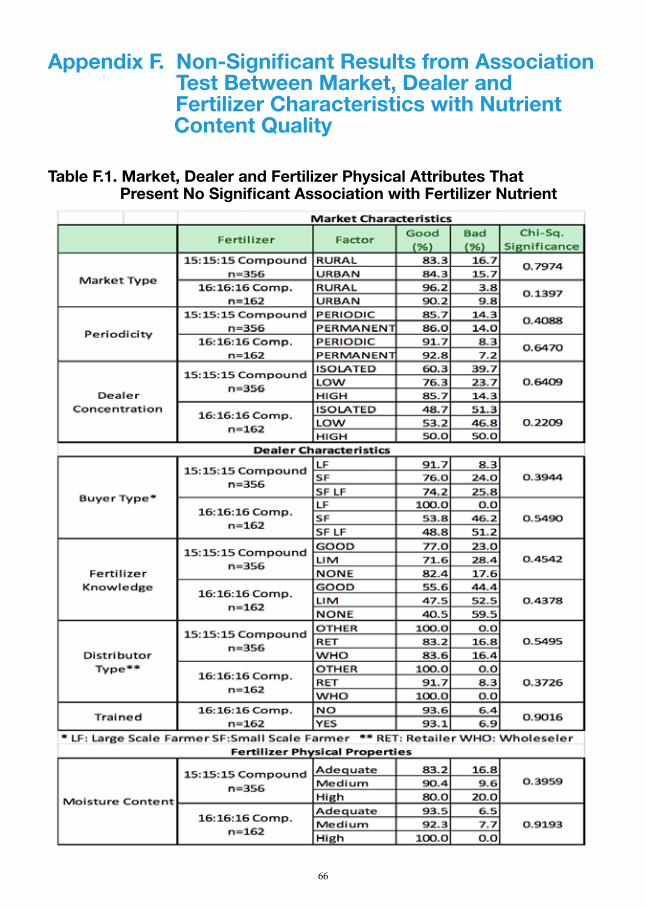
66
Appendix F. Non-Significant Results from Association Test Between Market, Dealer and Fertilizer Characteristics with Nutrient Content Quality
Table F.1. Market, Dealer and Fertilizer Physical Attributes That Present No Significant Association with Fertilizer Nutrient Content Quality


P.O. Box 2040 Muscle Shoals, AL 35662 USA
Phone: +1(256) 381-6600 Fax: +1(256) 381-7408 Website: www.ifdc.org E-mail: [email protected]
© 2013, IFDC. All rights reserved.
Special Publication IFDC – SP-42August 20133C ISBN 978-0-88090-173-4