Embed Size (px)
Citation preview

The Quality of an Educational System cannot Exceed the Quality of
its Teachers Muireann Sheehan & Peter E. Childs
National Centre for Excellence in Mathematics and Science Teaching and Learning, University
of Limerick Department of Chemical and Environmental
Sciences, University of Limerick
Overview of Presentation
• Background
• Focus of Study
• Research Questions
• Methodology
• Results
• Key Findings
• Conclusions
• Implications and Future Work
2

Background

Irish Education System
• Producing students with average reading and scientific literacy (Perkins et al., 2011).
• Producing students with below average mathematical skills (Perkins et al., 2011).
• Those entering third-level education often lack critical thinking and independent learning skills (Department of Education & Skills, 2010).
• Misconceptions about basic chemistry concepts are widespread among Junior & Leaving Certificate students (Sheehan, 2010).
Background
4

School Systems
• The quality of an educational system cannot exceed the quality of its teachers (Barber & Mourshed, 2007).
• Raising the calibre of pre-service and in-service teachers is a successful strategy for improving educational systems like Ireland’s (Mourshed et al., 2010).
Background
5
Subject Matter Knowledge
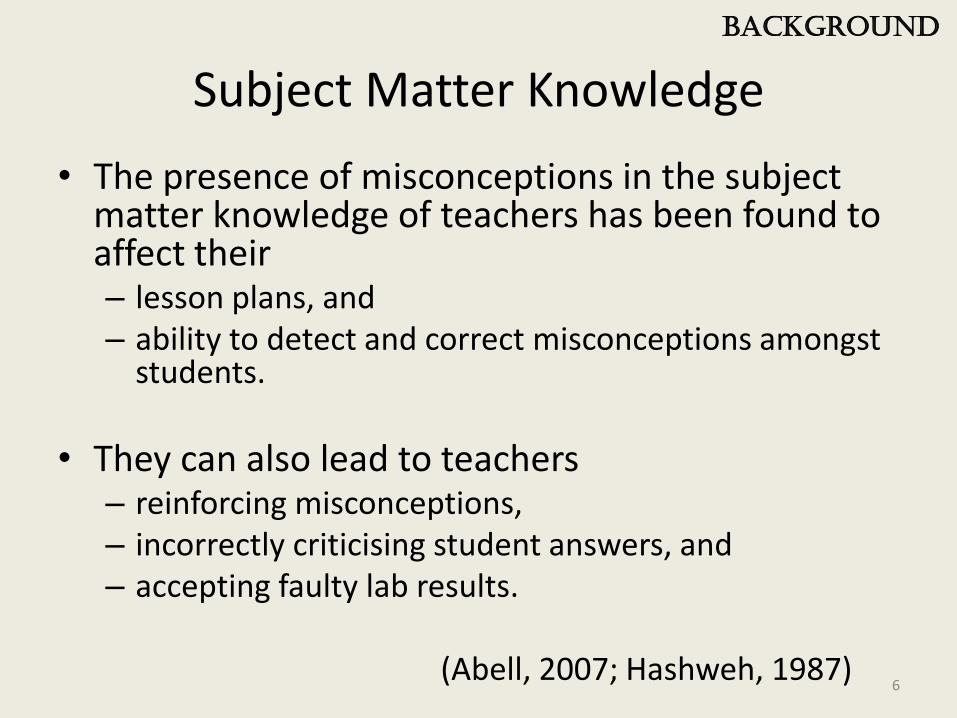
• The presence of misconceptions in the subject matter knowledge of teachers has been found to affect their – lesson plans, and – ability to detect and correct misconceptions amongst
students.
• They can also lead to teachers – reinforcing misconceptions, – incorrectly criticising student answers, and – accepting faulty lab results.
(Abell, 2007; Hashweh, 1987)
Background
6

Focus of Study
• To gain insight into the chemistry subject matter knowledge of pre-service science teachers in Ireland by investigating the prevalence of misconceptions among this group.
Focus of study
7

Research Questions
• What number and type of misconceptions in chemistry are held by Irish pre-service teachers?
• Does the number of years of science and science pedagogy study have an effect on the number or type of misconceptions?
• Is there a link between the number of misconceptions and gender, age or previous school experience?
• Does mode of entry to teaching (concurrent or consecutive) have an effect on the number or type of misconceptions?
Research Questions
8
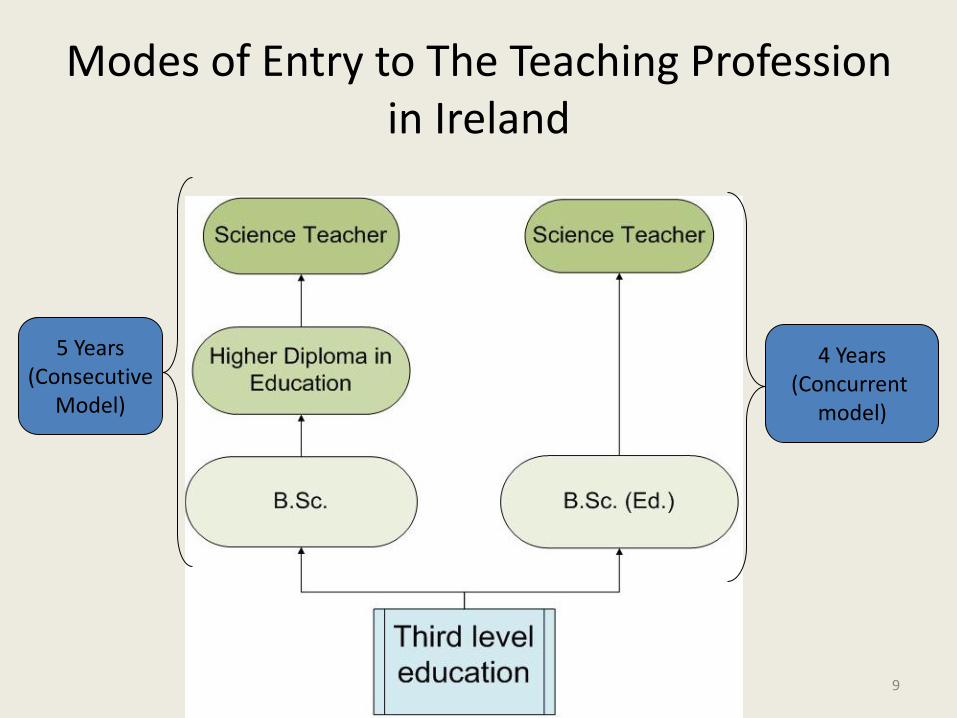
Modes of Entry to The Teaching Profession in Ireland
9
5 Years (Consecutive
Model)
4 Years (Concurrent
model)
Methodology
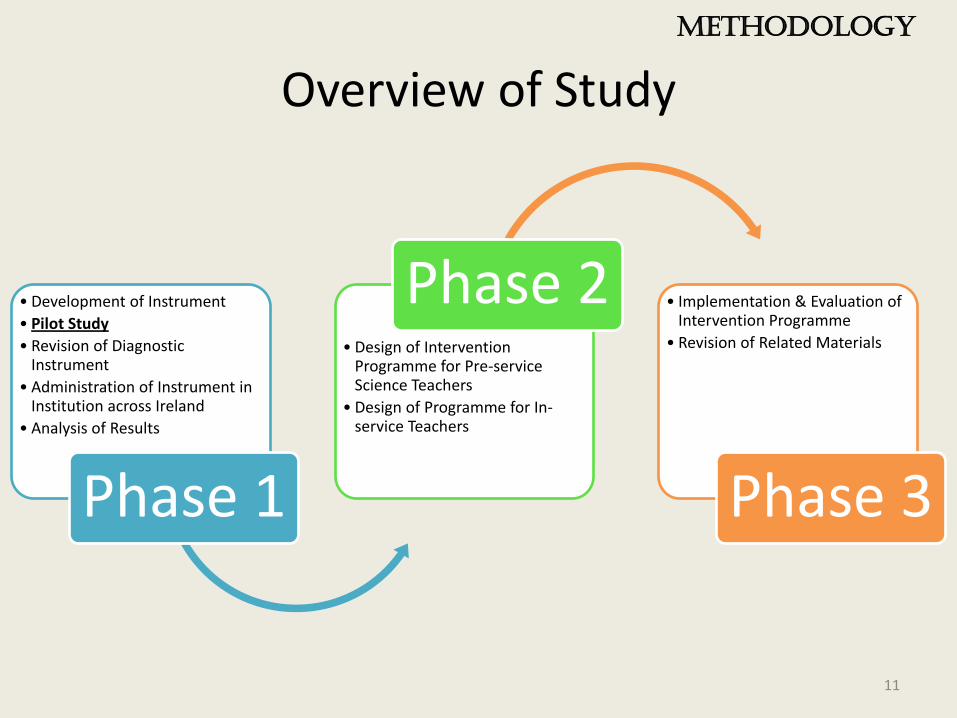
Overview of Study
• Development of Instrument
• Pilot Study
• Revision of Diagnostic Instrument
• Administration of Instrument in Institution across Ireland
• Analysis of Results
Phase 1
• Design of Intervention Programme for Pre-service Science Teachers
• Design of Programme for In-service Teachers
Phase 2 • Implementation & Evaluation of Intervention Programme
• Revision of Related Materials
Phase 3
Methodology
11

Phase 1 Misconceptions
categorised • Leaving Certificate chemistry syllabus was used as a
framework.
Questions selected
• Suitable questions identified from the literature or developed by the authors.
Piloting of Instrument
• 212 pre-service science teachers across 4 years of a concurrent course. (Response Rate 77%)
Revision of the instrument
• Based on the results of the pilot study and interviews with participants.
Institutions recruited
• Course directors and science pedagogy lecturers contacted
Administration of instrument
• 467 pre-service science teachers in concurrent and consecutive courses across Ireland
Analysis of results
• Statistical Package for Social Sciences (SPSS v19)
Methodology
12
Sample Group
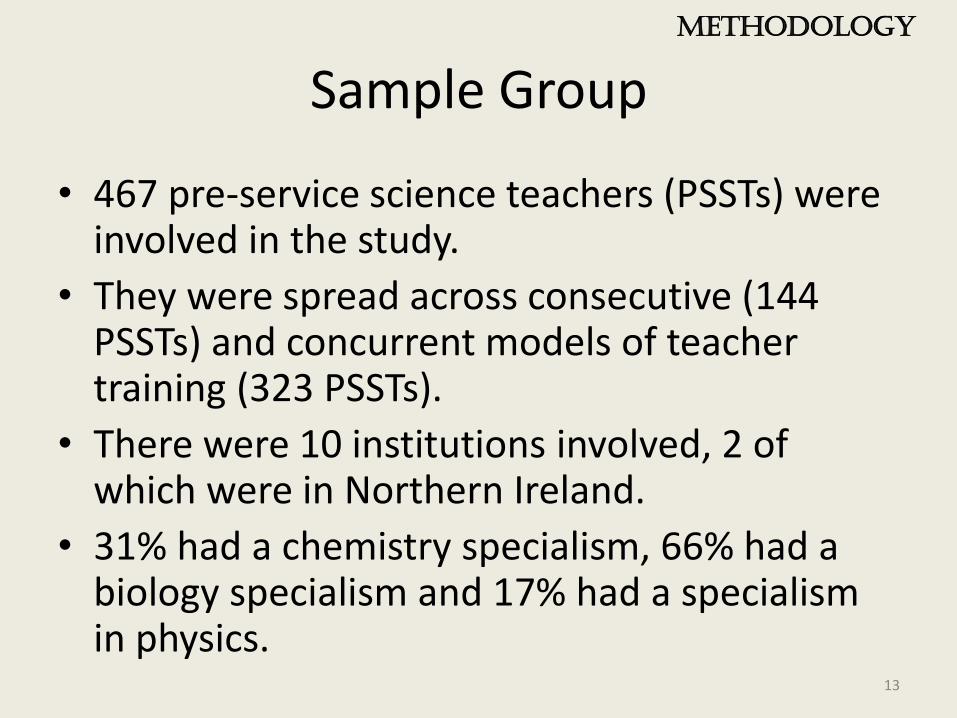
• 467 pre-service science teachers (PSSTs) were involved in the study.
• They were spread across consecutive (144 PSSTs) and concurrent models of teacher training (323 PSSTs).
• There were 10 institutions involved, 2 of which were in Northern Ireland.
• 31% had a chemistry specialism, 66% had a biology specialism and 17% had a specialism in physics.
Methodology
13

Diagnostic Instrument (20 Questions)
Concept Area No.
Qns Concept(s) being tested Source of Question
Particulate Nature of Matter
4 Microscopic nature of atoms, elements,
compounds and mixtures
Mulford & Robinson (2002); Adapted
from Sanger (2000)
1 Conservation of Matter Adapted from Mulford & Robinson (2002)
1 Understanding of phase change Yezierski & Birk (2006)
2 Meaningful conversions from symbolic to microscopic
Author developed; Nurrenbern & Pickering (1987)
Stoichiometry & the
Mole Concept
4 The mole as a counting unit, using the mole concept in stoichiometry and understanding of molar volumes
Gower et al. (1977); Developed by author
Chemical Bonding
5 Process and energetics of bonding, effect of bond type and structure of Ionic Compounds
Peterson & Treagust (1989); adapted
from Mulford & Robinson (2002); Author developed; Adapted from Jensen (unpublished)
Equilibrium 3 Dynamic nature of equilibrium and the
equilibrium constant
Krause et al. (2004); Adapted from JCE website
Methodology
14

Results
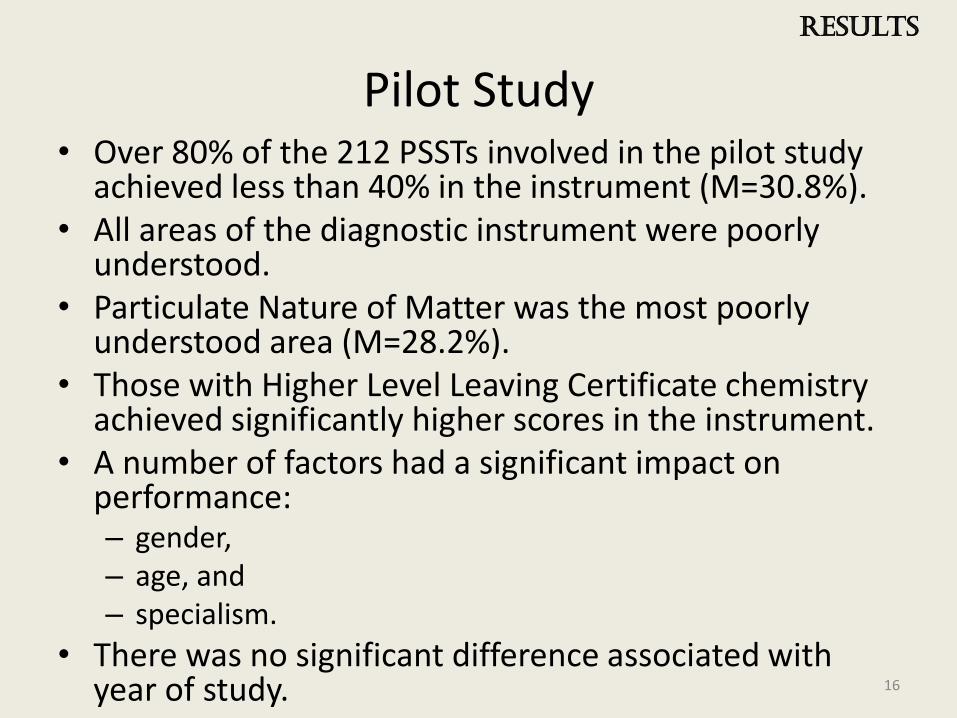
Pilot Study • Over 80% of the 212 PSSTs involved in the pilot study
achieved less than 40% in the instrument (M=30.8%). • All areas of the diagnostic instrument were poorly
understood. • Particulate Nature of Matter was the most poorly
understood area (M=28.2%). • Those with Higher Level Leaving Certificate chemistry
achieved significantly higher scores in the instrument. • A number of factors had a significant impact on
performance: – gender, – age, and – specialism.
• There was no significant difference associated with year of study.
Results
16

Results of Wide-scale Study
Results

Overall Performance in Diagnostic Instrument
• 50% of those involved in the study achieved less than 40% in the instrument.
• A further 14% achieved exactly 40%.
8.6
41.3 41.3
7.9
0.9 0.0
10.0
20.0
30.0
40.0
50.0
60.0
70.0
80.0
90.0
100.0
0-19% 20-39% 40-59% 60-79% 80-100%
Breakdown of Performance of Pre-service Teachers (n = 467) in the Diagnostic Instrument
Results
18

Performance in Instrument: Mode of Entry
• No significant difference between modes of entry to the teaching profession and pre-service teachers overall performance on the instrument.
0.0
10.0
20.0
30.0
40.0
50.0
60.0
70.0
80.0
90.0
100.0
0-19% 20-39% 40-59% 60-79% 80-100%
% P
re-s
erv
ice
Te
ach
ers
Percentage of Correct Answers
Breakdown of Performance of Pre-service Science Teachers in Consecutive and Concurrent Modes of Study
% Consecutive Pre-service Teachers (n =144)
% Concurrent Pre-service Teachers (n =323)
Results
19
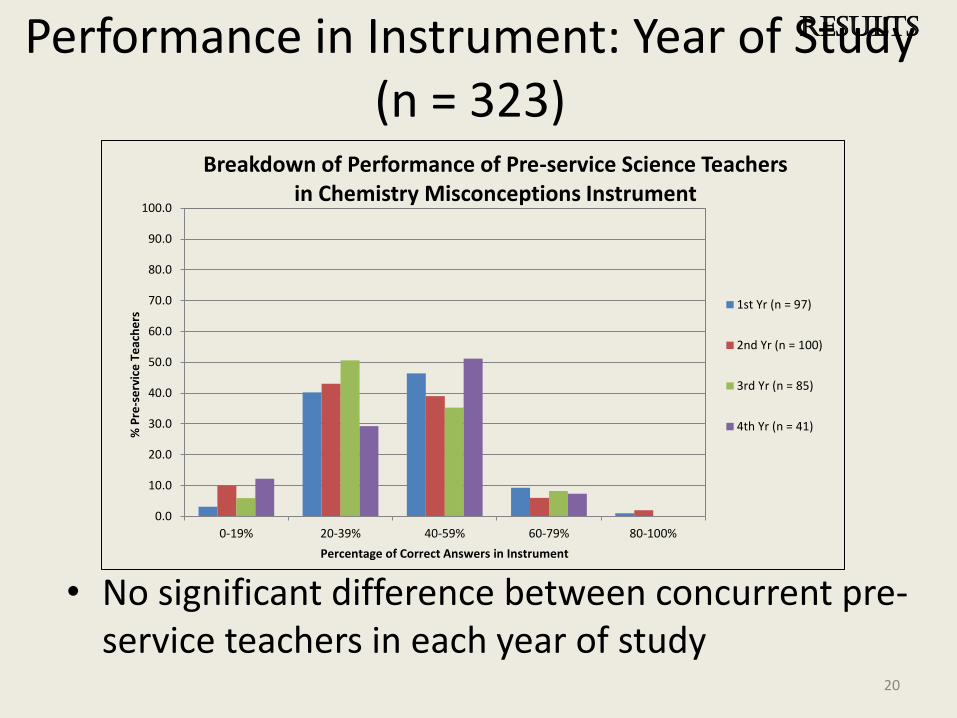
Performance in Instrument: Year of Study (n = 323)
• No significant difference between concurrent pre-service teachers in each year of study
0.0
10.0
20.0
30.0
40.0
50.0
60.0
70.0
80.0
90.0
100.0
0-19% 20-39% 40-59% 60-79% 80-100%
% P
re-s
erv
ice
Te
ach
ers
Percentage of Correct Answers in Instrument
Breakdown of Performance of Pre-service Science Teachers in Chemistry Misconceptions Instrument
1st Yr (n = 97)
2nd Yr (n = 100)
3rd Yr (n = 85)
4th Yr (n = 41)
Results
20

Breakdown of Scores in each Conceptual Area for all PSSTs (n = 467)
Concept Area Mean Percentage % Not Attempting Section
Particulate Nature of Matter
44.4% 0
Stoichiometry & Mole 40.4% 0.9
Chemical Bonding 36.4% 0.4
Equilibrium 17.6% 3.2
Overall Score 37.4% 0
• All areas were poorly understood.
• Equilibrium was the most poorly understood conceptual area.
Results
21
12.6 14.3
3.0
64.2
4.7
0.0
10.0
20.0
30.0
40.0
50.0
60.0
70.0
80.0
90.0
100.0
A B C D* E
% P
re-s
erv
ice
Te
ach
ers
Response Options
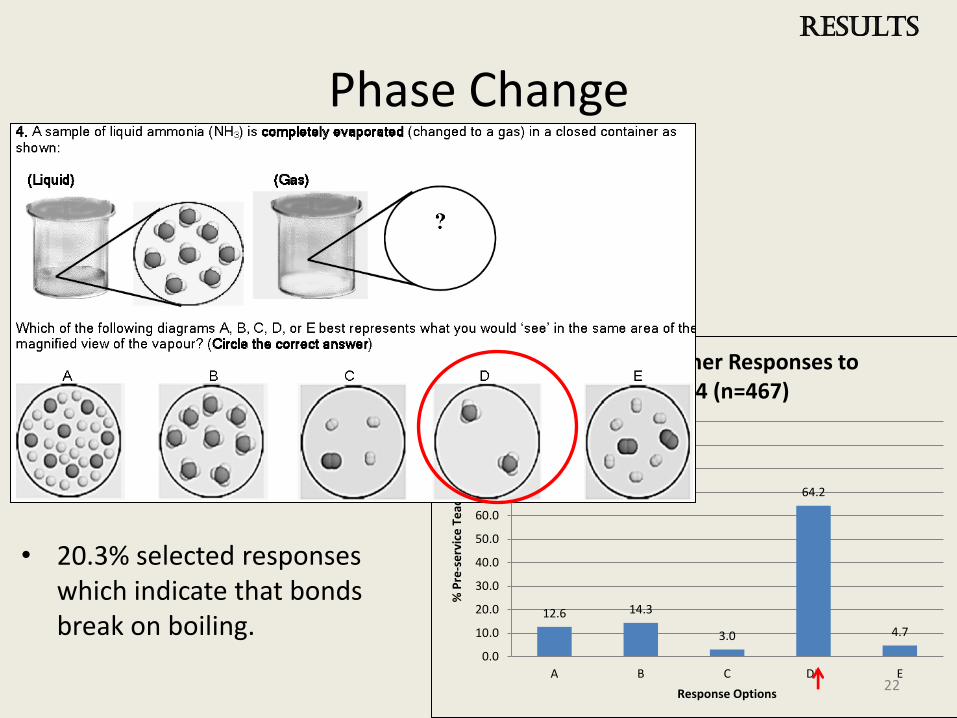
Pre-service Teacher Responses to Question 4 (n=467)
Phase Change
• 20.3% selected responses which indicate that bonds break on boiling.
Results
22
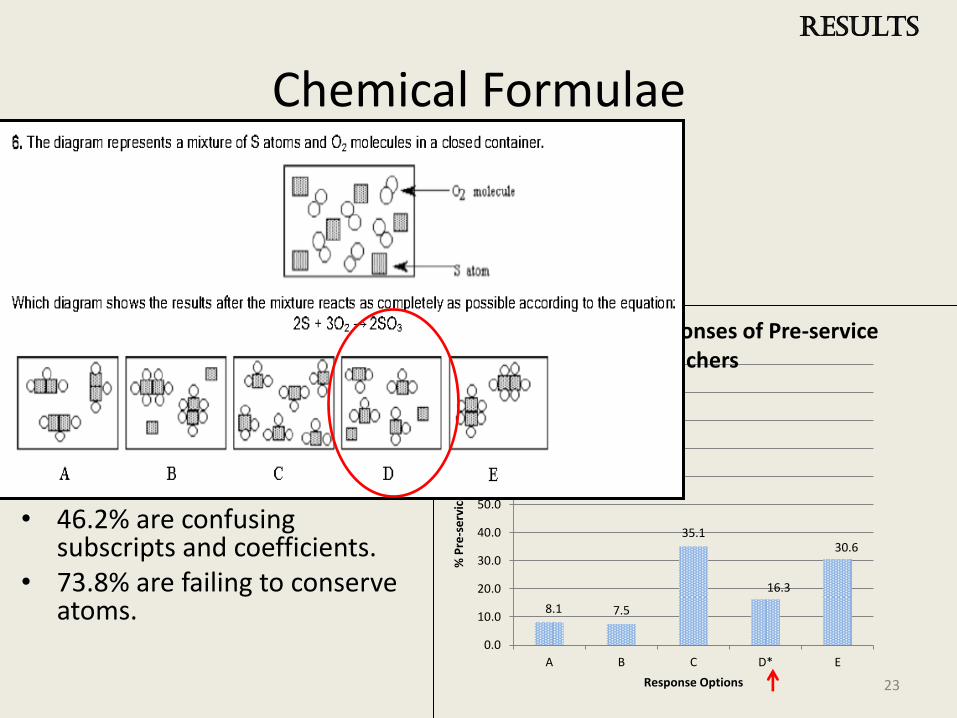
Chemical Formulae
• 46.2% are confusing subscripts and coefficients.
• 73.8% are failing to conserve atoms. 8.1 7.5
35.1
16.3
30.6
0.0
10.0
20.0
30.0
40.0
50.0
60.0
70.0
80.0
90.0
100.0
A B C D* E
% P
re-s
erv
ice
Te
ach
ers
Response Options
Question 6: Responses of Pre-service Teachers
Results
23

Energetics of Bonding
• 64.3% selected answers indicating that the breaking of bonds releases energy.
20.6 11.6
18.6
32.1
12.8
0.0
10.0
20.0
30.0
40.0
50.0
60.0
70.0
80.0
90.0
100.0
A B C* D E
% P
re-s
erv
ice
Te
ach
ers
Response Options
Pre-service Teachers Understanding of Energetics of Bonding (n = 467)
Results
24
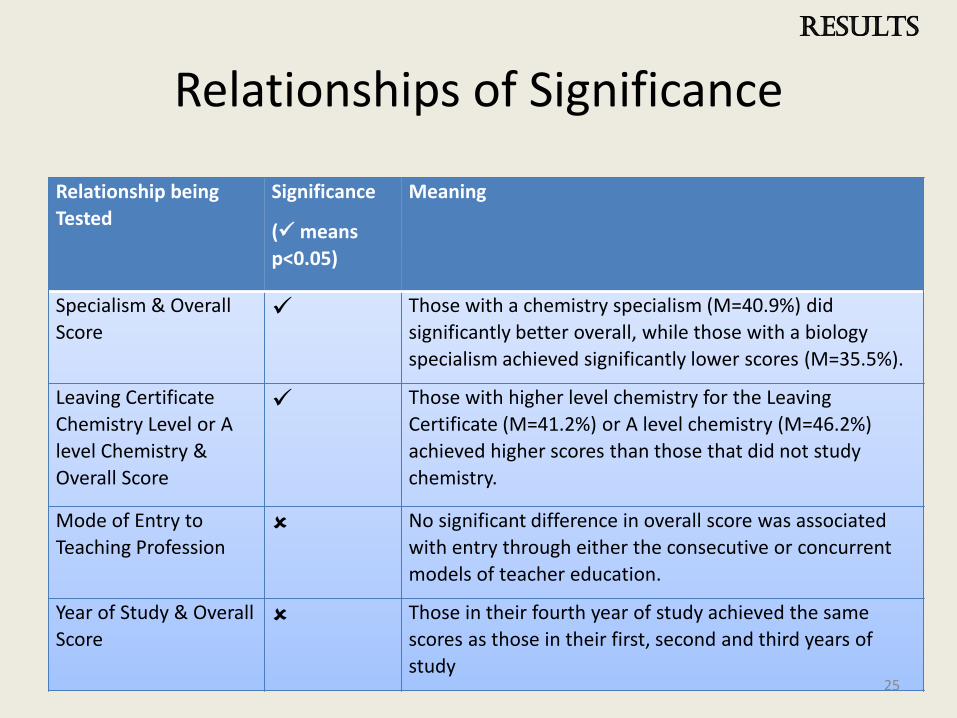
Relationships of Significance
Relationship being
Tested
Significance
( means
p<0.05)
Meaning
Specialism & Overall
Score Those with a chemistry specialism (M=40.9%) did
significantly better overall, while those with a biology
specialism achieved significantly lower scores (M=35.5%).
Leaving Certificate
Chemistry Level or A
level Chemistry &
Overall Score
Those with higher level chemistry for the Leaving
Certificate (M=41.2%) or A level chemistry (M=46.2%)
achieved higher scores than those that did not study
chemistry.
Mode of Entry to
Teaching Profession
No significant difference in overall score was associated
with entry through either the consecutive or concurrent
models of teacher education.
Year of Study & Overall
Score
Those in their fourth year of study achieved the same
scores as those in their first, second and third years of
study
Results
25
Conclusion

Key Findings
27
• Chemistry misconceptions are widespread among Irish pre-service science teachers.
• Mode of entry to the teaching profession has no significant impact on the number of misconceptions.
• These misconceptions are not reduced or altered significantly over the course of a four-year concurrent programme.
• PSSTs chosen specialism and their previous second-level chemistry experience were found to have significant impact on the number of misconceptions.
• Limitations include:
– semi-longitudinal nature of study, and
– the lack of homogeneity e.g. entry standards.
Conclusions • Science teacher education programmes appear to have
little effect on the chemistry misconceptions of pre-service science teachers.
• The programmes do not appear to produce pre-service teachers with sufficient subject matter knowledge to effectively address the misconceptions of their future students.
• Possible reasons for this include: – the manner in which university chemistry modules are taught, – how these chemistry modules are assessed, – lack of time to address these issues in science pedagogy modules, and – lack of integration between science courses and science pedagogy.
• This study highlights the need to address the chemistry misconceptions of pre-service science teachers early and often.
Conclusions
28
Implications & Future Work
• Why do the pre-service science teachers’ chemistry misconceptions remain unchanged over the course of their studies?
– textbooks, lecture style, cognitive level, science pedagogy
• What are appropriate strategies & teaching materials for reducing these misconceptions
– for pre-service science teachers and
– for in-service science teachers?
Implications & Future Work
29
Acknowledgements
This project has been funded by the Irish Research Council for Science, Engineering and Technology.
All institutions for allowing their student teachers to be surveyed.
Experts who reviewed the test and kindly offered advice over the last 2 years: Dr. Vanessa Kind, Prof. Dr. David DiFuccia, Dr. Rob Toplis, Dr. Jane
Essex, and Stephen Krause.
This project has been supported by The Department of Chemical and Environmental Sciences, University of
Limerick &
The National Centre for Excellence in Mathematics and Science Teaching and Learning, University of Limerick
30
References
• Abell, S. K. (2007). Research on science teachers' knowledge. In S. K. Abell & N. G. Lederman (Eds.), Handbook of Research on Science Education (pp. 1105–1149), Mahwah, New Jersey: Lawrence Erlbaum Associates.
• Barber, M. and Mourshed, M. (2007) How the world's best-performing school systems come out on top, McKinsey & Co.
• Cakmakci, G. (2010) 'Identifying Alternative Conceptions of Chemical Kinetics among Secondary School and Undergraduate Students in Turkey', Journal of chemical education, 87(4), 449-455.
• Calik, M. and Ayas, A. (2005) 'A Comparison of Level of Understanding of Eight-Grade Students and Science Student Teachers Related to Selected Chemistry Concepts', Journal of Research in Science Teaching, 42(6), 638-667.
• Clement, J. (1982) 'Students' Preconceptions in Introductory Mechanics', American Journal of Physics, 50(1), 66-71.
• Coll, R.K. and Treagust, D.F. (2003) 'Investigation of secondary school, undergraduate, and graduate learners' mental models of ionic bonding', Journal of Research in Science Teaching, 40(5), 464-486.
• Gabel, D. (1999) 'Improving Teaching and Learning through Chemistry Education Research: A Look to the Future', Journal of chemical education, 76(4), 548-54.
• Holt-Reynolds, D. (1992) 'Personal History-Based Beliefs as Relevant Prior Knowledge in Course Work', American Educational Research Journal, 29(2), 325-349.
• Johnstone, A.H. (2006) 'Chemical Education Research in Glasgow in Perspective', CHEMISTRY EDUCATION RESEARCH AND PRACTICE, 7(2), 49-63.
• Kind, V. (2004) Beyond appearances: Students' misconceptions about basic chemical ideas, 2nd ed., London: Royal Society of Chemistry.
• Krause, S., Birk, J., Bauer, R., Jenkins, B. and Pavelich, M.J. (2004) 'Development, testing, and application of a chemistry concept inventory', Proceedings - Frontiers in Education Conference, FIE, 1 T1G-1.
• Kruse, R.A. and Roehrig, G.H. (2005) 'A Comparison Study: Assessing Teachers' Conceptions with the Chemistry Concepts Inventory', Journal of chemical education, 82(8), 1246-50.
• McCormack, L. (2009) ‘Cognitive acceleration across the primary-second level transition’, unpublished thesis (Ph.D.), Dublin City University available:http://doras.dcu.ie/14886/ [accessed 24 April 2010]
31

Appendix
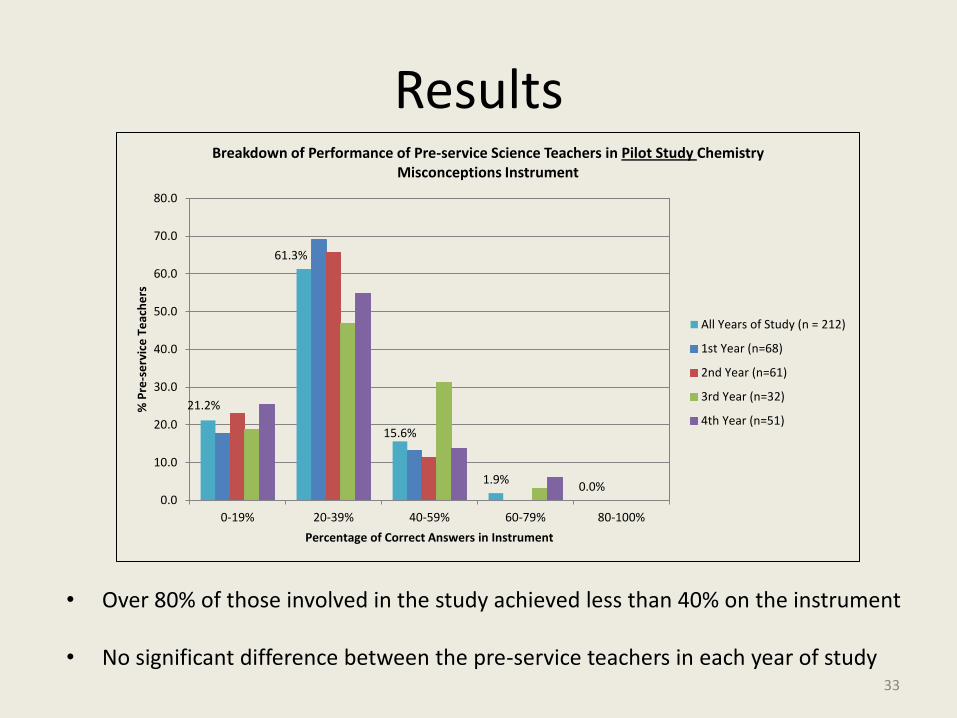
Results
• Over 80% of those involved in the study achieved less than 40% on the instrument • No significant difference between the pre-service teachers in each year of study
21.2%
61.3%
15.6%
1.9% 0.0%
0.0
10.0
20.0
30.0
40.0
50.0
60.0
70.0
80.0
0-19% 20-39% 40-59% 60-79% 80-100%
% P
re-s
erv
ice
Te
ach
ers
Percentage of Correct Answers in Instrument
Breakdown of Performance of Pre-service Science Teachers in Pilot Study Chemistry Misconceptions Instrument
All Years of Study (n = 212)
1st Year (n=68)
2nd Year (n=61)
3rd Year (n=32)
4th Year (n=51)
33

Results: Pilot Study
Concept Area Mean Percentage % Not Attempting Section
Particulate Nature of Matter
28.2% 0
Stoichiometry & Mole 43.0% 0.5
Chemical Bonding 32.7% 1.4
Equilibrium 31.1% 0.9
Total 30.8% 0
• All areas poorly understood
• PNM most poorly understood conceptual area
34
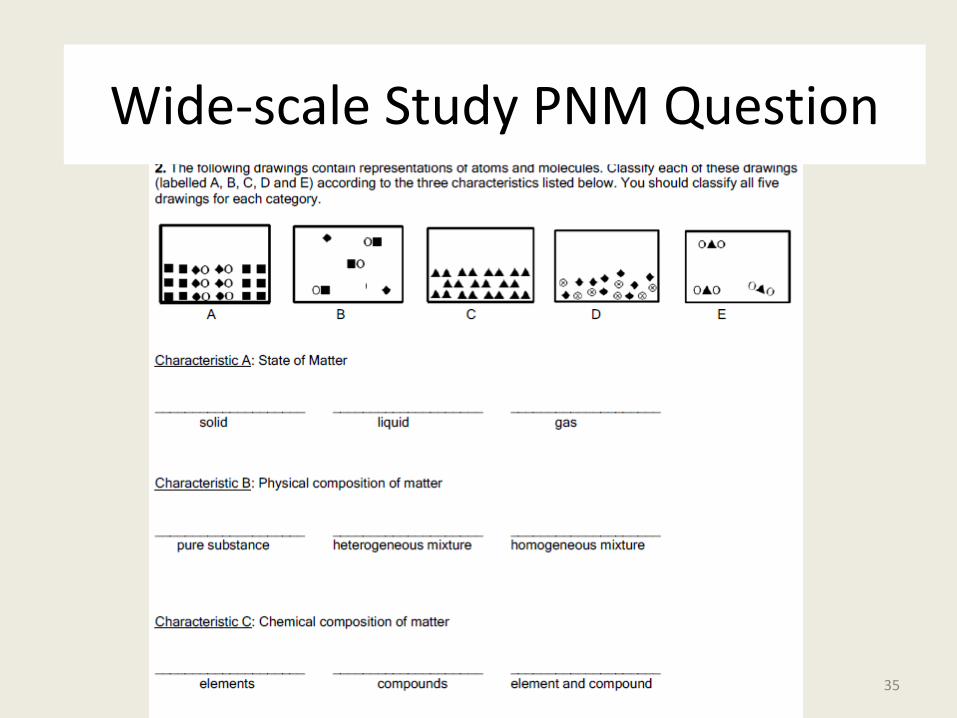
Pilot Study PNM Question Wide-scale Study PNM Question
35
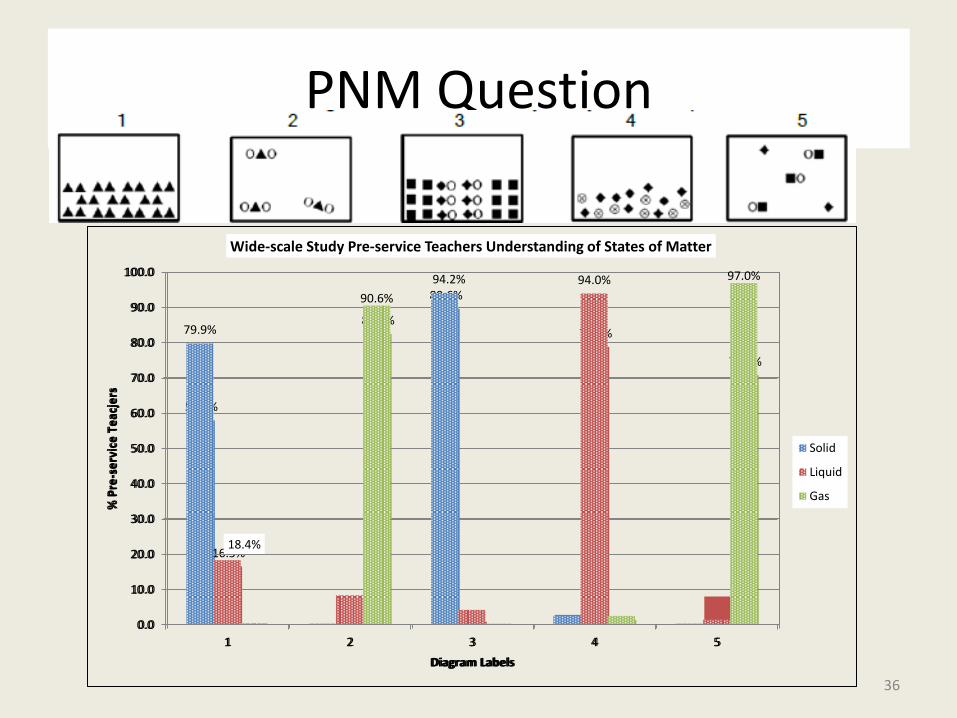
PNM Question
58.0%
89.6%
16.5%
78.8% 82.5%
70.8%
0.0
10.0
20.0
30.0
40.0
50.0
60.0
70.0
80.0
90.0
100.0
1 2 3 4 5
% P
re-s
erv
ice
Te
acje
rs
Diagram Labels
Pilot Study Preservice Teachers Understanding of States of Matter
Solid
Liquid
Gas
79.9%
94.2%
18.4%
94.0%
90.6%
97.0%
0.0
10.0
20.0
30.0
40.0
50.0
60.0
70.0
80.0
90.0
100.0
1 2 3 4 5
% P
re-s
erv
ice
Te
acje
rs
Diagram Labels
Wide-scale Study Pre-service Teachers Understanding of States of Matter
Solid
Liquid
Gas
36

PNM Question
74.5 17.9 56.6
26.4 30.2 20.3 13.7 47.6
16.0 44.3
0.0
10.0
20.0
30.0
40.0
50.0
60.0
70.0
80.0
90.0
100.0
1 2 3 4 5
% P
re-s
erv
ice
Te
ach
ers
Diagram Labels
Pilot-scale Study Pre-service Teachers Understanding of Chemical Composition of Matter
Elements
Compounds
Elements &Compounds
90.1
61.2
83.7
22.5
15.0 11.1
71.9
22.5
83.7
0.0
10.0
20.0
30.0
40.0
50.0
60.0
70.0
80.0
90.0
100.0
1 2 3 4 5
% P
re-s
erv
ice
Te
ach
ers
Diagram Labels
Wide-scale Study Pre-service Teachers Understanding of Chemical Composition of Matter
Elements
Compounds
Elements &Compounds
37


![EDUCATIONAL QUALITY AND ASSESSMENT PROGRAMME [EQAP ]](https://img.pdfslide.us/doc/110x75/61f3bd8dc596167a3b513314/educational-quality-and-assessment-programme-eqap-.jpg)


![EDUCATIONAL QUALITY AND ASSESSMENT PROGRAMME [EQAP]](https://img.pdfslide.us/doc/110x75/618182ffa62e0458703dd4a0/educational-quality-and-assessment-programme-eqap.jpg)