Embed Size (px)
Citation preview
The Quadruple Aim: Working Together, Achieving Success
2011 Military Health System Conference
OSD(Health Affairs); Health Budgets & Financial Policy
Current & Future Prospective Payment System
Sep 2011
Program Review and Evaluation
TRICARE Data Quality Course
The Quadruple Aim: Working Together, Achieving Success
2011 MHS Conference
Resourcing the Direct Care System for Value
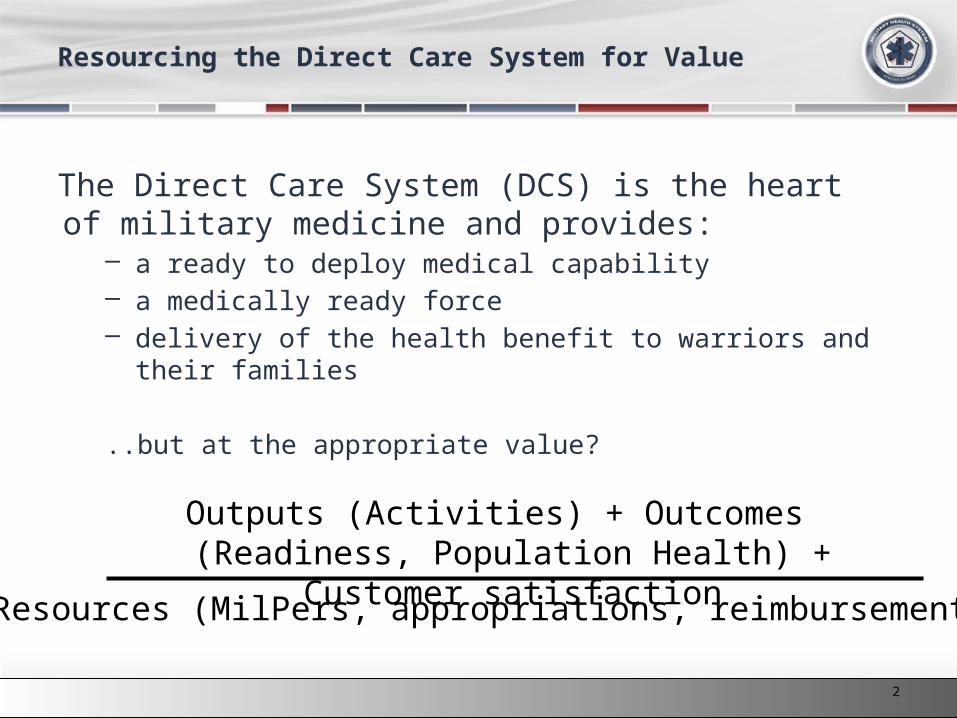
The Direct Care System (DCS) is the heart of military medicine and provides:
– a ready to deploy medical capability– a medically ready force– delivery of the health benefit to warriors and their families
..but at the appropriate value?
Outputs (Activities) + Outcomes (Readiness, Population Health) + Customer satisfaction
Resources (MilPers, appropriations, reimbursements)
2
2011 MHS Conference
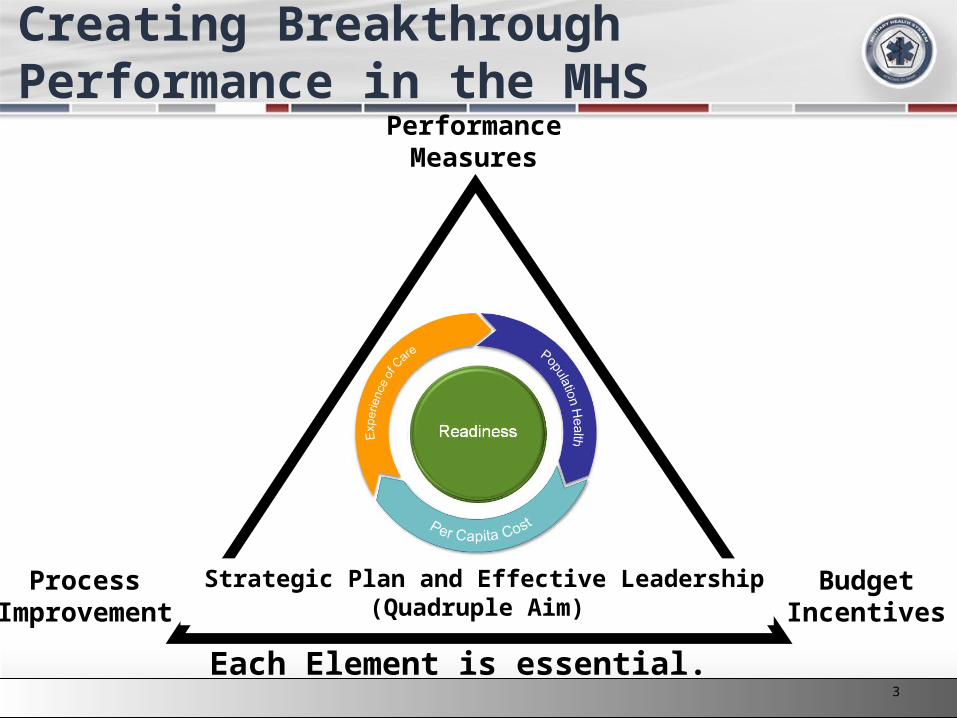
Creating Breakthrough Performance in the MHS
PerformanceMeasures
ProcessImprovement
BudgetIncentives
Strategic Plan and Effective Leadership(Quadruple Aim)
Each Element is essential.3
2011 MHS Conference
Agenda
Current Prospective Payment System Future Prospective Payment System??
– Performance Based Planning Pilots Issues to consider for Data Quality
4
2011 MHS Conference
Background
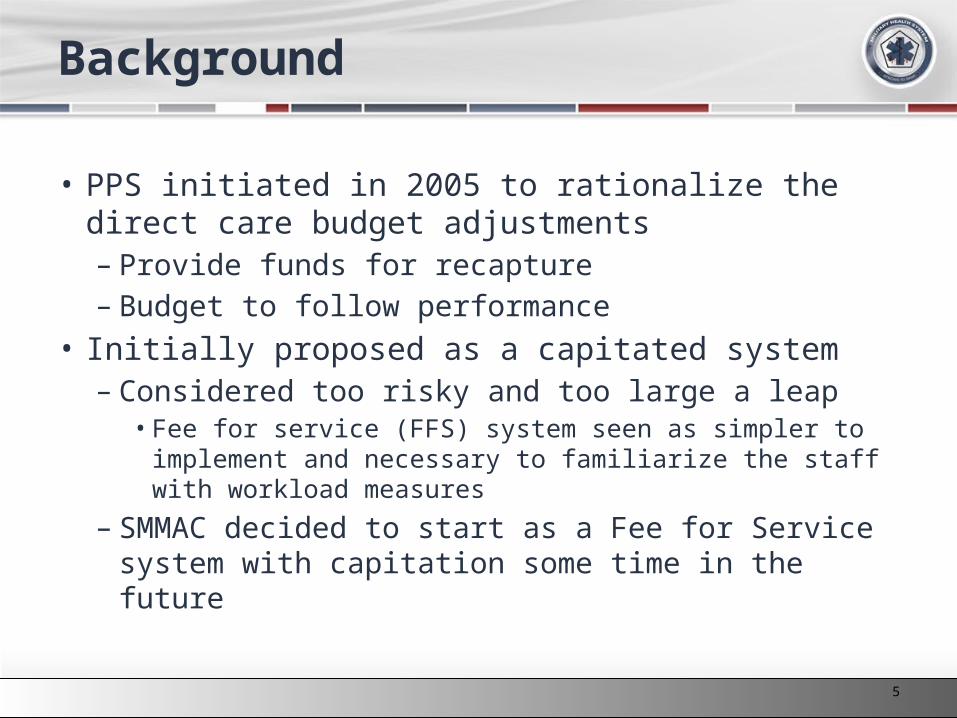
• PPS initiated in 2005 to rationalize the direct care budget adjustments– Provide funds for recapture– Budget to follow performance
• Initially proposed as a capitated system– Considered too risky and too large a leap
• Fee for service (FFS) system seen as simpler to implement and necessary to familiarize the staff with workload measures
– SMMAC decided to start as a Fee for Service system with capitation some time in the future
5
2011 MHS Conference
Background (cont.)
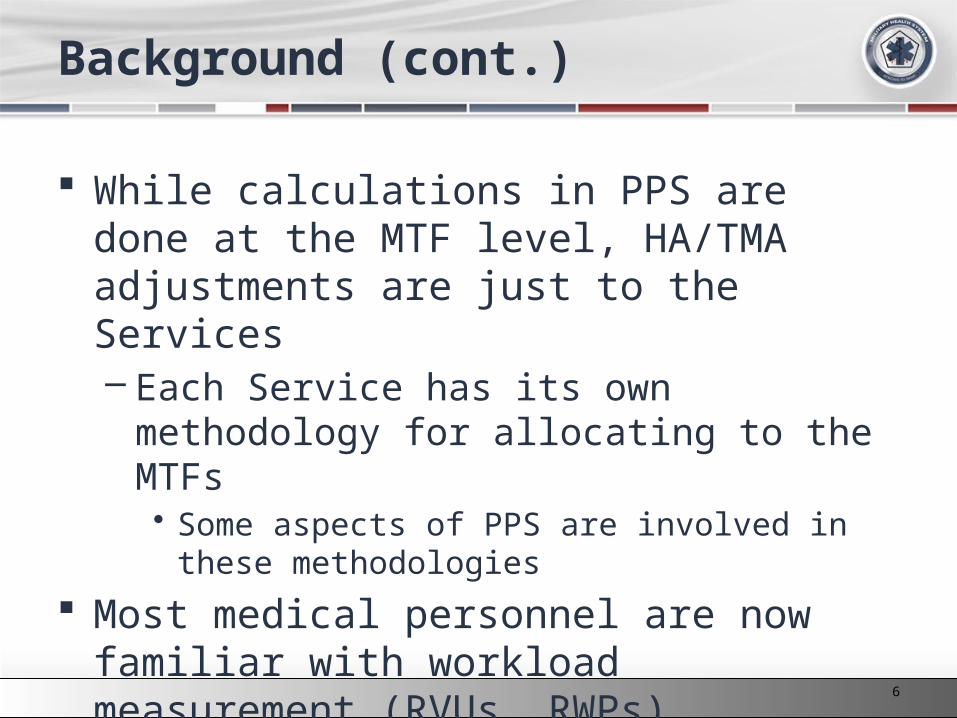
While calculations in PPS are done at the MTF level, HA/TMA adjustments are just to the Services– Each Service has its own methodology for
allocating to the MTFs• Some aspects of PPS are involved in these
methodologies
Most medical personnel are now familiar with workload measurement (RVUs, RWPs)
6
2011 MHS Conference
PPS Value of Care
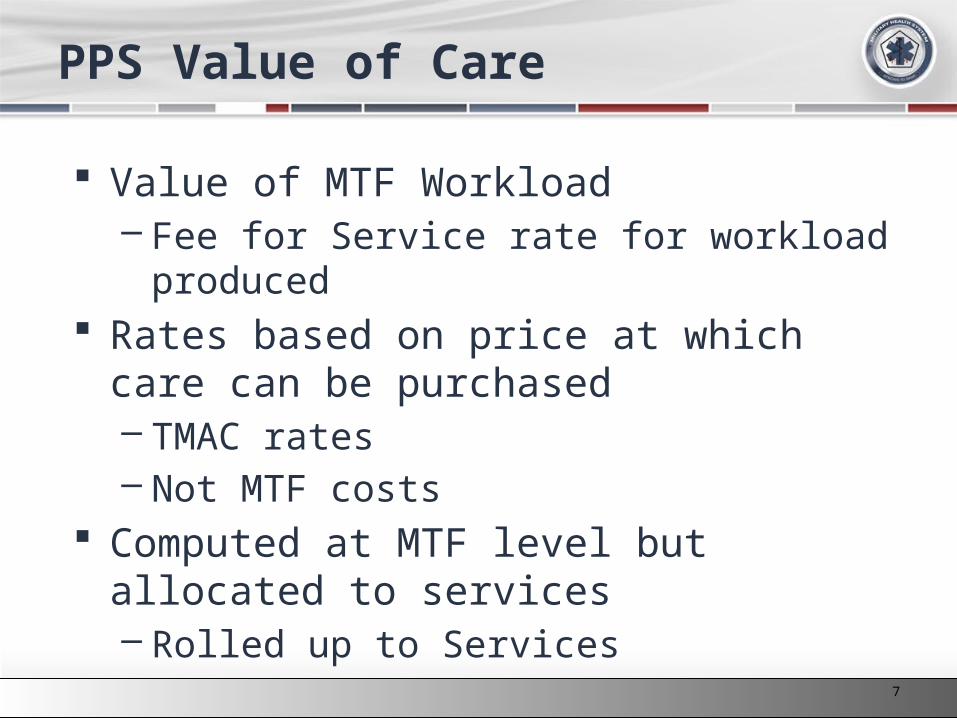
Value of MTF Workload– Fee for Service rate for workload produced
Rates based on price at which care can be purchased– TMAC rates– Not MTF costs
Computed at MTF level but allocated to services– Rolled up to Services
7
2011 MHS Conference
TMAC versus PPS
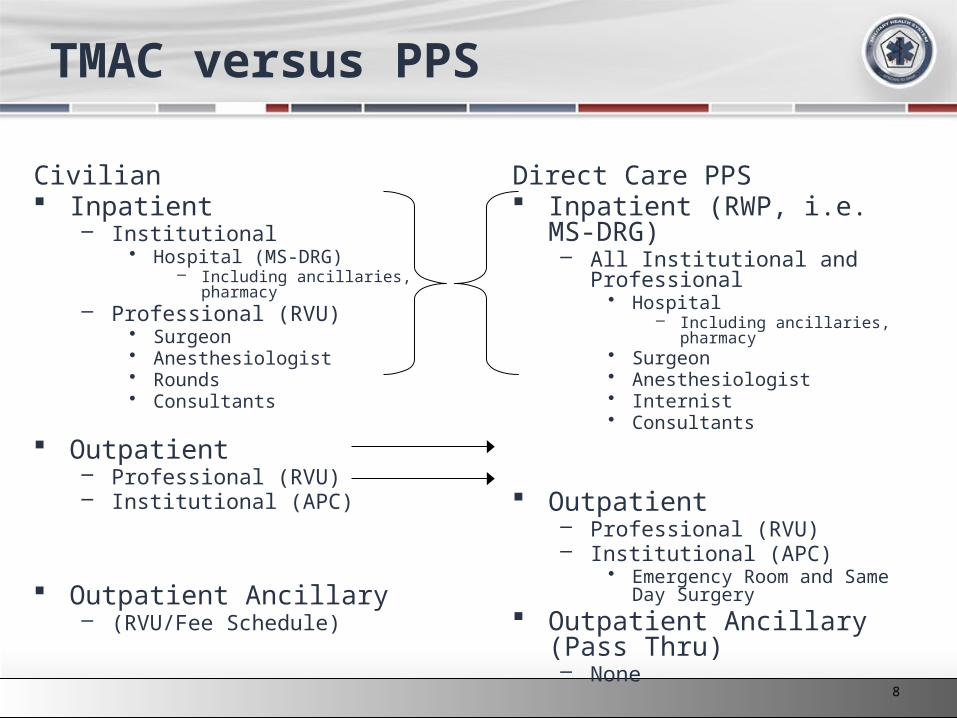
Civilian Inpatient
– Institutional• Hospital (MS-DRG)
– Including ancillaries, pharmacy– Professional (RVU)
• Surgeon• Anesthesiologist• Rounds• Consultants
Outpatient– Professional (RVU)– Institutional (APC)
Outpatient Ancillary – (RVU/Fee Schedule)
Direct Care PPS Inpatient (RWP, i.e. MS-DRG)
– All Institutional and Professional• Hospital
– Including ancillaries, pharmacy• Surgeon• Anesthesiologist• Internist• Consultants
Outpatient – Professional (RVU)– Institutional (APC)
• Emergency Room and Same Day Surgery
Outpatient Ancillary (Pass Thru)– None
8
2011 MHS Conference
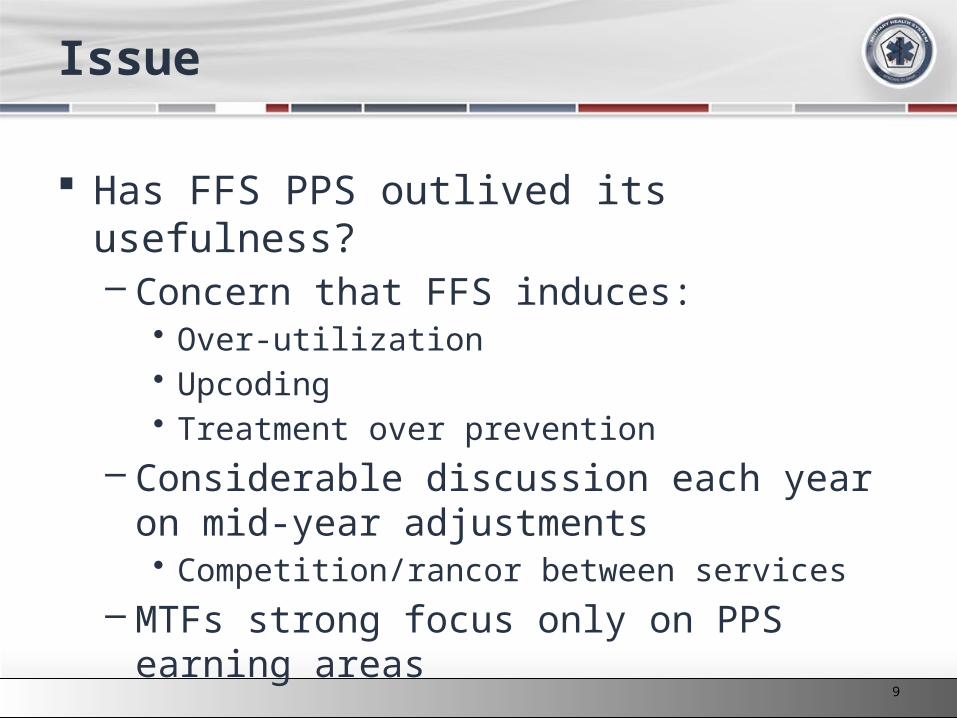
Issue
Has FFS PPS outlived its usefulness?– Concern that FFS induces:
• Over-utilization• Upcoding• Treatment over prevention
– Considerable discussion each year on mid-year adjustments• Competition/rancor between services
– MTFs strong focus only on PPS earning areas
9
2011 MHS Conference
Future Prospective Payment System??
Performance-Based Planning
10
2011 MHS Conference
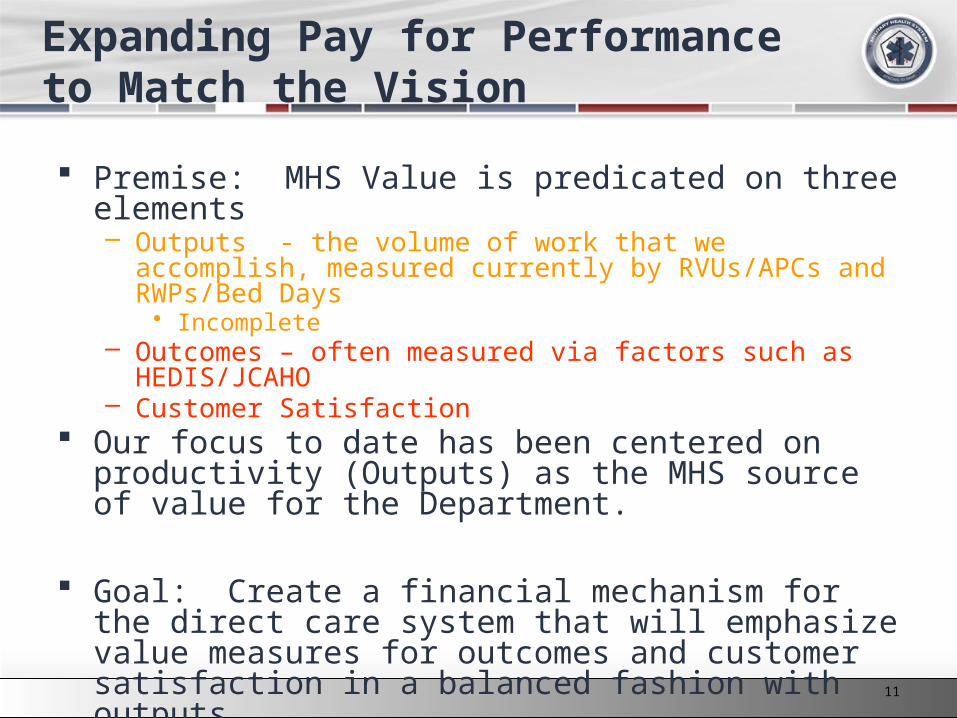
Expanding Pay for Performance to Match the Vision
Premise: MHS Value is predicated on three elements– Outputs - the volume of work that we accomplish, measured
currently by RVUs/APCs and RWPs/Bed Days • Incomplete
– Outcomes – often measured via factors such as HEDIS/JCAHO – Customer Satisfaction
Our focus to date has been centered on productivity (Outputs) as the MHS source of value for the Department.
Goal: Create a financial mechanism for the direct care system that will emphasize value measures for outcomes and customer satisfaction in a balanced fashion with outputs
11
2011 MHS Conference
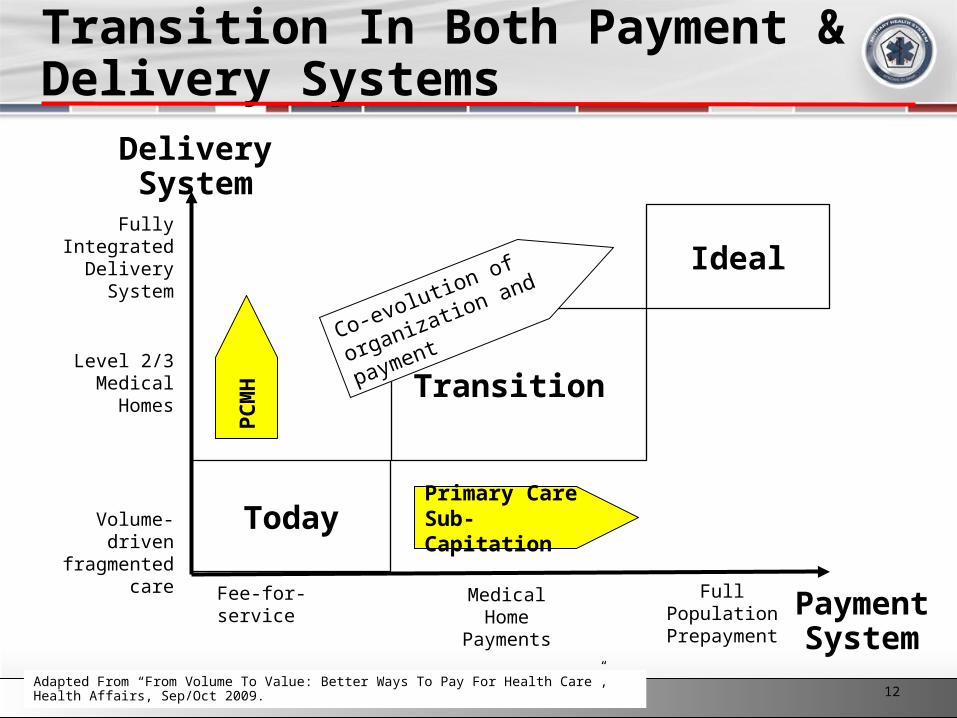
Transition In Both Payment & Delivery Systems
Today
Payment System
Adapted From “From Volume To Value: Better Ways To Pay For Health Care”, Health Affairs, Sep/Oct 2009.
Delivery System
Transition
IdealFully Integrated
Delivery System
Volume-drivenfragmented care
Fee-for-service Medical HomePayments
Full PopulationPrepayment
Co-evolution of
organization and payment
Primary Care Sub-Capitation
PC
MH
Level 2/3 Medical Homes
12
2011 MHS Conference
Performance Planning Integrated Project Team
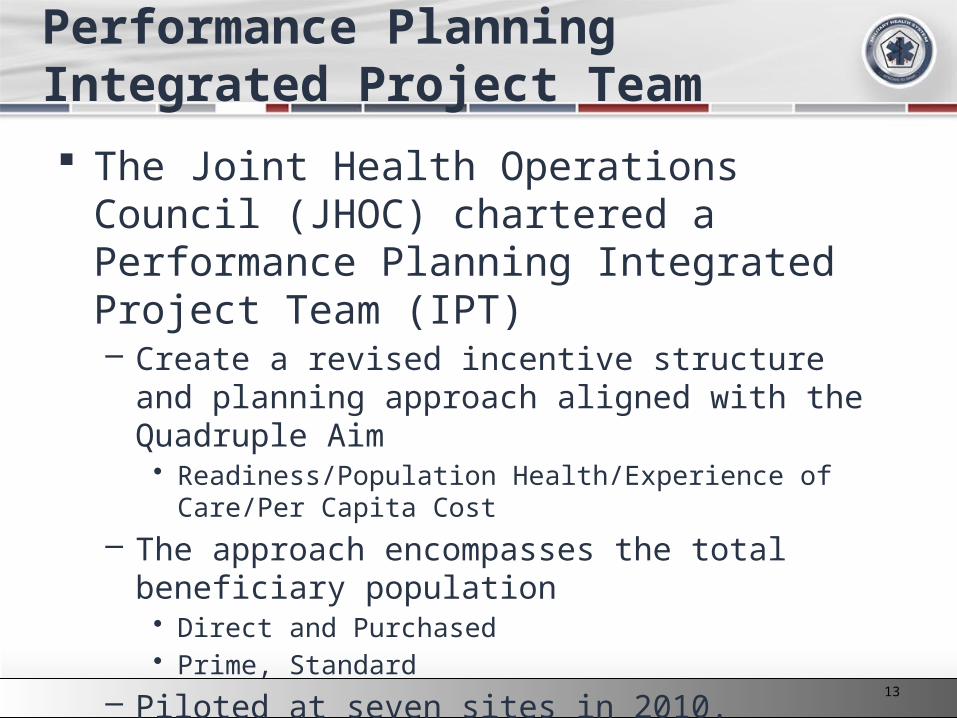
The Joint Health Operations Council (JHOC) chartered a Performance Planning Integrated Project Team (IPT) – Create a revised incentive structure and planning
approach aligned with the Quadruple Aim• Readiness/Population Health/Experience of Care/Per Capita
Cost
– The approach encompasses the total beneficiary population• Direct and Purchased• Prime, Standard
– Piloted at seven sites in 2010.
13
2011 MHS Conference
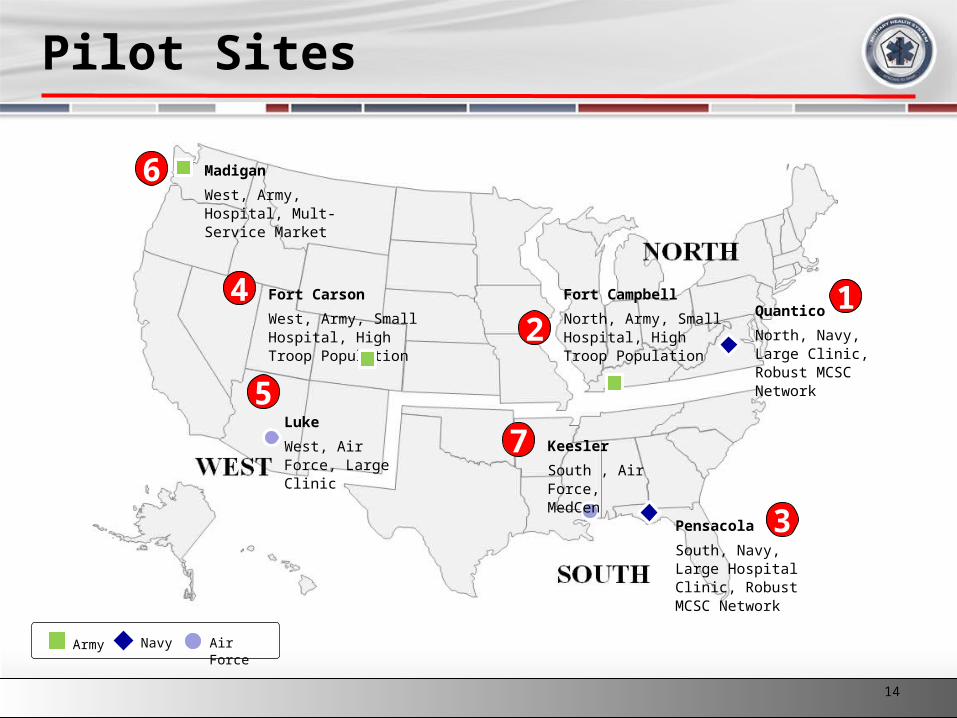
Pilot Sites
Luke
West, Air Force, Large Clinic
Pensacola
South, Navy, Large Hospital Clinic, Robust MCSC Network
Fort Carson
West, Army, Small Hospital, High Troop Population
Fort Campbell
North, Army, Small Hospital, High Troop Population
Quantico
North, Navy, Large Clinic, Robust MCSC Network
Air ForceArmy Navy
42
3
1
5
6 Madigan
West, Army, Hospital, Mult-Service Market
Keesler
South , Air Force, MedCen
7
14
2011 MHS Conference
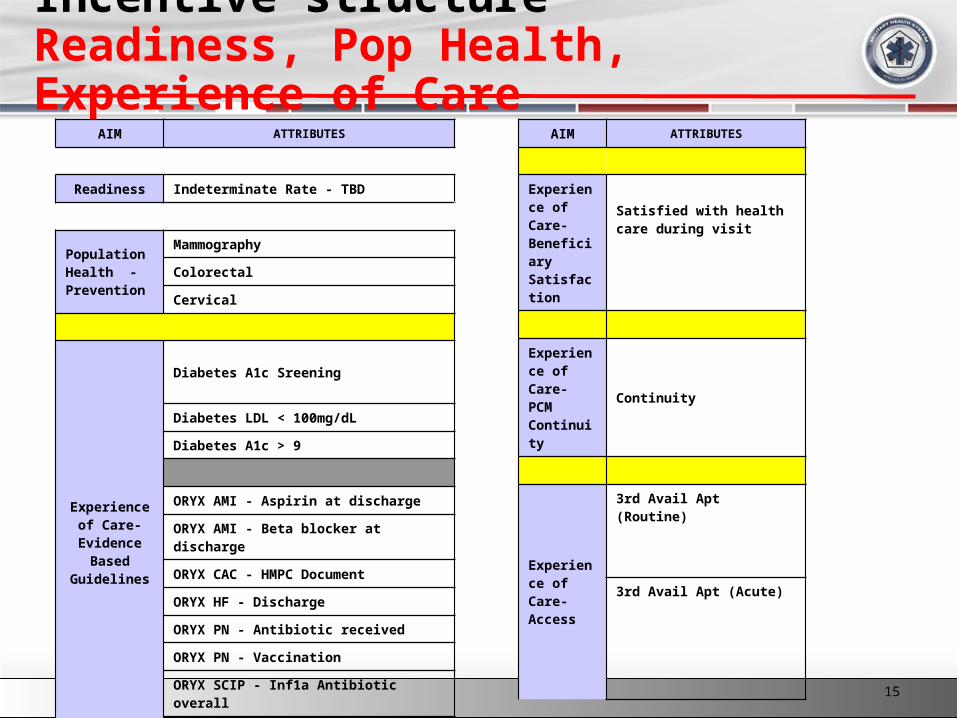
Incentive structureReadiness, Pop Health, Experience of Care
AIM ATTRIBUTES
Readiness Indeterminate Rate - TBD
Population Health - Prevention
Mammography
Colorectal
Cervical
Experience of Care- Evidence
Based Guidelines
Diabetes A1c Sreening
Diabetes LDL < 100mg/dL
Diabetes A1c > 9
ORYX AMI - Aspirin at discharge
ORYX AMI - Beta blocker at discharge
ORYX CAC - HMPC Document
ORYX HF - Discharge
ORYX PN - Antibiotic received
ORYX PN - Vaccination
ORYX SCIP - Inf1a Antibiotic overall
ORYX SCIP - Inf3A Antibiotic dc
AIM ATTRIBUTES
Experience of Care- Beneficiary Satisfaction
Satisfied with health care during visit
Experience of Care- PCM Continuity
Continuity
Experience of Care- Access
3rd Avail Apt (Routine)
3rd Avail Apt (Acute)
15
2011 MHS Conference
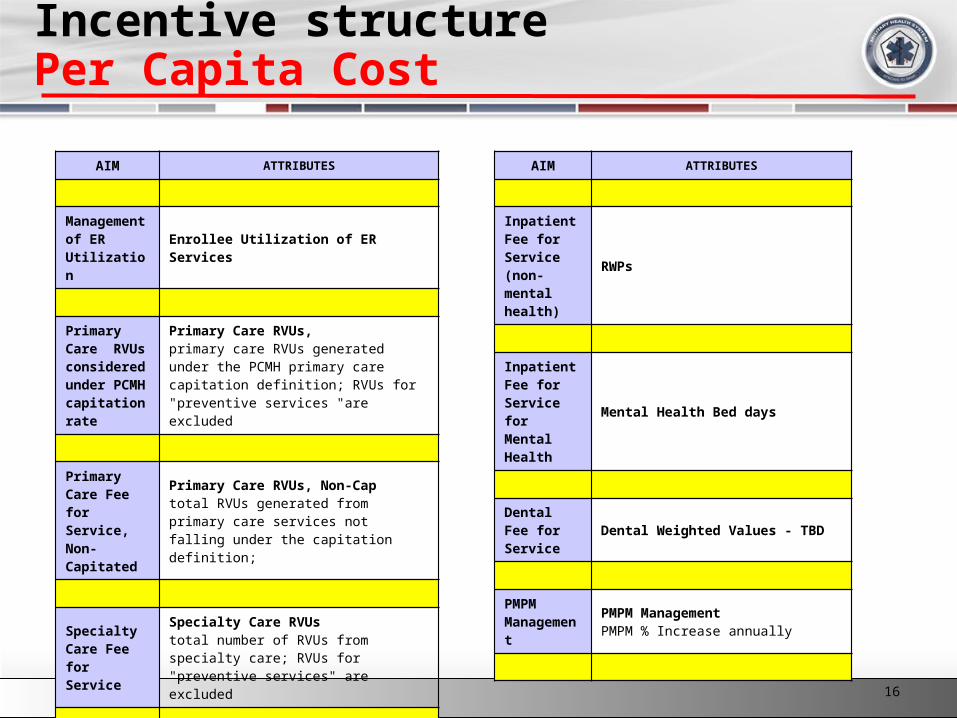
AIM ATTRIBUTES
Management of ER Utilization
Enrollee Utilization of ER Services
Primary Care RVUs considered under PCMH capitation rate
Primary Care RVUs, primary care RVUs generated under the PCMH primary care capitation definition; RVUs for "preventive services "are excluded
Primary Care Fee for Service, Non-Capitated
Primary Care RVUs, Non-Captotal RVUs generated from primary care services not falling under the capitation definition;
Specialty Care Fee for Service
Specialty Care RVUstotal number of RVUs from specialty care; RVUs for "preventive services" are excluded
Outpatient Facility Fee for Service
Ambulatory Payment Classification (APCs) (facility fee for ER and ambulatory surgical services)
Incentive structurePer Capita Cost
AIM ATTRIBUTES
Inpatient Fee for Service (non-mental health)
RWPs
Inpatient Fee for Service for Mental Health
Mental Health Bed days
Dental Fee for Service Dental Weighted Values - TBD
PMPM Management
PMPM Management PMPM % Increase annually
16
2011 MHS Conference
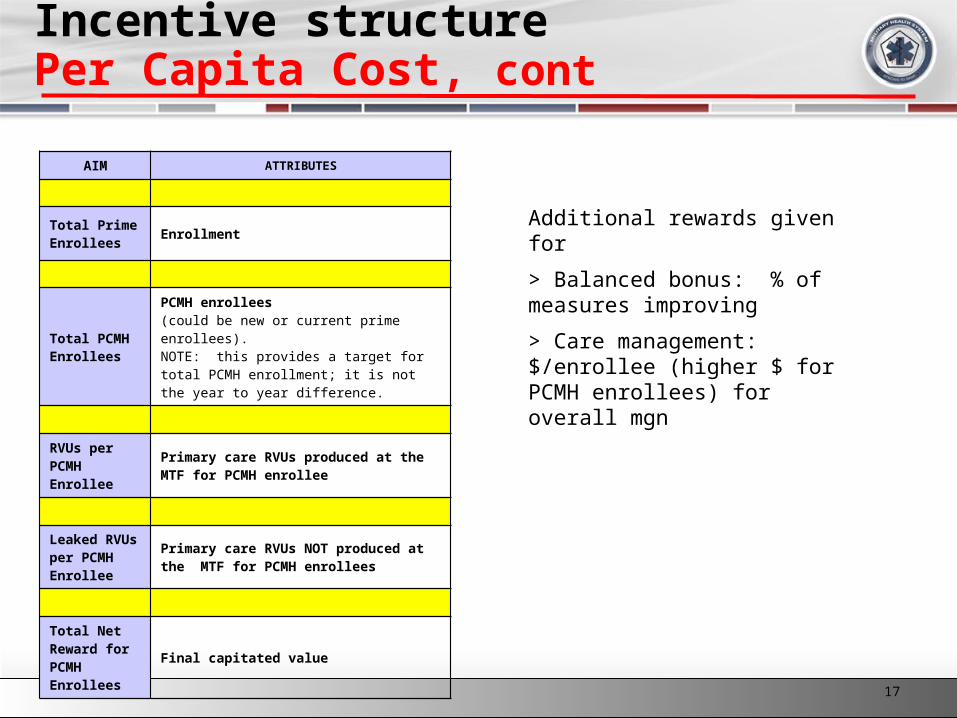
AIM ATTRIBUTES
Total Prime Enrollees Enrollment
Total PCMH Enrollees
PCMH enrollees (could be new or current prime enrollees). NOTE: this provides a target for total PCMH enrollment; it is not the year to year difference.
RVUs per PCMH Enrollee
Primary care RVUs produced at the MTF for PCMH enrollee
Leaked RVUs per PCMH Enrollee
Primary care RVUs NOT produced at the MTF for PCMH enrollees
Total Net Reward for PCMH Enrollees
Final capitated value
Additional rewards given for
> Balanced bonus: % of measures improving
> Care management: $/enrollee (higher $ for PCMH enrollees) for overall mgn
Incentive structurePer Capita Cost, cont
17
2011 MHS Conference
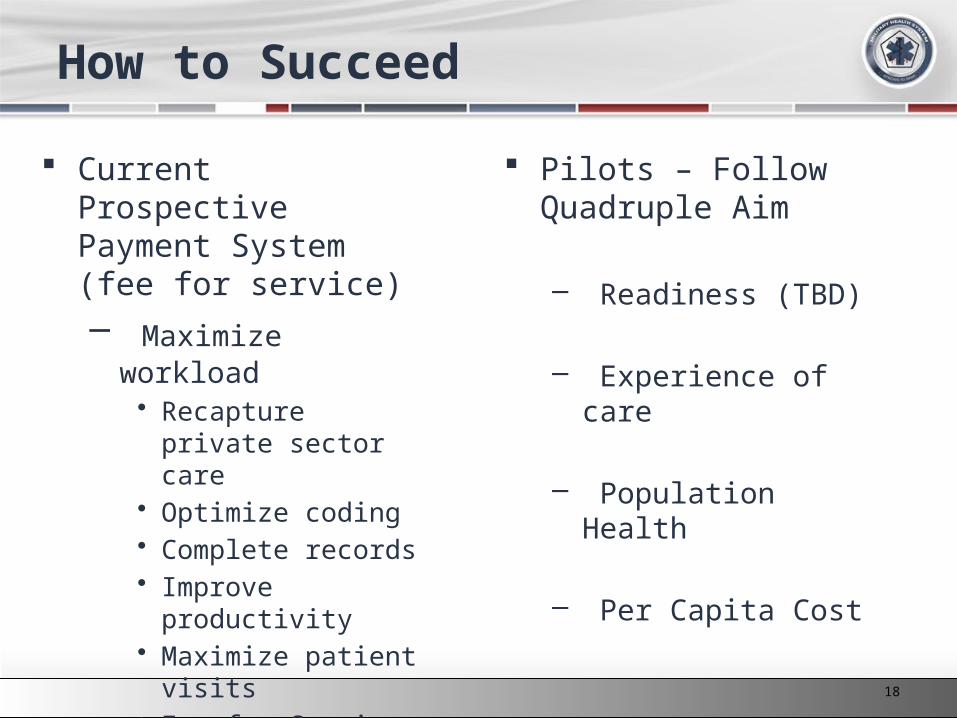
How to Succeed
Current Prospective Payment System (fee for service)
– Maximize workload• Recapture private
sector care• Optimize coding• Complete records• Improve productivity• Maximize patient visits• Fee for Service rate
for workload produced
Pilots – Follow Quadruple Aim
– Readiness (TBD)
– Experience of care
– Population Health
– Per Capita Cost
18
2011 MHS Conference
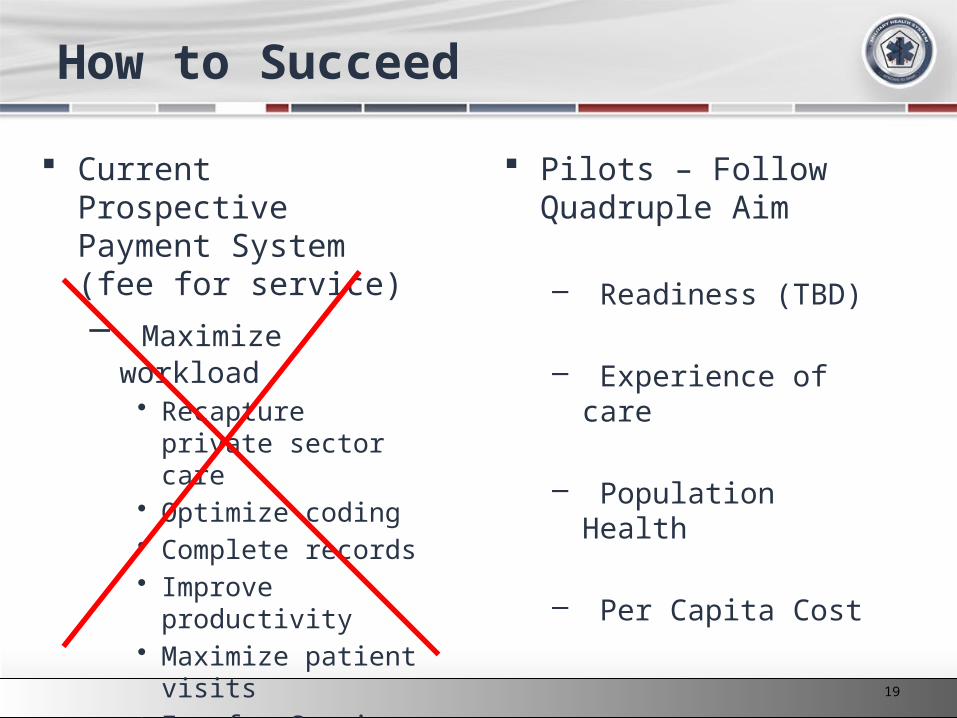
How to Succeed
Current Prospective Payment System (fee for service)
– Maximize workload• Recapture private
sector care• Optimize coding• Complete records• Improve productivity• Maximize patient visits• Fee for Service rate
for workload produced
Pilots – Follow Quadruple Aim
– Readiness (TBD)
– Experience of care
– Population Health
– Per Capita Cost
19
2011 MHS Conference
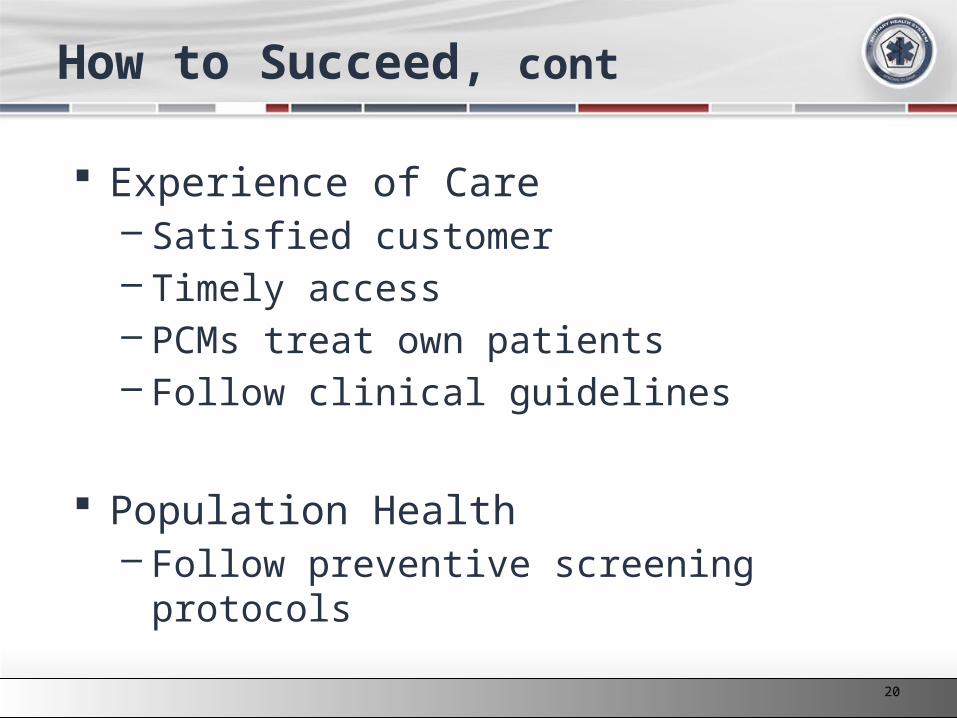
How to Succeed, cont
Experience of Care– Satisfied customer– Timely access– PCMs treat own patients– Follow clinical guidelines
Population Health– Follow preventive screening protocols
20
2011 MHS Conference
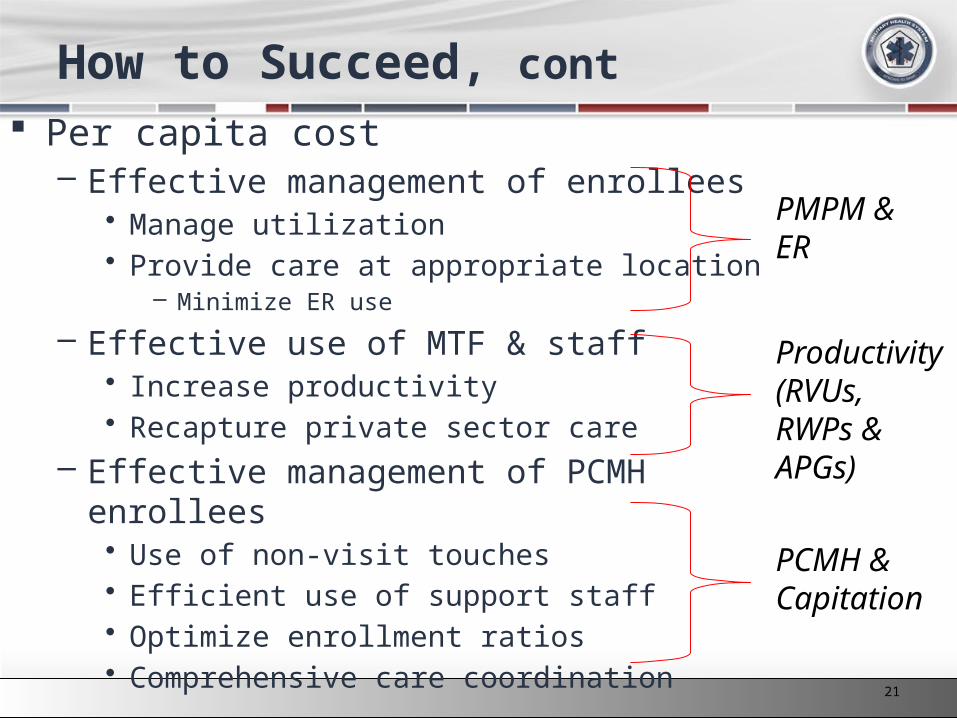
How to Succeed, cont
Per capita cost– Effective management of enrollees
• Manage utilization• Provide care at appropriate location
– Minimize ER use
– Effective use of MTF & staff• Increase productivity• Recapture private sector care
– Effective management of PCMH enrollees• Use of non-visit touches • Efficient use of support staff• Optimize enrollment ratios• Comprehensive care coordination
PMPM & ER
Productivity (RVUs, RWPs & APGs)
PCMH & Capitation
21
2011 MHS Conference
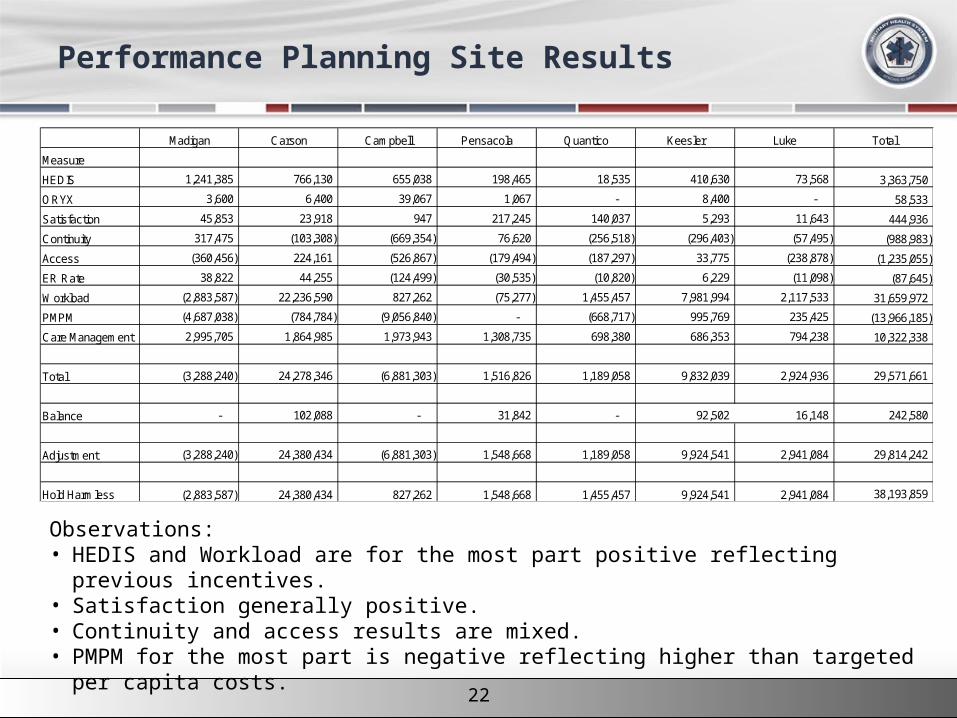
Performance Planning Site Results
22
Madigan Carson Campbell Pensacola Quantico Keesler Luke Total
Measure
HEDIS 1,241,385 766,130 655,038 198,465 18,535 410,630 73,568 3,363,750
ORYX 3,600 6,400 39,067 1,067 - 8,400 - 58,533
Satisfaction 45,853 23,918 947 217,245 140,037 5,293 11,643 444,936
Continuity 317,475 (103,308) (669,354) 76,620 (256,518) (296,403) (57,495) (988,983)
Access (360,456) 224,161 (526,867) (179,494) (187,297) 33,775 (238,878) (1,235,055)
ER Rate 38,822 44,255 (124,499) (30,535) (10,820) 6,229 (11,098) (87,645)
Workload (2,883,587) 22,236,590 827,262 (75,277) 1,455,457 7,981,994 2,117,533 31,659,972
PMPM (4,687,038) (784,784) (9,056,840) - (668,717) 995,769 235,425 (13,966,185)
Care Management 2,995,705 1,864,985 1,973,943 1,308,735 698,380 686,353 794,238 10,322,338
Total (3,288,240) 24,278,346 (6,881,303) 1,516,826 1,189,058 9,832,039 2,924,936 29,571,661
Balance - 102,088 - 31,842 - 92,502 16,148 242,580
Adjustment (3,288,240) 24,380,434 (6,881,303) 1,548,668 1,189,058 9,924,541 2,941,084 29,814,242
Hold Harmless (2,883,587) 24,380,434 827,262 1,548,668 1,455,457 9,924,541 2,941,084 38,193,859
Observations:• HEDIS and Workload are for the most part positive reflecting previous incentives.• Satisfaction generally positive.• Continuity and access results are mixed.• PMPM for the most part is negative reflecting higher than targeted per capita costs.
2011 MHS Conference
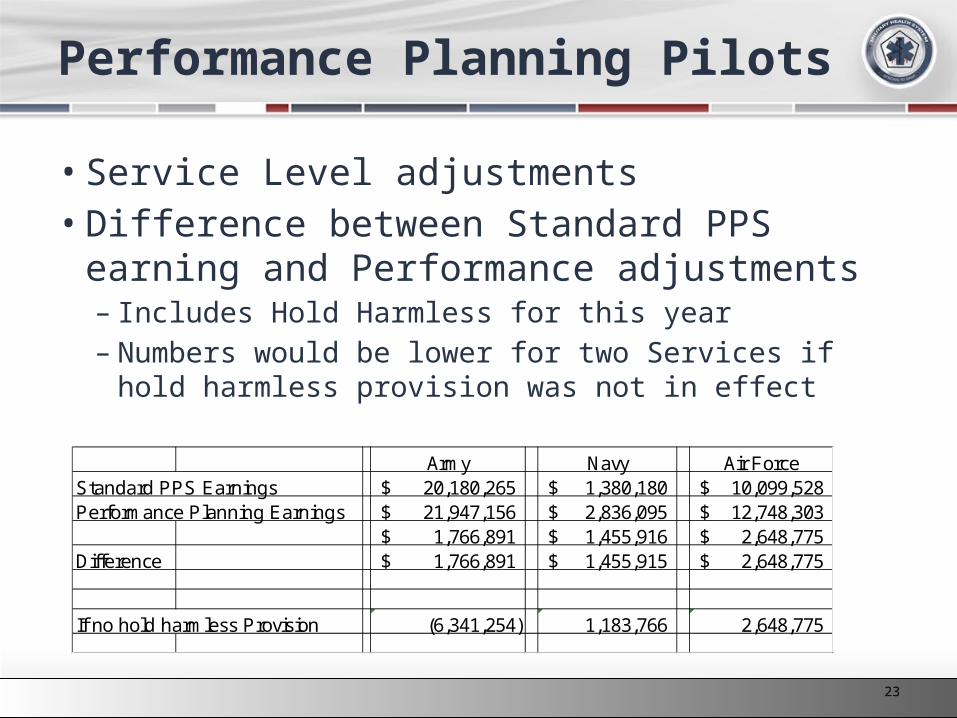
Performance Planning Pilots
• Service Level adjustments• Difference between Standard PPS earning
and Performance adjustments– Includes Hold Harmless for this year– Numbers would be lower for two Services if hold
harmless provision was not in effect
23
Army Navy Air Force Standard PPS Earnings 20,180,265$ 1,380,180$ 10,099,528$ Performance Planning Earnings 21,947,156$ 2,836,095$ 12,748,303$
1,766,891$ 1,455,916$ 2,648,775$ Difference 1,766,891$ 1,455,915$ 2,648,775$
If no hold harmless Provision (6,341,254) 1,183,766 2,648,775
2011 MHS Conference
Way Forward for Performance Planning
• Build off existing work - refine and strengthen current MTF Performance Plans for FY12; due to TMA 1 Sep– “Closing the Gaps” – Initiative selection should be based on under
performing measures, not consistently successful measures
• Access to data key for MTFs to close gaps; MTF scorecards will be available 1 Oct
Test primary care sub-capitation for approved sites 1 Oct – 4th Level MEPRS implementation for these sites needs to be
completed by 1 Aug
• Incentivize MTF leadership to fully engage in the Performance Planning process to enable success
2011 MHS Conference
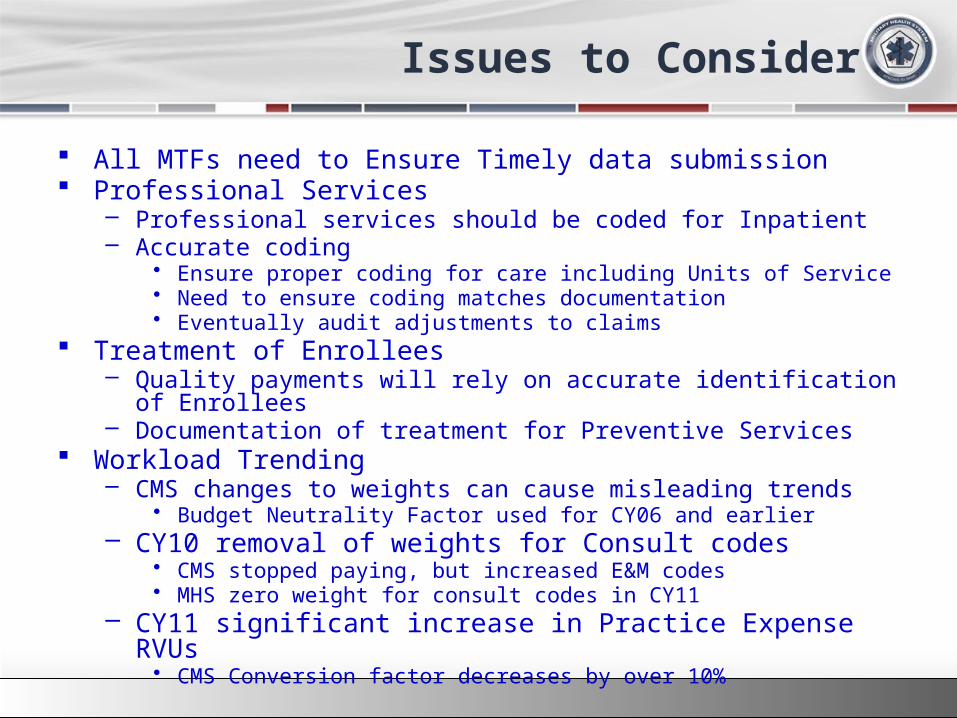
Issues to Consider
All MTFs need to Ensure Timely data submission Professional Services
– Professional services should be coded for Inpatient– Accurate coding
• Ensure proper coding for care including Units of Service• Need to ensure coding matches documentation• Eventually audit adjustments to claims
Treatment of Enrollees– Quality payments will rely on accurate identification of Enrollees– Documentation of treatment for Preventive Services
Workload Trending– CMS changes to weights can cause misleading trends
• Budget Neutrality Factor used for CY06 and earlier– CY10 removal of weights for Consult codes
• CMS stopped paying, but increased E&M codes• MHS zero weight for consult codes in CY11
– CY11 significant increase in Practice Expense RVUs• CMS Conversion factor decreases by over 10%
2011 MHS Conference
Back-up
26

2011 MHS Conference
BACK UP SLIDES
27
2011 MHS Conference
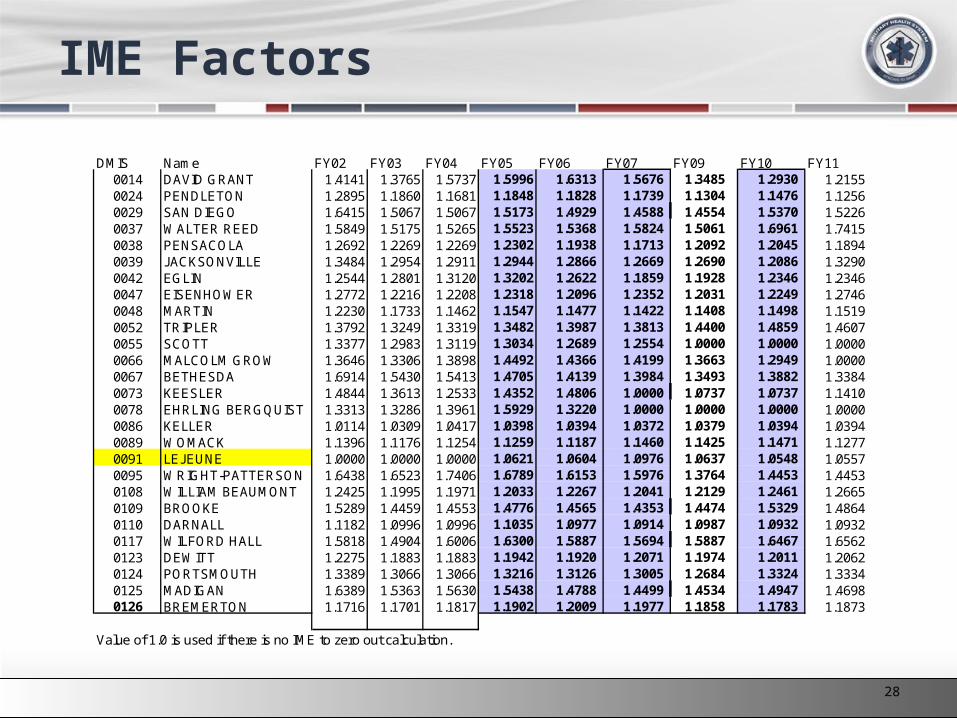
IME Factors
DMIS Name FY02 FY03 FY04 FY05 FY06 FY07 FY09 FY10 FY110014 DAVID GRANT 1.4141 1.3765 1.5737 1.5996 1.6313 1.5676 1.3485 1.2930 1.2155 0024 PENDLETON 1.2895 1.1860 1.1681 1.1848 1.1828 1.1739 1.1304 1.1476 1.1256 0029 SAN DIEGO 1.6415 1.5067 1.5067 1.5173 1.4929 1.4588 1.4554 1.5370 1.5226 0037 WALTER REED 1.5849 1.5175 1.5265 1.5523 1.5368 1.5824 1.5061 1.6961 1.7415 0038 PENSACOLA 1.2692 1.2269 1.2269 1.2302 1.1938 1.1713 1.2092 1.2045 1.1894 0039 JACKSONVILLE 1.3484 1.2954 1.2911 1.2944 1.2866 1.2669 1.2690 1.2086 1.3290 0042 EGLIN 1.2544 1.2801 1.3120 1.3202 1.2622 1.1859 1.1928 1.2346 1.2346 0047 EISENHOWER 1.2772 1.2216 1.2208 1.2318 1.2096 1.2352 1.2031 1.2249 1.2746 0048 MARTIN 1.2230 1.1733 1.1462 1.1547 1.1477 1.1422 1.1408 1.1498 1.1519 0052 TRIPLER 1.3792 1.3249 1.3319 1.3482 1.3987 1.3813 1.4400 1.4859 1.4607 0055 SCOTT 1.3377 1.2983 1.3119 1.3034 1.2689 1.2554 1.0000 1.0000 1.0000 0066 MALCOLM GROW 1.3646 1.3306 1.3898 1.4492 1.4366 1.4199 1.3663 1.2949 1.0000 0067 BETHESDA 1.6914 1.5430 1.5413 1.4705 1.4139 1.3984 1.3493 1.3882 1.3384 0073 KEESLER 1.4844 1.3613 1.2533 1.4352 1.4806 1.0000 1.0737 1.0737 1.1410 0078 EHRLING BERGQUIST 1.3313 1.3286 1.3961 1.5929 1.3220 1.0000 1.0000 1.0000 1.0000 0086 KELLER 1.0114 1.0309 1.0417 1.0398 1.0394 1.0372 1.0379 1.0394 1.0394 0089 WOMACK 1.1396 1.1176 1.1254 1.1259 1.1187 1.1460 1.1425 1.1471 1.1277 0091 LEJEUNE 1.0000 1.0000 1.0000 1.0621 1.0604 1.0976 1.0637 1.0548 1.0557 0095 WRIGHT-PATTERSON 1.6438 1.6523 1.7406 1.6789 1.6153 1.5976 1.3764 1.4453 1.4453 0108 WILLIAM BEAUMONT 1.2425 1.1995 1.1971 1.2033 1.2267 1.2041 1.2129 1.2461 1.2665 0109 BROOKE 1.5289 1.4459 1.4553 1.4776 1.4565 1.4353 1.4474 1.5329 1.4864 0110 DARNALL 1.1182 1.0996 1.0996 1.1035 1.0977 1.0914 1.0987 1.0932 1.0932 0117 WILFORD HALL 1.5818 1.4904 1.6006 1.6300 1.5887 1.5694 1.5887 1.6467 1.6562 0123 DEWITT 1.2275 1.1883 1.1883 1.1942 1.1920 1.2071 1.1974 1.2011 1.2062 0124 PORTSMOUTH 1.3389 1.3066 1.3066 1.3216 1.3126 1.3005 1.2684 1.3324 1.3334 0125 MADIGAN 1.6389 1.5363 1.5630 1.5438 1.4788 1.4499 1.4534 1.4947 1.4698 0126 BREMERTON 1.1716 1.1701 1.1817 1.1902 1.2009 1.1977 1.1858 1.1783 1.1873
Value of 1.0 is used if there is no IME to zero out calculation.
28
2011 MHS Conference
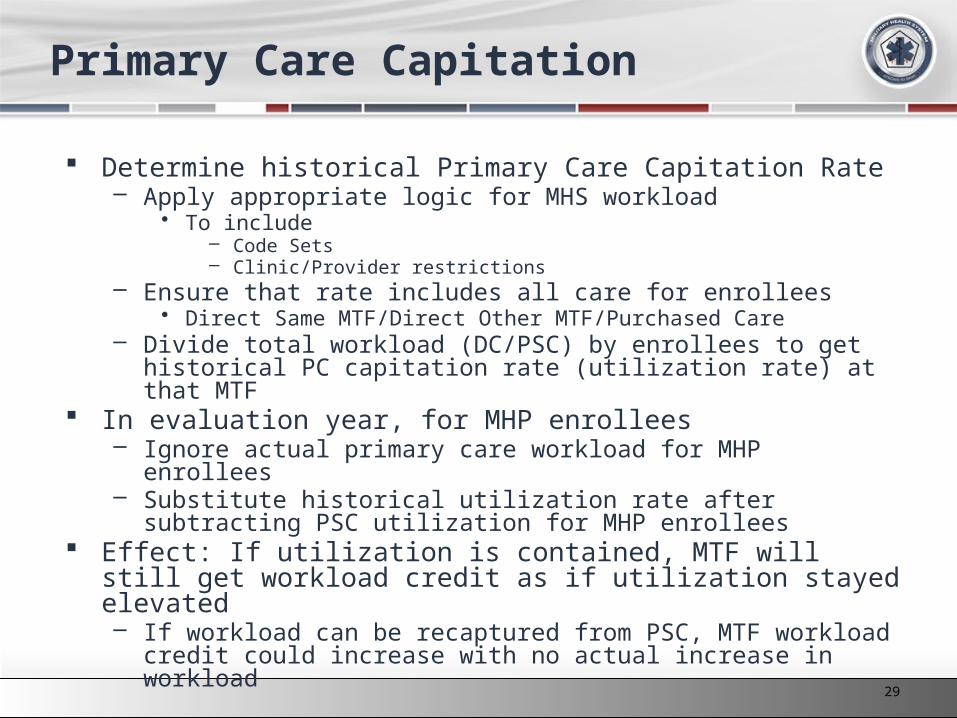
Primary Care Capitation
Determine historical Primary Care Capitation Rate– Apply appropriate logic for MHS workload
• To include– Code Sets– Clinic/Provider restrictions
– Ensure that rate includes all care for enrollees• Direct Same MTF/Direct Other MTF/Purchased Care
– Divide total workload (DC/PSC) by enrollees to get historical PC capitation rate (utilization rate) at that MTF
In evaluation year, for MHP enrollees– Ignore actual primary care workload for MHP enrollees– Substitute historical utilization rate after subtracting PSC utilization for
MHP enrollees Effect: If utilization is contained, MTF will still get workload credit as
if utilization stayed elevated– If workload can be recaptured from PSC, MTF workload credit could
increase with no actual increase in workload
29
2011 MHS Conference
HEDIS Preventive Services
Adherence to HEDIS Guidelines– Breast Cancer Screening– Cervical Cancer Screening– Colorectal Screening– Diabetes A1c Screen– Asthma Meds– Diabetes A1c<9– Diabetes LDL<100
30
2011 MHS Conference
DRG Comparison
Historical DRG– System to classify hospital cases into one of approximately 500
groups– System in use since approximately 1983, with minor updates on
a yearly basis– Calculated for TRICARE using CMS method just for our
beneficiaries with-in Purchased Care claims
MS-DRG – Severity Adjusted DRGs– System used to differentiate levels of complexity for the DRGs– Approximately 750 different groups– CMS implemented in 2008– TRICARE implemented in 2009
31
2011 MHS Conference
RVU comparison
Old Method– Uses Work RVU for all payments
• Work RVU only represents provider portion– Payments based on Product Lines
• Defined by MEPRS codes • Significant variation in rates ($38/RVU to $330/RVU)• Rates based on Allowed Amount from Purchased Care claims
divided by Work RVUs New Total RVU method
– Uses both Work and Practice RVUs for payments• Practice RVU represents the cost of the staff/office/equipment• Includes Units of Service adjustments for both RVUs
– Provides appropriate credit for equipment intensive procedures– Allows for a Standard Rate per RVU
• Can use same rate as Purchase Care– Used with Ambulatory Payment Classification (APCs)
• Facility charges now available for ER and Same Day Surgery• Consistent with TRICARE change for CY09
32
2011 MHS Conference
Geographic Practice Cost Index (GPCI)
Based on Medicare locality Adjustments Different rates for Work and Non-Facility
Practice– Work
• Generally 1.0 +, max 1.5 for Alaska
– Non-Facility Practice• Range 0.803 (part of Missouri) to 1.342 (part of California)
Payment Amount– Multiply the RVU for each component times the GPCI
for that component
33
2011 MHS Conference
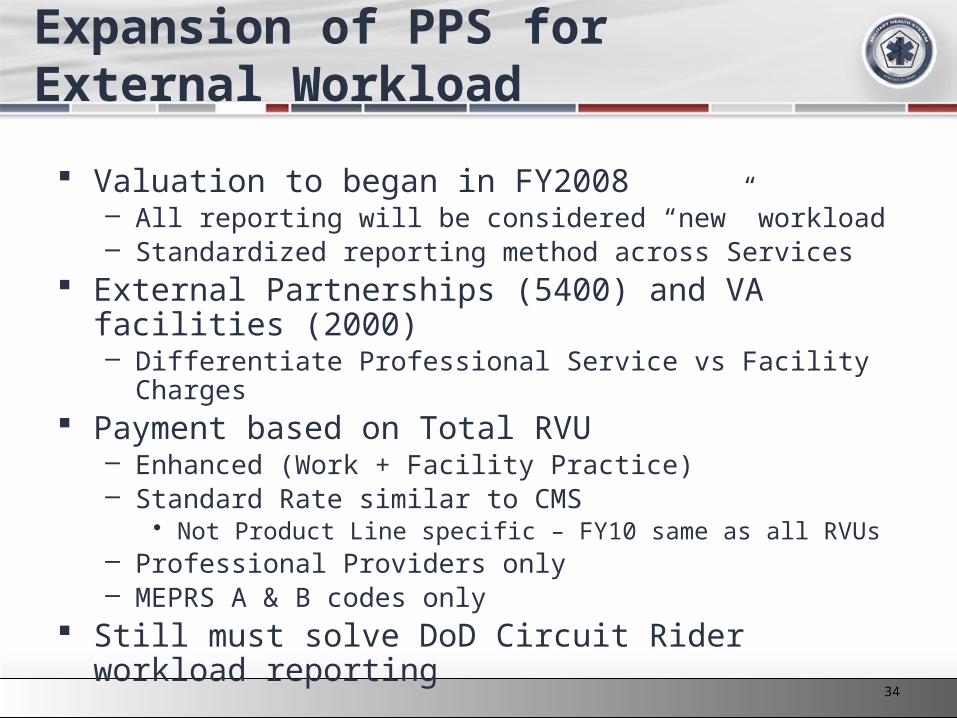
Expansion of PPS for External Workload
Valuation to began in FY2008– All reporting will be considered “new” workload– Standardized reporting method across Services
External Partnerships (5400) and VA facilities (2000)– Differentiate Professional Service vs Facility Charges
Payment based on Total RVU– Enhanced (Work + Facility Practice)– Standard Rate similar to CMS
• Not Product Line specific – FY10 same as all RVUs– Professional Providers only– MEPRS A & B codes only
Still must solve DoD Circuit Rider workload reporting
34
2011 MHS Conference
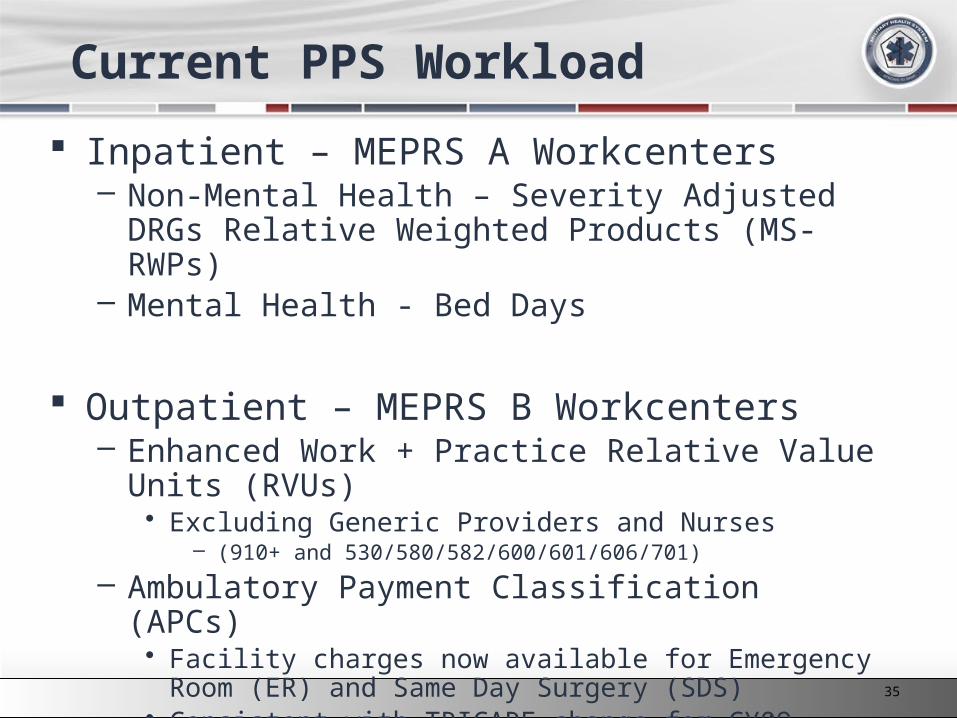
Current PPS Workload
Inpatient – MEPRS A Workcenters– Non-Mental Health – Severity Adjusted DRGs
Relative Weighted Products (MS-RWPs)– Mental Health - Bed Days
Outpatient – MEPRS B Workcenters– Enhanced Work + Practice Relative Value Units
(RVUs)• Excluding Generic Providers and Nurses
– (910+ and 530/580/582/600/601/606/701)
– Ambulatory Payment Classification (APCs)• Facility charges now available for Emergency Room (ER)
and Same Day Surgery (SDS)• Consistent with TRICARE change for CY09
35
2011 MHS Conference
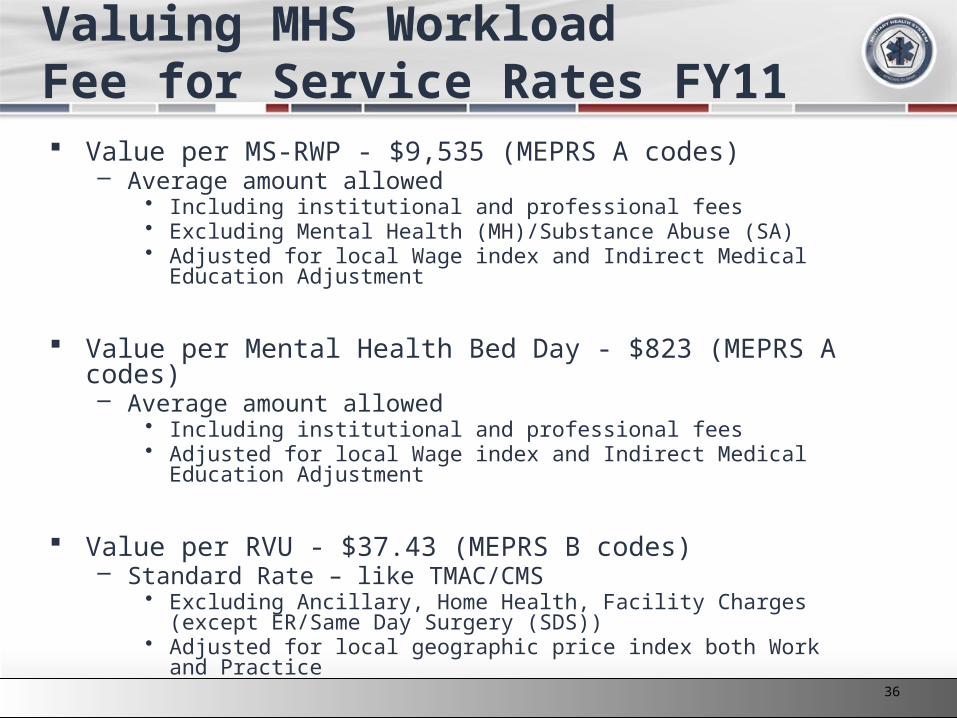
Valuing MHS Workload Fee for Service Rates FY11 Value per MS-RWP - $9,535 (MEPRS A codes)
– Average amount allowed • Including institutional and professional fees• Excluding Mental Health (MH)/Substance Abuse (SA) • Adjusted for local Wage index and Indirect Medical Education Adjustment
Value per Mental Health Bed Day - $823 (MEPRS A codes) – Average amount allowed
• Including institutional and professional fees• Adjusted for local Wage index and Indirect Medical Education Adjustment
Value per RVU - $37.43 (MEPRS B codes)– Standard Rate – like TMAC/CMS
• Excluding Ancillary, Home Health, Facility Charges (except ER/Same Day Surgery (SDS))
• Adjusted for local geographic price index both Work and Practice
Value per APC - $68.86 (MEPRS B codes ER/SDS)– Standard Rate
36