Embed Size (px)
Citation preview
alternative assets. intelligent data.
Content includes...
FundraisingPrivate equity fundraising reached $62bn in Q3 2016.
Distributions2015 saw a record $443bn distributed back to investors from their private equity investments.
Deal FlowBuyout deal activity remained steady in Q3, while venture capital deal flow dropped.
Fund Performance and Dry PowderEstimated capital available to fund managers has increased to $839bn.
The Q3 2016Preqin Quarterly Update
Private Equity & Venture Capital Insight on the quarter from the leading provider of alternative assets data
The Preqin Quarterly Update: Private Equity & Venture Capital, Q3 2016
Download the data pack at:www.preqin.com/quarterlyupdate
2 © 2016 Preqin Ltd. / www.preqin.com
All rights reserved. The entire contents of Preqin Quarterly Update: Private Equity, Q3 2016 are the Copyright of Preqin Ltd. No part of this publication or any information contained in it may be copied, transmitted by any electronic means, or stored in any electronic or other data storage medium, or printed or published in any document, report or publication, without the express prior written approval of Preqin Ltd. The information presented in Preqin Quarterly Update: Private Equity, Q3 2016 is for information purposes only and does not constitute and should not be construed as a solicitation or other offer, or recommendation to acquire or dispose of any investment or to engage in any other transaction, or as advice of any nature whatsoever. If the reader seeks advice rather than information then he should seek an independent fi nancial advisor and hereby agrees that he will not hold Preqin Ltd. responsible in law or equity for any decisions of whatever nature the reader makes or refrains from making following its use of Preqin Quarterly Update: Private Equity, Q3 2016.
While reasonable efforts have been made to obtain information from sources that are believed to be accurate, and to confi rm the accuracy of such information wherever possible, Preqin Ltd. does not make any representation or warranty that the information or opinions contained in Preqin Quarterly Update: Private Equity, Q3 2016 are accurate, reliable, up-to-date or complete.
Although every reasonable effort has been made to ensure the accuracy of this publication Preqin Ltd. does not accept any responsibility for any errors or omissions within Preqin Quarterly Update: Private Equity, Q3 2016 or for any expense or other loss alleged to have arisen in any way with a reader’s use of this publication.
Foreword - Christopher Elvin, Preqin
2015 witnessed record levels of capital distributions ($443bn), surpassing that of the previous record high in 2014, when fund managers return $424bn to investors. 2015 also marks the fi fth consecutive year in which capital distributions outstripped capital calls. With these high levels of distributions currently seen in the industry, it seems that investors are still committed to the asset class: over half (56%) of investors active in private equity are planning to increase their allocation in the longer term. Furthermore, private equity dry powder continues to reach record levels and currently stands at $839bn, up from the $818bn reported at the end of Q2 2016.
In light of the increased level of capital available to fund managers, portfolio company valuations have increased quarter-on-quarter, with the average buyout deal size in Q3 2016 ($405mn) increasing 9% from the Q2 2016 fi gure ($372mn). Despite this increase, aggregate global private equity-backed buyout deal value stayed relatively steady at $90bn, similar to the $89bn seen in Q2. Notable deals completed in Q3 2016 include the $4.4bn deal for Israel-based Playtika Ltd., the second largest buyout deal ever outside North America, Europe and Asia, as well as the high-profi le deal for Ultimate Fighting Championship worth $4bn.
However, global venture capital activity slowed noticeably in the third quarter of 2016: the number of deals (2,050) and aggregate deal value ($26bn) decreased 12% and 37% respectively from the previous quarter. Despite this, Q3 2016 saw the launch of China State-Owned Capital Venture Investment Fund in August 2016, a vehicle targeting CNY 200bn (approximately $30bn) for venture capital investment in China. Should this fund achieve its target, it would be the largest private equity fund ever raised.
The $62bn secured by the 170 funds closed in Q3 2016 represents a 22% decrease from the $80bn secured by funds closed in Q3 2015. However, private equity fundraising in the longer term remains strong: funds closed in the fi rst three quarters of 2016 have secured an aggregate $253bn, a larger amount than that secured by funds closed in the same period in 2015 ($213bn).
We hope you fi nd this report useful and welcome any feedback you may have. For more information, please visit www.preqin.comor contact [email protected].
Fundraising in Q3 2016 4
Funds in Market 6
Institutional Investors in Private Equity 8
Buyout Deals and Exits 11
Venture Capital Deals 13
Fund Performance and Dry Powder 15
Conferences 16
Contents
Data Source:
Private Equity Online is Preqin’s fl agship online private equity information resource and encompasses all of Preqin’s private equity databases. With unrivalled data and intelligence, Private Equity Online provides a 360º transparent view of all aspects of the asset class, including fund terms and conditions, fundraising, fund managers, institutional investors, fund performance, deals and exits, service providers and more.
For more information, or to arrange a demo, please visit: www.preqin.com/privateequity
SuperReturn Africa 2016
Create new business opportunities and share strategic insights with 550+ influential members of the African private equity community
29 November - 1 December, The Westin Cape Town
10% Reader Offer
Dear Spotlight reader,
Meet 550 international private equity attendees, including 150+ LPs in Cape Town 29 November - 1December 2016.
Hear from 100 speakers including:
- F.W. de Klerk, Former President of South Africa- Rt. Hon. Mark Simmonds, Former Foreign and Commonwealth Office Minister with responsibility for
Africa, the Caribbean, Conflict Prevention and International Energy- Nontombi Marule, Director of Innovation and Technology Policy, Department of Trade and Industry- Andrew Brown, CIO & Managing Director, Emerging Capital Partners (ECP)- Jeremy Cleaver, Portfolio Director, intermediated Equity (Africa), CDC Group- Catherine Swanepoel, Director, South Suez Capital- Andrea Heinzer, CIO & Partner, OBVIAM
See the attendee list and schedule meetings 2 weeks beforehand, plus attend several social and networking functions at the event.
Kindest regards
Mark O’Hare
For all bookings & enquiries, please contact the SuperReturn Africa 2016 Team Quote VIP Code: FKR2387PRQSP for your 10% discount
Tel: +44 (0) 20 7017 7200Email: [email protected]: https://finance.knect365.com/superreturn-africa/purchase/select-package/vip/FKR2387PRQSP
The Preqin Quarterly Update: Private Equity & Venture Capital, Q3 2016
Download the data pack at:www.preqin.com/quarterlyupdate
4 © 2016 Preqin Ltd. / www.preqin.com
Fundraising in Q3 2016
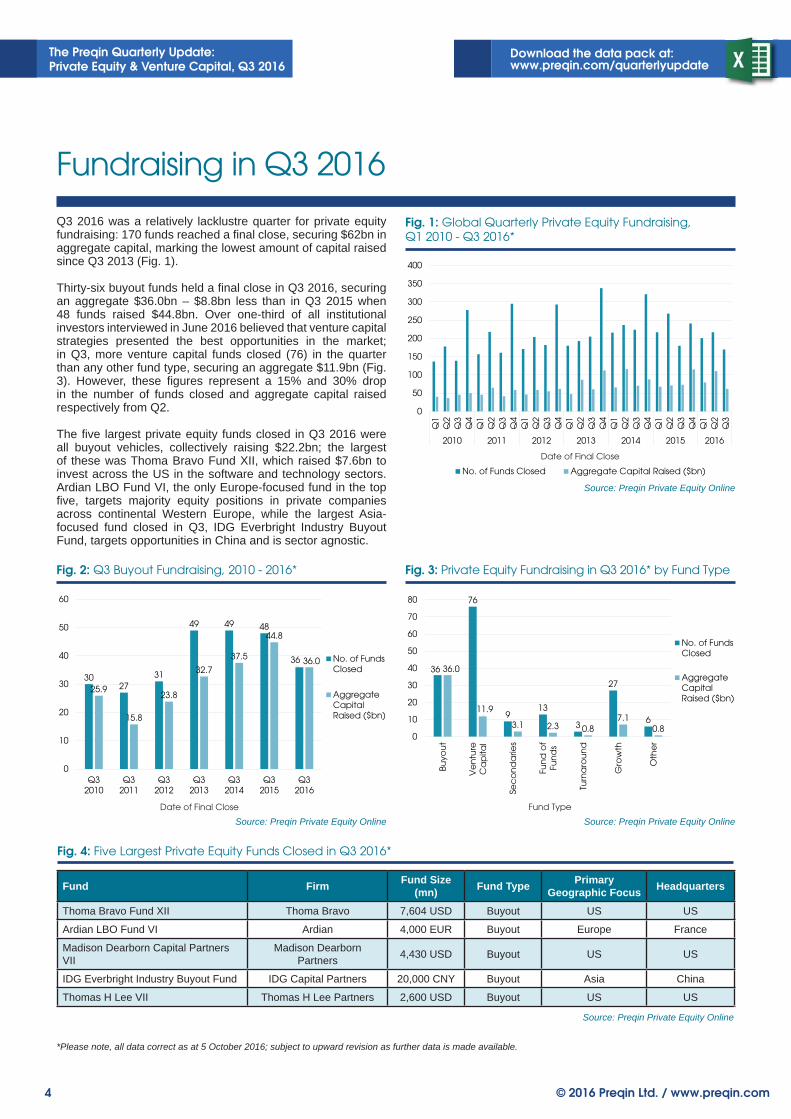
Fig. 4: Five Largest Private Equity Funds Closed in Q3 2016*
Fund Firm Fund Size (mn) Fund Type Primary
Geographic Focus Headquarters
Thoma Bravo Fund XII Thoma Bravo 7,604 USD Buyout US US
Ardian LBO Fund VI Ardian 4,000 EUR Buyout Europe France
Madison Dearborn Capital Partners VII
Madison Dearborn Partners 4,430 USD Buyout US US
IDG Everbright Industry Buyout Fund IDG Capital Partners 20,000 CNY Buyout Asia China
Thomas H Lee VII Thomas H Lee Partners 2,600 USD Buyout US US
Source: Preqin Private Equity Online
Q3 2016 was a relatively lacklustre quarter for private equity fundraising: 170 funds reached a fi nal close, securing $62bn in aggregate capital, marking the lowest amount of capital raised since Q3 2013 (Fig. 1).
Thirty-six buyout funds held a fi nal close in Q3 2016, securing an aggregate $36.0bn – $8.8bn less than in Q3 2015 when 48 funds raised $44.8bn. Over one-third of all institutional investors interviewed in June 2016 believed that venture capital strategies presented the best opportunities in the market; in Q3, more venture capital funds closed (76) in the quarter than any other fund type, securing an aggregate $11.9bn (Fig. 3). However, these fi gures represent a 15% and 30% drop in the number of funds closed and aggregate capital raised respectively from Q2.
The fi ve largest private equity funds closed in Q3 2016 were all buyout vehicles, collectively raising $22.2bn; the largest of these was Thoma Bravo Fund XII, which raised $7.6bn to invest across the US in the software and technology sectors. Ardian LBO Fund VI, the only Europe-focused fund in the top fi ve, targets majority equity positions in private companies across continental Western Europe, while the largest Asia-focused fund closed in Q3, IDG Everbright Industry Buyout Fund, targets opportunities in China and is sector agnostic.
0
50
100
150
200
250
300
350
400
Q1
Q2
Q3
Q4
Q1
Q2
Q3
Q4
Q1
Q2
Q3
Q4
Q1
Q2
Q3
Q4
Q1
Q2
Q3
Q4
Q1
Q2
Q3
Q4
Q1
Q2
Q3
2010 2011 2012 2013 2014 2015 2016
No. of Funds Closed Aggregate Capital Raised ($bn)
Fig. 1: Global Quarterly Private Equity Fundraising, Q1 2010 - Q3 2016*
Source: Preqin Private Equity Online
Date of Final Close
3027
31
49 49 48
36
25.9
15.8
23.8
32.7
37.5
44.8
36.0
0
10
20
30
40
50
60
Q32010
Q32011
Q32012
Q32013
Q32014
Q32015
Q32016
No. of FundsClosed
AggregateCapitalRaised ($bn)
Fig. 2: Q3 Buyout Fundraising, 2010 - 2016*
Source: Preqin Private Equity OnlineDate of Final Close
36
76
913
3
27
6
36.0
11.9
3.1 2.3 0.87.1
0.80
10
20
30
40
50
60
70
80
Buyo
ut
Ve
ntu
reC
ap
ital
Sec
on
da
ries
Fun
d o
fFu
nd
s
Turn
aro
un
d
Gro
wth
Oth
er
No. of FundsClosed
AggregateCapitalRaised ($bn)
Fig. 3: Private Equity Fundraising in Q3 2016* by Fund Type
Source: Preqin Private Equity OnlineFund Type
*Please note, all data correct as at 5 October 2016; subject to upward revision as further data is made available.

29th November 2016 | Frankfurt am Main at the Westin Grand
The 4th Annual German Private Equity Conference80+ LPs | 80+ GPs | 30+ CEOs
Register now online:pe-insights.org/german/register
Special Coupon for Registration:
GPEC_Preqin
Contact us: [email protected] +421949808416
One-day event
300 regional & international key players
50 + Speakers
1 Keynote
Preqin delegates are entitled to an exclusive discount of 20 %!
Get Ready toMake IP Deals
Preqin Readers Save $100
>>
The Preqin Quarterly Update: Private Equity & Venture Capital, Q3 2016
Download the data pack at:www.preqin.com/quarterlyupdate
6 © 2016 Preqin Ltd. / www.preqin.com
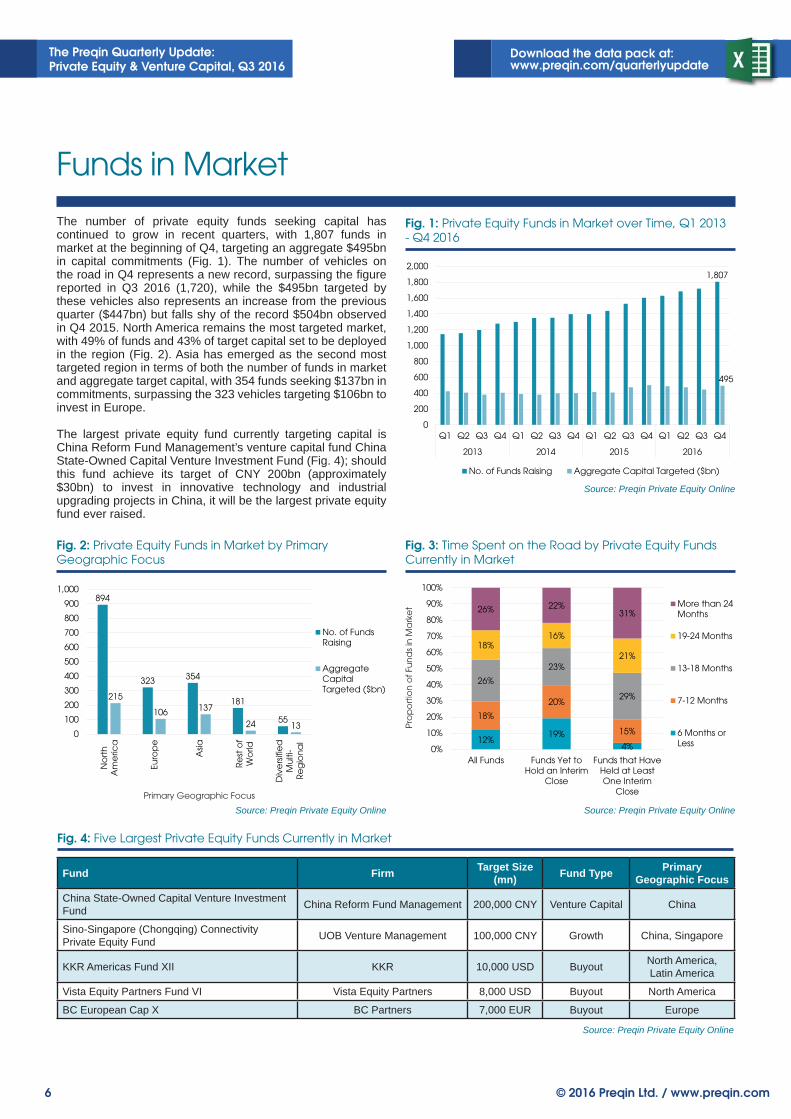
The number of private equity funds seeking capital has continued to grow in recent quarters, with 1,807 funds in market at the beginning of Q4, targeting an aggregate $495bn in capital commitments (Fig. 1). The number of vehicles on the road in Q4 represents a new record, surpassing the fi gure reported in Q3 2016 (1,720), while the $495bn targeted by these vehicles also represents an increase from the previous quarter ($447bn) but falls shy of the record $504bn observed in Q4 2015. North America remains the most targeted market, with 49% of funds and 43% of target capital set to be deployed in the region (Fig. 2). Asia has emerged as the second most targeted region in terms of both the number of funds in market and aggregate target capital, with 354 funds seeking $137bn in commitments, surpassing the 323 vehicles targeting $106bn to invest in Europe.
The largest private equity fund currently targeting capital is China Reform Fund Management’s venture capital fund China State-Owned Capital Venture Investment Fund (Fig. 4); should this fund achieve its target of CNY 200bn (approximately $30bn) to invest in innovative technology and industrial upgrading projects in China, it will be the largest private equity fund ever raised.
Funds in Market
Fig. 4: Five Largest Private Equity Funds Currently in Market
Fund Firm Target Size (mn) Fund Type Primary
Geographic FocusChina State-Owned Capital Venture Investment Fund China Reform Fund Management 200,000 CNY Venture Capital China
Sino-Singapore (Chongqing) Connectivity Private Equity Fund UOB Venture Management 100,000 CNY Growth China, Singapore
KKR Americas Fund XII KKR 10,000 USD Buyout North America, Latin America
Vista Equity Partners Fund VI Vista Equity Partners 8,000 USD Buyout North America
BC European Cap X BC Partners 7,000 EUR Buyout Europe
Source: Preqin Private Equity Online
1,807
495
0
200
400
600
800
1,000
1,200
1,400
1,600
1,800
2,000
Q1 Q2 Q3 Q4 Q1 Q2 Q3 Q4 Q1 Q2 Q3 Q4 Q1 Q2 Q3 Q4
2013 2014 2015 2016
No. of Funds Raising Aggregate Capital Targeted ($bn)
Fig. 1: Private Equity Funds in Market over Time, Q1 2013 - Q4 2016
Source: Preqin Private Equity Online
12%19%
4%
18%
20%
15%
26%
23%
29%
18%16%
21%
26% 22%31%
0%
10%
20%
30%
40%
50%
60%
70%
80%
90%
100%
All Funds Funds Yet toHold an Interim
Close
Funds that HaveHeld at LeastOne Interim
Close
More than 24Months
19-24 Months
13-18 Months
7-12 Months
6 Months orLess
Fig. 3: Time Spent on the Road by Private Equity Funds Currently in Market
Source: Preqin Private Equity Online
Pro
po
rtio
n o
f Fu
nd
s in
Ma
rke
t
894
323 354
181
55
215
106 137
24 130
100
200
300
400
500
600
700
800
900
1,000
No
rth
Am
eric
a
Euro
pe
Asi
a
Re
st o
fW
orld
Div
ers
ifie
dM
ulti
-R
eg
ion
al
No. of FundsRaising
AggregateCapitalTargeted ($bn)
Fig. 2: Private Equity Funds in Market by Primary Geographic Focus
Source: Preqin Private Equity OnlinePrimary Geographic Focus
December 4-6, 2016Monarch Beach Resort, Dana Point, CAOpal Group is proud to present our CLO Summit. The CLO Summit is an educational forum designed for investors, issuers, underwriters, rating agencies, lawyers and accountants. At this conference, they can learn the newest techniques to maximize returns and reduce risk exposure in this growing area of Asset-Backed Finance. An in-depth review of recent regulatory changes in addition to rating agency methodology, legal, tax and structural considerations will provide attendees with the tools necessary to stay one step ahead of their competitors. The conference will serve as an opportunity where a meaningful dialogue can be opened to address concerns regarding this dynamic segment of the market. This event promises to be the "must attend" CLO event of 2016.
Sponsorship and Exhibiting Opportunities are Available:If you are interested in attending, sponsoring, speaking or exhibit-ing at this event, please call 212-532-9898 or email [email protected]
Register: To register, visit us online at www.opalgroup.net or email us at [email protected]
Ref code: CLOA1606
CLO Summit
The Preqin Quarterly Update: Private Equity & Venture Capital, Q3 2016
Download the data pack at:www.preqin.com/quarterlyupdate
8 © 2016 Preqin Ltd. / www.preqin.com
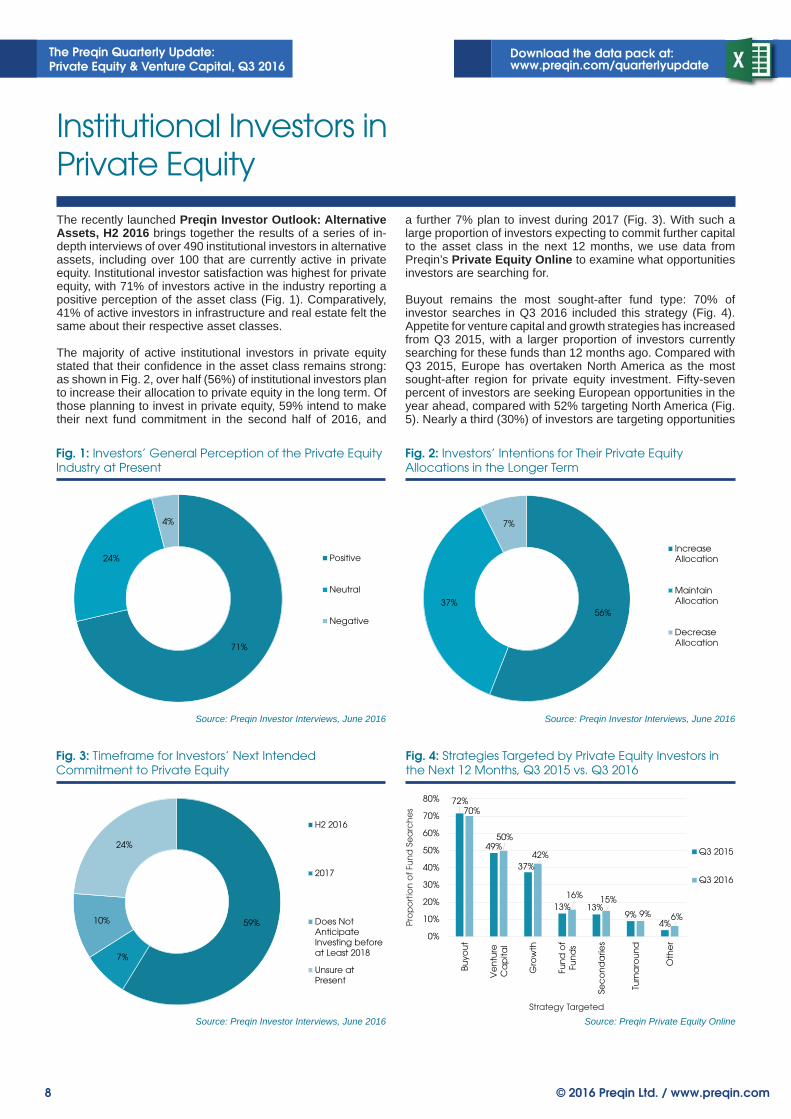
The recently launched Preqin Investor Outlook: Alternative Assets, H2 2016 brings together the results of a series of in-depth interviews of over 490 institutional investors in alternative assets, including over 100 that are currently active in private equity. Institutional investor satisfaction was highest for private equity, with 71% of investors active in the industry reporting a positive perception of the asset class (Fig. 1). Comparatively, 41% of active investors in infrastructure and real estate felt the same about their respective asset classes.
The majority of active institutional investors in private equity stated that their confi dence in the asset class remains strong: as shown in Fig. 2, over half (56%) of institutional investors plan to increase their allocation to private equity in the long term. Of those planning to invest in private equity, 59% intend to make their next fund commitment in the second half of 2016, and
a further 7% plan to invest during 2017 (Fig. 3). With such a large proportion of investors expecting to commit further capital to the asset class in the next 12 months, we use data from Preqin’s Private Equity Online to examine what opportunities investors are searching for.
Buyout remains the most sought-after fund type: 70% of investor searches in Q3 2016 included this strategy (Fig. 4). Appetite for venture capital and growth strategies has increased from Q3 2015, with a larger proportion of investors currently searching for these funds than 12 months ago. Compared with Q3 2015, Europe has overtaken North America as the most sought-after region for private equity investment. Fifty-seven percent of investors are seeking European opportunities in the year ahead, compared with 52% targeting North America (Fig. 5). Nearly a third (30%) of investors are targeting opportunities
71%
24%
4%
Positive
Neutral
Negative
Fig. 1: Investors’ General Perception of the Private Equity Industry at Present
Source: Preqin Investor Interviews, June 2016
72%
49%
37%
13% 13%9%
4%
70%
50%
42%
16% 15%
9% 6%
0%
10%
20%
30%
40%
50%
60%
70%
80%
Buyo
ut
Ve
ntu
reC
ap
ital
Gro
wth
Fun
d o
fFu
nd
s
Sec
on
da
ries
Turn
aro
un
d
Oth
er
Q3 2015
Q3 2016
Fig. 4: Strategies Targeted by Private Equity Investors in the Next 12 Months, Q3 2015 vs. Q3 2016
Source: Preqin Private Equity Online
Pro
po
rtio
n o
f Fu
nd
Se
arc
he
s
Strategy Targeted
56%37%
7%
IncreaseAllocation
MaintainAllocation
DecreaseAllocation
Fig. 2: Investors’ Intentions for Their Private Equity Allocations in the Longer Term
Source: Preqin Investor Interviews, June 2016
59%
7%
10%
24%
H2 2016
2017
Does NotAnticipateInvesting beforeat Least 2018
Unsure atPresent
Fig. 3: Timeframe for Investors’ Next Intended Commitment to Private Equity
Source: Preqin Investor Interviews, June 2016
Institutional Investors in Private Equity
The Preqin Quarterly Update: Private Equity & Venture Capital, Q3 2016
Download the data pack at:www.preqin.com/quarterlyupdate
9© 2016 Preqin Ltd. / www.preqin.com
44%
14%
26%
10%
6%
Less than $50mn
$50-99mn
$100-299mn
$300-599mn
$600mn or More
Fig. 6: Amount of Capital Investors Plan to Commit to Private Equity Funds in the Next 12 Months
Source: Preqin Private Equity Online
9%
29%
46%
16%
1 Fund
2-3 Funds
4-9 Funds
10 Funds orMore
Fig. 7: Number of Private Equity Funds Investors Plan to Commit to in the Next 12 Months
Source: Preqin Private Equity Online
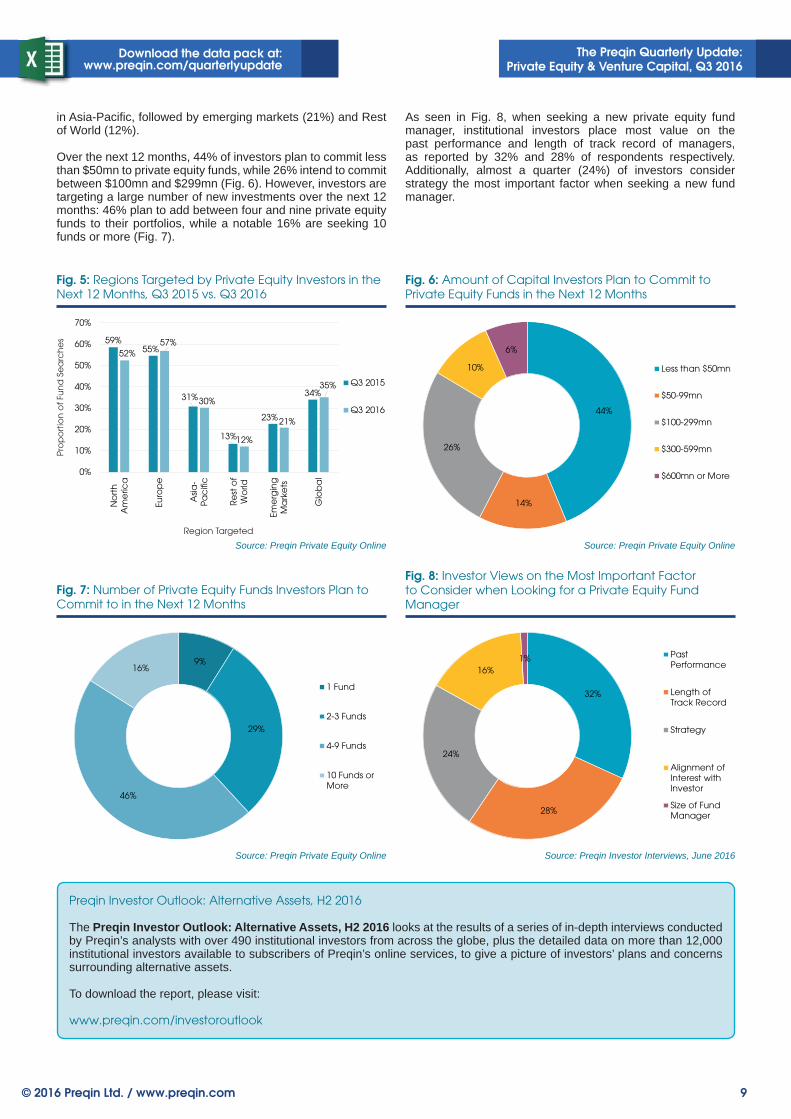
in Asia-Pacifi c, followed by emerging markets (21%) and Rest of World (12%).
Over the next 12 months, 44% of investors plan to commit less than $50mn to private equity funds, while 26% intend to commit between $100mn and $299mn (Fig. 6). However, investors are targeting a large number of new investments over the next 12 months: 46% plan to add between four and nine private equity funds to their portfolios, while a notable 16% are seeking 10 funds or more (Fig. 7).
As seen in Fig. 8, when seeking a new private equity fund manager, institutional investors place most value on the past performance and length of track record of managers, as reported by 32% and 28% of respondents respectively. Additionally, almost a quarter (24%) of investors consider strategy the most important factor when seeking a new fund manager.
32%
28%
24%
16%1% Past
Performance
Length ofTrack Record
Strategy
Alignment ofInterest withInvestor
Size of FundManager
Fig. 8: Investor Views on the Most Important Factor to Consider when Looking for a Private Equity Fund Manager
Source: Preqin Investor Interviews, June 2016
Preqin Investor Outlook: Alternative Assets, H2 2016
The Preqin Investor Outlook: Alternative Assets, H2 2016 looks at the results of a series of in-depth interviews conducted by Preqin’s analysts with over 490 institutional investors from across the globe, plus the detailed data on more than 12,000 institutional investors available to subscribers of Preqin’s online services, to give a picture of investors’ plans and concerns surrounding alternative assets.
To download the report, please visit:
www.preqin.com/investoroutlook
59%55%
31%
13%
23%
34%
52%57%
30%
12%
21%
35%
0%
10%
20%
30%
40%
50%
60%
70%
No
rth
Am
eric
a
Euro
pe
Asia
-Pa
cifi
c
Re
st o
fW
orld
Eme
rgin
gM
ark
ets
Glo
ba
l
Q3 2015
Q3 2016
Fig. 5: Regions Targeted by Private Equity Investors in the Next 12 Months, Q3 2015 vs. Q3 2016
Source: Preqin Private Equity Online
Pro
po
rtio
n o
f Fu
nd
Se
arc
he
s
Region Targeted
Register for demo access to find out how Preqin’s Private Equity Online can help your business:
www.preqin.com/privateequity
Source new investors for funds
Identify new investment opportunities
Conduct competitor and market analysis
Find potential deal opportunities
Develop new business
alternative assets. intelligent data.
The Preqin Quarterly Update: Private Equity & Venture Capital, Q3 2016
Download the data pack at:www.preqin.com/quarterlyupdate
11© 2016 Preqin Ltd. / www.preqin.com
Buyout Deals and Exits
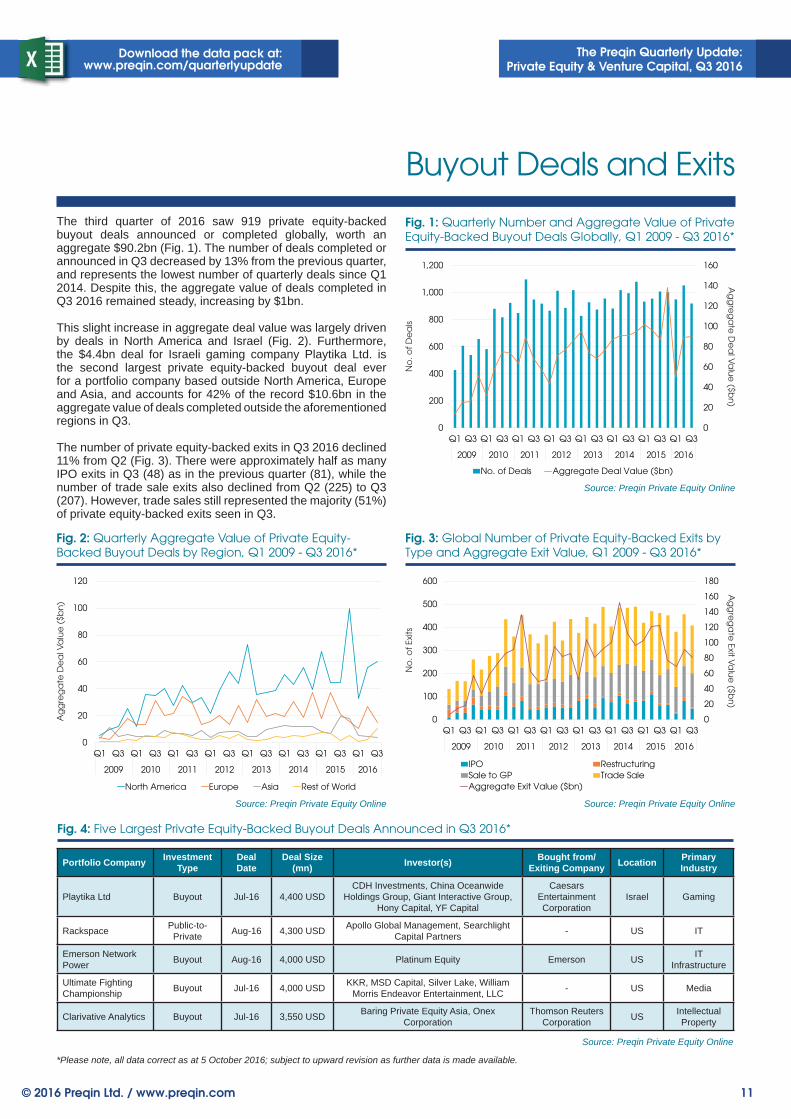
The third quarter of 2016 saw 919 private equity-backed buyout deals announced or completed globally, worth an aggregate $90.2bn (Fig. 1). The number of deals completed or announced in Q3 decreased by 13% from the previous quarter, and represents the lowest number of quarterly deals since Q1 2014. Despite this, the aggregate value of deals completed in Q3 2016 remained steady, increasing by $1bn.
This slight increase in aggregate deal value was largely driven by deals in North America and Israel (Fig. 2). Furthermore, the $4.4bn deal for Israeli gaming company Playtika Ltd. is the second largest private equity-backed buyout deal ever for a portfolio company based outside North America, Europe and Asia, and accounts for 42% of the record $10.6bn in the aggregate value of deals completed outside the aforementioned regions in Q3.
The number of private equity-backed exits in Q3 2016 declined 11% from Q2 (Fig. 3). There were approximately half as many IPO exits in Q3 (48) as in the previous quarter (81), while the number of trade sale exits also declined from Q2 (225) to Q3 (207). However, trade sales still represented the majority (51%) of private equity-backed exits seen in Q3.
Fig. 4: Five Largest Private Equity-Backed Buyout Deals Announced in Q3 2016*
Portfolio Company Investment Type
Deal Date
Deal Size (mn) Investor(s) Bought from/
Exiting Company Location Primary Industry
Playtika Ltd Buyout Jul-16 4,400 USDCDH Investments, China Oceanwide
Holdings Group, Giant Interactive Group, Hony Capital, YF Capital
Caesars Entertainment Corporation
Israel Gaming
Rackspace Public-to-Private Aug-16 4,300 USD Apollo Global Management, Searchlight
Capital Partners - US IT
Emerson Network Power Buyout Aug-16 4,000 USD Platinum Equity Emerson US IT
Infrastructure
Ultimate Fighting Championship Buyout Jul-16 4,000 USD KKR, MSD Capital, Silver Lake, William
Morris Endeavor Entertainment, LLC - US Media
Clarivative Analytics Buyout Jul-16 3,550 USD Baring Private Equity Asia, Onex Corporation
Thomson Reuters Corporation US Intellectual
Property
Source: Preqin Private Equity Online
0
20
40
60
80
100
120
140
160
0
200
400
600
800
1,000
1,200
Q1 Q3 Q1 Q3 Q1 Q3 Q1 Q3 Q1 Q3 Q1 Q3 Q1 Q3 Q1 Q3
2009 2010 2011 2012 2013 2014 2015 2016
No. of Deals Aggregate Deal Value ($bn)
Fig. 1: Quarterly Number and Aggregate Value of Private Equity-Backed Buyout Deals Globally, Q1 2009 - Q3 2016*
Source: Preqin Private Equity Online
No
. of
De
als
Ag
gre
ga
te D
ea
l Va
lue
($bn
)
0
20
40
60
80
100
120
Q1 Q3 Q1 Q3 Q1 Q3 Q1 Q3 Q1 Q3 Q1 Q3 Q1 Q3 Q1 Q3
2009 2010 2011 2012 2013 2014 2015 2016
North America Europe Asia Rest of World
Fig. 2: Quarterly Aggregate Value of Private Equity-Backed Buyout Deals by Region, Q1 2009 - Q3 2016*
Source: Preqin Private Equity Online
Ag
gre
ga
te D
ea
l Va
lue
($b
n)
0
20
40
60
80
100
120
140
160
180
0
100
200
300
400
500
600
Q1 Q3 Q1 Q3 Q1 Q3 Q1 Q3 Q1 Q3 Q1 Q3 Q1 Q3 Q1 Q3
2009 2010 2011 2012 2013 2014 2015 2016
IPO RestructuringSale to GP Trade SaleAggregate Exit Value ($bn)
Fig. 3: Global Number of Private Equity-Backed Exits by Type and Aggregate Exit Value, Q1 2009 - Q3 2016*
Source: Preqin Private Equity Online
No
. of
Exits
Ag
gre
ga
te Exit V
alu
e ($b
n)
*Please note, all data correct as at 5 October 2016; subject to upward revision as further data is made available.
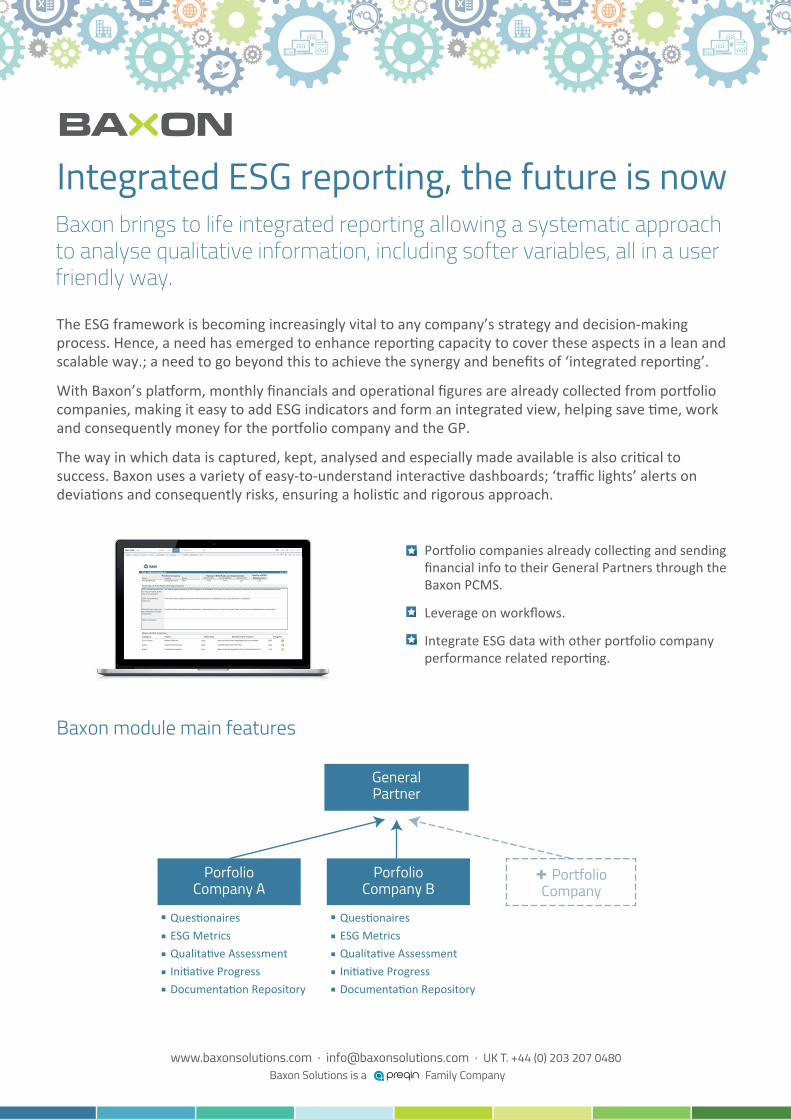
Baxon brings to life integrated reporting allowing a systematic approach to analyse qualitative information, including softer variables, all in a user friendly way.
Integrated ESG reporting, the future is now
The ESG framework is becoming increasingly vital to any company’s strategy and decision-making
Baxon Solutions is a Family Companywww.baxonsolutions.com · [email protected] · UK T. +44 (0) 203 207 0480
GeneralPartner
+ PortfolioCompany
Porfolio Company A
ESG Metrics ESG Metrics
Porfolio Company B
Baxon module main features
Fund Country Sector Environment Social Matters GovernancePwp 2009 Fund United Kingdom TMT High High Low Low
ESG issues/opportunities for improvements at the time of Investment:
ESG improvements achieved:
Status/further actions to be undertaken (include timeframe):
Other information:
Category Relevance
Environment High 90%
Social Med 30%
Social Low 10%
Ran - ESG Compliance
Summary of ESG Risks and Opportunities
Status of ESG Initiatives
Improved work plan negotiated with ops manager
ProgresssnoitcA rehtruF/sutatSrotcaF
Levels of battery disposal still unsatisfactory, improvements to work flow still required. New work flow to be established by next quarter
Jun-15Portfolio Company Quality of ESG
Management Rating of ESG Risks and Opportunities
We saw progress toward their ESG targets in Scandanavia, still scope to improve in factors of external community and environmental issues.
This month saw progress toward environmental goals in comparison to prior year and other competitors.
Battery Disposal
Community Outreach
Consumer protection
Confirm framework with CFO,
New consumer regulations to be introduced next qtr.
The Preqin Quarterly Update: Private Equity & Venture Capital, Q3 2016
Download the data pack at:www.preqin.com/quarterlyupdate
13© 2016 Preqin Ltd. / www.preqin.com
Venture Capital Deals
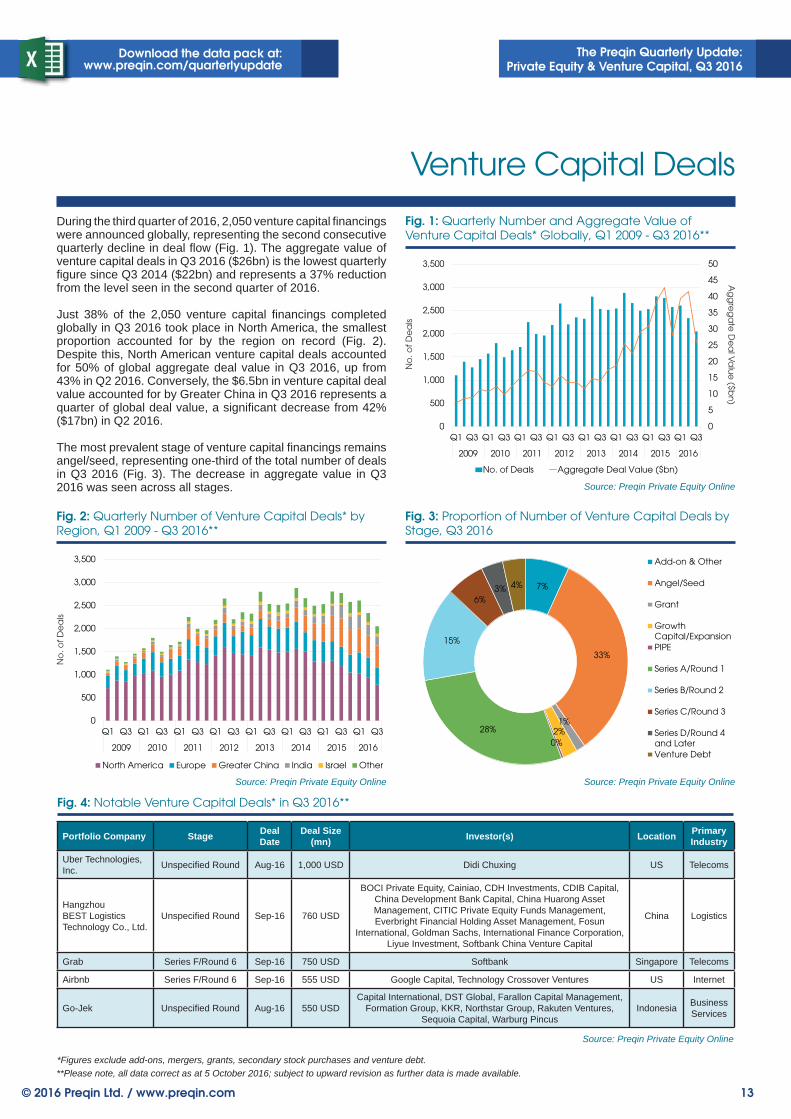
During the third quarter of 2016, 2,050 venture capital fi nancings were announced globally, representing the second consecutive quarterly decline in deal fl ow (Fig. 1). The aggregate value of venture capital deals in Q3 2016 ($26bn) is the lowest quarterly fi gure since Q3 2014 ($22bn) and represents a 37% reduction from the level seen in the second quarter of 2016.
Just 38% of the 2,050 venture capital fi nancings completed globally in Q3 2016 took place in North America, the smallest proportion accounted for by the region on record (Fig. 2). Despite this, North American venture capital deals accounted for 50% of global aggregate deal value in Q3 2016, up from 43% in Q2 2016. Conversely, the $6.5bn in venture capital deal value accounted for by Greater China in Q3 2016 represents a quarter of global deal value, a signifi cant decrease from 42% ($17bn) in Q2 2016.
The most prevalent stage of venture capital fi nancings remains angel/seed, representing one-third of the total number of deals in Q3 2016 (Fig. 3). The decrease in aggregate value in Q3 2016 was seen across all stages.
Fig. 4: Notable Venture Capital Deals* in Q3 2016**
Portfolio Company Stage Deal Date
Deal Size (mn) Investor(s) Location Primary
Industry
Uber Technologies, Inc. Unspecifi ed Round Aug-16 1,000 USD Didi Chuxing US Telecoms
Hangzhou BEST Logistics Technology Co., Ltd.
Unspecifi ed Round Sep-16 760 USD
BOCI Private Equity, Cainiao, CDH Investments, CDIB Capital, China Development Bank Capital, China Huarong Asset Management, CITIC Private Equity Funds Management, Everbright Financial Holding Asset Management, Fosun
International, Goldman Sachs, International Finance Corporation, Liyue Investment, Softbank China Venture Capital
China Logistics
Grab Series F/Round 6 Sep-16 750 USD Softbank Singapore Telecoms
Airbnb Series F/Round 6 Sep-16 555 USD Google Capital, Technology Crossover Ventures US Internet
Go-Jek Unspecifi ed Round Aug-16 550 USDCapital International, DST Global, Farallon Capital Management,
Formation Group, KKR, Northstar Group, Rakuten Ventures, Sequoia Capital, Warburg Pincus
Indonesia Business Services
Source: Preqin Private Equity Online
0
5
10
15
20
25
30
35
40
45
50
0
500
1,000
1,500
2,000
2,500
3,000
3,500
Q1 Q3 Q1 Q3 Q1 Q3 Q1 Q3 Q1 Q3 Q1 Q3 Q1 Q3 Q1 Q3
2009 2010 2011 2012 2013 2014 2015 2016
No. of Deals Aggregate Deal Value ($bn)
Fig. 1: Quarterly Number and Aggregate Value of Venture Capital Deals* Globally, Q1 2009 - Q3 2016**
Source: Preqin Private Equity Online
No
. of
De
als
Ag
gre
ga
te D
ea
l Va
lue
($bn
)
0
500
1,000
1,500
2,000
2,500
3,000
3,500
Q1 Q3 Q1 Q3 Q1 Q3 Q1 Q3 Q1 Q3 Q1 Q3 Q1 Q3 Q1 Q3
2009 2010 2011 2012 2013 2014 2015 2016
North America Europe Greater China India Israel Other
Fig. 2: Quarterly Number of Venture Capital Deals* by Region, Q1 2009 - Q3 2016**
Source: Preqin Private Equity Online
No
. of
De
als
7%
33%
1%2%
0%
28%
15%
6%3% 4%
Add-on & Other
Angel/Seed
Grant
GrowthCapital/ExpansionPIPE
Series A/Round 1
Series B/Round 2
Series C/Round 3
Series D/Round 4and LaterVenture Debt
Fig. 3: Proportion of Number of Venture Capital Deals by Stage, Q3 2016
Source: Preqin Private Equity Online
*Figures exclude add-ons, mergers, grants, secondary stock purchases and venture debt.**Please note, all data correct as at 5 October 2016; subject to upward revision as further data is made available.

International Private Equity Market
JANUARY 25-27, 2017PALAIS DES FESTIVALS CANNES - FRANCE
Follow us www.ipem-market.com
Join 1200+ PE, VC and Business leaders
from 35 countries for 3 days of intensive networking
Register now and benefit from a preferential rate thanks to the promo code PREQIN17
The Preqin Quarterly Update: Private Equity & Venture Capital, Q3 2016
Download the data pack at:www.preqin.com/quarterlyupdate
15© 2016 Preqin Ltd. / www.preqin.com
Fund Performance and Dry Powder
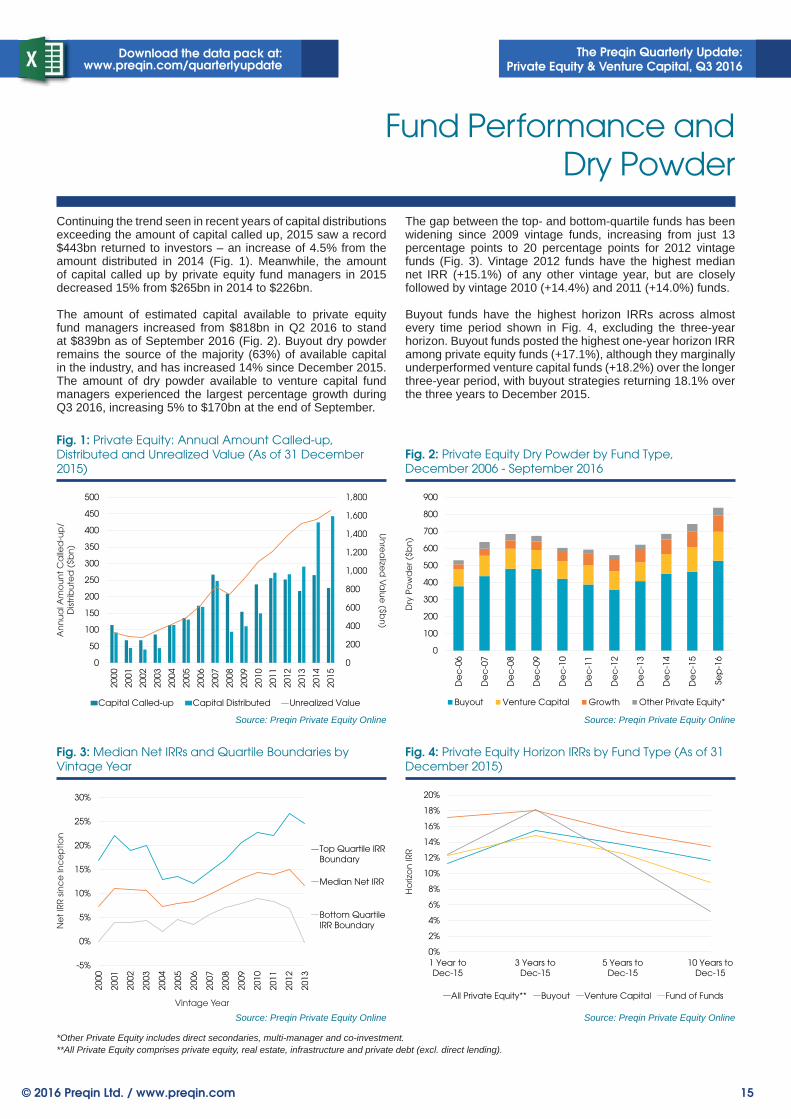
Continuing the trend seen in recent years of capital distributions exceeding the amount of capital called up, 2015 saw a record $443bn returned to investors – an increase of 4.5% from the amount distributed in 2014 (Fig. 1). Meanwhile, the amount of capital called up by private equity fund managers in 2015 decreased 15% from $265bn in 2014 to $226bn.
The amount of estimated capital available to private equity fund managers increased from $818bn in Q2 2016 to stand at $839bn as of September 2016 (Fig. 2). Buyout dry powder remains the source of the majority (63%) of available capital in the industry, and has increased 14% since December 2015. The amount of dry powder available to venture capital fund managers experienced the largest percentage growth during Q3 2016, increasing 5% to $170bn at the end of September.
The gap between the top- and bottom-quartile funds has been widening since 2009 vintage funds, increasing from just 13 percentage points to 20 percentage points for 2012 vintage funds (Fig. 3). Vintage 2012 funds have the highest median net IRR (+15.1%) of any other vintage year, but are closely followed by vintage 2010 (+14.4%) and 2011 (+14.0%) funds.
Buyout funds have the highest horizon IRRs across almost every time period shown in Fig. 4, excluding the three-year horizon. Buyout funds posted the highest one-year horizon IRR among private equity funds (+17.1%), although they marginally underperformed venture capital funds (+18.2%) over the longer three-year period, with buyout strategies returning 18.1% over the three years to December 2015.
0
200
400
600
800
1,000
1,200
1,400
1,600
1,800
0
50
100
150
200
250
300
350
400
450
500
2000
2001
2002
2003
2004
2005
2006
2007
2008
2009
2010
2011
2012
2013
2014
2015
Capital Called-up Capital Distributed Unrealized Value
Fig. 1: Private Equity: Annual Amount Called-up, Distributed and Unrealized Value (As of 31 December 2015)
Source: Preqin Private Equity Online
An
nu
al A
mo
un
t C
alle
d-u
p/
Dist
ribu
ted
($b
n)
-5%
0%
5%
10%
15%
20%
25%
30%
2000
2001
2002
2003
2004
2005
2006
2007
2008
2009
2010
2011
2012
2013
Top Quartile IRRBoundary
Median Net IRR
Bottom QuartileIRR Boundary
Fig. 3: Median Net IRRs and Quartile Boundaries by Vintage Year
Source: Preqin Private Equity Online
Ne
t IR
R s
inc
e In
ce
ptio
n
Vintage Year
0%
2%
4%
6%
8%
10%
12%
14%
16%
18%
20%
1 Year toDec-15
3 Years toDec-15
5 Years toDec-15
10 Years toDec-15
All Private Equity** Buyout Venture Capital Fund of Funds
Fig. 4: Private Equity Horizon IRRs by Fund Type (As of 31 December 2015)
Source: Preqin Private Equity Online
Ho
rizo
n IR
RU
nre
alize
d V
alu
e ($b
n)
0
100
200
300
400
500
600
700
800
900
De
c-0
6
De
c-0
7
De
c-0
8
De
c-0
9
De
c-1
0
De
c-1
1
De
c-1
2
De
c-1
3
De
c-1
4
De
c-1
5
Sep
-16
Buyout Venture Capital Growth Other Private Equity*
Fig. 2: Private Equity Dry Powder by Fund Type, December 2006 - September 2016
Source: Preqin Private Equity Online
Dry
Po
wd
er (
$bn
)
*Other Private Equity includes direct secondaries, multi-manager and co-investment.**All Private Equity comprises private equity, real estate, infrastructure and private debt (excl. direct lending).
The Preqin Quarterly Update: Private Equity & Venture Capital, Q3 2016
Download the data pack at:www.preqin.com/quarterlyupdate
16 © 2016 Preqin Ltd. / www.preqin.com
Conferences
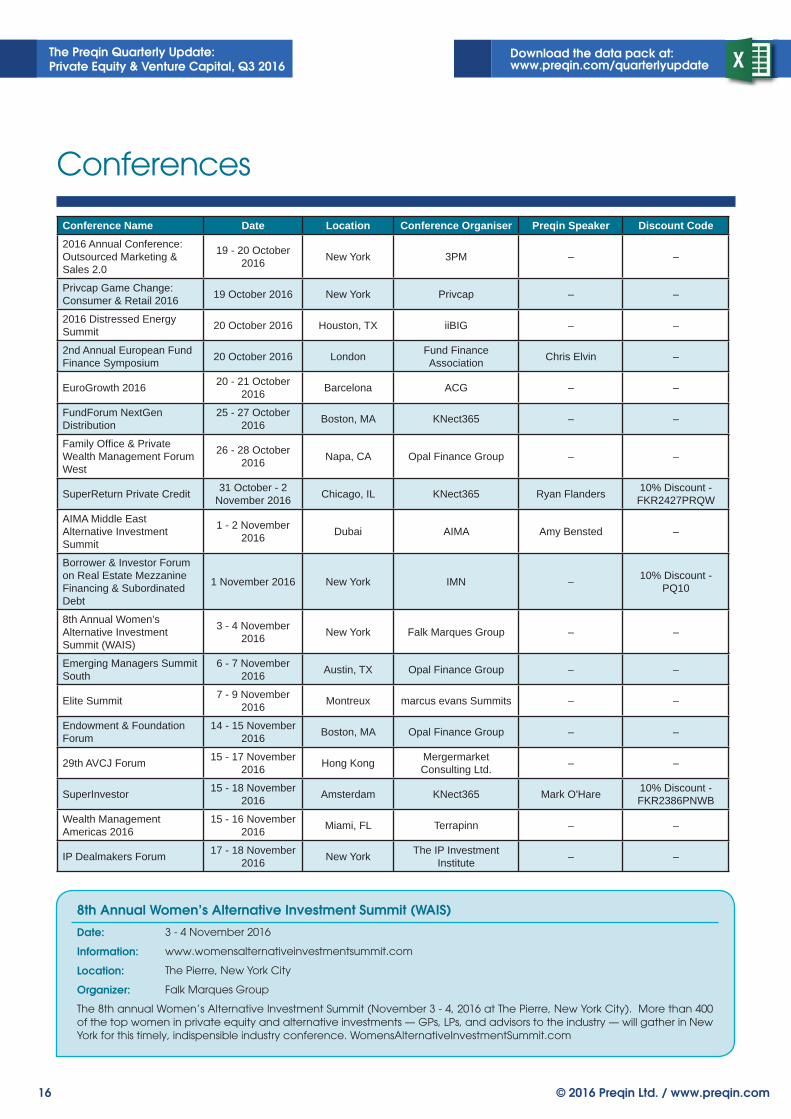
Conference Name Date Location Conference Organiser Preqin Speaker Discount Code2016 Annual Conference: Outsourced Marketing & Sales 2.0
19 - 20 October 2016 New York 3PM – –
Privcap Game Change: Consumer & Retail 2016 19 October 2016 New York Privcap – –
2016 Distressed Energy Summit 20 October 2016 Houston, TX iiBIG – –
2nd Annual European Fund Finance Symposium 20 October 2016 London Fund Finance
Association Chris Elvin –
EuroGrowth 2016 20 - 21 October 2016 Barcelona ACG – –
FundForum NextGen Distribution
25 - 27 October 2016 Boston, MA KNect365 – –
Family Offi ce & Private Wealth Management Forum West
26 - 28 October 2016 Napa, CA Opal Finance Group – –
SuperReturn Private Credit 31 October - 2 November 2016 Chicago, IL KNect365 Ryan Flanders 10% Discount -
FKR2427PRQW
AIMA Middle East Alternative Investment Summit
1 - 2 November 2016 Dubai AIMA Amy Bensted –
Borrower & Investor Forum on Real Estate Mezzanine Financing & Subordinated Debt
1 November 2016 New York IMN – 10% Discount - PQ10
8th Annual Women’s Alternative Investment Summit (WAIS)
3 - 4 November 2016 New York Falk Marques Group – –
Emerging Managers Summit South
6 - 7 November 2016 Austin, TX Opal Finance Group – –
Elite Summit 7 - 9 November 2016 Montreux marcus evans Summits – –
Endowment & Foundation Forum
14 - 15 November 2016 Boston, MA Opal Finance Group – –
29th AVCJ Forum 15 - 17 November 2016 Hong Kong Mergermarket
Consulting Ltd. – –
SuperInvestor 15 - 18 November 2016 Amsterdam KNect365 Mark O'Hare 10% Discount -
FKR2386PNWB
Wealth Management Americas 2016
15 - 16 November 2016 Miami, FL Terrapinn – –
IP Dealmakers Forum 17 - 18 November 2016 New York The IP Investment
Institute – –
8th Annual Women’s Alternative Investment Summit (WAIS)
Date: 3 - 4 November 2016
Information: www.womensalternativeinvestmentsummit.com
Location: The Pierre, New York City
Organizer: Falk Marques Group
The 8th annual Women’s Alternative Investment Summit (November 3 - 4, 2016 at The Pierre, New York City). More than 400 of the top women in private equity and alternative investments — GPs, LPs, and advisors to the industry — will gather in New York for this timely, indispensible industry conference. WomensAlternativeInvestmentSummit.com
The Preqin Quarterly Update: Private Equity & Venture Capital, Q3 2016
Download the data pack at:www.preqin.com/quarterlyupdate
17© 2016 Preqin Ltd. / www.preqin.com
6th AIFM Directive 2016 Conference: Private Equity post Brexit
Date: 29 November 2016
Information: www.aifmdirective.co.uk
Location: CityPoint, One Ropemaker Street, London EC2Y 9SS
Organizer: Private Equity Forum
Brexit: what will it mean for private equity and venture capital? Through company case studies, in-depth presentations and panel discussions, Private Equity Forum’s 6th AIFM Directive 2016 Conference will provide you with clarification on the next series of changes to ensure you are aware of the necessary key actions and deadlines.
The IP Dealmakers Forum 2016
Date: 17 - 18 November 2016
Information: www.ipdealmakersforum.com
Location: Apella, New York City
Organizer: The IP Investment Institute
The IP Dealmakers Forum explores the challenges and opportunities in the rapidly changing IP marketplace. Although the IP market has evolved over the past several years, the lack of data, information, and transparency pose serious challenges to market efficiency. At the same time, this can mean unparalleled opportunities for investors that understand how to leverage the information available, manage risks and connect with the right players.
Wealth Management Americas 2016
Date: 15 - 16 November 2016
Information: www.terrapinn.com/WealthMiami
Location: Four Seasons Hotel, Miami, FL
Organizer: Terrapinn
The most senior executives from US and LatAm Private Banks and Family Offices will convene at Wealth Management Americas 2016. Across two days in November, private banks, wealth managers, family offices, asset managers, investment banks, accountants and consultants will gather explore the latest strategies, technologies and investment techniques from across the industry.
German Private Equity Conference
Date: 29 November 2016
Information: www.pe-conference.org/german
Location: Westin Grand Hotel, Frankfurt
Organizer: Private Equity Insights Ltd
The German Private Equity Conference will feature ten panel discussions, an inspiring keynote, and four hours of Pan-European networking opportunities. Contact Preqin for details of a 20% exclusive discount, and come and meet more than 80 LPs, 80 GPs, and 30 CEOs in Frankfurt on 29th November. See you there!
SuperReturn Africa
Date: 29 November - 1 December
Information: https://finance.knect365.com/superreturn-africa/purchase/select-package/vip/FKR2387PRQSP
Location: The Westin Cape Town
Organizer: KNect365
• 550+ senior-level attendees: Our largest audience yet!• 150+ local and international LPs looking to invest in the region • 100+ industry leading speakers: Largest speaker faculty ever!• 60+ in-depth sessions: Unparalleled scope & depth of content covered • Plus! Brand new Real Estate Summit on 1 December
The Preqin Quarterly Update: Private Equity & Venture Capital, Q3 2016
Download the data pack at:www.preqin.com/quarterlyupdate
18 © 2016 Preqin Ltd. / www.preqin.com
IPEM 2017
Date: 25 - 27 January 2017
Information: www.ipem-market.com
Location: Palais des Festivals, Cannes, France
Organizer: EUROPEXPO
Join 1,200 private equity leaders at IPEM 2017.IPEM is the only international event to provide the Private Equity industry with a marketplace to foster business opportunities between private and institutional investors, investment funds, service providers, and business owners seeking to support their company’s development.Benefit from a special fee with the promo code PREQIN17
CLO Summit
Date: 4 - 6 December 2016
Information: http://opalgroup.net/conference/clo-summit-2016/
Location: Monarch Beach Resort, Dana Point, CA
Organizer: Opal Group
Opal Group is proud to present our CLO Summit. The CLO Summit is an educational forum designed for investors, issuers, underwriters, rating agencies, lawyers and accountants. At this conference, they can learn the newest techniques to maximize returns and reduce risk exposure in this growing area of Asset-Backed Finance. An in-depth review of recent regulatory changes in addition to rating agency methodology, legal, tax and structural considerations will provide attendees with the tools necessary to stay one step ahead of their competitors.
THE MUST-ATTEND EVENT FOR SENIOR-LEVEL WOMEN IN PRIVATE EQUITY & ALTERNATIVES
Private Equity | Venture Capital | Hedge Fund | Real Estate | Debt | Real Assets
8th Annual
Women’s Alternative Investment Summit November 3–4, 2016 The Pierre, New York City
Join more than 400 of the top women in private equity and alternatives — GPs, LPs, and
advisors to the industry — as we gather in November in New York City for insightful and
candid discussions on fundraising, deal flow, portfolio management, liquidity, and more.
PLATINUM SPONSOR: GOLD SPONSORS:FOUNDER AND PRODUCER
WomensAlternativeInvestmentSummit.com | T: + 1 781.652.0900 | [email protected]
SILVER SPONSORS:
alternative assets. intelligent data.
Find out how Preqin’s range of private equity products and services can help you:
www.preqin.com/privateequity
Preqin Private Equity Online
With global coverage and detailed information on all aspects of the private equity asset class, Preqin’s industry-leading Private Equity Online services keep you up-to-date on all the latest developments in the private equity universe.
Source new investors for funds and co-investments
Find the most relevant investors, with access to detailed profi les for over 6,300 institutional investors actively investing in private equity, including future fund searches and mandates, direct contact information and sample investments.
Identify potential investment opportunities
View in-depth profi les for over 1,800 unlisted private equity funds currently in market, including information on investment strategy, geographic focus, key fundraising data, service providers used and sample investors.
Find active fund managers in private equity
Search for fi rms actively targeting private equity investments. View information on key contacts, fi rm fundraising and performance history, and applied strategies of the fi rm when investing in portfolio companies and assets.
Analyze the latest private equity fundraising activity
See which fi rms are currently on the road raising a private equity fund and which will be coming to market soon. Analyze fundraising over time by fund strategy and location.
See the latest buyout and venture capital deals and exits
View details of more than 150,000 buyout and venture capital deals, including deal value, buyers, sellers, debt fi nancing providers, fi nancial and legal advisors, exit details and more. Identify forthcoming exits and expected IPOs.
Benchmark performance
Identify which fund managers have the best track records, with performance benchmarks for private equity funds and performance details for over 6,500 individual named funds.
Examine fund terms
See the typical terms offered by funds of particular types, strategies and geographic foci, and assess the implications of making changes to different fees.
If you want any further information, or would like a demo of our products,
please contact us:
New York:One Grand Central Place
60 E 42nd Street, Suite 630New YorkNY 10165
Tel: +1 212 350 0100Fax: +1 440 445 9595
London:3rd Floor
Vintners’ Place68 Upper Thames Street
LondonEC4V 3BJ
Tel: +44 (0)20 3207 0200Fax: +44 (0)87 0330 5892
Singapore:One Finlayson Green, #11-02
Singapore 049246Tel: +65 6305 2200
Fax: +65 6491 5365
San Francisco:One Embarcadero Center
Suite 2850San Francisco
CA 94111Tel: +1 415 316 0580
Fax: +1 440 445 9595
Hong Kong:Level 9, Central Building
1-3 Pedder StreetCentral, Hong Kong
Tel: +852 3958 2819Fax: +852 3975 2800
Manila:Pascor Drive
Sto. NiñoParañaque City
Metro Manila 1700Philippines
Email: [email protected]: www.preqin.com
The Q3 2016Preqin Quarterly Update:
Private Equity & Venture Capital