Embed Size (px)
Citation preview

University of Trento
The pursuit of happiness: when work makes the difference Sara Depedri*
(Working draft) Please, do not cite without author’s permissions
Dr. Sara Depedri University of Trento, Department of Economics Via Inama, 5 – 38100 Trento, Italy Tel. +39 0461 882251 – Fax +39 0461 882222 E-mail address: [email protected] Sara Depedri is a research fellow at Trento University, Faculty of Economics, where she carries out researches in the field of economics of cooperation and nonprofit organizations, with special regard to human resources management, incentives structures, and payment systems. She is waiting to discuss of her doctoral thesis on incentives, preferences and complementarities in working relationships at the University of Siena.
Introduction In the last movie of Gabriele Muccino, “The pursuit of happiness”, the protagonist claims that
he achieved happiness when he got the job that represented his dream and mainly when he achieved
a better living standard. At the beginning of the movie, an insufficient level of income was the
principal obstacle for achieving happiness; at the end, a more remunerated job is its solution,
although at expense of the protagonist’s marriage.
On the contrary, recent empirical evidence and theoretical approaches have sustained that in
life satisfaction is not significantly influenced by the level of income. People give more importance
to other aspects of the life, such as relationships and family. Nevertheless, work is a significant
component in life and may partly explain happiness. Theoretical literature expresses controversial
opinions on work. From a first approach, job satisfaction can spill over into life satisfaction, since
attitudes and practices of individuals directly and positively influence other aspects of life (in terms
of relations, general perceptions, and well-being). From a different point of view, the more the
worker is dissatisfied with his or her job the more he or she tends to compensate with rewards and
aspects of satisfaction coming from another sphere of his or her life. Recent empirical studies
demonstrate the presence of both interrelations and in general, the positive relationship between job
and life satisfaction.
The investigation of work and employment characteristics is thus of great importance in
understanding happiness. The homo oeconomicus maturus constructs his process of evaluation on
different steps and summing up different factors that symbolize his well-being. Among these
components, work is certainly a significant one. At the same time, satisfaction at work is attracting
more attention of scientists and practitioners who study human resource management and working
environment. As a consequence, the research of happiness can not omit the investigation of work
satisfaction. This aspect has to therefore, estimate what job characteristics explain workers’
wellbeing and whether there is a correlation between job satisfaction and happiness considering
both socio-demographic characteristics of workers and organizational policies—especially in terms
of working environment and promotion of incentives for improving loyalty and effort.
Despite the variety of investigations on job satisfaction and happiness, little evidence exists on
the direct impact of working characteristics on satisfaction in life. More emphasis must be put in
order to understand the linkage between intrinsic and extrinsic aspects of the job and workers’ well-
being and to explain how salaries impact on job and life satisfactions. This paper moves in this
direction. Its proposal is to realize an empirical investigation on satisfaction in both life and at work.
Specifically, empirical models will be developed in order to understand: firstly, the correlation
between the two types of satisfaction; secondly, whether job characteristics and working attitudes

directly explain happiness; finally, which job features and workers explain the different levels of
job satisfaction and should thus be managed in order to ameliorate both job satisfaction and
happiness.
This paper is based on a research done in Italy in 1999 on a sample of 2000 individuals and
part of an international investigation on European values. The data will permit to ameliorate the
theoretical understanding of happiness, satisfaction with life and the job. Specifically, the data
verify in what circumstances the contents of the movie (i.e., the importance of income and work in
explaining happiness) and economic theory (i.e., the prevalence of other aspects of life in making
people happy) are complementary—rather than alternative—explanations of the achievement of life
satisfaction.
1. Happiness and job satisfaction in the empirical literature Happiness is one of the critical points in the analysis of people’s well-being. It influences not
only our lives, but also our will to communicate and interact with others, our behaviors and
approach with different aspects of the life. At the same time, these same and other many aspects are
not only the consequence but also a determinant of our happiness. The estimation of the general
well-being or satisfaction with life involves perceptions and evaluations on various components of
the way of living and each person may have (and surely have) different opinions on the relevance of
each one of this domain of life. It may be the case of the quality of one’s health, housing and
marriage (Van Praag and Ferrer-I-Carbonell, 2004), but it also involves enjoying oneself, meeting
people, experiences, having an exciting life, living in a lovely and familiar environment and
working.
Recurring to the definition of Maslow (1974), people have essentially five categories of needs
on which their lives are based and their work should respond to all them. These are; physiological
needs, needs of security (included stability, and protection), identification and involvement (both in
a society and in groups), esteem (as self-esteem and other rewards), and self-fulfillment (as
implementation of personal and professional ability). In addition, intrinsic motivations and social
preferences induce workers to evaluate their lives and their jobs as aspects which give them indirect
satisfaction and mainly have a positive impact on morality and social aspects of the life.
Consequently, happiness is the result of a mix of elements and satisfactions with different aspects of
life. It is also the result of different preferences and needs of people. Furthermore, it is possible to
claim that the more time spent in an activity the more this activity influences the general perception
of one’s life. For example, the family explains perceptions, preferences, behaviors and satisfaction
with many daily aspects, as in particular relationships and social preferences, but also economic

needs and decisions on the time to spent in different activities. In a similar way, many people spend
the major part of their time working and they naturally estimates their lives also on elements related
to their jobs.
Even though the relationship between work and life seems quite clear, scientists have rarely
analyzed it with specific approaches and empirical analysis. They have separately studied happiness
and job satisfaction. In the first case, the economics literature focuses on the relationship between
income (i.e., economic wellbeing) and happiness. In the second case, many analyses are developed
in order to understand job factors that explain workers’ satisfaction.
Among the most recent analyses on job satisfaction and happiness, Dolan and Gosselin (2000)
demonstrate the strong bond between the two variables and they support the hypotheses that people
draw utility from their jobs, which is then translated in satisfaction with their lives. Other studies
show that the state of unemployment is cause of unhappiness (Oswald, 1997; Dockery, 2005) and
this situation is mainly explained by anxiety, depression, loss of confidence and self-esteem which
characterizes unemployed people (Theoudossiou, 1998). People are also less satisfied with their
lives when giving more importance to job quality, and this result explains why workers’
expectations have a further role in determining general perceptions on both job and life satisfactions
(Dockery, 2005). This evidence could also clarify why, as emerged in other surveys, job satisfaction
and happiness are low in countries which are characterized by high indicators of national wellbeing
(as the U.N. Human Development Index in the analysis of Blanchflower and Oswald, 2005).
Furthermore, similar to what emerged in analyses on happiness and life satisfaction, job satisfaction
is only partially correlated with income. Specifically, happiness is strongly and positively
correlated—similarly to job satisfaction—with the change in the worker’s pay between waves, but it
does not increase with the level of pay (Clark, 1999). This also explains why the average happiness
of citizens is weakly or not correlated with their income or the per capita GNP of a nation.
Given the relevance of workers’ motivations and job characteristics during the life, given the
influence of job satisfaction on happiness, and given the unclear correlation between wellbeing and
wages, the specific investigation of work and job satisfaction becomes essential.
1.1. A survey on job satisfaction’s studies
When economists speak about job satisfaction, they refer to the well-being at work and
involves workers’ evaluation and perceptions on different aspects of the job that provide the
workers with material and psychological rewards. Similar to the notion of happiness, job
satisfaction is therefore the result of a complete process of evaluation and its determinants are a
composed of sets that includes characteristics of the worker, the job, and the organization.

Generally, the critical factors that explain job satisfaction can be separated into two categories.
Firstly, all external events, situations, and demographic characteristics that influence the workers’
perception of satisfaction. Secondly, individual’s feelings and characteristics. From this approach,
the environment and external conditions oppose personal and psychological elements (Diener,
1984). In a different analysis, job satisfaction depends on work-role inputs (e.g., level of education,
working hours, and effort) and work-role outputs (e.g., wage, career, job security, working
conditions, and intrinsic aspects, such as relations, autonomy, helping people and being useful to the
society). The former class includes all aspects of the job that cause pain or costs to workers, while
the latter consists of elements that give the worker direct and indirect—but also material and
immaterial—benefits or pleasures (Sousa-Poza and Sousa-Poza, 2000). The proposed classifications
are not alternative, but complementary. Furthermore, in a dynamic approach exogenous elements
and external institutions impact on job satisfaction and influence workers’ preferences and are
conforming to internal norms (Huang and Van de Vliert, 2002).
Looking at the main results of recent empirical researches, the complete understanding of job
satisfaction has to deal with alot of factors, which come from both the psychological and the
effective sphere. The gender is one of them, and females are significantly more satisfied with their
jobs than males. For Clark (1997), the reasons of these differences are principally found in four
variables: the type of jobs and performed activity (and in particular the tasks to which females are
devoted), the involvement in the organization, the propensity to leave the job, and their
expectations. With regards to this last aspect, expectations of women will be lower because their
lack of perfect mobility and of access to jobs, and the labour market offers less job opportunities,
which then decreases women’s expectations and are satisfied at a lower level of incentives. In a
specific investigation on Faculty members of Americans institutes (Bilimoria et.al, 2006), the larger
satisfaction of women is also explained by their positive perceptions of receiving internal relational
supports. Furthermore, a comparison among different activities and job characteristics demonstrates
that the higher expressed job satisfaction of women is the consequence of a self-selection process.
Female workers seem less interested in economic rewards (i.e., in having a good wage) and choose
jobs with highly valued attributes and characteristics more related to their tastes, and consequently
better satisfy them from a psychological point of view and better respond to their subjective
believes and preferences (Sloane and Williams, 2000). However, recent analyses have demonstrated
that in these last years, differences have significantly decreased (Sousa-Poza and Sousa-Poza,
2003), probably due to a converging expectations between males and females. This result leads to
conclude that certainly endogenous factors also influence personal perceptions and expectations,
and job satisfaction can change in a dynamic approach of learning and adaptation.
The level of education is correlated with job satisfaction in a dual manner (Tsang, 1991).
Firstly, the required education positively influences job satisfaction, and this is mainly due to the
increase in workers’ involvement in the activity, in the quality of the job and performed activity,
and in the freedom to decide (Meng, 1990). Secondly, the surplus education, intended as the excess
of education in comparison with the required level, is negatively correlated with job satisfaction,
since it is not correctly rewarded and recognized by the principal and expectations of these workers
are higher. This upshot could explain why in some investigations workers with higher levels of
education have comparative lower levels of satisfaction (Clark, 1996); especially when the income
is maintained constant and workers compare their wages (Clark and Oswald, 1996). Similar results
emerge also in other analyses (see for example Vila and Garcia-Mora, 2005), which confirm that
the main aspect of education that influences workers’ satisfaction is the matching between
employment and education. In this case, higher education also means greater opportunities to find a
better job that meets the workers’ preferences on non-monetary aspects. Nevertheless, when the
analysis isolates the effects of matching, education differently impacts on specific aspects of job
satisfaction. Specifically, the more the workers are educated, the more they are satisfied with the
pay, working hours, job stability, and the working conditions. But education on its own does not
significantly impact on satisfaction with the job as a whole.
Among other significant variables, age is correlated with job satisfaction in a U-shaped
function and specifically, a threshold-age exists over which satisfaction increases with age (Clark
and Oswald, 1996). The working hours are on the contrary negatively correlated with job
satisfaction as shown in some investigations (Clark, 1997; Clark and Oswald, 1996), but positively
in others (Bartel, 1981; Schwochau, 1987). These different results may be due to interferences of
preferences for education level and mainly for gender, since women generally declare less satisfied
when working hours increase (Sousa-Poza and Sousa-Poza, 2000). Contrasting results also emerge
in analyses on the level of agency of workers and in particular on their adherence to trade unions
(see also Gordon and Denisi, 1995; Meng, 1990). There is a positive correlation with job
satisfaction for some researchers (Miller, 1990) and a negative one for others (Schwochau, 1978).
Looking at the wage factor, both its direct and indirect impacts on job satisfaction have been
studied. On one hand, the relationship between the wage level and workers’ satisfaction frequently
results weak or undetermined (Cappelli e Sherer, 1988). Only when people have a high family
income they seem significantly more satisfied with their job, independently of their personal wage
(Sousa-Poza and Sousa-Poza, 2000) and this result contrast with the literature on happiness. On the
other hand, workers are more interested in the fairness of wages distribution (distributive justice)
than in their levels, and consequently workers’ perceptions of different and unjustified treatments

among workers interpose in the relationship between wage and satisfaction (Tortia, 2006). Similar
results and observations emerge when distributive fairness is calculated as the difference between
the effective and the expected wage, since the more the distance, the more the decrease in job
satisfaction (Cappelli e Sherer, 1988). Furthermore, the effect of economic rewards (i.e., increasing
wages) on job satisfaction is positive and significant when organizations implement policies of
budgetary participation linked to the transmission of information. In fact, high budgetary emphasis
and participation are associated with increasing satisfaction and good behaviors of workers. This is
mainly due to the opportunity of workers and managers to exchange and acquire information, for
workers to interact, communicate and cooperate with their superiors (Lau and Tan, 2003).
Among other characteristics, intrinsic aspects and social preferences assume great relevance.
Firstly, models which include specific intrinsic job aspects show that the variation of job
satisfaction is significantly explained by having an interesting job and good relations and that
relations with management principally influences the job satisfaction of women (Sousa-Poza and
Sousa-Poza, 2000). Moreover, intrinsic motivations are a source of empowerment, in the sense that
they influence the workers’ beliefs about the meaning of work, their competences, self-
determination and autonomy. Consequently, workers appreciate more their jobs and feel more
satisfied, even though motivations do not explicitly influence the relationship between
empowerment and job satisfaction (Hechanova, Alampay and Franco, 2006). Secondly, when
workers express high scores of agreement with proxies and assertions concerning altruism, they also
declare more satisfied with their job (Arciniega and Gonzalez, 2005).
Close to the workers personal and job characteristics, organizational features also
significantly influence job satisfaction: from working environment to management. A first approach
demonstrates that the legal type of enterprise significantly impacts on job satisfaction (civil servants
present different levels and different determinants of their satisfaction, as demonstrated by
Soonehee, 2002 and Lau, Tse, Zhou, 2002, while workers in nonprofit organizations are intensively
motivated and satisfied as in Leete, 1999, Mirvis and Hackett, 1983, and Borzaga, 2000). Job
satisfaction also differs from sector to sector (as asserted by Brown e McIntosh, 1998, in their study
on services) and depend on the dimension of the organization (workers in small business are
generally more satisfied with their job than others, as demonstrated by Rowden, 2002).
Nevertheless, organizational features have frequently an indirect impact on job satisfaction, due to
the intermediation of management styles.
It is demonstrated that: (i) participative management improves job satisfaction, especially
when workers are involved in strategic planning and in this phase great communication
characterizes the relationship between the manager and workers (Soonhee, 2002); (ii) policies
devoted to recognize the workers’ activity in terms of accountability to co-workers and
management positively influence job satisfaction, because the more the worker enjoys decision
making autonomy and the more the worker’s performance is clearly recognized by other people, the
more the worker is accountable for how well he or she works (Thoms, Dose and Scott, 2002); and
(iii) supporting workers’ training and workplace learning increases job satisfaction and in particular,
most of workers’ well-being is explained by informal learning, which is indirectly supported by the
working environment rather than by a formal training (Rowden, 2002).
Furthermore, not only the working environment, but also external institutions and norms are
determinants of job satisfaction when analyzing the psychological effect on workers’ adaptation and
dynamic evolution of preferences. In particular, intrinsic job rewards significantly influences job
satisfaction depending on the importance that people give to these variables in the society and their
recognition in the community. The same social environment gives work-related information which
permits workers to judge their job bearing in mind the social relevance of intrinsic aspects and other
incentives. In other words, the more the society evaluates intrinsic aspects and communicates this
preference to the worker, the more the worker will assess his or her job on the basis of the average
assessment of others. The general and relevant vision on intrinsic aspects of jobs that characterize a
country is the source of adaptation of workers’ preferences and job satisfaction (Huang and Van de
Vliert, 2002). In addition, other institutions influence workers’ preferences and expectations and
consequently, their job satisfaction. This is the case of regional economic prosperity (which is
negatively correlated with job satisfaction) and interaction of institutions in supporting economic
changes without a negative impact on workers’ perceptions and requests (see for example the case
of the transitional economics, where institutions have the role to reduce the negative impact on job
satisfaction of increasing working hours, flexibility, and temporality of contracts, as partially
sustained in Lau, Tse and Zhou, 2002).
Interests in job satisfaction come, however, not only from the knowledge of its determinants,
but also from the possible consequences of job satisfaction and dissatisfaction. Thus, as previously
reviewed, job satisfaction is one of the dimensions of life’s satisfaction.
2. The relevance of happiness, life and job satisfaction in Italy A research at a European and national level on the impact has recently been developed. Its
aim is not specifically linked to the study of happiness and job satisfaction, but it mainly analyzed
the values of Europeans. Nevertheless, both life and work are specific themes examined in this

investigation. Some characteristics of life and work, closely linked to the attraction to specific
aspects of work, generally define people’s perceptions and behaviors.
Given the specific questions and sections of the questionnaire that intensified the study of
satisfaction with life and work, the following subsections present the main results of both
investigations.
2.1. The sample
A recent analysis on Europeans’ values (the European Values Studies – EVS), which was
conducted in 1999 in all 25-UE member States (with exception of Cyprus) collected data on four
main areas: religion and morality, politics, work and free time, and primary relations. The total
sample consisted in 31.000 interviews.
In Italy, the data was collected by the Department of Sociology and Social Research of the
University of Trento and the sample interviewed two thousand people. Among them, 56% are
employed and consequently 1,115 interviewees will be considered when analyzing job elements.
All individuals however, express their opinions on the relevance of some job aspects, and so the
following analysis will also evaluate the emergence of different perceptions between employed and
unemployed people and the impact of these factors on workers’ happiness.
Interestingly in this analysis, the research asked the interviewees to judge both their happiness
(on a scale of four values equal to very, quite, not very, and not at all happy) and their satisfaction
with life (on an increasing scale of 1 to 10). The aim of this study is to distinguish a general sense of
happiness from a more detailed and comprehensive sense of satisfaction with all aspects of life.
Furthermore, a specific section of the questionnaire collects information on working conditions,
characteristics and perceptions. In detail, workers are asked information on extrinsic aspects of their
jobs (e.g., wage, security, stability, work-time, holidays and career), intrinsic aspects (e.g.,
relationships, sociality, and autonomy), job satisfaction and personal perceptions on some specific
aspects. This information will enable the matching of personal and professional data with levels of
happiness and satisfaction with life.
Looking at the main characteristics of the Italian sample1, it turns out to be equally composed
of males (48%) and females. Firstly, less than 10% is represented by people under the age of 25,
another 22.5% is composed of people from the age of 25 to 35, 18% from 35 to 45 years, and 34.5%
are over 55 years old. Only 43.7% has the compulsory school degree, another 41.4% have a
1 Due to problems of privacy of personal data, it has not been possible to have and present specific data on the European sample. Following results on other Countries are the only available, standing to the source of the research, national books, and articles.

diploma, while only the 15% have graduated, and this seems quite in line with the distribution of
the people among classes of age.
Secondly, with regards to job characteristics, 34.5% of the sample works more than 30 hours
and 8.8% works less than 30 hours a week, while the 10.8% is self-employed. Among the people
not working, retired people (18.8%) prevail over housewives (14.2%) and students (7.6%), while
4.5% are unemployed. Considering their economical situation, 26.6% have an annual family income
of less than 12,500 Euros, 18.9% have a family income between 12,500 and 17,000 Euros, 20.6%
between 17,000 and 23,000 Euros, 17,5% between 23,000 and 32,000 Euros, and the remaining
16.4% over 32,000 Euros. Furthermore, it emerges a very similar distribution between people
claiming that they are the people earning more in their family (45.2%) and others. Finally, only
6.7% of interviewees live alone, 18.3% with another person, 30% has a family composed of three
people, and 31.1% has a family composed of four people (only 14% more than four people).
In conclusion, the sample seems quite straightforward regarding different classes of people
and so we were able to carry out interesting comparisons. Even analyzing only employed
interviewees, the sample is representative and similarly distributed. Nevertheless, males prevail
over females (58% against 42%); younger people are reduced to 6% and workers included between
the age of 35 and 45 has grown to 26.4%; graduated people represent 22% of the total population;
family incomes mainly achieve 23,000 Euros per year (43.4%).
2.1.1. Happiness and life satisfaction
The first important question asked to people is: “All considered, how much are you happy?” .
Studies show that Italians tend to declare intermediate levels of happiness: 18.4% of them are very
happy, 61.8% quite happy, 16.5% not very happy, and only 3.3.% not happy at all. Not significantly
different is their satisfaction with the life, although the percentage of totally satisfied people is
higher: 18.6% declares scores under 5 (on a scale from 1 to 10), the 32.2% of interviewees assign
scores of 6 or 7, another 22.8% is satisfied with 8, and 26.5% is very satisfied (scores of 9 or 10).
Happiness and life satisfaction are a little higher for workers, who are not very or not at all
happy only in the 16.9% of the cases (opposite to 23.6% of not employed people) and are less
satisfied with their life (scores under 5) in 15.3% of the cases (with average scores of 7.3 and 7
respectively for employed and not employed people).
The specific analysis of happiness shows some interesting results, although differences in
happiness are in many cases not highly significant. The percentage of people very happy is the same
in men and women (with a slightly higher percentage in women not very happy, 18.7% vs. 14.1%
of men). Happiness only decreases with the age, 14% of people over 45 years are very happy,

compared to more than 22% of people happy are under 45 years. Happiness increases with the level
of education, people with compulsory school are a little less happy (probably in connection with
their age and age problems).Most educated people have the highest percentage quite happy (64%).
Also the personal income seems to positively influence happiness: people in the lowest class of
income (below 10,000 Euros per year) are in 9% of the cases not happy at all, while the percentage
of very happy people increases with their income (from 14% in the first class to 22% on average
when the yearly income is over 25,000 Euros). But the greatest difference emerges when
distinguishing interviewees for their civil status: married people are very happy in 20.3% of the
cases, and this percentage decreases for singles who have never married (18.1%) and mostly for
widowed, divorced and separated people (on average 10%).
The matching of happiness and the importance assigned by interviewees to some aspects of
the life is a proxy of the relevance that they assign to these factors in defining their total well-being.
Consequently, data permits one to claim that people are happier when considering both the family
and work as important aspects of the life. Furthermore, the highest percentage of very happy people
is revealed among interviewees who declare that friends’, acquaintances and leisure are very
important (24.5% and 23.6% respectively, of very happy people). Consequently, it seems that
happiness is mainly associated by people to enjoying aspects of their lives, even though work and
family are also relevant.
When the analysis only considers employed people, it emerges that, similar to the data on the
entire sample, the happiest classes of workers are the youngest (24% of very satisfied are below 35
years old) and people with intermediate levels of education (while only 16% of graduated workers
are very happy and 15% of them are not very happy). Furthermore, happiness increases for
subordinated workers employed full time or in general those working more than 30 hours a week
(20.7% of very satisfied opposed to 17.9% of part-timers and 13.9% of self-employed) and above a
certain level of income (with more than 20% of people very happy for classes of yearly income
above 17,000 Euros). The achieving of a minimum threshold of income seems thus a requirement of
feeling happy, although other factors and personal characteristics significantly influence the
workers’ level of happiness. Moreover, workers declare to be happier when they think that the most
important aspects of a jobs are: the presence of pleasant people (19.8% of people very happy
contrary to 16.4% of workers thinking that having pleasant colleagues is not important), doing a job
that is useful to the society (20.9% are very happy), enjoying generous holidays and meeting people
(both at 20.3%), and having a responsible job (20.9%). On the contrary, happiness is worst when
workers consider having a good wage as an important aspect of the job (18.3% are very happy
people compared to 22.9% of workers not interested in wage).

Results are very similar when considering life satisfaction, although in this analysis frequently
differences in average scores do not significantly vary with personal and living characteristics (as
emerged in the T-test and F-test analysis). It should be noted that people are more satisfied when
married (scores of 7.44), with a good family income (7.5 on average in the highest classes of
income), and when considering very important both family and work (average life satisfaction 7.2,
which decreases to 6.2 for not interested people). Furthermore, workers are a little less satisfied
with their life when employed part-time (7.03 compared with 7.32 of self-employed and full-time
workers) or with a role of unskilled manual or agriculture worker (6.35 on average, compared to the
maximal values of 8.48 of armed forces, 7.74 for employers with more than 10 employees, and
values close to 7.5 for other employers, non manual officers, supervisors and foremen). Their
satisfaction instead increase if they do not consider as important in their job having a good wage
(average life satisfaction of 7.4 compared to 7.25 of others), but it is relevant meeting people and
working with pleasant people (scores of 0.3 point above the average). Finally, workers’ satisfaction
with life is strictly linked to satisfaction with both the job as a whole and job security.
In conclusion, the data show the presence of two groups of happy workers (and in general
people). The first one is mainly composed of young people and singles, who estimate their
happiness on the basis of their leisure and relationships. The second group of workers, which is
mainly but not exclusively composed of married people, who evaluate happiness mainly by
considering psychological aspects and looking to intrinsic factors of the job (e.g., usefulness to
others, relationships with colleagues, responsibility, etc.). For all workers, having a satisfying job
and good opportunities of remaining in the organization are two important aspects for their life, and
this supports the hypothesis that different characteristics of the job, and significantly its stability,
influences beliefs, expectations, and projects of workers with regards to both their work and their
life. These arguments are therefore strictly linked.
2.1.2. The importance of work and of specific aspects of the job
A first interesting result emerges when asking all individuals the relevance they allocate to
work. 61.7% of interviewees considers work as very important, and another 33.3% as quite
relevant. Only 5% claims that it has few or no relevance. Furthermore, though work is perceived as
less important than the family (important for 90% of interviewees), it is significantly more relevant
than free-time (since only 30% of interviewees asserts its relevance).
Looking at singular aspects of the job (Chart 1), the preferences of Italian people reveal that
they assign great importance to aspects such as a good pay (85%), job security, having an
interesting job, but also achieving something with one’s own activity and meeting abilities (all

aspects which are relevant to 75% of interviewees). On the other hand, holidays, careers and
promotions, and having a responsible job are not important. Moreover, Italian people are more
interested than other Europeans in intrinsic or non-economic aspects. In particular, Italy stands on
top of the list of European countries where workers consider the importance of job elements such as
using personal initiative, social usefulness, but also rewarding of ability and interest of the activity.
Among extrinsic aspects of the work, significantly higher than the average of Europe is the attention
to job security and working hours.
Analyzing the single sample of employed people, it emerges that relating themselves with
pleasant people, using initiative and achieving something that increases their importance and
becoming very important are 73.5%, 67.5%, and 77% respectively of employees. On the contrary,
job security and chances for promotion lose part of their importance (and they are relevant only for
72.5% and 44% respectively of employees).
0,00
10,00
20,00
30,00
40,00
50,00
60,00
70,00
80,00
90,00
%
good
pay
job
secu
rity
inte
rest
ing
job
achi
evin
g so
met
hing
mee
ting
abili
ties
plea
sent
peo
ple
good
phy
sica
l wor
k.co
nditi
on
mee
ting
peop
le
usef
ul fo
r soc
iety
use
initi
ativ
e
goos
hou
rs
resp
ecte
d jo
b
not t
oo m
uch
pres
sure
time
off i
n w
eeke
nds
resp
onsi
ble
job
chan
ces f
or p
rom
otio
n
gene
rous
hol
iday
s
Chart 2 - Importance of some aspects of the job for Italian employees

Important results emerge also when distinguishing people by personal and professional
characteristics (Table 1). This study permits one to understand the preferences of individuals, and
specifically their different approach with the job and the working life. Thus, firstly, males are
significantly more interested in promotion opportunities (48.7% of males in comparison with 38.1%
females), the exploitation of initiatives on the job (relevant for 71% against 63% for females) and
responsibility (59.5% against 46.5%). Females are more attracted by the presence of pleasant
people, having good working hours and job security (which are marked by 75.2%, 66%, and 75.7%
respectively of females).
Secondly, more educated people express less interest for good pay (important for 80.8% of
graduated employees, in comparison to an average of 90% among people with the compulsory
degree) and meeting pleasant people on the job (68% against 80%), while they are significantly
more interested in jobs permitting the use of personal initiatives (signed by 78% respect to 66%)
and having an interesting job (79.3% against 70% for less educated classes).
Moreover, younger employees declare to be more enthusiastic and assign high scores of
importance to several aspects of the job. Compared to elderly people, they consider to be more
important the quality of relations (84.8% of them sign as relevant the presence of pleasant people
and 80.3% the opportunity of meeting people, against percentages under 70% among over 55-
years), job security (relevant of 80.3% of the younger people), having an interesting job (for
83.3%), a job useful for the society and good working hours (important for 71.2% and 69.7%
respective). Finally, strictly and negatively related with age is the importance of a good pay (signed
by 91% of youngest and by the 79% of oldest), and consequently it is possible to claim that intrinsic
aspects of the job are a focus for young employees, but also economic reward are considered as
essential, especially in the evolution of the working life. This should explain the fact that pure wage
is not crucial for people with great work experience.
taking into consideration roles and professional positions, skilled and unskilled workers
assign more relevance to job security. On the other hand, employees in higher socio-economic
classes consider as more relevant to use initiative (72.6%) and having an interesting job (75.3%)
and as less important having a respectable job (46.6% against 70.8% for unskilled workers) and
good working hours. Consequently, they are more feasible in sacrificing their time for the job
whether it gives them professional satisfaction or not. No differences emerge in preferences for
different aspects of the job among people with different job positions and levels of autonomy.
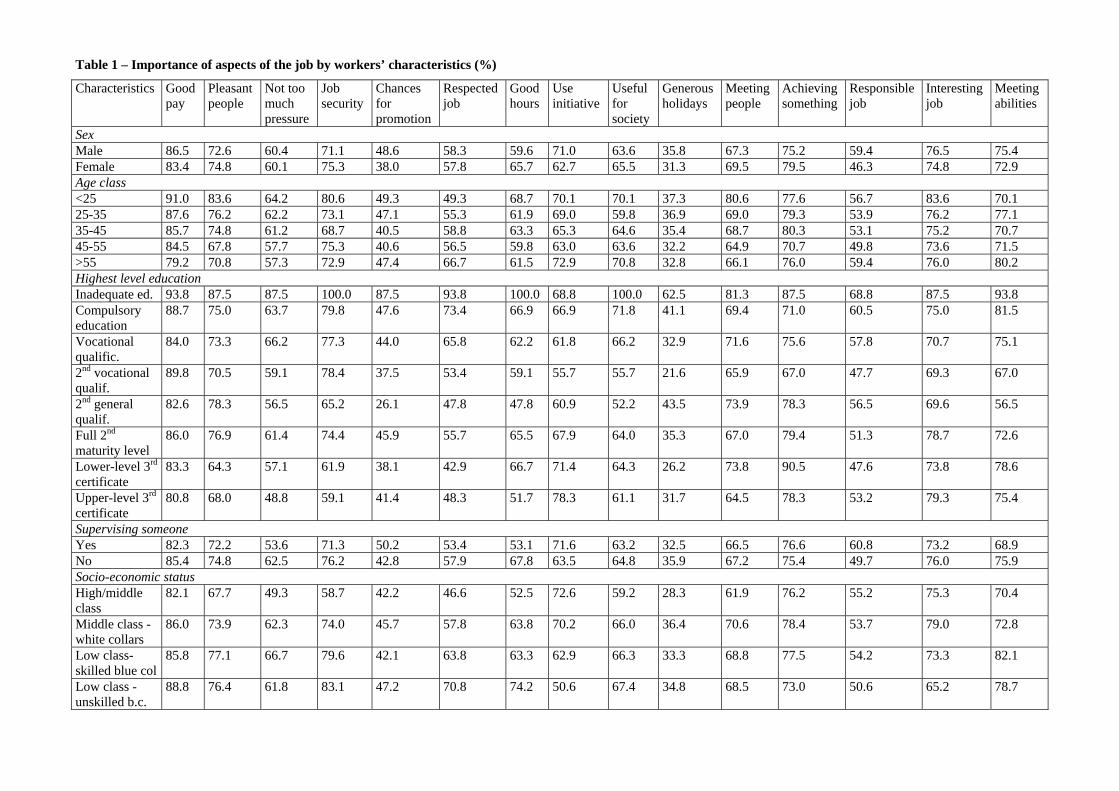
Table 1 – Importance of aspects of the job by workers’ characteristics (%)
Characteristics Good pay
Pleasant people
Not too much pressure
Job security
Chances for promotion
Respected job
Good hours
Use initiative
Useful for society
Generous holidays
Meeting people
Achieving something
Responsible job
Interesting job
Meeting abilities
Sex Male 86.5 72.6 60.4 71.1 48.6 58.3 59.6 71.0 63.6 35.8 67.3 75.2 59.4 76.5 75.4 Female 83.4 74.8 60.1 75.3 38.0 57.8 65.7 62.7 65.5 31.3 69.5 79.5 46.3 74.8 72.9 Age class <25 91.0 83.6 64.2 80.6 49.3 49.3 68.7 70.1 70.1 37.3 80.6 77.6 56.7 83.6 70.1 25-35 87.6 76.2 62.2 73.1 47.1 55.3 61.9 69.0 59.8 36.9 69.0 79.3 53.9 76.2 77.1 35-45 85.7 74.8 61.2 68.7 40.5 58.8 63.3 65.3 64.6 35.4 68.7 80.3 53.1 75.2 70.7 45-55 84.5 67.8 57.7 75.3 40.6 56.5 59.8 63.0 63.6 32.2 64.9 70.7 49.8 73.6 71.5 >55 79.2 70.8 57.3 72.9 47.4 66.7 61.5 72.9 70.8 32.8 66.1 76.0 59.4 76.0 80.2 Highest level education Inadequate ed. 93.8 87.5 87.5 100.0 87.5 93.8 100.0 68.8 100.0 62.5 81.3 87.5 68.8 87.5 93.8 Compulsory education
88.7 75.0 63.7 79.8 47.6 73.4 66.9 66.9 71.8 41.1 69.4 71.0 60.5 75.0 81.5
Vocational qualific.
84.0 73.3 66.2 77.3 44.0 65.8 62.2 61.8 66.2 32.9 71.6 75.6 57.8 70.7 75.1
2nd vocational qualif.
89.8 70.5 59.1 78.4 37.5 53.4 59.1 55.7 55.7 21.6 65.9 67.0 47.7 69.3 67.0
2nd general qualif.
82.6 78.3 56.5 65.2 26.1 47.8 47.8 60.9 52.2 43.5 73.9 78.3 56.5 69.6 56.5
Full 2nd maturity level
86.0 76.9 61.4 74.4 45.9 55.7 65.5 67.9 64.0 35.3 67.0 79.4 51.3 78.7 72.6
Lower-level 3rd certificate
83.3 64.3 57.1 61.9 38.1 42.9 66.7 71.4 64.3 26.2 73.8 90.5 47.6 73.8 78.6
Upper-level 3rd certificate
80.8 68.0 48.8 59.1 41.4 48.3 51.7 78.3 61.1 31.7 64.5 78.3 53.2 79.3 75.4
Supervising someone Yes 82.3 72.2 53.6 71.3 50.2 53.4 53.1 71.6 63.2 32.5 66.5 76.6 60.8 73.2 68.9 No 85.4 74.8 62.5 76.2 42.8 57.9 67.8 63.5 64.8 35.9 67.2 75.4 49.7 76.0 75.9 Socio-economic status High/middle class
82.1 67.7 49.3 58.7 42.2 46.6 52.5 72.6 59.2 28.3 61.9 76.2 55.2 75.3 70.4
Middle class - white collars
86.0 73.9 62.3 74.0 45.7 57.8 63.8 70.2 66.0 36.4 70.6 78.4 53.7 79.0 72.8
Low class- skilled blue col
85.8 77.1 66.7 79.6 42.1 63.8 63.3 62.9 66.3 33.3 68.8 77.5 54.2 73.3 82.1
Low class - unskilled b.c.
88.8 76.4 61.8 83.1 47.2 70.8 74.2 50.6 67.4 34.8 68.5 73.0 50.6 65.2 78.7

2.1.3. Perceptions on the job and feeling of fairness
The survey also includes some questions that shade light on fairness and the significance of
the job. Data has to be treated with some caution, because it is not specific to the individual working
environment, but they investigate in general people’s sensibility and inequity aversion.
Nevertheless, it should be firstly noted that the majority of workers2 assign to work both personal
and social relevance. They declare that work is necessary to fully develop one’s own talents (31.3%
of them strongly agree and another 41.4% agree with affirmation), that people not working turn out
to be lazy (32.1% strongly agree and 42.4% agree) and that working is also a duty towards society
(22.7% strongly agree and 43.0% agree).
Furthermore, workers are unequally averse to unkindly treatments and to rewards which do
not take into account personal characteristics and effort. In fact, the majority of interviewees agree
with the assertion that receiving money without working is unfair (28.4% agree strongly, 37%
agree) and consider fair that managers reward with higher salaries those who work more and better
than others.
Finally, workers are also asked to judge if sticking to superiors’ instructions is always a duty
or whether it is necessary to first be convinced on one’s own actions and behaviors. The data reveal
that only 23.7% of the of cases agree in following instructions to work, while the majority of them
consider as important to be convinced first or that it depends on the different cases (42.9%).
Consequently, most workers perceive instructions as a form of bureaucracy, control and limitation
to personal autonomy, and only in limited cases, workers interpret them as a mechanism of
transparent communication and transmission of information, which are used to make kind and clear
internal processes.
2.1.4. Job satisfaction
Assuming the described general preferences and perceptions, the analysis shifts to specific
esteems of workers’ satisfaction. On average, in Europe half of the workers assign to job
satisfaction scores over 8, on a scale of 1 to 10. Italian data reflects this result, since people assign
to job satisfaction an average score of 7.7. In particular (Table 2), only 15.9% of the sample is
unsatisfied (assigning scores under 5), while about 54% is very satisfied (assigning scores over 8).
This is a really good result, even though in other countries (as in Malta and Denmark) the
percentage of very satisfied people reaches 70%. In comparison with the level of general happiness,
it should be noted that only 20% of Italians declares very happy and another 65% is quite happy.
2 All data described in the table and in the text are referred only to workers. However, they do not differ significantly (or not at all) from those characterizing the entire sample of interviewees.

Moreover, Italian employees seem very satisfied also for their job security. The majority of
interviewees assign to job security scores of satisfaction over 8 (50.3%), while dissatisfaction
(scores under 5) is declared only by 25%. Less satisfying is the employees’ freedom in decision
taking because only 62% of employees declare to be free on the job.
Table 2 – Job satisfaction, satisfaction with job security, and freedom on the job (%)
1 (dissatisfied)
2 3 4 5 6 7 8 9 10 (satisfied)
Job satisfaction 2.0 1.3 2.3 3.5 6.8 11.1 19.2 25.6 13.0 15.2 Satisfaction with job security 4.5 2.1 3.3 4.5 10.5 9.9 14.9 19.0 11.4 19.9 Freedom in decision-making 6.2 2.3 5.0 5.7 11.1 11.9 15.1 18.0 9.0 15.7
Consequently, summing up some conclusions with previous data on the importance of
different aspect of the job, it is possible to claim that, averagely, Italian people are fulfilled with
their job and life. A cluster analysis that combines job satisfaction and with specific aspects of it
confirms that Italians are ‘pro-quality of the job’. They judge as very important all aspects of the job
and in particular of the work-life, and are very satisfied with the work in general, even if some
regional labor markets are characterized by high levels of unemployment.
Obviously, these data are valid only on average. In fact, when the analysis distinguishes
interviewees for personal and professional characteristics, significant differences emerge (Table 3).
Firstly, an analysis by gender demonstrates that satisfaction with the job is quite similar for males
and females (7.5 in comparison with 7.1). Nevertheless, the former are more satisfied by their job
security than the latter (in line with literature) and they are also receiving more freedom in decision
making than female.
Secondly, when distinguishing by level of education, satisfaction with the job not
significantly differs among groups of employees, and the situation is similar in the satisfaction with
job security (average scores of 7.1 among graduated people and employees with a secondary school
degree compared to 6.9 among others). Nevertheless, it is quite obvious that more educated
employees enjoy more freedom in decision making (average scores of 7.2 in comparison with
scores under 6.5 for other classes).
Significant differences emerge when distinguishing employees by age. Job satisfaction is
positively correlated with the age, since it increases by 6.8 among employees less than 25 years of
age to the 7.9 of people over 55 years. Satisfaction with job security is also for younger people on
average lower than for older employees (scores of 6.1 in the first age-class, 6.4 in the second one,
and 7.5 in the last classes respectively), and a similar increase is registered for freedom in decision
making—which grows from 5.5 to 7.5.
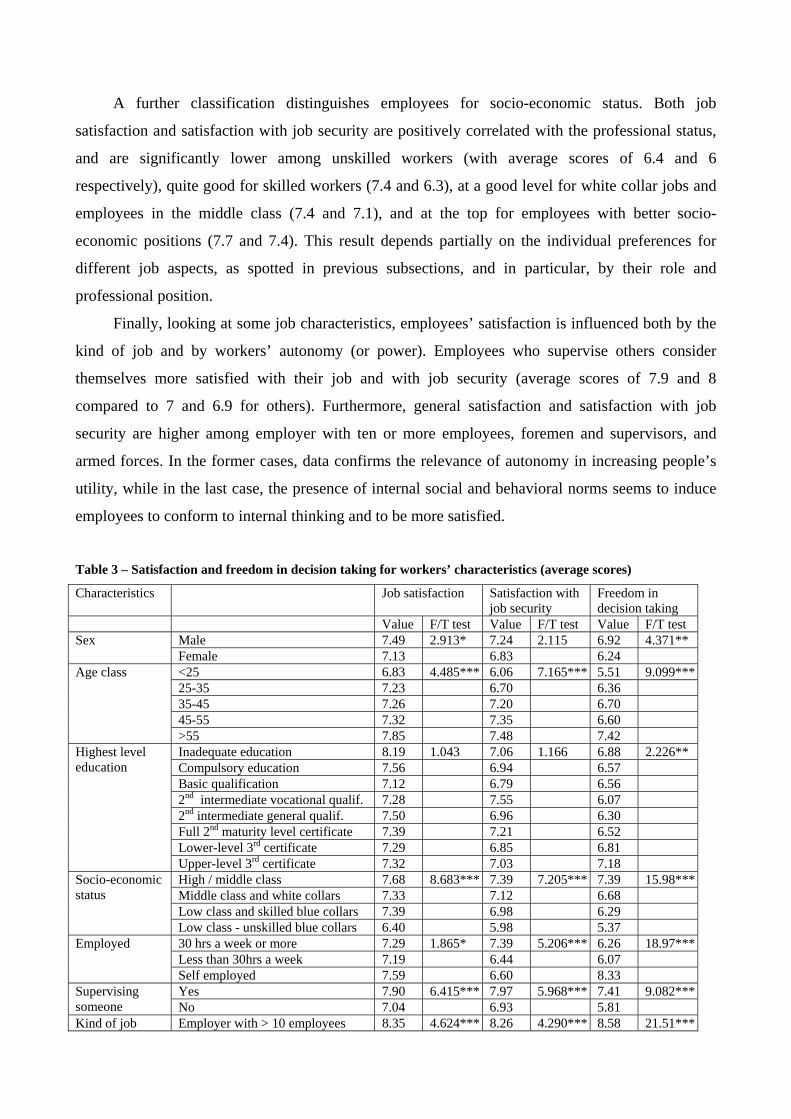
A further classification distinguishes employees for socio-economic status. Both job
satisfaction and satisfaction with job security are positively correlated with the professional status,
and are significantly lower among unskilled workers (with average scores of 6.4 and 6
respectively), quite good for skilled workers (7.4 and 6.3), at a good level for white collar jobs and
employees in the middle class (7.4 and 7.1), and at the top for employees with better socio-
economic positions (7.7 and 7.4). This result depends partially on the individual preferences for
different job aspects, as spotted in previous subsections, and in particular, by their role and
professional position.
Finally, looking at some job characteristics, employees’ satisfaction is influenced both by the
kind of job and by workers’ autonomy (or power). Employees who supervise others consider
themselves more satisfied with their job and with job security (average scores of 7.9 and 8
compared to 7 and 6.9 for others). Furthermore, general satisfaction and satisfaction with job
security are higher among employer with ten or more employees, foremen and supervisors, and
armed forces. In the former cases, data confirms the relevance of autonomy in increasing people’s
utility, while in the last case, the presence of internal social and behavioral norms seems to induce
employees to conform to internal thinking and to be more satisfied.
Table 3 – Satisfaction and freedom in decision taking for workers’ characteristics (average scores)
Characteristics Job satisfaction Satisfaction with job security
Freedom in decision taking
Value F/T test Value F/T test Value F/T test Male 7.49 2.913* 7.24 2.115 6.92 4.371** Sex Female 7.13 6.83 6.24 <25 6.83 4.485*** 6.06 7.165*** 5.51 9.099***25-35 7.23 6.70 6.36 35-45 7.26 7.20 6.70 45-55 7.32 7.35 6.60
Age class
>55 7.85 7.48 7.42 Inadequate education 8.19 1.043 7.06 1.166 6.88 2.226** Compulsory education 7.56 6.94 6.57 Basic qualification 7.12 6.79 6.56 2nd intermediate vocational qualif. 7.28 7.55 6.07 2nd intermediate general qualif. 7.50 6.96 6.30 Full 2nd maturity level certificate 7.39 7.21 6.52 Lower-level 3rd certificate 7.29 6.85 6.81
Highest level education
Upper-level 3rd certificate 7.32 7.03 7.18 High / middle class 7.68 8.683*** 7.39 7.205*** 7.39 15.98***Middle class and white collars 7.33 7.12 6.68 Low class and skilled blue collars 7.39 6.98 6.29
Socio-economic status
Low class - unskilled blue collars 6.40 5.98 5.37 30 hrs a week or more 7.29 1.865* 7.39 5.206*** 6.26 18.97***Less than 30hrs a week 7.19 6.44 6.07
Employed
Self employed 7.59 6.60 8.33 Yes 7.90 6.415*** 7.97 5.968*** 7.41 9.082***Supervising
someone No 7.04 6.93 5.81 Kind of job Employer with > 10 employees 8.35 4.624*** 8.26 4.290*** 8.58 21.51***

Employer with < 10 employees 7.80 7.10 8.35 Professional worker 7.52 6.88 7.42 Manual-office worker 7.10 7.49 6.21 Non-manual-office worker 7.22 7.23 5.66 Foreman and supervisor 7.88 7.60 6.63 Skilled manual worker 7.25 6.92 6.22 Semi-skilled manual worker 7.13 6.74 5.41 Unskilled manual worker 6.32 6.20 4.82 Farmer: employer or own account 7.21 6.68 8.16 Agricultural worker 6.50 5.63 6.63 Armed forces 8.18 8.79 6.28
2.2. Explaining happiness and life satisfaction
The development of some multinomial models explains the determinants of happiness and life
satisfaction, with attention to both the factors classically considered in the literature and specific
aspects of the job and working life. Furthermore, the comparison among these models shows
whether the concept of happiness is different from satisfaction with life.
When the analysis is done on personal characteristics of people (table 4), both happiness and
life satisfaction are significantly explained by interrelations—since people feel better when the time
spent with their colleagues increases—and morality—since their wellbeing increases when people
think that helping the elderly is fair. Nevertheless, the contribution to public goods is not a sensible
factor of well-being, but on the contrary the more people claim that taking advantage of state
benefits is justifiable the more they are happy and satisfied with their lives. Italians are also more
satisfied when living in the North-West (where, on average, the living standard is higher than in the
South), and married. This last result confirms that the family environment is an important source of
wellbeing. The level of education, the gender of people, other psychological characteristics
(approximated by opinions on different aspects of life and social norms), and the household income
are irrelevant factors. These models seem to therefore confirm previous investigations and the
opinion that happiness is not influenced by income.
Looking at differences between the determinants of happiness and life satisfaction, the model
shows that happiness is negatively correlated with age and positively correlated with the time spent
with friends and in the church. On the contrary, foreigners are generally less happier than others.
Consequently, it is possible to claim that happiness has an intrinsic meaning of amusement, while
life satisfaction has a higher component of psychological wellbeing and its definition frequently
does not depend on personal or definable characteristics (as supported in the model by the high
significance of the constant).
Table 4 – The impact of personal aspects on happiness and life satisfaction (ordered probit model)
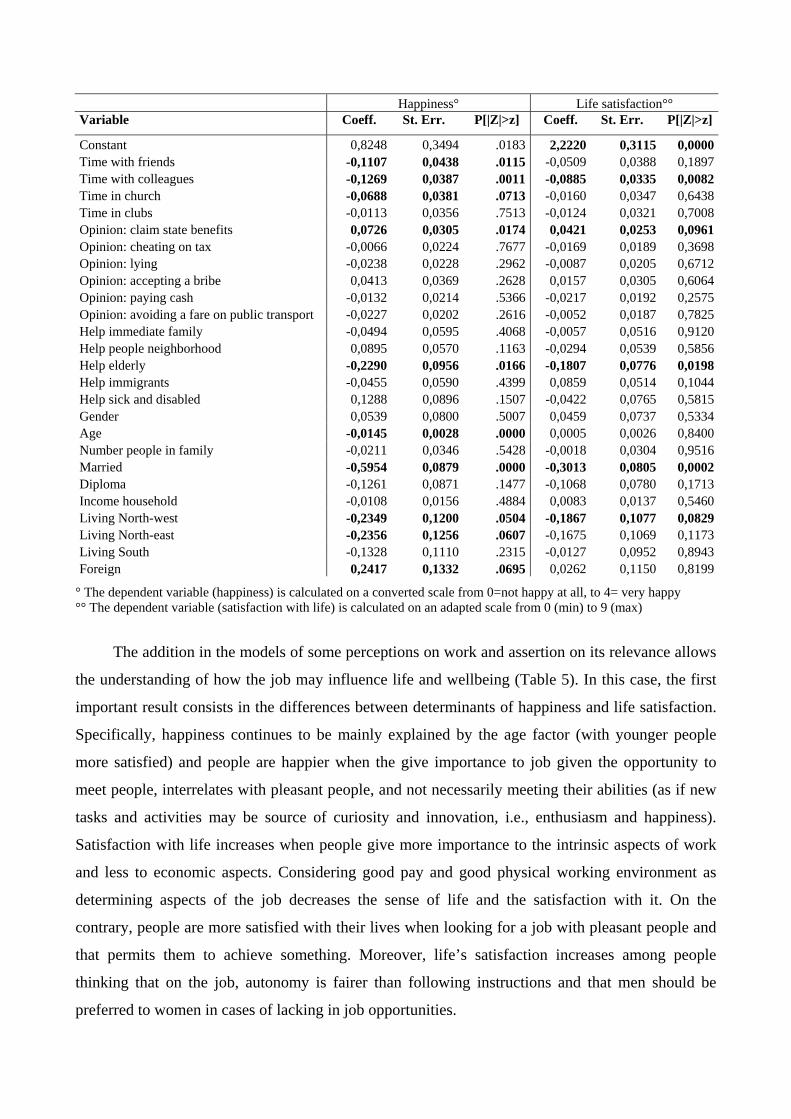
Happiness° Life satisfaction°° Variable Coeff. St. Err. P[|Z|>z] Coeff. St. Err. P[|Z|>z]
Constant 0,8248 0,3494 .0183 2,2220 0,3115 0,0000Time with friends -0,1107 0,0438 .0115 -0,0509 0,0388 0,1897Time with colleagues -0,1269 0,0387 .0011 -0,0885 0,0335 0,0082Time in church -0,0688 0,0381 .0713 -0,0160 0,0347 0,6438Time in clubs -0,0113 0,0356 .7513 -0,0124 0,0321 0,7008Opinion: claim state benefits 0,0726 0,0305 .0174 0,0421 0,0253 0,0961Opinion: cheating on tax -0,0066 0,0224 .7677 -0,0169 0,0189 0,3698Opinion: lying -0,0238 0,0228 .2962 -0,0087 0,0205 0,6712Opinion: accepting a bribe 0,0413 0,0369 .2628 0,0157 0,0305 0,6064Opinion: paying cash -0,0132 0,0214 .5366 -0,0217 0,0192 0,2575Opinion: avoiding a fare on public transport -0,0227 0,0202 .2616 -0,0052 0,0187 0,7825Help immediate family -0,0494 0,0595 .4068 -0,0057 0,0516 0,9120Help people neighborhood 0,0895 0,0570 .1163 -0,0294 0,0539 0,5856Help elderly -0,2290 0,0956 .0166 -0,1807 0,0776 0,0198Help immigrants -0,0455 0,0590 .4399 0,0859 0,0514 0,1044Help sick and disabled 0,1288 0,0896 .1507 -0,0422 0,0765 0,5815Gender 0,0539 0,0800 .5007 0,0459 0,0737 0,5334Age -0,0145 0,0028 .0000 0,0005 0,0026 0,8400Number people in family -0,0211 0,0346 .5428 -0,0018 0,0304 0,9516Married -0,5954 0,0879 .0000 -0,3013 0,0805 0,0002Diploma -0,1261 0,0871 .1477 -0,1068 0,0780 0,1713Income household -0,0108 0,0156 .4884 0,0083 0,0137 0,5460Living North-west -0,2349 0,1200 .0504 -0,1867 0,1077 0,0829Living North-east -0,2356 0,1256 .0607 -0,1675 0,1069 0,1173Living South -0,1328 0,1110 .2315 -0,0127 0,0952 0,8943Foreign 0,2417 0,1332 .0695 0,0262 0,1150 0,8199
° The dependent variable (happiness) is calculated on a converted scale from 0=not happy at all, to 4= very happy °° The dependent variable (satisfaction with life) is calculated on an adapted scale from 0 (min) to 9 (max)
The addition in the models of some perceptions on work and assertion on its relevance allows
the understanding of how the job may influence life and wellbeing (Table 5). In this case, the first
important result consists in the differences between determinants of happiness and life satisfaction.
Specifically, happiness continues to be mainly explained by the age factor (with younger people
more satisfied) and people are happier when the give importance to job given the opportunity to
meet people, interrelates with pleasant people, and not necessarily meeting their abilities (as if new
tasks and activities may be source of curiosity and innovation, i.e., enthusiasm and happiness).
Satisfaction with life increases when people give more importance to the intrinsic aspects of work
and less to economic aspects. Considering good pay and good physical working environment as
determining aspects of the job decreases the sense of life and the satisfaction with it. On the
contrary, people are more satisfied with their lives when looking for a job with pleasant people and
that permits them to achieve something. Moreover, life’s satisfaction increases among people
thinking that on the job, autonomy is fairer than following instructions and that men should be
preferred to women in cases of lacking in job opportunities.

Interestingly, in both models income becomes significantly and positively correlated with
wellbeing. Income seems therefore a determinant of people’s perceptions when they assume a
concrete view of the life and link happiness and satisfaction to the job. However, this result
contrasts with the assertion on the relevance of the job, since people are more satisfied when richer
but disinterested in a good wage. The perception of financial security is probably the discriminating
factor in interpreting these results. The achievement of an income’s threshold gives people both a
concrete and a psychological wellbeing; and when the weight assigned to wage is low (i.e.,
interviewees consider not essential on work having a good wage) people are also satisfied at lower
levels of income.
Table 5 – The impact of factors of work on happiness and life satisfaction (ordered probit model)
Happiness Life satisfaction
Variable Coeff. St. Err. P[|Z|>z] Coeff. St. Err. P[|Z|>z]
Constant -0,6092 0,2508 .0151 1,1208 0,2220 0,0000Good pay -0,1391 0,0977 .1545 -0,1517 0,0871 0,0814Pleasant people 0,1962 0,0902 .0296 0,2484 0,0781 0,0015Not too much pressure -0,1164 0,0839 .1652 -0,0728 0,0718 0,3105Job security 0,0812 0,0939 .3868 -0,0695 0,0860 0,4189Chances for promotion -0,0009 0,0771 .9909 0,0119 0,0699 0,8651Respected job -0,0119 0,0783 .8797 -0,0469 0,0726 0,5180Good hours 0,0489 0,0906 .5895 - - -Use initiative 0,0898 0,0925 .3316 0,0717 0,0753 0,3413Useful for society 0,1465 0,0905 .1055 0,0465 0,0782 0,5519Generous holidays 0,0443 0,0792 .5763 - - -Meeting people 0,2439 0,0862 .0047 0,2283 0,0765 0,0028Achieving something -0,1266 0,1000 .2054 -0,0864 0,0845 0,3067Interesting job 0,0395 0,1014 .6972 0,0077 0,0821 0,9248Meeting abilities -0,1687 0,0913 .0648 -0,1822 0,0794 0,0217Good physical working conditions -0,1240 0,0947 .1903 -0,0088 0,0836 0,9160Time off in week-ends -0,0434 0,0810 .5923 0,0301 0,0684 0,6600Job needed to develop talents -0,0264 0,0357 .4599 -0,0473 0,0321 0,1412Receiving money without working -0,0343 0,0309 .2674 -0,0054 0,0278 0,8469Turning lazy not working -0,0340 0,0372 .3614 -0,0195 0,0325 0,5480Duty towards society -0,0441 0,0381 .2471 -0,0339 0,0345 0,3259Not having to work -0,0378 0,0320 .2385 -0,0169 0,0283 0,5495Work always first 0,0348 0,0319 .2762 -0,0125 0,0283 0,6593Fair that quicker is paid more -0,0121 0,0823 .8831 -0,0129 0,0707 0,8558Following instructions at work 0,0130 0,0411 .7523 0,0738 0,0365 0,0434Giving nation priority 0,0523 0,0480 .2756 0,0703 0,0432 0,1038Giving men priority 0,0335 0,0545 .5389 -0,0847 0,0481 0,0786Jobs local people -0,0788 0,0507 .1199 -0,0657 0,0443 0,1380Gender -0,0761 0,0679 .2624 -0,0728 0,0613 0,2350Age -0,0093 0,0022 .0000 0,0024 0,0019 0,2044Degree 0,1592 0,1066 .1353 0,2170 0,1060 0,0406Compulsory school -0,0823 0,0836 .3246 -0,0070 0,0725 0,9228Income household 0,0347 0,0125 .0056 0,0422 0,0113 0,0002
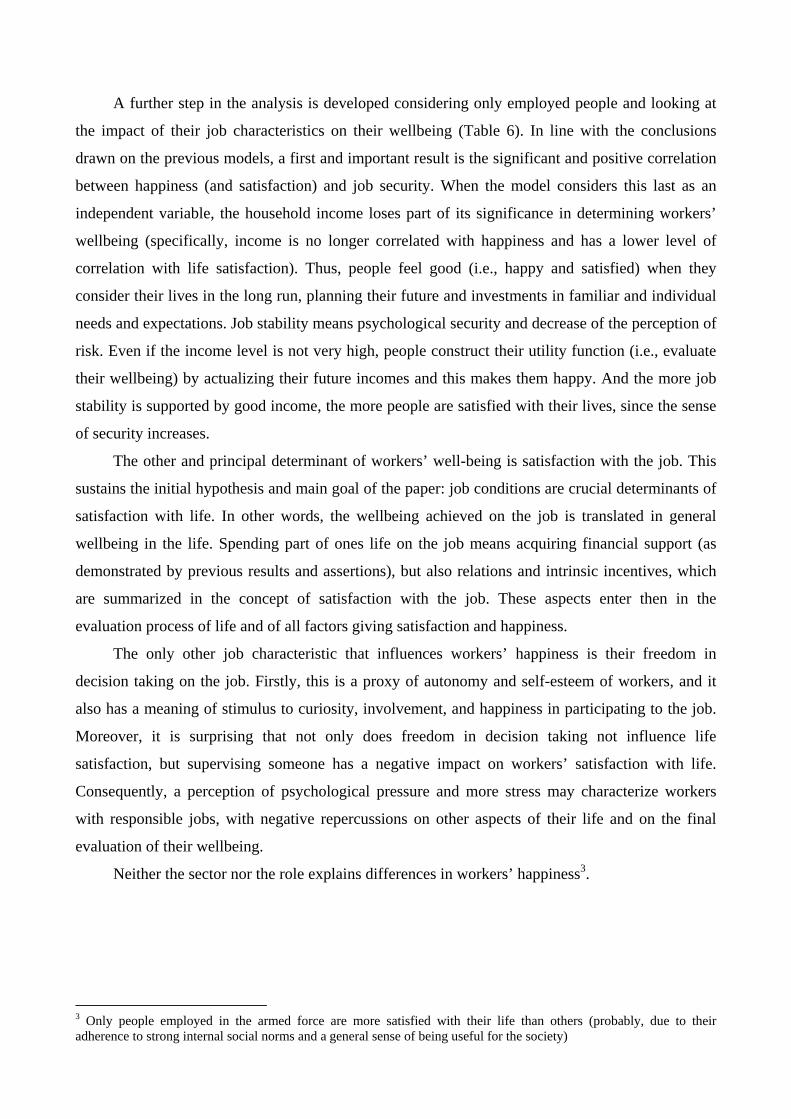
A further step in the analysis is developed considering only employed people and looking at
the impact of their job characteristics on their wellbeing (Table 6). In line with the conclusions
drawn on the previous models, a first and important result is the significant and positive correlation
between happiness (and satisfaction) and job security. When the model considers this last as an
independent variable, the household income loses part of its significance in determining workers’
wellbeing (specifically, income is no longer correlated with happiness and has a lower level of
correlation with life satisfaction). Thus, people feel good (i.e., happy and satisfied) when they
consider their lives in the long run, planning their future and investments in familiar and individual
needs and expectations. Job stability means psychological security and decrease of the perception of
risk. Even if the income level is not very high, people construct their utility function (i.e., evaluate
their wellbeing) by actualizing their future incomes and this makes them happy. And the more job
stability is supported by good income, the more people are satisfied with their lives, since the sense
of security increases.
The other and principal determinant of workers’ well-being is satisfaction with the job. This
sustains the initial hypothesis and main goal of the paper: job conditions are crucial determinants of
satisfaction with life. In other words, the wellbeing achieved on the job is translated in general
wellbeing in the life. Spending part of ones life on the job means acquiring financial support (as
demonstrated by previous results and assertions), but also relations and intrinsic incentives, which
are summarized in the concept of satisfaction with the job. These aspects enter then in the
evaluation process of life and of all factors giving satisfaction and happiness.
The only other job characteristic that influences workers’ happiness is their freedom in
decision taking on the job. Firstly, this is a proxy of autonomy and self-esteem of workers, and it
also has a meaning of stimulus to curiosity, involvement, and happiness in participating to the job.
Moreover, it is surprising that not only does freedom in decision taking not influence life
satisfaction, but supervising someone has a negative impact on workers’ satisfaction with life.
Consequently, a perception of psychological pressure and more stress may characterize workers
with responsible jobs, with negative repercussions on other aspects of their life and on the final
evaluation of their wellbeing.
Neither the sector nor the role explains differences in workers’ happiness3.
3 Only people employed in the armed force are more satisfied with their life than others (probably, due to their adherence to strong internal social norms and a general sense of being useful for the society)

Table 6 – The impact of ones own job position on happiness and life satisfaction (ordered probit model)
Happiness Life satisfaction Variable Coeff. St. Err. P[|Z|>z] Coeff. St. Err. P[|Z|>z]
Constant -0,6867 0,8304 .4082 0,1248 0,8092 .8774Freedom 0,0393 0,0201 .0502 0,0136 0,0190 .4737Job security 0,0747 0,0196 .0001 0,0656 0,0206 .0014Part-time -0,0295 0,1368 .8292 -0,0743 0,1272 .5593Supervising someone -0,0386 0,1343 .7741 0,1915 0,1132 .0907Industry -0,0250 0,0002 .4730 0,0228 0,0054 .9854Employer -0,0807 0,2446 .7415 -0,0989 0,2488 .6910White collar -0,1153 0,1565 .4611 -0,1032 0,1476 .4847Skilled blue collar -0,1274 0,2043 .5327 -0,1164 0,1907 .5415Unskilled blue collar -0,2453 0,2279 .2817 -0,1513 0,2222 .4960Army force -0,0548 0,3279 .8673 -0,6921 0,2576 .0072Gender -0,0504 0,1075 .6392 -0,1296 0,0986 .1887Age -0,0125 0,0043 .0034 0,0010 0,0039 .7911Degree 0,0177 0,1491 .9056 0,1338 0,1565 .3928Compulsory school 0,0170 0,1377 .9019 -0,0586 0,1218 .6302Income household 0,0213 0,0184 .2468 0,0411 0,0187 .0276Job satisfaction 0,1524 0,0250 .0000 0,2834 0,0226 .0000
In conclusion, the models claim that work in general and one’s own job in particular influence
the vision of life and perception of wellbeing. Working is a very important aspect of the life. Firstly,
as asserted by economic theory, people plan their lives by considering their work. Specifically, the
models sustain that people consider their job as a proxy of their income and consequently of the
stability of their working and social position. In this sense, income in itself does not directly and
specifically influence happiness and satisfaction with life It simply represents a threshold under
which dissatisfaction emerges. Over this threshold, other aspects of life and job become relevant,
and especially satisfaction with the job explains satisfaction with life.
This conclusion explains the interest that also scholars of happiness have to assign to the job.
And this explains the interest that also practitioners (i.e., organizations and human resource
managers) must understand what factors determine job satisfaction.
2.3. Understanding job satisfaction
In order to understand the determinants of job satisfaction, some analyses can be made across
multinomial models. A first ordered probit model, which assumes workers’ characteristics as
independent variables (model A in Table 7), shows that satisfaction is significantly correlated to the
gender of respondents (where female are less satisfied, on the contrary of many researches on job
satisfaction), to their age (where oldest worker are more satisfied than youngest), and it is higher for
people with a secondary school certificate, respect to graduated people or persons with basic
education. No relationship emerges between job satisfaction and family income, location, marital
status, and other personal characteristics. Only some aspects that reflect the personal way of living

and morality influence significantly the satisfaction with the job. For example, the time spent with
co-workers outside the work-place is positively correlated with job satisfaction, demonstrating that
good relations on the job afflict workers’ well-being. Furthermore, job satisfaction increases when
interviewees never justify people who do not pay the bus ticket. This is a proxy of morality and in
particular of the worker’s opportunism, and it reveals that people who (theoretically) cooperate
more in public goods and is non opportunistic develop a stronger feeling of belonging and have
preferences different from the pure self-interest.
Table 7 A-B – Determinants of the satisfaction with the job (multinomial model)
Model A Model B Variable Coeff. St. Err. P[|Z|>z] Variable Coeff. St. Err. P[|Z|>z]Constant 1,6220 0,3992 .0000 Constant 0,7853 0,3206 .0143 Spend time with friends 0,0198 0,0499 .6917 Good pay -0,1011 0,1230 .4110 Spend time with colleagues -0,1264 0,0397 .0014 Pleasant people 0,1323 0,1046 .2058 Spend time in church 0,0122 0,0443 .7837 Not too much pressure -0,0183 0,0959 .8489 Spend time in clubs 0,0246 0,0397 .5348 Job security 0,0878 0,1081 .4168 Claim state benefits 0,0088 0,0336 .7926 Chances of promotion 0,0865 0,0925 .3499 Cheating on taxes -0,0269 0,0235 .2525 Respected job -0,1767 0,1001 .0775 Lying -0,0290 0,0246 .2391 Good hours -0,1120 0,1028 .2759 Unemployed accepting a bribe 0,0292 0,0348 .4016 Use initiative -0,0132 0,1022 .8972 Paying cash 0,0336 0,0246 .1719 Useful for society 0,2632 0,1102 .0169 Avoiding a fare on public transport -0,0399 0,0232 .0850 Generous holidays -0,0863 0,0937 .3568 Help immediate family -0,0077 0,0640 .9040 Meeting people 0,0866 0,1017 .3942 Help people neighborhood -0,0481 0,0651 .4598 Achieving something 0,0368 0,1158 .7504 Help elderly -0,1974 0,1060 .0624 Interesting job 0,0344 0,1131 .7612 Help immigrants 0,0720 0,0620 .2460 Meeting abilities -0,0440 0,1084 .6846 Help sick and disabled -0,0037 0,1079 .9724 Physical conditions 0,1342 0,1080 .2142 Gender -0,2349 0,0886 .0080 Time off in week-ends -0,0789 0,0962 .4122 Age 0,0108 0,0038 .0042 None of these 0,0895 0,2121 .6732 Components of the family 0,0315 0,0366 .3894 Job to develop talents -0,1129 0,0435 .0095 Married -0,1142 0,1003 .2548 Receiving money
without working -0,0128 0,0376 .7337
Graduated 0,1721 0,1167 .1403 Turning lazy not working
0,0068 0,0487 .8894
First certificate degree 0,1286 0,1007 .2015 Duty towards society 0,0328 0,0485 .4984 Diploma -0,1834 0,0914 .0448 Not having to work 0,0571 0,0405 .1581 Familiar income 0,0131 0,0165 .4266 Work always first -0,1436 0,0382 .0002 Location: NO -0,0880 0,1298 .4980 Fair quicker paid more 0,1463 0,1046 .1618 Location: NE -0,1614 0,1312 .2185 Following instructions 0,0694 0,0506 .1700 Location: SUD -0,1512 0,1164 .1940 Giving Italians priority 0,0730 0,0553 .1871 Location: Foreign 0,1293 0,1400 .3557 Giving men priority -0,1539 0,0682 .0241 Jobs local people 0,0237 0,0626 .7048 Gender -0,2363 0,0857 .0058 Age 0,0092 0,0033 .0051 Degree 0,1330 0,1105 .2288 Family income 0,0396 0,0160 .0131 Model A: Observations: 680; Iterations completed: 35; Log likelihood function: -1240.593; Restricted log like. -
1271.618; Chi-squared: 62.0484; Degrees of freedom: 25; Sign. level: .000000 Model B: Observations: 763; Iterations completed: 42; Log likelihood function: -1369.494; Restricted log like. -
1420.754; Chi-squared: 102.5199; Degrees of freedom: 33; Sign. level: .000000

A second model is developed on workers’ motivations and perceptions of general equity
(model B in Table 7). It analyses how psychological preferences can affect job satisfaction by
looking at the importance that people assign to some general aspects of a job4. Data firstly reveal
that people are more satisfied when they are more interested in doing a job that is useful to the
society and less motivated to doing a respectable job. Job satisfaction also increases when people
declare that working is necessary for developing abilities and that always work comes first (even
sacrificing free-time). 5
Consequently, it is possible to claim that workers’ satisfaction depends on their morality and
the importance that they assign to work. Other kinds of equity and personal perceptions—included
sensitivity on differences in wages and on the respect of instructions—are not related with job
satisfaction. People thinking that, when job opportunities are scarce, men should be preferred to
women are more satisfied with their job. This result could be a consequence of the positional value
given to the job by workers, who consider work as a priority of being a ‘man’. Finally, on the
contrary of the previous model, the family income is here significantly and positively correlated
with job satisfaction. In other words the richer people are also more they are satisfied with their job.
Workers’ job satisfaction is also explained by some specific characteristics of their jobs.
Model C in Table 7 illustrates that: (i) satisfaction with job security and freedom in decision-taking
on the job has both the maximum and positive significance in explaining job satisfaction, i.e., the
more secure the job and the more the autonomy level, the higher the workers’ satisfaction with the
job; (ii) unskilled blue collars are in general less satisfied, while employees in the army are more
satisfied; this result may be induced by the presence of rigid norms and imposition of correct
behaviors, which positively influence the workers’ perceptions and well-being; (iii) also people
employed in knowledge intensive or entrepreneurial sectors are more satisfied, supporting the
relevance of autonomy on the job; and (iv) the gender no longer has importance and consequently
job characteristics rather than personal features explain job satisfaction and are frequently correlated
to workers’ gender.
Finally, taking into account only those variables relevant in the previous models (model D in
Table 7), the multinomial analysis reveals that job satisfaction depends on psychological
characteristics, workers’ motivations and job aspects. In particular, job satisfaction is mainly
explained by enthusiasm of interviewees or by a sense of general well-being of workers, reflected in
4 The specific question inserted in the questionnaire was formulated as: In the following list are indicated some aspects of work that people consider relevant. Indicate pleas for each of them the importance that you personally assign to them on a scale from ‘not at all important’ to ‘very important’. Consequently, the following analyses of workers’ motivations concern their general preferences on the job and not their specific elements of attraction to their current job. 5 The importance assigned to the other aspects of the job is not significantly correlated with job satisfaction and this is probably due to the high percentage of people looking these elements as always relevant, such as in the case of having a good wage, achieving something, doing an interesting job, etc.

high levels of happiness and satisfaction with job security, in high importance ascribed to having a
job (and posing the job at the first place) and in great autonomy. But, satisfaction with the job
persistently depends on crucial aspects of the job such as the sector of activity and the position in
the organization (with unskilled employees less satisfied). Morality and social motivations are also
relevant. In fact, job satisfaction characterizes the majority of workers attracted by the social
usefulness of the job and willing to sacrifice their time in helping the elderly. Socio-demographic
characteristics are instead less or not significant and this result outlines that what affects the
satisfaction is intrinsic to the person or specific to the job, but not only nor mainly to its extrinsic
nature.
Table 7 C-D – Determinants of the satisfaction with the job (multinomial model)
Model C Model D Variable Coeff. St. Err. P[|Z|>z] Variable Coeff. St. Err. P[|Z|>z]Constant -1,1162 0,7493 .1363 Constant 0,2404 0,4146 .5619 Freedom decision taking 0,1744 0,0172 .0000 Importance of work -0,2489 0,0788 .0016 Satisfaction with job security 0,1814 0,0180 .0000 Happiness -0,3726 0,0606 .0000 Full-time worker 0,1244 0,1239 .3156 Time with coworkers -0,0043 0,0380 .9104 Supervising someone -0,0648 0,1106 .5580 Age 0,0048 0,0035 .1613 Industry 0,0001 0,0000 .0617 Don’t pay bus-ticket -0,0032 0,0202 .8748 Employer -0,0124 0,2289 .9567 Sacrificing for elderly -0,1493 0,0636 .0190 Self-employed person -0,1203 0,1631 .4608 Import. of respected job -0,0936 0,0962 .3309 White collars 0,1834 0,1342 .1718 Importance of useful
for society 0,1749 0,0998 .0796
Skilled workers 0,0309 0,1775 .8620 Work necessary to develop talents
-0,0379 0,0436 .3854
Unskilled workers 0,3548 0,2055 .0842 Work at the first place -0,0778 0,0396 .0492 Soldiers and similar -0,5357 0,2633 .0419 Men preferred to
women -0,0959 0,0664 .1487
Gender -0,0469 0,1022 .6467 Gender -0,0517 0,0910 .5697 Age 0,0099 0,0039 .0111 Familiar income -0,0016 0,0158 .9189 Graduated 0,1359 0,1316 .3017 Freedom in decision-
taking 0,1800 0,0154 .0000
Compulsory school 0,0945 0,1244 .4475 Satisfaction with job security
0,1849 0,0160 .0000
Income family 0,0005 0,0166 .9781 Sector (intellectual =0, others=1)
-0,0001 0,0000 .0056
Unskilled blue collars 0,3223 0,1354 .0173 Soldiers and similar -0,3897 0,2168 .0723 Model C: Observations: 616; Iterations completed: 26; Log likelihood function: -1020.369; Restricted log like. -
1153.289; Chi-squared: 265.8399; Degrees of freedom: 15; Sign. level: .000000 Model D: Observations: 751; Iterations completed: 30; Log likelihood function: -1189.859; Restricted log like. -
1396.324; Chi-squared: 412.9309; Degrees of freedom: 18; Sign. level: .000000
In conclusion, what certainly has to be theoretically considered and practically enforced by
organizations is security and autonomy on the job, since both elements directly generate satisfaction
with these specific elements and indirectly influence the workers’ satisfaction with the job as a
whole.

3. Conclusions The analysis of happiness and of its linkage with job has emerged in this paper as a process
which has to be realized in various steps. Firstly, when speaking about happiness scientists must
distinguish this notion with the notion of life satisfaction. The former, but not the latter, is strictly
linked with factors of enjoyment, typically (but not exclusive) of young people. The latter, and less
the former, has a high psychological meaning and defines the dimension of general well-being. This
explains why income emerges as a significant variable in defining satisfaction with life but not
happiness. Despite these differences, both happiness and life satisfaction strictly depend on job
satisfaction. Furthermore, some characteristics of the job explain both meanings of general well-
being. Specifically this is the case of relationships, autonomy and security on the job, which
respectively represent relational goods, intrinsic incentives and socio-economic stability. The
models developed therefore sustain that people consider their jobs as a proxy of their income and
consequently of the stability of their working and social position, but also as a source of relations
and personal growth.
In this sense, and given the importance of job satisfaction in explaining happiness and life
satisfaction, policies and interventions on job characteristics and workers’ perceptions are essential
in order to achieve general wellbeing. Data suggest, firstly, that organizations (i.e., principals) have
to consider that economic rewards are not the most important lever for increasing their employees’
satisfaction. Even if wages must achieve a sufficient threshold and bonuses may be perceived as fair
recognition of workers’ effort, organizations should also plan the development of friendly working
environments, in which relationships and communication are the pillars. Secondly, national policies
and the regulation of the labor market should be planned considering different needs and
perceptions that define the workers’ well-being. Job security certainly is the crux, especially related
to the recent reform of flexibility and temporary jobs. Nevertheless, other kinds of flexibility have
to be considered and on the opposite side, have to be provided in order to sustain autonomy,
freedom on the job and the satisfaction of specific needs of workers. Finally, all these policies have
to reflect on the relevance of personal perceptions and social principles. In fact, if behaviors
significantly depend on common morality and social norms, institutional changes on the labor
market should be promoted with the consensus of the society or implementing their adaptation and
preferences. Therefore, the same regulation of flexibility should be advanced as an experience
which is equally promoted to all individuals and able to implement their vocational training.
In conclusion, the paper has contributed in ameliorating the theoretical understanding of
satisfaction with life and with the job. In particular, through empirical analyses and multinomial
models, the paper demonstrates that the contents of the movie and economic theory are
complementary—rather than alternative—explanations of the achievement of happiness. In
particular, the wage may influence satisfaction with life unto when people have achieved a
minimum threshold of income. This is mainly due to the necessity to cater for basic needs and in
general to increase the perception of security and decrease risk. People are satisfied with their lives
when they assume that a long-run perspective and certainly work is a determinant for ensuring
income and stability. Furthermore, when instability is overcome and an adequate income is
achieved, people judge their jobs and their lives on different parameters. Relationships and
immaterial (or intrinsic) aspects acquire relevance and happiness is defined on perceptions and
needs that differ from aspects that are purely economic.
On the achievement of a minimum working standard people will also achieve a minimum
standard of living and from this point they can declare to be happy on the job and, if possible, in
their lives.
Bibliography Arciniega L.M. and Gonzalez L. (2005), “Other-Oriented Values and Job Satisfaction”, Problems
and Perspectives in Management, iss. 4, pp. 128-32
Bartel A., Freeman R., Echniowski C. and Kleiner M. (2004) “Can a Work Organizations Have an Attitude Problem? The Impact of Workplace on Employees Attitudes and Economic Outcomes”, Centre for Economic Performance, London School, Discussion Paper n. 636
Bilimoria D., Perry S., Liang X., Stoller E., Higgins P., Taylor C. (2006), “How Do Female and Male Faculty Members Construct Job Satisfaction? The Roles of Perceived Institutional Leadership and Mentoring and Their Mediating Processes”, Journal of Technology Transfer, v. 31, iss. 3, pp. 355-65
Blanchflower D.G. and Oswald A.J. (2005), “Happiness and the Human Development Index: the Paradox of Australia”, National Bureau of Economic Research NBER working papers, 11416
Borzaga C. (a cura di) (2000), Capitale umano e qualità del lavoro nel settore dei servizi sociali. Un’analisi comparata tra modelli di gestione, FIVOL, Roma
Borzaga C. and Musella M. (2004), Produttività ed efficienza nelle organizzazioni nonprofit: analisi teoriche e verifiche empiriche, edizioni31, Trento
Brown D. and McIntosh (1998), “If You’re Happy and You Know It… Job Satisfaction in the Low Wage Service Sector”, Discussion Paper 405, Centre for Economic Performance, London
Cappelli P. and Shererer P.D. (1998), “Satisfaction, Market Wages and Labor Relations: an Airline Study”, Industrial Relations, 27, pp.56-73

Chan K.C., Gee M.V. and Steiner T.L. (2000), “Employee Happiness and Corporate Financial Performance”, Financial Practice and Education, v.10, iss.2, pp.47-52
Clark A.E. (1996), “Job Satisfaction in Britain”, British Journal of Industrial Relations, v.34, pp.189-217
Clark A.E. (1997), “Job Satisfaction and Gender: Why are Women so Happy at Work?”, Labour Economics, 61, pp.359-381
Clark A.E. (1999), “Are Wages Habit-Forming? Evidence from Micro Data”, Journal of Economics Behaviour and Organizations, v.39, iss.2, pp.179-200
Clark A.E. and Oswald A.J. (1996), “Satisfaction and Comparison Income”, Journal of Public Economics, n.61, vol.6, pp. 359-381
Diener E. (1984), “Subjective Well-being”, in Psychological Bulletin, n.95, pp.542-575
Dockery A.M. (2005), “The Happiness of Young Australians: Empirical Evidence on the Role of Labour Market Experiences”, Economic Record, v.81, iss.255, pp.322-335
Gordon M.E. and Denisi A.S. (1995), “A Re-examination of the Relationship Between Union Membership and Job Satisfaction”, Industrial and Labor Relations Review, 48, pp.222-236
Hechanova Ma.R.M, Alampay R.B.A. and Franco E.P. (2006), “Psychological empowerment, job satisfaction and performance among Filipino service workers”, Asian Journal of Social Psychology, v.9, pp.72-78
Huang X. and Van de Vliert E. (2002), “Intrinsic Job Rewards at Country-Level and Individual-Level Codetermine Job Satisfaction”, Journal of International Business Studies, v. 33, iss. 2, pp. 385-94
Lau C.M. and Tan S.L.C. (2003), “The Effects of Participation and Job-Relevant Information on the Relationship between Evaluative Style and Job Satisfaction”, Review of Quantitative Finance and Accounting, v. 21, iss. 1, pp. 17-34
Lau C-M., Tse D. and Zhou N. (2002), “Institutional Forces and Organizational Culture in China: Effects on Change Schemas, Firm Commitment and Job Satisfaction”, Journal of International Business Studies, v. 33, iss. 3, pp. 533-50
Leete L. (1999), “Wage Equity and Employee Motivation in Nonprofit and For-profit Organizations”, Journal of Economic Behavior and Organization, vol.43, pg.423-446
Maslow A.H. (1973), Motivazione e personalità, Armando Editore, Roma
Meng R. (1990), “The Relationship Between Unions and Job Satisfaction”, Applied Economics, 22, pp.1635-1648
Miller P.W. (1990), Trade Unions and Job Satisfaction”, Australian Economic Papers, 29, pp.226-248
Mirvis P.H. (1992), “The Quality of Employment in the Nonprofit Sector: an Update in Employee Attitudes in Nonprofit Versus Business and Government”, in Nonprofit Management and Leadership, 1, vol.3

Mirvis P.H. e Hackett E.J. (1983), “Work and Workforce Characteristics in the Nonprofit Sector”, in Monthly Labour Review, 4, vol.106
Oswald A. (1997), “Happiness and Economic Performance”, The Warwick Economics Research Paper Series, University of Warwick
Rowden R.W. (2002), “The Relationship Between Workplace Learning and Job Satisfaction in U.S. Small to Midsize Business”, Human Resource Development Quarterly, v.13, n.4, pp.407-425
Schwochau S. (1987), “Union Effects on Job Attitudes”, Industrial and Labor Relations Review, 40, pp.209-224
Soonhee K. (2002), “Participative Management and Job Satisfaction: Lessons for Management Leadership”, Public Administration Review, v. 62, iss. 2, pp. 231-41
Sousa-Poza A. and Sousa-Poza A.A. (2000), “Well-Being at Work: A Cross-National Analysis of the Levels and Determinants of Job Satisfaction”, Journal of Socio-Economics, v. 29, iss. 6, pp. 517-38
Sousa-Poza, A. and Sousa-Poza, A. A.(2003), “Gender Differences in Job Satisfaction in Great Britain, 1991-2000: Permanent or Transitory?” Applied Economics Letters, v. 10, iss. 11, pp. 691-94
Theoudossiou I. (1998), “The Effects of Low-Pay and Unemployment on Psychological Well-being: A Logistic Regression Approach”, Journal of Health Economics, v.17, iss.1, pp.85-104
Thoms P., Dose J.J. and Scott K.S. (2002), “Relationship Between Accountability, Job Satisfaction, and Trust”, Human Resource Development Quarterly, v.13, n.3, pp.307-323
Tsang M.C., Rumberger R.W. and Levin H.M. (1991), “The Impact of Surplus Schooling on Work Productivity”, Industrial Relations, 30, pp.209-228
Tsou M.W. and Liu J.T. (2001), “Happiness and Domain Satisfaction in Taiwan”, Journal of Happiness Studies, v.2, iss.3, pp.269-288
Van Praag B. and Ferrer-I-Carbonell A. (2004), Happiness quantified: A satisfaction calculus approach, Oxford University Press
Vila L. and Garcia-Mora B. (2005), “Education and the Determinants of Job Satisfaction”, Education Economics, v. 13, iss. 4, pp. 409-25