Embed Size (px)
Citation preview

The Psychometric Development Process of Recovery Measures and Markers: Classical Test Theory and Item Response Theory
Kate DeRoche, M.A. Mental Health Center of Denver
Antonio Olmos, Ph.D.
Mental Health Center of Denver
Susan Hutchinson, Ph.D. University of Northern Colorado
CJ McKinney, M.A.
Mental Health Center of Denver

Presentation Overview Warning: We have a wealth of data to discuss Overview: Recovery evaluation at MHCD This presentation will focus on process of
development of two measurement tools, including advantages and limitation of psychometric methodologies: 1st Classical Test Theory 2nd Rasch Models in IRT 3rd Additional Models in IRT
How many of you have used Item Response Theory, or have a background knowledge of how it works?

Classical Test Theory (CTT) Item characteristics
are sample and test dependent
Items are commonly at an equal level of the trait
Reliability and assumption of parallel test-difficulty to obtain
Equal standard error for all participants
Item Response Theory (IRT) Separation of item
parameters and participants ability
Items are monotonically increasing in the latent trait
Assumptions of unidimensionality & local independence
Multiple models (1PL, 2PL & 3PL)
Comparison of CTT and IRT (Hambleton, Swaminathan, Roger, 1991)

Models of CTT and IRT
CTT has a single model IRT includes a collection of models (validity
issues in model selection) IPL (Rasch Models) N=100’s
Difficulty parameters 2PL N= 1,000’s
Difficulty and item discrimination parameters 3PL N= 10,000’s
Difficulty, item discrimination, & pseudo guessing parameters

Measurement Approach at MHCD The Mental Health Center of Denver is large, non-profit
community-based mental health center providing services for adults, children and families In the Evaluation and Research Department, we hold the assumption
that we fit data to match a model (data driven)
We are in process of creating measurement tools to evaluate mental health recovery (latent trait) in adult consumers, using 3 measures:
Consumer Recovery Measures Recovery Markers Recovery Enhancing Environment
Recovery Marker
Consumer Recovery Measures
Recovery Enhancing
Environment
Mental Health Recovery
occurring at MHCD

Theory and Measurement The relationship between
theory and measurement is critical for latent constructs to be able to provide a feedback loop for quality improvement
Measurement revised the
underlying constructs of a theory which, in turn, revises the measurement tool
Continuous Process
Initially Define Theory
Develop Measures
Improve Theory
Improve Measures
Improve Theory
Improve Measures
MHCD

Example 1: Consumer Recovery Measures

Beginning the Psychometric Process: Classical Test Theory
Conducted an Exploratory Factor analysis which revealed 5 factors and explained approximately 57% of the variance
Conducted Cronbach’s alpha reliability analysis Active/growth orientation (α = .67) Hope (α = .77) Symptom Interference (α = .88) Safety (α = .72) Social Network (α = .63)
Total Scale = .88 What would we think of this scale based on this analysis?

Step 2: Rasch Modeling Rating Scale Model (1PL)
Domain Number of items Marginal Reliability (IRT)
Active 3 .754 Hope 3 .783 Symptom 4 .841 Safe 3 .724 Social 3 .750 Total CRM 16 .916
Again, the IRT analysis both produce acceptable reliabilities, but…
In IRT, a validity issue is selecting a model that is appropriate for your data. Most commonly, you begin with the most simplest model (Rasch Model) and if it fits, you can stop, if not you can try a more complicated model. (some people do not agree with this concept)
For example, our data is a Likert-type scale so we used a Rasch Rating Scale Model, which produced the following reliabilities:
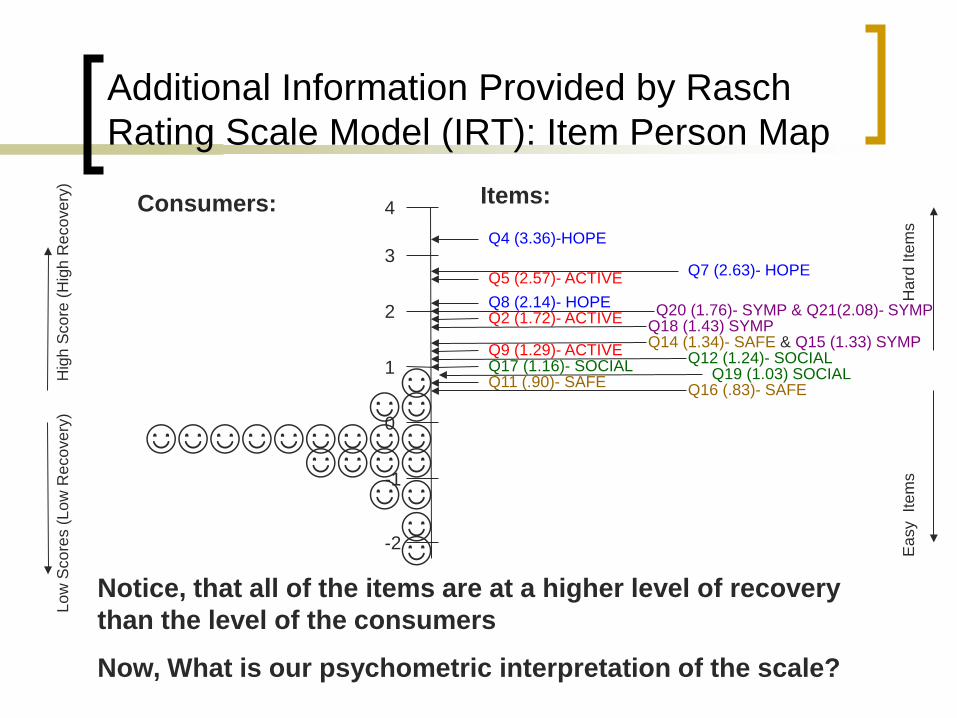
Additional Information Provided by Rasch Rating Scale Model (IRT): Item Person Map
0
-2
-1
4
3
2
1
Q2 (1.72)- ACTIVE
Q4 (3.36)-HOPE
Q5 (2.57)- ACTIVE Q7 (2.63)- HOPE
Q8 (2.14)- HOPE
Q9 (1.29)- ACTIVE
Q11 (.90)- SAFE Q12 (1.24)- SOCIAL
Q14 (1.34)- SAFE & Q15 (1.33) SYMP
Q16 (.83)- SAFE Q17 (1.16)- SOCIAL
Q18 (1.43) SYMP
Q19 (1.03) SOCIAL
Q20 (1.76)- SYMP & Q21(2.08)- SYMP
☺
Items:
Har
d Ite
ms
Eas
y It
ems
Hig
h S
core
(Hig
h R
ecov
ery)
Lo
w S
core
s (L
ow R
ecov
ery)
☺ ☺☺
☺☺☺☺☺☺☺☺☺ ☺☺☺☺
☺☺ ☺
Consumers:
Notice, that all of the items are at a higher level of recovery than the level of the consumers
Now, What is our psychometric interpretation of the scale?
Comparison of CTT and IRT results for Example 1
By only reviewing the CTT analysis the psychometrics seemed fine
With the additional information provided by the Rasch model we understand that our questions are too difficult for our sample,
Therefore, we need to create more items that display less recovery (to measure small changes)

Example 2: Recovery Markers Indicators usually associated with individual's recovery,
but are not necessary for recovery Includes 6 dimensions with varying response sets:
Employment (8 response categories) Education/Training (7 response categories) Active/Growth orientation (6 response categories) Symptom Interference (5 response categories) Housing * (9 response categories) Engagement/role with service provider (6 response
categories) Substance Abuse- level of use (6 response categories) Substance Abuse- level of change* (5 response
categories)


Step 1: CTT Reliability and Factor Analysis
Internal Reliability estimated Cronbach’s alpha = .67
An experimental factor analysis revealed 1 factors
A confirmatory factor analysis was conducted on the 1 factor solution x²(11)=26.98, p=.005 RMSEA = .043
This analysis told us that the scale was not working well, but did not explain why it was not working
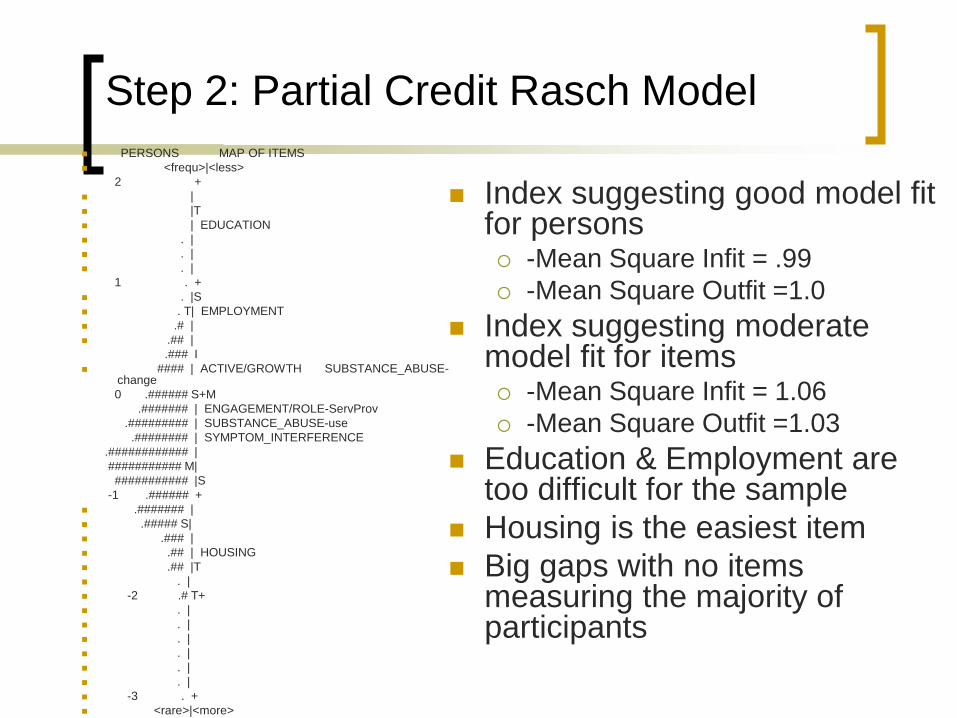
Step 2: Partial Credit Rasch Model
Index suggesting good model fit for persons -Mean Square Infit = .99 -Mean Square Outfit =1.0
Index suggesting moderate model fit for items -Mean Square Infit = 1.06 -Mean Square Outfit =1.03
Education & Employment are too difficult for the sample
Housing is the easiest item Big gaps with no items
measuring the majority of participants
PERSONS MAP OF ITEMS <frequ>|<less> 2 + | |T | EDUCATION . | . | . | 1 . + . |S . T| EMPLOYMENT .# | .## | .### I #### | ACTIVE/GROWTH SUBSTANCE_ABUSE-
change 0 .###### S+M .####### | ENGAGEMENT/ROLE-ServProv .######### | SUBSTANCE_ABUSE-use .######## | SYMPTOM_INTERFERENCE .############ | ########### M| ########### |S -1 .###### + .####### | .##### S| .### | .## | HOUSING .## |T . | -2 .# T+ . | . | . | . | . | . | -3 . + <rare>|<more>

Step 3: Nominal Response Model
The Nominal Response model is based off of the 2 PL requiring more participants (1,000’s)
Allows us to view the order of the responses within an item, to make sure they are ordered
We can change the response categories to make sure that they are ordered in terms of difficulty

Example of Nominal Output 4.0
2.0
0.0
-2.0
-4.0
Diff
icul
ty o
f Ite
m
Har
d
Eas
y
4.0
2.0
0.0
-2.0
-4.0
4.0
2.0
0.0
-2.0
-4.0
Employment Education Active/Growth
H- Full time independent (1.59)
G- Part time independent (.76)
F- Full time supported (-1.22)
E- Part time supported (-.37)
D- Non-paid work/volunteer (2.64)
C- Active Job Search (3.29)
B- Interest in work, no action (-1.99)
A- No interest in work (-2.71)
G- Recent Grad (-.20)
F- Full time college (4.77)
E- Part time college (.3.66)
D- noncredit training (-.10)
C- Active education/training search (-1.00) B-interest in education, no action (-1.05)
A- No interest in education (-2.82)
A- Very low (-3.88)
B- Low (-2.28) C- Moderate in MH system (-2.37)
D- Moderate out MH system (-1.62)
E- High (-.75)
F- Very high (3.41)
There are issues of improper ordering, large gaps, where there are not responses & clumps of responses

Review of Psychometric Process
1st CTT analysis determine reliability
2nd Rasch modeling determine model fit (reliability), participants
ability level & item difficulty 3rd Nominal Model
Determine model fit (reliability) and ordering of responses within items
As you increase the complexity of the measurement model, you also increase the required assumptions

Lessons Learned Requires time to educate yourself, critical to use
appropriate model for your data In IRT literature be prepared to read conflicting
pieces of information regarding model use (Rasch vs. IRT)
If you have stakeholders that want to be involved in the analysis, be prepared to example concepts (i.e. IQ)
Sample size requirements Have resource to conduct analysis, stakeholder
buy in Purchase software (winstep, bilog, etc..) Computer memory (Maximum Likelihood estimation)

Take home Message
IRT is beneficial and allows you to see more aspects of measurement than in CTT alone
As we increase our understanding with IRT, we also increase our assumptions
Measurement is a critical step in evaluation Regardless of which method you use,
understanding the benefits and limitations of your measurement model will help to interpret your data

Questions ???
Contact Information: Kate DeRoche, M.A.
(303) 504-6664 [email protected]
Antonio Olmos, Ph.D. (303) 504-6661 [email protected]
![Psychometric item evaluations of the Recovery-Stress ... and orzeck RESTQ final published article.… · Psychology of Sport and Exercise ] (]]]]) ]]]–]]] Psychometric item evaluations](https://img.pdfslide.us/doc/110x75/5f5dc559e3e0b101ec78e499/psychometric-item-evaluations-of-the-recovery-stress-and-orzeck-restq-final.jpg)