Embed Size (px)
Citation preview
SEMIANNUAL REPORT JUNE 30, 2009
The Prudential Series Fund� Diversified Conservative Growth Portfolio
0158083-00001-00
This report is one of several that provide financial information about certain investment choices available onvariable life insurance and variable annuity contracts. Based on the variable contract you own or the portfoliosyou invested in, you may receive additional reports that provide financial information on those investmentchoices. Please refer to your variable life insurance or variable annuity contract prospectus to determine whichportfolios are available to you.
This report must be preceded or accompanied by the current prospectuses for the Prudential Series Fund portfolios andthe applicable variable life or annuity contract. The prospectuses contains information on the investment objectives,risks, and charges and expenses of the portfolios and the contract and should be read carefully.
The contract’s prospectus contains hypothetical performance illustrations that show the effect of various assumptionsregarding the cost of insurance protection. You may also obtain a personalized illustration of historical performance thatreflects the cost of your contract’s insurance protection.
A description of the Fund’s proxy voting policies and procedures is available, without charge, upon request. Owners ofvariable annuity contracts should call 888-778-2888 and owners of variable life insurance contracts should call800-778-2255 to obtain descriptions of the Fund’s proxy voting policies and procedures. The description is also available onthe website of the Securities and Exchange Commission (the “Commission”) at www.sec.gov. Information regarding how theFund voted proxies relating to portfolio securities during the most recent 12-month period ended June 30 is available on thewebsite of the Commission at www.sec.gov and on the Fund’s website.
The Fund files with the Commission a complete listing of portfolio holdings as of its first and third quarter-end on Form N-Q.Form N-Q is available on the Commission’s website at www.sec.gov or by visiting the Commission’s Public ReferenceRoom. For more information on the Commission’s Public Reference Room, please visit the Commission’s website or call800-SEC-0330. Form N-Q is also available on the Fund’s website at www.prudential.com or by calling the telephonenumbers referenced above.
The Fund’s Statement of Additional Information contains additional information about the Fund’s Trustees and is availablewithout charge upon request by calling 888-778-2888.
This report may include financial information pertaining to certain portfolios that are not available through the variable lifeinsurance policy or variable annuity contract that you have chosen. Please refer to your variable life insurance or variableannuity prospectus to determine which portfolios are available to you.
The Prudential Series FundTable of Contents
Semiannual Report June 30, 2009
� L E T T E R T O C O N T R A C T O W N E R S
� P R E S E N T A T I O N O F P O R T F O L I O H O L D I N G S
� F E E S A N D E X P E N S E S T A B L E
� F I N A N C I A L R E P O R T S
A1 Schedule of Investments and Financial StatementsB1 Notes to Financial StatementsC1 Financial Highlights
� A P P R O V A L O F A D V I S O R Y A G R E E M E N T S

[THIS PAGE INTENTIONALLY LEFT BLANK]
The Prudential Series FundLetter to Contract Owners
Semiannual Report June 30, 2009
� D E A R C O N T R A C T O W N E R
Our primary focus at Prudential is to help investors achieve and maintain long-termfinancial success. Our Prudential Series Fund semiannual report outlines our efforts toreach this goal. We hope you find it informative and useful.
Prudential has been building on a heritage of success for more than 130 years, and thequality of our businesses and risk diversification has enabled us to manage effectivelythrough volatile markets. We believe the array of our products provides a highlyattractive value proposition to clients like you who are focused on financial security.
Your financial professional is your best resource to help you make the most informedinvestment decisions to meet your needs. Together, you can develop a diversifiedinvestment portfolio that aligns with your long-term goals and can help deliver a moresecure financial future.
Thank you for selecting Prudential as one of your financial partners. We value yourtrust and appreciate the opportunity to help you achieve your financial goals.
Sincerely,
Stephen PelletierPresident,The Prudential Series Fund July 31, 2009
P R E S I D E N TS T E P H E N P E L L E T I E R

[THIS PAGE INTENTIONALLY LEFT BLANK]
The Prudential Series FundPresentation of Portfolio Holdings — unaudited
June 30, 2009
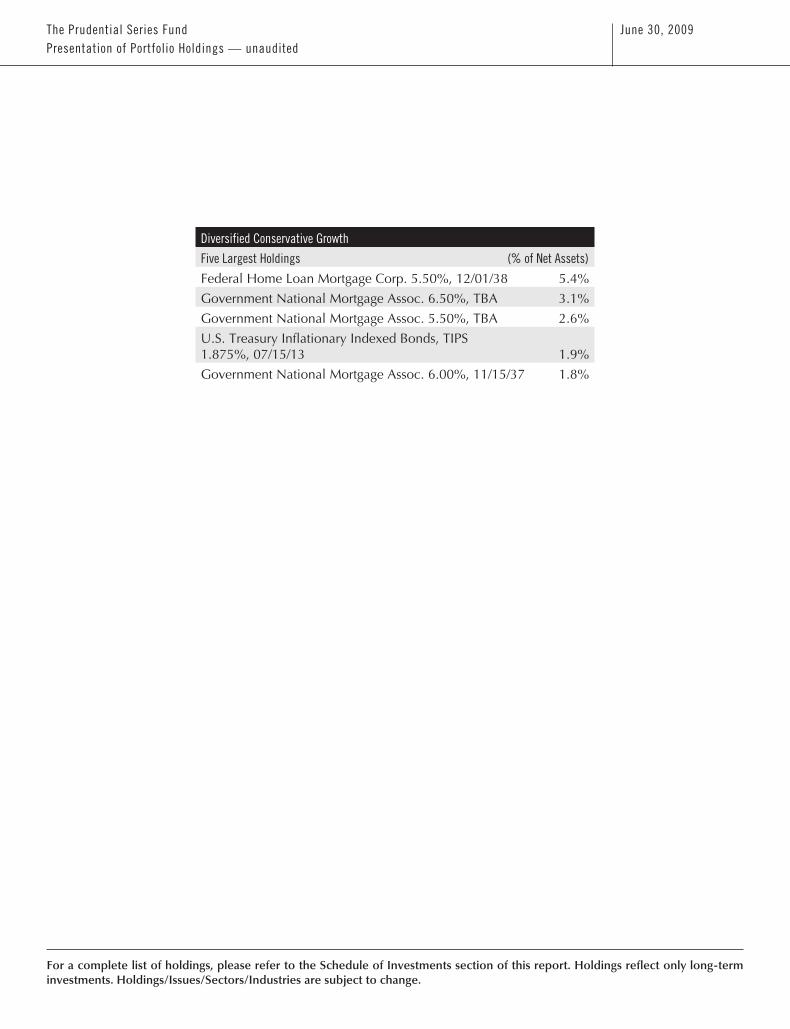
Diversified Conservative Growth
Five Largest Holdings (% of Net Assets)
Federal Home Loan Mortgage Corp. 5.50%, 12/01/38 5.4%
Government National Mortgage Assoc. 6.50%, TBA 3.1%
Government National Mortgage Assoc. 5.50%, TBA 2.6%
U.S. Treasury Inflationary Indexed Bonds, TIPS1.875%, 07/15/13 1.9%
Government National Mortgage Assoc. 6.00%, 11/15/37 1.8%
For a complete list of holdings, please refer to the Schedule of Investments section of this report. Holdings reflect only long-terminvestments. Holdings/Issues/Sectors/Industries are subject to change.
The Prudential Series FundFees and Expenses — unaudited
June 30, 2009
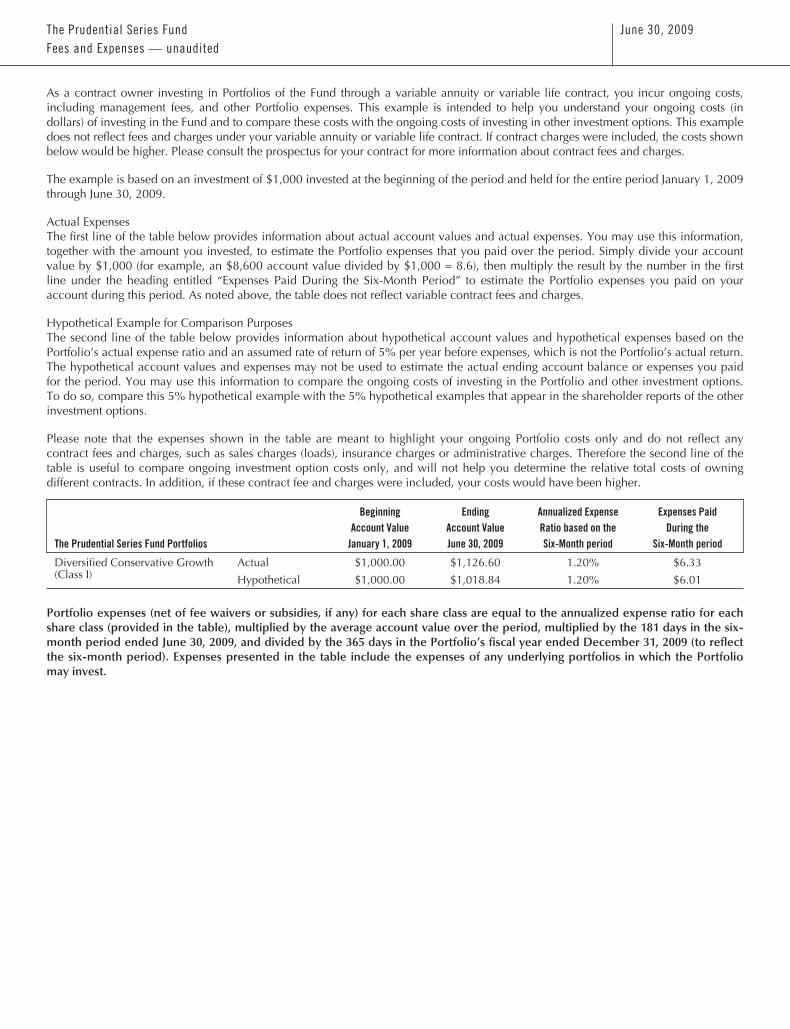
As a contract owner investing in Portfolios of the Fund through a variable annuity or variable life contract, you incur ongoing costs,including management fees, and other Portfolio expenses. This example is intended to help you understand your ongoing costs (indollars) of investing in the Fund and to compare these costs with the ongoing costs of investing in other investment options. This exampledoes not reflect fees and charges under your variable annuity or variable life contract. If contract charges were included, the costs shownbelow would be higher. Please consult the prospectus for your contract for more information about contract fees and charges.
The example is based on an investment of $1,000 invested at the beginning of the period and held for the entire period January 1, 2009through June 30, 2009.
Actual ExpensesThe first line of the table below provides information about actual account values and actual expenses. You may use this information,together with the amount you invested, to estimate the Portfolio expenses that you paid over the period. Simply divide your accountvalue by $1,000 (for example, an $8,600 account value divided by $1,000 = 8.6), then multiply the result by the number in the firstline under the heading entitled “Expenses Paid During the Six-Month Period” to estimate the Portfolio expenses you paid on youraccount during this period. As noted above, the table does not reflect variable contract fees and charges.
Hypothetical Example for Comparison PurposesThe second line of the table below provides information about hypothetical account values and hypothetical expenses based on thePortfolio’s actual expense ratio and an assumed rate of return of 5% per year before expenses, which is not the Portfolio’s actual return.The hypothetical account values and expenses may not be used to estimate the actual ending account balance or expenses you paidfor the period. You may use this information to compare the ongoing costs of investing in the Portfolio and other investment options.To do so, compare this 5% hypothetical example with the 5% hypothetical examples that appear in the shareholder reports of the otherinvestment options.
Please note that the expenses shown in the table are meant to highlight your ongoing Portfolio costs only and do not reflect anycontract fees and charges, such as sales charges (loads), insurance charges or administrative charges. Therefore the second line of thetable is useful to compare ongoing investment option costs only, and will not help you determine the relative total costs of owningdifferent contracts. In addition, if these contract fee and charges were included, your costs would have been higher.
The Prudential Series Fund Portfolios
BeginningAccount Value
January 1, 2009
EndingAccount ValueJune 30, 2009
Annualized ExpenseRatio based on theSix-Month period
Expenses PaidDuring the
Six-Month period
Diversified Conservative Growth(Class I)
Actual $1,000.00 $1,126.60 1.20% $6.33
Hypothetical $1,000.00 $1,018.84 1.20% $6.01
Portfolio expenses (net of fee waivers or subsidies, if any) for each share class are equal to the annualized expense ratio for eachshare class (provided in the table), multiplied by the average account value over the period, multiplied by the 181 days in the six-month period ended June 30, 2009, and divided by the 365 days in the Portfolio’s fiscal year ended December 31, 2009 (to reflectthe six-month period). Expenses presented in the table include the expenses of any underlying portfolios in which the Portfoliomay invest.
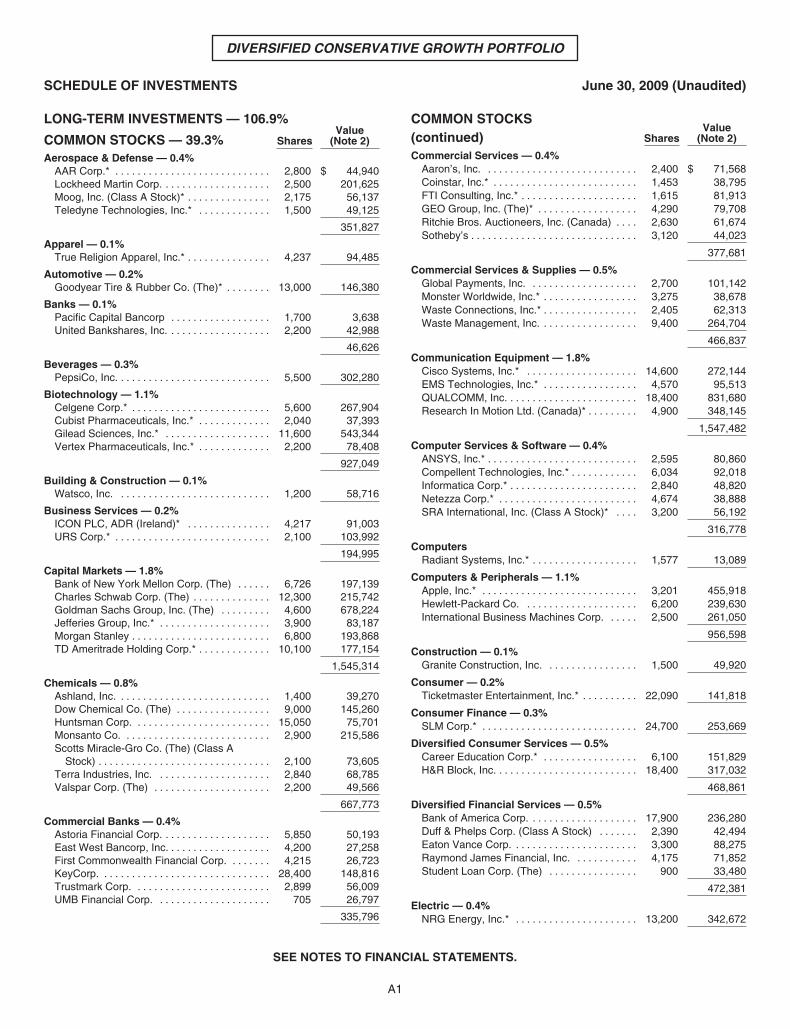
DIVERSIFIED CONSERVATIVE GROWTH PORTFOLIO
SCHEDULE OF INVESTMENTS June 30, 2009 (Unaudited)
LONG-TERM INVESTMENTS — 106.9%
COMMON STOCKS — 39.3% SharesValue
(Note 2)
Aerospace & Defense — 0.4%AAR Corp.* . . . . . . . . . . . . . . . . . . . . . . . . . . . . 2,800 $ 44,940Lockheed Martin Corp. . . . . . . . . . . . . . . . . . . . 2,500 201,625Moog, Inc. (Class A Stock)* . . . . . . . . . . . . . . . 2,175 56,137Teledyne Technologies, Inc.* . . . . . . . . . . . . . 1,500 49,125
351,827
Apparel — 0.1%True Religion Apparel, Inc.* . . . . . . . . . . . . . . . 4,237 94,485
Automotive — 0.2%Goodyear Tire & Rubber Co. (The)* . . . . . . . . 13,000 146,380
Banks — 0.1%Pacific Capital Bancorp . . . . . . . . . . . . . . . . . . 1,700 3,638United Bankshares, Inc. . . . . . . . . . . . . . . . . . . 2,200 42,988
46,626
Beverages — 0.3%PepsiCo, Inc. . . . . . . . . . . . . . . . . . . . . . . . . . . . 5,500 302,280
Biotechnology — 1.1%Celgene Corp.* . . . . . . . . . . . . . . . . . . . . . . . . . 5,600 267,904Cubist Pharmaceuticals, Inc.* . . . . . . . . . . . . . 2,040 37,393Gilead Sciences, Inc.* . . . . . . . . . . . . . . . . . . . 11,600 543,344Vertex Pharmaceuticals, Inc.* . . . . . . . . . . . . . 2,200 78,408
927,049
Building & Construction — 0.1%Watsco, Inc. . . . . . . . . . . . . . . . . . . . . . . . . . . . 1,200 58,716
Business Services — 0.2%ICON PLC, ADR (Ireland)* . . . . . . . . . . . . . . . 4,217 91,003URS Corp.* . . . . . . . . . . . . . . . . . . . . . . . . . . . . 2,100 103,992
194,995
Capital Markets — 1.8%Bank of New York Mellon Corp. (The) . . . . . . 6,726 197,139Charles Schwab Corp. (The) . . . . . . . . . . . . . . 12,300 215,742Goldman Sachs Group, Inc. (The) . . . . . . . . . 4,600 678,224Jefferies Group, Inc.* . . . . . . . . . . . . . . . . . . . . 3,900 83,187Morgan Stanley . . . . . . . . . . . . . . . . . . . . . . . . . 6,800 193,868TD Ameritrade Holding Corp.* . . . . . . . . . . . . . 10,100 177,154
1,545,314
Chemicals — 0.8%Ashland, Inc. . . . . . . . . . . . . . . . . . . . . . . . . . . . 1,400 39,270Dow Chemical Co. (The) . . . . . . . . . . . . . . . . . 9,000 145,260Huntsman Corp. . . . . . . . . . . . . . . . . . . . . . . . . 15,050 75,701Monsanto Co. . . . . . . . . . . . . . . . . . . . . . . . . . . 2,900 215,586Scotts Miracle-Gro Co. (The) (Class A
Stock) . . . . . . . . . . . . . . . . . . . . . . . . . . . . . . . 2,100 73,605Terra Industries, Inc. . . . . . . . . . . . . . . . . . . . . 2,840 68,785Valspar Corp. (The) . . . . . . . . . . . . . . . . . . . . . 2,200 49,566
667,773
Commercial Banks — 0.4%Astoria Financial Corp. . . . . . . . . . . . . . . . . . . . 5,850 50,193East West Bancorp, Inc. . . . . . . . . . . . . . . . . . . 4,200 27,258First Commonwealth Financial Corp. . . . . . . . 4,215 26,723KeyCorp. . . . . . . . . . . . . . . . . . . . . . . . . . . . . . . 28,400 148,816Trustmark Corp. . . . . . . . . . . . . . . . . . . . . . . . . 2,899 56,009UMB Financial Corp. . . . . . . . . . . . . . . . . . . . . 705 26,797
335,796
COMMON STOCKS(continued) Shares
Value(Note 2)
Commercial Services — 0.4%Aaron’s, Inc. . . . . . . . . . . . . . . . . . . . . . . . . . . . 2,400 $ 71,568Coinstar, Inc.* . . . . . . . . . . . . . . . . . . . . . . . . . . 1,453 38,795FTI Consulting, Inc.* . . . . . . . . . . . . . . . . . . . . . 1,615 81,913GEO Group, Inc. (The)* . . . . . . . . . . . . . . . . . . 4,290 79,708Ritchie Bros. Auctioneers, Inc. (Canada) . . . . 2,630 61,674Sotheby’s . . . . . . . . . . . . . . . . . . . . . . . . . . . . . . 3,120 44,023
377,681
Commercial Services & Supplies — 0.5%Global Payments, Inc. . . . . . . . . . . . . . . . . . . . 2,700 101,142Monster Worldwide, Inc.* . . . . . . . . . . . . . . . . . 3,275 38,678Waste Connections, Inc.* . . . . . . . . . . . . . . . . . 2,405 62,313Waste Management, Inc. . . . . . . . . . . . . . . . . . 9,400 264,704
466,837
Communication Equipment — 1.8%Cisco Systems, Inc.* . . . . . . . . . . . . . . . . . . . . 14,600 272,144EMS Technologies, Inc.* . . . . . . . . . . . . . . . . . 4,570 95,513QUALCOMM, Inc. . . . . . . . . . . . . . . . . . . . . . . . 18,400 831,680Research In Motion Ltd. (Canada)* . . . . . . . . . 4,900 348,145
1,547,482
Computer Services & Software — 0.4%ANSYS, Inc.* . . . . . . . . . . . . . . . . . . . . . . . . . . . 2,595 80,860Compellent Technologies, Inc.* . . . . . . . . . . . . 6,034 92,018Informatica Corp.* . . . . . . . . . . . . . . . . . . . . . . . 2,840 48,820Netezza Corp.* . . . . . . . . . . . . . . . . . . . . . . . . . 4,674 38,888SRA International, Inc. (Class A Stock)* . . . . 3,200 56,192
316,778
ComputersRadiant Systems, Inc.* . . . . . . . . . . . . . . . . . . . 1,577 13,089
Computers & Peripherals — 1.1%Apple, Inc.* . . . . . . . . . . . . . . . . . . . . . . . . . . . . 3,201 455,918Hewlett-Packard Co. . . . . . . . . . . . . . . . . . . . . 6,200 239,630International Business Machines Corp. . . . . . 2,500 261,050
956,598
Construction — 0.1%Granite Construction, Inc. . . . . . . . . . . . . . . . . 1,500 49,920
Consumer — 0.2%Ticketmaster Entertainment, Inc.* . . . . . . . . . . 22,090 141,818
Consumer Finance — 0.3%SLM Corp.* . . . . . . . . . . . . . . . . . . . . . . . . . . . . 24,700 253,669
Diversified Consumer Services — 0.5%Career Education Corp.* . . . . . . . . . . . . . . . . . 6,100 151,829H&R Block, Inc. . . . . . . . . . . . . . . . . . . . . . . . . . 18,400 317,032
468,861
Diversified Financial Services — 0.5%Bank of America Corp. . . . . . . . . . . . . . . . . . . . 17,900 236,280Duff & Phelps Corp. (Class A Stock) . . . . . . . 2,390 42,494Eaton Vance Corp. . . . . . . . . . . . . . . . . . . . . . . 3,300 88,275Raymond James Financial, Inc. . . . . . . . . . . . 4,175 71,852Student Loan Corp. (The) . . . . . . . . . . . . . . . . 900 33,480
472,381
Electric — 0.4%NRG Energy, Inc.* . . . . . . . . . . . . . . . . . . . . . . 13,200 342,672
SEE NOTES TO FINANCIAL STATEMENTS.
A1
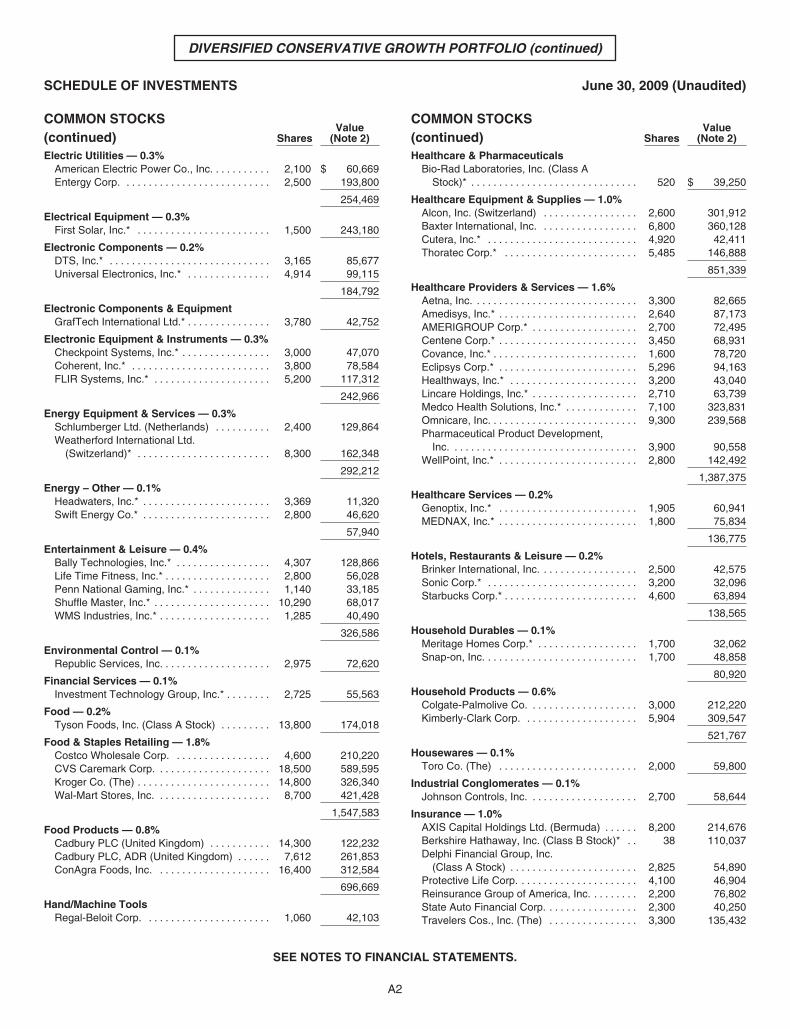
DIVERSIFIED CONSERVATIVE GROWTH PORTFOLIO (continued)
SCHEDULE OF INVESTMENTS June 30, 2009 (Unaudited)
COMMON STOCKS(continued) Shares
Value(Note 2)
Electric Utilities — 0.3%American Electric Power Co., Inc. . . . . . . . . . . 2,100 $ 60,669Entergy Corp. . . . . . . . . . . . . . . . . . . . . . . . . . . 2,500 193,800
254,469
Electrical Equipment — 0.3%First Solar, Inc.* . . . . . . . . . . . . . . . . . . . . . . . . 1,500 243,180
Electronic Components — 0.2%DTS, Inc.* . . . . . . . . . . . . . . . . . . . . . . . . . . . . . 3,165 85,677Universal Electronics, Inc.* . . . . . . . . . . . . . . . 4,914 99,115
184,792
Electronic Components & EquipmentGrafTech International Ltd.* . . . . . . . . . . . . . . . 3,780 42,752
Electronic Equipment & Instruments — 0.3%Checkpoint Systems, Inc.* . . . . . . . . . . . . . . . . 3,000 47,070Coherent, Inc.* . . . . . . . . . . . . . . . . . . . . . . . . . 3,800 78,584FLIR Systems, Inc.* . . . . . . . . . . . . . . . . . . . . . 5,200 117,312
242,966
Energy Equipment & Services — 0.3%Schlumberger Ltd. (Netherlands) . . . . . . . . . . 2,400 129,864Weatherford International Ltd.
(Switzerland)* . . . . . . . . . . . . . . . . . . . . . . . . 8,300 162,348
292,212
Energy – Other — 0.1%Headwaters, Inc.* . . . . . . . . . . . . . . . . . . . . . . . 3,369 11,320Swift Energy Co.* . . . . . . . . . . . . . . . . . . . . . . . 2,800 46,620
57,940
Entertainment & Leisure — 0.4%Bally Technologies, Inc.* . . . . . . . . . . . . . . . . . 4,307 128,866Life Time Fitness, Inc.* . . . . . . . . . . . . . . . . . . . 2,800 56,028Penn National Gaming, Inc.* . . . . . . . . . . . . . . 1,140 33,185Shuffle Master, Inc.* . . . . . . . . . . . . . . . . . . . . . 10,290 68,017WMS Industries, Inc.* . . . . . . . . . . . . . . . . . . . . 1,285 40,490
326,586
Environmental Control — 0.1%Republic Services, Inc. . . . . . . . . . . . . . . . . . . . 2,975 72,620
Financial Services — 0.1%Investment Technology Group, Inc.* . . . . . . . . 2,725 55,563
Food — 0.2%Tyson Foods, Inc. (Class A Stock) . . . . . . . . . 13,800 174,018
Food & Staples Retailing — 1.8%Costco Wholesale Corp. . . . . . . . . . . . . . . . . . 4,600 210,220CVS Caremark Corp. . . . . . . . . . . . . . . . . . . . . 18,500 589,595Kroger Co. (The) . . . . . . . . . . . . . . . . . . . . . . . . 14,800 326,340Wal-Mart Stores, Inc. . . . . . . . . . . . . . . . . . . . . 8,700 421,428
1,547,583
Food Products — 0.8%Cadbury PLC (United Kingdom) . . . . . . . . . . . 14,300 122,232Cadbury PLC, ADR (United Kingdom) . . . . . . 7,612 261,853ConAgra Foods, Inc. . . . . . . . . . . . . . . . . . . . . 16,400 312,584
696,669
Hand/Machine ToolsRegal-Beloit Corp. . . . . . . . . . . . . . . . . . . . . . . 1,060 42,103
COMMON STOCKS(continued) Shares
Value(Note 2)
Healthcare & PharmaceuticalsBio-Rad Laboratories, Inc. (Class A
Stock)* . . . . . . . . . . . . . . . . . . . . . . . . . . . . . . 520 $ 39,250
Healthcare Equipment & Supplies — 1.0%Alcon, Inc. (Switzerland) . . . . . . . . . . . . . . . . . 2,600 301,912Baxter International, Inc. . . . . . . . . . . . . . . . . . 6,800 360,128Cutera, Inc.* . . . . . . . . . . . . . . . . . . . . . . . . . . . 4,920 42,411Thoratec Corp.* . . . . . . . . . . . . . . . . . . . . . . . . 5,485 146,888
851,339
Healthcare Providers & Services — 1.6%Aetna, Inc. . . . . . . . . . . . . . . . . . . . . . . . . . . . . . 3,300 82,665Amedisys, Inc.* . . . . . . . . . . . . . . . . . . . . . . . . . 2,640 87,173AMERIGROUP Corp.* . . . . . . . . . . . . . . . . . . . 2,700 72,495Centene Corp.* . . . . . . . . . . . . . . . . . . . . . . . . . 3,450 68,931Covance, Inc.* . . . . . . . . . . . . . . . . . . . . . . . . . . 1,600 78,720Eclipsys Corp.* . . . . . . . . . . . . . . . . . . . . . . . . . 5,296 94,163Healthways, Inc.* . . . . . . . . . . . . . . . . . . . . . . . 3,200 43,040Lincare Holdings, Inc.* . . . . . . . . . . . . . . . . . . . 2,710 63,739Medco Health Solutions, Inc.* . . . . . . . . . . . . . 7,100 323,831Omnicare, Inc. . . . . . . . . . . . . . . . . . . . . . . . . . . 9,300 239,568Pharmaceutical Product Development,
Inc. . . . . . . . . . . . . . . . . . . . . . . . . . . . . . . . . . 3,900 90,558WellPoint, Inc.* . . . . . . . . . . . . . . . . . . . . . . . . . 2,800 142,492
1,387,375
Healthcare Services — 0.2%Genoptix, Inc.* . . . . . . . . . . . . . . . . . . . . . . . . . 1,905 60,941MEDNAX, Inc.* . . . . . . . . . . . . . . . . . . . . . . . . . 1,800 75,834
136,775
Hotels, Restaurants & Leisure — 0.2%Brinker International, Inc. . . . . . . . . . . . . . . . . . 2,500 42,575Sonic Corp.* . . . . . . . . . . . . . . . . . . . . . . . . . . . 3,200 32,096Starbucks Corp.* . . . . . . . . . . . . . . . . . . . . . . . . 4,600 63,894
138,565
Household Durables — 0.1%Meritage Homes Corp.* . . . . . . . . . . . . . . . . . . 1,700 32,062Snap-on, Inc. . . . . . . . . . . . . . . . . . . . . . . . . . . . 1,700 48,858
80,920
Household Products — 0.6%Colgate-Palmolive Co. . . . . . . . . . . . . . . . . . . . 3,000 212,220Kimberly-Clark Corp. . . . . . . . . . . . . . . . . . . . . 5,904 309,547
521,767
Housewares — 0.1%Toro Co. (The) . . . . . . . . . . . . . . . . . . . . . . . . . 2,000 59,800
Industrial Conglomerates — 0.1%Johnson Controls, Inc. . . . . . . . . . . . . . . . . . . . 2,700 58,644
Insurance — 1.0%AXIS Capital Holdings Ltd. (Bermuda) . . . . . . 8,200 214,676Berkshire Hathaway, Inc. (Class B Stock)* . . 38 110,037Delphi Financial Group, Inc.
(Class A Stock) . . . . . . . . . . . . . . . . . . . . . . . 2,825 54,890Protective Life Corp. . . . . . . . . . . . . . . . . . . . . . 4,100 46,904Reinsurance Group of America, Inc. . . . . . . . . 2,200 76,802State Auto Financial Corp. . . . . . . . . . . . . . . . . 2,300 40,250Travelers Cos., Inc. (The) . . . . . . . . . . . . . . . . 3,300 135,432
SEE NOTES TO FINANCIAL STATEMENTS.
A2
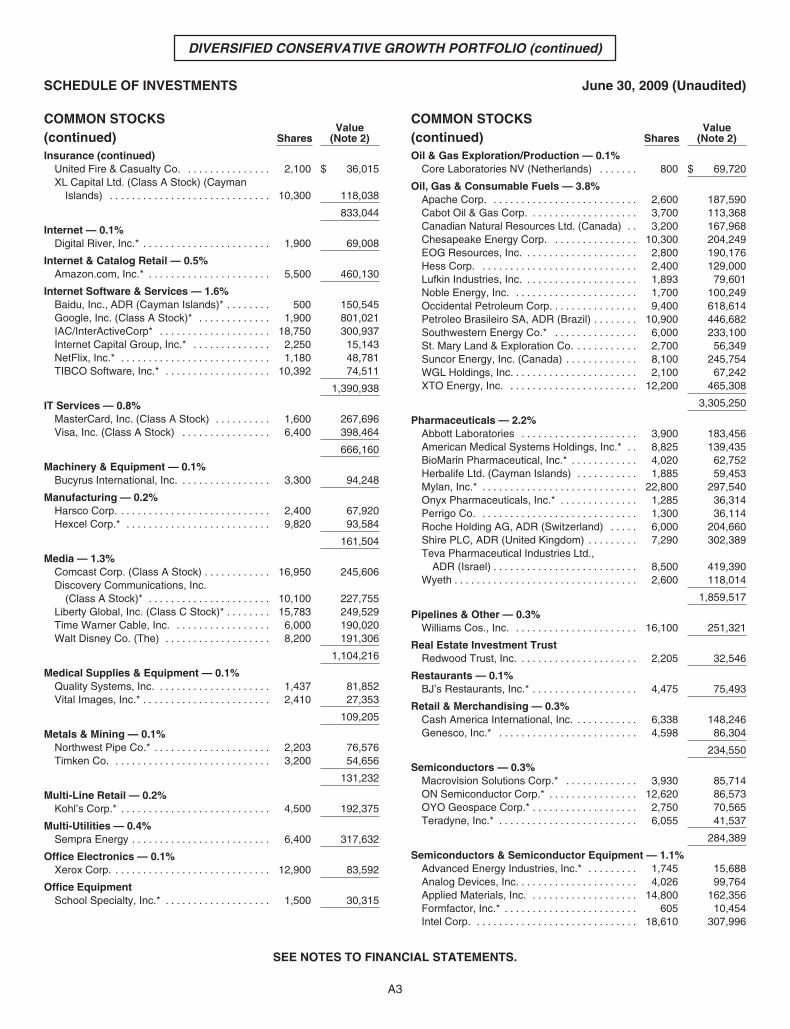
DIVERSIFIED CONSERVATIVE GROWTH PORTFOLIO (continued)
SCHEDULE OF INVESTMENTS June 30, 2009 (Unaudited)
COMMON STOCKS(continued) Shares
Value(Note 2)
Insurance (continued)United Fire & Casualty Co. . . . . . . . . . . . . . . . 2,100 $ 36,015XL Capital Ltd. (Class A Stock) (Cayman
Islands) . . . . . . . . . . . . . . . . . . . . . . . . . . . . . 10,300 118,038
833,044
Internet — 0.1%Digital River, Inc.* . . . . . . . . . . . . . . . . . . . . . . . 1,900 69,008
Internet & Catalog Retail — 0.5%Amazon.com, Inc.* . . . . . . . . . . . . . . . . . . . . . . 5,500 460,130
Internet Software & Services — 1.6%Baidu, Inc., ADR (Cayman Islands)* . . . . . . . . 500 150,545Google, Inc. (Class A Stock)* . . . . . . . . . . . . . 1,900 801,021IAC/InterActiveCorp* . . . . . . . . . . . . . . . . . . . . 18,750 300,937Internet Capital Group, Inc.* . . . . . . . . . . . . . . 2,250 15,143NetFlix, Inc.* . . . . . . . . . . . . . . . . . . . . . . . . . . . 1,180 48,781TIBCO Software, Inc.* . . . . . . . . . . . . . . . . . . . 10,392 74,511
1,390,938
IT Services — 0.8%MasterCard, Inc. (Class A Stock) . . . . . . . . . . 1,600 267,696Visa, Inc. (Class A Stock) . . . . . . . . . . . . . . . . 6,400 398,464
666,160
Machinery & Equipment — 0.1%Bucyrus International, Inc. . . . . . . . . . . . . . . . . 3,300 94,248
Manufacturing — 0.2%Harsco Corp. . . . . . . . . . . . . . . . . . . . . . . . . . . . 2,400 67,920Hexcel Corp.* . . . . . . . . . . . . . . . . . . . . . . . . . . 9,820 93,584
161,504
Media — 1.3%Comcast Corp. (Class A Stock) . . . . . . . . . . . . 16,950 245,606Discovery Communications, Inc.
(Class A Stock)* . . . . . . . . . . . . . . . . . . . . . . 10,100 227,755Liberty Global, Inc. (Class C Stock)* . . . . . . . . 15,783 249,529Time Warner Cable, Inc. . . . . . . . . . . . . . . . . . 6,000 190,020Walt Disney Co. (The) . . . . . . . . . . . . . . . . . . . 8,200 191,306
1,104,216
Medical Supplies & Equipment — 0.1%Quality Systems, Inc. . . . . . . . . . . . . . . . . . . . . 1,437 81,852Vital Images, Inc.* . . . . . . . . . . . . . . . . . . . . . . . 2,410 27,353
109,205
Metals & Mining — 0.1%Northwest Pipe Co.* . . . . . . . . . . . . . . . . . . . . . 2,203 76,576Timken Co. . . . . . . . . . . . . . . . . . . . . . . . . . . . . 3,200 54,656
131,232
Multi-Line Retail — 0.2%Kohl’s Corp.* . . . . . . . . . . . . . . . . . . . . . . . . . . . 4,500 192,375
Multi-Utilities — 0.4%Sempra Energy . . . . . . . . . . . . . . . . . . . . . . . . . 6,400 317,632
Office Electronics — 0.1%Xerox Corp. . . . . . . . . . . . . . . . . . . . . . . . . . . . . 12,900 83,592
Office EquipmentSchool Specialty, Inc.* . . . . . . . . . . . . . . . . . . . 1,500 30,315
COMMON STOCKS(continued) Shares
Value(Note 2)
Oil & Gas Exploration/Production — 0.1%Core Laboratories NV (Netherlands) . . . . . . . 800 $ 69,720
Oil, Gas & Consumable Fuels — 3.8%Apache Corp. . . . . . . . . . . . . . . . . . . . . . . . . . . 2,600 187,590Cabot Oil & Gas Corp. . . . . . . . . . . . . . . . . . . . 3,700 113,368Canadian Natural Resources Ltd. (Canada) . . 3,200 167,968Chesapeake Energy Corp. . . . . . . . . . . . . . . . 10,300 204,249EOG Resources, Inc. . . . . . . . . . . . . . . . . . . . . 2,800 190,176Hess Corp. . . . . . . . . . . . . . . . . . . . . . . . . . . . . 2,400 129,000Lufkin Industries, Inc. . . . . . . . . . . . . . . . . . . . . 1,893 79,601Noble Energy, Inc. . . . . . . . . . . . . . . . . . . . . . . 1,700 100,249Occidental Petroleum Corp. . . . . . . . . . . . . . . . 9,400 618,614Petroleo Brasileiro SA, ADR (Brazil) . . . . . . . . 10,900 446,682Southwestern Energy Co.* . . . . . . . . . . . . . . . 6,000 233,100St. Mary Land & Exploration Co. . . . . . . . . . . . 2,700 56,349Suncor Energy, Inc. (Canada) . . . . . . . . . . . . . 8,100 245,754WGL Holdings, Inc. . . . . . . . . . . . . . . . . . . . . . . 2,100 67,242XTO Energy, Inc. . . . . . . . . . . . . . . . . . . . . . . . 12,200 465,308
3,305,250
Pharmaceuticals — 2.2%Abbott Laboratories . . . . . . . . . . . . . . . . . . . . . 3,900 183,456American Medical Systems Holdings, Inc.* . . 8,825 139,435BioMarin Pharmaceutical, Inc.* . . . . . . . . . . . . 4,020 62,752Herbalife Ltd. (Cayman Islands) . . . . . . . . . . . 1,885 59,453Mylan, Inc.* . . . . . . . . . . . . . . . . . . . . . . . . . . . . 22,800 297,540Onyx Pharmaceuticals, Inc.* . . . . . . . . . . . . . . 1,285 36,314Perrigo Co. . . . . . . . . . . . . . . . . . . . . . . . . . . . . 1,300 36,114Roche Holding AG, ADR (Switzerland) . . . . . 6,000 204,660Shire PLC, ADR (United Kingdom) . . . . . . . . . 7,290 302,389Teva Pharmaceutical Industries Ltd.,
ADR (Israel) . . . . . . . . . . . . . . . . . . . . . . . . . . 8,500 419,390Wyeth . . . . . . . . . . . . . . . . . . . . . . . . . . . . . . . . . 2,600 118,014
1,859,517
Pipelines & Other — 0.3%Williams Cos., Inc. . . . . . . . . . . . . . . . . . . . . . . 16,100 251,321
Real Estate Investment TrustRedwood Trust, Inc. . . . . . . . . . . . . . . . . . . . . . 2,205 32,546
Restaurants — 0.1%BJ’s Restaurants, Inc.* . . . . . . . . . . . . . . . . . . . 4,475 75,493
Retail & Merchandising — 0.3%Cash America International, Inc. . . . . . . . . . . . 6,338 148,246Genesco, Inc.* . . . . . . . . . . . . . . . . . . . . . . . . . 4,598 86,304
234,550
Semiconductors — 0.3%Macrovision Solutions Corp.* . . . . . . . . . . . . . 3,930 85,714ON Semiconductor Corp.* . . . . . . . . . . . . . . . . 12,620 86,573OYO Geospace Corp.* . . . . . . . . . . . . . . . . . . . 2,750 70,565Teradyne, Inc.* . . . . . . . . . . . . . . . . . . . . . . . . . 6,055 41,537
284,389
Semiconductors & Semiconductor Equipment — 1.1%Advanced Energy Industries, Inc.* . . . . . . . . . 1,745 15,688Analog Devices, Inc. . . . . . . . . . . . . . . . . . . . . . 4,026 99,764Applied Materials, Inc. . . . . . . . . . . . . . . . . . . . 14,800 162,356Formfactor, Inc.* . . . . . . . . . . . . . . . . . . . . . . . . 605 10,454Intel Corp. . . . . . . . . . . . . . . . . . . . . . . . . . . . . . 18,610 307,996
SEE NOTES TO FINANCIAL STATEMENTS.
A3
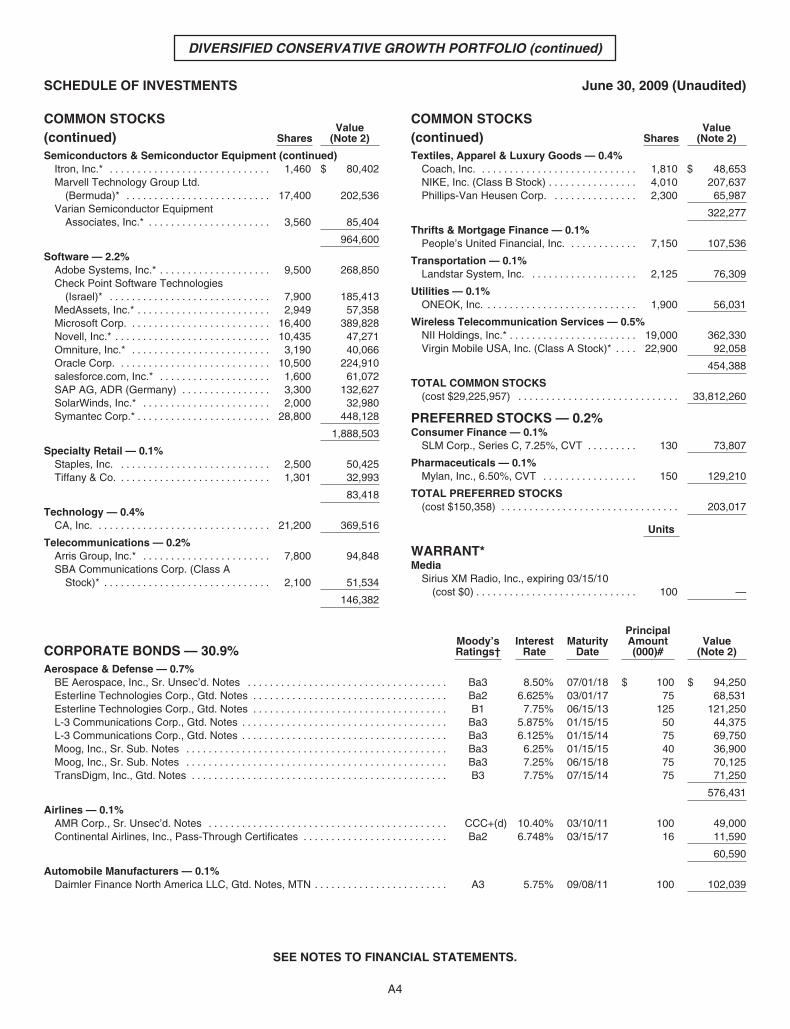
DIVERSIFIED CONSERVATIVE GROWTH PORTFOLIO (continued)
SCHEDULE OF INVESTMENTS June 30, 2009 (Unaudited)
COMMON STOCKS(continued) Shares
Value(Note 2)
Semiconductors & Semiconductor Equipment (continued)Itron, Inc.* . . . . . . . . . . . . . . . . . . . . . . . . . . . . . 1,460 $ 80,402Marvell Technology Group Ltd.
(Bermuda)* . . . . . . . . . . . . . . . . . . . . . . . . . . 17,400 202,536Varian Semiconductor Equipment
Associates, Inc.* . . . . . . . . . . . . . . . . . . . . . . 3,560 85,404
964,600
Software — 2.2%Adobe Systems, Inc.* . . . . . . . . . . . . . . . . . . . . 9,500 268,850Check Point Software Technologies
(Israel)* . . . . . . . . . . . . . . . . . . . . . . . . . . . . . 7,900 185,413MedAssets, Inc.* . . . . . . . . . . . . . . . . . . . . . . . . 2,949 57,358Microsoft Corp. . . . . . . . . . . . . . . . . . . . . . . . . . 16,400 389,828Novell, Inc.* . . . . . . . . . . . . . . . . . . . . . . . . . . . . 10,435 47,271Omniture, Inc.* . . . . . . . . . . . . . . . . . . . . . . . . . 3,190 40,066Oracle Corp. . . . . . . . . . . . . . . . . . . . . . . . . . . . 10,500 224,910salesforce.com, Inc.* . . . . . . . . . . . . . . . . . . . . 1,600 61,072SAP AG, ADR (Germany) . . . . . . . . . . . . . . . . 3,300 132,627SolarWinds, Inc.* . . . . . . . . . . . . . . . . . . . . . . . 2,000 32,980Symantec Corp.* . . . . . . . . . . . . . . . . . . . . . . . . 28,800 448,128
1,888,503
Specialty Retail — 0.1%Staples, Inc. . . . . . . . . . . . . . . . . . . . . . . . . . . . 2,500 50,425Tiffany & Co. . . . . . . . . . . . . . . . . . . . . . . . . . . . 1,301 32,993
83,418
Technology — 0.4%CA, Inc. . . . . . . . . . . . . . . . . . . . . . . . . . . . . . . . 21,200 369,516
Telecommunications — 0.2%Arris Group, Inc.* . . . . . . . . . . . . . . . . . . . . . . . 7,800 94,848SBA Communications Corp. (Class A
Stock)* . . . . . . . . . . . . . . . . . . . . . . . . . . . . . . 2,100 51,534
146,382
COMMON STOCKS(continued) Shares
Value(Note 2)
Textiles, Apparel & Luxury Goods — 0.4%Coach, Inc. . . . . . . . . . . . . . . . . . . . . . . . . . . . . 1,810 $ 48,653NIKE, Inc. (Class B Stock) . . . . . . . . . . . . . . . . 4,010 207,637Phillips-Van Heusen Corp. . . . . . . . . . . . . . . . 2,300 65,987
322,277
Thrifts & Mortgage Finance — 0.1%People’s United Financial, Inc. . . . . . . . . . . . . 7,150 107,536
Transportation — 0.1%Landstar System, Inc. . . . . . . . . . . . . . . . . . . . 2,125 76,309
Utilities — 0.1%ONEOK, Inc. . . . . . . . . . . . . . . . . . . . . . . . . . . . 1,900 56,031
Wireless Telecommunication Services — 0.5%NII Holdings, Inc.* . . . . . . . . . . . . . . . . . . . . . . . 19,000 362,330Virgin Mobile USA, Inc. (Class A Stock)* . . . . 22,900 92,058
454,388
TOTAL COMMON STOCKS(cost $29,225,957) . . . . . . . . . . . . . . . . . . . . . . . . . . . . . 33,812,260
PREFERRED STOCKS — 0.2%Consumer Finance — 0.1%
SLM Corp., Series C, 7.25%, CVT . . . . . . . . . 130 73,807
Pharmaceuticals — 0.1%Mylan, Inc., 6.50%, CVT . . . . . . . . . . . . . . . . . 150 129,210
TOTAL PREFERRED STOCKS(cost $150,358) . . . . . . . . . . . . . . . . . . . . . . . . . . . . . . . . 203,017
Units
WARRANT*Media
Sirius XM Radio, Inc., expiring 03/15/10(cost $0) . . . . . . . . . . . . . . . . . . . . . . . . . . . . . 100 —
CORPORATE BONDS — 30.9%Moody’sRatings†
InterestRate
MaturityDate
PrincipalAmount(000)#
Value(Note 2)
Aerospace & Defense — 0.7%BE Aerospace, Inc., Sr. Unsec’d. Notes . . . . . . . . . . . . . . . . . . . . . . . . . . . . . . . . . . . . Ba3 8.50% 07/01/18 $ 100 $ 94,250Esterline Technologies Corp., Gtd. Notes . . . . . . . . . . . . . . . . . . . . . . . . . . . . . . . . . . . Ba2 6.625% 03/01/17 75 68,531Esterline Technologies Corp., Gtd. Notes . . . . . . . . . . . . . . . . . . . . . . . . . . . . . . . . . . . B1 7.75% 06/15/13 125 121,250L-3 Communications Corp., Gtd. Notes . . . . . . . . . . . . . . . . . . . . . . . . . . . . . . . . . . . . . Ba3 5.875% 01/15/15 50 44,375L-3 Communications Corp., Gtd. Notes . . . . . . . . . . . . . . . . . . . . . . . . . . . . . . . . . . . . . Ba3 6.125% 01/15/14 75 69,750Moog, Inc., Sr. Sub. Notes . . . . . . . . . . . . . . . . . . . . . . . . . . . . . . . . . . . . . . . . . . . . . . . Ba3 6.25% 01/15/15 40 36,900Moog, Inc., Sr. Sub. Notes . . . . . . . . . . . . . . . . . . . . . . . . . . . . . . . . . . . . . . . . . . . . . . . Ba3 7.25% 06/15/18 75 70,125TransDigm, Inc., Gtd. Notes . . . . . . . . . . . . . . . . . . . . . . . . . . . . . . . . . . . . . . . . . . . . . . B3 7.75% 07/15/14 75 71,250
576,431
Airlines — 0.1%AMR Corp., Sr. Unsec’d. Notes . . . . . . . . . . . . . . . . . . . . . . . . . . . . . . . . . . . . . . . . . . . CCC+(d) 10.40% 03/10/11 100 49,000Continental Airlines, Inc., Pass-Through Certificates . . . . . . . . . . . . . . . . . . . . . . . . . . Ba2 6.748% 03/15/17 16 11,590
60,590
Automobile Manufacturers — 0.1%Daimler Finance North America LLC, Gtd. Notes, MTN . . . . . . . . . . . . . . . . . . . . . . . . A3 5.75% 09/08/11 100 102,039
SEE NOTES TO FINANCIAL STATEMENTS.
A4
DIVERSIFIED CONSERVATIVE GROWTH PORTFOLIO (continued)
SCHEDULE OF INVESTMENTS June 30, 2009 (Unaudited)
CORPORATE BONDS(continued)
Moody’sRatings†
InterestRate
MaturityDate
PrincipalAmount(000)#
Value(Note 2)
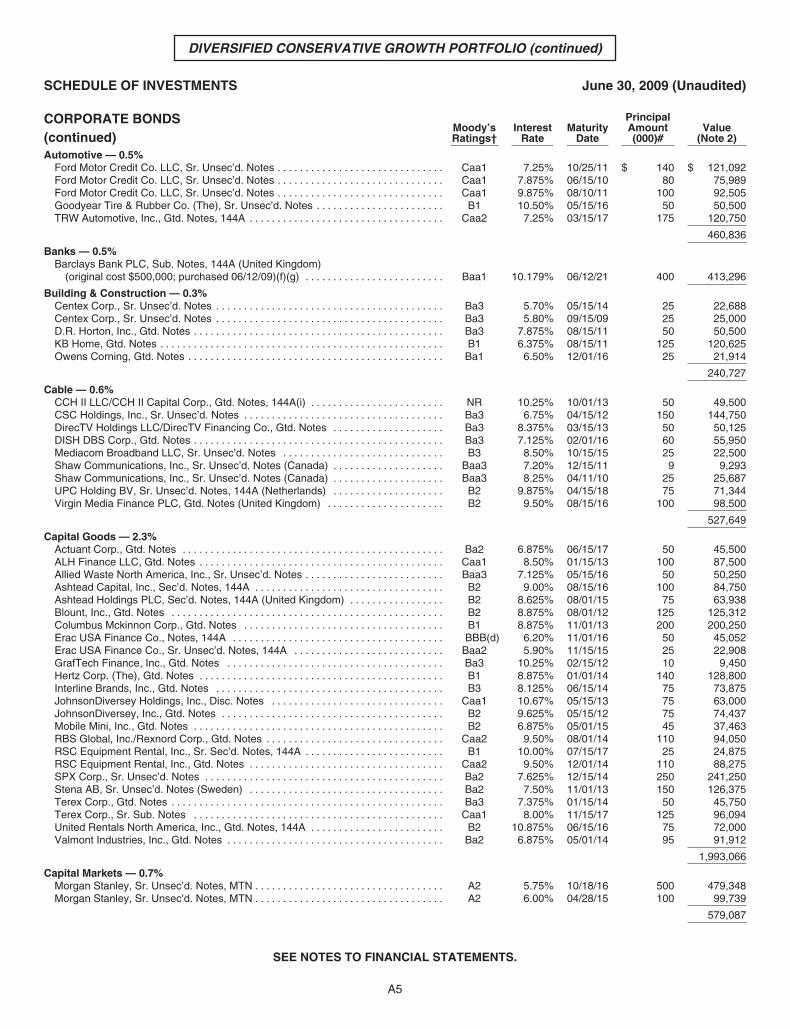
Automotive — 0.5%Ford Motor Credit Co. LLC, Sr. Unsec’d. Notes . . . . . . . . . . . . . . . . . . . . . . . . . . . . . . Caa1 7.25% 10/25/11 $ 140 $ 121,092Ford Motor Credit Co. LLC, Sr. Unsec’d. Notes . . . . . . . . . . . . . . . . . . . . . . . . . . . . . . Caa1 7.875% 06/15/10 80 75,989Ford Motor Credit Co. LLC, Sr. Unsec’d. Notes . . . . . . . . . . . . . . . . . . . . . . . . . . . . . . Caa1 9.875% 08/10/11 100 92,505Goodyear Tire & Rubber Co. (The), Sr. Unsec’d. Notes . . . . . . . . . . . . . . . . . . . . . . . B1 10.50% 05/15/16 50 50,500TRW Automotive, Inc., Gtd. Notes, 144A . . . . . . . . . . . . . . . . . . . . . . . . . . . . . . . . . . . Caa2 7.25% 03/15/17 175 120,750
460,836
Banks — 0.5%Barclays Bank PLC, Sub. Notes, 144A (United Kingdom)
(original cost $500,000; purchased 06/12/09)(f)(g) . . . . . . . . . . . . . . . . . . . . . . . . . Baa1 10.179% 06/12/21 400 413,296
Building & Construction — 0.3%Centex Corp., Sr. Unsec’d. Notes . . . . . . . . . . . . . . . . . . . . . . . . . . . . . . . . . . . . . . . . . Ba3 5.70% 05/15/14 25 22,688Centex Corp., Sr. Unsec’d. Notes . . . . . . . . . . . . . . . . . . . . . . . . . . . . . . . . . . . . . . . . . Ba3 5.80% 09/15/09 25 25,000D.R. Horton, Inc., Gtd. Notes . . . . . . . . . . . . . . . . . . . . . . . . . . . . . . . . . . . . . . . . . . . . . Ba3 7.875% 08/15/11 50 50,500KB Home, Gtd. Notes . . . . . . . . . . . . . . . . . . . . . . . . . . . . . . . . . . . . . . . . . . . . . . . . . . . B1 6.375% 08/15/11 125 120,625Owens Corning, Gtd. Notes . . . . . . . . . . . . . . . . . . . . . . . . . . . . . . . . . . . . . . . . . . . . . . Ba1 6.50% 12/01/16 25 21,914
240,727
Cable — 0.6%CCH II LLC/CCH II Capital Corp., Gtd. Notes, 144A(i) . . . . . . . . . . . . . . . . . . . . . . . . NR 10.25% 10/01/13 50 49,500CSC Holdings, Inc., Sr. Unsec’d. Notes . . . . . . . . . . . . . . . . . . . . . . . . . . . . . . . . . . . . Ba3 6.75% 04/15/12 150 144,750DirecTV Holdings LLC/DirecTV Financing Co., Gtd. Notes . . . . . . . . . . . . . . . . . . . . Ba3 8.375% 03/15/13 50 50,125DISH DBS Corp., Gtd. Notes . . . . . . . . . . . . . . . . . . . . . . . . . . . . . . . . . . . . . . . . . . . . . Ba3 7.125% 02/01/16 60 55,950Mediacom Broadband LLC, Sr. Unsec’d. Notes . . . . . . . . . . . . . . . . . . . . . . . . . . . . . B3 8.50% 10/15/15 25 22,500Shaw Communications, Inc., Sr. Unsec’d. Notes (Canada) . . . . . . . . . . . . . . . . . . . . Baa3 7.20% 12/15/11 9 9,293Shaw Communications, Inc., Sr. Unsec’d. Notes (Canada) . . . . . . . . . . . . . . . . . . . . Baa3 8.25% 04/11/10 25 25,687UPC Holding BV, Sr. Unsec’d. Notes, 144A (Netherlands) . . . . . . . . . . . . . . . . . . . . B2 9.875% 04/15/18 75 71,344Virgin Media Finance PLC, Gtd. Notes (United Kingdom) . . . . . . . . . . . . . . . . . . . . . B2 9.50% 08/15/16 100 98,500
527,649
Capital Goods — 2.3%Actuant Corp., Gtd. Notes . . . . . . . . . . . . . . . . . . . . . . . . . . . . . . . . . . . . . . . . . . . . . . . Ba2 6.875% 06/15/17 50 45,500ALH Finance LLC, Gtd. Notes . . . . . . . . . . . . . . . . . . . . . . . . . . . . . . . . . . . . . . . . . . . . Caa1 8.50% 01/15/13 100 87,500Allied Waste North America, Inc., Sr. Unsec’d. Notes . . . . . . . . . . . . . . . . . . . . . . . . . Baa3 7.125% 05/15/16 50 50,250Ashtead Capital, Inc., Sec’d. Notes, 144A . . . . . . . . . . . . . . . . . . . . . . . . . . . . . . . . . . B2 9.00% 08/15/16 100 84,750Ashtead Holdings PLC, Sec’d. Notes, 144A (United Kingdom) . . . . . . . . . . . . . . . . . B2 8.625% 08/01/15 75 63,938Blount, Inc., Gtd. Notes . . . . . . . . . . . . . . . . . . . . . . . . . . . . . . . . . . . . . . . . . . . . . . . . . B2 8.875% 08/01/12 125 125,312Columbus Mckinnon Corp., Gtd. Notes . . . . . . . . . . . . . . . . . . . . . . . . . . . . . . . . . . . . B1 8.875% 11/01/13 200 200,250Erac USA Finance Co., Notes, 144A . . . . . . . . . . . . . . . . . . . . . . . . . . . . . . . . . . . . . . BBB(d) 6.20% 11/01/16 50 45,052Erac USA Finance Co., Sr. Unsec’d. Notes, 144A . . . . . . . . . . . . . . . . . . . . . . . . . . . Baa2 5.90% 11/15/15 25 22,908GrafTech Finance, Inc., Gtd. Notes . . . . . . . . . . . . . . . . . . . . . . . . . . . . . . . . . . . . . . . Ba3 10.25% 02/15/12 10 9,450Hertz Corp. (The), Gtd. Notes . . . . . . . . . . . . . . . . . . . . . . . . . . . . . . . . . . . . . . . . . . . . B1 8.875% 01/01/14 140 128,800Interline Brands, Inc., Gtd. Notes . . . . . . . . . . . . . . . . . . . . . . . . . . . . . . . . . . . . . . . . . B3 8.125% 06/15/14 75 73,875JohnsonDiversey Holdings, Inc., Disc. Notes . . . . . . . . . . . . . . . . . . . . . . . . . . . . . . . Caa1 10.67% 05/15/13 75 63,000JohnsonDiversey, Inc., Gtd. Notes . . . . . . . . . . . . . . . . . . . . . . . . . . . . . . . . . . . . . . . . B2 9.625% 05/15/12 75 74,437Mobile Mini, Inc., Gtd. Notes . . . . . . . . . . . . . . . . . . . . . . . . . . . . . . . . . . . . . . . . . . . . . B2 6.875% 05/01/15 45 37,463RBS Global, Inc./Rexnord Corp., Gtd. Notes . . . . . . . . . . . . . . . . . . . . . . . . . . . . . . . . Caa2 9.50% 08/01/14 110 94,050RSC Equipment Rental, Inc., Sr. Sec’d. Notes, 144A . . . . . . . . . . . . . . . . . . . . . . . . . B1 10.00% 07/15/17 25 24,875RSC Equipment Rental, Inc., Gtd. Notes . . . . . . . . . . . . . . . . . . . . . . . . . . . . . . . . . . . Caa2 9.50% 12/01/14 110 88,275SPX Corp., Sr. Unsec’d. Notes . . . . . . . . . . . . . . . . . . . . . . . . . . . . . . . . . . . . . . . . . . . Ba2 7.625% 12/15/14 250 241,250Stena AB, Sr. Unsec’d. Notes (Sweden) . . . . . . . . . . . . . . . . . . . . . . . . . . . . . . . . . . . Ba2 7.50% 11/01/13 150 126,375Terex Corp., Gtd. Notes . . . . . . . . . . . . . . . . . . . . . . . . . . . . . . . . . . . . . . . . . . . . . . . . . Ba3 7.375% 01/15/14 50 45,750Terex Corp., Sr. Sub. Notes . . . . . . . . . . . . . . . . . . . . . . . . . . . . . . . . . . . . . . . . . . . . . Caa1 8.00% 11/15/17 125 96,094United Rentals North America, Inc., Gtd. Notes, 144A . . . . . . . . . . . . . . . . . . . . . . . . B2 10.875% 06/15/16 75 72,000Valmont Industries, Inc., Gtd. Notes . . . . . . . . . . . . . . . . . . . . . . . . . . . . . . . . . . . . . . . Ba2 6.875% 05/01/14 95 91,912
1,993,066
Capital Markets — 0.7%Morgan Stanley, Sr. Unsec’d. Notes, MTN . . . . . . . . . . . . . . . . . . . . . . . . . . . . . . . . . . A2 5.75% 10/18/16 500 479,348Morgan Stanley, Sr. Unsec’d. Notes, MTN . . . . . . . . . . . . . . . . . . . . . . . . . . . . . . . . . . A2 6.00% 04/28/15 100 99,739
579,087
SEE NOTES TO FINANCIAL STATEMENTS.
A5
DIVERSIFIED CONSERVATIVE GROWTH PORTFOLIO (continued)
SCHEDULE OF INVESTMENTS June 30, 2009 (Unaudited)
CORPORATE BONDS(continued)
Moody’sRatings†
InterestRate
MaturityDate
PrincipalAmount(000)#
Value(Note 2)
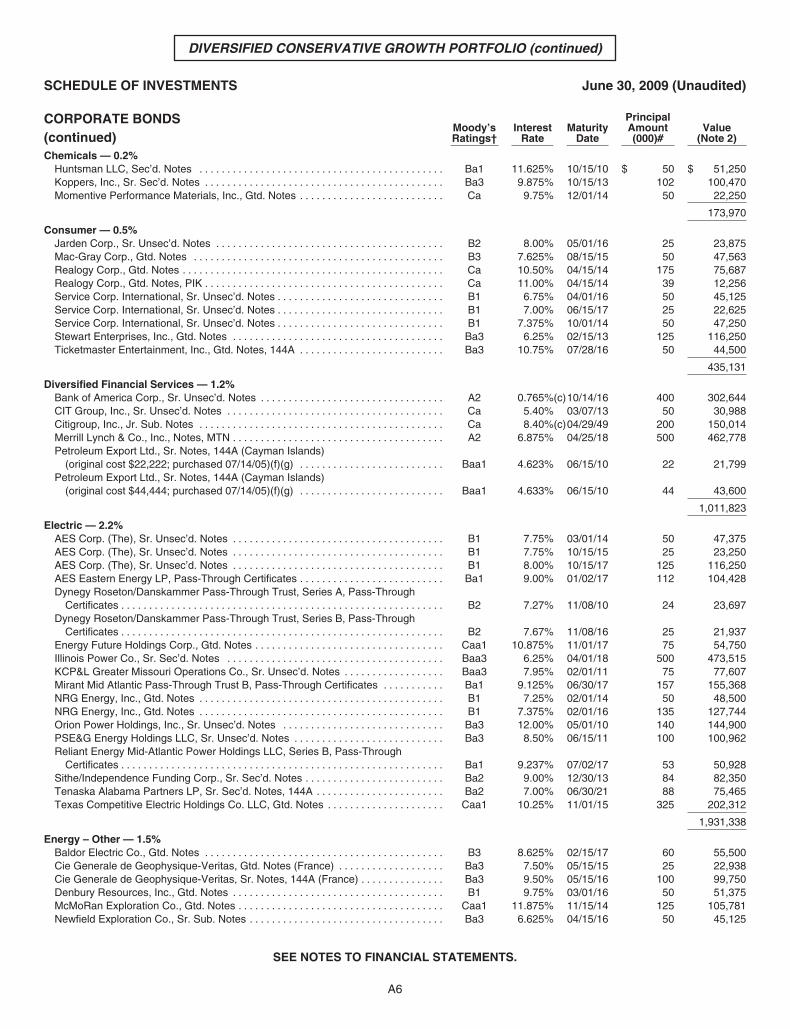
Chemicals — 0.2%Huntsman LLC, Sec’d. Notes . . . . . . . . . . . . . . . . . . . . . . . . . . . . . . . . . . . . . . . . . . . . Ba1 11.625% 10/15/10 $ 50 $ 51,250Koppers, Inc., Sr. Sec’d. Notes . . . . . . . . . . . . . . . . . . . . . . . . . . . . . . . . . . . . . . . . . . . Ba3 9.875% 10/15/13 102 100,470Momentive Performance Materials, Inc., Gtd. Notes . . . . . . . . . . . . . . . . . . . . . . . . . . Ca 9.75% 12/01/14 50 22,250
173,970
Consumer — 0.5%Jarden Corp., Sr. Unsec’d. Notes . . . . . . . . . . . . . . . . . . . . . . . . . . . . . . . . . . . . . . . . . B2 8.00% 05/01/16 25 23,875Mac-Gray Corp., Gtd. Notes . . . . . . . . . . . . . . . . . . . . . . . . . . . . . . . . . . . . . . . . . . . . . B3 7.625% 08/15/15 50 47,563Realogy Corp., Gtd. Notes . . . . . . . . . . . . . . . . . . . . . . . . . . . . . . . . . . . . . . . . . . . . . . . Ca 10.50% 04/15/14 175 75,687Realogy Corp., Gtd. Notes, PIK . . . . . . . . . . . . . . . . . . . . . . . . . . . . . . . . . . . . . . . . . . . Ca 11.00% 04/15/14 39 12,256Service Corp. International, Sr. Unsec’d. Notes . . . . . . . . . . . . . . . . . . . . . . . . . . . . . . B1 6.75% 04/01/16 50 45,125Service Corp. International, Sr. Unsec’d. Notes . . . . . . . . . . . . . . . . . . . . . . . . . . . . . . B1 7.00% 06/15/17 25 22,625Service Corp. International, Sr. Unsec’d. Notes . . . . . . . . . . . . . . . . . . . . . . . . . . . . . . B1 7.375% 10/01/14 50 47,250Stewart Enterprises, Inc., Gtd. Notes . . . . . . . . . . . . . . . . . . . . . . . . . . . . . . . . . . . . . . Ba3 6.25% 02/15/13 125 116,250Ticketmaster Entertainment, Inc., Gtd. Notes, 144A . . . . . . . . . . . . . . . . . . . . . . . . . . Ba3 10.75% 07/28/16 50 44,500
435,131
Diversified Financial Services — 1.2%Bank of America Corp., Sr. Unsec’d. Notes . . . . . . . . . . . . . . . . . . . . . . . . . . . . . . . . . A2 0.765%(c)10/14/16 400 302,644CIT Group, Inc., Sr. Unsec’d. Notes . . . . . . . . . . . . . . . . . . . . . . . . . . . . . . . . . . . . . . . Ca 5.40% 03/07/13 50 30,988Citigroup, Inc., Jr. Sub. Notes . . . . . . . . . . . . . . . . . . . . . . . . . . . . . . . . . . . . . . . . . . . . Ca 8.40%(c)04/29/49 200 150,014Merrill Lynch & Co., Inc., Notes, MTN . . . . . . . . . . . . . . . . . . . . . . . . . . . . . . . . . . . . . . A2 6.875% 04/25/18 500 462,778Petroleum Export Ltd., Sr. Notes, 144A (Cayman Islands)
(original cost $22,222; purchased 07/14/05)(f)(g) . . . . . . . . . . . . . . . . . . . . . . . . . . Baa1 4.623% 06/15/10 22 21,799Petroleum Export Ltd., Sr. Notes, 144A (Cayman Islands)
(original cost $44,444; purchased 07/14/05)(f)(g) . . . . . . . . . . . . . . . . . . . . . . . . . . Baa1 4.633% 06/15/10 44 43,600
1,011,823
Electric — 2.2%AES Corp. (The), Sr. Unsec’d. Notes . . . . . . . . . . . . . . . . . . . . . . . . . . . . . . . . . . . . . . B1 7.75% 03/01/14 50 47,375AES Corp. (The), Sr. Unsec’d. Notes . . . . . . . . . . . . . . . . . . . . . . . . . . . . . . . . . . . . . . B1 7.75% 10/15/15 25 23,250AES Corp. (The), Sr. Unsec’d. Notes . . . . . . . . . . . . . . . . . . . . . . . . . . . . . . . . . . . . . . B1 8.00% 10/15/17 125 116,250AES Eastern Energy LP, Pass-Through Certificates . . . . . . . . . . . . . . . . . . . . . . . . . . Ba1 9.00% 01/02/17 112 104,428Dynegy Roseton/Danskammer Pass-Through Trust, Series A, Pass-Through
Certificates . . . . . . . . . . . . . . . . . . . . . . . . . . . . . . . . . . . . . . . . . . . . . . . . . . . . . . . . . . B2 7.27% 11/08/10 24 23,697Dynegy Roseton/Danskammer Pass-Through Trust, Series B, Pass-Through
Certificates . . . . . . . . . . . . . . . . . . . . . . . . . . . . . . . . . . . . . . . . . . . . . . . . . . . . . . . . . . B2 7.67% 11/08/16 25 21,937Energy Future Holdings Corp., Gtd. Notes . . . . . . . . . . . . . . . . . . . . . . . . . . . . . . . . . . Caa1 10.875% 11/01/17 75 54,750Illinois Power Co., Sr. Sec’d. Notes . . . . . . . . . . . . . . . . . . . . . . . . . . . . . . . . . . . . . . . Baa3 6.25% 04/01/18 500 473,515KCP&L Greater Missouri Operations Co., Sr. Unsec’d. Notes . . . . . . . . . . . . . . . . . . Baa3 7.95% 02/01/11 75 77,607Mirant Mid Atlantic Pass-Through Trust B, Pass-Through Certificates . . . . . . . . . . . Ba1 9.125% 06/30/17 157 155,368NRG Energy, Inc., Gtd. Notes . . . . . . . . . . . . . . . . . . . . . . . . . . . . . . . . . . . . . . . . . . . . B1 7.25% 02/01/14 50 48,500NRG Energy, Inc., Gtd. Notes . . . . . . . . . . . . . . . . . . . . . . . . . . . . . . . . . . . . . . . . . . . . B1 7.375% 02/01/16 135 127,744Orion Power Holdings, Inc., Sr. Unsec’d. Notes . . . . . . . . . . . . . . . . . . . . . . . . . . . . . Ba3 12.00% 05/01/10 140 144,900PSE&G Energy Holdings LLC, Sr. Unsec’d. Notes . . . . . . . . . . . . . . . . . . . . . . . . . . . Ba3 8.50% 06/15/11 100 100,962Reliant Energy Mid-Atlantic Power Holdings LLC, Series B, Pass-Through
Certificates . . . . . . . . . . . . . . . . . . . . . . . . . . . . . . . . . . . . . . . . . . . . . . . . . . . . . . . . . . Ba1 9.237% 07/02/17 53 50,928Sithe/Independence Funding Corp., Sr. Sec’d. Notes . . . . . . . . . . . . . . . . . . . . . . . . . Ba2 9.00% 12/30/13 84 82,350Tenaska Alabama Partners LP, Sr. Sec’d. Notes, 144A . . . . . . . . . . . . . . . . . . . . . . . Ba2 7.00% 06/30/21 88 75,465Texas Competitive Electric Holdings Co. LLC, Gtd. Notes . . . . . . . . . . . . . . . . . . . . . Caa1 10.25% 11/01/15 325 202,312
1,931,338
Energy – Other — 1.5%Baldor Electric Co., Gtd. Notes . . . . . . . . . . . . . . . . . . . . . . . . . . . . . . . . . . . . . . . . . . . B3 8.625% 02/15/17 60 55,500Cie Generale de Geophysique-Veritas, Gtd. Notes (France) . . . . . . . . . . . . . . . . . . . Ba3 7.50% 05/15/15 25 22,938Cie Generale de Geophysique-Veritas, Sr. Notes, 144A (France) . . . . . . . . . . . . . . . Ba3 9.50% 05/15/16 100 99,750Denbury Resources, Inc., Gtd. Notes . . . . . . . . . . . . . . . . . . . . . . . . . . . . . . . . . . . . . . B1 9.75% 03/01/16 50 51,375McMoRan Exploration Co., Gtd. Notes . . . . . . . . . . . . . . . . . . . . . . . . . . . . . . . . . . . . . Caa1 11.875% 11/15/14 125 105,781Newfield Exploration Co., Sr. Sub. Notes . . . . . . . . . . . . . . . . . . . . . . . . . . . . . . . . . . . Ba3 6.625% 04/15/16 50 45,125
SEE NOTES TO FINANCIAL STATEMENTS.
A6
DIVERSIFIED CONSERVATIVE GROWTH PORTFOLIO (continued)
SCHEDULE OF INVESTMENTS June 30, 2009 (Unaudited)
CORPORATE BONDS(continued)
Moody’sRatings†
InterestRate
MaturityDate
PrincipalAmount(000)#
Value(Note 2)
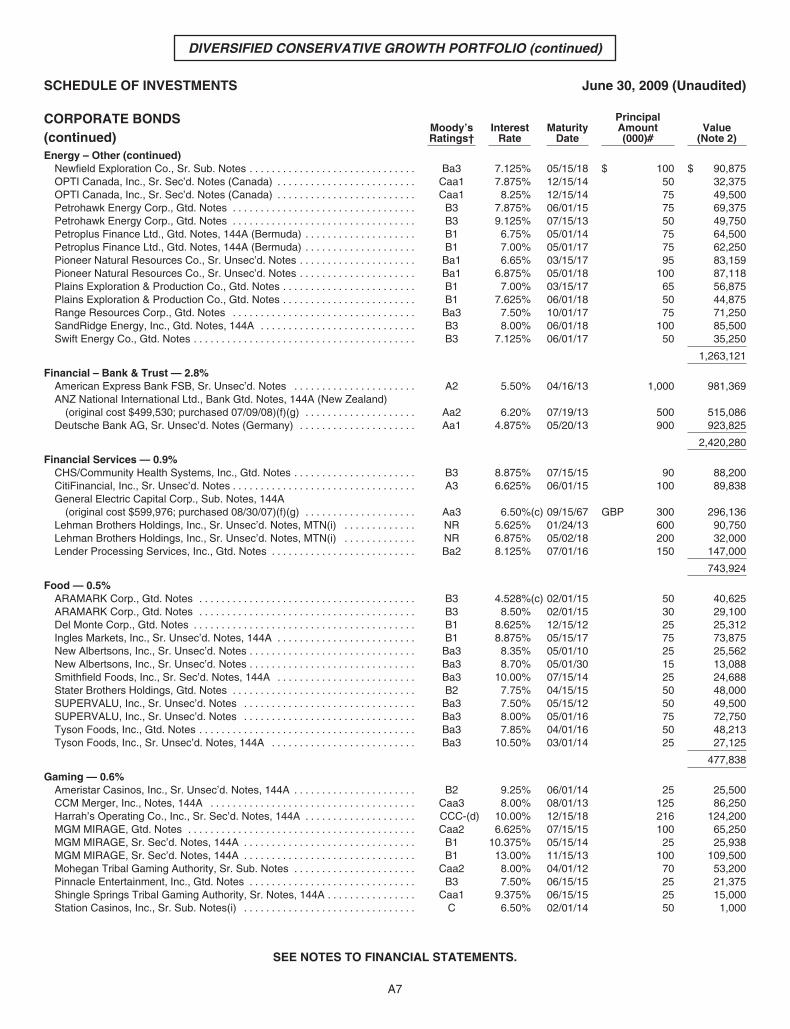
Energy – Other (continued)Newfield Exploration Co., Sr. Sub. Notes . . . . . . . . . . . . . . . . . . . . . . . . . . . . . . Ba3 7.125% 05/15/18 $ 100 $ 90,875OPTI Canada, Inc., Sr. Sec’d. Notes (Canada) . . . . . . . . . . . . . . . . . . . . . . . . . Caa1 7.875% 12/15/14 50 32,375OPTI Canada, Inc., Sr. Sec’d. Notes (Canada) . . . . . . . . . . . . . . . . . . . . . . . . . Caa1 8.25% 12/15/14 75 49,500Petrohawk Energy Corp., Gtd. Notes . . . . . . . . . . . . . . . . . . . . . . . . . . . . . . . . . B3 7.875% 06/01/15 75 69,375Petrohawk Energy Corp., Gtd. Notes . . . . . . . . . . . . . . . . . . . . . . . . . . . . . . . . . B3 9.125% 07/15/13 50 49,750Petroplus Finance Ltd., Gtd. Notes, 144A (Bermuda) . . . . . . . . . . . . . . . . . . . . B1 6.75% 05/01/14 75 64,500Petroplus Finance Ltd., Gtd. Notes, 144A (Bermuda) . . . . . . . . . . . . . . . . . . . . B1 7.00% 05/01/17 75 62,250Pioneer Natural Resources Co., Sr. Unsec’d. Notes . . . . . . . . . . . . . . . . . . . . . Ba1 6.65% 03/15/17 95 83,159Pioneer Natural Resources Co., Sr. Unsec’d. Notes . . . . . . . . . . . . . . . . . . . . . Ba1 6.875% 05/01/18 100 87,118Plains Exploration & Production Co., Gtd. Notes . . . . . . . . . . . . . . . . . . . . . . . . B1 7.00% 03/15/17 65 56,875Plains Exploration & Production Co., Gtd. Notes . . . . . . . . . . . . . . . . . . . . . . . . B1 7.625% 06/01/18 50 44,875Range Resources Corp., Gtd. Notes . . . . . . . . . . . . . . . . . . . . . . . . . . . . . . . . . Ba3 7.50% 10/01/17 75 71,250SandRidge Energy, Inc., Gtd. Notes, 144A . . . . . . . . . . . . . . . . . . . . . . . . . . . . B3 8.00% 06/01/18 100 85,500Swift Energy Co., Gtd. Notes . . . . . . . . . . . . . . . . . . . . . . . . . . . . . . . . . . . . . . . . B3 7.125% 06/01/17 50 35,250
1,263,121
Financial – Bank & Trust — 2.8%American Express Bank FSB, Sr. Unsec’d. Notes . . . . . . . . . . . . . . . . . . . . . . A2 5.50% 04/16/13 1,000 981,369ANZ National International Ltd., Bank Gtd. Notes, 144A (New Zealand)
(original cost $499,530; purchased 07/09/08)(f)(g) . . . . . . . . . . . . . . . . . . . . Aa2 6.20% 07/19/13 500 515,086Deutsche Bank AG, Sr. Unsec’d. Notes (Germany) . . . . . . . . . . . . . . . . . . . . . Aa1 4.875% 05/20/13 900 923,825
2,420,280
Financial Services — 0.9%CHS/Community Health Systems, Inc., Gtd. Notes . . . . . . . . . . . . . . . . . . . . . . B3 8.875% 07/15/15 90 88,200CitiFinancial, Inc., Sr. Unsec’d. Notes . . . . . . . . . . . . . . . . . . . . . . . . . . . . . . . . . A3 6.625% 06/01/15 100 89,838General Electric Capital Corp., Sub. Notes, 144A
(original cost $599,976; purchased 08/30/07)(f)(g) . . . . . . . . . . . . . . . . . . . . Aa3 6.50%(c) 09/15/67 GBP 300 296,136Lehman Brothers Holdings, Inc., Sr. Unsec’d. Notes, MTN(i) . . . . . . . . . . . . . NR 5.625% 01/24/13 600 90,750Lehman Brothers Holdings, Inc., Sr. Unsec’d. Notes, MTN(i) . . . . . . . . . . . . . NR 6.875% 05/02/18 200 32,000Lender Processing Services, Inc., Gtd. Notes . . . . . . . . . . . . . . . . . . . . . . . . . . Ba2 8.125% 07/01/16 150 147,000
743,924
Food — 0.5%ARAMARK Corp., Gtd. Notes . . . . . . . . . . . . . . . . . . . . . . . . . . . . . . . . . . . . . . . B3 4.528%(c) 02/01/15 50 40,625ARAMARK Corp., Gtd. Notes . . . . . . . . . . . . . . . . . . . . . . . . . . . . . . . . . . . . . . . B3 8.50% 02/01/15 30 29,100Del Monte Corp., Gtd. Notes . . . . . . . . . . . . . . . . . . . . . . . . . . . . . . . . . . . . . . . . B1 8.625% 12/15/12 25 25,312Ingles Markets, Inc., Sr. Unsec’d. Notes, 144A . . . . . . . . . . . . . . . . . . . . . . . . . B1 8.875% 05/15/17 75 73,875New Albertsons, Inc., Sr. Unsec’d. Notes . . . . . . . . . . . . . . . . . . . . . . . . . . . . . . Ba3 8.35% 05/01/10 25 25,562New Albertsons, Inc., Sr. Unsec’d. Notes . . . . . . . . . . . . . . . . . . . . . . . . . . . . . . Ba3 8.70% 05/01/30 15 13,088Smithfield Foods, Inc., Sr. Sec’d. Notes, 144A . . . . . . . . . . . . . . . . . . . . . . . . . Ba3 10.00% 07/15/14 25 24,688Stater Brothers Holdings, Gtd. Notes . . . . . . . . . . . . . . . . . . . . . . . . . . . . . . . . . B2 7.75% 04/15/15 50 48,000SUPERVALU, Inc., Sr. Unsec’d. Notes . . . . . . . . . . . . . . . . . . . . . . . . . . . . . . . Ba3 7.50% 05/15/12 50 49,500SUPERVALU, Inc., Sr. Unsec’d. Notes . . . . . . . . . . . . . . . . . . . . . . . . . . . . . . . Ba3 8.00% 05/01/16 75 72,750Tyson Foods, Inc., Gtd. Notes . . . . . . . . . . . . . . . . . . . . . . . . . . . . . . . . . . . . . . . Ba3 7.85% 04/01/16 50 48,213Tyson Foods, Inc., Sr. Unsec’d. Notes, 144A . . . . . . . . . . . . . . . . . . . . . . . . . . Ba3 10.50% 03/01/14 25 27,125
477,838
Gaming — 0.6%Ameristar Casinos, Inc., Sr. Unsec’d. Notes, 144A . . . . . . . . . . . . . . . . . . . . . . B2 9.25% 06/01/14 25 25,500CCM Merger, Inc., Notes, 144A . . . . . . . . . . . . . . . . . . . . . . . . . . . . . . . . . . . . . Caa3 8.00% 08/01/13 125 86,250Harrah’s Operating Co., Inc., Sr. Sec’d. Notes, 144A . . . . . . . . . . . . . . . . . . . . CCC-(d) 10.00% 12/15/18 216 124,200MGM MIRAGE, Gtd. Notes . . . . . . . . . . . . . . . . . . . . . . . . . . . . . . . . . . . . . . . . . Caa2 6.625% 07/15/15 100 65,250MGM MIRAGE, Sr. Sec’d. Notes, 144A . . . . . . . . . . . . . . . . . . . . . . . . . . . . . . . B1 10.375% 05/15/14 25 25,938MGM MIRAGE, Sr. Sec’d. Notes, 144A . . . . . . . . . . . . . . . . . . . . . . . . . . . . . . . B1 13.00% 11/15/13 100 109,500Mohegan Tribal Gaming Authority, Sr. Sub. Notes . . . . . . . . . . . . . . . . . . . . . . Caa2 8.00% 04/01/12 70 53,200Pinnacle Entertainment, Inc., Gtd. Notes . . . . . . . . . . . . . . . . . . . . . . . . . . . . . . B3 7.50% 06/15/15 25 21,375Shingle Springs Tribal Gaming Authority, Sr. Notes, 144A . . . . . . . . . . . . . . . . Caa1 9.375% 06/15/15 25 15,000Station Casinos, Inc., Sr. Sub. Notes(i) . . . . . . . . . . . . . . . . . . . . . . . . . . . . . . . C 6.50% 02/01/14 50 1,000
SEE NOTES TO FINANCIAL STATEMENTS.
A7
DIVERSIFIED CONSERVATIVE GROWTH PORTFOLIO (continued)
SCHEDULE OF INVESTMENTS June 30, 2009 (Unaudited)
CORPORATE BONDS(continued)
Moody’sRatings†
InterestRate
MaturityDate
PrincipalAmount(000)#
Value(Note 2)
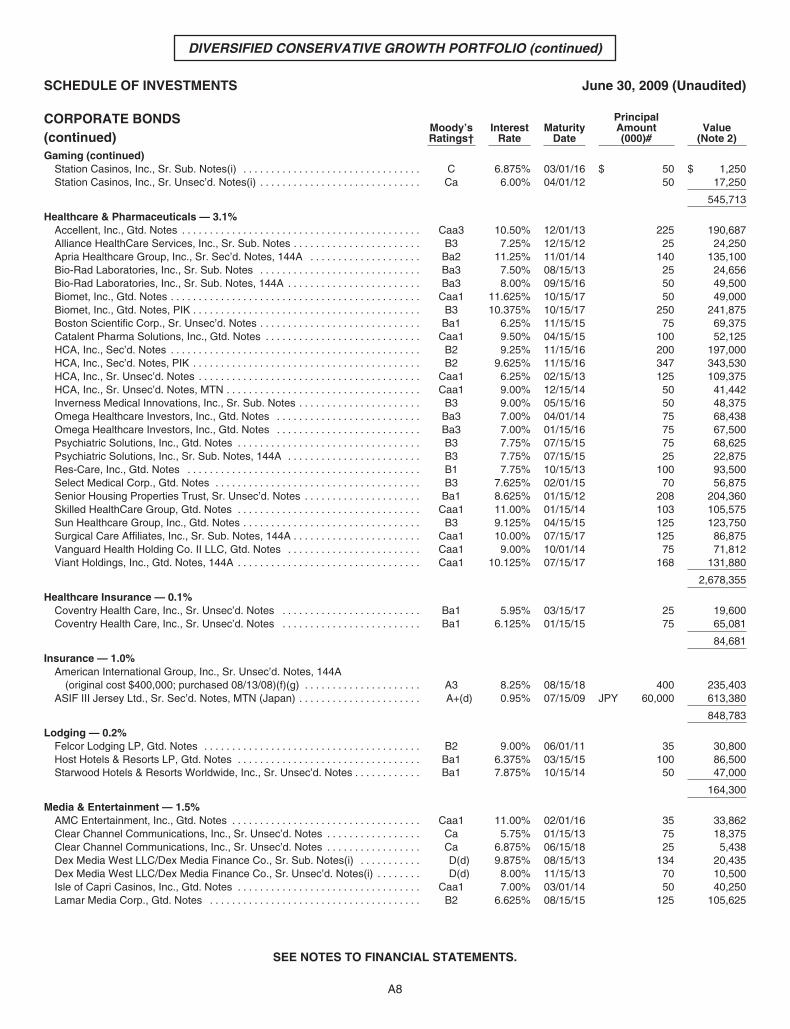
Gaming (continued)Station Casinos, Inc., Sr. Sub. Notes(i) . . . . . . . . . . . . . . . . . . . . . . . . . . . . . . . . C 6.875% 03/01/16 $ 50 $ 1,250Station Casinos, Inc., Sr. Unsec’d. Notes(i) . . . . . . . . . . . . . . . . . . . . . . . . . . . . . Ca 6.00% 04/01/12 50 17,250
545,713
Healthcare & Pharmaceuticals — 3.1%Accellent, Inc., Gtd. Notes . . . . . . . . . . . . . . . . . . . . . . . . . . . . . . . . . . . . . . . . . . . Caa3 10.50% 12/01/13 225 190,687Alliance HealthCare Services, Inc., Sr. Sub. Notes . . . . . . . . . . . . . . . . . . . . . . . B3 7.25% 12/15/12 25 24,250Apria Healthcare Group, Inc., Sr. Sec’d. Notes, 144A . . . . . . . . . . . . . . . . . . . . Ba2 11.25% 11/01/14 140 135,100Bio-Rad Laboratories, Inc., Sr. Sub. Notes . . . . . . . . . . . . . . . . . . . . . . . . . . . . . Ba3 7.50% 08/15/13 25 24,656Bio-Rad Laboratories, Inc., Sr. Sub. Notes, 144A . . . . . . . . . . . . . . . . . . . . . . . . Ba3 8.00% 09/15/16 50 49,500Biomet, Inc., Gtd. Notes . . . . . . . . . . . . . . . . . . . . . . . . . . . . . . . . . . . . . . . . . . . . . Caa1 11.625% 10/15/17 50 49,000Biomet, Inc., Gtd. Notes, PIK . . . . . . . . . . . . . . . . . . . . . . . . . . . . . . . . . . . . . . . . . B3 10.375% 10/15/17 250 241,875Boston Scientific Corp., Sr. Unsec’d. Notes . . . . . . . . . . . . . . . . . . . . . . . . . . . . . Ba1 6.25% 11/15/15 75 69,375Catalent Pharma Solutions, Inc., Gtd. Notes . . . . . . . . . . . . . . . . . . . . . . . . . . . . Caa1 9.50% 04/15/15 100 52,125HCA, Inc., Sec’d. Notes . . . . . . . . . . . . . . . . . . . . . . . . . . . . . . . . . . . . . . . . . . . . . B2 9.25% 11/15/16 200 197,000HCA, Inc., Sec’d. Notes, PIK . . . . . . . . . . . . . . . . . . . . . . . . . . . . . . . . . . . . . . . . . B2 9.625% 11/15/16 347 343,530HCA, Inc., Sr. Unsec’d. Notes . . . . . . . . . . . . . . . . . . . . . . . . . . . . . . . . . . . . . . . . Caa1 6.25% 02/15/13 125 109,375HCA, Inc., Sr. Unsec’d. Notes, MTN . . . . . . . . . . . . . . . . . . . . . . . . . . . . . . . . . . . Caa1 9.00% 12/15/14 50 41,442Inverness Medical Innovations, Inc., Sr. Sub. Notes . . . . . . . . . . . . . . . . . . . . . . B3 9.00% 05/15/16 50 48,375Omega Healthcare Investors, Inc., Gtd. Notes . . . . . . . . . . . . . . . . . . . . . . . . . . Ba3 7.00% 04/01/14 75 68,438Omega Healthcare Investors, Inc., Gtd. Notes . . . . . . . . . . . . . . . . . . . . . . . . . . Ba3 7.00% 01/15/16 75 67,500Psychiatric Solutions, Inc., Gtd. Notes . . . . . . . . . . . . . . . . . . . . . . . . . . . . . . . . . B3 7.75% 07/15/15 75 68,625Psychiatric Solutions, Inc., Sr. Sub. Notes, 144A . . . . . . . . . . . . . . . . . . . . . . . . B3 7.75% 07/15/15 25 22,875Res-Care, Inc., Gtd. Notes . . . . . . . . . . . . . . . . . . . . . . . . . . . . . . . . . . . . . . . . . . B1 7.75% 10/15/13 100 93,500Select Medical Corp., Gtd. Notes . . . . . . . . . . . . . . . . . . . . . . . . . . . . . . . . . . . . . B3 7.625% 02/01/15 70 56,875Senior Housing Properties Trust, Sr. Unsec’d. Notes . . . . . . . . . . . . . . . . . . . . . Ba1 8.625% 01/15/12 208 204,360Skilled HealthCare Group, Gtd. Notes . . . . . . . . . . . . . . . . . . . . . . . . . . . . . . . . . Caa1 11.00% 01/15/14 103 105,575Sun Healthcare Group, Inc., Gtd. Notes . . . . . . . . . . . . . . . . . . . . . . . . . . . . . . . . B3 9.125% 04/15/15 125 123,750Surgical Care Affiliates, Inc., Sr. Sub. Notes, 144A . . . . . . . . . . . . . . . . . . . . . . . Caa1 10.00% 07/15/17 125 86,875Vanguard Health Holding Co. II LLC, Gtd. Notes . . . . . . . . . . . . . . . . . . . . . . . . Caa1 9.00% 10/01/14 75 71,812Viant Holdings, Inc., Gtd. Notes, 144A . . . . . . . . . . . . . . . . . . . . . . . . . . . . . . . . . Caa1 10.125% 07/15/17 168 131,880
2,678,355
Healthcare Insurance — 0.1%Coventry Health Care, Inc., Sr. Unsec’d. Notes . . . . . . . . . . . . . . . . . . . . . . . . . Ba1 5.95% 03/15/17 25 19,600Coventry Health Care, Inc., Sr. Unsec’d. Notes . . . . . . . . . . . . . . . . . . . . . . . . . Ba1 6.125% 01/15/15 75 65,081
84,681
Insurance — 1.0%American International Group, Inc., Sr. Unsec’d. Notes, 144A
(original cost $400,000; purchased 08/13/08)(f)(g) . . . . . . . . . . . . . . . . . . . . . A3 8.25% 08/15/18 400 235,403ASIF III Jersey Ltd., Sr. Sec’d. Notes, MTN (Japan) . . . . . . . . . . . . . . . . . . . . . . A+(d) 0.95% 07/15/09 JPY 60,000 613,380
848,783
Lodging — 0.2%Felcor Lodging LP, Gtd. Notes . . . . . . . . . . . . . . . . . . . . . . . . . . . . . . . . . . . . . . . B2 9.00% 06/01/11 35 30,800Host Hotels & Resorts LP, Gtd. Notes . . . . . . . . . . . . . . . . . . . . . . . . . . . . . . . . . Ba1 6.375% 03/15/15 100 86,500Starwood Hotels & Resorts Worldwide, Inc., Sr. Unsec’d. Notes . . . . . . . . . . . . Ba1 7.875% 10/15/14 50 47,000
164,300
Media & Entertainment — 1.5%AMC Entertainment, Inc., Gtd. Notes . . . . . . . . . . . . . . . . . . . . . . . . . . . . . . . . . . Caa1 11.00% 02/01/16 35 33,862Clear Channel Communications, Inc., Sr. Unsec’d. Notes . . . . . . . . . . . . . . . . . Ca 5.75% 01/15/13 75 18,375Clear Channel Communications, Inc., Sr. Unsec’d. Notes . . . . . . . . . . . . . . . . . Ca 6.875% 06/15/18 25 5,438Dex Media West LLC/Dex Media Finance Co., Sr. Sub. Notes(i) . . . . . . . . . . . D(d) 9.875% 08/15/13 134 20,435Dex Media West LLC/Dex Media Finance Co., Sr. Unsec’d. Notes(i) . . . . . . . . D(d) 8.00% 11/15/13 70 10,500Isle of Capri Casinos, Inc., Gtd. Notes . . . . . . . . . . . . . . . . . . . . . . . . . . . . . . . . . Caa1 7.00% 03/01/14 50 40,250Lamar Media Corp., Gtd. Notes . . . . . . . . . . . . . . . . . . . . . . . . . . . . . . . . . . . . . . B2 6.625% 08/15/15 125 105,625
SEE NOTES TO FINANCIAL STATEMENTS.
A8
DIVERSIFIED CONSERVATIVE GROWTH PORTFOLIO (continued)
SCHEDULE OF INVESTMENTS June 30, 2009 (Unaudited)
CORPORATE BONDS(continued)
Moody’sRatings†
InterestRate
MaturityDate
PrincipalAmount(000)#
Value(Note 2)
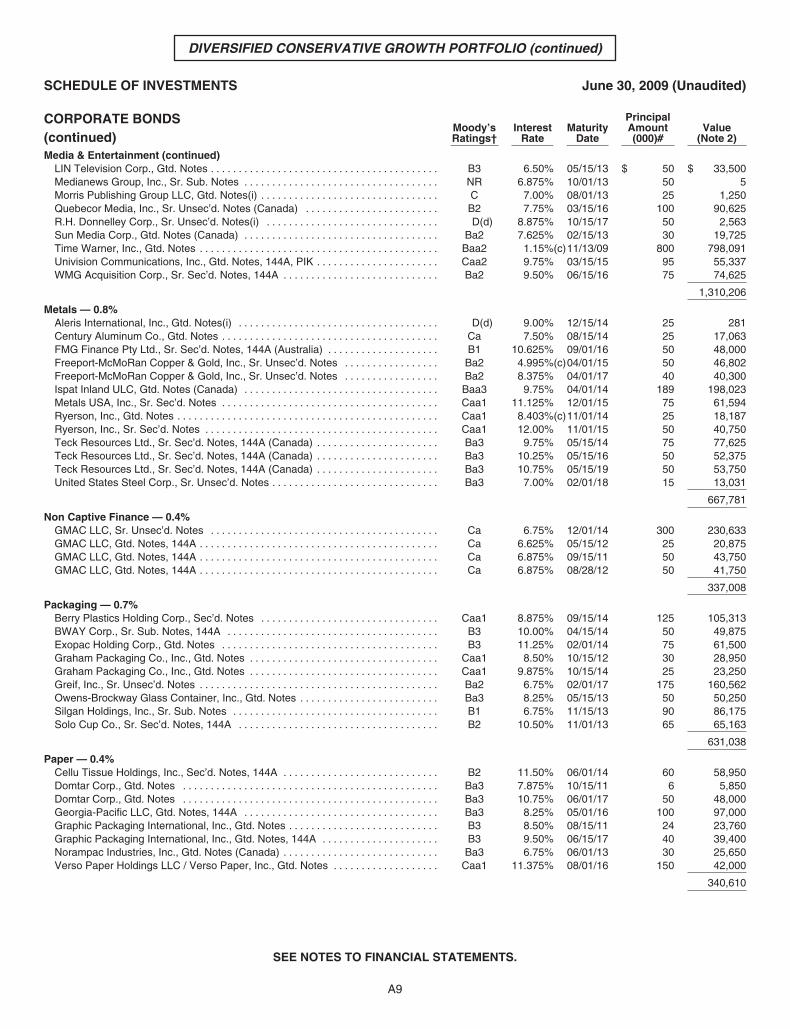
Media & Entertainment (continued)LIN Television Corp., Gtd. Notes . . . . . . . . . . . . . . . . . . . . . . . . . . . . . . . . . . . . . . . . . B3 6.50% 05/15/13 $ 50 $ 33,500Medianews Group, Inc., Sr. Sub. Notes . . . . . . . . . . . . . . . . . . . . . . . . . . . . . . . . . . . NR 6.875% 10/01/13 50 5Morris Publishing Group LLC, Gtd. Notes(i) . . . . . . . . . . . . . . . . . . . . . . . . . . . . . . . . C 7.00% 08/01/13 25 1,250Quebecor Media, Inc., Sr. Unsec’d. Notes (Canada) . . . . . . . . . . . . . . . . . . . . . . . . B2 7.75% 03/15/16 100 90,625R.H. Donnelley Corp., Sr. Unsec’d. Notes(i) . . . . . . . . . . . . . . . . . . . . . . . . . . . . . . . D(d) 8.875% 10/15/17 50 2,563Sun Media Corp., Gtd. Notes (Canada) . . . . . . . . . . . . . . . . . . . . . . . . . . . . . . . . . . . Ba2 7.625% 02/15/13 30 19,725Time Warner, Inc., Gtd. Notes . . . . . . . . . . . . . . . . . . . . . . . . . . . . . . . . . . . . . . . . . . . Baa2 1.15%(c)11/13/09 800 798,091Univision Communications, Inc., Gtd. Notes, 144A, PIK . . . . . . . . . . . . . . . . . . . . . . Caa2 9.75% 03/15/15 95 55,337WMG Acquisition Corp., Sr. Sec’d. Notes, 144A . . . . . . . . . . . . . . . . . . . . . . . . . . . . Ba2 9.50% 06/15/16 75 74,625
1,310,206
Metals — 0.8%Aleris International, Inc., Gtd. Notes(i) . . . . . . . . . . . . . . . . . . . . . . . . . . . . . . . . . . . . D(d) 9.00% 12/15/14 25 281Century Aluminum Co., Gtd. Notes . . . . . . . . . . . . . . . . . . . . . . . . . . . . . . . . . . . . . . . Ca 7.50% 08/15/14 25 17,063FMG Finance Pty Ltd., Sr. Sec’d. Notes, 144A (Australia) . . . . . . . . . . . . . . . . . . . . B1 10.625% 09/01/16 50 48,000Freeport-McMoRan Copper & Gold, Inc., Sr. Unsec’d. Notes . . . . . . . . . . . . . . . . . Ba2 4.995%(c)04/01/15 50 46,802Freeport-McMoRan Copper & Gold, Inc., Sr. Unsec’d. Notes . . . . . . . . . . . . . . . . . Ba2 8.375% 04/01/17 40 40,300Ispat Inland ULC, Gtd. Notes (Canada) . . . . . . . . . . . . . . . . . . . . . . . . . . . . . . . . . . . Baa3 9.75% 04/01/14 189 198,023Metals USA, Inc., Sr. Sec’d. Notes . . . . . . . . . . . . . . . . . . . . . . . . . . . . . . . . . . . . . . . Caa1 11.125% 12/01/15 75 61,594Ryerson, Inc., Gtd. Notes . . . . . . . . . . . . . . . . . . . . . . . . . . . . . . . . . . . . . . . . . . . . . . . Caa1 8.403%(c)11/01/14 25 18,187Ryerson, Inc., Sr. Sec’d. Notes . . . . . . . . . . . . . . . . . . . . . . . . . . . . . . . . . . . . . . . . . . Caa1 12.00% 11/01/15 50 40,750Teck Resources Ltd., Sr. Sec’d. Notes, 144A (Canada) . . . . . . . . . . . . . . . . . . . . . . Ba3 9.75% 05/15/14 75 77,625Teck Resources Ltd., Sr. Sec’d. Notes, 144A (Canada) . . . . . . . . . . . . . . . . . . . . . . Ba3 10.25% 05/15/16 50 52,375Teck Resources Ltd., Sr. Sec’d. Notes, 144A (Canada) . . . . . . . . . . . . . . . . . . . . . . Ba3 10.75% 05/15/19 50 53,750United States Steel Corp., Sr. Unsec’d. Notes . . . . . . . . . . . . . . . . . . . . . . . . . . . . . . Ba3 7.00% 02/01/18 15 13,031
667,781
Non Captive Finance — 0.4%GMAC LLC, Sr. Unsec’d. Notes . . . . . . . . . . . . . . . . . . . . . . . . . . . . . . . . . . . . . . . . . Ca 6.75% 12/01/14 300 230,633GMAC LLC, Gtd. Notes, 144A . . . . . . . . . . . . . . . . . . . . . . . . . . . . . . . . . . . . . . . . . . . Ca 6.625% 05/15/12 25 20,875GMAC LLC, Gtd. Notes, 144A . . . . . . . . . . . . . . . . . . . . . . . . . . . . . . . . . . . . . . . . . . . Ca 6.875% 09/15/11 50 43,750GMAC LLC, Gtd. Notes, 144A . . . . . . . . . . . . . . . . . . . . . . . . . . . . . . . . . . . . . . . . . . . Ca 6.875% 08/28/12 50 41,750
337,008
Packaging — 0.7%Berry Plastics Holding Corp., Sec’d. Notes . . . . . . . . . . . . . . . . . . . . . . . . . . . . . . . . Caa1 8.875% 09/15/14 125 105,313BWAY Corp., Sr. Sub. Notes, 144A . . . . . . . . . . . . . . . . . . . . . . . . . . . . . . . . . . . . . . B3 10.00% 04/15/14 50 49,875Exopac Holding Corp., Gtd. Notes . . . . . . . . . . . . . . . . . . . . . . . . . . . . . . . . . . . . . . . B3 11.25% 02/01/14 75 61,500Graham Packaging Co., Inc., Gtd. Notes . . . . . . . . . . . . . . . . . . . . . . . . . . . . . . . . . . Caa1 8.50% 10/15/12 30 28,950Graham Packaging Co., Inc., Gtd. Notes . . . . . . . . . . . . . . . . . . . . . . . . . . . . . . . . . . Caa1 9.875% 10/15/14 25 23,250Greif, Inc., Sr. Unsec’d. Notes . . . . . . . . . . . . . . . . . . . . . . . . . . . . . . . . . . . . . . . . . . . Ba2 6.75% 02/01/17 175 160,562Owens-Brockway Glass Container, Inc., Gtd. Notes . . . . . . . . . . . . . . . . . . . . . . . . . Ba3 8.25% 05/15/13 50 50,250Silgan Holdings, Inc., Sr. Sub. Notes . . . . . . . . . . . . . . . . . . . . . . . . . . . . . . . . . . . . . B1 6.75% 11/15/13 90 86,175Solo Cup Co., Sr. Sec’d. Notes, 144A . . . . . . . . . . . . . . . . . . . . . . . . . . . . . . . . . . . . B2 10.50% 11/01/13 65 65,163
631,038
Paper — 0.4%Cellu Tissue Holdings, Inc., Sec’d. Notes, 144A . . . . . . . . . . . . . . . . . . . . . . . . . . . . B2 11.50% 06/01/14 60 58,950Domtar Corp., Gtd. Notes . . . . . . . . . . . . . . . . . . . . . . . . . . . . . . . . . . . . . . . . . . . . . . Ba3 7.875% 10/15/11 6 5,850Domtar Corp., Gtd. Notes . . . . . . . . . . . . . . . . . . . . . . . . . . . . . . . . . . . . . . . . . . . . . . Ba3 10.75% 06/01/17 50 48,000Georgia-Pacific LLC, Gtd. Notes, 144A . . . . . . . . . . . . . . . . . . . . . . . . . . . . . . . . . . . Ba3 8.25% 05/01/16 100 97,000Graphic Packaging International, Inc., Gtd. Notes . . . . . . . . . . . . . . . . . . . . . . . . . . . B3 8.50% 08/15/11 24 23,760Graphic Packaging International, Inc., Gtd. Notes, 144A . . . . . . . . . . . . . . . . . . . . . B3 9.50% 06/15/17 40 39,400Norampac Industries, Inc., Gtd. Notes (Canada) . . . . . . . . . . . . . . . . . . . . . . . . . . . . Ba3 6.75% 06/01/13 30 25,650Verso Paper Holdings LLC / Verso Paper, Inc., Gtd. Notes . . . . . . . . . . . . . . . . . . . Caa1 11.375% 08/01/16 150 42,000
340,610
SEE NOTES TO FINANCIAL STATEMENTS.
A9
DIVERSIFIED CONSERVATIVE GROWTH PORTFOLIO (continued)
SCHEDULE OF INVESTMENTS June 30, 2009 (Unaudited)
CORPORATE BONDS(continued)
Moody’sRatings†
InterestRate
MaturityDate
PrincipalAmount(000)#
Value(Note 2)
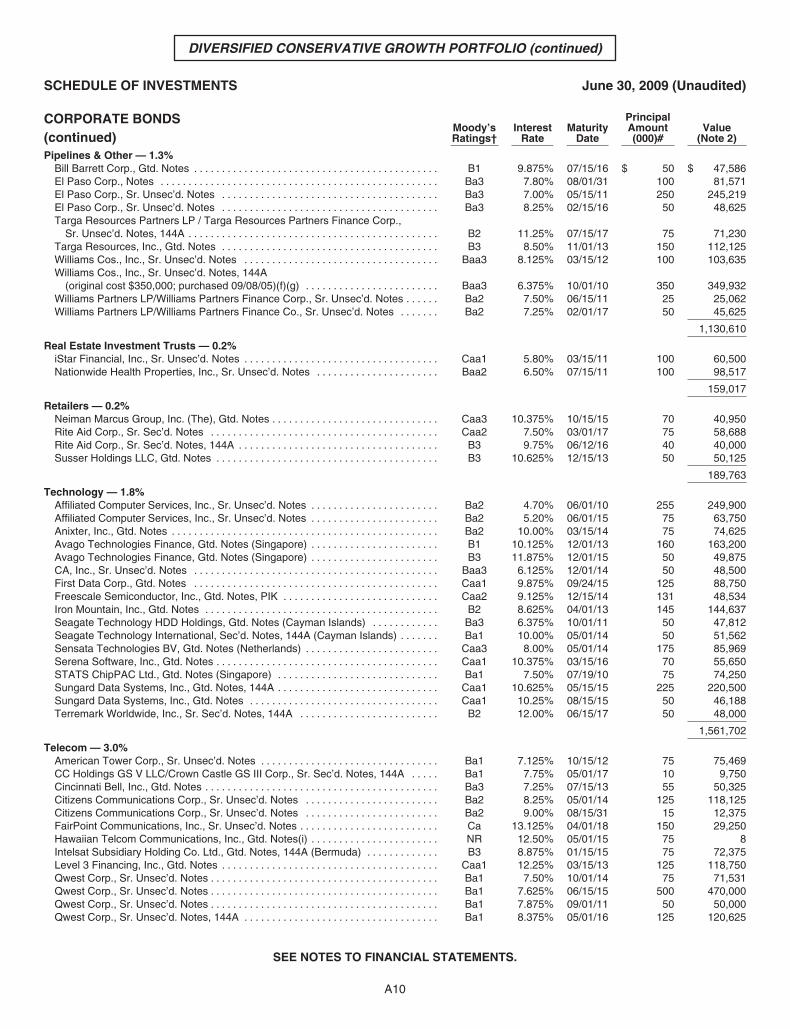
Pipelines & Other — 1.3%Bill Barrett Corp., Gtd. Notes . . . . . . . . . . . . . . . . . . . . . . . . . . . . . . . . . . . . . . . . . . . . B1 9.875% 07/15/16 $ 50 $ 47,586El Paso Corp., Notes . . . . . . . . . . . . . . . . . . . . . . . . . . . . . . . . . . . . . . . . . . . . . . . . . . Ba3 7.80% 08/01/31 100 81,571El Paso Corp., Sr. Unsec’d. Notes . . . . . . . . . . . . . . . . . . . . . . . . . . . . . . . . . . . . . . . Ba3 7.00% 05/15/11 250 245,219El Paso Corp., Sr. Unsec’d. Notes . . . . . . . . . . . . . . . . . . . . . . . . . . . . . . . . . . . . . . . Ba3 8.25% 02/15/16 50 48,625Targa Resources Partners LP / Targa Resources Partners Finance Corp.,
Sr. Unsec’d. Notes, 144A . . . . . . . . . . . . . . . . . . . . . . . . . . . . . . . . . . . . . . . . . . . . . B2 11.25% 07/15/17 75 71,230Targa Resources, Inc., Gtd. Notes . . . . . . . . . . . . . . . . . . . . . . . . . . . . . . . . . . . . . . . B3 8.50% 11/01/13 150 112,125Williams Cos., Inc., Sr. Unsec’d. Notes . . . . . . . . . . . . . . . . . . . . . . . . . . . . . . . . . . . Baa3 8.125% 03/15/12 100 103,635Williams Cos., Inc., Sr. Unsec’d. Notes, 144A
(original cost $350,000; purchased 09/08/05)(f)(g) . . . . . . . . . . . . . . . . . . . . . . . . Baa3 6.375% 10/01/10 350 349,932Williams Partners LP/Williams Partners Finance Corp., Sr. Unsec’d. Notes . . . . . . Ba2 7.50% 06/15/11 25 25,062Williams Partners LP/Williams Partners Finance Co., Sr. Unsec’d. Notes . . . . . . . Ba2 7.25% 02/01/17 50 45,625
1,130,610
Real Estate Investment Trusts — 0.2%iStar Financial, Inc., Sr. Unsec’d. Notes . . . . . . . . . . . . . . . . . . . . . . . . . . . . . . . . . . . Caa1 5.80% 03/15/11 100 60,500Nationwide Health Properties, Inc., Sr. Unsec’d. Notes . . . . . . . . . . . . . . . . . . . . . . Baa2 6.50% 07/15/11 100 98,517
159,017
Retailers — 0.2%Neiman Marcus Group, Inc. (The), Gtd. Notes . . . . . . . . . . . . . . . . . . . . . . . . . . . . . . Caa3 10.375% 10/15/15 70 40,950Rite Aid Corp., Sr. Sec’d. Notes . . . . . . . . . . . . . . . . . . . . . . . . . . . . . . . . . . . . . . . . . Caa2 7.50% 03/01/17 75 58,688Rite Aid Corp., Sr. Sec’d. Notes, 144A . . . . . . . . . . . . . . . . . . . . . . . . . . . . . . . . . . . . B3 9.75% 06/12/16 40 40,000Susser Holdings LLC, Gtd. Notes . . . . . . . . . . . . . . . . . . . . . . . . . . . . . . . . . . . . . . . . B3 10.625% 12/15/13 50 50,125
189,763
Technology — 1.8%Affiliated Computer Services, Inc., Sr. Unsec’d. Notes . . . . . . . . . . . . . . . . . . . . . . . Ba2 4.70% 06/01/10 255 249,900Affiliated Computer Services, Inc., Sr. Unsec’d. Notes . . . . . . . . . . . . . . . . . . . . . . . Ba2 5.20% 06/01/15 75 63,750Anixter, Inc., Gtd. Notes . . . . . . . . . . . . . . . . . . . . . . . . . . . . . . . . . . . . . . . . . . . . . . . . Ba2 10.00% 03/15/14 75 74,625Avago Technologies Finance, Gtd. Notes (Singapore) . . . . . . . . . . . . . . . . . . . . . . . B1 10.125% 12/01/13 160 163,200Avago Technologies Finance, Gtd. Notes (Singapore) . . . . . . . . . . . . . . . . . . . . . . . B3 11.875% 12/01/15 50 49,875CA, Inc., Sr. Unsec’d. Notes . . . . . . . . . . . . . . . . . . . . . . . . . . . . . . . . . . . . . . . . . . . . Baa3 6.125% 12/01/14 50 48,500First Data Corp., Gtd. Notes . . . . . . . . . . . . . . . . . . . . . . . . . . . . . . . . . . . . . . . . . . . . Caa1 9.875% 09/24/15 125 88,750Freescale Semiconductor, Inc., Gtd. Notes, PIK . . . . . . . . . . . . . . . . . . . . . . . . . . . . Caa2 9.125% 12/15/14 131 48,534Iron Mountain, Inc., Gtd. Notes . . . . . . . . . . . . . . . . . . . . . . . . . . . . . . . . . . . . . . . . . . B2 8.625% 04/01/13 145 144,637Seagate Technology HDD Holdings, Gtd. Notes (Cayman Islands) . . . . . . . . . . . . Ba3 6.375% 10/01/11 50 47,812Seagate Technology International, Sec’d. Notes, 144A (Cayman Islands) . . . . . . . Ba1 10.00% 05/01/14 50 51,562Sensata Technologies BV, Gtd. Notes (Netherlands) . . . . . . . . . . . . . . . . . . . . . . . . Caa3 8.00% 05/01/14 175 85,969Serena Software, Inc., Gtd. Notes . . . . . . . . . . . . . . . . . . . . . . . . . . . . . . . . . . . . . . . . Caa1 10.375% 03/15/16 70 55,650STATS ChipPAC Ltd., Gtd. Notes (Singapore) . . . . . . . . . . . . . . . . . . . . . . . . . . . . . Ba1 7.50% 07/19/10 75 74,250Sungard Data Systems, Inc., Gtd. Notes, 144A . . . . . . . . . . . . . . . . . . . . . . . . . . . . . Caa1 10.625% 05/15/15 225 220,500Sungard Data Systems, Inc., Gtd. Notes . . . . . . . . . . . . . . . . . . . . . . . . . . . . . . . . . . Caa1 10.25% 08/15/15 50 46,188Terremark Worldwide, Inc., Sr. Sec’d. Notes, 144A . . . . . . . . . . . . . . . . . . . . . . . . . B2 12.00% 06/15/17 50 48,000
1,561,702
Telecom — 3.0%American Tower Corp., Sr. Unsec’d. Notes . . . . . . . . . . . . . . . . . . . . . . . . . . . . . . . . Ba1 7.125% 10/15/12 75 75,469CC Holdings GS V LLC/Crown Castle GS III Corp., Sr. Sec’d. Notes, 144A . . . . . Ba1 7.75% 05/01/17 10 9,750Cincinnati Bell, Inc., Gtd. Notes . . . . . . . . . . . . . . . . . . . . . . . . . . . . . . . . . . . . . . . . . . Ba3 7.25% 07/15/13 55 50,325Citizens Communications Corp., Sr. Unsec’d. Notes . . . . . . . . . . . . . . . . . . . . . . . . Ba2 8.25% 05/01/14 125 118,125Citizens Communications Corp., Sr. Unsec’d. Notes . . . . . . . . . . . . . . . . . . . . . . . . Ba2 9.00% 08/15/31 15 12,375FairPoint Communications, Inc., Sr. Unsec’d. Notes . . . . . . . . . . . . . . . . . . . . . . . . . Ca 13.125% 04/01/18 150 29,250Hawaiian Telcom Communications, Inc., Gtd. Notes(i) . . . . . . . . . . . . . . . . . . . . . . . NR 12.50% 05/01/15 75 8Intelsat Subsidiary Holding Co. Ltd., Gtd. Notes, 144A (Bermuda) . . . . . . . . . . . . . B3 8.875% 01/15/15 75 72,375Level 3 Financing, Inc., Gtd. Notes . . . . . . . . . . . . . . . . . . . . . . . . . . . . . . . . . . . . . . . Caa1 12.25% 03/15/13 125 118,750Qwest Corp., Sr. Unsec’d. Notes . . . . . . . . . . . . . . . . . . . . . . . . . . . . . . . . . . . . . . . . . Ba1 7.50% 10/01/14 75 71,531Qwest Corp., Sr. Unsec’d. Notes . . . . . . . . . . . . . . . . . . . . . . . . . . . . . . . . . . . . . . . . . Ba1 7.625% 06/15/15 500 470,000Qwest Corp., Sr. Unsec’d. Notes . . . . . . . . . . . . . . . . . . . . . . . . . . . . . . . . . . . . . . . . . Ba1 7.875% 09/01/11 50 50,000Qwest Corp., Sr. Unsec’d. Notes, 144A . . . . . . . . . . . . . . . . . . . . . . . . . . . . . . . . . . . Ba1 8.375% 05/01/16 125 120,625
SEE NOTES TO FINANCIAL STATEMENTS.
A10
DIVERSIFIED CONSERVATIVE GROWTH PORTFOLIO (continued)
SCHEDULE OF INVESTMENTS June 30, 2009 (Unaudited)
CORPORATE BONDS(continued)
Moody’sRatings†
InterestRate
MaturityDate
PrincipalAmount(000)#
Value(Note 2)
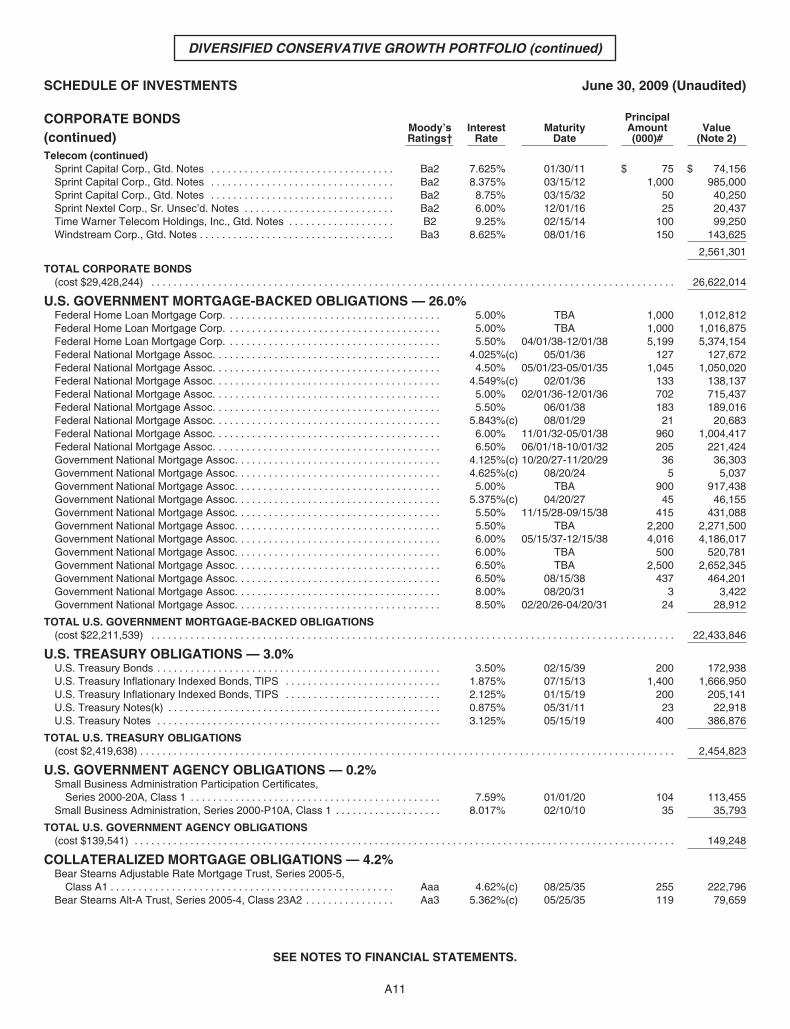
Telecom (continued)Sprint Capital Corp., Gtd. Notes . . . . . . . . . . . . . . . . . . . . . . . . . . . . . . . . . Ba2 7.625% 01/30/11 $ 75 $ 74,156Sprint Capital Corp., Gtd. Notes . . . . . . . . . . . . . . . . . . . . . . . . . . . . . . . . . Ba2 8.375% 03/15/12 1,000 985,000Sprint Capital Corp., Gtd. Notes . . . . . . . . . . . . . . . . . . . . . . . . . . . . . . . . . Ba2 8.75% 03/15/32 50 40,250Sprint Nextel Corp., Sr. Unsec’d. Notes . . . . . . . . . . . . . . . . . . . . . . . . . . . Ba2 6.00% 12/01/16 25 20,437Time Warner Telecom Holdings, Inc., Gtd. Notes . . . . . . . . . . . . . . . . . . . B2 9.25% 02/15/14 100 99,250Windstream Corp., Gtd. Notes . . . . . . . . . . . . . . . . . . . . . . . . . . . . . . . . . . . Ba3 8.625% 08/01/16 150 143,625
2,561,301
TOTAL CORPORATE BONDS(cost $29,428,244) . . . . . . . . . . . . . . . . . . . . . . . . . . . . . . . . . . . . . . . . . . . . . . . . . . . . . . . . . . . . . . . . . . . . . . . . . . . . . . . . . . . . . . . . . . . . . . 26,622,014
U.S. GOVERNMENT MORTGAGE-BACKED OBLIGATIONS — 26.0%Federal Home Loan Mortgage Corp. . . . . . . . . . . . . . . . . . . . . . . . . . . . . . . . . . . . . . . 5.00% TBA 1,000 1,012,812Federal Home Loan Mortgage Corp. . . . . . . . . . . . . . . . . . . . . . . . . . . . . . . . . . . . . . . 5.00% TBA 1,000 1,016,875Federal Home Loan Mortgage Corp. . . . . . . . . . . . . . . . . . . . . . . . . . . . . . . . . . . . . . . 5.50% 04/01/38-12/01/38 5,199 5,374,154Federal National Mortgage Assoc. . . . . . . . . . . . . . . . . . . . . . . . . . . . . . . . . . . . . . . . . 4.025%(c) 05/01/36 127 127,672Federal National Mortgage Assoc. . . . . . . . . . . . . . . . . . . . . . . . . . . . . . . . . . . . . . . . . 4.50% 05/01/23-05/01/35 1,045 1,050,020Federal National Mortgage Assoc. . . . . . . . . . . . . . . . . . . . . . . . . . . . . . . . . . . . . . . . . 4.549%(c) 02/01/36 133 138,137Federal National Mortgage Assoc. . . . . . . . . . . . . . . . . . . . . . . . . . . . . . . . . . . . . . . . . 5.00% 02/01/36-12/01/36 702 715,437Federal National Mortgage Assoc. . . . . . . . . . . . . . . . . . . . . . . . . . . . . . . . . . . . . . . . . 5.50% 06/01/38 183 189,016Federal National Mortgage Assoc. . . . . . . . . . . . . . . . . . . . . . . . . . . . . . . . . . . . . . . . . 5.843%(c) 08/01/29 21 20,683Federal National Mortgage Assoc. . . . . . . . . . . . . . . . . . . . . . . . . . . . . . . . . . . . . . . . . 6.00% 11/01/32-05/01/38 960 1,004,417Federal National Mortgage Assoc. . . . . . . . . . . . . . . . . . . . . . . . . . . . . . . . . . . . . . . . . 6.50% 06/01/18-10/01/32 205 221,424Government National Mortgage Assoc. . . . . . . . . . . . . . . . . . . . . . . . . . . . . . . . . . . . . 4.125%(c) 10/20/27-11/20/29 36 36,303Government National Mortgage Assoc. . . . . . . . . . . . . . . . . . . . . . . . . . . . . . . . . . . . . 4.625%(c) 08/20/24 5 5,037Government National Mortgage Assoc. . . . . . . . . . . . . . . . . . . . . . . . . . . . . . . . . . . . . 5.00% TBA 900 917,438Government National Mortgage Assoc. . . . . . . . . . . . . . . . . . . . . . . . . . . . . . . . . . . . . 5.375%(c) 04/20/27 45 46,155Government National Mortgage Assoc. . . . . . . . . . . . . . . . . . . . . . . . . . . . . . . . . . . . . 5.50% 11/15/28-09/15/38 415 431,088Government National Mortgage Assoc. . . . . . . . . . . . . . . . . . . . . . . . . . . . . . . . . . . . . 5.50% TBA 2,200 2,271,500Government National Mortgage Assoc. . . . . . . . . . . . . . . . . . . . . . . . . . . . . . . . . . . . . 6.00% 05/15/37-12/15/38 4,016 4,186,017Government National Mortgage Assoc. . . . . . . . . . . . . . . . . . . . . . . . . . . . . . . . . . . . . 6.00% TBA 500 520,781Government National Mortgage Assoc. . . . . . . . . . . . . . . . . . . . . . . . . . . . . . . . . . . . . 6.50% TBA 2,500 2,652,345Government National Mortgage Assoc. . . . . . . . . . . . . . . . . . . . . . . . . . . . . . . . . . . . . 6.50% 08/15/38 437 464,201Government National Mortgage Assoc. . . . . . . . . . . . . . . . . . . . . . . . . . . . . . . . . . . . . 8.00% 08/20/31 3 3,422Government National Mortgage Assoc. . . . . . . . . . . . . . . . . . . . . . . . . . . . . . . . . . . . . 8.50% 02/20/26-04/20/31 24 28,912
TOTAL U.S. GOVERNMENT MORTGAGE-BACKED OBLIGATIONS(cost $22,211,539) . . . . . . . . . . . . . . . . . . . . . . . . . . . . . . . . . . . . . . . . . . . . . . . . . . . . . . . . . . . . . . . . . . . . . . . . . . . . . . . . . . . . . . . . . . . . . . 22,433,846
U.S. TREASURY OBLIGATIONS — 3.0%U.S. Treasury Bonds . . . . . . . . . . . . . . . . . . . . . . . . . . . . . . . . . . . . . . . . . . . . . . . . . . . 3.50% 02/15/39 200 172,938U.S. Treasury Inflationary Indexed Bonds, TIPS . . . . . . . . . . . . . . . . . . . . . . . . . . . . 1.875% 07/15/13 1,400 1,666,950U.S. Treasury Inflationary Indexed Bonds, TIPS . . . . . . . . . . . . . . . . . . . . . . . . . . . . 2.125% 01/15/19 200 205,141U.S. Treasury Notes(k) . . . . . . . . . . . . . . . . . . . . . . . . . . . . . . . . . . . . . . . . . . . . . . . . . 0.875% 05/31/11 23 22,918U.S. Treasury Notes . . . . . . . . . . . . . . . . . . . . . . . . . . . . . . . . . . . . . . . . . . . . . . . . . . . 3.125% 05/15/19 400 386,876
TOTAL U.S. TREASURY OBLIGATIONS(cost $2,419,638) . . . . . . . . . . . . . . . . . . . . . . . . . . . . . . . . . . . . . . . . . . . . . . . . . . . . . . . . . . . . . . . . . . . . . . . . . . . . . . . . . . . . . . . . . . . . . . . . 2,454,823
U.S. GOVERNMENT AGENCY OBLIGATIONS — 0.2%Small Business Administration Participation Certificates,
Series 2000-20A, Class 1 . . . . . . . . . . . . . . . . . . . . . . . . . . . . . . . . . . . . . . . . . . . . . 7.59% 01/01/20 104 113,455Small Business Administration, Series 2000-P10A, Class 1 . . . . . . . . . . . . . . . . . . . 8.017% 02/10/10 35 35,793
TOTAL U.S. GOVERNMENT AGENCY OBLIGATIONS(cost $139,541) . . . . . . . . . . . . . . . . . . . . . . . . . . . . . . . . . . . . . . . . . . . . . . . . . . . . . . . . . . . . . . . . . . . . . . . . . . . . . . . . . . . . . . . . . . . . . . . . . 149,248
COLLATERALIZED MORTGAGE OBLIGATIONS — 4.2%Bear Stearns Adjustable Rate Mortgage Trust, Series 2005-5,
Class A1 . . . . . . . . . . . . . . . . . . . . . . . . . . . . . . . . . . . . . . . . . . . . . . . . . . . Aaa 4.62%(c) 08/25/35 255 222,796Bear Stearns Alt-A Trust, Series 2005-4, Class 23A2 . . . . . . . . . . . . . . . . Aa3 5.362%(c) 05/25/35 119 79,659
SEE NOTES TO FINANCIAL STATEMENTS.
A11
DIVERSIFIED CONSERVATIVE GROWTH PORTFOLIO (continued)
SCHEDULE OF INVESTMENTS June 30, 2009 (Unaudited)
COLLATERALIZED MORTGAGE OBLIGATIONS(continued)
Moody’sRatings†
InterestRate
MaturityDate
PrincipalAmount(000)#
Value(Note 2)
Countrywide Alternative Loan Trust, Series 2006-HY13, Class 4A1 . . . . . . . . . . AAA(d) 5.886%(c) 02/25/37 $ 189 $ 111,046Countrywide Alternative Loan Trust, Series 2006-OA11, Class A1B . . . . . . . . . Caa2 0.504%(c) 09/25/46 185 70,482Countrywide Alternative Loan Trust, Series 2007-OA7, Class A1A . . . . . . . . . . B2 0.494%(c) 05/25/47 154 57,643FHLMC Structured Pass-Through Securities, Series T-61, Class 1A1 . . . . . . . . Aaa 2.838%(c) 07/25/44 351 347,670Freddie Mac, Series 2266, Class F . . . . . . . . . . . . . . . . . . . . . . . . . . . . . . . . . . . . Aaa 0.738%(c) 11/15/30 10 9,900Freddie Mac, Series 2888, Class ZG . . . . . . . . . . . . . . . . . . . . . . . . . . . . . . . . . . . Aaa 4.50% 11/15/19 123 119,151Freddie Mac, Series 3010, Class WB . . . . . . . . . . . . . . . . . . . . . . . . . . . . . . . . . . . Aaa 4.50% 07/15/20 1,000 1,022,085Government National Mortgage Assoc., Series 2000-15, Class Z . . . . . . . . . . . Aaa 7.50% 02/20/30 179 196,975Greenpoint Mortgage Funding Trust, Series 2006-AR6, Class A1A . . . . . . . . . . B2 0.394%(c) 10/25/46 93 76,667Harborview Mortgage Loan Trust, Series 2006-5, Class 2A1A . . . . . . . . . . . . . . Caa1 0.493%(c) 07/19/46 192 79,511Impac Secured Assets CMN Owner Trust, Series 2006-4, Class A2A . . . . . . . . B3 0.394%(c) 01/25/37 42 39,117Merrill Lynch Floating Trust, Series 2006-1, Class A1, 144A
(original cost $110,880; purchased 10/31/06)(f)(g) . . . . . . . . . . . . . . . . . . . . . . Aaa 0.358%(c) 06/15/22 111 77,616Merrill Lynch Mortgage Investors, Inc., Series 2005-A10, Class A . . . . . . . . . . . A3 0.524%(c) 02/25/36 88 47,655Structured Asset Mortgage Investments, Inc., Series 2005-AR8, Class A1A . . . Ba3 0.594%(c) 02/25/36 374 171,514WaMu Mortgage Pass-Through Certificates, Series 2002-AR17, Class 1A . . . . Aaa 2.54%(c) 11/25/42 53 30,538WaMu Mortgage Pass-Through Certificates, Series 2003-R1, Class A1 . . . . . . Aaa 0.854%(c) 12/25/27 455 339,917WaMu Mortgage Pass-Through Certificates, Series 2005-AR13,
Class A1A1 . . . . . . . . . . . . . . . . . . . . . . . . . . . . . . . . . . . . . . . . . . . . . . . . . . . . . . Aa2 0.604%(c) 10/25/45 98 51,093WaMu Mortgage Pass-Through Certificates, Series 2006-AR17,
Class 1A1A . . . . . . . . . . . . . . . . . . . . . . . . . . . . . . . . . . . . . . . . . . . . . . . . . . . . . . Caa1 2.15%(c) 12/25/46 137 53,395WaMu Mortgage Pass-Through Certificates, Series 2006-AR17, Class 2A . . . . Ba3 2.88%(c) 12/25/46 156 66,478WaMu Mortgage Pass-Through Certificates, Series 2007-HY1, Class 2A3 . . . . CCC(d) 5.833%(c) 02/25/37 187 116,992WaMu Mortgage Pass-Through Certificates, Series 2007-HY2, Class 1A1 . . . . CCC(d) 5.581%(c) 12/25/36 191 117,647WaMu Mortgage Pass-Through Certificates, Series 2007-OA3, Class 2A1A . . B3 2.10%(c) 04/25/47 190 77,766
TOTAL COLLATERALIZED MORTGAGE OBLIGATIONS(cost $4,502,429) . . . . . . . . . . . . . . . . . . . . . . . . . . . . . . . . . . . . . . . . . . . . . . . . . . . . . . . . . . . . . . . . . . . . . . . . . . . . . . . . . . . . . . . . . . . . . . . . 3,583,313
FOREIGN GOVERNMENT BOND — 0.1%Development Bank of Japan, Foreign Gov’t. Gtd. Bonds (Japan)
(cost $84,902) . . . . . . . . . . . . . . . . . . . . . . . . . . . . . . . . . . . . . . . . . . . . . . . . . . . . Aaa 1.75% 06/21/10 JPY 10,000 104,906
ASSET-BACKED SECURITIESAsset Backed Securities Corp. Home Equity, Series 2004-HE6, Class A1
(cost $21,276) . . . . . . . . . . . . . . . . . . . . . . . . . . . . . . . . . . . . . . . . . . . . . . . . . . . . Aaa 0.589%(c) 09/25/34 21 13,514
MUNICIPAL BONDS — 1.2%California — 0.3%
California Educational Facilities Authority, General Obligation Bonds . . . . . . . . Aa1 5.00% 10/01/39 200 197,830State of California, General Obligation Bonds . . . . . . . . . . . . . . . . . . . . . . . . . . . . Baa1 4.50% 08/01/28 100 79,415
277,245
Louisiana — 0.3%Tobacco Settlement Financing Corp., Revenue Bonds, Series 2001B . . . . . . . . Baa3 5.875% 05/15/39 290 227,322
Massachusetts — 0.3%Massachusetts Water Resources Authority, Revenue Bonds, Series J(e)(l) . . . Aa2 5.00%(c) 08/01/32 250 251,548
Ohio — 0.3%Buckeye Tobacco Settlement Financing Authority, Revenue Bonds,
Series A-2 . . . . . . . . . . . . . . . . . . . . . . . . . . . . . . . . . . . . . . . . . . . . . . . . . . . . . . . Baa3 5.875% 06/01/47 500 281,510
TOTAL MUNICIPAL BONDS(cost $1,240,599) . . . . . . . . . . . . . . . . . . . . . . . . . . . . . . . . . . . . . . . . . . . . . . . . . . . . . . . . . . . . . . . . . . . . . . . . . . . . . . . . . . . . . . . . . . . . . . . . 1,037,625
CONVERTIBLE BOND — 0.9%Healthcare & Pharmaceuticals
LifePoint Hospitals, Inc., Sr. Sub. Notes(cost $1,000,000) . . . . . . . . . . . . . . . . . . . . . . . . . . . . . . . . . . . . . . . . . . . . . . . . . B(d) 3.50% 05/15/14 1,000 802,500
SEE NOTES TO FINANCIAL STATEMENTS.
A12
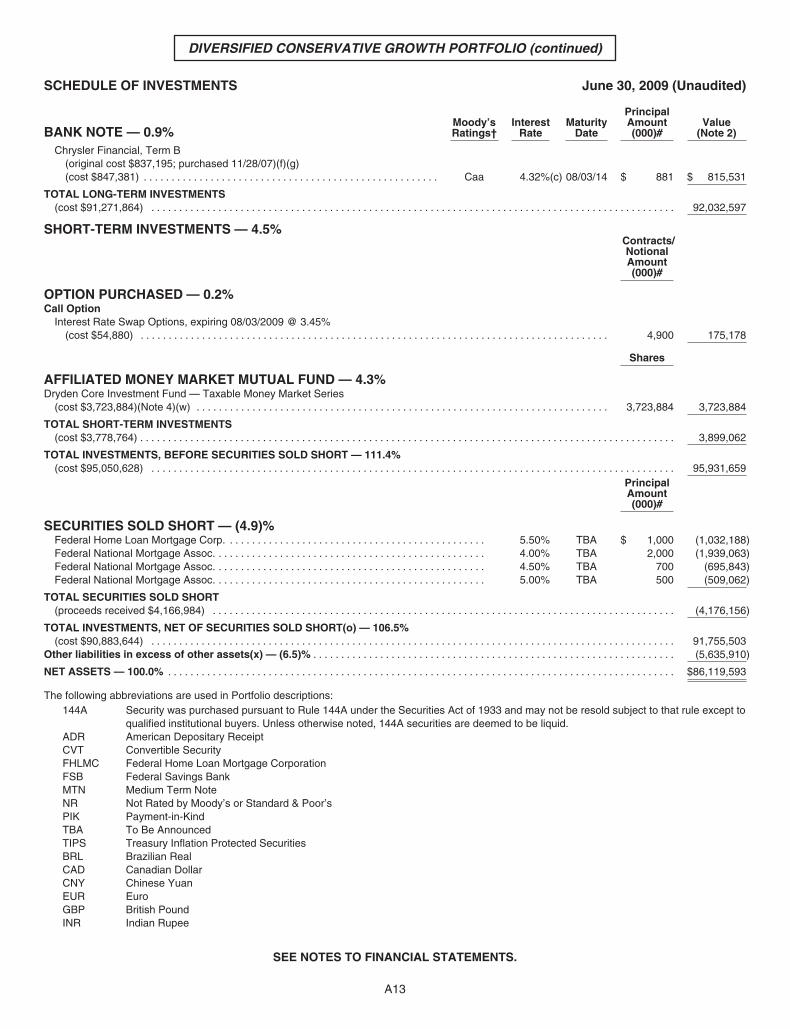
DIVERSIFIED CONSERVATIVE GROWTH PORTFOLIO (continued)
SCHEDULE OF INVESTMENTS June 30, 2009 (Unaudited)
BANK NOTE — 0.9%Moody’sRatings†
InterestRate
MaturityDate
PrincipalAmount(000)#
Value(Note 2)
Chrysler Financial, Term B(original cost $837,195; purchased 11/28/07)(f)(g)(cost $847,381) . . . . . . . . . . . . . . . . . . . . . . . . . . . . . . . . . . . . . . . . . . . . . . . . . . . . . Caa 4.32%(c) 08/03/14 $ 881 $ 815,531
TOTAL LONG-TERM INVESTMENTS(cost $91,271,864) . . . . . . . . . . . . . . . . . . . . . . . . . . . . . . . . . . . . . . . . . . . . . . . . . . . . . . . . . . . . . . . . . . . . . . . . . . . . . . . . . . . . . . . . . . . . . . 92,032,597
SHORT-TERM INVESTMENTS — 4.5%Contracts/NotionalAmount(000)#
OPTION PURCHASED — 0.2%Call Option
Interest Rate Swap Options, expiring 08/03/2009 @ 3.45%(cost $54,880) . . . . . . . . . . . . . . . . . . . . . . . . . . . . . . . . . . . . . . . . . . . . . . . . . . . . . . . . . . . . . . . . . . . . . . . . . . . . . . . . . . . . 4,900 175,178
Shares
AFFILIATED MONEY MARKET MUTUAL FUND — 4.3%Dryden Core Investment Fund — Taxable Money Market Series
(cost $3,723,884)(Note 4)(w) . . . . . . . . . . . . . . . . . . . . . . . . . . . . . . . . . . . . . . . . . . . . . . . . . . . . . . . . . . . . . . . . . . . . . . . . . . 3,723,884 3,723,884
TOTAL SHORT-TERM INVESTMENTS(cost $3,778,764) . . . . . . . . . . . . . . . . . . . . . . . . . . . . . . . . . . . . . . . . . . . . . . . . . . . . . . . . . . . . . . . . . . . . . . . . . . . . . . . . . . . . . . . . . . . . . . . . 3,899,062
TOTAL INVESTMENTS, BEFORE SECURITIES SOLD SHORT — 111.4%(cost $95,050,628) . . . . . . . . . . . . . . . . . . . . . . . . . . . . . . . . . . . . . . . . . . . . . . . . . . . . . . . . . . . . . . . . . . . . . . . . . . . . . . . . . . . . . . . . . . . . . . 95,931,659
PrincipalAmount(000)#
SECURITIES SOLD SHORT — (4.9)%Federal Home Loan Mortgage Corp. . . . . . . . . . . . . . . . . . . . . . . . . . . . . . . . . . . . . . . . . . . . . . . 5.50% TBA $ 1,000 (1,032,188)Federal National Mortgage Assoc. . . . . . . . . . . . . . . . . . . . . . . . . . . . . . . . . . . . . . . . . . . . . . . . . 4.00% TBA 2,000 (1,939,063)Federal National Mortgage Assoc. . . . . . . . . . . . . . . . . . . . . . . . . . . . . . . . . . . . . . . . . . . . . . . . . 4.50% TBA 700 (695,843)Federal National Mortgage Assoc. . . . . . . . . . . . . . . . . . . . . . . . . . . . . . . . . . . . . . . . . . . . . . . . . 5.00% TBA 500 (509,062)
TOTAL SECURITIES SOLD SHORT(proceeds received $4,166,984) . . . . . . . . . . . . . . . . . . . . . . . . . . . . . . . . . . . . . . . . . . . . . . . . . . . . . . . . . . . . . . . . . . . . . . . . . . . . . . . . . . . (4,176,156)
TOTAL INVESTMENTS, NET OF SECURITIES SOLD SHORT(o) — 106.5%(cost $90,883,644) . . . . . . . . . . . . . . . . . . . . . . . . . . . . . . . . . . . . . . . . . . . . . . . . . . . . . . . . . . . . . . . . . . . . . . . . . . . . . . . . . . . . . . . . . . . . . . 91,755,503
Other liabilities in excess of other assets(x) — (6.5)% . . . . . . . . . . . . . . . . . . . . . . . . . . . . . . . . . . . . . . . . . . . . . . . . . . . . . . . . . . . . . . . . . (5,635,910)
NET ASSETS — 100.0% . . . . . . . . . . . . . . . . . . . . . . . . . . . . . . . . . . . . . . . . . . . . . . . . . . . . . . . . . . . . . . . . . . . . . . . . . . . . . . . . . . . . . . . . . . . $86,119,593
The following abbreviations are used in Portfolio descriptions:144A Security was purchased pursuant to Rule 144A under the Securities Act of 1933 and may not be resold subject to that rule except to
qualified institutional buyers. Unless otherwise noted, 144A securities are deemed to be liquid.ADR American Depositary ReceiptCVT Convertible SecurityFHLMC Federal Home Loan Mortgage CorporationFSB Federal Savings BankMTN Medium Term NoteNR Not Rated by Moody’s or Standard & Poor’sPIK Payment-in-KindTBA To Be AnnouncedTIPS Treasury Inflation Protected SecuritiesBRL Brazilian RealCAD Canadian DollarCNY Chinese YuanEUR EuroGBP British PoundINR Indian Rupee
SEE NOTES TO FINANCIAL STATEMENTS.
A13
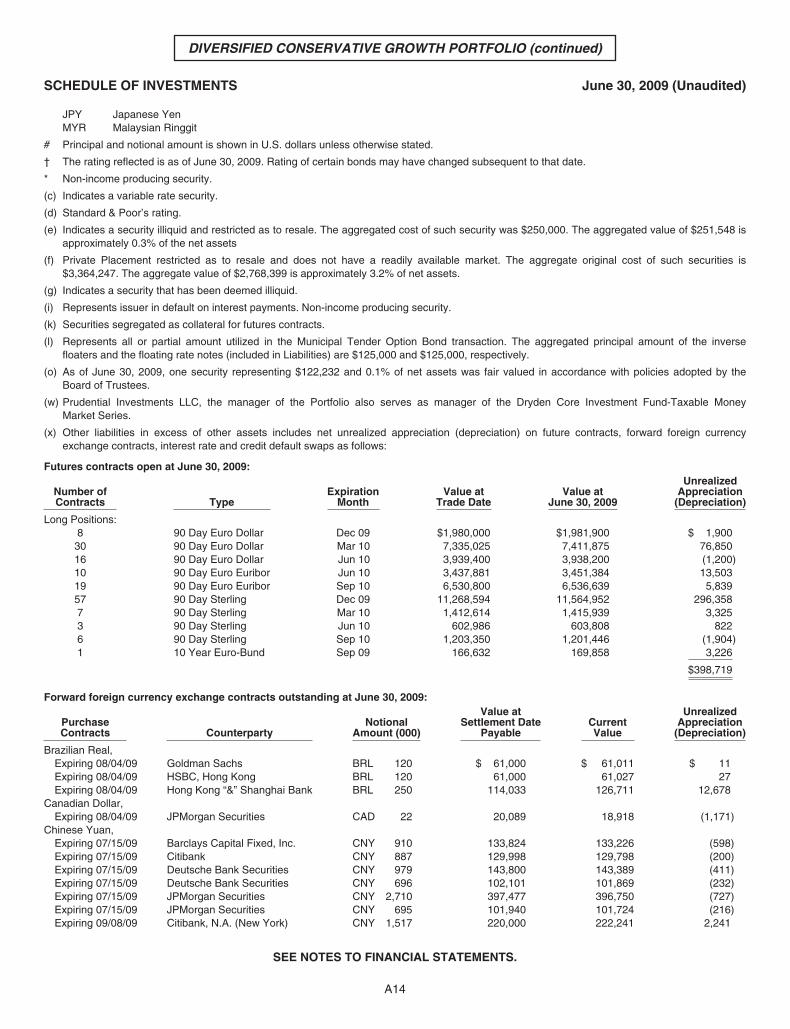
DIVERSIFIED CONSERVATIVE GROWTH PORTFOLIO (continued)
SCHEDULE OF INVESTMENTS June 30, 2009 (Unaudited)
JPY Japanese YenMYR Malaysian Ringgit
# Principal and notional amount is shown in U.S. dollars unless otherwise stated.
† The rating reflected is as of June 30, 2009. Rating of certain bonds may have changed subsequent to that date.
* Non-income producing security.
(c) Indicates a variable rate security.
(d) Standard & Poor’s rating.
(e) Indicates a security illiquid and restricted as to resale. The aggregated cost of such security was $250,000. The aggregated value of $251,548 isapproximately 0.3% of the net assets
(f) Private Placement restricted as to resale and does not have a readily available market. The aggregate original cost of such securities is$3,364,247. The aggregate value of $2,768,399 is approximately 3.2% of net assets.
(g) Indicates a security that has been deemed illiquid.
(i) Represents issuer in default on interest payments. Non-income producing security.
(k) Securities segregated as collateral for futures contracts.
(l) Represents all or partial amount utilized in the Municipal Tender Option Bond transaction. The aggregated principal amount of the inversefloaters and the floating rate notes (included in Liabilities) are $125,000 and $125,000, respectively.
(o) As of June 30, 2009, one security representing $122,232 and 0.1% of net assets was fair valued in accordance with policies adopted by theBoard of Trustees.
(w) Prudential Investments LLC, the manager of the Portfolio also serves as manager of the Dryden Core Investment Fund-Taxable MoneyMarket Series.
(x) Other liabilities in excess of other assets includes net unrealized appreciation (depreciation) on future contracts, forward foreign currencyexchange contracts, interest rate and credit default swaps as follows:
Futures contracts open at June 30, 2009:
Number ofContracts Type
ExpirationMonth
Value atTrade Date
Value atJune 30, 2009
UnrealizedAppreciation
(Depreciation)
Long Positions:8 90 Day Euro Dollar Dec 09 $1,980,000 $1,981,900 $ 1,90030 90 Day Euro Dollar Mar 10 7,335,025 7,411,875 76,85016 90 Day Euro Dollar Jun 10 3,939,400 3,938,200 (1,200)10 90 Day Euro Euribor Jun 10 3,437,881 3,451,384 13,50319 90 Day Euro Euribor Sep 10 6,530,800 6,536,639 5,83957 90 Day Sterling Dec 09 11,268,594 11,564,952 296,3587 90 Day Sterling Mar 10 1,412,614 1,415,939 3,3253 90 Day Sterling Jun 10 602,986 603,808 8226 90 Day Sterling Sep 10 1,203,350 1,201,446 (1,904)1 10 Year Euro-Bund Sep 09 166,632 169,858 3,226
$398,719
Forward foreign currency exchange contracts outstanding at June 30, 2009:
PurchaseContracts Counterparty
NotionalAmount (000)
Value atSettlement Date
PayableCurrentValue
UnrealizedAppreciation
(Depreciation)
Brazilian Real,Expiring 08/04/09 Goldman Sachs BRL 120 $ 61,000 $ 61,011 $ 11Expiring 08/04/09 HSBC, Hong Kong BRL 120 61,000 61,027 27Expiring 08/04/09 Hong Kong “&” Shanghai Bank BRL 250 114,033 126,711 12,678
Canadian Dollar,Expiring 08/04/09 JPMorgan Securities CAD 22 20,089 18,918 (1,171)
Chinese Yuan,Expiring 07/15/09 Barclays Capital Fixed, Inc. CNY 910 133,824 133,226 (598)Expiring 07/15/09 Citibank CNY 887 129,998 129,798 (200)Expiring 07/15/09 Deutsche Bank Securities CNY 979 143,800 143,389 (411)Expiring 07/15/09 Deutsche Bank Securities CNY 696 102,101 101,869 (232)Expiring 07/15/09 JPMorgan Securities CNY 2,710 397,477 396,750 (727)Expiring 07/15/09 JPMorgan Securities CNY 695 101,940 101,724 (216)Expiring 09/08/09 Citibank, N.A. (New York) CNY 1,517 220,000 222,241 2,241
SEE NOTES TO FINANCIAL STATEMENTS.
A14
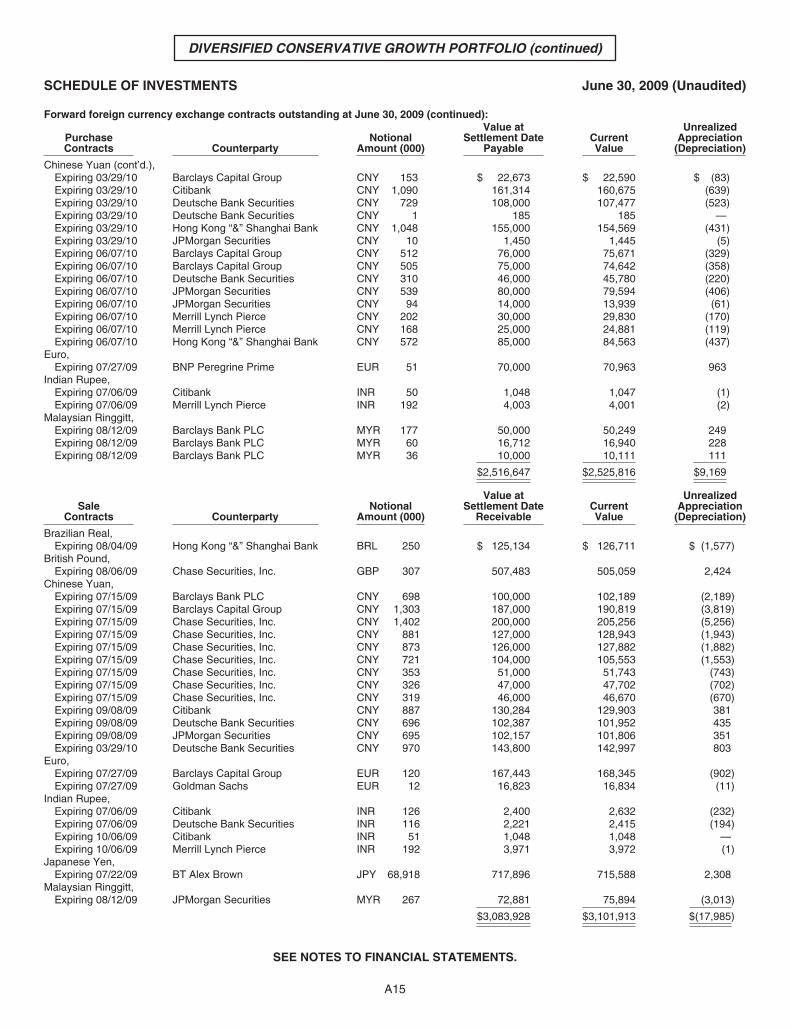
DIVERSIFIED CONSERVATIVE GROWTH PORTFOLIO (continued)
SCHEDULE OF INVESTMENTS June 30, 2009 (Unaudited)
Forward foreign currency exchange contracts outstanding at June 30, 2009 (continued):
PurchaseContracts Counterparty
NotionalAmount (000)
Value atSettlement Date
PayableCurrentValue
UnrealizedAppreciation
(Depreciation)
Chinese Yuan (cont’d.),Expiring 03/29/10 Barclays Capital Group CNY 153 $ 22,673 $ 22,590 $ (83)Expiring 03/29/10 Citibank CNY 1,090 161,314 160,675 (639)Expiring 03/29/10 Deutsche Bank Securities CNY 729 108,000 107,477 (523)Expiring 03/29/10 Deutsche Bank Securities CNY 1 185 185 —Expiring 03/29/10 Hong Kong “&” Shanghai Bank CNY 1,048 155,000 154,569 (431)Expiring 03/29/10 JPMorgan Securities CNY 10 1,450 1,445 (5)Expiring 06/07/10 Barclays Capital Group CNY 512 76,000 75,671 (329)Expiring 06/07/10 Barclays Capital Group CNY 505 75,000 74,642 (358)Expiring 06/07/10 Deutsche Bank Securities CNY 310 46,000 45,780 (220)Expiring 06/07/10 JPMorgan Securities CNY 539 80,000 79,594 (406)Expiring 06/07/10 JPMorgan Securities CNY 94 14,000 13,939 (61)Expiring 06/07/10 Merrill Lynch Pierce CNY 202 30,000 29,830 (170)Expiring 06/07/10 Merrill Lynch Pierce CNY 168 25,000 24,881 (119)Expiring 06/07/10 Hong Kong “&” Shanghai Bank CNY 572 85,000 84,563 (437)
Euro,Expiring 07/27/09 BNP Peregrine Prime EUR 51 70,000 70,963 963
Indian Rupee,Expiring 07/06/09 Citibank INR 50 1,048 1,047 (1)Expiring 07/06/09 Merrill Lynch Pierce INR 192 4,003 4,001 (2)
Malaysian Ringgitt,Expiring 08/12/09 Barclays Bank PLC MYR 177 50,000 50,249 249Expiring 08/12/09 Barclays Bank PLC MYR 60 16,712 16,940 228Expiring 08/12/09 Barclays Bank PLC MYR 36 10,000 10,111 111
$2,516,647 $2,525,816 $9,169
SaleContracts Counterparty
NotionalAmount (000)
Value atSettlement Date
ReceivableCurrentValue
UnrealizedAppreciation
(Depreciation)
Brazilian Real,Expiring 08/04/09 Hong Kong “&” Shanghai Bank BRL 250 $ 125,134 $ 126,711 $ (1,577)
British Pound,Expiring 08/06/09 Chase Securities, Inc. GBP 307 507,483 505,059 2,424
Chinese Yuan,Expiring 07/15/09 Barclays Bank PLC CNY 698 100,000 102,189 (2,189)Expiring 07/15/09 Barclays Capital Group CNY 1,303 187,000 190,819 (3,819)Expiring 07/15/09 Chase Securities, Inc. CNY 1,402 200,000 205,256 (5,256)Expiring 07/15/09 Chase Securities, Inc. CNY 881 127,000 128,943 (1,943)Expiring 07/15/09 Chase Securities, Inc. CNY 873 126,000 127,882 (1,882)Expiring 07/15/09 Chase Securities, Inc. CNY 721 104,000 105,553 (1,553)Expiring 07/15/09 Chase Securities, Inc. CNY 353 51,000 51,743 (743)Expiring 07/15/09 Chase Securities, Inc. CNY 326 47,000 47,702 (702)Expiring 07/15/09 Chase Securities, Inc. CNY 319 46,000 46,670 (670)Expiring 09/08/09 Citibank CNY 887 130,284 129,903 381Expiring 09/08/09 Deutsche Bank Securities CNY 696 102,387 101,952 435Expiring 09/08/09 JPMorgan Securities CNY 695 102,157 101,806 351Expiring 03/29/10 Deutsche Bank Securities CNY 970 143,800 142,997 803
Euro,Expiring 07/27/09 Barclays Capital Group EUR 120 167,443 168,345 (902)Expiring 07/27/09 Goldman Sachs EUR 12 16,823 16,834 (11)
Indian Rupee,Expiring 07/06/09 Citibank INR 126 2,400 2,632 (232)Expiring 07/06/09 Deutsche Bank Securities INR 116 2,221 2,415 (194)Expiring 10/06/09 Citibank INR 51 1,048 1,048 —Expiring 10/06/09 Merrill Lynch Pierce INR 192 3,971 3,972 (1)
Japanese Yen,Expiring 07/22/09 BT Alex Brown JPY 68,918 717,896 715,588 2,308
Malaysian Ringgitt,Expiring 08/12/09 JPMorgan Securities MYR 267 72,881 75,894 (3,013)
$3,083,928 $3,101,913 $(17,985)
SEE NOTES TO FINANCIAL STATEMENTS.
A15
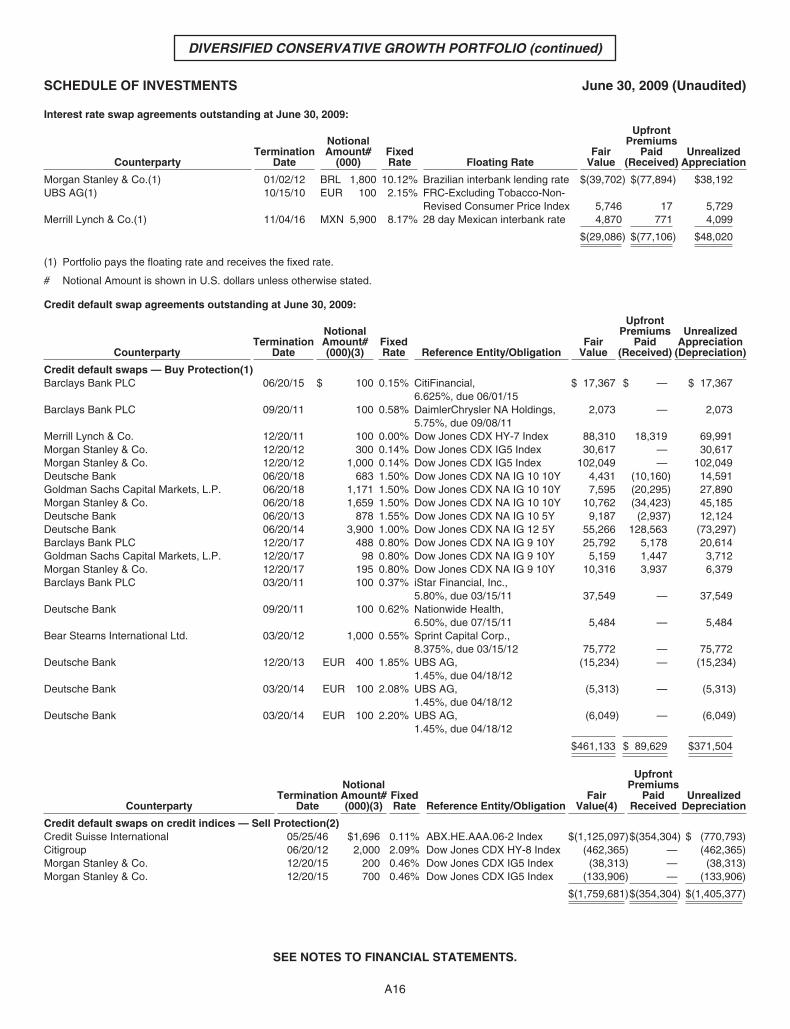
DIVERSIFIED CONSERVATIVE GROWTH PORTFOLIO (continued)
SCHEDULE OF INVESTMENTS June 30, 2009 (Unaudited)
Interest rate swap agreements outstanding at June 30, 2009:
CounterpartyTermination
Date
NotionalAmount#
(000)FixedRate Floating Rate
FairValue
UpfrontPremiums
Paid(Received)
UnrealizedAppreciation
Morgan Stanley & Co.(1) 01/02/12 BRL 1,800 10.12% Brazilian interbank lending rate $(39,702) $(77,894) $38,192UBS AG(1) 10/15/10 EUR 100 2.15% FRC-Excluding Tobacco-Non-
Revised Consumer Price Index 5,746 17 5,729Merrill Lynch & Co.(1) 11/04/16 MXN 5,900 8.17% 28 day Mexican interbank rate 4,870 771 4,099
$(29,086) $(77,106) $48,020
(1) Portfolio pays the floating rate and receives the fixed rate.
# Notional Amount is shown in U.S. dollars unless otherwise stated.
Credit default swap agreements outstanding at June 30, 2009:
CounterpartyTermination
Date
NotionalAmount#(000)(3)
FixedRate Reference Entity/Obligation
FairValue
UpfrontPremiums
Paid(Received)
UnrealizedAppreciation
(Depreciation)
Credit default swaps — Buy Protection(1)Barclays Bank PLC 06/20/15 $ 100 0.15% CitiFinancial,
6.625%, due 06/01/15$ 17,367 $ — $ 17,367
Barclays Bank PLC 09/20/11 100 0.58% DaimlerChrysler NA Holdings,5.75%, due 09/08/11
2,073 — 2,073
Merrill Lynch & Co. 12/20/11 100 0.00% Dow Jones CDX HY-7 Index 88,310 18,319 69,991Morgan Stanley & Co. 12/20/12 300 0.14% Dow Jones CDX IG5 Index 30,617 — 30,617Morgan Stanley & Co. 12/20/12 1,000 0.14% Dow Jones CDX IG5 Index 102,049 — 102,049Deutsche Bank 06/20/18 683 1.50% Dow Jones CDX NA IG 10 10Y 4,431 (10,160) 14,591Goldman Sachs Capital Markets, L.P. 06/20/18 1,171 1.50% Dow Jones CDX NA IG 10 10Y 7,595 (20,295) 27,890Morgan Stanley & Co. 06/20/18 1,659 1.50% Dow Jones CDX NA IG 10 10Y 10,762 (34,423) 45,185Deutsche Bank 06/20/13 878 1.55% Dow Jones CDX NA IG 10 5Y 9,187 (2,937) 12,124Deutsche Bank 06/20/14 3,900 1.00% Dow Jones CDX NA IG 12 5Y 55,266 128,563 (73,297)Barclays Bank PLC 12/20/17 488 0.80% Dow Jones CDX NA IG 9 10Y 25,792 5,178 20,614Goldman Sachs Capital Markets, L.P. 12/20/17 98 0.80% Dow Jones CDX NA IG 9 10Y 5,159 1,447 3,712Morgan Stanley & Co. 12/20/17 195 0.80% Dow Jones CDX NA IG 9 10Y 10,316 3,937 6,379Barclays Bank PLC 03/20/11 100 0.37% iStar Financial, Inc.,
5.80%, due 03/15/11 37,549 — 37,549Deutsche Bank 09/20/11 100 0.62% Nationwide Health,
6.50%, due 07/15/11 5,484 — 5,484Bear Stearns International Ltd. 03/20/12 1,000 0.55% Sprint Capital Corp.,
8.375%, due 03/15/12 75,772 — 75,772Deutsche Bank 12/20/13 EUR 400 1.85% UBS AG,
1.45%, due 04/18/12(15,234) — (15,234)
Deutsche Bank 03/20/14 EUR 100 2.08% UBS AG,1.45%, due 04/18/12
(5,313) — (5,313)
Deutsche Bank 03/20/14 EUR 100 2.20% UBS AG,1.45%, due 04/18/12
(6,049) — (6,049)
$461,133 $ 89,629 $371,504
CounterpartyTermination
Date
NotionalAmount#(000)(3)
FixedRate Reference Entity/Obligation
FairValue(4)
UpfrontPremiums
PaidReceived
UnrealizedDepreciation
Credit default swaps on credit indices — Sell Protection(2)Credit Suisse International 05/25/46 $1,696 0.11% ABX.HE.AAA.06-2 Index $(1,125,097)$(354,304) $ (770,793)Citigroup 06/20/12 2,000 2.09% Dow Jones CDX HY-8 Index (462,365) — (462,365)Morgan Stanley & Co. 12/20/15 200 0.46% Dow Jones CDX IG5 Index (38,313) — (38,313)Morgan Stanley & Co. 12/20/15 700 0.46% Dow Jones CDX IG5 Index (133,906) — (133,906)
$(1,759,681)$(354,304) $(1,405,377)
SEE NOTES TO FINANCIAL STATEMENTS.
A16
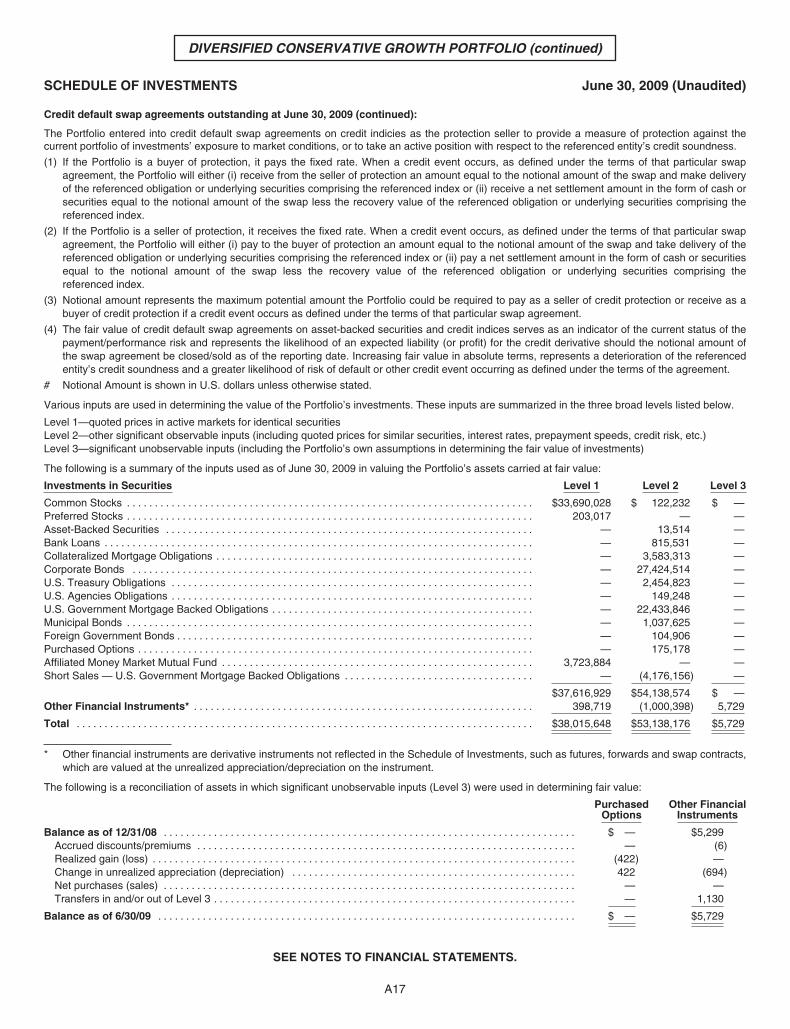
DIVERSIFIED CONSERVATIVE GROWTH PORTFOLIO (continued)
SCHEDULE OF INVESTMENTS June 30, 2009 (Unaudited)
Credit default swap agreements outstanding at June 30, 2009 (continued):
The Portfolio entered into credit default swap agreements on credit indicies as the protection seller to provide a measure of protection against thecurrent portfolio of investments’ exposure to market conditions, or to take an active position with respect to the referenced entity’s credit soundness.
(1) If the Portfolio is a buyer of protection, it pays the fixed rate. When a credit event occurs, as defined under the terms of that particular swapagreement, the Portfolio will either (i) receive from the seller of protection an amount equal to the notional amount of the swap and make deliveryof the referenced obligation or underlying securities comprising the referenced index or (ii) receive a net settlement amount in the form of cash orsecurities equal to the notional amount of the swap less the recovery value of the referenced obligation or underlying securities comprising thereferenced index.
(2) If the Portfolio is a seller of protection, it receives the fixed rate. When a credit event occurs, as defined under the terms of that particular swapagreement, the Portfolio will either (i) pay to the buyer of protection an amount equal to the notional amount of the swap and take delivery of thereferenced obligation or underlying securities comprising the referenced index or (ii) pay a net settlement amount in the form of cash or securitiesequal to the notional amount of the swap less the recovery value of the referenced obligation or underlying securities comprising thereferenced index.
(3) Notional amount represents the maximum potential amount the Portfolio could be required to pay as a seller of credit protection or receive as abuyer of credit protection if a credit event occurs as defined under the terms of that particular swap agreement.
(4) The fair value of credit default swap agreements on asset-backed securities and credit indices serves as an indicator of the current status of thepayment/performance risk and represents the likelihood of an expected liability (or profit) for the credit derivative should the notional amount ofthe swap agreement be closed/sold as of the reporting date. Increasing fair value in absolute terms, represents a deterioration of the referencedentity’s credit soundness and a greater likelihood of risk of default or other credit event occurring as defined under the terms of the agreement.
# Notional Amount is shown in U.S. dollars unless otherwise stated.
Various inputs are used in determining the value of the Portfolio’s investments. These inputs are summarized in the three broad levels listed below.
Level 1—quoted prices in active markets for identical securitiesLevel 2—other significant observable inputs (including quoted prices for similar securities, interest rates, prepayment speeds, credit risk, etc.)Level 3—significant unobservable inputs (including the Portfolio’s own assumptions in determining the fair value of investments)
The following is a summary of the inputs used as of June 30, 2009 in valuing the Portfolio’s assets carried at fair value:
Investments in Securities Level 1 Level 2 Level 3
Common Stocks . . . . . . . . . . . . . . . . . . . . . . . . . . . . . . . . . . . . . . . . . . . . . . . . . . . . . . . . . . . . . . . . . . . . . . . . . $33,690,028 $ 122,232 $ —Preferred Stocks . . . . . . . . . . . . . . . . . . . . . . . . . . . . . . . . . . . . . . . . . . . . . . . . . . . . . . . . . . . . . . . . . . . . . . . . . 203,017 — —Asset-Backed Securities . . . . . . . . . . . . . . . . . . . . . . . . . . . . . . . . . . . . . . . . . . . . . . . . . . . . . . . . . . . . . . . . . . — 13,514 —Bank Loans . . . . . . . . . . . . . . . . . . . . . . . . . . . . . . . . . . . . . . . . . . . . . . . . . . . . . . . . . . . . . . . . . . . . . . . . . . . . . — 815,531 —Collateralized Mortgage Obligations . . . . . . . . . . . . . . . . . . . . . . . . . . . . . . . . . . . . . . . . . . . . . . . . . . . . . . . . . — 3,583,313 —Corporate Bonds . . . . . . . . . . . . . . . . . . . . . . . . . . . . . . . . . . . . . . . . . . . . . . . . . . . . . . . . . . . . . . . . . . . . . . . . — 27,424,514 —U.S. Treasury Obligations . . . . . . . . . . . . . . . . . . . . . . . . . . . . . . . . . . . . . . . . . . . . . . . . . . . . . . . . . . . . . . . . . — 2,454,823 —U.S. Agencies Obligations . . . . . . . . . . . . . . . . . . . . . . . . . . . . . . . . . . . . . . . . . . . . . . . . . . . . . . . . . . . . . . . . . — 149,248 —U.S. Government Mortgage Backed Obligations . . . . . . . . . . . . . . . . . . . . . . . . . . . . . . . . . . . . . . . . . . . . . . . — 22,433,846 —Municipal Bonds . . . . . . . . . . . . . . . . . . . . . . . . . . . . . . . . . . . . . . . . . . . . . . . . . . . . . . . . . . . . . . . . . . . . . . . . . — 1,037,625 —Foreign Government Bonds . . . . . . . . . . . . . . . . . . . . . . . . . . . . . . . . . . . . . . . . . . . . . . . . . . . . . . . . . . . . . . . . — 104,906 —Purchased Options . . . . . . . . . . . . . . . . . . . . . . . . . . . . . . . . . . . . . . . . . . . . . . . . . . . . . . . . . . . . . . . . . . . . . . . — 175,178 —Affiliated Money Market Mutual Fund . . . . . . . . . . . . . . . . . . . . . . . . . . . . . . . . . . . . . . . . . . . . . . . . . . . . . . . . 3,723,884 — —Short Sales — U.S. Government Mortgage Backed Obligations . . . . . . . . . . . . . . . . . . . . . . . . . . . . . . . . . . — (4,176,156) —
$37,616,929 $54,138,574 $ —Other Financial Instruments* . . . . . . . . . . . . . . . . . . . . . . . . . . . . . . . . . . . . . . . . . . . . . . . . . . . . . . . . . . . . . 398,719 (1,000,398) 5,729
Total . . . . . . . . . . . . . . . . . . . . . . . . . . . . . . . . . . . . . . . . . . . . . . . . . . . . . . . . . . . . . . . . . . . . . . . . . . . . . . . . . . $38,015,648 $53,138,176 $5,729
* Other financial instruments are derivative instruments not reflected in the Schedule of Investments, such as futures, forwards and swap contracts,which are valued at the unrealized appreciation/depreciation on the instrument.
The following is a reconciliation of assets in which significant unobservable inputs (Level 3) were used in determining fair value:
PurchasedOptions
Other FinancialInstruments
Balance as of 12/31/08 . . . . . . . . . . . . . . . . . . . . . . . . . . . . . . . . . . . . . . . . . . . . . . . . . . . . . . . . . . . . . . . . . . . . . . . . . . $ — $5,299Accrued discounts/premiums . . . . . . . . . . . . . . . . . . . . . . . . . . . . . . . . . . . . . . . . . . . . . . . . . . . . . . . . . . . . . . . . . . . . — (6)Realized gain (loss) . . . . . . . . . . . . . . . . . . . . . . . . . . . . . . . . . . . . . . . . . . . . . . . . . . . . . . . . . . . . . . . . . . . . . . . . . . . . (422) —Change in unrealized appreciation (depreciation) . . . . . . . . . . . . . . . . . . . . . . . . . . . . . . . . . . . . . . . . . . . . . . . . . . . 422 (694)Net purchases (sales) . . . . . . . . . . . . . . . . . . . . . . . . . . . . . . . . . . . . . . . . . . . . . . . . . . . . . . . . . . . . . . . . . . . . . . . . . . — —Transfers in and/or out of Level 3 . . . . . . . . . . . . . . . . . . . . . . . . . . . . . . . . . . . . . . . . . . . . . . . . . . . . . . . . . . . . . . . . . — 1,130
Balance as of 6/30/09 . . . . . . . . . . . . . . . . . . . . . . . . . . . . . . . . . . . . . . . . . . . . . . . . . . . . . . . . . . . . . . . . . . . . . . . . . . . $ — $5,729
SEE NOTES TO FINANCIAL STATEMENTS.
A17
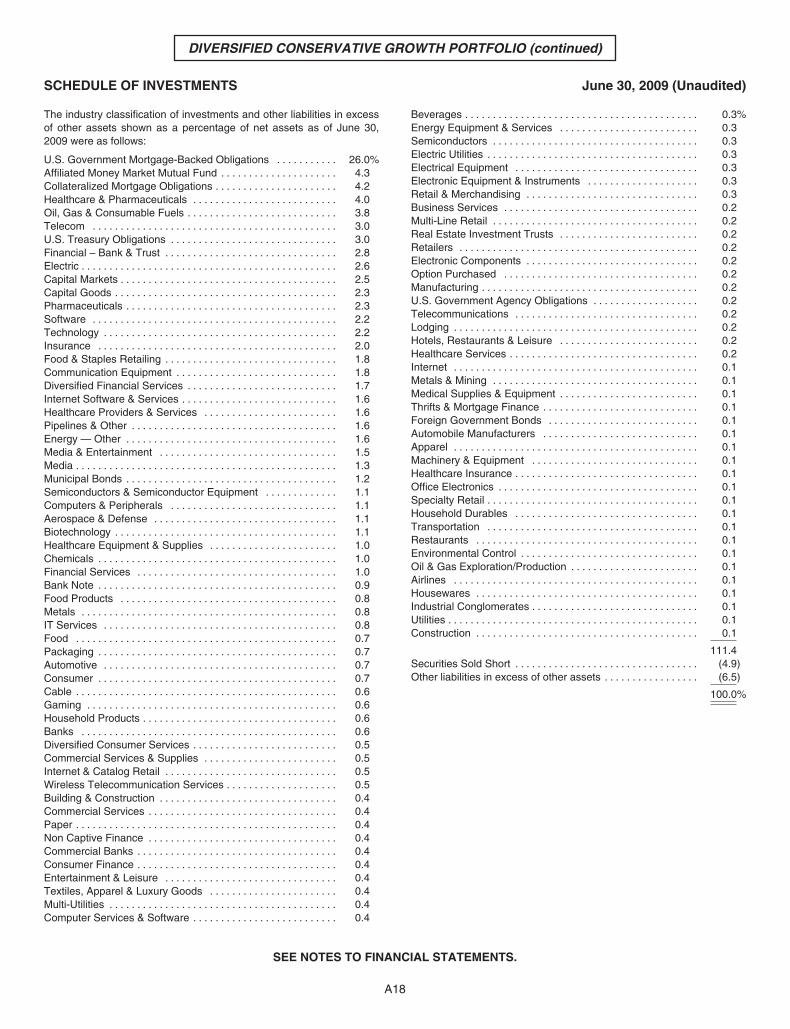
DIVERSIFIED CONSERVATIVE GROWTH PORTFOLIO (continued)
SCHEDULE OF INVESTMENTS June 30, 2009 (Unaudited)
The industry classification of investments and other liabilities in excessof other assets shown as a percentage of net assets as of June 30,2009 were as follows:
U.S. Government Mortgage-Backed Obligations . . . . . . . . . . . 26.0%Affiliated Money Market Mutual Fund . . . . . . . . . . . . . . . . . . . . . 4.3Collateralized Mortgage Obligations . . . . . . . . . . . . . . . . . . . . . . 4.2Healthcare & Pharmaceuticals . . . . . . . . . . . . . . . . . . . . . . . . . . 4.0Oil, Gas & Consumable Fuels . . . . . . . . . . . . . . . . . . . . . . . . . . . 3.8Telecom . . . . . . . . . . . . . . . . . . . . . . . . . . . . . . . . . . . . . . . . . . . . 3.0U.S. Treasury Obligations . . . . . . . . . . . . . . . . . . . . . . . . . . . . . . 3.0Financial – Bank & Trust . . . . . . . . . . . . . . . . . . . . . . . . . . . . . . . 2.8Electric . . . . . . . . . . . . . . . . . . . . . . . . . . . . . . . . . . . . . . . . . . . . . . 2.6Capital Markets . . . . . . . . . . . . . . . . . . . . . . . . . . . . . . . . . . . . . . . 2.5Capital Goods . . . . . . . . . . . . . . . . . . . . . . . . . . . . . . . . . . . . . . . . 2.3Pharmaceuticals . . . . . . . . . . . . . . . . . . . . . . . . . . . . . . . . . . . . . . 2.3Software . . . . . . . . . . . . . . . . . . . . . . . . . . . . . . . . . . . . . . . . . . . . 2.2Technology . . . . . . . . . . . . . . . . . . . . . . . . . . . . . . . . . . . . . . . . . . 2.2Insurance . . . . . . . . . . . . . . . . . . . . . . . . . . . . . . . . . . . . . . . . . . . 2.0Food & Staples Retailing . . . . . . . . . . . . . . . . . . . . . . . . . . . . . . . 1.8Communication Equipment . . . . . . . . . . . . . . . . . . . . . . . . . . . . . 1.8Diversified Financial Services . . . . . . . . . . . . . . . . . . . . . . . . . . . 1.7Internet Software & Services . . . . . . . . . . . . . . . . . . . . . . . . . . . . 1.6Healthcare Providers & Services . . . . . . . . . . . . . . . . . . . . . . . . 1.6Pipelines & Other . . . . . . . . . . . . . . . . . . . . . . . . . . . . . . . . . . . . . 1.6Energy — Other . . . . . . . . . . . . . . . . . . . . . . . . . . . . . . . . . . . . . . 1.6Media & Entertainment . . . . . . . . . . . . . . . . . . . . . . . . . . . . . . . . 1.5Media . . . . . . . . . . . . . . . . . . . . . . . . . . . . . . . . . . . . . . . . . . . . . . . 1.3Municipal Bonds . . . . . . . . . . . . . . . . . . . . . . . . . . . . . . . . . . . . . . 1.2Semiconductors & Semiconductor Equipment . . . . . . . . . . . . . 1.1Computers & Peripherals . . . . . . . . . . . . . . . . . . . . . . . . . . . . . . 1.1Aerospace & Defense . . . . . . . . . . . . . . . . . . . . . . . . . . . . . . . . . 1.1Biotechnology . . . . . . . . . . . . . . . . . . . . . . . . . . . . . . . . . . . . . . . . 1.1Healthcare Equipment & Supplies . . . . . . . . . . . . . . . . . . . . . . . 1.0Chemicals . . . . . . . . . . . . . . . . . . . . . . . . . . . . . . . . . . . . . . . . . . . 1.0Financial Services . . . . . . . . . . . . . . . . . . . . . . . . . . . . . . . . . . . . 1.0Bank Note . . . . . . . . . . . . . . . . . . . . . . . . . . . . . . . . . . . . . . . . . . . 0.9Food Products . . . . . . . . . . . . . . . . . . . . . . . . . . . . . . . . . . . . . . . 0.8Metals . . . . . . . . . . . . . . . . . . . . . . . . . . . . . . . . . . . . . . . . . . . . . . 0.8IT Services . . . . . . . . . . . . . . . . . . . . . . . . . . . . . . . . . . . . . . . . . . 0.8Food . . . . . . . . . . . . . . . . . . . . . . . . . . . . . . . . . . . . . . . . . . . . . . . 0.7Packaging . . . . . . . . . . . . . . . . . . . . . . . . . . . . . . . . . . . . . . . . . . . 0.7Automotive . . . . . . . . . . . . . . . . . . . . . . . . . . . . . . . . . . . . . . . . . . 0.7Consumer . . . . . . . . . . . . . . . . . . . . . . . . . . . . . . . . . . . . . . . . . . . 0.7Cable . . . . . . . . . . . . . . . . . . . . . . . . . . . . . . . . . . . . . . . . . . . . . . . 0.6Gaming . . . . . . . . . . . . . . . . . . . . . . . . . . . . . . . . . . . . . . . . . . . . . 0.6Household Products . . . . . . . . . . . . . . . . . . . . . . . . . . . . . . . . . . . 0.6Banks . . . . . . . . . . . . . . . . . . . . . . . . . . . . . . . . . . . . . . . . . . . . . . 0.6Diversified Consumer Services . . . . . . . . . . . . . . . . . . . . . . . . . . 0.5Commercial Services & Supplies . . . . . . . . . . . . . . . . . . . . . . . . 0.5Internet & Catalog Retail . . . . . . . . . . . . . . . . . . . . . . . . . . . . . . . 0.5Wireless Telecommunication Services . . . . . . . . . . . . . . . . . . . . 0.5Building & Construction . . . . . . . . . . . . . . . . . . . . . . . . . . . . . . . . 0.4Commercial Services . . . . . . . . . . . . . . . . . . . . . . . . . . . . . . . . . . 0.4Paper . . . . . . . . . . . . . . . . . . . . . . . . . . . . . . . . . . . . . . . . . . . . . . . 0.4Non Captive Finance . . . . . . . . . . . . . . . . . . . . . . . . . . . . . . . . . . 0.4Commercial Banks . . . . . . . . . . . . . . . . . . . . . . . . . . . . . . . . . . . . 0.4Consumer Finance . . . . . . . . . . . . . . . . . . . . . . . . . . . . . . . . . . . . 0.4Entertainment & Leisure . . . . . . . . . . . . . . . . . . . . . . . . . . . . . . . 0.4Textiles, Apparel & Luxury Goods . . . . . . . . . . . . . . . . . . . . . . . 0.4Multi-Utilities . . . . . . . . . . . . . . . . . . . . . . . . . . . . . . . . . . . . . . . . . 0.4Computer Services & Software . . . . . . . . . . . . . . . . . . . . . . . . . . 0.4
Beverages . . . . . . . . . . . . . . . . . . . . . . . . . . . . . . . . . . . . . . . . . . 0.3%Energy Equipment & Services . . . . . . . . . . . . . . . . . . . . . . . . . 0.3Semiconductors . . . . . . . . . . . . . . . . . . . . . . . . . . . . . . . . . . . . . 0.3Electric Utilities . . . . . . . . . . . . . . . . . . . . . . . . . . . . . . . . . . . . . . 0.3Electrical Equipment . . . . . . . . . . . . . . . . . . . . . . . . . . . . . . . . . 0.3Electronic Equipment & Instruments . . . . . . . . . . . . . . . . . . . . 0.3Retail & Merchandising . . . . . . . . . . . . . . . . . . . . . . . . . . . . . . . 0.3Business Services . . . . . . . . . . . . . . . . . . . . . . . . . . . . . . . . . . . 0.2Multi-Line Retail . . . . . . . . . . . . . . . . . . . . . . . . . . . . . . . . . . . . . 0.2Real Estate Investment Trusts . . . . . . . . . . . . . . . . . . . . . . . . . 0.2Retailers . . . . . . . . . . . . . . . . . . . . . . . . . . . . . . . . . . . . . . . . . . . 0.2Electronic Components . . . . . . . . . . . . . . . . . . . . . . . . . . . . . . . 0.2Option Purchased . . . . . . . . . . . . . . . . . . . . . . . . . . . . . . . . . . . 0.2Manufacturing . . . . . . . . . . . . . . . . . . . . . . . . . . . . . . . . . . . . . . . 0.2U.S. Government Agency Obligations . . . . . . . . . . . . . . . . . . . 0.2Telecommunications . . . . . . . . . . . . . . . . . . . . . . . . . . . . . . . . . 0.2Lodging . . . . . . . . . . . . . . . . . . . . . . . . . . . . . . . . . . . . . . . . . . . . 0.2Hotels, Restaurants & Leisure . . . . . . . . . . . . . . . . . . . . . . . . . 0.2Healthcare Services . . . . . . . . . . . . . . . . . . . . . . . . . . . . . . . . . . 0.2Internet . . . . . . . . . . . . . . . . . . . . . . . . . . . . . . . . . . . . . . . . . . . . 0.1Metals & Mining . . . . . . . . . . . . . . . . . . . . . . . . . . . . . . . . . . . . . 0.1Medical Supplies & Equipment . . . . . . . . . . . . . . . . . . . . . . . . . 0.1Thrifts & Mortgage Finance . . . . . . . . . . . . . . . . . . . . . . . . . . . . 0.1Foreign Government Bonds . . . . . . . . . . . . . . . . . . . . . . . . . . . 0.1Automobile Manufacturers . . . . . . . . . . . . . . . . . . . . . . . . . . . . 0.1Apparel . . . . . . . . . . . . . . . . . . . . . . . . . . . . . . . . . . . . . . . . . . . . 0.1Machinery & Equipment . . . . . . . . . . . . . . . . . . . . . . . . . . . . . . 0.1Healthcare Insurance . . . . . . . . . . . . . . . . . . . . . . . . . . . . . . . . . 0.1Office Electronics . . . . . . . . . . . . . . . . . . . . . . . . . . . . . . . . . . . . 0.1Specialty Retail . . . . . . . . . . . . . . . . . . . . . . . . . . . . . . . . . . . . . . 0.1Household Durables . . . . . . . . . . . . . . . . . . . . . . . . . . . . . . . . . 0.1Transportation . . . . . . . . . . . . . . . . . . . . . . . . . . . . . . . . . . . . . . 0.1Restaurants . . . . . . . . . . . . . . . . . . . . . . . . . . . . . . . . . . . . . . . . 0.1Environmental Control . . . . . . . . . . . . . . . . . . . . . . . . . . . . . . . . 0.1Oil & Gas Exploration/Production . . . . . . . . . . . . . . . . . . . . . . . 0.1Airlines . . . . . . . . . . . . . . . . . . . . . . . . . . . . . . . . . . . . . . . . . . . . 0.1Housewares . . . . . . . . . . . . . . . . . . . . . . . . . . . . . . . . . . . . . . . . 0.1Industrial Conglomerates . . . . . . . . . . . . . . . . . . . . . . . . . . . . . . 0.1Utilities . . . . . . . . . . . . . . . . . . . . . . . . . . . . . . . . . . . . . . . . . . . . . 0.1Construction . . . . . . . . . . . . . . . . . . . . . . . . . . . . . . . . . . . . . . . . 0.1
111.4Securities Sold Short . . . . . . . . . . . . . . . . . . . . . . . . . . . . . . . . . (4.9)Other liabilities in excess of other assets . . . . . . . . . . . . . . . . . (6.5)
100.0%
SEE NOTES TO FINANCIAL STATEMENTS.
A18
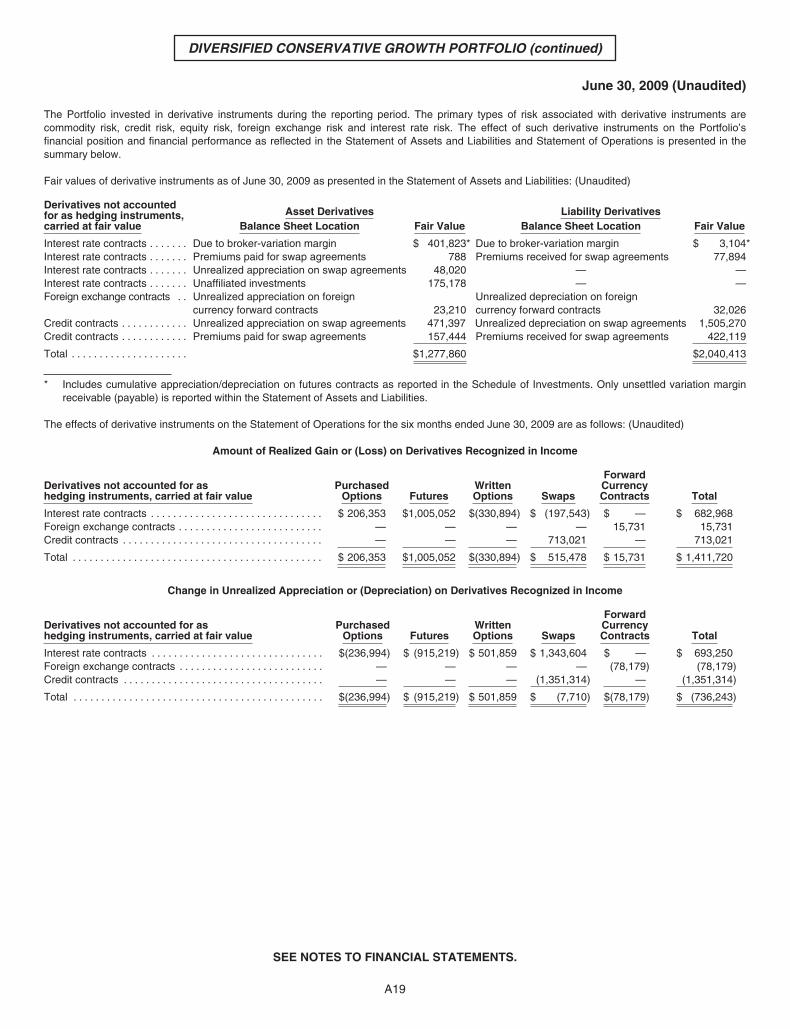
DIVERSIFIED CONSERVATIVE GROWTH PORTFOLIO (continued)
June 30, 2009 (Unaudited)
The Portfolio invested in derivative instruments during the reporting period. The primary types of risk associated with derivative instruments arecommodity risk, credit risk, equity risk, foreign exchange risk and interest rate risk. The effect of such derivative instruments on the Portfolio’sfinancial position and financial performance as reflected in the Statement of Assets and Liabilities and Statement of Operations is presented in thesummary below.
Fair values of derivative instruments as of June 30, 2009 as presented in the Statement of Assets and Liabilities: (Unaudited)
Derivatives not accountedfor as hedging instruments,carried at fair value
Asset Derivatives Liability DerivativesBalance Sheet Location Fair Value Balance Sheet Location Fair Value
Interest rate contracts . . . . . . . Due to broker-variation margin $ 401,823* Due to broker-variation margin $ 3,104*Interest rate contracts . . . . . . . Premiums paid for swap agreements 788 Premiums received for swap agreements 77,894Interest rate contracts . . . . . . . Unrealized appreciation on swap agreements 48,020 — —Interest rate contracts . . . . . . . Unaffiliated investments 175,178 — —Foreign exchange contracts . . Unrealized appreciation on foreign
currency forward contracts 23,210Unrealized depreciation on foreigncurrency forward contracts 32,026
Credit contracts . . . . . . . . . . . . Unrealized appreciation on swap agreements 471,397 Unrealized depreciation on swap agreements 1,505,270Credit contracts . . . . . . . . . . . . Premiums paid for swap agreements 157,444 Premiums received for swap agreements 422,119
Total . . . . . . . . . . . . . . . . . . . . . $1,277,860 $2,040,413
* Includes cumulative appreciation/depreciation on futures contracts as reported in the Schedule of Investments. Only unsettled variation marginreceivable (payable) is reported within the Statement of Assets and Liabilities.
The effects of derivative instruments on the Statement of Operations for the six months ended June 30, 2009 are as follows: (Unaudited)
Amount of Realized Gain or (Loss) on Derivatives Recognized in Income
Derivatives not accounted for ashedging instruments, carried at fair value
PurchasedOptions Futures
WrittenOptions Swaps
ForwardCurrencyContracts Total
Interest rate contracts . . . . . . . . . . . . . . . . . . . . . . . . . . . . . . . $ 206,353 $1,005,052 $(330,894) $ (197,543) $ — $ 682,968Foreign exchange contracts . . . . . . . . . . . . . . . . . . . . . . . . . . — — — — 15,731 15,731Credit contracts . . . . . . . . . . . . . . . . . . . . . . . . . . . . . . . . . . . . — — — 713,021 — 713,021
Total . . . . . . . . . . . . . . . . . . . . . . . . . . . . . . . . . . . . . . . . . . . . . $ 206,353 $1,005,052 $(330,894) $ 515,478 $ 15,731 $ 1,411,720
Change in Unrealized Appreciation or (Depreciation) on Derivatives Recognized in Income
Derivatives not accounted for ashedging instruments, carried at fair value
PurchasedOptions Futures
WrittenOptions Swaps
ForwardCurrencyContracts Total
Interest rate contracts . . . . . . . . . . . . . . . . . . . . . . . . . . . . . . . $(236,994) $ (915,219) $ 501,859 $ 1,343,604 $ — $ 693,250Foreign exchange contracts . . . . . . . . . . . . . . . . . . . . . . . . . . — — — — (78,179) (78,179)Credit contracts . . . . . . . . . . . . . . . . . . . . . . . . . . . . . . . . . . . . — — — (1,351,314) — (1,351,314)
Total . . . . . . . . . . . . . . . . . . . . . . . . . . . . . . . . . . . . . . . . . . . . . $(236,994) $ (915,219) $ 501,859 $ (7,710) $(78,179) $ (736,243)
SEE NOTES TO FINANCIAL STATEMENTS.
A19
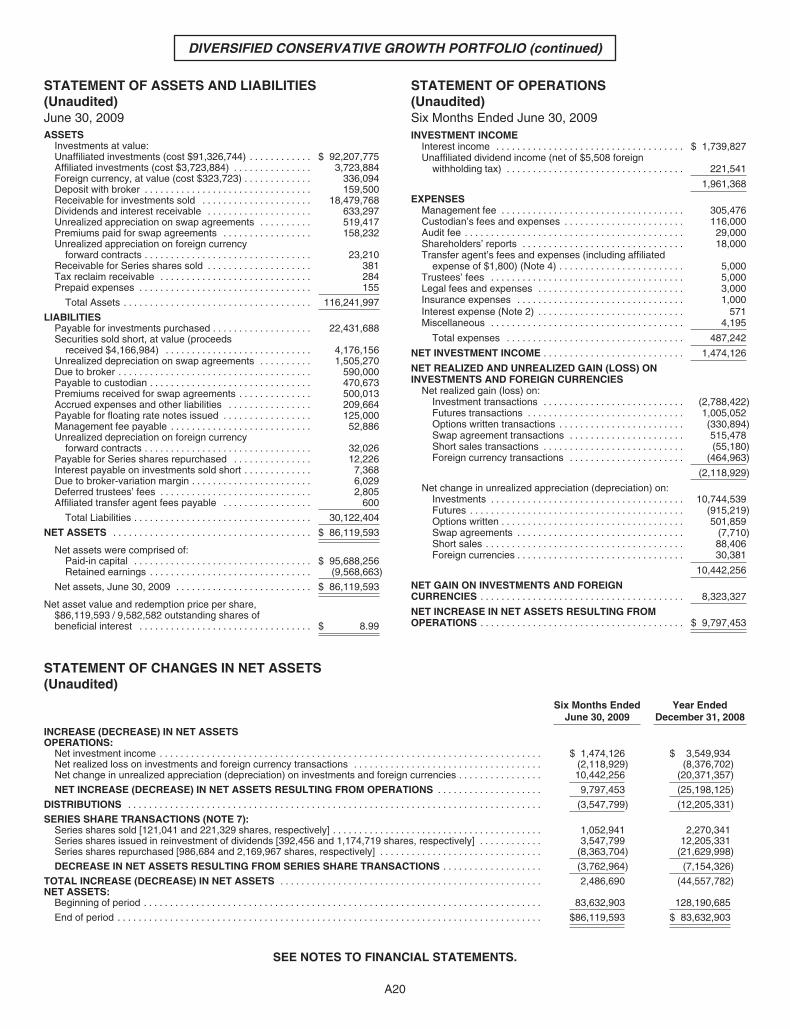
DIVERSIFIED CONSERVATIVE GROWTH PORTFOLIO (continued)
STATEMENT OF ASSETS AND LIABILITIES(Unaudited)June 30, 2009ASSETS
Investments at value:Unaffiliated investments (cost $91,326,744) . . . . . . . . . . . . $ 92,207,775Affiliated investments (cost $3,723,884) . . . . . . . . . . . . . . . 3,723,884Foreign currency, at value (cost $323,723) . . . . . . . . . . . . . 336,094Deposit with broker . . . . . . . . . . . . . . . . . . . . . . . . . . . . . . . . 159,500Receivable for investments sold . . . . . . . . . . . . . . . . . . . . . 18,479,768Dividends and interest receivable . . . . . . . . . . . . . . . . . . . . 633,297Unrealized appreciation on swap agreements . . . . . . . . . . 519,417Premiums paid for swap agreements . . . . . . . . . . . . . . . . . 158,232Unrealized appreciation on foreign currency
forward contracts . . . . . . . . . . . . . . . . . . . . . . . . . . . . . . . . 23,210Receivable for Series shares sold . . . . . . . . . . . . . . . . . . . . 381Tax reclaim receivable . . . . . . . . . . . . . . . . . . . . . . . . . . . . . 284Prepaid expenses . . . . . . . . . . . . . . . . . . . . . . . . . . . . . . . . . 155
Total Assets . . . . . . . . . . . . . . . . . . . . . . . . . . . . . . . . . . . . 116,241,997
LIABILITIESPayable for investments purchased . . . . . . . . . . . . . . . . . . . 22,431,688Securities sold short, at value (proceeds
received $4,166,984) . . . . . . . . . . . . . . . . . . . . . . . . . . . . 4,176,156Unrealized depreciation on swap agreements . . . . . . . . . . 1,505,270Due to broker . . . . . . . . . . . . . . . . . . . . . . . . . . . . . . . . . . . . . 590,000Payable to custodian . . . . . . . . . . . . . . . . . . . . . . . . . . . . . . . 470,673Premiums received for swap agreements . . . . . . . . . . . . . . 500,013Accrued expenses and other liabilities . . . . . . . . . . . . . . . . 209,664Payable for floating rate notes issued . . . . . . . . . . . . . . . . . 125,000Management fee payable . . . . . . . . . . . . . . . . . . . . . . . . . . . 52,886Unrealized depreciation on foreign currency
forward contracts . . . . . . . . . . . . . . . . . . . . . . . . . . . . . . . . 32,026Payable for Series shares repurchased . . . . . . . . . . . . . . . 12,226Interest payable on investments sold short . . . . . . . . . . . . . 7,368Due to broker-variation margin . . . . . . . . . . . . . . . . . . . . . . . 6,029Deferred trustees’ fees . . . . . . . . . . . . . . . . . . . . . . . . . . . . . 2,805Affiliated transfer agent fees payable . . . . . . . . . . . . . . . . . 600
Total Liabilities . . . . . . . . . . . . . . . . . . . . . . . . . . . . . . . . . . 30,122,404
NET ASSETS . . . . . . . . . . . . . . . . . . . . . . . . . . . . . . . . . . . . . . $ 86,119,593
Net assets were comprised of:Paid-in capital . . . . . . . . . . . . . . . . . . . . . . . . . . . . . . . . . . $ 95,688,256Retained earnings . . . . . . . . . . . . . . . . . . . . . . . . . . . . . . . (9,568,663)
Net assets, June 30, 2009 . . . . . . . . . . . . . . . . . . . . . . . . . . $ 86,119,593
Net asset value and redemption price per share,$86,119,593 / 9,582,582 outstanding shares ofbeneficial interest . . . . . . . . . . . . . . . . . . . . . . . . . . . . . . . . . $ 8.99
STATEMENT OF OPERATIONS(Unaudited)Six Months Ended June 30, 2009INVESTMENT INCOME
Interest income . . . . . . . . . . . . . . . . . . . . . . . . . . . . . . . . . . . . $ 1,739,827Unaffiliated dividend income (net of $5,508 foreign
withholding tax) . . . . . . . . . . . . . . . . . . . . . . . . . . . . . . . . . . 221,541
1,961,368
EXPENSESManagement fee . . . . . . . . . . . . . . . . . . . . . . . . . . . . . . . . . . . 305,476Custodian’s fees and expenses . . . . . . . . . . . . . . . . . . . . . . . 116,000Audit fee . . . . . . . . . . . . . . . . . . . . . . . . . . . . . . . . . . . . . . . . . . 29,000Shareholders’ reports . . . . . . . . . . . . . . . . . . . . . . . . . . . . . . . 18,000Transfer agent’s fees and expenses (including affiliated
expense of $1,800) (Note 4) . . . . . . . . . . . . . . . . . . . . . . . . 5,000Trustees’ fees . . . . . . . . . . . . . . . . . . . . . . . . . . . . . . . . . . . . . 5,000Legal fees and expenses . . . . . . . . . . . . . . . . . . . . . . . . . . . . 3,000Insurance expenses . . . . . . . . . . . . . . . . . . . . . . . . . . . . . . . . 1,000Interest expense (Note 2) . . . . . . . . . . . . . . . . . . . . . . . . . . . . 571Miscellaneous . . . . . . . . . . . . . . . . . . . . . . . . . . . . . . . . . . . . . 4,195
Total expenses . . . . . . . . . . . . . . . . . . . . . . . . . . . . . . . . . . 487,242
NET INVESTMENT INCOME . . . . . . . . . . . . . . . . . . . . . . . . . . . 1,474,126
NET REALIZED AND UNREALIZED GAIN (LOSS) ONINVESTMENTS AND FOREIGN CURRENCIES
Net realized gain (loss) on:Investment transactions . . . . . . . . . . . . . . . . . . . . . . . . . . . (2,788,422)Futures transactions . . . . . . . . . . . . . . . . . . . . . . . . . . . . . . 1,005,052Options written transactions . . . . . . . . . . . . . . . . . . . . . . . . (330,894)Swap agreement transactions . . . . . . . . . . . . . . . . . . . . . . 515,478Short sales transactions . . . . . . . . . . . . . . . . . . . . . . . . . . . (55,180)Foreign currency transactions . . . . . . . . . . . . . . . . . . . . . . (464,963)
(2,118,929)
Net change in unrealized appreciation (depreciation) on:Investments . . . . . . . . . . . . . . . . . . . . . . . . . . . . . . . . . . . . . 10,744,539Futures . . . . . . . . . . . . . . . . . . . . . . . . . . . . . . . . . . . . . . . . . (915,219)Options written . . . . . . . . . . . . . . . . . . . . . . . . . . . . . . . . . . . 501,859Swap agreements . . . . . . . . . . . . . . . . . . . . . . . . . . . . . . . . (7,710)Short sales . . . . . . . . . . . . . . . . . . . . . . . . . . . . . . . . . . . . . . 88,406Foreign currencies . . . . . . . . . . . . . . . . . . . . . . . . . . . . . . . . 30,381
10,442,256
NET GAIN ON INVESTMENTS AND FOREIGNCURRENCIES . . . . . . . . . . . . . . . . . . . . . . . . . . . . . . . . . . . . . . . 8,323,327
NET INCREASE IN NET ASSETS RESULTING FROMOPERATIONS . . . . . . . . . . . . . . . . . . . . . . . . . . . . . . . . . . . . . . . $ 9,797,453
STATEMENT OF CHANGES IN NET ASSETS(Unaudited)
Six Months EndedJune 30, 2009
Year EndedDecember 31, 2008
INCREASE (DECREASE) IN NET ASSETSOPERATIONS:
Net investment income . . . . . . . . . . . . . . . . . . . . . . . . . . . . . . . . . . . . . . . . . . . . . . . . . . . . . . . . . . . . . . . . . . . . . . . . . $ 1,474,126 $ 3,549,934Net realized loss on investments and foreign currency transactions . . . . . . . . . . . . . . . . . . . . . . . . . . . . . . . . . . . . (2,118,929) (8,376,702)Net change in unrealized appreciation (depreciation) on investments and foreign currencies . . . . . . . . . . . . . . . . 10,442,256 (20,371,357)
NET INCREASE (DECREASE) IN NET ASSETS RESULTING FROM OPERATIONS . . . . . . . . . . . . . . . . . . . . 9,797,453 (25,198,125)
DISTRIBUTIONS . . . . . . . . . . . . . . . . . . . . . . . . . . . . . . . . . . . . . . . . . . . . . . . . . . . . . . . . . . . . . . . . . . . . . . . . . . . . . . . (3,547,799) (12,205,331)
SERIES SHARE TRANSACTIONS (NOTE 7):Series shares sold [121,041 and 221,329 shares, respectively] . . . . . . . . . . . . . . . . . . . . . . . . . . . . . . . . . . . . . . . . 1,052,941 2,270,341Series shares issued in reinvestment of dividends [392,456 and 1,174,719 shares, respectively] . . . . . . . . . . . . 3,547,799 12,205,331Series shares repurchased [986,684 and 2,169,967 shares, respectively] . . . . . . . . . . . . . . . . . . . . . . . . . . . . . . . (8,363,704) (21,629,998)
DECREASE IN NET ASSETS RESULTING FROM SERIES SHARE TRANSACTIONS . . . . . . . . . . . . . . . . . . . (3,762,964) (7,154,326)
TOTAL INCREASE (DECREASE) IN NET ASSETS . . . . . . . . . . . . . . . . . . . . . . . . . . . . . . . . . . . . . . . . . . . . . . . . . . 2,486,690 (44,557,782)NET ASSETS:
Beginning of period . . . . . . . . . . . . . . . . . . . . . . . . . . . . . . . . . . . . . . . . . . . . . . . . . . . . . . . . . . . . . . . . . . . . . . . . . . . . 83,632,903 128,190,685
End of period . . . . . . . . . . . . . . . . . . . . . . . . . . . . . . . . . . . . . . . . . . . . . . . . . . . . . . . . . . . . . . . . . . . . . . . . . . . . . . . . . $86,119,593 $ 83,632,903
SEE NOTES TO FINANCIAL STATEMENTS.
A20
NOTES TO THE FINANCIAL STATEMENTS OFTHE PRUDENTIAL SERIES FUND
Note 1: General
The Prudential Series Fund (“Series Fund”), organized as a Delaware statutory trust, is a diversified open-endmanagement investment company registered under the Investment Company Act of 1940, as amended. OnJanuary 2, 2006, each Portfolio of the Series Fund changed its federal income tax status from a regulatedinvestment company to a partnership. As a result of that conversion, the Series Fund was reorganized from aMaryland corporation to a Delaware statutory trust. Pursuant to this reorganization, the Fund has beenrenamed “The Prudential Series Fund.” The Series Fund is composed of twenty-eight Portfolios (“Portfolio” or“Portfolios”), each with a separate series shares. The information presented in these financial statementspertains to Diversified Conservative Growth Portfolio.
The Portfolio has the following as investment objectives:
Current income and a reasonable level of capital appreciation by investing primarily in a diversified portfolio ofdebt and equity securities.
The ability of issuers of debt securities (other than those issued or guaranteed by the U.S. Government) heldby the Portfolio to meet their obligations may be affected by the economic or political developments in aspecific industry, region or country.
Foreign security and currency transactions may involve certain considerations and risks not typicallyassociated with those of domestic origin as a result of, among other factors, the possibility of political andeconomic instability or the level of government supervision and regulation of foreign securities markets.
Note 2: Accounting Policies
The following is a summary of significant accounting policies followed by the Series Fund and the Portfolio inpreparation of their financial statements.
Securities Valuation: Securities listed on a securities exchange are valued at the last sale price on suchexchange on the day of valuation or, if there was no sale on such day, at the mean between the last reportedbid and asked prices, or at the last bid price on such day in the absence of an asked price. Securities tradedvia NASDAQ are valued at the NASDAQ official closing price (“NOCP”) on the day of valuation, or if there wasno NOCP, at the last sale price. Securities that are actively traded in the over-the-counter market, includinglisted securities for which the primary market is believed by Prudential Investments LLC (“PI” or “Manager”) inconsultation with the subadviser, to be over-the-counter, are valued at market value using prices provided byan independent pricing agent or principal market maker. Options on securities and indices traded on anexchange are valued at the last sale price as of the close of trading on the applicable exchange or, if therewas no sale, at the mean between the most recently quoted bid and asked prices on such exchange, or at thelast bid price in the absence of an asked price. Futures contracts and options thereon traded on acommodities exchange or board of trade are valued at the last sale price at the close of trading on suchexchange or board of trade or, if there was no sale on the applicable commodities exchange or board of tradeon such day, at the mean between the most recently quoted bid and asked prices on such exchange or boardof trade or at the last bid price in the absence of an asked price. Prices may be obtained from independentpricing services which use information provided by market makers or estimates of market values obtainedfrom yield data relating to investments or securities with similar characteristics. Securities for which reliablemarket quotations are not readily available, or whose values have been affected by events occurring after theclose of the security’s foreign market and before the Series Fund’s normal pricing time, are valued at fair valuein accordance with Board of Trustees approved fair valuation procedures. When determining the fair valuationof securities some of the factors influencing the valuation include, the nature of any restrictions on dispositionof the securities; assessment of the general liquidity of the securities; the issuer’s financial condition and themarkets in which it does business; the cost of the investment; the size of the holding and the capitalization ofthe issuer; the prices of any recent transactions or bids/offers for such securities of any comparable securities;any available analyst media or other reports or information deemed reliable by the investment adviserregarding the issuer or the markets or industry in which it operates. Using fair value to price securities mayresult in a value that is different from a security’s most recent closing price and from the price used by othermutual funds to calculate their net asset values.
Investments in mutual funds are valued at their net asset value as of the close of the New York StockExchange on the date of valuation.
B1
Short-term securities that are held in the Portfolio which mature in more than 60 days are valued at currentmarket quotations and those short-term securities which mature in 60 days or less are valued at amortizedcost which approximates market value. The amortized cost method values a security at its cost at the time ofpurchase and there after assumes a constant amortization to maturity of any discount or premium.
Repurchase Agreements: In connection with transactions in repurchase agreements with United Statesfinancial institutions, it is the Series Fund’s policy that its custodian or designated subcustodians, as the casemay be, under triparty repurchase agreements, take possession of the underlying collateral securities, thevalue of which exceeds the principal amount of the repurchase transaction, including accrued interest. To theextent that any repurchase transaction exceeds one business day, the value of the collateral is marked tomarket on a daily basis to ensure the adequacy of the collateral. If the seller defaults or the value of thecollateral declines, or if bankruptcy proceedings are commenced with respect to the seller of the security,realization of the collateral by the Series Fund may by delayed or limited.
Foreign Currency Translation: The books and records of the Series Fund are maintained in U.S. dollars.Foreign currency amounts are translated into U.S. dollars on the following basis:
(i) market value of investment securities, other assets and liabilities—at the current daily rates of exchange.
(ii) purchases and sales of investment securities, income and expenses—at the rates of exchange prevailingon the respective dates of such transactions.
Although the net assets of the Series Fund are presented at the foreign exchange rates and market values atthe close of the year, the Series Fund does not isolate that portion of the results of operations arising as aresult of changes in the foreign exchange rates from the fluctuations arising from changes in the market pricesof securities held at the end of the period. Similarly, the Series Fund does not isolate the effect of changes inforeign exchange rates from the fluctuations arising from changes in the market prices of portfolio securitiessold during the period. Accordingly, these realized foreign currency gains (losses) are included in the reportednet realized gains (losses) on investment transactions.
Net realized gains (losses) on foreign currency transactions represent net foreign exchange gains (losses)from the holding of foreign currencies, currency gains (losses) realized between the trade date and settlementdate on securities transactions, and the difference between the amounts of dividends, interest and foreignwithholding taxes recorded on the Series Fund’s books and the U.S. dollar equivalent amounts actuallyreceived or paid. Net unrealized currency gains (losses) from valuing foreign currency denominated assetsand liabilities (other than investments) at period end exchange rates are reflected as a component of netunrealized appreciation (depreciation) on investments and foreign currencies.
Forward Currency Contracts: A forward currency contract is a commitment to purchase or sell a foreigncurrency at a future date at a negotiated forward rate between two parties. Certain Portfolios of the SeriesFund may enter into forward currency contracts in order to hedge their exposure to changes in foreigncurrency exchange rates on their foreign portfolio holdings or specific receivables and payables denominatedin a foreign currency. The contracts are valued daily at current exchange rates and any unrealized gain or lossis included in net unrealized appreciation or depreciation on foreign currencies. Gain or loss is realized on thesettlement date of the contract equal to the difference between the settlement value of the original andrenegotiated forward contracts. This gain or loss, if any, is included in net realized gain (loss) on foreigncurrency transactions. Risks may arise upon entering into these contracts from the potential inability of thecounterparties to meet the terms of their contracts. Forward currency contracts involve risks from currencyexchange rate and credit risk in excess of the amounts reflected on the Statement of Assets and Liabilities.The Portfolio’s maximum risk of loss from counterparty credit risk is the net value of the cash flows to bereceived from the counterparty at the end of the contract’s life. This risk may be mitigated by having a masternetting arrangement between the Portfolio and the counterparty which may permit the Portfolio to offsetamounts payable by the Portfolio to the same counterparty against amounts to be received; and by the receiptof collateral from the counterparty by the Portfolio to cover the Portfolio’s exposure to the counterparty.However, there is no assurance that such mitigating factors are easily enforceable.
Floating-Rate Notes Issued in Conjunction with Securities Held: The Portfolio invests in inverse floating ratesecurities (“inverse floaters”) that pay interest at a rate that varies inversely with short-term interest rates.Certain of these securities may be leveraged, whereby the interest rate varies inversely at a multiple of thechange in short-term rates. As interest rates rise, inverse floaters provide less current income. The price ofsuch securities is more volatile than comparable fixed rate securities.
B2
When the Portfolio enters into agreements to create inverse floaters and floater note securities (also known asTender Option Bond Transactions), the Portfolio transfers a fixed rate bond to a broker for cash. At the sametime the Portfolio buys (receives) a residual interest in a trust (the “trust”) set up by the broker, often referredto as an inverse floating rate obligation (inverse floaters). Generally, the broker deposits a fixed rate bond (the“fixed rate bond”) into the trust with the same CUSIP number as the fixed rate bond sold to the broker by thePortfolio. The trust also issues floating rate notes (“floating rate notes”) which sold to third parties. The floatingrate notes have interest rates that reset weekly. The inverse floater held by the Portfolio gives the Portfolio theright (1) to cause the holders of the floating rate notes to tender their notes at par, and (2) to have the brokertransfer the fixed rate bond held by the trust to the Portfolio thereby collapsing the trust. In accordance withFAS Statement No. 140, the Portfolio’s account for the transaction described above as funded leverage byincluding the fixed rate bond in its Portfolio of Investments, and accounts for the floating rate notes asa liability under the caption “payable for floating rate notes issued” in the Portfolio’s “Statement of Assetsand Liabilities.”
The Portfolio’s investment policies and restrictions permit investments in inverse floating rate securities.Inverse floaters held by the Portfolio are securities exempt from registration under Rules 144A of theSecurities Act of 1933.
Short Sales: The Portfolios may sell a security it does not own in anticipation of a decline in the market valueof that security (short sale). When a Portfolio makes a short sale, it must borrow the security sold short anddeliver it to the broker-dealer through which it made the short sale as collateral for its obligation to deliver thesecurity upon conclusion of the transaction. The Portfolio may have to pay a fee to borrow the particularsecurity and may be obligated to remit any interest or dividends received on such borrowed securities.Dividends declared on short positions open on record date are recorded on the ex-date as an expense. Again, limited to the price at which the Portfolio sold the security short, or a loss, unlimited in magnitude, will berecognized upon the termination of a short sale if the market price at termination is less than or greater than,respectively, the proceeds originally received.
Options: The Portfolio may either purchase or write options in order to hedge against adverse marketmovements or fluctuations in value caused by changes in prevailing interest rates or foreign currencyexchange rates or currencies with respect to securities which the Portfolio currently owns or intends topurchase. The Portfolio’s principal reason for writing options is to realize, through receipt of premiums, agreater current return than would be realized on the underlying security alone. When the Portfolio purchasesan option, it pays a premium and an amount equal to that premium is recorded as an asset. When thePortfolio writes an option, it receives a premium and an amount equal to that premium is recorded as aliability. The asset or liability is adjusted daily to reflect the current market value of the option. If an optionexpires unexercised, the Portfolio realizes a gain (loss) to the extent of the premium received or paid. If anoption is exercised, the premium received or paid is recorded as an adjustment to the proceeds from the saleor the cost basis of the purchase in determining whether the Portfolio has realized a gain (loss). Thedifference between the premium and the amount received or paid on effecting a closing purchase or saletransaction is also treated as a realized gain (loss). Gains (losses) on purchased options are included in netrealized gains (losses) on investment transactions. Gains (losses) on written options are presented separatelyas net realized gains (losses) on written option transactions. The Portfolio, as writer of an option, may have nocontrol over whether the contract may be exercised. As a result, the Portfolio bears the market risk of anunfavorable change in the price of the security underlying the written option. The Portfolio, as purchaser of anoption, bears the risk of the potential inability of the counterparties to meet the terms of their contracts. Withexchange-traded futures and options contracts, there is minimal counterparty credit risk to the Portfolio sincethe exchanges’ Clearinghouse acts as counterparty to all exchange-traded futures and options andguarantees the futures and options contracts against default.
Financial Futures Contracts: A financial futures contract is an agreement to purchase (long) or sell (short) anagreed amount of securities at a set price for delivery on a future date. Upon entering into a financial futurescontract, the Portfolio is required to pledge to the broker an amount of cash and/or other assets equal to acertain percentage of the contract amount. This amount is known as the “initial margin”. Subsequentpayments, known as “variation margin”, are made or received by the Portfolio each day, depending on thedaily fluctuations in the value of the underlying security. Such variation margin is recorded for financialstatement purposes on a daily basis as unrealized gain (loss). When the contract expires or is closed, the gain(loss) is realized and is presented in the Statement of Operations as net realized gain (loss) on financialfutures contracts.
B3
The Portfolio invests in financial futures contracts in order to hedge its existing portfolio securities, or securitiesthe Portfolio intends to purchase, against fluctuations in value caused by changes in prevailing rates or marketconditions. Under a variety of circumstances, the Portfolio may not achieve the anticipated benefits of thefinancial futures contracts and may realize a loss. The use of futures transactions involves the risk of imperfectcorrelation in movements in the price of futures contracts and the underlying hedged assets.
Swap Agreements: The Portfolio may enter into credit default, interest rate, total return and other forms ofswap agreements. A swap agreement is an agreement to exchange the return generated by one instrumentfor the return generated by another instrument. The swap agreements are valued daily at current market valueand any change in value is included in the net unrealized appreciation or depreciation on investments.Payments received or paid by the Portfolio are recorded as realized gains or losses upon termination ormaturity of the swap. Risk of loss may exceed amounts recognized on the statements of assets and liabilities.Swap agreements outstanding at period end, if any, are listed on the Schedule of Investments.
Interest rate swaps: Interest rate swaps represent an agreement between counterparties to exchange cashflows based on the difference between two interest rates, applied to a notional principal amount for a specifiedperiod. The Portfolio is subject to interest rate risk exposure in the normal course of pursuing its investmentobjectives. The Portfolio may use interest rate swaps to either maintain its ability to generate steady cash flowby receiving a stream of fixed rate payments or to increase exposure to prevailing market rates by receivingfloating rate payments using interest rate swap contracts. The Portfolio’s maximum risk of loss fromcounterparty credit risk is the discounted net value of the cash flows to be received from the counterparty overthe contract’s remaining life. This risk may be mitigated by having a master netting arrangement between thePortfolio and the counterparty which may permit the Portfolio to offset amounts payable by the Portfolio to thesame counterparty against amounts to be received; and by the receipt of collateral from the counterparty bythe Portfolio to cover the Portfolio’s exposure to the counterparty. However, there is no assurance that suchmitigating factors are easily enforceable.
Credit Default Swaps: Credit default swaps involve one party (the protection buyer) making a stream ofpayments to another party (the protection seller) in exchange for the right to receive a specified payment inthe event of a default or as a result of a default (“credit event”) for the referenced party, typically corporateissues or sovereign issues of an emerging country, on its obligation; or in the event of a write-down, principalshortfall, interest shortfall or default of all or part of the referenced entities comprising a credit index.
The Portfolio is subject to credit risk in the normal course of pursuing its investment objectives. A Portfoliomay use credit default swaps to provide a measure of protection against defaults of the issuers or to take anactive long or short position with respect to the likelihood of a particular issuer’s default. A Portfolio may usecredit default swaps on credit indices to hedge a portfolio of credit default swaps or bonds, which is lessexpensive than it would be to buy many credit default swaps to achieve a similar effect. The Portfolio’smaximum risk of loss from counterparty credit risk for purchased credit default swaps is the notional value of acredit default swap agreement. This risk may be mitigated by having a master netting arrangement betweenthe Portfolio and the counterparty which may permit the Portfolio to offset amounts payable by the Portfolio tothe same counterparty against amounts to be received; and by the receipt of collateral from the counterpartyby the Portfolio to cover the Portfolio’s exposure to the counterparty. However, there is no assurance thatsuch mitigating factors are easily enforceable.
As a seller of protection on a credit default swap agreement, a Portfolio will generally receive from the buyer ofprotection an agreed upon payment throughout the terms of the swap provided that there is no credit event.As a seller, a Portfolio would effectively increase investment risk to its portfolio because, in addition to its totalnet assets, a Portfolio may be subject to investment exposure on the notional amount of the swap.
The maximum amount of the payment that a Portfolio as a seller of protection could be required to makeunder a credit default swap agreement would be equal the notional amount of the underlying security or indexcontract as a result of a credit event. These potential amounts will be partially offset by any recovery values ofthe respective referenced obligations, or net amounts received from the settlement of buy protection creditdefault swap agreements entered into by the Portfolio for the same referenced entity or index. As a buyer ofprotection, the Portfolio generally receives an amount up to the notional value of the swap if a creditevent occurs.
Implied credit spreads, represented in absolute terms, utilized in determining the market value of credit defaultswap agreements on corporate issues or sovereign issues of an emerging country as of period end are
B4
disclosed in the footnotes to the Schedules of Investments and serve as an indicator of the current status ofthe payment/performance risk and represent the likelihood or risk of default for the credit derivative. Theimplied credit spread of a particular referenced entity reflects the cost of buying/selling protection and mayinclude upfront payments required to enter into the agreement. For credit default swap agreements on asset-backed securities and credit indices, the fair value serve as the indicator of the current status of the payment/performance risk. Wider credit spreads and increasing market value in absolute terms, when comparing to thenotional amount of the swap, represent a deterioration of the referenced entity’s credit soundness and agreater likelihood or risk of default or other credit event occurring as defined under the terms ofthe agreement.
Total Return Swap: In a total return swap, one party would receive payments based on the market value ofthe security or the commodity involved, or total return of a specific referenced asset, such as an equity, index orbond, and in return pay a fixed amount. The Portfolio is subject to risk exposures associated with thereferenced asset in the normal course of pursuing its investment objectives. A Portfolio may enter into totalreturn swaps to manage their exposure to a security or an index. The Portfolio’s maximum risk of loss fromcounterparty credit risk is the change in the value of the security, in favor of the Portfolio, from the point ofentering into the contract. This risk may be mitigated by having a master netting arrangement between thePortfolio and the counterparty which may permit the Portfolio to offset amounts payable by the Portfolio to thesame counterparty against amounts to be received; and by the receipt of collateral from the counterparty by thePortfolio to cover the Portfolio’s exposure to the counterparty. However, there is no assurance that suchmitigating factors are easily enforceable.
In addition to each instrument’s primary underlying risk exposure (e.g. interest rate, credit, equity or foreignexchange, etc.), swap agreements involve, to varying degrees, elements of credit, market and documentationrisk. Such risks involve the possibility that there will be no liquid market for these agreements, that thecounterparty to the agreement may default on its obligation to perform or disagree as to the meaning of thecontractual terms in the agreement, and that there will be unfavorable changes in net interest rates. Inconnection with these agreements, securities in the portfolio may be identified as collateral or received ascollateral from the counterparty in accordance with the terms of the respective swap agreements to provide orreceive assets of value and serve as recourse in the event of default or bankruptcy/insolvency of either party.Such over-the-counter derivative agreements include conditions which when materialized, give thecounterparty the right to cause an early termination of the transactions under those agreements. Any electionby the counterparty for early termination of the contract(s) may impact the amounts reported onfinancial statements.
As June 30, 2009, the Portfolio has not met conditions under such agreements, which give the counterpartythe right to call for an early termination.
Forward currency contracts, written options, short sales, swaps and financial futures contracts involveelements of both market and credit risk in excess of the amounts reflected on the Statement of Assetsand Liabilities.
Warrants and Rights: Certain Portfolios of the Series Fund may hold warrants and rights acquired eitherthrough a direct purchase, including as part of private placement, or pursuant to corporate actions. Warrantsand rights entitle the holder to buy a proportionate amount of common stock at a specific price and timethrough the expiration dates. Such warrants and rights are held as long positions by the Portfolio untilexercised, sold or expired. Warrants and rights are valued at fair value in accordance with the Board ofTrustees’ approved fair valuation procedures.
Securities Lending: The Portfolio may lend its portfolio securities to broker-dealers. The loans are secured bycollateral at least equal at all times to the market value of the securities loaned. Loans are subject totermination at the option of the borrower or the Portfolio. Upon termination of the loan, the borrower will returnto the lender securities identical to the loaned securities. Should the borrower of the securities fail financially,the Portfolio has the right to repurchase the securities using the collateral in the open market. The Portfoliorecognizes income, net of any rebate and securities lending agent fees, for lending its securities in the form offees or interest on the investment of any cash received as collateral. The Portfolio also continues to receiveinterest and dividends or amounts equivalent thereto on the securities loaned and recognizes any unrealizedgain or loss in the market price of the securities loaned that may occur during the term of the loan.
B5
When-Issued/Delayed Delivery Securities: Securities purchased or sold on a when-issued or delayeddelivery basis may be settled a month or more after trade date; interest income is not accrued until settlementdate. At the time a Portfolio enters into such transactions, it instructs the custodian to segregate assets with acurrent value at least equal to the amount of its when-issued or delayed-delivery purchase commitments.
Securities Transactions and Net Investment Income: Securities transactions are recorded on the trade date.Realized gains (losses) on sales of securities are calculated on the identified cost basis. Dividend income isrecorded on the ex-dividend date; interest income, which is comprised of four elements: stated coupon,original issue discount, market discount and market premium, is recorded on the accrual basis. Expenses arerecorded on the accrual basis. The Series Fund’s expenses are allocated to the respective Portfolios on thebasis of relative net assets except for Portfolio specific expenses which are attributable directly to a Portfolioor class level.
Taxes: For federal income tax purposes, the Portfolio is treated as a partnership. No provision has beenmade in the financial statements for U.S. Federal, state, or local taxes, as any tax liability arising fromoperations of the Portfolio is the responsibility of its partners. The Portfolio is not subject to tax. Partners ofeach Portfolio are subject to taxes on their distributive share of partnership items.
Withholding taxes on foreign dividends, interest and capital gains have been provided for in accordance withthe Series Fund’s understanding of the applicable country’s tax rules and regulations.
Distributions: Distributions from the Portfolio are made in cash and automatically reinvested in additionalshares of the Portfolio. The Portfolio makes distributions, if any, at least annually. Distributions are recordedon the ex-dividend date.
Estimates: The preparation of financial statements requires management to make estimates andassumptions that affect the reported amounts and disclosures in the financial statements. Actual results coulddiffer from these estimates.
Note 3: Agreements
The Series Fund has a management agreement with PI. Pursuant to this agreement PI has responsibility forall investment advisory services and supervises the subadvisers’ performance of such services. PI hasentered into subadvisory agreements with Prudential Investment Management, Inc. (“PIM”), JennisonAssociates LLC (“Jennison”), Eagle Asset Management (“Eagle”), Pacific Investment Management CompanyLLC (“PIMCO”) and EARNEST Partners LLC (“EARNEST”) an Quantitative Management Associates LLC(“QMA”) (collectively, the “Subadvisers”), under which each provides investment advisory services for certainPortfolios of the Series Fund. PI pays for the services of the Subadvisers, compensation of officers of theSeries Fund, occupancy and certain clerical and administrative expenses of the Series Fund. The Portfoliobears all other costs and expenses.
The management fee paid to PI is computed daily and payable monthly, at the annual rate of .75 of 1% of thePortfolio’s average daily net assets.
The Series Fund has a distribution agreement with Prudential Investment Management Services LLC (“PIMS”)which acts as the distributor of the Class I and Class II of the Series Fund. The Series Fund compensatesPIMS for distributing and servicing the Series Fund’s Class II shares pursuant to a plan of distribution (the“Class II Plan”), regardless of expenses actually incurred by PIMS. The distribution fees are accrued daily andpayable monthly. No distribution or service fees are paid to PIMS as distributor of the Class I shares of theSeries Fund.
PIMS, PI, PIM, QMA and Jennison are indirect, wholly-owned subsidiaries of Prudential Financial,Inc. (“Prudential”).
Note 4: Other Transactions with Affiliates
Prudential Mutual Fund Services LLC (“PMFS”), an affiliate of PI and an indirect, wholly-owned subsidiary ofPrudential, serves as the Series Fund’s transfer agent. Transfer agent fees and expenses in the Statements ofOperations include certain out-of-pocket expenses paid to non-affiliates, where applicable.
B6
For the period ended June 30, 2009, Wachovia Securities LLC, an affiliate of PI, earned brokeragecommissions from transactions executed on behalf of the Diversified Conservative Growth Portfolio was $55.
The Portfolio invests in the Taxable Money Market Series (the “Series”), a portfolio of the Dryden CoreInvestment Fund registered under the Investment Company Act of 1940, as amended, and managed by PI.
Note 5: Portfolio Securities
Purchases and sales of portfolio securities (excluding government securities and short-term issues) for theperiod ended June 30, 2009 were $140,358,381 and $164,647,754 respectively.
The Portfolio’s written options activity for the period ended June 30, 2009 was as follows:
Number ofContracts/
Swap NotionalAmount $ Premium
Balance at beginning of period . . . . . . . . . . . . . . . . . . . . . . . . . . . . . . . . . . 6,700,000 $ 203,446Written options . . . . . . . . . . . . . . . . . . . . . . . . . . . . . . . . . . . . . . . . . . . . . . . — —Expired options . . . . . . . . . . . . . . . . . . . . . . . . . . . . . . . . . . . . . . . . . . . . . . . (1,000,000) (7,156)Exercised options . . . . . . . . . . . . . . . . . . . . . . . . . . . . . . . . . . . . . . . . . . . . . — —Closed options . . . . . . . . . . . . . . . . . . . . . . . . . . . . . . . . . . . . . . . . . . . . . . . (5,700,000) (196,290)
Balance at end of period . . . . . . . . . . . . . . . . . . . . . . . . . . . . . . . . . . . . . . . — $ —
Note 6: Tax Information
After January 2, 2006, all Portfolios are treated as partnerships for tax purposes. The character of the cashdistributions made by the partnerships is generally classified as return of capital nontaxable distributions. Aftereach fiscal year each partner will receive information regarding their distributive allocable share of thepartnership’s income, gains, losses and deductions.
Prior to January 2, 2006, each Portfolio, which was incorporated as of that date, qualified as a regulatedinvestment company under the Internal Revenue Code and distributed all of its taxable income including anyrealized gains on investments, to shareholders.
With respect to the Portfolios, book cost of assets differs from tax cost of assets as a result of each Portfolio’sadoption of a mark to market method of accounting for tax purposes. Under this method, tax cost of assets willapproximate its fair market value.
Management has analyzed the Portfolios’ tax positions taken on federal income tax returns for all open taxyears and has concluded that as of June 30, 2009, no provision for income tax would be required in thePortfolios’ financial statements. The Portfolios’ federal and state income tax returns for tax years for which theapplicable statues of limitations have not expired are subject to examination by the Internal Revenue Serviceand state departments of revenue.
Note 7: Capital
The Series Fund offers Class I and Class II shares. Neither Class I nor Class II shares of a Portfolio aresubject to any sales charge or redemption charge and are sold at the net asset value of the Portfolio. Class Ishares are sold only to certain separate accounts of Prudential to fund benefits under certain variable lifeinsurance and variable annuity contracts (“contracts”). Class II shares are sold only to separate accounts ofnon-Prudential insurance companies as investment options under certain contracts. The separate accountsinvest in shares of the Series Fund through subaccounts that correspond to the Portfolio. The separateaccounts will redeem shares of the Series Fund to the extent necessary to provide benefits under thecontracts or for such other purpose as may be consistent with the contracts.
Note 8: Borrowings
The Portfolio, along with other affiliated registered investment companies (the “Funds”), are a party to asyndicated credit agreement (“SCA”) with two banks. The SCA provides for a commitment of $500 million.
B7
Interest on any borrowings under the SCA would be incurred at market rates and a commitment fee for theunused amount is accrued daily and paid quarterly. Effective October 24, 2008, the Funds renewed the SCAwith banks. The commitment under the renewed SCA continues to be $500 million. The Funds pay acommitment fee of .13 of 1% of the unused portion of the renewed SCA. The expiration date of the renewedSCA will be October 23, 2009. The purpose of the SCA is to provide an alternative source of temporaryfunding for capital share redemptions.
During the period ended June 30, 2009, the Portfolio did not utilize the line of credit.
Note 9: Ownership and Affiliates
As of June 30, 2009, all of Class I shares of the Portfolio were owned of record by the Prudential InsuranceCompany of America (“PICA”) on behalf of the owners of the variable insurance products issued by PICA.
Note 10: Subsequent Events
Management has evaluated the impact of all subsequent events on the Portfolio through August 24, 2009, thedate the financial statements were issued, and has determined that the following subsequent events requirerecognition or disclosure in the financial statements:
Based on the approval of the Board of Trustees on June 26, 2009, the Diversified Conservative GrowthPortfolio will be merged into the Advanced Series Trust—AST Preservation Asset Allocation Portfolio on orabout November 20, 2009. Such merger is subject to the approval of the shareholders.
B8
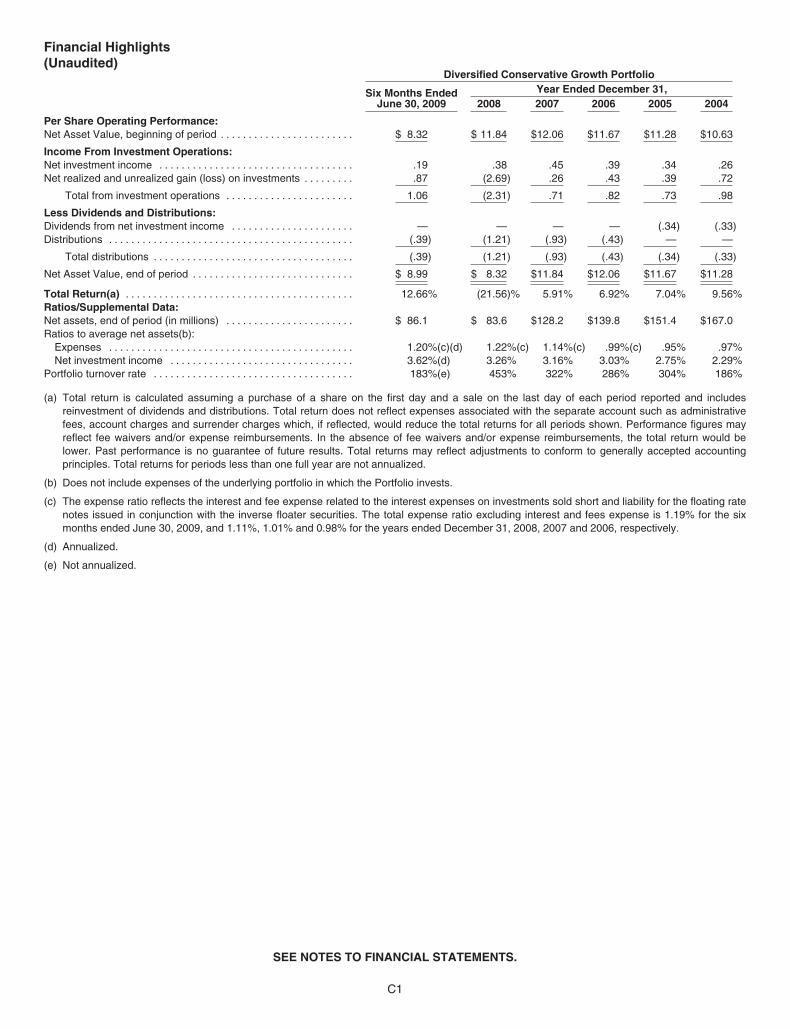
Financial Highlights(Unaudited)
Diversified Conservative Growth Portfolio
Six Months EndedJune 30, 2009
Year Ended December 31,2008 2007 2006 2005 2004
Per Share Operating Performance:Net Asset Value, beginning of period . . . . . . . . . . . . . . . . . . . . . . . . $ 8.32 $ 11.84 $12.06 $11.67 $11.28 $10.63
Income From Investment Operations:Net investment income . . . . . . . . . . . . . . . . . . . . . . . . . . . . . . . . . . . .19 .38 .45 .39 .34 .26Net realized and unrealized gain (loss) on investments . . . . . . . . . .87 (2.69) .26 .43 .39 .72
Total from investment operations . . . . . . . . . . . . . . . . . . . . . . . 1.06 (2.31) .71 .82 .73 .98
Less Dividends and Distributions:Dividends from net investment income . . . . . . . . . . . . . . . . . . . . . . — — — — (.34) (.33)Distributions . . . . . . . . . . . . . . . . . . . . . . . . . . . . . . . . . . . . . . . . . . . . (.39) (1.21) (.93) (.43) — —
Total distributions . . . . . . . . . . . . . . . . . . . . . . . . . . . . . . . . . . . . (.39) (1.21) (.93) (.43) (.34) (.33)
Net Asset Value, end of period . . . . . . . . . . . . . . . . . . . . . . . . . . . . . $ 8.99 $ 8.32 $11.84 $12.06 $11.67 $11.28
Total Return(a) . . . . . . . . . . . . . . . . . . . . . . . . . . . . . . . . . . . . . . . . . 12.66% (21.56)% 5.91% 6.92% 7.04% 9.56%Ratios/Supplemental Data:Net assets, end of period (in millions) . . . . . . . . . . . . . . . . . . . . . . . $ 86.1 $ 83.6 $128.2 $139.8 $151.4 $167.0Ratios to average net assets(b):
Expenses . . . . . . . . . . . . . . . . . . . . . . . . . . . . . . . . . . . . . . . . . . . . 1.20%(c)(d) 1.22%(c) 1.14%(c) .99%(c) .95% .97%Net investment income . . . . . . . . . . . . . . . . . . . . . . . . . . . . . . . . . 3.62%(d) 3.26% 3.16% 3.03% 2.75% 2.29%
Portfolio turnover rate . . . . . . . . . . . . . . . . . . . . . . . . . . . . . . . . . . . . 183%(e) 453% 322% 286% 304% 186%
(a) Total return is calculated assuming a purchase of a share on the first day and a sale on the last day of each period reported and includesreinvestment of dividends and distributions. Total return does not reflect expenses associated with the separate account such as administrativefees, account charges and surrender charges which, if reflected, would reduce the total returns for all periods shown. Performance figures mayreflect fee waivers and/or expense reimbursements. In the absence of fee waivers and/or expense reimbursements, the total return would belower. Past performance is no guarantee of future results. Total returns may reflect adjustments to conform to generally accepted accountingprinciples. Total returns for periods less than one full year are not annualized.
(b) Does not include expenses of the underlying portfolio in which the Portfolio invests.
(c) The expense ratio reflects the interest and fee expense related to the interest expenses on investments sold short and liability for the floating ratenotes issued in conjunction with the inverse floater securities. The total expense ratio excluding interest and fees expense is 1.19% for the sixmonths ended June 30, 2009, and 1.11%, 1.01% and 0.98% for the years ended December 31, 2008, 2007 and 2006, respectively.
(d) Annualized.
(e) Not annualized.
SEE NOTES TO FINANCIAL STATEMENTS.
C1
[THIS PAGE INTENTIONALLY LEFT BLANK]
The Prudential Series Fund
Diversified Conservative Growth Portfolio
Approval of Advisory Agreements The Trust’s Board of Trustees The Board of Trustees (the “Board”) of The Prudential Series Fund (the “Trust”) consists of seven individuals, six of whom are not “interested persons” of the Trust, as defined in the Investment Company Act of 1940, as amended (the “1940 Act”) (the “Independent Trustees”). The Board is responsible for the oversight of the Trust and each of its Portfolios, its operations, and performs the various duties imposed on the directors of investment companies by the 1940 Act. The Independent Trustees have retained independent legal counsel to assist them in connection with their duties. The Chair of the Board is an Independent Trustee. The Board has established three standing committees: the Audit Committee, the Governance Committee, and the Compliance Committee. Each committee is chaired by, and composed of, Independent Trustees. Annual Approval of the Trust’s Advisory Agreements As required under the 1940 Act, the Board determines annually whether to renew the Trust’s management agreement with Prudential Investments LLC (“PI”) and the Diversified Conservative Growth Portfolio’s subadvisory agreements. As is further discussed and explained below, in considering the renewal of the agreements, the Board, including all of the Independent Trustees, met on June 24-26, 2009 and approved the renewal of the agreements through July 31, 2010, after concluding that renewal of the agreements was in the best interests of the Trust, and the Diversified Conservative Growth Portfolio (the “Portfolio”) and its shareholders. With respect to the Portfolio, the Board noted that its renewal of the agreements was intended to be interim in nature, because the Board approved at the same meetings submitting to shareholders a proposal to reorganize (merge) the Portfolio into the AST Preservation Asset Allocation Portfolio of the Advanced Series Trust. In advance of the meetings, the Trustees requested and received materials relating to the agreements, and the Trustees had the opportunity to ask questions and request further information in connection with their consideration of those agreements. In approving the agreements, the Trustees, including the Independent Trustees advised by independent legal counsel, considered the factors they deemed relevant, including the nature, quality and extent of services provided, the performance of the Portfolio, the profitability of PI and its affiliates, expenses and fees, and the potential for economies of scale that may be shared with the Portfolio and its shareholders. In their deliberations, the Trustees did not identify any single factor that alone was responsible for the Board’s decision to approve the agreements. In connection with its deliberations, the Board considered information provided at or in advance of the June 2009 meetings as well as information provided throughout the year at regular and special Board meetings, including presentations from PI and subadviser personnel such as portfolio managers. The Trustees determined that the overall arrangements between the Trust and PI, which serves as the Trust’s investment manager pursuant to a management agreement, and between PI and each subadviser, each of which serves pursuant to the terms of a subadvisory agreement with PI, are fair and reasonable in light of the services performed, fees charged and such other matters as the Trustees considered relevant in the exercise of their business judgment. The material factors and conclusions that formed the basis for the Trustees’ determinations to approve the renewal of the agreements are discussed separately below. Nature, quality and extent of services The Board received and considered information regarding the nature, quality and extent of services provided to the Trust by PI and each subadviser. The Board considered the services provided by PI, including but not limited to the oversight of the subadvisers, as well as the provision of recordkeeping and compliance services to the Trust. With
respect to PI’s oversight of the subadvisers, the Board noted that PI’s Strategic Investment Research Group (“SIRG”), a business unit of PI, is responsible for screening and recommending new subadvisers when appropriate, as well as monitoring and reporting to the Board on the performance and operations of the subadvisers. The Board also considered that PI pays the salaries of all of the officers and non-independent Trustees of the Trust. The Board also considered the investment subadvisory services provided by each subadviser, as well as compliance with the Trust’s investment restrictions, policies and procedures. The Board considered PI’s evaluation of the subadvisers, as well as PI’s recommendation, based on its review of the subadvisers, to renew the subadvisory agreements. The Board reviewed the qualifications, backgrounds and responsibilities of PI’s senior management responsible for the oversight of the Trust and each subadviser, and also reviewed the qualifications, backgrounds and responsibilities of the subadvisers’ portfolio managers who are responsible for the day-to-day management of the Portfolio. The Board was provided with information pertaining to PI’s and each subadviser’s organizational structure, senior management, investment operations and other relevant information pertaining to both PI and each subadviser. The Board also noted that it received favorable compliance reports from the Trust’s Chief Compliance Officer (“CCO”) as to both PI and each subadviser. The Board noted that Prudential Investment Management, Inc. (“PIM”), Jennison Associates LLC (“Jennison”) and Quantitative Management Associates LLC (“QMA”) each of which serve as subadvisers to the Trust, are affiliated with PI. The Board concluded that it was satisfied with the nature, extent and quality of the investment management services provided by PI and the subadvisory services provided to the Portfolios by each subadviser, and that there was a reasonable basis on which to conclude that the Portfolio benefits from the services provided by PI and each subadviser under the management and subadvisory agreements.
Costs of Services and Profits Realized by PI
The Board was provided with information on the profitability of PI and its affiliates in serving as the Trust’s investment manager. The Board discussed with PI the methodology utilized in assembling the information regarding profitability and considered its reasonableness. The Board recognized that it is difficult to make comparisons of profitability from fund management contracts because comparative information is not generally available and is affected by numerous factors, including the structure of the particular adviser, the types of funds it manages, its business mix, numerous assumptions regarding allocations and the adviser’s capital structure and cost of capital. The Board did not separately consider the profitability of PIM, Jennison or QMA, which are affiliates of PI, as their profitability was included in the profitability report for PI. Taking these factors into account, the Board concluded that the profitability of PI and its affiliates in relation to the services rendered was not unreasonable. The Board concluded that the level of profitability of a subadviser not affiliated with PI may not be as significant as PI’s profitability given the arm’s length nature of the process by which the subadvisory fee rates were negotiated by PI and the unaffiliated subadvisers, as well as the fact that PI compensates the subadvisers out of its management fee. Economies of Scale The Board noted that the management fee schedule for the Portfolio does not contain breakpoints that would reduce the fee rate on assets above specified levels. The Board received and discussed information concerning whether PI realizes economies of scale as the Portfolios’ assets grow beyond current levels. However, because of the nature of PI’s business, the Board could not reach definitive conclusions as to whether PI might realize economies of scale on the Portfolio or how great they may be. In light of each Portfolio’s current size and fee rate, the Board concluded that the fact that the Portfolio does not have breakpoints is acceptable at this time. Other Benefits to PI and the Subadvisers The Board considered potential ancillary benefits that might be received by PI, the subadvisers, and their affiliates as a result of their relationship with the Trust. The Board concluded that potential benefits to be derived by PI included brokerage commissions received by affiliates of PI, compensation received by insurance company affiliates of PI from the subadvisers, as well as benefits to its reputation or other intangible benefits resulting from PI’s association
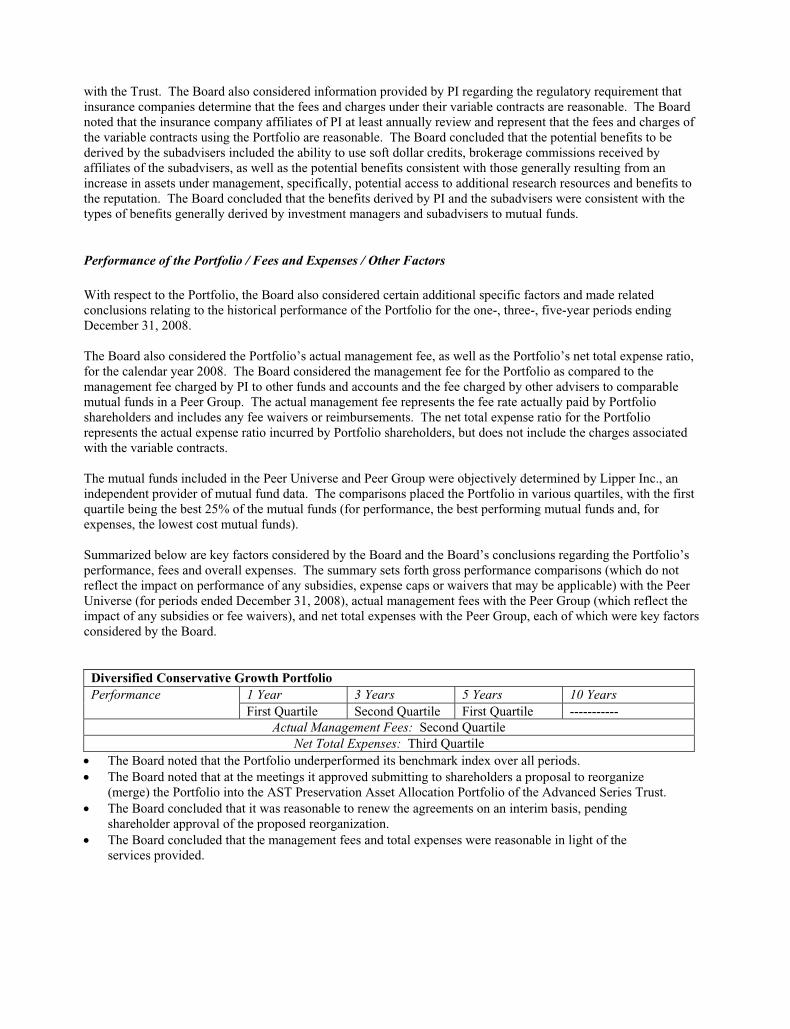
with the Trust. The Board also considered information provided by PI regarding the regulatory requirement that insurance companies determine that the fees and charges under their variable contracts are reasonable. The Board noted that the insurance company affiliates of PI at least annually review and represent that the fees and charges of the variable contracts using the Portfolio are reasonable. The Board concluded that the potential benefits to be derived by the subadvisers included the ability to use soft dollar credits, brokerage commissions received by affiliates of the subadvisers, as well as the potential benefits consistent with those generally resulting from an increase in assets under management, specifically, potential access to additional research resources and benefits to the reputation. The Board concluded that the benefits derived by PI and the subadvisers were consistent with the types of benefits generally derived by investment managers and subadvisers to mutual funds.
Performance of the Portfolio / Fees and Expenses / Other Factors
With respect to the Portfolio, the Board also considered certain additional specific factors and made related conclusions relating to the historical performance of the Portfolio for the one-, three-, five-year periods ending December 31, 2008. The Board also considered the Portfolio’s actual management fee, as well as the Portfolio’s net total expense ratio, for the calendar year 2008. The Board considered the management fee for the Portfolio as compared to the management fee charged by PI to other funds and accounts and the fee charged by other advisers to comparable mutual funds in a Peer Group. The actual management fee represents the fee rate actually paid by Portfolio shareholders and includes any fee waivers or reimbursements. The net total expense ratio for the Portfolio represents the actual expense ratio incurred by Portfolio shareholders, but does not include the charges associated with the variable contracts. The mutual funds included in the Peer Universe and Peer Group were objectively determined by Lipper Inc., an independent provider of mutual fund data. The comparisons placed the Portfolio in various quartiles, with the first quartile being the best 25% of the mutual funds (for performance, the best performing mutual funds and, for expenses, the lowest cost mutual funds). Summarized below are key factors considered by the Board and the Board’s conclusions regarding the Portfolio’s performance, fees and overall expenses. The summary sets forth gross performance comparisons (which do not reflect the impact on performance of any subsidies, expense caps or waivers that may be applicable) with the Peer Universe (for periods ended December 31, 2008), actual management fees with the Peer Group (which reflect the impact of any subsidies or fee waivers), and net total expenses with the Peer Group, each of which were key factors considered by the Board.
Diversified Conservative Growth Portfolio Performance 1 Year 3 Years 5 Years 10 Years
First Quartile Second Quartile First Quartile ----------- Actual Management Fees: Second Quartile
Net Total Expenses: Third Quartile • The Board noted that the Portfolio underperformed its benchmark index over all periods. • The Board noted that at the meetings it approved submitting to shareholders a proposal to reorganize
(merge) the Portfolio into the AST Preservation Asset Allocation Portfolio of the Advanced Series Trust. • The Board concluded that it was reasonable to renew the agreements on an interim basis, pending
shareholder approval of the proposed reorganization. • The Board concluded that the management fees and total expenses were reasonable in light of the
services provided.

[THIS PAGE INTENTIONALLY LEFT BLANK]
Annuities are issued by Pruco Life Insurance Company, or in New York, Pruco Life Insurance Company of New Jersey, bothlocated at 213 Washington Street, Newark, NJ 07102-2992, and Prudential Annuities Life Assurance Corporation, located atOne Corporate Drive, Shelton, CT, 06484. Variable annuities are distributed by Prudential Annuities Distributors, Inc., alsolocated in Shelton, CT. Prudential Annuities is a business unit of Prudential Financial.
Variable life insurance is issued by The Prudential Insurance Company of America, 751 Broad Street, Newark, NJ 07102-3777, Pruco Life Insurance Company, or in New York, Pruco Life Insurance Company of New Jersey, both located at 213Washington Street, Newark, NJ 07102-2992. Pruco Life Insurance Company is not licensed to do business in New York.Variable life insurance is offered through Pruco Securities LLC, 751 Broad Street, Newark, NJ 07102-3777.
All are Prudential Financial companies and each is solely responsible for its financial condition and contractual obligations.
Life insurance policies and annuity contracts contain exclusions, limitations, reductions of benefits and terms for keepingthem in force. Your licensed financial professional can provide you with costs and complete details. Contract guarantees arebased on the claims-paying ability of the issuing company.
The Prudential Insurance Company of America751 Broad StreetNewark, NJ 07102-3777
PresortedStandard
U.S. PostagePAID
Prudential
The 2008 Audited Financial Statements of Pruco Life Insurance Company, Pruco Life Insurance Company of NewJersey, and The Prudential Insurance Company of America are available. You may call 888-778-2888 to obtain a freecopy of the audited financial statements of the insurance company that issued your contract.
To reduce costs, we now generally send only a single copy of prospectuses and shareholder reports to each household(“householding”) in lieu of sending a copy to each Contract Owner who resides in the household. You should be awarethat by calling 877-778-5008, you can revoke or “opt out” of householding at any time.
Pru, Prudential, Prudential Financial, Rock Solid, “The Rock,” the Rock Logo and the Rock Prudential Logo areregistered service marks of The Prudential Insurance Company of America, Newark, NJ, and its affiliates.
0158083-00001-00 PSF-SAR-DCG