Embed Size (px)
Citation preview
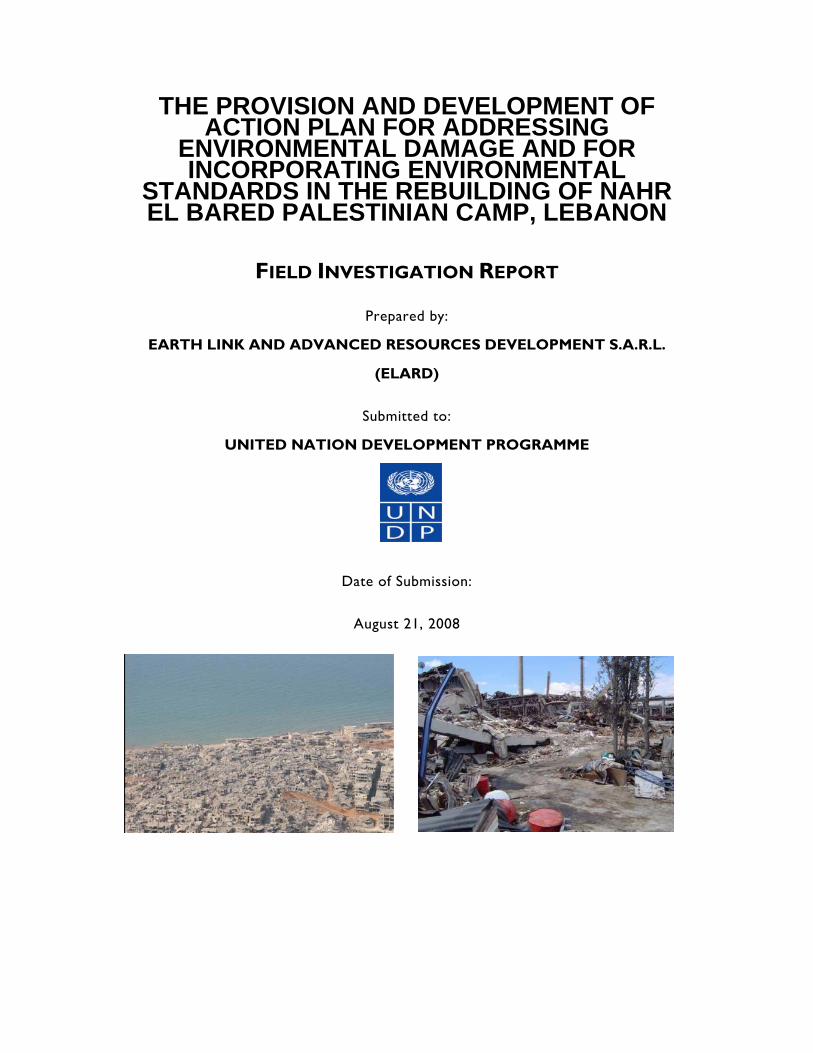
THE PROVISION AND DEVELOPMENT OF ACTION PLAN FOR ADDRESSING
ENVIRONMENTAL DAMAGE AND FOR INCORPORATING ENVIRONMENTAL
STANDARDS IN THE REBUILDING OF NAHR EL BARED PALESTINIAN CAMP, LEBANON
FIELD INVESTIGATION REPORT
Prepared by:
EARTH LINK AND ADVANCED RESOURCES DEVELOPMENT S.A.R.L.
(ELARD)
Submitted to:
UNITED NATION DEVELOPMENT PROGRAMME
Date of Submission:
August 21, 2008
Environmental Rapid Assessment United Nations Development Programme (UNDP) Field Investigation Report Table of Contents
Prepared by ELARD ii
ELARD LEBANON
UNITED NATIONS DEVELOPMENT PROGRAMME (UNDP-) Document Type: Background Review Report
Contract Ref: LEB/RFP/05/08
Title No. of Pages: 106 Excluding Appendices
The Provision and Development of Action Plan for Addressing Environmental Damage and for Incorporating Environmental Standards in the Rebuilding of Nahr El Bared Palestinian Camp, Lebanon
Version 1
Approved by Ramez Kayal Project Director- Senior Water Resources Specialist August 21th, 2008
Reviewed by Ricardo Khoury Assistant Project Director August 20th, 2008
Prepared by Joanna Doummar Project Manager- Water Resources Specialist August 19th, 2006
Rabih Fayad Solid Waste Specialist August 16th, 2006 Amal Othmani Environmental Expert August 17th, 2006 Nadine Aoun Environmental Expert August 17th, 2006 Carlo Bekhazi Environmental Expert August 17th, 2006
DISCLAIMER
This EIA report has been prepared by ELARD , with all reasonable skill, care and diligence within the terms of the contract with the client, incorporating our General Terms and Conditions of Business and taking account of the resources devoted to it by agreement with the client. The information contained in this report is, to the best of our knowledge, correct at the time of printing. The interpretations and recommendations are based on our experience, using reasonable professional skill and judgment, and based upon the information that was available to us. This report is confidential to the client and we accept no responsibility whatsoever to third parties to whom this report, or any part thereof, is made known. Any such party relies on the report at heir own risk.
ELARD Hojeily Center 6th Fl. Pere Yaoub Street Sin El Fil, 2708 5803 Tel: +961 (1) 512121/2 Fax: +961 1 512123

Environmental Rapid Assessment United Nations Development Programme (UNDP) Field Investigation Report Table of Contents
Prepared by ELARD iii
TABLE OF CONTENTS Table of Contents ........................................................................................................................................................ iii
List of Tables .................................................................................................................................................................. v
List of Figures ................................................................................................................................................................. vi
List of Acronyms .......................................................................................................................................................... viii
1. Introduction .................................................................................................................................................. 1-1
1.1. General .................................................................................................................................................... 1-1
1.2. Objectives and structure of the Field Investigation report ............................................................. 1-1
2. Methodology ............................................................................................................................................... 2-1
2.1.1. Meetings with Concerned Parties ................................................................................................... 2-1
2.1.2. Field Survey ......................................................................................................................................... 2-2
2.1.3. Questionnaires, ................................................................................................................................... 2-2
2.1.4. Sampling Campaign ......................................................................................................................... 2-3
3. Physical Description of the Area .............................................................................................................. 3-1
3.1.1. Topography ........................................................................................................................................ 3-1
3.1.2. Meteorology ....................................................................................................................................... 3-1
3.1.3. Geology ............................................................................................................................................... 3-4
3.1.4. Hydrogeology ..................................................................................................................................... 3-6
4. Field Investigation: New Camp ................................................................................................................ 4-1
4.1. General .................................................................................................................................................... 4-1
4.2. Population ................................................................................................................................................ 4-2
4.2.1. Pre-conflict population size .............................................................................................................. 4-2
4.2.2. Post conflict- Reconstruction population status ........................................................................... 4-3
4.2.3. Expected population growth after relief and reconstruction ................................................... 4-3
4.3. Solid waste ............................................................................................................................................... 4-4
4.3.1. Quantities ............................................................................................................................................ 4-4
4.3.2. Composition ........................................................................................................................................ 4-5
4.3.3. Current Collection & Disposal .......................................................................................................... 4-5
4.4. Demolition Debris .................................................................................................................................... 4-7
4.4.1. Definitions ............................................................................................................................................ 4-7
4.4.2. Quantities ............................................................................................................................................ 4-7
4.4.3. Composition ........................................................................................................................................ 4-7
4.4.4. Disposal ................................................................................................................................................ 4-9
4.5. Water Supply ........................................................................................................................................... 4-9
4.5.1. Water supply prior to the conflict.................................................................................................... 4-9
4.5.2. Current Water supply Status ........................................................................................................... 4-10
4.6. Waste Water .......................................................................................................................................... 4-15
4.6.1. Waste Water generation ................................................................................................................ 4-15
4.6.2. Waste Water Current Conditions .................................................................................................. 4-15
Environmental Rapid Assessment United Nations Development Programme (UNDP) Field Investigation Report Table of Contents
Prepared by ELARD iv
4.6.3. Storm water network ....................................................................................................................... 4-18
4.7. Electricity ................................................................................................................................................ 4-18
4.8. Other Issues ............................................................................................................................................ 4-20
4.9. Environmental Concerns ..................................................................................................................... 4-20
5. Field Investigation: Surrounding Municipalities ...................................................................................... 5-1
5.1. General .................................................................................................................................................... 5-1
5.2. Mhammara .............................................................................................................................................. 5-3
5.2.1. Municipal Solid waste ....................................................................................................................... 5-5
5.2.2. Water supply ....................................................................................................................................... 5-6
5.2.3. Wastewater ......................................................................................................................................... 5-9
5.2.4. Electricity ........................................................................................................................................... 5-10
5.2.5. Damages related to NBC conflict ................................................................................................ 5-11
5.2.6. Environmental Concerns ................................................................................................................ 5-11
5.3. Bhannine ................................................................................................................................................ 5-12
5.3.1. Municipal Solid waste ..................................................................................................................... 5-13
5.3.2. Water supply ..................................................................................................................................... 5-13
5.3.3. Waste water ...................................................................................................................................... 5-14
5.3.4. Electricity ........................................................................................................................................... 5-15
5.3.5. Damage related to NBC conflict .................................................................................................. 5-15
5.3.6. Environmental Concerns ................................................................................................................ 5-15
5.4. Bebnine .................................................................................................................................................. 5-16
5.4.1. Municipal Solid Waste ..................................................................................................................... 5-17
5.4.2. Water supply ..................................................................................................................................... 5-20
5.4.3. Waste water ...................................................................................................................................... 5-22
5.4.4. Electricity ........................................................................................................................................... 5-23
5.4.5. Environmental Concerns ................................................................................................................ 5-23
5.5. Deir Ammar ............................................................................................................................................ 5-24
5.5.1. Municipal solid waste ...................................................................................................................... 5-24
5.5.2. Water supply ..................................................................................................................................... 5-27
5.5.3. Wastewater ....................................................................................................................................... 5-28
5.5.4. Electricity ........................................................................................................................................... 5-29
5.5.5. Relevant Industries ........................................................................................................................... 5-29
5.5.6. Environmental Concerns ................................................................................................................ 5-31
5.6. Menieh .................................................................................................................................................... 5-32
5.6.1. Municipal solid waste ...................................................................................................................... 5-33
5.6.2. Water supply ..................................................................................................................................... 5-35
5.6.3. Wastewater ....................................................................................................................................... 5-37
5.6.4. Electricity ........................................................................................................................................... 5-37
5.6.5. Environmental Concerns ................................................................................................................ 5-38
5.7. Beddawi ................................................................................................................................................. 5-39
5.7.1. Municipal solid waste ...................................................................................................................... 5-41

Environmental Rapid Assessment United Nations Development Programme (UNDP) Field Investigation Report Table of Contents
Prepared by ELARD v
5.7.2. Water supply ..................................................................................................................................... 5-42
5.7.3. Wastewater ....................................................................................................................................... 5-45
5.7.4. Industrial wastes ............................................................................................................................... 5-46
5.7.5. Electricity ........................................................................................................................................... 5-47
5.7.6. Environmental concerns ................................................................................................................. 5-47
6. Synopsis ......................................................................................................................................................... 6-1
Appendix A ................................................................................................................................................................ 6-1
LIST OF TABLES Table 2-1 List of Stakeholders Relevant to the Project .................................................................................. 2-1 Table 2-2 Main Information Collected in the Surrounding Municipalities during Field Assessment ...... 2-2 Table 2-3 Sampling Program as performed during the 4 site visits conducted by ELARD ..................... 2-4 Table 2-4 Coordinates of the Ground Water Sampling Locations ............................................................. 2-6 Table 2-5 Collected Samples and Associated Analyzed Parameters ....................................................... 2-7 Table 3-1 Elevation Ranges and Surface Areas of the Surrounding Municipalities of Nahr El Bared Camp 3-1 Table 3-2 Dominant and Second Prevailing Wind Directions for Tripoli-Mina (Atlas Climatique Du
Liban, 1973) ......................................................................................................................................... 3-2 Table 3-3 List of wells tapping the Quaternary Aquifer mostly located in Nahr El Bared Area ............. 3-8 Table 3-4 Characteristics of the wells tapping the Miocene Aquifer in the study area ......................... 3-9 Table 4-1 Coordinates of Visited Locations (in WGS84 Geographic system) ........................................... 4-1 Table 4-2 New Camp Sector’s Division ............................................................................................................ 4-2 Table 4-3 Expected Number of Inhabitants in New Camp until 2011 as Projected by UNRWA (2008) 4-3 Table 4-4 Expected Number of Inhabitants in NBC & New Camp Considering an Average
Demographic Expansion of 3.5% .................................................................................................... 4-4 Table 4-5 Population and Solid Waste Generation in the New NBC until 2020 ........................................ 4-4 Table 4-6 Estimation of the composition of demolition debris in the new camp based on Field
Investigation ........................................................................................................................................ 4-8 Table 4-7 Water Supply Sectors (Pump, well, reservoir and transmission Characteristics) ................... 4-10 Table 4-8 Main Characteristics of the Surveyed and Visited Wells ........................................................... 4-11 Table 4-9 Conditions of the Water Towers located in the old and New Camp .................................... 4-12 Table 4-10 Current Water Supply in Nahr El Bared New Camp .............................................................. 4-14 Table 4-11 Water Demand in the New NBC until 2020 (On the basis of 80 liters per capita per day
starting 2008) ................................................................................................................................ 4-15 Table 4-12 Theoretical Waste Water Generation in NBC new camp until 2020 .................................. 4-15 Table 4-13 Current status of wastewater network and disposal in the new camp ............................ 4-17 Table 4-14 EDL Electricity Network in the New Camp after the Conflict .............................................. 4-19 Table 4-15 Distribution of the 11 UNRWA generators* in the new camp .............................................. 4-19 Table 4-16 Pre-conflict Environmental Concerns ...................................................................................... 4-20 Table 4-17 Post-Conflict Environmental Concerns ...................................................................................... 4-1 Table 5-1 Points of Environmental Concern Identified during the Field Visits ........................................... 5-1 Table 5-2 Current population status in the Mhammara municipality and Demographic Projections
(on the basis of 3.5 %) ....................................................................................................................... 5-4 Table 5-3 Population and Solid Waste Generation in Mhammara village until 2020 .............................. 5-5 Table 5-4 Synopsis of the Water Supply Sector in Mhammara .................................................................... 5-8 Table 5-5 Theoretical Water Demand in Mhammara Municipality from 2010 until 2020 ....................... 5-8 Table 5-6 Theoretical Waste Water Generation in Mhammara Municipality from 2010 until 2020 .... 5-10 Table 5-7 Issues of Environmental Concern in the Municipality of Mhammara ..................................... 5-11 Table 5-8 Projected Population till year 2020 in Bhann2ine, with Respective Densities ........................ 5-12 Table 5-9 Solid Waste Generation in Bhannine Municipality until year 2020 .......................................... 5-13 Table 5-10 Current and Projected Water Demand in Bhannine (on the basis of a theoretical daily
water consumption of 80 liters per capita) ............................................................................ 5-14 Table 5-11 Theoretical waste water generation in Bhannine Municipality until year 2020 ............... 5-15 Table 5-12 Issues of Environmental concern in the Municipality of Bhannine ..................................... 5-16 Table 5-13 Projected Population till year 2020 in Bebnine, with Respective Densities ....................... 5-17
Environmental Rapid Assessment United Nations Development Programme (UNDP) Field Investigation Report Table of Contents
Prepared by ELARD vi
Table 5-14 Number of inhabitants and solid wastes generation in Bebnine village until year 2020 considering a demographic expansion of 3.5% .................................................................... 5-17
Table 5-15 Theoretical Water Demand in Bebnine village until year 2020 ........................................... 5-22 Table 5-16 Theoretical waste water generation in Bebnine village until year 2020............................ 5-23 Table 5-17 Issues of Environmental concern in the Municipality of Bebnine ....................................... 5-23 Table 5-18 Projected Population till year 2020 in Deir Ammar, with Respective Densities................. 5-24 Table 5-19 Number of inhabitants and solid wastes generation in Deir Ammar village until year 2020
considering a demographic expansion of 3.5% .................................................................... 5-25 Table 5-20 Theoretical Water Demand in Deir Ammar Municipality till 2020 ....................................... 5-28 Table 5-21 Theoretical waste water generation in Deir Ammar village until year 2020 ..................... 5-29 Table 5-22 Quarries identified in Deir Ammar Area .................................................................................. 5-30 Table 5-23 Issues of Environmental concern in the Municipality of Deir Ammar ................................. 5-31 Table 5-24 Projected Population till year 2020 in Menieh, with Respective Densities ........................ 5-32 Table 5-25 Number of inhabitants and solid wastes generation in Menieh village until year 2020
considering a demographic expansion of 3.5% .................................................................... 5-33 Table 5-26 Theoretical water demand in Menieh village until year 2020 ............................................. 5-36 Table 5-27 Theoretical waste water generation in Menieh village until year 2020 considering a
demographic expansion of 3.5% ............................................................................................. 5-37 Table 5-28 Issues of Environmental concern in the Municipality of Menieh ......................................... 5-39 Table 5-29 Projected Population till year 2020 in Beddawi, with Respective Densities ...................... 5-40 Table 5-30 Daily Solid Wastes Generation Rates in Beddawi Village until year 2020 ......................... 5-41 Table 5-31 Theoretical Water Consumption in Beddawi area till 2020 .................................................. 5-44 Table 5-32 Theoretical Waste Water Generation in Beddawi village until year 2020 ......................... 5-46 Table 5-33 Issues of Environmental concern in the Municipality of Beddawi ...................................... 5-47 Table 6-1 Synopsis of the Major Issues Identified in the Surrounding Municipalities ................................ 6-1
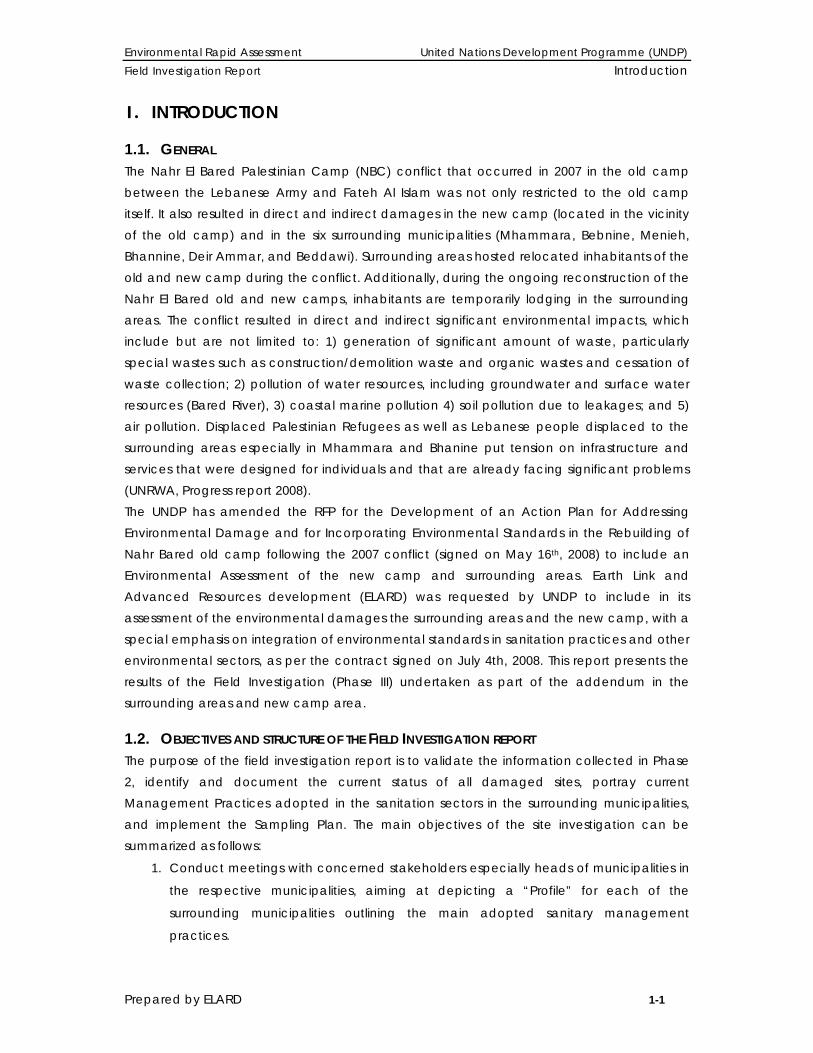
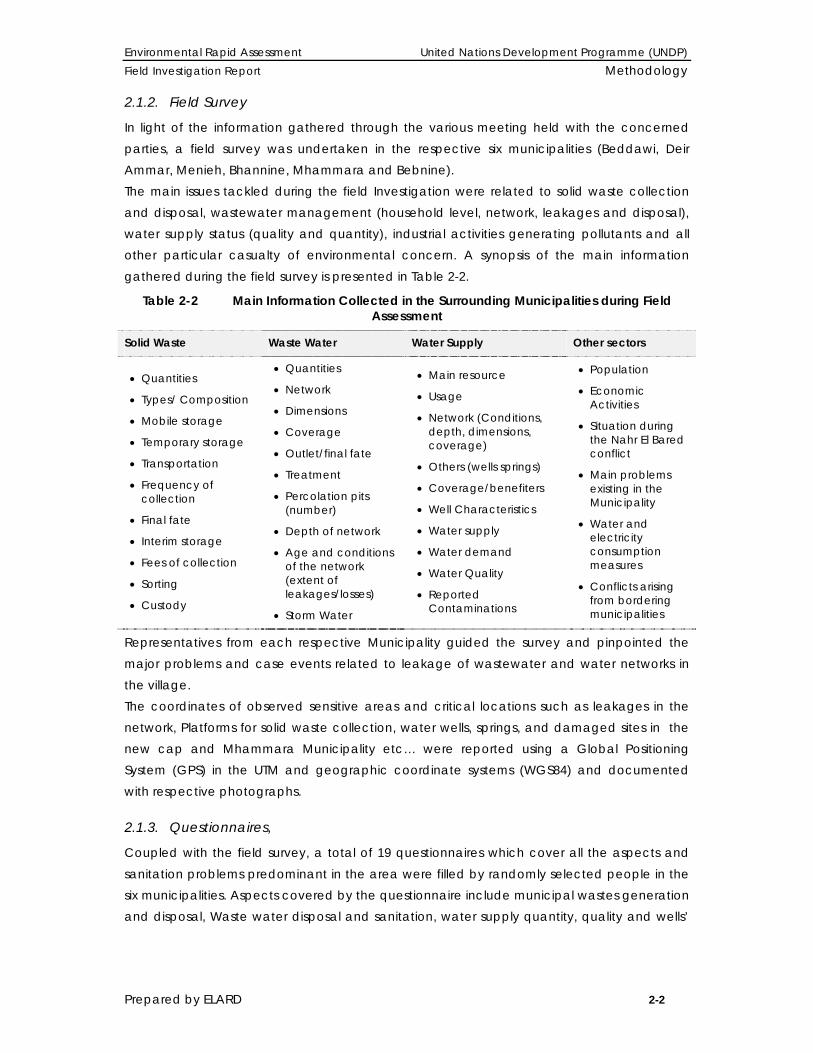
LIST OF FIGURES Figure 2-1 Water sample collection from a) surface water: Nahr El Bared River; Ouyoun El Samak
Dam, b) Well 3 in Nahr El Bared Camp .......................................................................................... 2-5 Figure 2-2 Water sample collection from c) Bebnine Spring, d) Well 2 in Nahr El Bared Camp ........... 2-5 Figure 2-3 Location of Water Sampling Points in the Project Area .............................................................. 2-6 Figure 3-1 Average Max & Min Temperatures at Abdeh Weather Station (Nov, 06-Oct, 07) ................ 3-2 Figure 3-2 Average Wind Rose diagram for Tripoli- Al Mina (Atlas Climatique du Liban, 1973) ............. 3-2 Figure 3-3 Maximum & Average Wind Speed Data from Tripoli Weather Station (2003) ........................ 3-3 Figure 3-4 Monthly Precipitation Rates and Total Amount of Rainy Days Recorded at Al-Abdeh
Weather Station (Nov, 06-Oct, 07) .................................................................................................. 3-3 Figure 3-5 General Geological Map of the Study Area (Dubertret, 1955)................................................. 3-5 Figure 3-6 Geological Cross Sections Passing through Nahr El Bared Area and Beddawi Area ........... 3-5 Figure 3-7 Hydrogeological map of the Project Area ................................................................................... 3-7 Figure 4-1 Visited Locations in the New Nahr El Bared Camp ...................................................................... 4-1 Figure 4-2 Temporary storage of solid waste near households .................................................................... 4-5 Figure 4-3 UNRWA workers of moving solid wastes from households to the steel containers located on
the main streets .................................................................................................................................. 4-5 Figure 4-4 Steel containers for Solid Waste Disposal found on the Main Streets of the New Camp of
Nahr El Bared ...................................................................................................................................... 4-6 Figure 4-5 Demolition Debris in the Nahr El Bared New Camp Composed Mainly of Rubble (Concrete, Metals and Aggregates) with other Minor Waste Streams (Nylon, Plastics) .................................................. 4-9 Figure 4-6 Demolition wastes dumped a) on seashore and b) on the banks of Nahr El Bared River
(Right) ................................................................................................................................................... 4-9 Figure 4-7 Schematic Water Supply Sectors in the New Camp A1, A2, A3, and A4 (Modified from
ELARD, 2005; Not to scale) ............................................................................................................. 4-10 Figure 4-8 a) Well 6 located near Nahr El Bared River rehabilitated and currently used for Sector A in
the New Camp, b) Well 8 completely buried beneath the rubble ........................................ 4-12 Figure 4-9 Water Tower least affected by the conflict serving the New Camp a) Amwas after, b)
Amwas before .................................................................................................................................. 4-13 Figure 4-10 Water Tower least affected by the conflict serving the New Camp a) Gineen after, b)
Gineen before .................................................................................................................................. 4-13 Figure 4-11 Water Tower Khaled Ben Waleed Completely Destroyed during the Conflict ............... 4-14
Environmental Rapid Assessment United Nations Development Programme (UNDP) Field Investigation Report Table of Contents
Prepared by ELARD vii
Figure 4-12 Open water canal of the northern part from Mhammara highway conveying wastewater to the sea and plugged with solid wastes ....................................................... 4-16
Figure 4-13 Canal of the northern part covered by concrete before reaching the sea ................... 4-16 Figure 4-14 Open canal of the southern part East to the pipeline plugged with solid waste ........... 4-17 Figure 4-15 A new air substation replacing: a) a destroyed concrete substation, b) a destroyed air
substation ...................................................................................................................................... 4-18 Figure 5-1 Locations Visited in the Surrounding Municipalities ..................................................................... 5-3 Figure 5-2 Map Showing the Mhammara Cadastre including the Nahr El Bared New Camp .............. 5-4 Figure 5-3 Rawda Municipal Solid Waste Dump Site of Mhammara, Menieh and Bhannine ................ 5-6 Figure 5-4 Sorting Municipal Wastes at the Rawda Dump site..................................................................... 5-6 Figure 5-5 Wastes (Nylon and Organic Material) Covered by Soil in Rawda Dump Site ........................ 5-6 Figure 5-6 Water well and water tower of Mhammara ................................................................................. 5-7 Figure 5-7 PVC water pipes in Mhammara at a distributing point .............................................................. 5-7 Figure 5-8 Water leakage in Mhammara ......................................................................................................... 5-8 Figure 5-9 Wastewater Leakage Problems - Network of the Southern Part of Mhammara Due to
Military Vehicles Circulation During the Conflict .......................................................................... 5-9 Figure 5-10 Wastewater Leakage on the Highway of Mhammara – Waste Water Network of the
Northern Part ....................................................................................................................................... 5-9 Figure 5-11 Commonly Used Electricity Generators in Mhammara ........................................................ 5-10 Figure 5-12 Destroyed and replaced electricity transformer at the entry of Mhammara ................. 5-11 Figure 5-13 Bhannine Located South to the New Camp Area ............................................................... 5-12 Figure 5-14 Wastewater conveyed to irrigation canal in Bhannine ....................................................... 5-15 Figure 5-15 Bebnine located North to the Camp Area ............................................................................ 5-17 Figure 5-16 Compactor collecting solid waste in Bebnine ....................................................................... 5-18 Figure 5-17 Solid waste barrel in Bebnine .................................................................................................... 5-18 Figure 5-18 Irrigation water canal polluted by wastewater and solid waste – A water pipe also
crosses this canal ......................................................................................................................... 5-19 Figure 5-19 Private landfill located in Beit El Hosh for Bebnine (and other Municipalities) solid waste
disposal ......................................................................................................................................... 5-19 Figure 5-20 Landfill of Beit EL Hosh turned into orchards ........................................................................... 5-20 Figure 5-21 Bebnine Spring ............................................................................................................................. 5-20 Figure 5-22 Wastewater conveyed to irrigation canal in Bebnine ......................................................... 5-21 Figure 5-23 Wastewater in Bebnine evacuated in to the sea and in the valley .................................. 5-22 Figure 5-24 Deir Ammar Municipality Cadastral Boundaries ................................................................... 5-24 Figure 5-25 Wastes disposed outside barrels in Deir Ammar .................................................................... 5-25 Figure 5-26 Truck for solid wastes collection in Deir Ammar ..................................................................... 5-26 Figure 5-27 Solid waste dump site in Deir Ammar ...................................................................................... 5-26 Figure 5-28 Wastes dumped outside Deir Ammar dump site .................................................................. 5-27 Figure 5-29 Well in Deir Ammar for Water Authorities of the North ......................................................... 5-27 Figure 5-30 Repaired water leakage in Deir Ammar ................................................................................. 5-28 Figure 5-31 Wastewater sea outlet in Deir Ammar .................................................................................... 5-28 Figure 5-32 Waste water network leakage on the highway in Deir Ammar ......................................... 5-29 Figure 5-33 Electricity Plant in Deir Ammar .................................................................................................. 5-30 Figure 5-34 Quarry in Deir Ammar ................................................................................................................. 5-30 Figure 5-35 Cars dump in Deir Ammar ......................................................................................................... 5-31 Figure 5-36 El Menieh Cadastral Boundaries............................................................................................... 5-32 Figure 5-37 Compactor for solid wastes collection in Menieh ................................................................. 5-34 Figure 5-38 Waste barrels overloaded in Menieh ...................................................................................... 5-34 Figure 5-39 Menieh seashore dump ............................................................................................................. 5-35 Figure 5-40 Ouyoun El Samak Spring Flowing Underground .................................................................... 5-35 Figure 5-41 Water Leakage along Ouyoun El Samak Network in Menieh............................................. 5-36 Figure 5-42 Wastewater sea outlets in Menieh ........................................................................................... 5-37 Figure 5-43 El Baddawi Cadastral Boundaries North to Tripoli ................................................................. 5-40 Figure 5-44 Temporary waste collection – “Lavajet” ................................................................................. 5-42 Figure 5-45 IPC fuel tanks ................................................................................................................................ 5-43 Figure 5-46 Ground pits of fuel at IPC percolating to groundwater ....................................................... 5-43 Figure 5-47 Water reservoir showing a brick colored scum in the bottom due to pollution .............. 5-43 Figure 5-48 Tap water from a polluted well being filtered using a gauze ............................................. 5-44 Figure 5-49 Irrigation water canal conveyed from IPC fuel contaminated well to Beddawi cultivated
land ................................................................................................................................................ 5-45

Environmental Rapid Assessment United Nations Development Programme (UNDP) Field Investigation Report Table of Contents
Prepared by ELARD viii
Figure 5-50 Open canals of wastewater towards the sea ....................................................................... 5-45 Figure 5-51 Two wastewater sea outlets in Beddawi ................................................................................. 5-46 Figure 5-52 Residues generated from the oil industry in Beddawi .......................................................... 5-47
LIST OF ACRONYMS
CDR Council of Development and Reconstruction
CSO Camp Services Officer
EDL Electricite du Liban
ELARD Earth Link and Advanced Resources Development
HDPE High Density Poly Ethylene
IPC Iraq Petroleum Company
Kg Kilogram
KW Kilowatt
LAF Lebanese Armed Forces
LBP. Lebanese Lira
m3 Cubic meters
NBC Nahr El Bared Camp
PCB Polychlorinated Biphenyls
PVC Polyvinyl Chloride
UNDP United Nations Development Program
UNRWA United Nations Relief and Work Agency
UPS Uninterruptible Power Supply
USD US Dollars
W Watt
Environmental Rapid Assessment United Nations Development Programme (UNDP) Field Investigation Report Introduction
Prepared by ELARD 1-1
1. INTRODUCTION
1.1. GENERAL The Nahr El Bared Palestinian Camp (NBC) conflict that occurred in 2007 in the old camp between the Lebanese Army and Fateh Al Islam was not only restricted to the old camp itself. It also resulted in direct and indirect damages in the new camp (located in the vicinity of the old camp) and in the six surrounding municipalities (Mhammara, Bebnine, Menieh, Bhannine, Deir Ammar, and Beddawi). Surrounding areas hosted relocated inhabitants of the old and new camp during the conflict. Additionally, during the ongoing reconstruction of the Nahr El Bared old and new camps, inhabitants are temporarily lodging in the surrounding areas. The conflict resulted in direct and indirect significant environmental impacts, which include but are not limited to: 1) generation of significant amount of waste, particularly special wastes such as construction/demolition waste and organic wastes and cessation of waste collection; 2) pollution of water resources, including groundwater and surface water resources (Bared River), 3) coastal marine pollution 4) soil pollution due to leakages; and 5) air pollution. Displaced Palestinian Refugees as well as Lebanese people displaced to the surrounding areas especially in Mhammara and Bhanine put tension on infrastructure and services that were designed for individuals and that are already facing significant problems (UNRWA, Progress report 2008). The UNDP has amended the RFP for the Development of an Action Plan for Addressing Environmental Damage and for Incorporating Environmental Standards in the Rebuilding of Nahr Bared old camp following the 2007 conflict (signed on May 16th, 2008) to include an Environmental Assessment of the new camp and surrounding areas. Earth Link and Advanced Resources development (ELARD) was requested by UNDP to include in its assessment of the environmental damages the surrounding areas and the new camp, with a special emphasis on integration of environmental standards in sanitation practices and other environmental sectors, as per the contract signed on July 4th, 2008. This report presents the results of the Field Investigation (Phase III) undertaken as part of the addendum in the surrounding areas and new camp area.
1.2. OBJECTIVES AND STRUCTURE OF THE FIELD INVESTIGATION REPORT The purpose of the field investigation report is to validate the information collected in Phase 2, identify and document the current status of all damaged sites, portray current Management Practices adopted in the sanitation sectors in the surrounding municipalities, and implement the Sampling Plan. The main objectives of the site investigation can be summarized as follows:
1. Conduct meetings with concerned stakeholders especially heads of municipalities in
the respective municipalities, aiming at depicting a “Profile” for each of the
surrounding municipalities outlining the main adopted sanitary management
practices.

Environmental Rapid Assessment United Nations Development Programme (UNDP) Field Investigation Report Introduction
Prepared by ELARD 1-2
2. Validate the information collected in the background review report through field
visits,
3. Identify and document the current status of all damaged sites, especially in the new
camp and Mhammara Municipality,
4. Fill questionnaires with randomly chosen local people in the surrounding municipalities
to acquire information about the status and conditions of the sanitation sectors of
environmental concerns in each of the municipalities. The Questionnaires will include
detailed inquires related to solid waste and waste water disposal, water demand,
consumption, supply, and quality, energy consumption, and economic activities,
etc…
5. Implement the Sampling Plan, in the light of preliminarily collected information
This report includes six discrete sections including the Introduction. Section II presents the methodology adopted for the collection of data presented in this report. Section III provides the Physical Description of the area updated in the light of the additional geological and hydrogeological investigations undertaken during field visits. Section IV illustrates a detailed description of the field investigation results in the main environmental sectors in the new camp area. Section V portrays the current Management Practices adopted in the solid waste, waste water, water supply and other sectors in the surrounding municipalities. Section VI provides a synopsis of the available data, and highlights the main environmental issues.

Environmental Rapid Assessment United Nations Development Programme (UNDP) Field Investigation Report Methodology
Prepared by ELARD 2-1
2. METHODOLOGY In order to achieve the objectives stated above, the Field Investigation was not limited to field data collection, but also entailed:
1) Meetings with concerned parties and main stakeholders, 2) Field visits in the new camp and surrounding municipalities for additional data gathering and data validation, 3) Interviews with local people, and 4) Water sampling campaign.
2.1.1. Meetings with Concerned Parties
ELARD team held several meetings with the heads of the municipalities of Bebnine, Mhammara, Bhannine, Menieh, Deir Ammar, and Beddawi, during which information relevant to the environmental assessment was gathered. With regards to the new camp, information about current sanitation practices and issues (The Solid waste, the Waste water and the Water supply sectors) of environmental concern was obtained from several stakeholders of the UNRWA and in the Mhammara municipality which has the territorial custody over the new camp. The list of the main stakeholders is presented in Table 2-1
Table 2-1 List of Stakeholders Relevant to the Project
Organization Contact Person Title Phone Number
Municipality of
Mhammara Mr. Nadim Ettellawi Municipality head 06-470394
Municipality of
Bhanine Mr. Mostafa Wehbeh Municipality head 06-461980
Municipality of
Beddawi Mr. Majed Ghemraoui Municipality head 06-389988
Municipality of
Menieh Mr. Mostafa Akl Municipality head 06-460106
Municipality of Deir
Ammar Mr. Ahmad Khalil Eid Municipality head 06- 461411
Municipality of
Bebnine Dr. Haissam El Masri Municipality head 06-740236
UNRWA Mr. Rasheed Ajjawi Head of Engineering and
Infrastructure (NBC) 70-850516
UNRWA Mr. Moussa El Ali Area Sanitation Officer 70-851638
UNRWA Mr. Kassem Rabih Electrical Engineer (NBC) 70-891008
UNRWA Mr. Mohammad
Ghalayini Water Supply officer (NBC) 70-852087
Environmental Rapid Assessment United Nations Development Programme (UNDP) Field Investigation Report Methodology
Prepared by ELARD 2-2
2.1.2. Field Survey
In light of the information gathered through the various meeting held with the concerned parties, a field survey was undertaken in the respective six municipalities (Beddawi, Deir Ammar, Menieh, Bhannine, Mhammara and Bebnine). The main issues tackled during the field Investigation were related to solid waste collection and disposal, wastewater management (household level, network, leakages and disposal), water supply status (quality and quantity), industrial activities generating pollutants and all other particular casualty of environmental concern. A synopsis of the main information gathered during the field survey is presented in Table 2-2.
Table 2-2 Main Information Collected in the Surrounding Municipalities during Field Assessment
Solid Waste Waste Water Water Supply Other sectors
• Quantities
• Types/ Composition
• Mobile storage
• Temporary storage
• Transportation
• Frequency of collection
• Final fate
• Interim storage
• Fees of collection
• Sorting
• Custody
• Quantities
• Network
• Dimensions
• Coverage
• Outlet/final fate
• Treatment
• Percolation pits (number)
• Depth of network
• Age and conditions of the network (extent of leakages/losses)
• Storm Water
• Main resource
• Usage
• Network (Conditions, depth, dimensions, coverage)
• Others (wells springs)
• Coverage/benefiters
• Well Characteristics
• Water supply
• Water demand
• Water Quality
• Reported Contaminations
• Population
• Economic Activities
• Situation during the Nahr El Bared conflict
• Main problems existing in the Municipality
• Water and electricity consumption measures
• Conflicts arising from bordering municipalities
Representatives from each respective Municipality guided the survey and pinpointed the major problems and case events related to leakage of wastewater and water networks in the village. The coordinates of observed sensitive areas and critical locations such as leakages in the network, Platforms for solid waste collection, water wells, springs, and damaged sites in the new cap and Mhammara Municipality etc… were reported using a Global Positioning System (GPS) in the UTM and geographic coordinate systems (WGS84) and documented with respective photographs.
2.1.3. Questionnaires,
Coupled with the field survey, a total of 19 questionnaires which cover all the aspects and sanitation problems predominant in the area were filled by randomly selected people in the six municipalities. Aspects covered by the questionnaire include municipal wastes generation and disposal, Waste water disposal and sanitation, water supply quantity, quality and wells’

Environmental Rapid Assessment United Nations Development Programme (UNDP) Field Investigation Report Methodology
Prepared by ELARD 2-3
characteristics, Air quality and Energy supply needs and sources as portrayed in the form presented in Appendix 1.
2.1.4. Sampling Campaign
The following section presents the methodology adopted for sampling in the old and new camps and surrounding areas. Soil sampling will be postponed to the beginning of September upon the oral request of UNRWA raised on June 30th, 2008 during the progress meeting in UNDP offices in Beirut. Results of the water sampling campaign will be provided in the Final Field Investigation Report. ELARD implemented a comprehensive sampling and laboratory analytical program, which aimed mainly at the following:
• Assess the degree and type of contamination of soil and water resulting from the conflict, i.e., fuel tanks, explosions,
• Evaluate the contamination of water consequent to previous discharge practices or existing point source of pollution prior to the conflict;
• Evaluate the quality of coastal groundwater, with respect to sea water intrusion
The sampling locations were selected in light of the early investigations performed to date mainly based but not limited to the following indicators and factors:
• Physico-chemical standard parameters along with bacteriological pathogen indicators (E-Coli, Enterococci, etc.) were analyzed in groundwater samples from sources located near percolation pits, or wells used for domestic consumption;
• Indicators of organic compounds such as BTEX/ gasoline were also analyzed in groundwater sample located in wells near exploded fuel or diesel tanks, in order to detect fuel or diesel contamination;
• PCB’s were analyzed in only a few samples collected from wells located downstream or in the vicinity of exploded PCB transformers;
The water sampling program included: • Ground water samples from the currently operating wells in the New camp and
surrounding areas
• Surface water samples at various points along the Nahr Bared river course: upstream and downstream to NBC and within the camp.
Limitations encountered during field sampling were mostly limited to some restrictions on sampling from wells in Nahr El Bared camp especially that following the conflict, the wells located in the old camp are currently either collapsed, or neither rehabilitated nor equipped with riser pipes.
2.1.4.1. Procedures
Given that no guidelines relating to sampling protocols for groundwater and surface water
exist in Lebanon; ELARD team adopted the methods and procedures presented in the "New
Jersey Field Sampling Procedures Manual", (2005), a worldwide recognized sampling
Environmental Rapid Assessment United Nations Development Programme (UNDP) Field Investigation Report Methodology
Prepared by ELARD 2-4
technical guidance manual. The primary intent of this manual has always been to promote
accuracy and consistency when environmental samples are collected and prepared for
analyses.
Standard Operating Procedures for Sample Collection and Sample Handling were adopted
throughout the whole process of sampling. The Samples were stored in cool container at 40C.
The Parameters for the water samples were analyzed locally in the Laboratory of the
American University of Beirut; (AUB). The sampling campaign was implemented in four days in
July and August (Table 2-3), during low flow periods where water dilution is considered
minimal.
Table 2-3 Sampling Program as performed during the 4 site visits conducted by ELARD
Date Number of samples Sampling Locations
Visit 23 July 2008 6 Bebnine Spring, NBC-well 10, NBC well 6, Nahr El Bared River, Beddawi well 1, Beddawi well 2
Visit 30 July 2008 5 NBC-well 3, NBC-well 5, NBC-Gineen well, NBC-Hamed well, Mhammara well
Visit 31 July 2008 3 Ouyoun El Samak, Nahr El Bared River
Visit 6 August 2008 3 NBC-well 2, Deir Ammar well, Menieh well
Total 17
2.1.4.2. Field sampling methodology
2.1.4.2.1 Collection Methodology
The well sampling was undertaken following the Ground Water Sampling Standard Operating
Procedure (SOP) (Field Sampling Procedures Manual, New Jersey, 2005, chapter 9). All
equipments were also handled as little as possible prior to use with disposable gloves worn at
all times when handled. Decontamination of all the equipments was performed prior to field
visit. It was ensured that sampling equipments are always stored away from solvents,
gasoline, exhaust emissions, or other equipment and/or materials that may impact the
integrity of prepared sampling instruments. A record was kept of the date and time and
labeled on the sampling device and containers. Water was sampled following this
procedure (Figure 2-1 and Figure 2-2):
o Prior to collecting groundwater samples, unless the well was not pumped prior to
sampling or not operational, the well was purged (5 well volumes of water) to
remove any stagnant water in the well casing and to ensure that at last 95 % of the
water sample originates from the aquifer formation being sampled.
o Water was then collected from the rising pipe, when possible; otherwise water was
collected from the nearest tap connected to the well, usually located at a maximum
distance of 20 meters from the source.
Environmental Rapid Assessment United Nations Development Programme (UNDP) Field Investigation Report Methodology
Prepared by ELARD 2-5
o Measurements of pH, water level, conductivity and temperature were performed in-
situ using a field pH, Field Conductimeter and temperature meter. It was ensured that
all the equipments were calibrated with blank and standards solutions according to
standards calibrating procedures, prior to field work initiation. A manual water level
meter was used, when applicable, for static water level measurements in the well. It
was ensured that the probe ran plumb vertically inside the well to avoid errors due to
the sinuosity of the tape meter.
a) b)
Figure 2-1 Water sample collection from a) surface water: Nahr El Bared River; Ouyoun El Samak Dam, b) Well 3 in Nahr El Bared Camp
c) d)
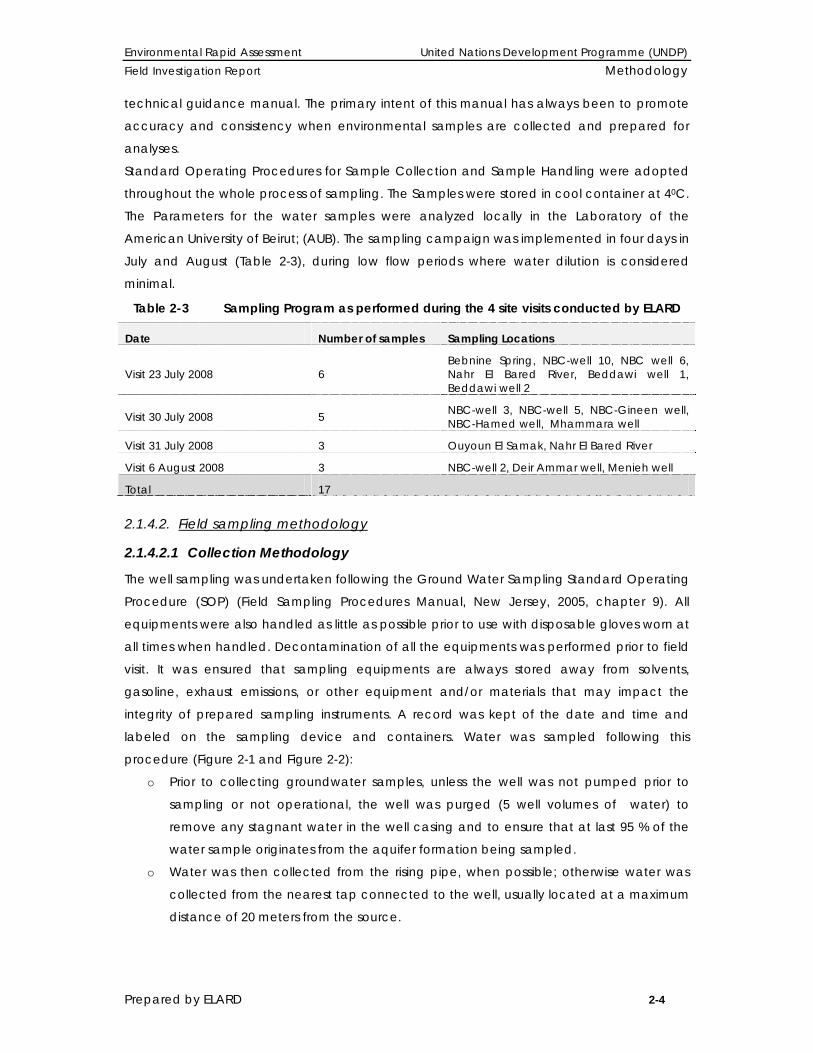
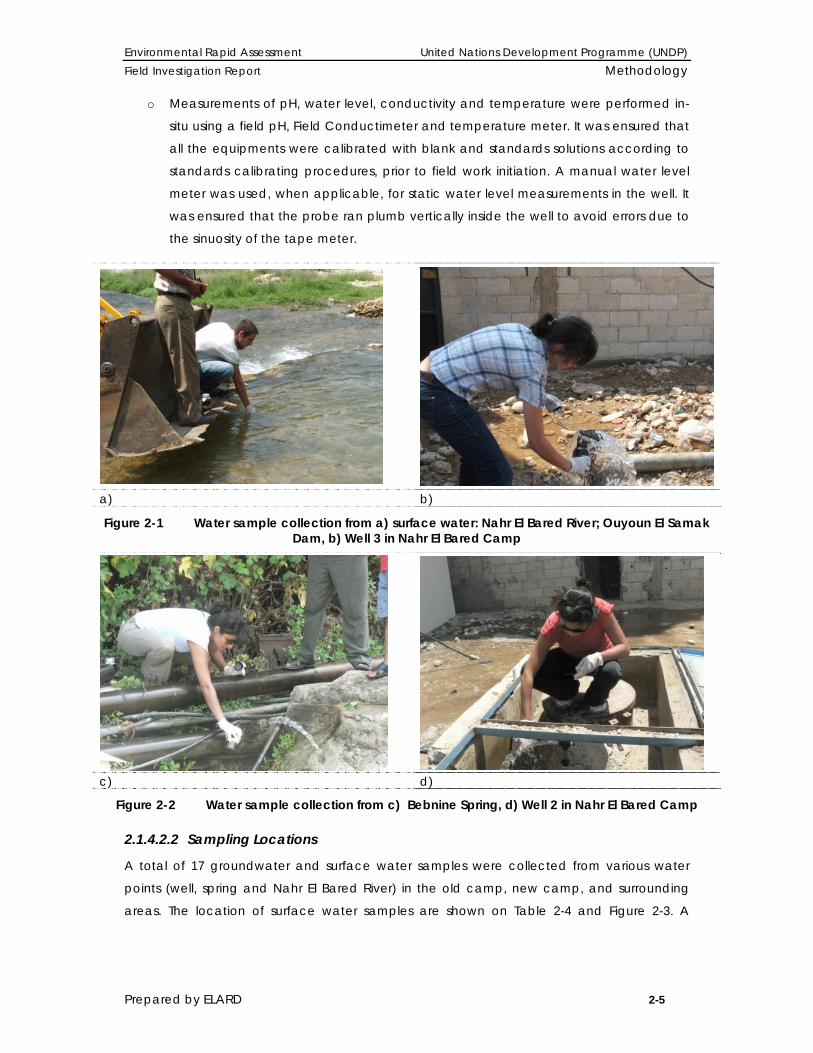
Figure 2-2 Water sample collection from c) Bebnine Spring, d) Well 2 in Nahr El Bared Camp
2.1.4.2.2 Sampling Locations
A total of 17 groundwater and surface water samples were collected from various water
points (well, spring and Nahr El Bared River) in the old camp, new camp, and surrounding
areas. The location of surface water samples are shown on Table 2-4 and Figure 2-3. A

Environmental Rapid Assessment United Nations Development Programme (UNDP) Field Investigation Report Methodology
Prepared by ELARD 2-6
summary of the sampling plan, along with the analytical parameters required in light of the
available information is provided in Table 2-5.
Figure 2-3 Location of Water Sampling Points in the Project Area
Table 2-4 Coordinates of the Ground Water Sampling Locations
Village Type Label Name X Y
DEG MIN SEC DEG MIN SEC Ain Bebnine Spring NBC 14 Bebnine Spring 34 29 28.2 35 59 53.4
NBC New Camp Well NBC 10 Well 10 34 30 37.2 35 57 48.6
NBC New Camp Well NBC 6 Well 6 34 30 31.8 35 57 42.6
NBC New Camp Surface Water
NBC SW bridge NBC downstream 34 30 31.8 35 57 42.6
Beddawi Well Well Beddawi 1
Beddawi well 1 34 30 31.8 35 57 42.6
Beddawi Well Well Beddawi 2
Beddawi well 2 34 27 17.4 35 52 22.8
NBC New Camp Well Well 3 Well 3 34 30 35.4 35 57 45.0

Environmental Rapid Assessment United Nations Development Programme (UNDP) Field Investigation Report Methodology
Prepared by ELARD 2-7
Village Type Label Name X Y NBC New Camp Well Well 5 Well 5 34 30 34.8 35 57 43.2
NBC New Camp Well Gineen Gineen well 34 30 39.6 35 57 57.6
NBC New Camp Well Hamed Hamed well 34 30 42.6 35 57 58.2
Mhammara Well Mhamara Mhammara well 34 30 17.4 35 58 24.0
Ouyoun El Samak Surface Water
Dam Ouyoun
Ouyoun El Samak upstream 34 26 22.8 36 1 10.2
Ouyoun El Samak Spring Ouyoun El Samak
Ouyoun El Samak spring 34 26 19.8 36 0 13.8
Nahr El Bared river
Surface Water
Rawda Nahr El Bared surface water 34 28 15 35 59 20.4
NBC New Camp Well Well 2 Well 2 34 30 36 35 57 45.6
Deir Ammar Well Deir Ammar Deir Ammar well 34 27 20.4 35 54 34.8
Menieh Well Menieh Menieh well 34 27 59.4 35 56 7.8
Table 2-5 Collected Samples and Associated Analyzed Parameters
Sample Number Type
Heav
y M
etal
s: A
rsen
ic, B
ariu
m, C
adm
ium
, Chr
omiu
m,
Cop
per,
Lead
, Nic
kel,
Zinc,
and
Mer
cury
Che
mic
al
Oxy
gen
dem
and
, Bi
olog
ical
O
xyge
nD
eman
d
Tota
l D
issol
ved
So
lids,
Tota
l Su
spen
ded
So
lids,
pH,
Con
duc
tivity
To
tal a
nd F
ecal
Col
iform
Tota
l Har
dne
ss, C
alci
um a
nd M
agne
sium
Ha
rdne
ss
BTEX
Poly
Chl
orin
ated
Bip
heny
l’s
Chr
omiu
m V
I
Mag
nesiu
m,
Cal
cium
, Iro
n,
Sod
ium
, Po
tass
ium
,C
hlor
ides
, N
itra
tes,
Nitr
ites,
Bica
rbon
ate
s,
NBC 14 Spring
Ouyoun El Samak Spring
NBC SW bridge Surface Water
Dam Ouyoun Surface Water
Rawda Surface Water
NBC 10 Well
NBC 6 Well
Well Beddawi 1 Well
Well Beddawi 2 Well
Well 3 Well

Environmental Rapid Assessment United Nations Development Programme (UNDP) Field Investigation Report Methodology
Prepared by ELARD 2-8
Sample Number Type
Heav
y M
etal
s: A
rsen
ic, B
ariu
m, C
adm
ium
, Chr
omiu
m,
Cop
per,
Lead
, Nic
kel,
Zinc,
and
Mer
cury
Che
mic
al
Oxy
gen
dem
and
, Bi
olog
ical
O
xyge
nD
eman
d
Tota
l D
issol
ved
So
lids,
Tota
l Su
spen
ded
So
lids,
pH,
Con
duc
tivity
To
tal a
nd F
ecal
Col
iform
Tota
l Har
dne
ss, C
alci
um a
nd M
agne
sium
Ha
rdne
ss
BTEX
Poly
Chl
orin
ated
Bip
heny
l’s
Chr
omiu
m V
I
Mag
nesiu
m,
Cal
cium
, Iro
n,
Sod
ium
, Po
tass
ium
,C
hlor
ides
, N
itra
tes,
Nitr
ites,
Bica
rbon
ate
s,
Well 5 Well
Gineen Well
Hamed Well
Mhammara Well
Well 2 Well
Deir Ammar Well
Menieh Well
Total 17
2.1.4.3. Storage, Preservation and Shipment
Collected samples are preserved at a temperature of 4 0C during transportation and
storage. Samples were sent to the Corelab in the American University of Beirut, and analyzed
for the parameters listed in Table 2-5 within a maximum of 8 hours of sampling.
Environmental Rapid Assessment United Nations Development Programme (UNDP) Field Investigation Report Error! Reference source not found.
Prepared by ELARD 3-1
3. PHYSICAL DESCRIPTION OF THE AREA
3.1.1. Topography
The municipalities surrounding Nahr El Bared old Camp are from south to north Beddawi, Deir Ammar, Menieh, Bhannine, Mhammara, Bebnine (Table 3-1). The so-called New Nahr El Bared Camp surrounding the old camp lies 16 km from the city of Tripoli, south to Al Abdeh Village on the coastal Lebanese trench. It mostly consists of a relatively plain area plunging towards the sea, where elevation ranges between sea level and 16-17 m above sea level. The Southern part of the New Camp belongs to Bhannine Municipality, South to the old camp. About 90% of the New Camp territories belong to Mhammara Municipality. Nahr El Bared River crosses the south western part of the new camp (Table 3-1).
Table 3-1 Elevation Ranges and Surface Areas of the Surrounding Municipalities of Nahr El Bared Camp
Municipality Elevation Range (m) Area (km2)
Beddawi 0-111 5.1
Deir Ammar 0-320 3.4
Menieh 0-494 13.5
Bhannine 0-140 6.5
Mhammara 0-80 3.8
Bebnine 0-150 6.8
3.1.2. Meteorology
Temperature and Precipitation data witnessed during the time span of the conflict are presented herein as well as wind data for the year 2004 giving the maximum and average wind speeds, in addition to the wind direction in the adjacent areas. The meteorological data were collected from Al-Abdeh (34:31N, 36:00E, 40 m) and from Tripoli (34:27N, 35:28E, 5 m) weather stations in North Lebanon.
3.1.2.1. Temperature
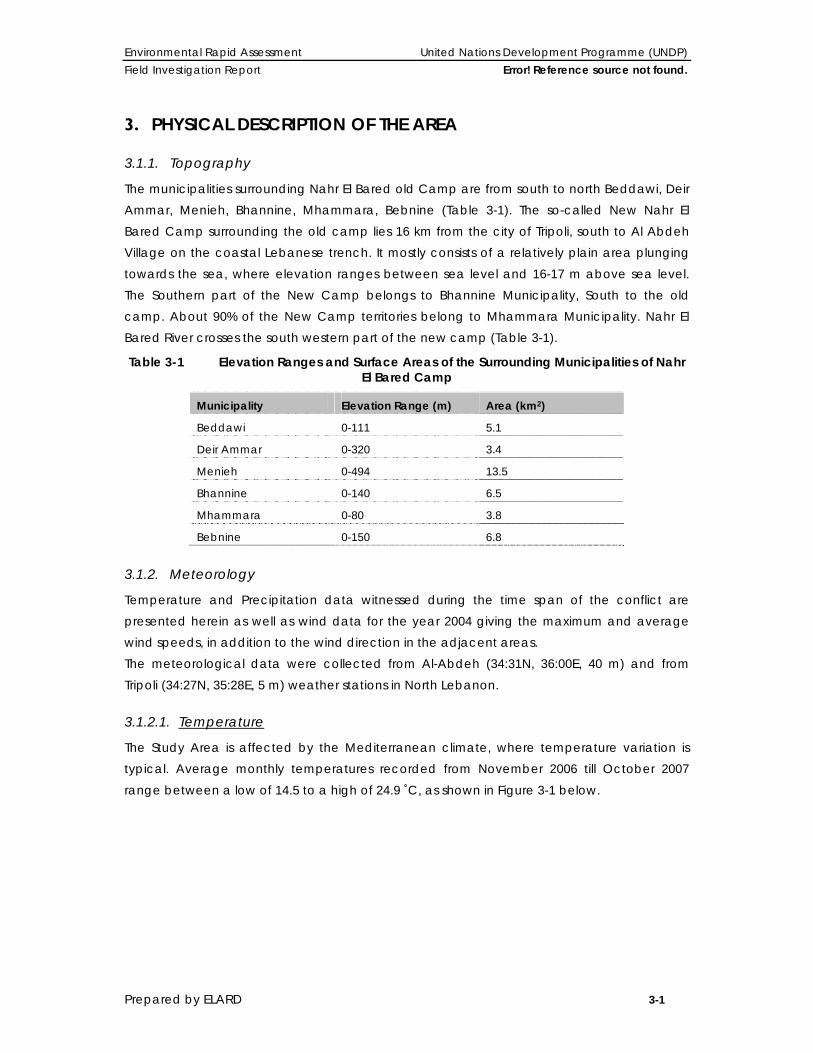
The Study Area is affected by the Mediterranean climate, where temperature variation is typical. Average monthly temperatures recorded from November 2006 till October 2007 range between a low of 14.5 to a high of 24.9 ˚C, as shown in Figure 3-1 below.
Environmental Rapid Assessment United Nations Development Programme (UNDP) Field Investigation Report Error! Reference source not found.
Prepared by ELARD 3-2
0.0
5.0
10.0
15.0
20.0
25.0
30.0
35.0
Nov-06
Dec-06
Jan-07
Feb-07
Mar-07
Apr-07
May-07
Jun-07
Jul-07
Aug-07
Sep-07
Oct-07
Tem
pera
ture
oC
Avg min.Avg max.
Figure 3-1 Average Max & Min Temperatures at Abdeh Weather Station (Nov, 06-Oct, 07)
3.1.2.2. Wind
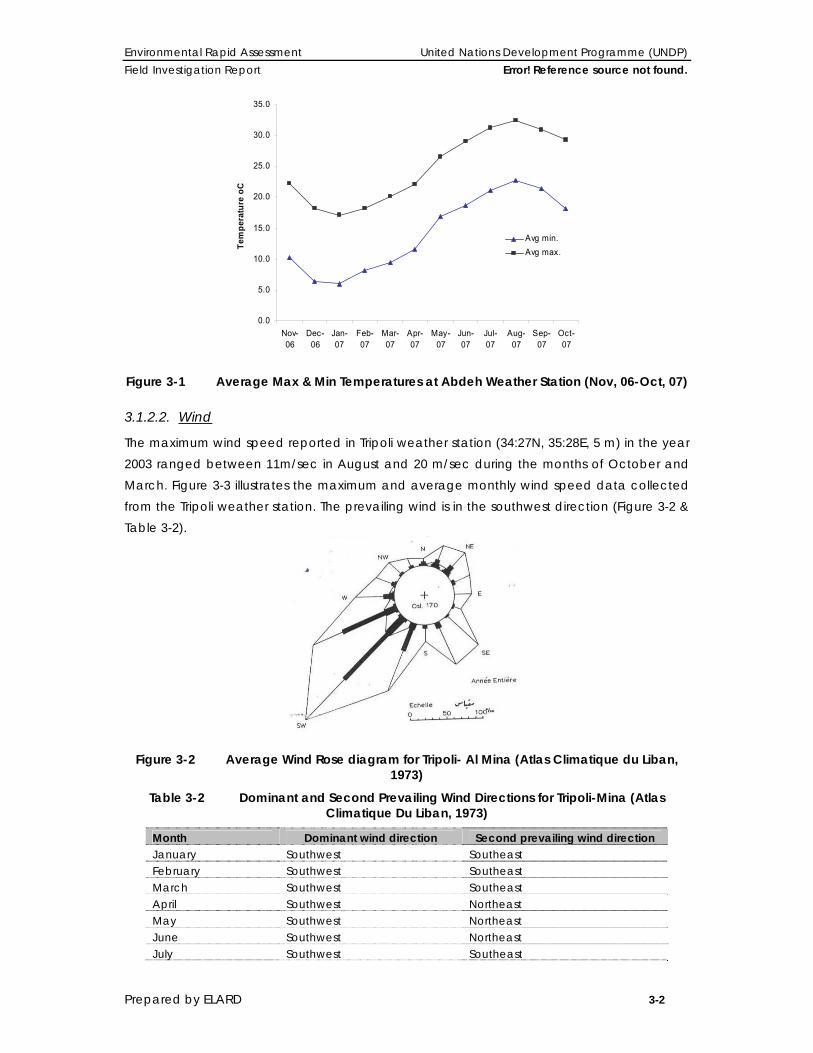
The maximum wind speed reported in Tripoli weather station (34:27N, 35:28E, 5 m) in the year 2003 ranged between 11m/sec in August and 20 m/sec during the months of October and March. Figure 3-3 illustrates the maximum and average monthly wind speed data collected from the Tripoli weather station. The prevailing wind is in the southwest direction (Figure 3-2 & Table 3-2).
Figure 3-2 Average Wind Rose diagram for Tripoli- Al Mina (Atlas Climatique du Liban,
1973)
Table 3-2 Dominant and Second Prevailing Wind Directions for Tripoli-Mina (Atlas Climatique Du Liban, 1973)
Month Dominant wind direction Second prevailing wind direction January Southwest Southeast February Southwest Southeast March Southwest Southeast April Southwest Northeast May Southwest Northeast June Southwest Northeast July Southwest Southeast
Environmental Rapid Assessment United Nations Development Programme (UNDP) Field Investigation Report Error! Reference source not found.
Prepared by ELARD 3-3
Month Dominant wind direction Second prevailing wind direction August Southwest Southeast September Southeast Southwest October Southeast Southwest November Southeast Southwest December Southeast Southwest, East, Northeast
0
5
10
15
20
25
Janu
ary
Febr
uary
Marc
h Apr
ilMay
June Ju
ly
Augus
t
Septembe
r
Octobe
r
Novem
ber
Decem
ber
max
win
d sp
eed
(m/s
ec)
0
1
1
2
2
3
3
4
4
5
aver
age
win
d sp
eed
(m/s
ec)
Max wind speedAvg wind speed
Figure 3-3 Maximum & Average Wind Speed Data from Tripoli Weather Station (2003)
3.1.2.3. Precipitation
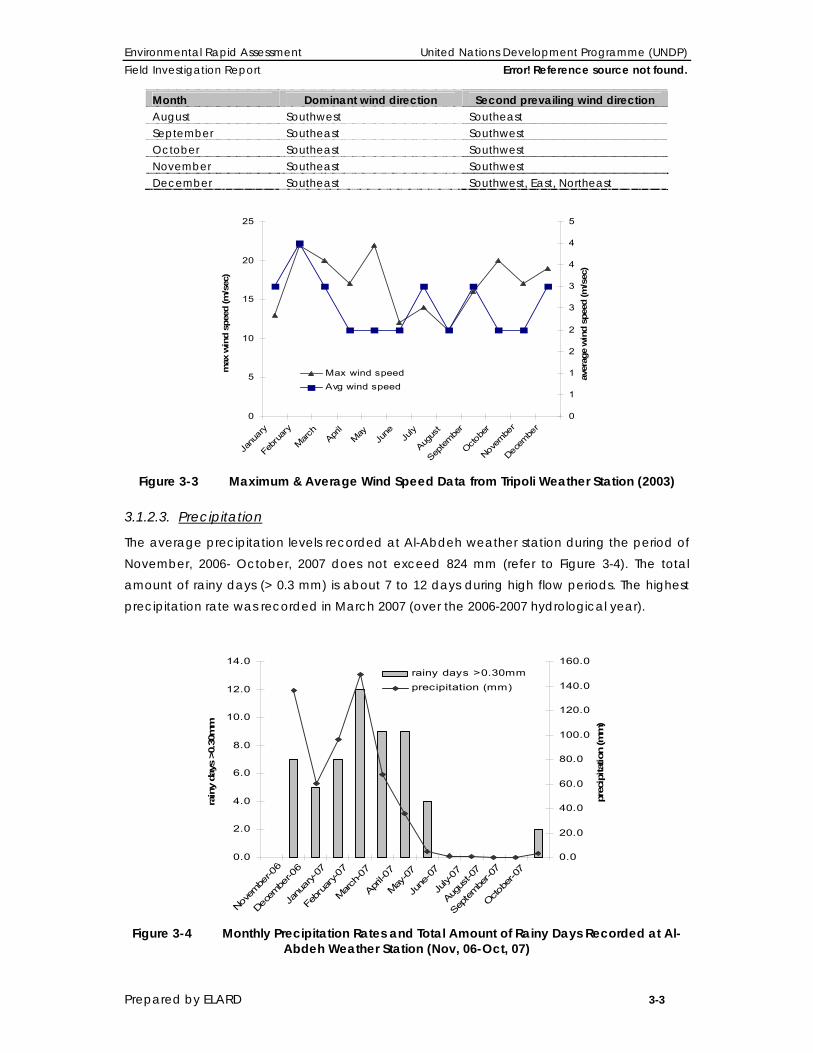
The average precipitation levels recorded at Al-Abdeh weather station during the period of November, 2006- October, 2007 does not exceed 824 mm (refer to Figure 3-4). The total amount of rainy days (> 0.3 mm) is about 7 to 12 days during high flow periods. The highest precipitation rate was recorded in March 2007 (over the 2006-2007 hydrological year).
0.0
2.0
4.0
6.0
8.0
10.0
12.0
14.0
Novem
ber-0
6
Decem
ber-0
6
Janu
ary-07
Febr
uary-0
7
March
-07
April-0
7
May
-07
June
-07
July-
07
Augus
t-07
Septembe
r-07
Octobe
r-07
rain
y da
ys >
0.30
mm
0.0
20.0
40.0
60.0
80.0
100.0
120.0
140.0
160.0
prec
ipita
tion
(mm
)
rainy days >0.30mmprecipitation (mm)
Figure 3-4 Monthly Precipitation Rates and Total Amount of Rainy Days Recorded at Al-
Abdeh Weather Station (Nov, 06-Oct, 07)

Environmental Rapid Assessment United Nations Development Programme (UNDP) Field Investigation Report Error! Reference source not found.
Prepared by ELARD 3-4
3.1.3. Geology
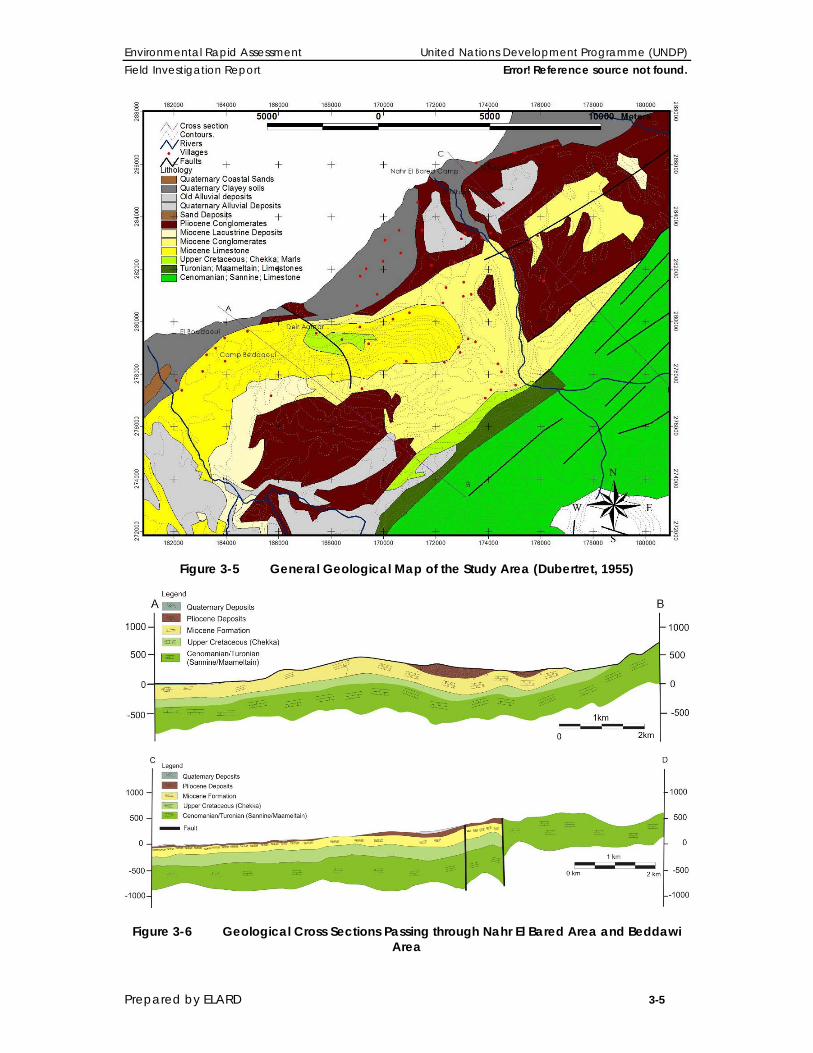
The area of Nahr El Bared constitutes the southern portion of a depression of structural origin situated between the Alaouite Massif in the North in Syria, and the Basaltic Plateau of Tell Kalakh in the east (FAO, 1970). The geological formations exposed In the Nahr El Bared camp and the surrounding areas are as follows from younger to older:
• Quaternary deposits at the coastal stretch composed of beach sands on the coast,
and sandy clay and clay loam with pebbles covering the rest of the camp area. The
Quaternary deposits are also formed in the subsurface by conglomerates, sandy
limestone and sandstone.
Other formations ranging from Miocene (Tertiary) to Cenomanian (Cretaceous) are expected in the subsurface and in the elevated areas away from the coast in the area of Beddawi, Menieh, and Deir Ammar as follows:
• Pliocene and Miocene units underlying the Quaternary deposits when present are
composed of limestone, marl, clay and gypsum. The thickness of the Pliocene and
Miocene strata ranges variably between 150 and 250 m.
• Senonian sequence (locally known as Chekka formation) consisting of marls and
marly limestone is found below the Miocene strata. The thickness of the Chekaa
Formation is about 200-250 m
• Cenomanian-Turonian (locally known as Sannine-Maameltain formation) strata
composed limestone and cherty limestone of Cretaceous age. The Top of the
Cenomanian Turonian sequence is found at about 450 m in the surrounding areas,
whereas it is located at about 500- 600 m below the Nahr El Bared Camps at the
coast.
Environmental Rapid Assessment United Nations Development Programme (UNDP) Field Investigation Report Error! Reference source not found.
Prepared by ELARD 3-5
Figure 3-5 General Geological Map of the Study Area (Dubertret, 1955)
Figure 3-6 Geological Cross Sections Passing through Nahr El Bared Area and Beddawi Area
Environmental Rapid Assessment United Nations Development Programme (UNDP) Field Investigation Report Error! Reference source not found.
Prepared by ELARD 3-6
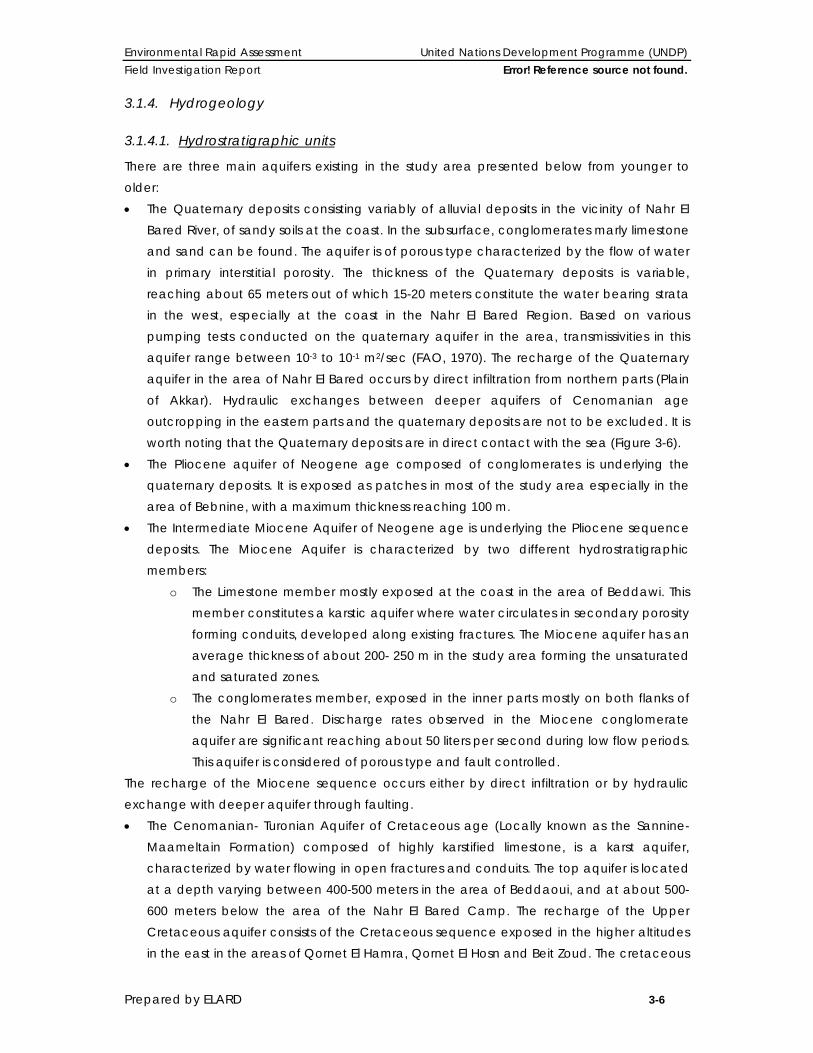
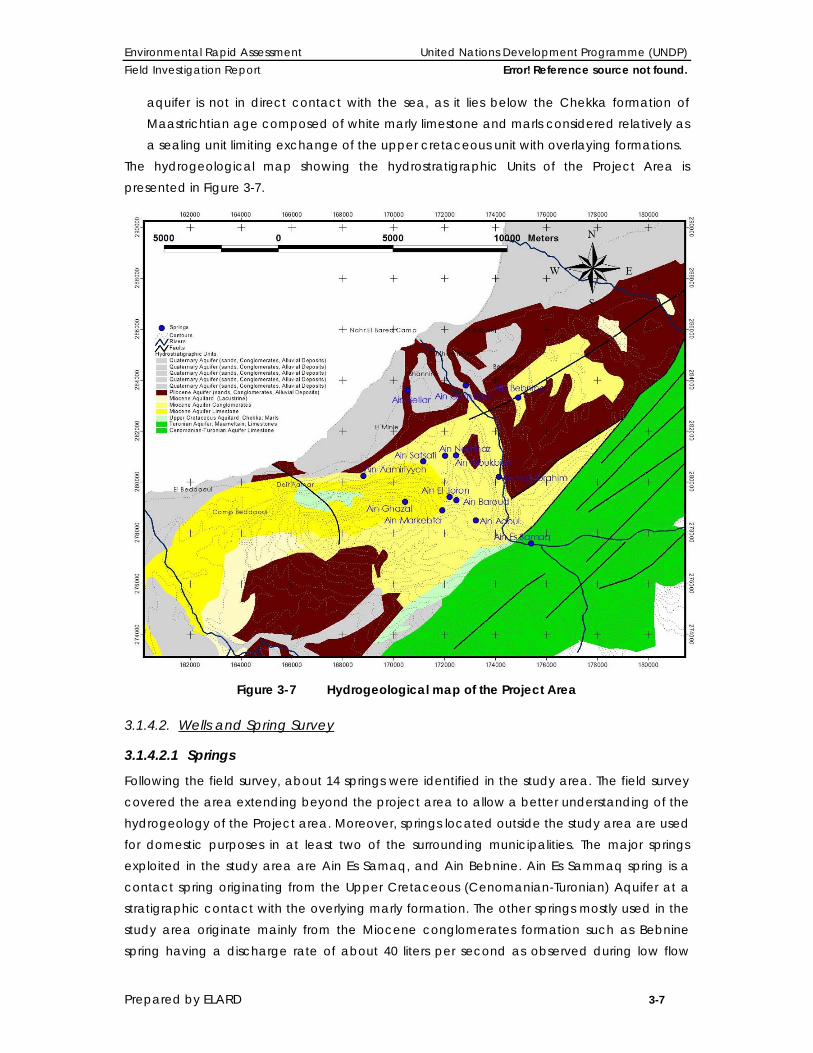
3.1.4. Hydrogeology
3.1.4.1. Hydrostratigraphic units
There are three main aquifers existing in the study area presented below from younger to older: • The Quaternary deposits consisting variably of alluvial deposits in the vicinity of Nahr El
Bared River, of sandy soils at the coast. In the subsurface, conglomerates marly limestone and sand can be found. The aquifer is of porous type characterized by the flow of water in primary interstitial porosity. The thickness of the Quaternary deposits is variable, reaching about 65 meters out of which 15-20 meters constitute the water bearing strata in the west, especially at the coast in the Nahr El Bared Region. Based on various pumping tests conducted on the quaternary aquifer in the area, transmissivities in this aquifer range between 10-3 to 10-1 m2/sec (FAO, 1970). The recharge of the Quaternary aquifer in the area of Nahr El Bared occurs by direct infiltration from northern parts (Plain of Akkar). Hydraulic exchanges between deeper aquifers of Cenomanian age outcropping in the eastern parts and the quaternary deposits are not to be excluded. It is worth noting that the Quaternary deposits are in direct contact with the sea (Figure 3-6).
• The Pliocene aquifer of Neogene age composed of conglomerates is underlying the quaternary deposits. It is exposed as patches in most of the study area especially in the area of Bebnine, with a maximum thickness reaching 100 m.
• The Intermediate Miocene Aquifer of Neogene age is underlying the Pliocene sequence deposits. The Miocene Aquifer is characterized by two different hydrostratigraphic members:
o The Limestone member mostly exposed at the coast in the area of Beddawi. This member constitutes a karstic aquifer where water circulates in secondary porosity forming conduits, developed along existing fractures. The Miocene aquifer has an average thickness of about 200- 250 m in the study area forming the unsaturated and saturated zones.
o The conglomerates member, exposed in the inner parts mostly on both flanks of the Nahr El Bared. Discharge rates observed in the Miocene conglomerate aquifer are significant reaching about 50 liters per second during low flow periods. This aquifer is considered of porous type and fault controlled.
The recharge of the Miocene sequence occurs either by direct infiltration or by hydraulic exchange with deeper aquifer through faulting. • The Cenomanian- Turonian Aquifer of Cretaceous age (Locally known as the Sannine-
Maameltain Formation) composed of highly karstified limestone, is a karst aquifer, characterized by water flowing in open fractures and conduits. The top aquifer is located at a depth varying between 400-500 meters in the area of Beddaoui, and at about 500-600 meters below the area of the Nahr El Bared Camp. The recharge of the Upper Cretaceous aquifer consists of the Cretaceous sequence exposed in the higher altitudes in the east in the areas of Qornet El Hamra, Qornet El Hosn and Beit Zoud. The cretaceous
Environmental Rapid Assessment United Nations Development Programme (UNDP) Field Investigation Report Error! Reference source not found.
Prepared by ELARD 3-7
aquifer is not in direct contact with the sea, as it lies below the Chekka formation of Maastrichtian age composed of white marly limestone and marls considered relatively as a sealing unit limiting exchange of the upper cretaceous unit with overlaying formations.
The hydrogeological map showing the hydrostratigraphic Units of the Project Area is presented in Figure 3-7.
Figure 3-7 Hydrogeological map of the Project Area
3.1.4.2. Wells and Spring Survey
3.1.4.2.1 Springs
Following the field survey, about 14 springs were identified in the study area. The field survey covered the area extending beyond the project area to allow a better understanding of the hydrogeology of the Project area. Moreover, springs located outside the study area are used for domestic purposes in at least two of the surrounding municipalities. The major springs exploited in the study area are Ain Es Samaq, and Ain Bebnine. Ain Es Sammaq spring is a contact spring originating from the Upper Cretaceous (Cenomanian-Turonian) Aquifer at a stratigraphic contact with the overlying marly formation. The other springs mostly used in the study area originate mainly from the Miocene conglomerates formation such as Bebnine spring having a discharge rate of about 40 liters per second as observed during low flow
Environmental Rapid Assessment United Nations Development Programme (UNDP) Field Investigation Report Error! Reference source not found.
Prepared by ELARD 3-8
periods. Other springs generating from the Miocene conglomerates located outside the Project Area are Al Adoui Spring, Al Safsafi Spring, and Ain El Ghazal Spring.
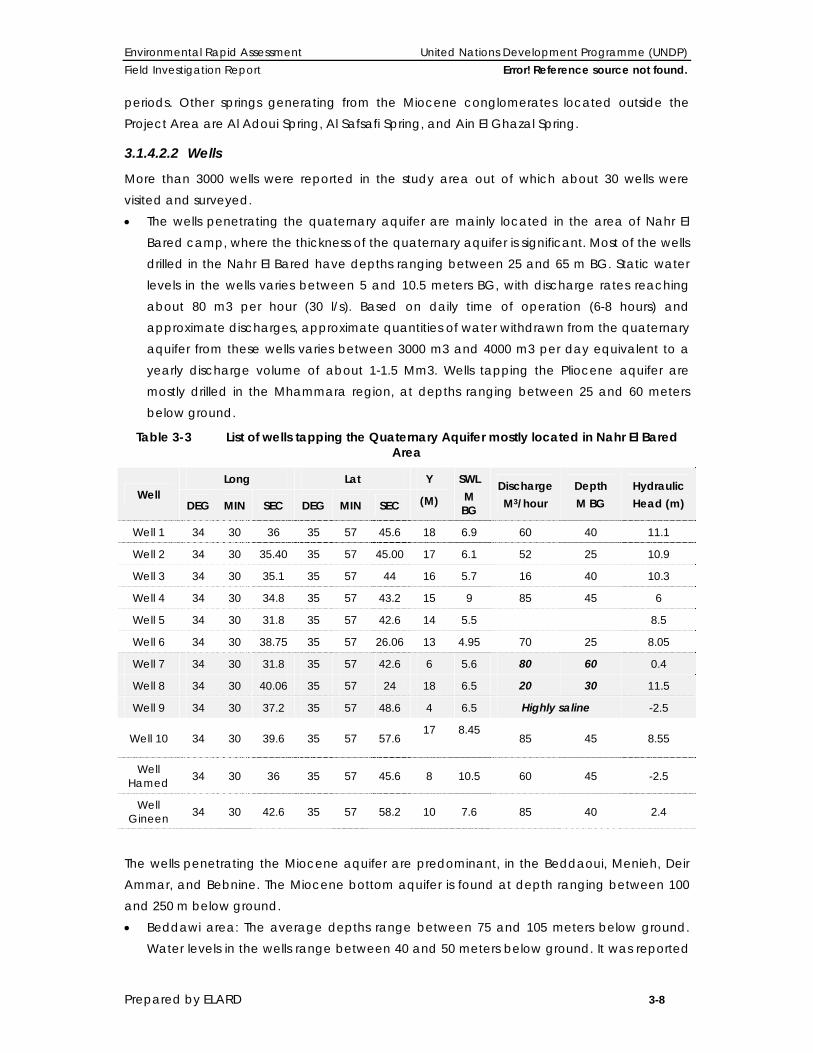
3.1.4.2.2 Wells
More than 3000 wells were reported in the study area out of which about 30 wells were visited and surveyed. • The wells penetrating the quaternary aquifer are mainly located in the area of Nahr El
Bared camp, where the thickness of the quaternary aquifer is significant. Most of the wells drilled in the Nahr El Bared have depths ranging between 25 and 65 m BG. Static water levels in the wells varies between 5 and 10.5 meters BG, with discharge rates reaching about 80 m3 per hour (30 l/s). Based on daily time of operation (6-8 hours) and approximate discharges, approximate quantities of water withdrawn from the quaternary aquifer from these wells varies between 3000 m3 and 4000 m3 per day equivalent to a yearly discharge volume of about 1-1.5 Mm3. Wells tapping the Pliocene aquifer are mostly drilled in the Mhammara region, at depths ranging between 25 and 60 meters below ground.
Table 3-3 List of wells tapping the Quaternary Aquifer mostly located in Nahr El Bared Area
Well Long Lat Y SWL
M BG
Discharge M3/hour
Depth M BG
Hydraulic Head (m) DEG MIN SEC DEG MIN SEC (M)
Well 1 34 30 36 35 57 45.6 18 6.9 60 40 11.1
Well 2 34 30 35.40 35 57 45.00 17 6.1 52 25 10.9
Well 3 34 30 35.1 35 57 44 16 5.7 16 40 10.3
Well 4 34 30 34.8 35 57 43.2 15 9 85 45 6
Well 5 34 30 31.8 35 57 42.6 14 5.5 8.5
Well 6 34 30 38.75 35 57 26.06 13 4.95 70 25 8.05
Well 7 34 30 31.8 35 57 42.6 6 5.6 80 60 0.4
Well 8 34 30 40.06 35 57 24 18 6.5 20 30 11.5
Well 9 34 30 37.2 35 57 48.6 4 6.5 Highly saline -2.5
Well 10 34 30 39.6 35 57 57.6 17 8.45
85 45 8.55
Well Hamed 34 30 36 35 57 45.6 8 10.5 60 45 -2.5
Well Gineen 34 30 42.6 35 57 58.2 10 7.6 85 40 2.4
The wells penetrating the Miocene aquifer are predominant, in the Beddaoui, Menieh, Deir Ammar, and Bebnine. The Miocene bottom aquifer is found at depth ranging between 100 and 250 m below ground. • Beddawi area: The average depths range between 75 and 105 meters below ground.
Water levels in the wells range between 40 and 50 meters below ground. It was reported

Environmental Rapid Assessment United Nations Development Programme (UNDP) Field Investigation Report Error! Reference source not found.
Prepared by ELARD 3-9
that static water levels are witnessing a significant decreasing general trend of about 0.5 meter per year. Wells in the Beddawi area are equipped with riser pipes yielding about 2 liters per second. Few wells have a greater discharge reaching 15 liters per second. More than 500 private wells were reported in the area of Beddawi;
• Bebnine area: The average depth of wells tapping the Miocene aquifer is 150 meters. Water levels are rather deep at about 100 meters below ground. Average discharge rates range between 1 and 2 liters per second. More than 150 well are reported in the area of Bebnine;
• Menieh area: Wells tapping the Miocene aquifer varies between 50 and 120 meters depending on the well location. There are more than 1000 wells reported in the Menieh, yielding about 3-4 liters per second;
• Deir Ammar: Most of the wells tapping the Miocene aquifer have depths of about 70- 80 meters, yielding about 1-2 liter per second, equipped with 1-inch riser pipes. More than 40 private wells were reported in the area of Menieh.
• One public well serving the Mhammara municipality, yielding 6 m3 per hour, a total of 0.04 Mm3 per year is tapping the Miocene Aquifer at a depth of 130 meters below ground. Static water level is observed at about 40 meters below ground.
Table 3-4 Characteristics of the wells tapping the Miocene Aquifer in the study area
Municipality Type Depth of wells (m BG)
Static water Levels (m BG)
Discharge rates (L/ sec)
Number of reported wells
Comments
Beddawi Limestone 75-105 40-50 2-15 >500 Decreasing water level trend-
Menieh Limestone 50-120 20 3-4 >1000 Domestic use
Deir Ammar Limestone 70-80 50-62 1-2 40 Domestic use
Bebnine Conglomerates 150 100 1-2 194 Domestic use
Mhammara Conglomerates 130 40 1.6 1 Domestic Use
There are no wells tapping the cretaceous aquifer in the project Area, as the top aquifer appears to be at depths exceeding 450 m in places.
Environmental Rapid Assessment United Nations Development Programme (UNDP) Field Investigation Report Field Investigation: New Camp
Prepared by ELARD 4-1
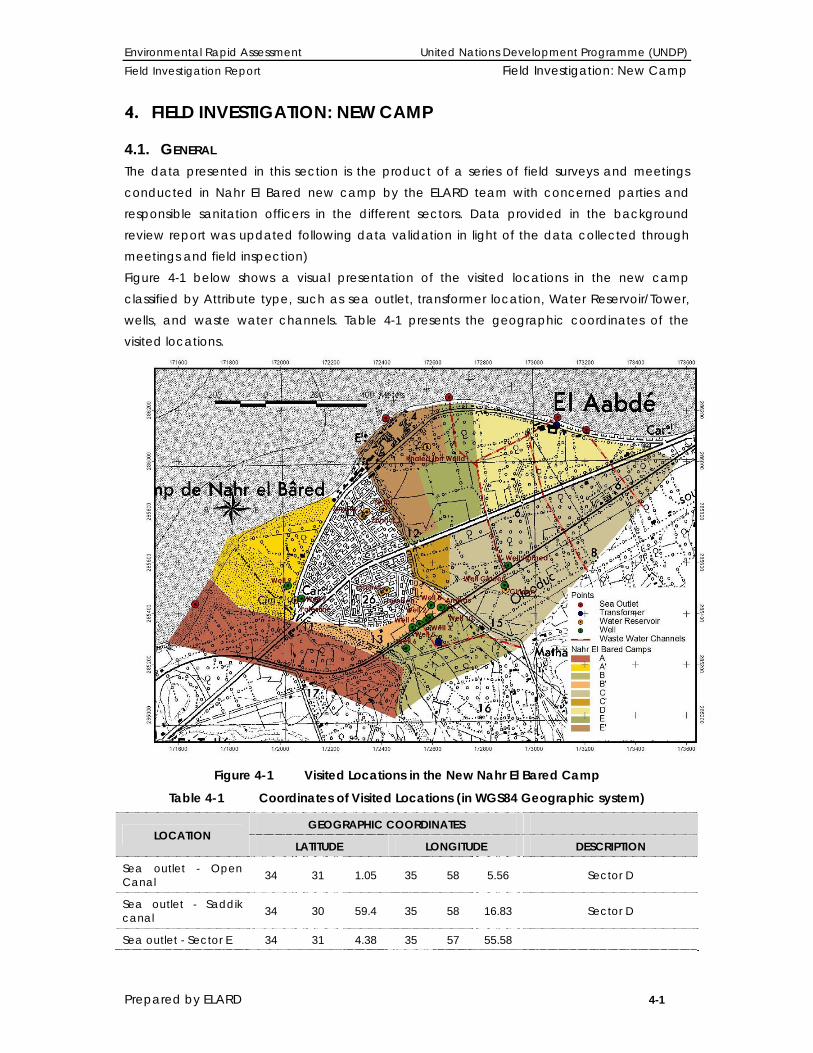
4. FIELD INVESTIGATION: NEW CAMP
4.1. GENERAL The data presented in this section is the product of a series of field surveys and meetings conducted in Nahr El Bared new camp by the ELARD team with concerned parties and responsible sanitation officers in the different sectors. Data provided in the background review report was updated following data validation in light of the data collected through meetings and field inspection) Figure 4-1 below shows a visual presentation of the visited locations in the new camp classified by Attribute type, such as sea outlet, transformer location, Water Reservoir/Tower, wells, and waste water channels. Table 4-1 presents the geographic coordinates of the visited locations.
Figure 4-1 Visited Locations in the New Nahr El Bared Camp
Table 4-1 Coordinates of Visited Locations (in WGS84 Geographic system)
LOCATION GEOGRAPHIC COORDINATES
LATITUDE LONGITUDE DESCRIPTION
Sea outlet - Open Canal 34 31 1.05 35 58 5.56 Sector D
Sea outlet - Saddik canal 34 30 59.4 35 58 16.83 Sector D
Sea outlet - Sector E 34 31 4.38 35 57 55.58

Environmental Rapid Assessment United Nations Development Programme (UNDP) Field Investigation Report Field Investigation: New Camp
Prepared by ELARD 4-2
LOCATION GEOGRAPHIC COORDINATES
LATITUDE LONGITUDE DESCRIPTION
Sea outlet - Sector E' 34 31 3.74 35 57 47.44 Non operational
Sea outlet - Sector A 34 30 40.03 35 57 14.43
Khaled Ibn Walid 34 30 57.72 35 57 52.05
Completely Destroyed Sector E’
Concrete transformer Destroyed & Replaced
34 31 0.93 35 58 5.64 Sector D
Transformer destroyed and replaced
34 30 32.27 35 57 47.47 Sector B
Water Tower Amwas 34 30 39.6 35 57 57.6 Rehabilitated
Water Tower Gineen 34 30 42.6 35 57 58.2 Rehabilitated
4.2. POPULATION
4.2.1. Pre-conflict population size
The new camp, inhabited at 80% by Palestinian families, has a total number of 2,055 housing
units (GoL, UNRWA, 2008) providing shelter for about 10,275 inhabitants. As shown in Table
4-2, the average demographic density for the new camp is about 90 inhabitants/ha ranging
between 43 and 119 inhabitants per hectare in the various sectors. Densities of 135
persons/ha were reported by UNRWA (UNRWA & Nahr El Bared Reconstruction Commission-
for Civil Action and Studies (NRC), 2007). United Nations World Population Prospects (Revised
2004) showed that the population densities in Lebanon range between 3.74 persons/ha, per
total land and 22.9 persons/ha, in arable land. Therefore the density of population in the new
camp is considered significant with respect to the average density in Lebanon.
Table 4-2 New Camp Sector’s Division
Sector Area (hectare)
Population (families)
Population (Inhabitants)
Density (Inhabitant/hectare)
A 18.9 522 2610 86
A' 11.4
B 10.5 237 1185 78
B' 4.6
C 32.2 832 4160 119
C' 2.7
D 15.1 263 1315 87
E 8.3 201 1005 43
E' 11.0
Total 114.7 2055 10275 89.5
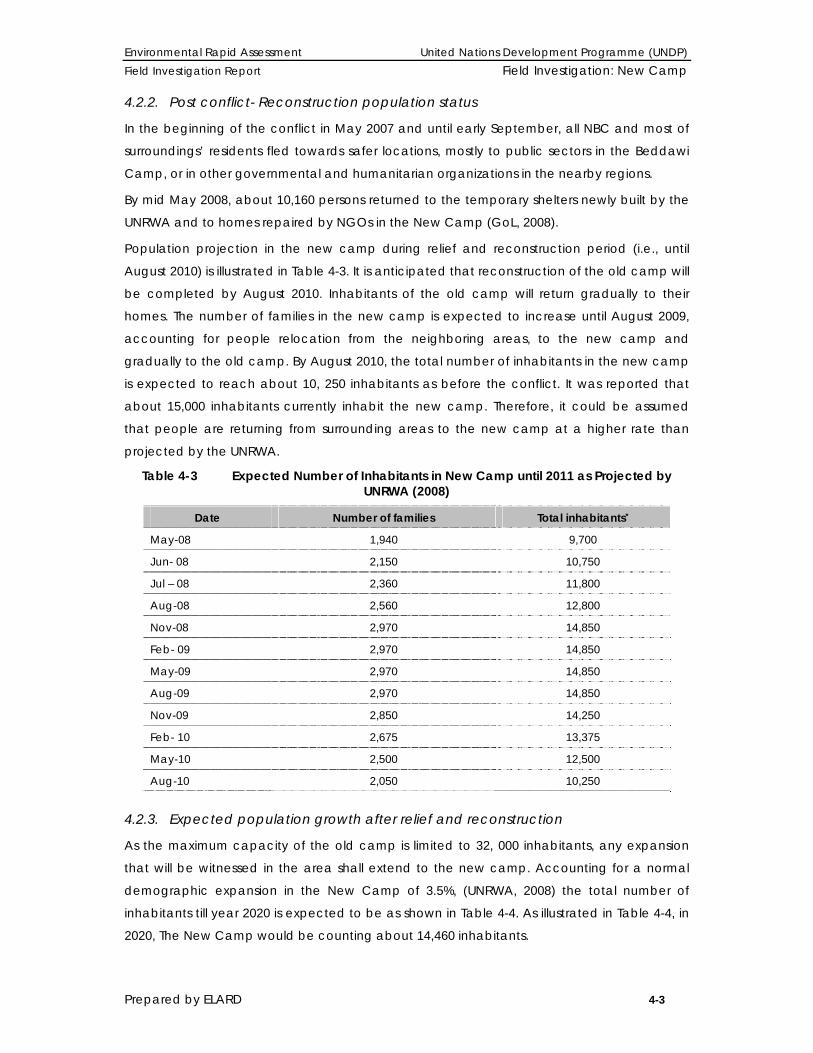
Environmental Rapid Assessment United Nations Development Programme (UNDP) Field Investigation Report Field Investigation: New Camp
Prepared by ELARD 4-3
4.2.2. Post conflict- Reconstruction population status
In the beginning of the conflict in May 2007 and until early September, all NBC and most of
surroundings’ residents fled towards safer locations, mostly to public sectors in the Beddawi
Camp, or in other governmental and humanitarian organizations in the nearby regions.
By mid May 2008, about 10,160 persons returned to the temporary shelters newly built by the
UNRWA and to homes repaired by NGOs in the New Camp (GoL, 2008).
Population projection in the new camp during relief and reconstruction period (i.e., until
August 2010) is illustrated in Table 4-3. It is anticipated that reconstruction of the old camp will
be completed by August 2010. Inhabitants of the old camp will return gradually to their
homes. The number of families in the new camp is expected to increase until August 2009,
accounting for people relocation from the neighboring areas, to the new camp and
gradually to the old camp. By August 2010, the total number of inhabitants in the new camp
is expected to reach about 10, 250 inhabitants as before the conflict. It was reported that
about 15,000 inhabitants currently inhabit the new camp. Therefore, it could be assumed
that people are returning from surrounding areas to the new camp at a higher rate than
projected by the UNRWA.
Table 4-3 Expected Number of Inhabitants in New Camp until 2011 as Projected by UNRWA (2008)
Date Number of families Total inhabitants*
May-08 1,940 9,700
Jun- 08 2,150 10,750
Jul – 08 2,360 11,800
Aug-08 2,560 12,800
Nov-08 2,970 14,850
Feb- 09 2,970 14,850
May-09 2,970 14,850
Aug-09 2,970 14,850
Nov-09 2,850 14,250
Feb- 10 2,675 13,375
May-10 2,500 12,500
Aug-10 2,050 10,250
4.2.3. Expected population growth after relief and reconstruction
As the maximum capacity of the old camp is limited to 32, 000 inhabitants, any expansion
that will be witnessed in the area shall extend to the new camp. Accounting for a normal
demographic expansion in the New Camp of 3.5%, (UNRWA, 2008) the total number of
inhabitants till year 2020 is expected to be as shown in Table 4-4. As illustrated in Table 4-4, in
2020, The New Camp would be counting about 14,460 inhabitants.
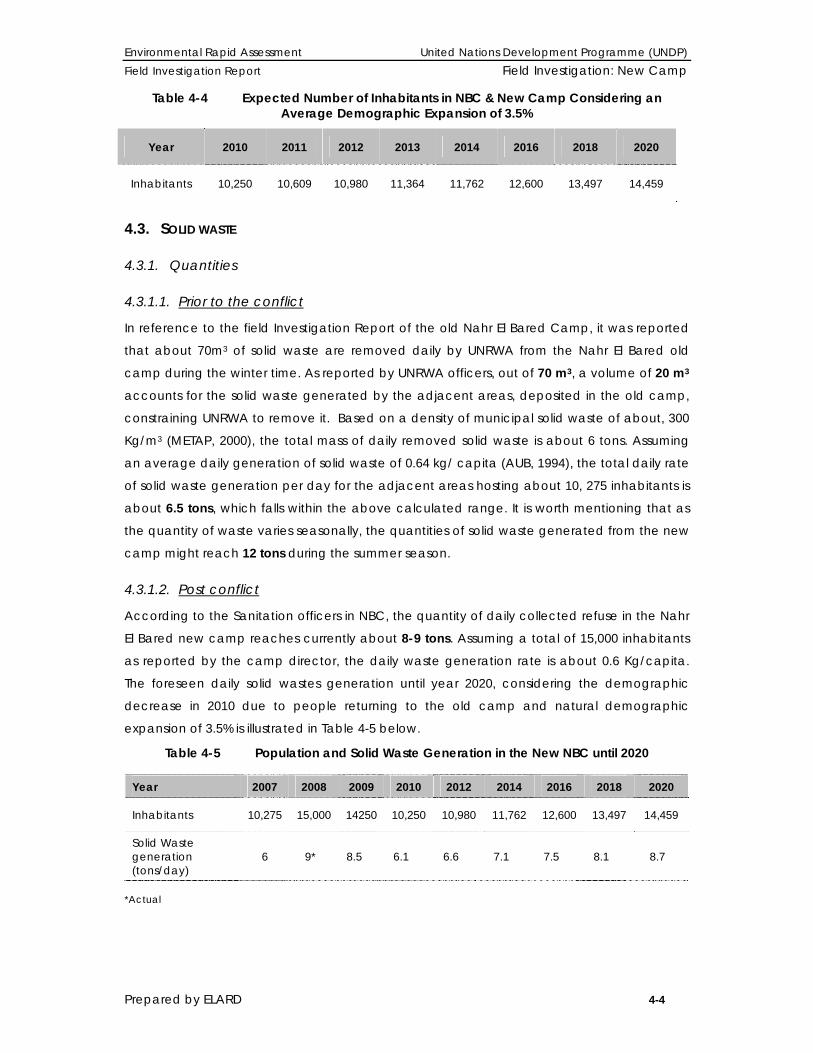
Environmental Rapid Assessment United Nations Development Programme (UNDP) Field Investigation Report Field Investigation: New Camp
Prepared by ELARD 4-4
Table 4-4 Expected Number of Inhabitants in NBC & New Camp Considering an Average Demographic Expansion of 3.5%
Year 2010 2011 2012 2013 2014 2016 2018 2020
Inhabitants 10,250 10,609 10,980 11,364 11,762 12,600 13,497 14,459
4.3. SOLID WASTE
4.3.1. Quantities
4.3.1.1. Prior to the conflict
In reference to the field Investigation Report of the old Nahr El Bared Camp, it was reported
that about 70m3 of solid waste are removed daily by UNRWA from the Nahr El Bared old
camp during the winter time. As reported by UNRWA officers, out of 70 m3, a volume of 20 m3
accounts for the solid waste generated by the adjacent areas, deposited in the old camp,
constraining UNRWA to remove it. Based on a density of municipal solid waste of about, 300
Kg/m3 (METAP, 2000), the total mass of daily removed solid waste is about 6 tons. Assuming
an average daily generation of solid waste of 0.64 kg/ capita (AUB, 1994), the total daily rate
of solid waste generation per day for the adjacent areas hosting about 10, 275 inhabitants is
about 6.5 tons, which falls within the above calculated range. It is worth mentioning that as
the quantity of waste varies seasonally, the quantities of solid waste generated from the new
camp might reach 12 tons during the summer season.
4.3.1.2. Post conflict
According to the Sanitation officers in NBC, the quantity of daily collected refuse in the Nahr
El Bared new camp reaches currently about 8-9 tons. Assuming a total of 15,000 inhabitants
as reported by the camp director, the daily waste generation rate is about 0.6 Kg/capita.
The foreseen daily solid wastes generation until year 2020, considering the demographic
decrease in 2010 due to people returning to the old camp and natural demographic
expansion of 3.5% is illustrated in Table 4-5 below.
Table 4-5 Population and Solid Waste Generation in the New NBC until 2020
*Actual
Year 2007 2008 2009 2010 2012 2014 2016 2018 2020
Inhabitants 10,275 15,000 14250 10,250 10,980 11,762 12,600 13,497 14,459
Solid Waste generation (tons/day)
6 9* 8.5 6.1 6.6 7.1 7.5 8.1 8.7

Environmental Rapid Assessment United Nations Development Programme (UNDP) Field Investigation Report Field Investigation: New Camp
Prepared by ELARD 4-5
4.3.2. Composition
The municipal solid waste collected from households in the new camp consists mainly of
organic residues and papers waste. After the conflict, with the affluence of food aids
distributed to local inhabitants, the composition of collected solid waste was slightly altered
as refuse enclose significant quantities of aluminum cans and plastic package.
4.3.3. Current Collection & Disposal
Refuse are disposed in closed bags inside barrels distributed along the roads. Since the
compactor is not able to circulate in the tight roads inside the new camp, temporary storage
is done in plastic barrels of capacities varying between 120 liters, 180 liters and 360 liters
distributed near households in the populated blocks as shown in Figure 4-2.
Figure 4-2 Temporary storage of solid waste near households
Workers of UNRWA are responsible of transporting solid wastes from the vicinities of
households (Figure 4-3) to the steel containers (of a volume of 1.1m3) located on the main
streets (Table 4-3).
Figure 4-3 UNRWA workers of moving solid wastes from households to the steel
containers located on the main streets
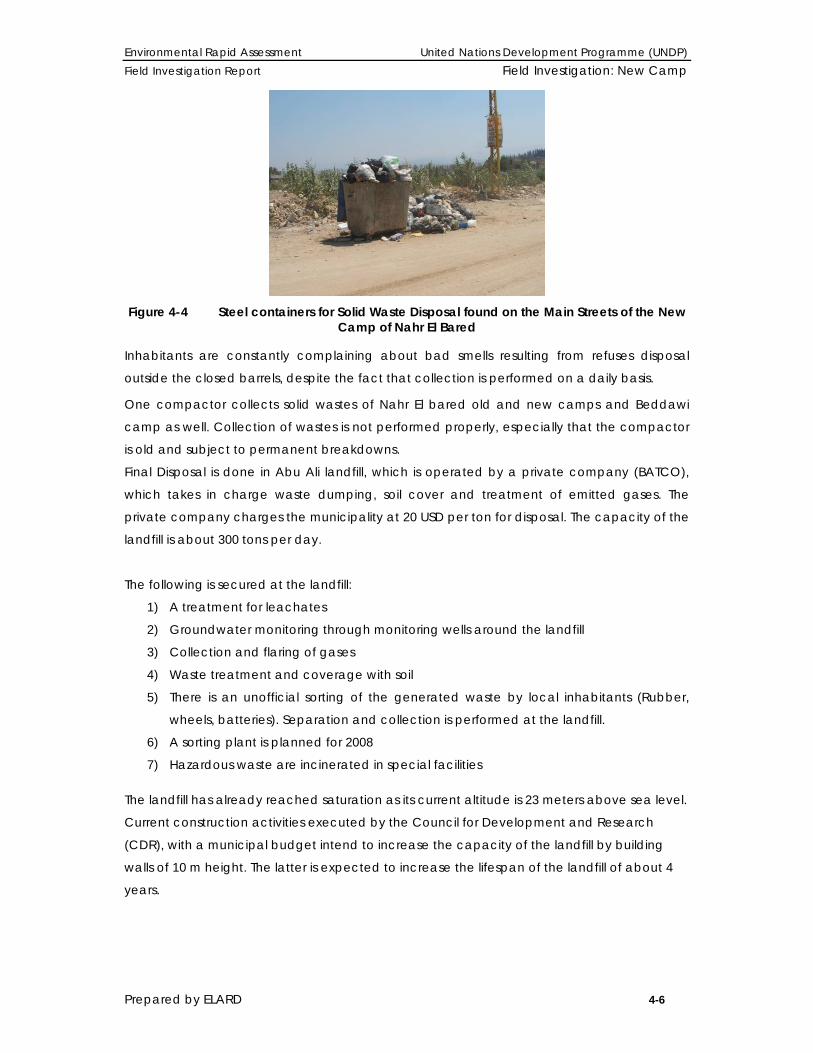
Environmental Rapid Assessment United Nations Development Programme (UNDP) Field Investigation Report Field Investigation: New Camp
Prepared by ELARD 4-6
Figure 4-4 Steel containers for Solid Waste Disposal found on the Main Streets of the New
Camp of Nahr El Bared
Inhabitants are constantly complaining about bad smells resulting from refuses disposal
outside the closed barrels, despite the fact that collection is performed on a daily basis.
One compactor collects solid wastes of Nahr El bared old and new camps and Beddawi
camp as well. Collection of wastes is not performed properly, especially that the compactor
is old and subject to permanent breakdowns.
Final Disposal is done in Abu Ali landfill, which is operated by a private company (BATCO),
which takes in charge waste dumping, soil cover and treatment of emitted gases. The
private company charges the municipality at 20 USD per ton for disposal. The capacity of the
landfill is about 300 tons per day.
The following is secured at the landfill:
1) A treatment for leachates
2) Groundwater monitoring through monitoring wells around the landfill
3) Collection and flaring of gases
4) Waste treatment and coverage with soil
5) There is an unofficial sorting of the generated waste by local inhabitants (Rubber,
wheels, batteries). Separation and collection is performed at the landfill.
6) A sorting plant is planned for 2008
7) Hazardous waste are incinerated in special facilities
The landfill has already reached saturation as its current altitude is 23 meters above sea level.
Current construction activities executed by the Council for Development and Research
(CDR), with a municipal budget intend to increase the capacity of the landfill by building
walls of 10 m height. The latter is expected to increase the lifespan of the landfill of about 4
years.
Environmental Rapid Assessment United Nations Development Programme (UNDP) Field Investigation Report Field Investigation: New Camp
Prepared by ELARD 4-7
4.4. DEMOLITION DEBRIS
4.4.1. Definitions
In this present report, the terms Demolition Wastes and Clear Rubble will be used to define
the Demolition debris (Kansas Department of Health and Environment, Bureau of Waste
Management).
Demolition Waste referred to in the report consists of the following:
• Solid waste resulting from the construction, remodeling, repair and demolition of structures,
roads, sidewalks and utilities;
• Untreated wood and untreated sawdust from any source;
• Treated wood from construction or demolition projects;
• Small amounts of municipal solid waste generated by the consumption of food and drinks
at construction or demolition sites, including, but not limited to, cups, bags, and bottles;
• Furniture and appliances;
• Solid waste consisting of motor vehicle window glass; and
• Solid waste consisting of vegetation from land clearing and grubbing, utility maintenance,
and seasonal or storm related cleanup.
Clear Rubble contains concrete and concrete products including reinforcing steel, asphalt
pavement, brick, rock and uncontaminated soil.
4.4.2. Quantities
Referring to the background review report, the total volume of Clear Rubble in the new
camp was calculated to be around 177,860 m3. The total Clear Rubble in the old Nahr El
Bared Camp was estimated at 500,000 m3-600,000 m3 (UNDP, 2008). With a total volume of
clear rubble for the new camp of about 180, 000 m3, the Clear Rubble in both camps (old
camp and new camp) amount to about 800,000 m3, as initially estimated by the UNRWA
(2008). It is worth noting that UNRWA has already removed about 75,000 m3 of clear rubble
from the sectors A, B, C, D, and E, which are located in the outer portions of the new camp.
Clear Rubble in Sectors A’, B’, C’, and E’ is expected to be greater given their vicinity to the
Old camp.
4.4.3. Composition
As per the conducted survey and observation, demolition debris generated in the new
camp as a result of the conflict is as per Table 4-6 below. Masonry, wood, concrete, and
metal are estimated at 90% of the total demolition debris, while furniture, clothing, white
goods, etc. are assumed to constitute the remaining 10% (Figure 4-5).

Environmental Rapid Assessment United Nations Development Programme (UNDP) Field Investigation Report Field Investigation: New Camp
Prepared by ELARD 4-8
The visual inspection of the conflict area during the field visit to the new camp allowed an in-
depth assessment of the constituents of the demolition debris remaining after almost one (1)
year of fire cessation, on September 7th, 2007. The field investigation revealed the presence
of large quantities of clear rubble mainly constituted of concrete and steel, in addition to
demolition waste including burned furniture, generators, and vehicles. The low occurrence of
white goods and the high presence of destroyed cars in the demolition waste were noted.
Table 4-6 Estimation of the composition of demolition debris in the new camp based on Field Investigation
TYPE OF DEBRIS FATE PERCENTAGE VOLUME (M3)
Clear Rubble 90% 160,200
Concrete Reuse/crushing 60% 96,120
Metal Partial recycling/reuse 12% 19,224
Aggregate Reuse/crushing 18% 28,836
Others 10% 17,800
Textiles and Organics Disposed/partial reuse/recycling
13% 2,314
Aluminum Partial recycling 7% 1,246
Wood Partial recycling 15% 2,670
Electrical wires Disposed 1% 178
Nylon packs Disposed 2% 356
Plastic Partial recycling 6% 1,068
Cardboard Partial recycling 4% 712
Glass Disposed 3% 534
Cans Partial recycling 4% 712
White goods/Household appliances
Partial recycling/reuse as spare parts
5% 890
Concrete/ PVC Pipes Special disposal (HWD, if needed be)
7% 1,246
Cars Partial recycling/reuse 25% 4,450
Tires Reuse/disposal 3% 534
Lead Partial recycling 1% 178
Mattresses Recycling 4% 712
UXO’s HWD Not Determined NA Contaminated soils HWD Not Determined NA Medical Wastes HWD Not Determined NA
Total 100% About 178,000

Environmental Rapid Assessment United Nations Development Programme (UNDP) Field Investigation Report Field Investigation: New Camp
Prepared by ELARD 4-9
Figure 4-5 Demolition Debris in the Nahr El Bared New Camp Composed Mainly of Rubble (Concrete, Metals and Aggregates) with other Minor Waste Streams (Nylon,
Plastics)
4.4.4. Disposal
Based on the conducted survey and interviews with Infrastructure officers of NBC, demolition
debris were removed from the schools area (Figure 4-1). Additionally, local residents moved
and dumped at their own expenses, some waste debris either on the banks of Nahr El Bared
River or on the seashore as shown in Figure 4-6. a)
b)
Figure 4-6 Demolition wastes dumped a) on seashore and b) on the banks of Nahr El
Bared River (Right)
4.5. WATER SUPPLY
4.5.1. Water supply prior to the conflict
The New Camp is divided into 4 main sectors A1, A2, A3, and A4 (Figure 4-7). In 2005, a
complete water supply network was installed in the new camp. Three new wells (well 10, 11
and 12; Table 4-7; section 3) were drilled to supply the whole area, designed to fulfill the
needs of 22, 000 inhabitants for a daily consumption of 100 liters/capita (ELARD, 2005).
Additionally many wells are also reported in the new camp premises.

Environmental Rapid Assessment United Nations Development Programme (UNDP) Field Investigation Report Field Investigation: New Camp
Prepared by ELARD 4-10
One (1) water tower (located in sector A3) having a capacity of 60 m3 was rehabilitated in
2005 and three (3) new water towers were built (70 m3 each). Wells and towers were
operational for 4 to 5 hours per day to meet the daily needs of the new camp (ELARD, 2005)
to secure a daily water demand ranging between 99 and 125 liters per capita at the end-
user. At the source, based on the installed pumps capacity, effective water supply is greater
ranging between 99 and 250 liters per capita per day.
Table 4-7 Water Supply Sectors (Pump, well, reservoir and transmission Characteristics)
Sector
Population Quantities Daily Consumption
No. of Households
Feeding well
Transmission Reservoir Name
Flow rate
(capita) m3/day L/day/cap unit (L/s) A1 2417 244 101 297 Well 11 17 Gineen 2
A2 2536 317 125 225 well 12 22 Khaled Ben El Walid
A3 2912 288 99 251 Well 10 20 Amwas
A4 1783 216 121 213 well 11 15 Gineen 1
Total 1065
Figure 4-7 Schematic Water Supply Sectors in the New Camp A1, A2, A3, and A4
(Modified from ELARD, 2005; Not to scale)
4.5.2. Current Water supply Status
4.5.2.1. Well Conditions
Based on the conducted field visits and interviews with sanitation and water technicians and
Engineers in the old and new camp, the conditions of the wells and water network were
assessed as follows:
• Wells 7 and 9 located in the old camp are completely collapsed. No evidence for
the existence of the wells is still in place;

Environmental Rapid Assessment United Nations Development Programme (UNDP) Field Investigation Report Field Investigation: New Camp
Prepared by ELARD 4-11
• Other private wells located in the old camp are all buried and collapsed beneath the
demolition debris;
• Well 8 located north to the rehabilitated wells in the vicinity of the old camp is buried;
• Well Hameed, 2, 4, 5 are not operated yet. UNRWA is in the process of rehabilitating
the wells. ELARD will seize the opportunity to perform a CCTV survey on the wells upon
pump removal to inspect the integrity of the wells; UNRWA is also planning on
rehabilitating well 8, which according to preliminary investigation is not collapsed
even though it is completely covered with rubble material;
• Wells 1, 3, 6, 10, and Gineen, were rehabilitated by the UNICEF and ICRC. The wells
were dismantled, developed by air lift pumping. Therefore, pumps were rehabilitated
and re-installed in the wells. The rehabilitated wells are currently used for water supply
for the new camp as follows:
o Well 6: Sector A in the New Camp
o Well 10: Sector B in the New Camp
o Well Gineen: Part of sector C, prefabricated compounds, and schools
o Well 1 and 3 are currently used as standby wells
A synopsis of the main characteristics of the visited wells is presented in Table 4-8. Wells 6 and
8 are illustrated in Figure 4-8. It is worth noting that the wells previously used for domestic
purposes in the new camp were not physically affected by the conflict, as two of them were
rehabilitated. UNRWA is planning on rehabilitating Hamed well in the beginnings of
September.
Table 4-8 Main Characteristics of the Surveyed and Visited Wells
Well Long Lat SWL
M BG Discharge
M3/hour
Depth
M BG Status
DEG MIN DEG MIN SEC
Well 1 34 30 36 35 57 45.6 6.9 60 40 REH
Well 2 34 30 35.40 35 57 45.00 6.1 52 25 NR
Well 3 34 30 35.1 35 57 44 5.7 16 40 REH
Well 4 34 30 34.8 35 57 43.2 9 85 45 NR
Well 5 34 30 31.8 35 57 42.6 5.5 NR
Well 6 34 30 38.75 35 57 26.06 4.95 70 25 REH
Well 7 34 30 31.8 35 57 42.6 5.6 80 60 COLL
Well 8 34 30 40.06 35 57 24 6.5 20 30 BUR
Well 9 34 30 37.2 35 57 48.6 6.5 Highly saline COLL
Well 10 34 30 39.6 35 57 57.6 8.45 85 45 REH

Environmental Rapid Assessment United Nations Development Programme (UNDP) Field Investigation Report Field Investigation: New Camp
Prepared by ELARD 4-12
Well Long Lat SWL
M BG Discharge
M3/hour
Depth
M BG Status
DEG MIN DEG MIN SEC
Well Hamed 34 30 36 35 57 45.6 10.5 60 45 NR
Well Gineen 34 30 42.6 35 57 58.2 7.6 85 40 REH
REH: Rehabilitated NR Non Rehabilitated COLL Collapsed BUR Buried Prior to conflict
4.5.2.2. Conditions of Water Towers
The three towers (3) water towers Gineen, Amwas, and Khaled Ben El Waleed used in the
new camp supplied by the wells Gineen, Hamed and well 10 were also assessed. Only the
Amwas (Figure 4-9) and Gineen (Figure 4-10) water towers are still in place. Amwas was
partially damaged during the conflict, yet was rehabilitated shortly. Khaled ben El Walis is
completely destroyed as shown in Figure 4-11.Results of the water tower damage field
inspection of all the water towers existing in the old and new camp are shown in Table 4-9.
a) b)
Figure 4-8 a) Well 6 located near Nahr El Bared River rehabilitated and currently used for Sector A in the New Camp, b) Well 8 completely buried beneath the rubble
Table 4-9 Conditions of the Water Towers located in the old and New Camp
Reservoir/ water Tower Capacity (M3) Sectors Feeding well Status
Zanhar 1 60 Old Camp Well 1 and 5 Destroyed
Zanhar 2 40.8 Old Camp Wells 1 and 7 Destroyed
Tarabeh 42 Old Camp Well 3 Destroyed
Palestine 53.4 Old Camp Well 9 Destroyed

Environmental Rapid Assessment United Nations Development Programme (UNDP) Field Investigation Report Field Investigation: New Camp
Prepared by ELARD 4-13
Reservoir/ water Tower Capacity (M3) Sectors Feeding well Status
Nidal 60 Old Camp Well 6 Destroyed
Khaled Ben Al Waleed
60
40 New Camp
Sector E’ Well Hamed Destroyed
Sharaf 40 Old Camp Well 2 and 8 Destroyed
Amwas 60 New Camp Sector B’ Well 10 Partially destroyed
Restored
Gineen (2) 60
60 New Camp
Sector C Well Gineen Not affected
a) b)
Figure 4-9 Water Tower least affected by the conflict serving the New Camp a) Amwas after, b) Amwas before
a) b)
Figure 4-10 Water Tower least affected by the conflict serving the New Camp a) Gineen after, b) Gineen before

Environmental Rapid Assessment United Nations Development Programme (UNDP) Field Investigation Report Field Investigation: New Camp
Prepared by ELARD 4-14
Figure 4-11 Water Tower Khaled Ben Waleed Completely Destroyed during the Conflict
4.5.2.3. Water Supply
About 2,380 m3 are currently supplied on a daily basis to 15,000 inhabitants of Nahr El Bared
new camp, out of which about 425 m3 are supplied by the Islamic Relief at a rate of 60 liters
per capita per day. Therefore, as shown in Table 4-10, 1,955 m3 are supplied to about 7,917
inhabitants at a rate of 247 liters per capita per day from the wells of 6, 10 and Gineen
operated about 8 hours per day.
Table 4-10 Current Water Supply in Nahr El Bared New Camp
Water Supply
(m3/day)
Population
(capita)
Source Water Supply
(l/capita per day)
1,955 7917 Well 6, 10 and Gineen 247
425 7,083 Cisterns 60
2,380 15,000 Wells and Cisterns 60-247
Water is conveyed from the currently operating water towers in 4 inches HDPE pipes 60-70
cm deep in the soil. The entire water supply network has been recently installed after the
conflict.
4.5.2.4. Post conflict Water Consumption
Assuming a theoretical water demand of about 80 liters per capita per day, the projected
water demand in the area of the new camp is expected to reach 1,157 m3 in 2020. The

Environmental Rapid Assessment United Nations Development Programme (UNDP) Field Investigation Report Field Investigation: New Camp
Prepared by ELARD 4-15
theoretical current water demand in the new camp is about 1,200 m3, whereas the effective
water supply is about 2,380 m3 as stipulated in section 4.5.2.3.
Table 4-11 Water Demand in the New NBC until 2020 (On the basis of 80 liters per capita per day starting 2008)
4.6. WASTE WATER
4.6.1. Waste Water generation
Prior to the conflict, the new camp hosting about 10, 275 inhabitants, generated a total
waste water volume of about 720 m3 per day assuming a rate of waste water generation of
about 70 liters per capita per day (being about 70% of water supply, i.e., 100 liters per capita
prior to conflict).
Currently, given the conflict related demographic increase in the new camp, About 2,380
m3`of water are being supplied on a daily basis for domestic use (as reported by Mr. Saleh
Suleiman), then the volume of daily generated waste water is about 1,666 m3.
The quantities of waste water that are expected to be generated in the new camp are
estimated at 810 m3 by year 2020 as shown in Table 4-12 below.
Table 4-12 Theoretical Waste Water Generation in NBC new camp until 2020
*Actual
4.6.2. Waste Water Current Conditions
As per the conducted field investigation with Mr. Saleh Suleiman, about 90% of the
wastewater network is currently in place in the inhabited areas. The pipes installed by the
Islamic Relief are PVC made, and the others installed partly by UNRWA and partly by the
Islamic Relief are made of concrete.
The installed pipes are divided into primary and secondary of diameters of 20, 30, 40 and 50-
inches located at 0.6 to 2 m below ground surface on the opposite side of the water
Year 2007 2008 2009 2010 2012 2014 2016 2018 2020
Inhabitants 10,275 15,000 14250 10,250 10,980 11,762 12,600 13,497 14,459
Water demand
(m3/day) 822 1,200* 1,140 820 878 941 1,008 1,080 1,157
*Actual supply is 2380 m3
Year 2007 2008 2009 2010 2012 2014 2016 2018 2020
Inhabitants 10,275 15,000 14250 10,250 10,980 11,762 12,600 13,497 14,459
Waste water generation (m3/day)
719 1,666* 798 574 615 659 706 756 810
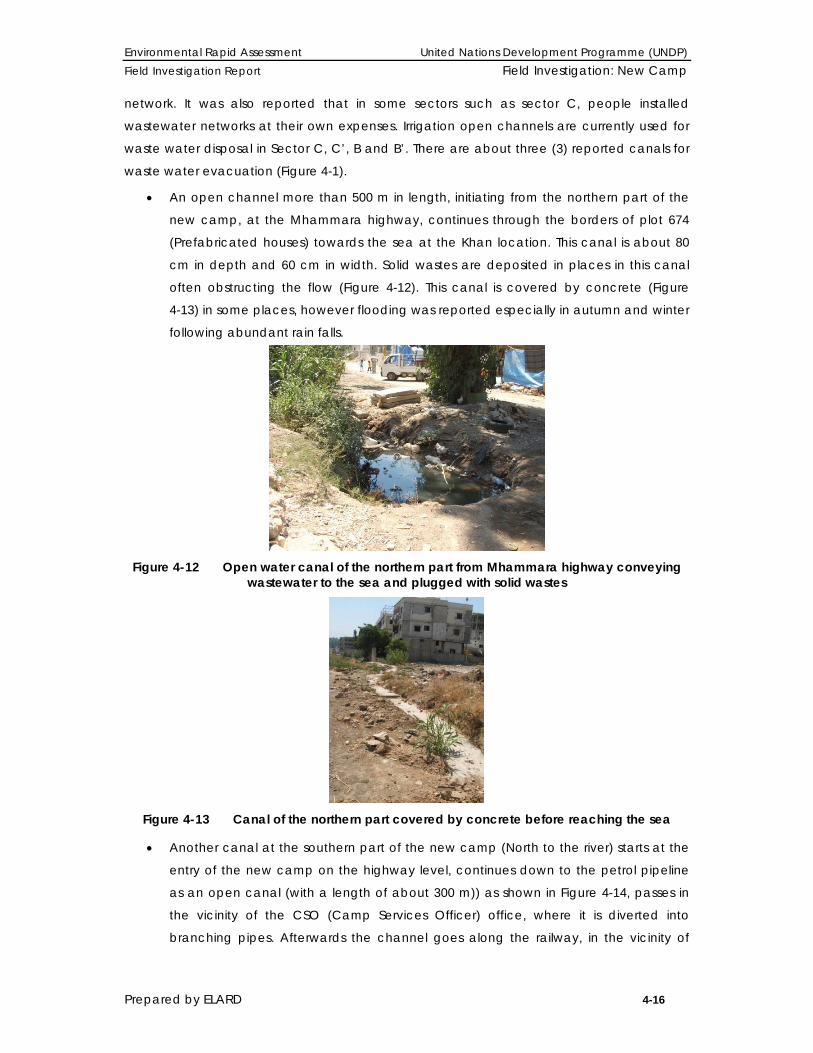
Environmental Rapid Assessment United Nations Development Programme (UNDP) Field Investigation Report Field Investigation: New Camp
Prepared by ELARD 4-16
network. It was also reported that in some sectors such as sector C, people installed
wastewater networks at their own expenses. Irrigation open channels are currently used for
waste water disposal in Sector C, C’, B and B’. There are about three (3) reported canals for
waste water evacuation (Figure 4-1).
• An open channel more than 500 m in length, initiating from the northern part of the
new camp, at the Mhammara highway, continues through the borders of plot 674
(Prefabricated houses) towards the sea at the Khan location. This canal is about 80
cm in depth and 60 cm in width. Solid wastes are deposited in places in this canal
often obstructing the flow (Figure 4-12). This canal is covered by concrete (Figure
4-13) in some places, however flooding was reported especially in autumn and winter
following abundant rain falls.
Figure 4-12 Open water canal of the northern part from Mhammara highway conveying
wastewater to the sea and plugged with solid wastes
Figure 4-13 Canal of the northern part covered by concrete before reaching the sea
• Another canal at the southern part of the new camp (North to the river) starts at the
entry of the new camp on the highway level, continues down to the petrol pipeline
as an open canal (with a length of about 300 m)) as shown in Figure 4-14, passes in
the vicinity of the CSO (Camp Services Officer) office, where it is diverted into
branching pipes. Afterwards the channel goes along the railway, in the vicinity of
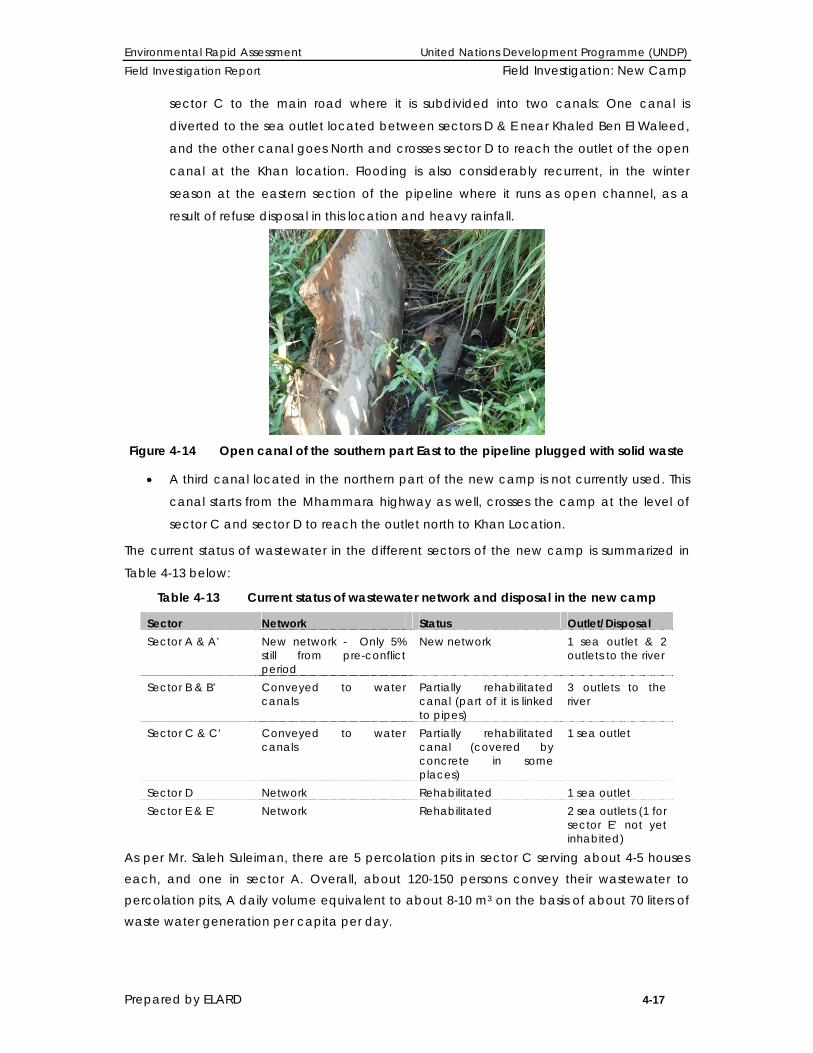
Environmental Rapid Assessment United Nations Development Programme (UNDP) Field Investigation Report Field Investigation: New Camp
Prepared by ELARD 4-17
sector C to the main road where it is subdivided into two canals: One canal is
diverted to the sea outlet located between sectors D & E near Khaled Ben El Waleed,
and the other canal goes North and crosses sector D to reach the outlet of the open
canal at the Khan location. Flooding is also considerably recurrent, in the winter
season at the eastern section of the pipeline where it runs as open channel, as a
result of refuse disposal in this location and heavy rainfall.
Figure 4-14 Open canal of the southern part East to the pipeline plugged with solid waste
• A third canal located in the northern part of the new camp is not currently used. This
canal starts from the Mhammara highway as well, crosses the camp at the level of
sector C and sector D to reach the outlet north to Khan Location.
The current status of wastewater in the different sectors of the new camp is summarized in
Table 4-13 below:
Table 4-13 Current status of wastewater network and disposal in the new camp
Sector Network Status Outlet/Disposal Sector A & A’ New network - Only 5%
still from pre-conflict period
New network 1 sea outlet & 2 outlets to the river
Sector B & B’ Conveyed to water canals
Partially rehabilitated canal (part of it is linked to pipes)
3 outlets to the river
Sector C & C’ Conveyed to water canals
Partially rehabilitated canal (covered by concrete in some places)
1 sea outlet
Sector D Network Rehabilitated 1 sea outlet Sector E & E’ Network Rehabilitated 2 sea outlets (1 for
sector E’ not yet inhabited)
As per Mr. Saleh Suleiman, there are 5 percolation pits in sector C serving about 4-5 houses each, and one in sector A. Overall, about 120-150 persons convey their wastewater to percolation pits, A daily volume equivalent to about 8-10 m3 on the basis of about 70 liters of waste water generation per capita per day.

Environmental Rapid Assessment United Nations Development Programme (UNDP) Field Investigation Report Field Investigation: New Camp
Prepared by ELARD 4-18
4.6.3. Storm water network
There are no built storm water canals in the new camp, in winter time, rainwater floods freely
on land surface or in water canals and flows downstream to the sea. Yet in places, where
water flows at the level of small shops and houses, local people installed preliminary culverts
at their own expenses.
4.7. ELECTRICITY Information related to the electricity supply in Nahr El Bared new camp was provided by the
Electrical Engineer responsible for the Electrical supply in the NBC on the behalf of the
UNRWA. Electricity is mainly supplied to the new camp from the Electricité du Liban (EDL) for
about 14-16 hrs/day and 7 hrs/day through electricity generators (5 hrs at night and 2 hrs
during the day). Few exceptions regarding electricity provision from generators can be
observed as in Plot 674, where houses are prefabricated and steel made (10 hrs/day) and
plots 774 & 23 (9 hrs/day).
Prior to the conflict the electricity of the new camp was entirely provided from the
Mhammara sub-station. During the conflict, all the electrical infrastructures were destroyed.
According to the reconstruction Plan, Sector A will be supplied from Bhannine sub-station
who is supplied by Deir Ammar electrical plant) and all other sectors falling under the
jurisdiction of the Mhammara municipality will be supplied from the sub-station of
Mhammara.
EDL is reestablishing a new network resembling the one existing prior to the conflict, but with
lower capacity. The concrete substations that were found prior to the conflict that can feed
up to 1000 KWA are being replaced by air substations (Figure 4-15) of a maximum capacity
of 400 KWA. The EDL new network is not accounting neither for the demographic expansion
in the new camp nor for the crowded sectors of Nahr El Bared old and new camp returnees
being all sheltered in the adjacent area.
a) b)
Figure 4-15 A new air substation replacing: a) a destroyed concrete substation, b) a destroyed air substation
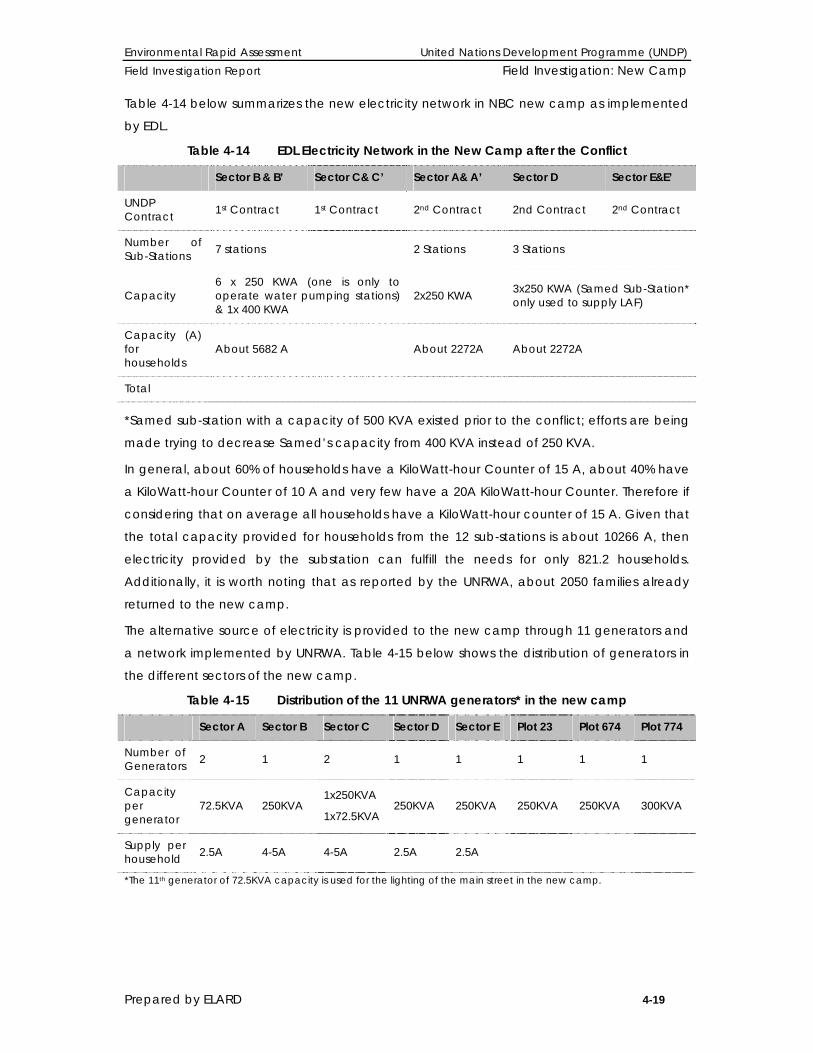
Environmental Rapid Assessment United Nations Development Programme (UNDP) Field Investigation Report Field Investigation: New Camp
Prepared by ELARD 4-19
Table 4-14 below summarizes the new electricity network in NBC new camp as implemented
by EDL.
Table 4-14 EDL Electricity Network in the New Camp after the Conflict
Sector B & B’ Sector C& C’ Sector A& A’ Sector D Sector E&E’
UNDP Contract 1st Contract 1st Contract 2nd Contract 2nd Contract 2nd Contract
Number of Sub-Stations 7 stations 2 Stations 3 Stations
Capacity 6 x 250 KWA (one is only to operate water pumping stations) & 1x 400 KWA
2x250 KWA 3x250 KWA (Samed Sub-Station* only used to supply LAF)
Capacity (A) for households
About 5682 A About 2272A About 2272A
Total
*Samed sub-station with a capacity of 500 KVA existed prior to the conflict; efforts are being
made trying to decrease Samed’s capacity from 400 KVA instead of 250 KVA.
In general, about 60% of households have a KiloWatt-hour Counter of 15 A, about 40% have
a KiloWatt-hour Counter of 10 A and very few have a 20A KiloWatt-hour Counter. Therefore if
considering that on average all households have a KiloWatt-hour counter of 15 A. Given that
the total capacity provided for households from the 12 sub-stations is about 10266 A, then
electricity provided by the substation can fulfill the needs for only 821.2 households.
Additionally, it is worth noting that as reported by the UNRWA, about 2050 families already
returned to the new camp.
The alternative source of electricity is provided to the new camp through 11 generators and
a network implemented by UNRWA. Table 4-15 below shows the distribution of generators in
the different sectors of the new camp.
Table 4-15 Distribution of the 11 UNRWA generators* in the new camp
Sector A Sector B Sector C Sector D Sector E Plot 23 Plot 674 Plot 774
Number of Generators 2 1 2 1 1 1 1 1
Capacity per generator
72.5KVA 250KVA 1x250KVA
1x72.5KVA 250KVA 250KVA 250KVA 250KVA 300KVA
Supply per household 2.5A 4-5A 4-5A 2.5A 2.5A
*The 11th generator of 72.5KVA capacity is used for the lighting of the main street in the new camp.

Environmental Rapid Assessment United Nations Development Programme (UNDP) Field Investigation Report Field Investigation: New Camp
Prepared by ELARD 4-20
4.8. OTHER ISSUES Four fuel stations located on the borders of the main street: three at the end of Sector C (Halba new camp entrance) and one in Sector D facing the others were strongly destroyed as a result of the conflict. One out of the three fuel stations of Sector C was not operating long before the conflict.
4.9. ENVIRONMENTAL CONCERNS The major pre- and post conflict environmental concerns in the main sectors in Nahr El Bared camp are summarized in Table 4-16 and Table 4-17 below.
Table 4-16 Pre-conflict Environmental Concerns
TYPE CONCERNS
Solid Waste Management
• Lack of Solid waste proper Management Practices
• Dumping of waste in Bared River and in water canals
• Disposal of waste in the vicinity of old the camp, to be collected by UNRWA upon collecting waste from old camp
Wastewater Management
• Percolation pits- for some households- were not cancelled upon implementation of sewage network
• Discharge of raw sewage from new camp directly into the sea
Water Supply
• High water turbidity for some wells (2004)
• TDS, chlorides, and Total Hardness above permissible levels in all wells (2008)
• Fecal coliform in most wells; destroyed after chlorination (2007-2008)
• Significant number of private wells
Air Emissions • Poor indoor air quality from improper ventilation and lack of sunlight
exposure
• Emissions from vehicular traffic
Energy Efficiency • Absence of Energy Efficiency Measures: Lightening, Heating, etc…
• Values of daily water supply per capita considered relatively high exceeding 240 liters (On the basis of 80 liters per capita per day)

Environmental Rapid Assessment United Nations Development Programme (UNDP) Field Investigation Report Field Investigation: New Camp
Prepared by ELARD 4-1
Table 4-17 Post-Conflict Environmental Concerns
TYPE CONCERNS
Demolition Waste Management
• Disposal of municipal demolition waste on the Nahr El Bared River
• Segregation and Quantification of load to be sent for final disposal at the landfill (Disposable Matter)
• Non Segregated demolition debris: furniture, white goods, and electronics from the debris needed to be sorted prior to transport to the temporary storage site
• Potential for reusing the aggregates, soils, concrete, and metals
• Quality of the demolition waste prior to disposal or reuse for any reclamation activity
Solid Waste
• Congested buildings, Poor road conditions impeding proper solid waste collection
• Improper temporary disposal
• Technical problems with solid waste collection machinery (Compactors)
Water Supply
• Rehabilitation of Towers
• Rehabilitation of wells (Development, Pump, Rising pipes, water Quality)
• Installing water network in remaining sectors
Conflict related Accidental Spills, Explosions
• Explosion of 3 operating Petrol Stations
• Spillage from exploded fuel storage tanks
• Spillage from exploded diesel storage tanks
• Explosion of transformers/ Generators
• Explosion of many transformers, probable release of PCBs
Construction
• Dust and pollutants emissions during rubble removal
• Dust and pollutants emissions during the mobilization of equipment, sourcing of raw materials, and during construction activities
• Pollutants generated from fires and explosive materials
• Accidental spills during reconstruction from Machineries (oil, diesel and fuel)
Waste Water • Temporary Discharge of raw waste water into the marine environment
(2 years)
• Disposal of wastewater (in some sectors) in water canals
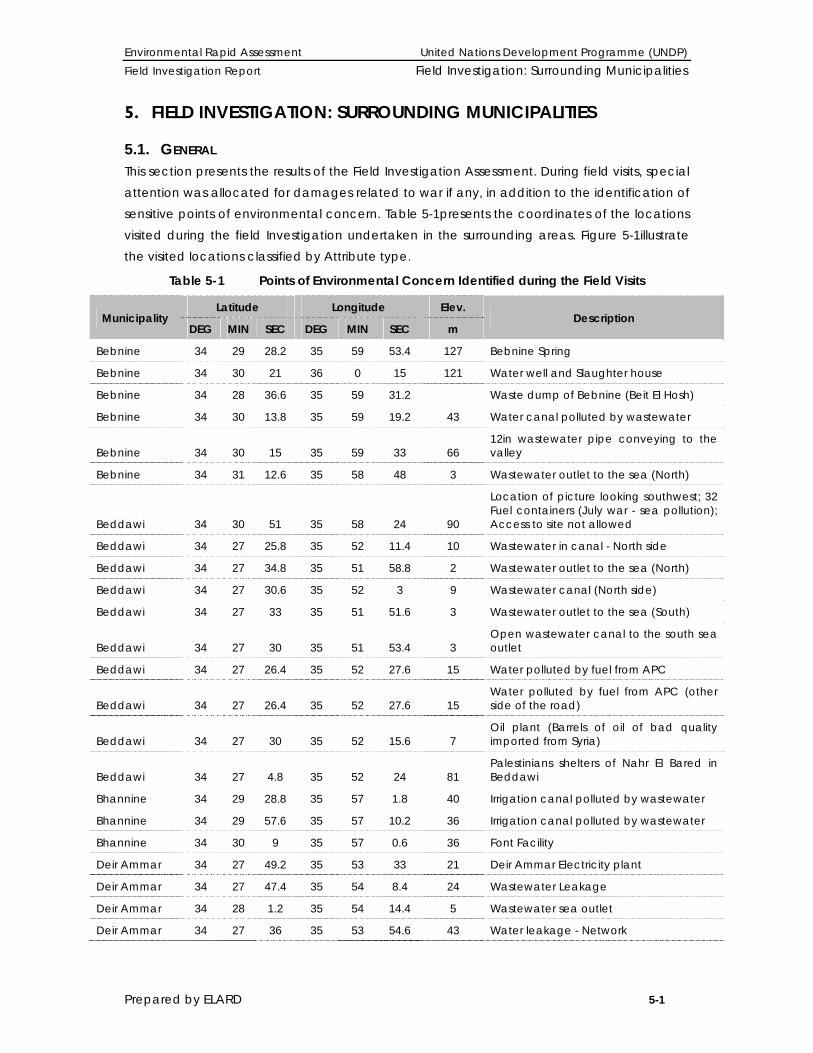
Environmental Rapid Assessment United Nations Development Programme (UNDP) Field Investigation Report Field Investigation: Surrounding Municipalities
Prepared by ELARD 5-1
5. FIELD INVESTIGATION: SURROUNDING MUNICIPALITIES
5.1. GENERAL This section presents the results of the Field Investigation Assessment. During field visits, special attention was allocated for damages related to war if any, in addition to the identification of sensitive points of environmental concern. Table 5-1presents the coordinates of the locations visited during the field Investigation undertaken in the surrounding areas. Figure 5-1illustrate the visited locations classified by Attribute type.
Table 5-1 Points of Environmental Concern Identified during the Field Visits
Municipality Latitude Longitude Elev.
Description DEG MIN SEC DEG MIN SEC m
Bebnine 34 29 28.2 35 59 53.4 127 Bebnine Spring
Bebnine 34 30 21 36 0 15 121 Water well and Slaughter house
Bebnine 34 28 36.6 35 59 31.2 Waste dump of Bebnine (Beit El Hosh)
Bebnine 34 30 13.8 35 59 19.2 43 Water canal polluted by wastewater
Bebnine 34 30 15 35 59 33 66 12in wastewater pipe conveying to the valley
Bebnine 34 31 12.6 35 58 48 3 Wastewater outlet to the sea (North)
Beddawi 34 30 51 35 58 24 90
Location of picture looking southwest; 32 Fuel containers (July war - sea pollution); Access to site not allowed
Beddawi 34 27 25.8 35 52 11.4 10 Wastewater in canal - North side
Beddawi 34 27 34.8 35 51 58.8 2 Wastewater outlet to the sea (North)
Beddawi 34 27 30.6 35 52 3 9 Wastewater canal (North side)
Beddawi 34 27 33 35 51 51.6 3 Wastewater outlet to the sea (South)
Beddawi 34 27 30 35 51 53.4 3 Open wastewater canal to the south sea outlet
Beddawi 34 27 26.4 35 52 27.6 15 Water polluted by fuel from APC
Beddawi 34 27 26.4 35 52 27.6 15 Water polluted by fuel from APC (other side of the road)
Beddawi 34 27 30 35 52 15.6 7 Oil plant (Barrels of oil of bad quality imported from Syria)
Beddawi 34 27 4.8 35 52 24 81 Palestinians shelters of Nahr El Bared in Beddawi
Bhannine 34 29 28.8 35 57 1.8 40 Irrigation canal polluted by wastewater
Bhannine 34 29 57.6 35 57 10.2 36 Irrigation canal polluted by wastewater
Bhannine 34 30 9 35 57 0.6 36 Font Facility
Deir Ammar 34 27 49.2 35 53 33 21 Deir Ammar Electricity plant
Deir Ammar 34 27 47.4 35 54 8.4 24 Wastewater Leakage
Deir Ammar 34 28 1.2 35 54 14.4 5 Wastewater sea outlet
Deir Ammar 34 27 36 35 53 54.6 43 Water leakage - Network

Environmental Rapid Assessment United Nations Development Programme (UNDP) Field Investigation Report Field Investigation: Surrounding Municipalities
Prepared by ELARD 5-2
Municipality Latitude Longitude Elev.
Description DEG MIN SEC DEG MIN SEC m
Deir Ammar 34 27 7.2 35 53 55.8 136 Quarry
Deir Ammar 34 27 0.6 35 53 51 162 Waste Dump - Municipality of Deir Ammar
Deir Ammar 34 27 20.4 35 54 34.8 136 Deir Ammar Water well for the village - Water Authorities
Deir Ammar 34 27 36 35 53 39 39 Cars dump
Markabta 34 27 42 35 57 48.6 113 Solid Waste dumped at roads' side
Markabta 34 27 40.8 35 57 49.2 128 Wastewater from Markabta to valley of Menieh
Menieh 34 28 55.8 35 56 36.6 60 Water leakage - Network
Menieh 34 28 21 35 57 37.2 111 Water tower for the old network (water of Ouyoun El Samak)
Menieh 34 28 46.8 35 55 7.8 1 Rubble dumping on sea shore
Menieh 34 28 52.2 35 55 18.6 1 Wastewater outlet to the sea (North side)
Menieh 34 28 42.6 35 55 3.6 2 Wastewater outlet to the sea (South side)
Menieh 34 27 59.4 35 56 7.8 18 Menieh Well
Mhammara 34 30 18 35 58 24.6 88 Water well for the village
Mhammara 34 30 16.8 35 58 20.4 87 Water leakage - Network
Mhammara 34 30 15.6 35 58 14.4 60 Water network - pipes
Mhammara 34 30 10.8 35 58 4.2 42 Wastewater leakage (South region)
Mhammara 34 30 11.4 35 58 5.4 42 Wastewater - sludge (South region)
Mhammara 34 30 30.6 35 58 3 14 Electricity targeted transformer
Mhammara 34 30 40.2 35 58 12.6 10 Wastewater leaking network (North Region)
Mhammara 34 30 48 35 58 22.8 8 Wastewater plugging near Saddik
Mhammara 34 30 51 35 58 25.2 8 Water canal downstream of highway polluted with wastewater
Mhammara 34 30 17.4 35 58 24 Mhammara well
Ouyoun El Samak 34 26 21 36 0 12 200
Water reservoir of Menieh in Ouyoun El Samak
Ouyoun El Samak 34 26 18.6 36 0 57.6 270 Ouyoun El Samak Lake & Dam
Ouyoun El Samak 34 26 22.8 36 1 19.2 253 Water falls
Ouyoun El Samak 34 26 19.8 36 0 13.8 Ouyoun El Samak spring
Rawda 34 27 6 35 59 19.2 150 Waste Dump of Adwe
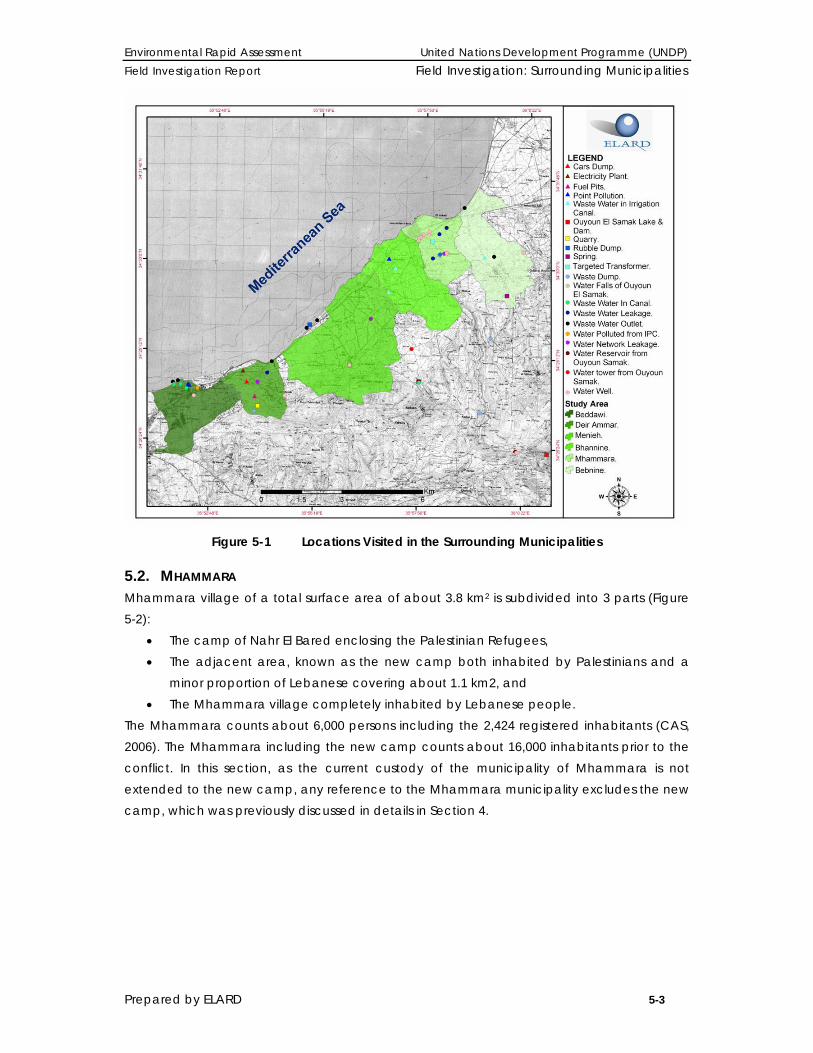
Environmental Rapid Assessment United Nations Development Programme (UNDP) Field Investigation Report Field Investigation: Surrounding Municipalities
Prepared by ELARD 5-3
Figure 5-1 Locations Visited in the Surrounding Municipalities
5.2. MHAMMARA Mhammara village of a total surface area of about 3.8 km2 is subdivided into 3 parts (Figure 5-2):
• The camp of Nahr El Bared enclosing the Palestinian Refugees, • The adjacent area, known as the new camp both inhabited by Palestinians and a
minor proportion of Lebanese covering about 1.1 km2, and • The Mhammara village completely inhabited by Lebanese people.
The Mhammara counts about 6,000 persons including the 2,424 registered inhabitants (CAS, 2006). The Mhammara including the new camp counts about 16,000 inhabitants prior to the conflict. In this section, as the current custody of the municipality of Mhammara is not extended to the new camp, any reference to the Mhammara municipality excludes the new camp, which was previously discussed in details in Section 4.
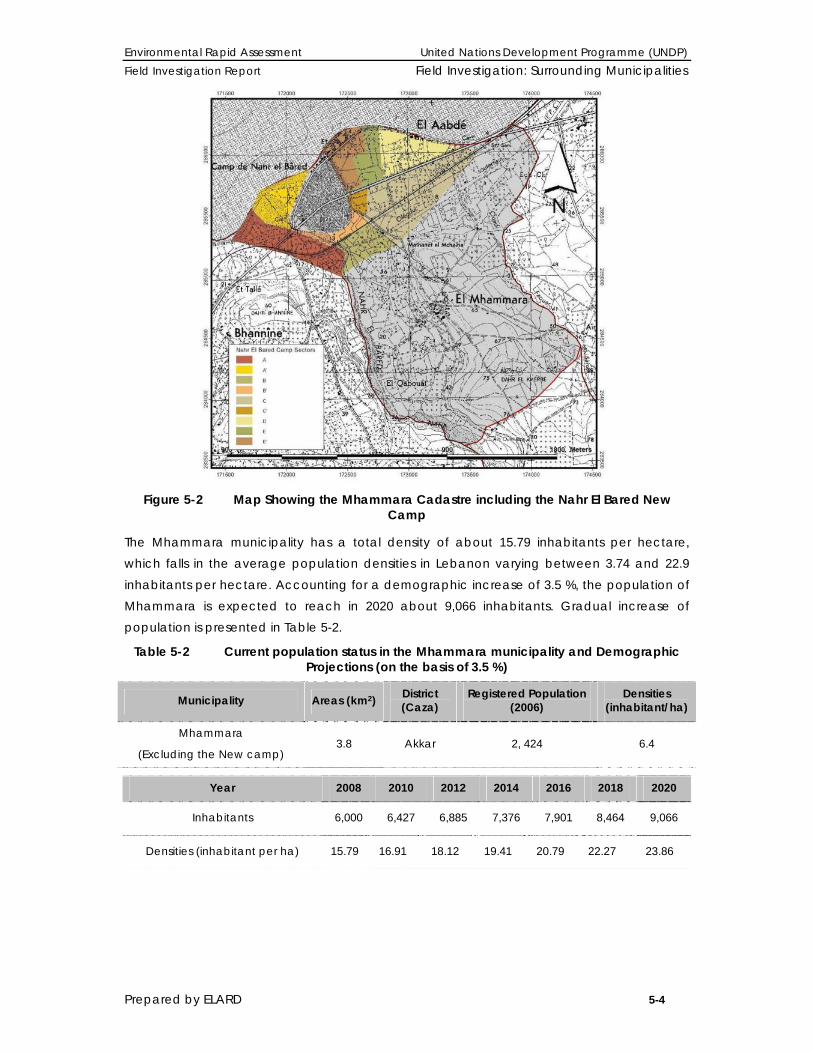
Environmental Rapid Assessment United Nations Development Programme (UNDP) Field Investigation Report Field Investigation: Surrounding Municipalities
Prepared by ELARD 5-4
Figure 5-2 Map Showing the Mhammara Cadastre including the Nahr El Bared New
Camp
The Mhammara municipality has a total density of about 15.79 inhabitants per hectare, which falls in the average population densities in Lebanon varying between 3.74 and 22.9 inhabitants per hectare. Accounting for a demographic increase of 3.5 %, the population of Mhammara is expected to reach in 2020 about 9,066 inhabitants. Gradual increase of population is presented in Table 5-2.
Table 5-2 Current population status in the Mhammara municipality and Demographic Projections (on the basis of 3.5 %)
Municipality Areas (km2) District (Caza)
Registered Population (2006)
Densities (inhabitant/ha)
Mhammara
(Excluding the New camp) 3.8 Akkar 2, 424 6.4
Year 2008 2010 2012 2014 2016 2018 2020
Inhabitants 6,000 6,427 6,885 7,376 7,901 8,464 9,066
Densities (inhabitant per ha) 15.79 16.91 18.12 19.41 20.79 22.27 23.86

Environmental Rapid Assessment United Nations Development Programme (UNDP) Field Investigation Report Field Investigation: Surrounding Municipalities
Prepared by ELARD 5-5
5.2.1. Municipal Solid waste
5.2.1.1. Quantities
According to the head of the municipality of Mhammara, about 2.5 tons (equivalent to about 0.42 Kg/capita/day) of solid wastes are collected on a daily basis. As illustrated in Table 5-3 below, the expected solid waste generation in year 2020 (based on a 3.5% demographic expansion) would be about 3.81 tons.
Table 5-3 Population and Solid Waste Generation in Mhammara village until 2020
5.2.1.2. Composition
The composition of solid wastes varies seasonally in Mhammara. Organic wastes are predominant in summer, following summer crops processing increase. Most of the solid wastes collected from households are mainly composed of organic residues, some quantities of cans and papers. A modest medical clinic provides basic medical services for the Mhammara Village, and generates medical wastes of relative low significance that are usually disposed along with the municipal waste. It is worth mentioning that the demolition wastes generated by the Nahr El Bared conflict are restricted to some broken glass and doors and therefore was disposed/ reused of at early stages.
5.2.1.3. Collection & Disposal
Wastes are temporary stored in closed bags in barrels distributed on the sides of the roads in the village. However, in places, especially the remote ones where municipal barrels are inexistent, wastes are deposited on the sides of the roads. Collection and dumping of solid wastes falls under the custody of a private group contracted by the Municipality of Mhammara at a rate of 600, 000 LBP per month (equivalent to 400 USD per month, and 160 USD per ton). The municipality of Mhammara allocates about 4,800 USD per year for solid waste transportation and disposal. The collected solid wastes are dumped in the Rawda (also known as Adwe) dumping site (34o 27 6.00N, 35o 59 19.20E), a land of a surface area of about 6,000 m2 on the flanks of Nahr El Bared Valley (Figure 5-3). Solid waste is segregated and sorted into reusable, recyclable and organic matter (Figure 5-4). The recyclables and reusable material are sold in the market if possible or buried as normal organic waste, and covered with soil (Figure 5-5).
Year 2008 2010 2012 2014 2016 2018 2020
Inhabitants 6,000 6,427 6,885 7,376 7,901 8,464 9,066
Solid Waste generation (tons/day) 2.50 2.7 2.9 3.10 3.32 3.55 3.81
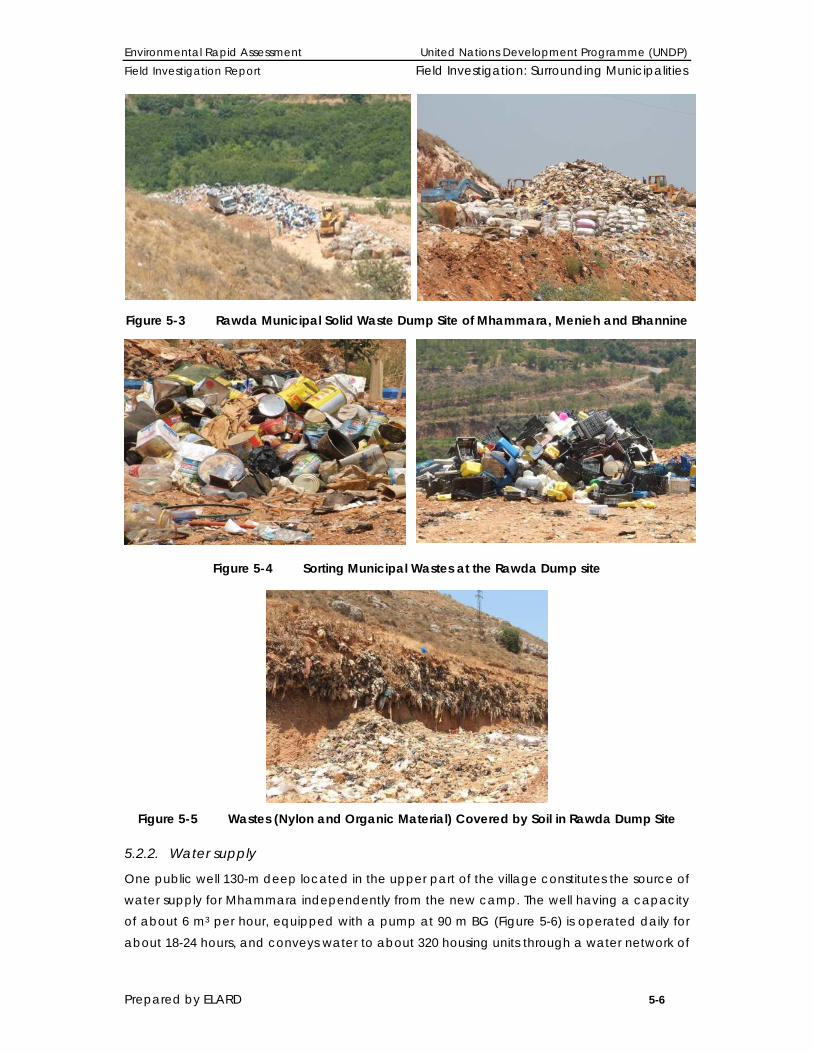
Environmental Rapid Assessment United Nations Development Programme (UNDP) Field Investigation Report Field Investigation: Surrounding Municipalities
Prepared by ELARD 5-6
Figure 5-3 Rawda Municipal Solid Waste Dump Site of Mhammara, Menieh and Bhannine
Figure 5-4 Sorting Municipal Wastes at the Rawda Dump site
Figure 5-5 Wastes (Nylon and Organic Material) Covered by Soil in Rawda Dump Site
5.2.2. Water supply
One public well 130-m deep located in the upper part of the village constitutes the source of water supply for Mhammara independently from the new camp. The well having a capacity of about 6 m3 per hour, equipped with a pump at 90 m BG (Figure 5-6) is operated daily for about 18-24 hours, and conveys water to about 320 housing units through a water network of

Environmental Rapid Assessment United Nations Development Programme (UNDP) Field Investigation Report Field Investigation: Surrounding Municipalities
Prepared by ELARD 5-7
a nominal diameter of 2- inch, located 50-60 cm below ground on the opposite side of the wastewater network. For each sector water is supplied daily for a period of about 2 hours, a quantity considered non sufficient especially for houses located at remote distance from the well. Considering no leakages in the system, gross water supply in the Mhammara municipality varies between 68 and 90 liters per capita per day. The housing units located outside the village and not benefiting of the public network because of their remoteness counting for about 73.33 % of the total residents of Mhammara municipality operate private wells having depths ranging between 25 and 60 m for domestic and local irrigation purposes.
Figure 5-6 Water well and water tower of Mhammara
The water supply network is constituted of PVC-made pipes as shown in Figure 5-7. In places many leakages are detected all across the network. Given that solid waste collection is not done properly, i.e., refuse are often found on the roads and not only in the vicinity of waste barrels, water leaking from the defective network might in flooding periods carry all kinds of impurities back to the network due to negative pressure (Figure 5-8).
Figure 5-7 PVC water pipes in Mhammara at a distributing point

Environmental Rapid Assessment United Nations Development Programme (UNDP) Field Investigation Report Field Investigation: Surrounding Municipalities
Prepared by ELARD 5-8
Figure 5-8 Water leakage in Mhammara
For irrigation purposes, water for citrus crops cultivation is provided from two main Irrigation Projects originating mainly from Ouyoun El Samak, Dam on Nahr El Bared River upper stream:
1) El Saki project for an area of about 80 ha, and 2) El Ray project for a cultivated area of about 150 ha.
A synthesis of the water use for various purposes in the Mhammara area is presented in Table 5-4. As shown in Table 5-5, based on a daily theoretical water demand ranging between 80 liters per capita, theoretical water demand for the Mhammara municipality in year 2020 is expected to reach gradually 725 m3. This value however does not account for water losses in the conduits, which might reach in places about 50 %.
Table 5-4 Synopsis of the Water Supply Sector in Mhammara
Source Purpose End-users Approximate Water supply
Public well Domestic
320 housing units/1600
inhabitants (26.66 % of the registered
population)
68-90 liters/ capita per day
Ouyoun Al Samak dam lake
El Saki Project Irrigation 80 hectares/ citrus NA
Ouyoun Al Samak dam lake
El Ray Project Irrigation 150 hectares/ citrus NA
Other Private wells (depth of about 25- 60 m)
Domestic and irrigation Unknown NA
Table 5-5 Theoretical Water Demand in Mhammara Municipality from 2010 until 2020
*Actual
Year 2008 2010 2012 2014 2016 2018 2020
Inhabitants 6,000 6,427 6,885 7,376 7,901 8,464 9,066
Waste water generation
(m3/day) 408* 514 551 590 632 677 725
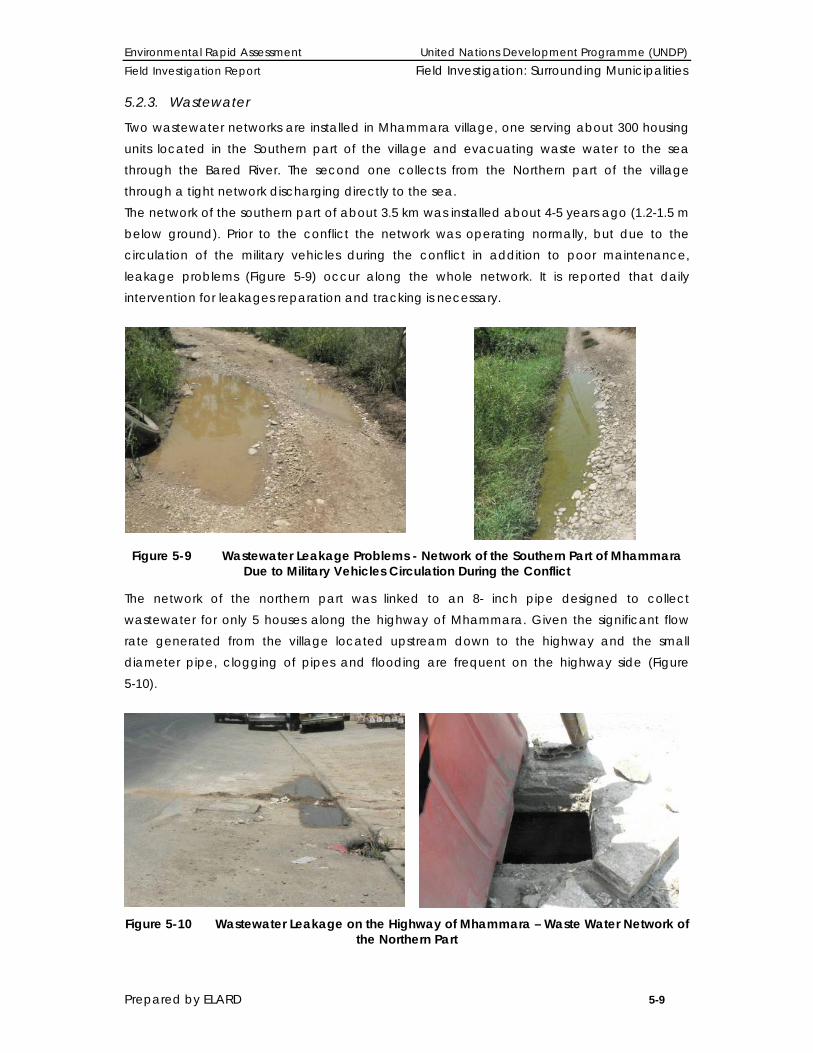
Environmental Rapid Assessment United Nations Development Programme (UNDP) Field Investigation Report Field Investigation: Surrounding Municipalities
Prepared by ELARD 5-9
5.2.3. Wastewater
Two wastewater networks are installed in Mhammara village, one serving about 300 housing units located in the Southern part of the village and evacuating waste water to the sea through the Bared River. The second one collects from the Northern part of the village through a tight network discharging directly to the sea. The network of the southern part of about 3.5 km was installed about 4-5 years ago (1.2-1.5 m below ground). Prior to the conflict the network was operating normally, but due to the circulation of the military vehicles during the conflict in addition to poor maintenance, leakage problems (Figure 5-9) occur along the whole network. It is reported that daily intervention for leakages reparation and tracking is necessary.
Figure 5-9 Wastewater Leakage Problems - Network of the Southern Part of Mhammara
Due to Military Vehicles Circulation During the Conflict
The network of the northern part was linked to an 8- inch pipe designed to collect wastewater for only 5 houses along the highway of Mhammara. Given the significant flow rate generated from the village located upstream down to the highway and the small diameter pipe, clogging of pipes and flooding are frequent on the highway side (Figure 5-10).
Figure 5-10 Wastewater Leakage on the Highway of Mhammara – Waste Water Network of
the Northern Part

Environmental Rapid Assessment United Nations Development Programme (UNDP) Field Investigation Report Field Investigation: Surrounding Municipalities
Prepared by ELARD 5-10
Houses located outside the village (in the cultivated land) discharge their wastewater to percolation pits of 4x4 m approximate dimensions. Despite that the pits are bottomless, unsealed, it was reported that inhabitants empty their pits on regular basis, when possible and evacuate the waste water to the sea. The storm water drainage canals are 0.3 m wide, located only on the highway side, and conveying rainwater directly to the sea. Given that the actual water supply is about 68 liters per capita, daily waste water generation is considered to be about 47.6 liters per capita. The quantities of waste water in the Mhammara Municipality are estimated currently at 285.6 m3. For projection purposes, expected daily waste water volumes are based on theoretical water supply of 80 l/capita/day, i.e., 56 liters per capita per day. Projections for theoretical waste water generation till year 2020 are presented in Table 5-6.
Table 5-6 Theoretical Waste Water Generation in Mhammara Municipality from 2010 until 2020
*Actual
5.2.4. Electricity
Most of the housing units in Mhammara are equipped with normal and energy saving lamps. Usually electricity is provided around 10 hours per day, however, due to the overloading of the network, electricity interruptions are very frequent. Most of Mhammara residents have electric generators (generating 3,000 A to 3,500 A) as shown in Figure 5-11 operating at 3 to 6 hours per day.
Figure 5-11 Commonly Used Electricity Generators in Mhammara
Year 2008 2010 2012 2014 2016 2018 2020
Inhabitants 6,000 6,427 6,885 7,376 7,901 8,464 9,066
Waste water generation
(m3/day) 285.6* 360 385.5 413 442.45 473.98 507.7
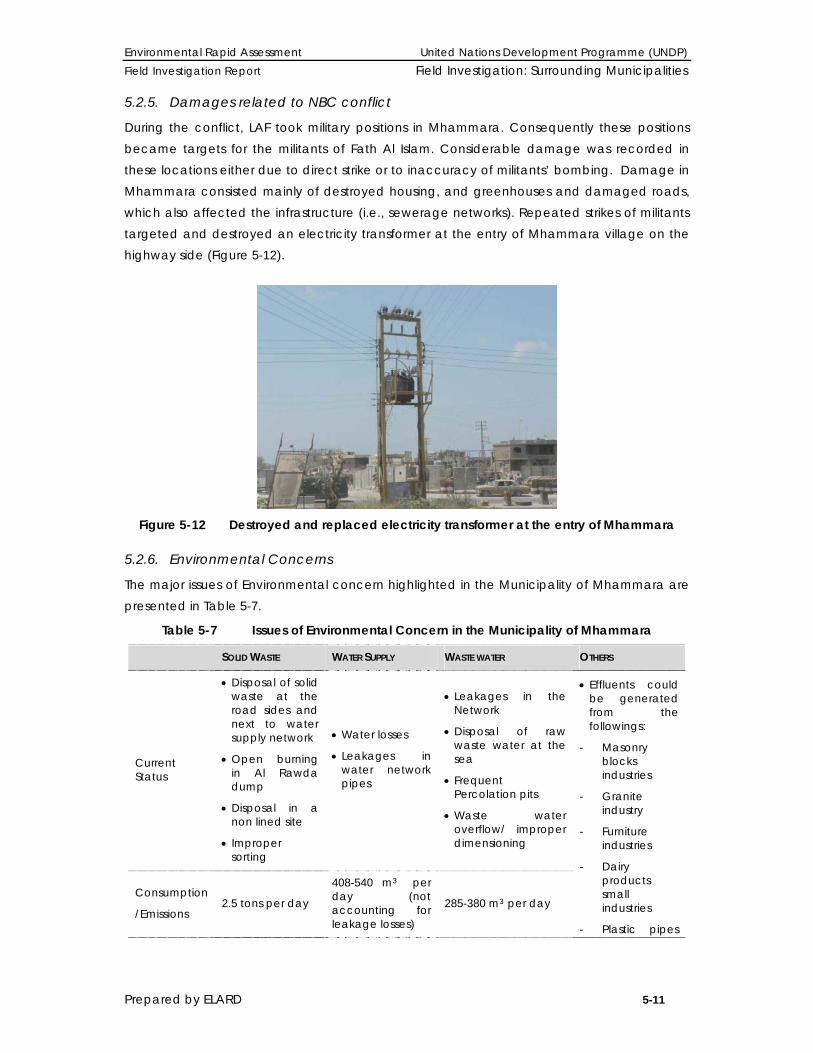
Environmental Rapid Assessment United Nations Development Programme (UNDP) Field Investigation Report Field Investigation: Surrounding Municipalities
Prepared by ELARD 5-11
5.2.5. Damages related to NBC conflict
During the conflict, LAF took military positions in Mhammara. Consequently these positions became targets for the militants of Fath Al Islam. Considerable damage was recorded in these locations either due to direct strike or to inaccuracy of militants’ bombing. Damage in Mhammara consisted mainly of destroyed housing, and greenhouses and damaged roads, which also affected the infrastructure (i.e., sewerage networks). Repeated strikes of militants targeted and destroyed an electricity transformer at the entry of Mhammara village on the highway side (Figure 5-12).
Figure 5-12 Destroyed and replaced electricity transformer at the entry of Mhammara
5.2.6. Environmental Concerns
The major issues of Environmental concern highlighted in the Municipality of Mhammara are presented in Table 5-7.
Table 5-7 Issues of Environmental Concern in the Municipality of Mhammara
SOLID WASTE WATER SUPPLY WASTE WATER OTHERS
Current Status
• Disposal of solid waste at the road sides and next to water supply network
• Open burning in Al Rawda dump
• Disposal in a non lined site
• Improper sorting
• Water losses
• Leakages in water network pipes
• Leakages in the Network
• Disposal of raw waste water at the sea
• Frequent Percolation pits
• Waste water overflow/ improper dimensioning
• Effluents could be generated from the followings:
- Masonry blocks industries
- Granite industry
- Furniture industries
- Dairy products small industries
- Plastic pipes
Consumption
/Emissions 2.5 tons per day
408-540 m3 per day (not accounting for leakage losses)
285-380 m3 per day

Environmental Rapid Assessment United Nations Development Programme (UNDP) Field Investigation Report Field Investigation: Surrounding Municipalities
Prepared by ELARD 5-12
SOLID WASTE WATER SUPPLY WASTE WATER OTHERS
Standard Values
3.84 tons per day*
480 m3 per day (not accounting for losses)*
336 m3 per day*
industry
- Steel industries
*Quantities based on a generation rate of 0.64 kg per capita per day (AUB, 1994) for solid waste, , 56 liters per capita per day for waste water
generation and 80 liters per capita per day for water consumption
5.3. BHANNINE Having an area of about 6.5 km2, Bhannine (Figure 5-13) is located in the southern borders of NBC. Bhannine counts about 14,000 inhabitants. During the conflict, the population remained almost the same. About 500 inhabitants fled to Bhannine temporarily during the conflict. As illustrated in Table 5-8, the current urban density in Bhannine is about 21-22 inhabitants per hectare, which is concordant with the density of arable land in Lebanon (22.9 persons per hectare).
Figure 5-13 Bhannine Located South to the New Camp Area
Table 5-8 Projected Population till year 2020 in Bhann2ine, with Respective Densities
Year 2008 2010 2012 2014 2016 2018 2020
Inhabitants 14,000 14,997 16,065 17,210 18,435 19,748 21,155
Density (Inhabitants/ ha) 21.5 23 24.7 26.5 28.4 30.4 32.5

Environmental Rapid Assessment United Nations Development Programme (UNDP) Field Investigation Report Field Investigation: Surrounding Municipalities
Prepared by ELARD 5-13
5.3.1. Municipal Solid waste
5.3.1.1. Quantities
According to the head of municipality, about 11 tons of municipal solid waste are generated per day, which is equivalent to about 0.79 kg/capita/day. Projected quantities of generated municipal solid waste in Bhannine are expected to reach by year 2020 about 16.6 tons/day of waste as shown in Table 5-9.
Table 5-9 Solid Waste Generation in Bhannine Municipality until year 2020
5.3.1.2. Composition
The composition of solid waste in Bhannine reflects the importance of agriculture practices where field investigation showed that organic wastes are the main components followed by paper wastes. Since the village lacks medical clinics, no medical wastes are generated with the municipal solid wastes.
5.3.1.3. Collection & Disposal
People in Bhanine dispose their unsorted wastes in plastic bags in special barrels found near their houses. Wastes are collected in pickups once or twice per week. It was noticed that in some places collection is not properly conducted, some leftovers are left in and around the barrels. Solid wastes are disposed in Rawda dump site. The municipality pays a monthly fee of 2,000 USD for waste collection and about 3,333 USD to Rawda dump, but starting August 2008, cost will increase to about 2,666 USD per month to account for high fuel prices. A budget of about 72,000 USD is yearly allocated for waste transportation and disposal in the Bhannine municipality. During NBC conflict, most of Bhannine residents left their houses especially inhabitants of southern vicinities of the new camp. After the crisis about 500 people from outside the village fled into Bhannine. As concluded during the conducted field investigation, solid waste services did not face additional stress and were maintained during and shortly after the crisis. It is worth mentioning that the demolition wastes generated by the Nahr El Bared conflict are restricted to some broken glass and doors. These wastes were collected and reused at early stages and did not affect the composition of solid wastes.
5.3.2. Water supply
The major water resource in Bhannine is the Ouyoun El Samak Spring located in the Valley of Nahr El Bared River to the east of Bhannine at the Nahr El Bared Upper dam.
Year 2008 2010 2012 2014 2016 2018 2020
Inhabitants 14,000 14,997 16,065 17,210 18,435 19,748 21,155
Solid Waste generation (T/day) 11 11.8 12.6 13.5 14.5 15.5 16.6

Environmental Rapid Assessment United Nations Development Programme (UNDP) Field Investigation Report Field Investigation: Surrounding Municipalities
Prepared by ELARD 5-14
A network conveys water from Ouyoun El Samak spring to about 60% of inhabitants of Bhannine (about 8, 400 persons). About 5% of houses rely partially or totally on private water wells to satisfy their water needs. Overall Bhannine counts about 140 wells drilled down to depths of 20 to 25 m below ground.
As per the conducted field investigation and individual questionnaires, water consumption in Bhannine was estimated at about 70 l/capita/day. However, leakages along the network (about 35 years old) as well as improper supply are recurrent. This implies that as water losses are considerable, daily water supply at the source significantly exceeds effective water consumption. Based on current daily water demand of about 70 liters per capita, water demand in the Bhannine Municipalities is currently about 980 m3. Based on the theoretical water demand of 80 liters per capita per day, this quantity is expected to reach about 1,700 m3 in 2020 (Table 5-10).
Table 5-10 Current and Projected Water Demand in Bhannine (on the basis of a theoretical daily water consumption of 80 liters per capita)
*Actual
5.3.3. Waste water
Bhannine is characterized a waste water network serving only 200 houses out of 2,800. The already installed pipes of the existing network are in deteriorated conditions. Pipes are neither gripped by tight clamps nor properly joined/ welded/threaded one to the other; therefore leakage problems are very frequent all through the network, although it was only installed few years ago. Wastewater of Bebnine is discharged into the sea via 2 outlets:
• One directly to the sea along with Menieh Northern waste water stream. • One to Nahr El Bared River located inside the new camp.
Houses having no access to waste water network convey their waste water to percolation pits. Additionally, housing units lacking proper waste water infrastructure, seldom discharge their generated waste water into irrigation pipe canals, resulting in polluting the water used for irrigation purposes (Figure 5-14). Storm water either flows into the sea by surface flowing and flooding on the roads or is conveyed to irrigation canals of dimensions 0.4x0.35 m originating from Nahr El Bared Dam.
Year 2008 2010 2012 2014 2016 2018 2020
Inhabitants 14,000 14,997 16,065 17,210 18,435 19,748 21,155
Water demand (m3/day) 980* 1,200 1,285 1,377 1,475 1,580 1,692
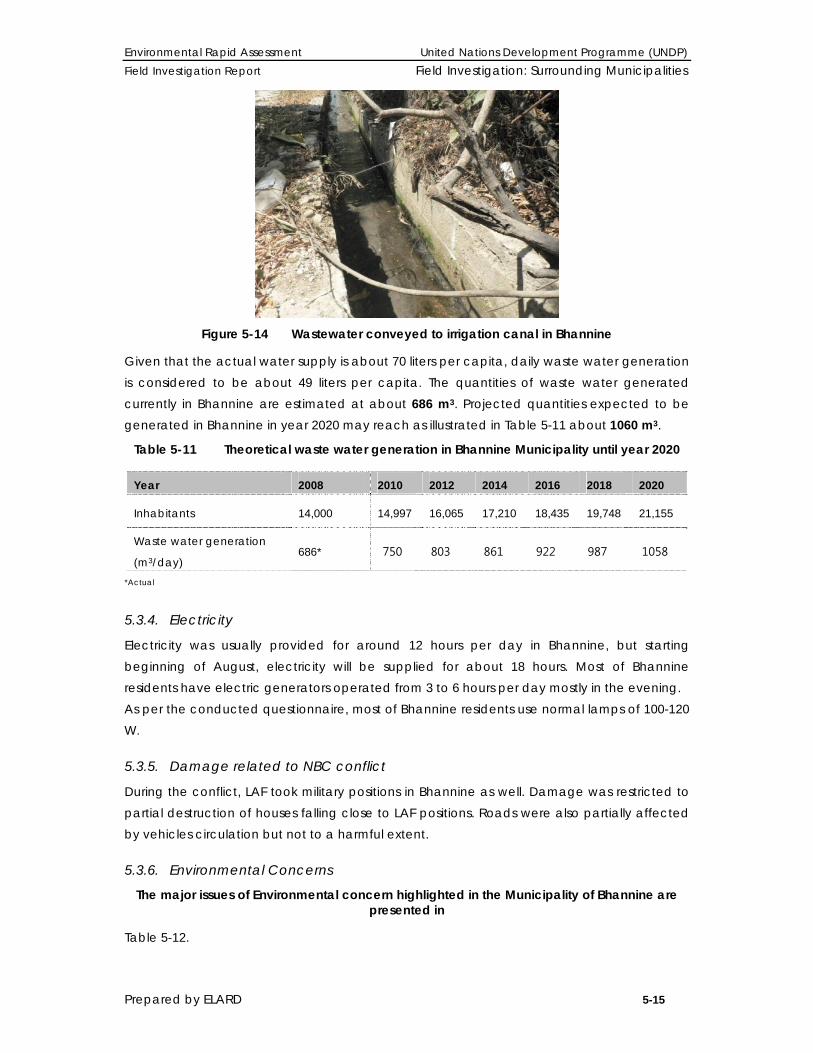
Environmental Rapid Assessment United Nations Development Programme (UNDP) Field Investigation Report Field Investigation: Surrounding Municipalities
Prepared by ELARD 5-15
Figure 5-14 Wastewater conveyed to irrigation canal in Bhannine
Given that the actual water supply is about 70 liters per capita, daily waste water generation is considered to be about 49 liters per capita. The quantities of waste water generated currently in Bhannine are estimated at about 686 m3. Projected quantities expected to be generated in Bhannine in year 2020 may reach as illustrated in Table 5-11 about 1060 m3.
Table 5-11 Theoretical waste water generation in Bhannine Municipality until year 2020
*Actual
5.3.4. Electricity
Electricity was usually provided for around 12 hours per day in Bhannine, but starting beginning of August, electricity will be supplied for about 18 hours. Most of Bhannine residents have electric generators operated from 3 to 6 hours per day mostly in the evening. As per the conducted questionnaire, most of Bhannine residents use normal lamps of 100-120 W.
5.3.5. Damage related to NBC conflict
During the conflict, LAF took military positions in Bhannine as well. Damage was restricted to partial destruction of houses falling close to LAF positions. Roads were also partially affected by vehicles circulation but not to a harmful extent.
5.3.6. Environmental Concerns
The major issues of Environmental concern highlighted in the Municipality of Bhannine are presented in
Table 5-12.
Year 2008 2010 2012 2014 2016 2018 2020
Inhabitants 14,000 14,997 16,065 17,210 18,435 19,748 21,155
Waste water generation
(m3/day) 686* 750 803 861 922 987 1058
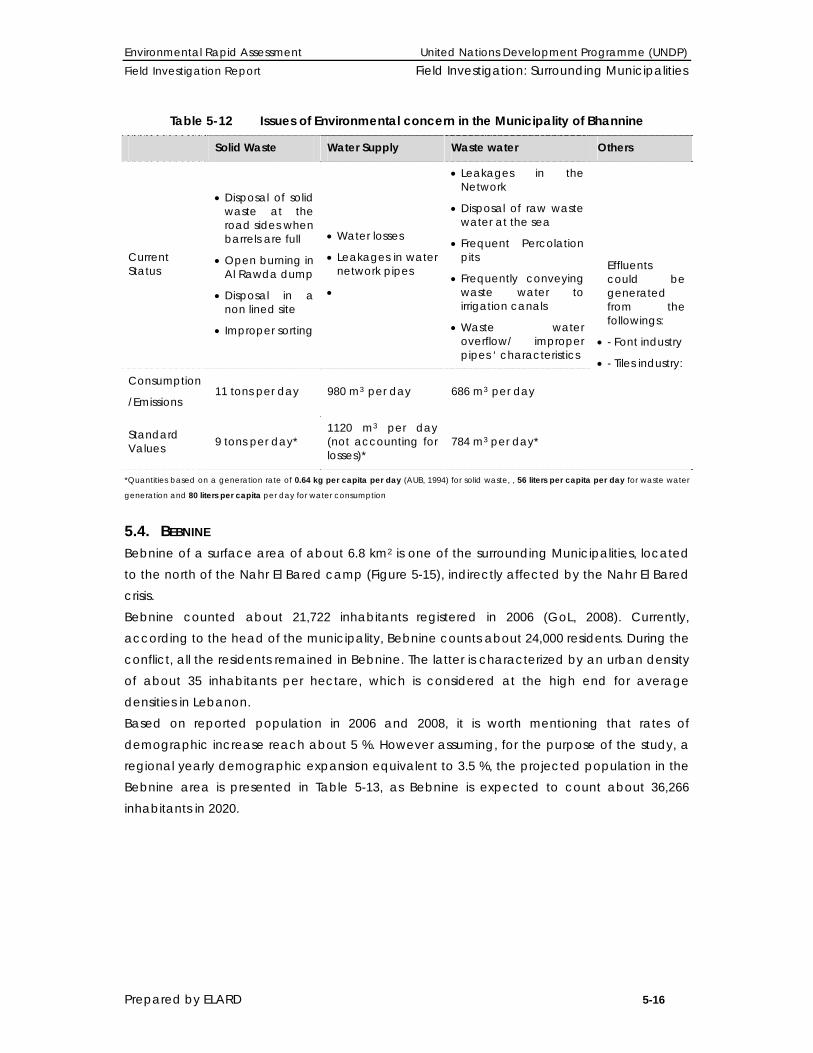
Environmental Rapid Assessment United Nations Development Programme (UNDP) Field Investigation Report Field Investigation: Surrounding Municipalities
Prepared by ELARD 5-16
Table 5-12 Issues of Environmental concern in the Municipality of Bhannine
Solid Waste Water Supply Waste water Others
Current Status
• Disposal of solid waste at the road sides when barrels are full
• Open burning in Al Rawda dump
• Disposal in a non lined site
• Improper sorting
• Water losses
• Leakages in water network pipes
•
• Leakages in the Network
• Disposal of raw waste water at the sea
• Frequent Percolation pits
• Frequently conveying waste water to irrigation canals
• Waste water overflow/ improper pipes ‘ characteristics
Effluents could be generated from the followings:
• - Font industry
• - Tiles industry: Consumption
/Emissions 11 tons per day 980 m3 per day 686 m3 per day
Standard Values 9 tons per day*
1120 m3 per day (not accounting for losses)*
784 m3 per day*
*Quantities based on a generation rate of 0.64 kg per capita per day (AUB, 1994) for solid waste, , 56 liters per capita per day for waste water
generation and 80 liters per capita per day for water consumption
5.4. BEBNINE Bebnine of a surface area of about 6.8 km2 is one of the surrounding Municipalities, located to the north of the Nahr El Bared camp (Figure 5-15), indirectly affected by the Nahr El Bared crisis. Bebnine counted about 21,722 inhabitants registered in 2006 (GoL, 2008). Currently, according to the head of the municipality, Bebnine counts about 24,000 residents. During the conflict, all the residents remained in Bebnine. The latter is characterized by an urban density of about 35 inhabitants per hectare, which is considered at the high end for average densities in Lebanon. Based on reported population in 2006 and 2008, it is worth mentioning that rates of demographic increase reach about 5 %. However assuming, for the purpose of the study, a regional yearly demographic expansion equivalent to 3.5 %, the projected population in the Bebnine area is presented in Table 5-13, as Bebnine is expected to count about 36,266 inhabitants in 2020.

Environmental Rapid Assessment United Nations Development Programme (UNDP) Field Investigation Report Field Investigation: Surrounding Municipalities
Prepared by ELARD 5-17
Figure 5-15 Bebnine located North to the Camp Area
Table 5-13 Projected Population till year 2020 in Bebnine, with Respective Densities
5.4.1. Municipal Solid Waste
5.4.1.1. Quantities
According to the head of municipality, about 25 tons/day of municipal solid waste are generated per day, which is equivalent to about 1.04 kg/capita/day. Projected quantities of generated municipal solid waste are expected to reach by year 2020 about 37.71 tons/day of waste in Bebnine as shown in Table 5-14.
Table 5-14 Number of inhabitants and solid wastes generation in Bebnine village until year 2020 considering a demographic expansion of 3.5%
Year 2008 2010 2012 2014 2016 2018 2020
Inhabitants 24,000 25,709 27,541 29,502 31,603 33,854 36,266
Density (Inhabitants/ ha) 35.3 37.8 40.5 43.4 46.5 49.8 53.3
Year 2008 2010 2012 2014 2016 2018 2020
Inhabitants 24,000 25,709 27,541 29,502 31,603 33,854 36,266
Solid Waste generation (T/day) 25.00 26.73 28.64 30.68 32.87 35.21 37.71

Environmental Rapid Assessment United Nations Development Programme (UNDP) Field Investigation Report Field Investigation: Surrounding Municipalities
Prepared by ELARD 5-18
5.4.1.2. Composition
Municipal solid waste of Bebnine includes a high proportion of organic waste with respect to other types of waste such as paper and plastic. The high organic waste content is reflective of the agricultural activities found in Bebnine. There are no demolition wastes, since Bebnine was not directly affected by NBC conflict consequences. According to local people and to the municipality the quantities of generated medical wastes are minimal, and are treated and processed in the same way as organic and other types of wastes.
5.4.1.3. Collection & Disposal
With respect to the disposal at household level, most of the inhabitants in Bebnine dispose their unsorted wastes in plastic bags in special barrels found near their houses. Solid wastes are collected in compactors (Figure 5-16) three times per week, yet in some places the collection occurs once per week thus resulting in a foul smell in the surroundings. According to the conducted surveys, collection is not properly done, as not all the refuse are collected and transported but left in and around the barrels as shown in Figure 5-17.
Figure 5-16 Compactor collecting solid waste in Bebnine
Figure 5-17 Solid waste barrel in Bebnine
In some places, solid wastes are disposed in irrigation canals also polluted by wastewater. Figure 5-18 below shows a solid waste disposal site into a water canal next to Bebnine spring.

Environmental Rapid Assessment United Nations Development Programme (UNDP) Field Investigation Report Field Investigation: Surrounding Municipalities
Prepared by ELARD 5-19
Figure 5-18 Irrigation water canal polluted by wastewater and solid waste – A water pipe
also crosses this canal
Collection as well as waste disposal is undertaken by of Mr. Hassan Toufic Boustany, a private contractor/ land owner. Solid waste services and final disposal are charged at a rate of 16 USD/ton (i.e., approximately 12,000 USD /month). The yearly budget allocated by the municipality for waste disposal is about 144, 000 USD. Solid waste is disposed in the private landfill (Figure 5-19) of Mr. Hassan Toufic Boustany lying in Beit El Hosh outside Bebnine and far from residential sectors. Following sorting and solid waste segregation into plastic, metal, and all other wastes such as organic, medical and paper wastes are all processed locally. Processing consists of spreading lime over the dumped wastes before covering them by soil. The dumping site is constantly planted and rehabilitated into orchards as shown in Figure 5-20.
Figure 5-19 Private landfill located in Beit El Hosh for Bebnine (and other Municipalities)
solid waste disposal
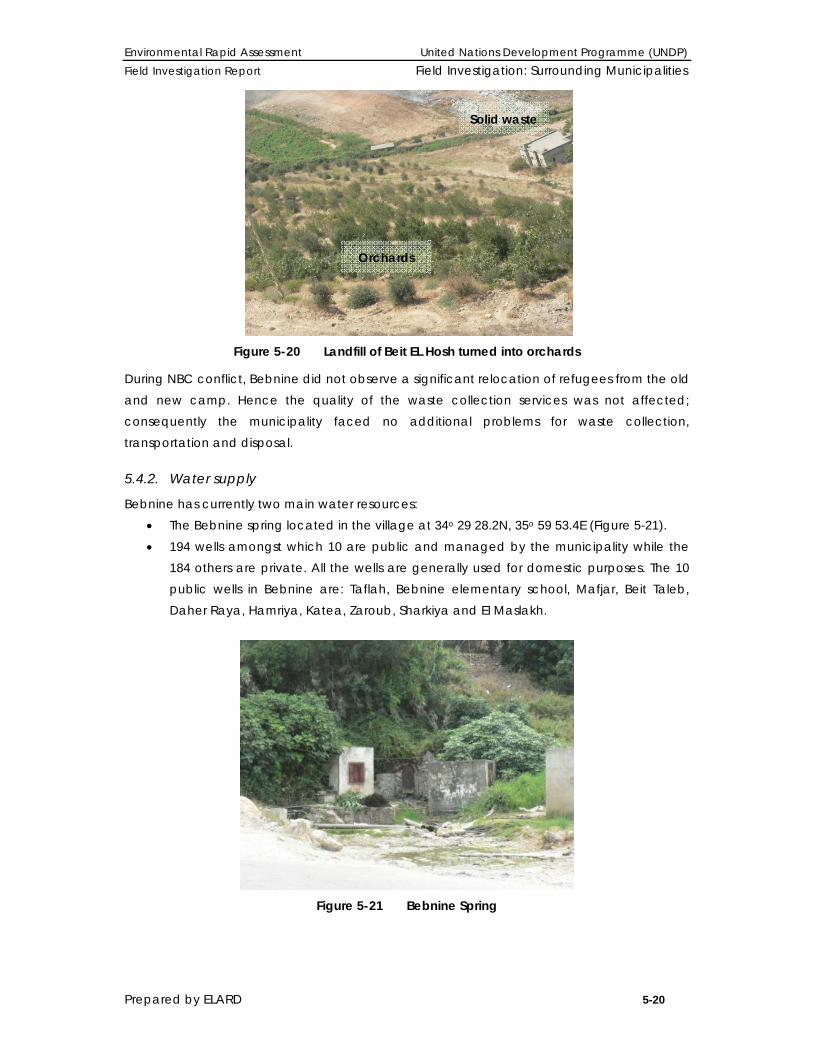
Environmental Rapid Assessment United Nations Development Programme (UNDP) Field Investigation Report Field Investigation: Surrounding Municipalities
Prepared by ELARD 5-20
Figure 5-20 Landfill of Beit EL Hosh turned into orchards
During NBC conflict, Bebnine did not observe a significant relocation of refugees from the old and new camp. Hence the quality of the waste collection services was not affected; consequently the municipality faced no additional problems for waste collection, transportation and disposal.
5.4.2. Water supply
Bebnine has currently two main water resources: • The Bebnine spring located in the village at 34o 29 28.2N, 35o 59 53.4E (Figure 5-21). • 194 wells amongst which 10 are public and managed by the municipality while the
184 others are private. All the wells are generally used for domestic purposes. The 10 public wells in Bebnine are: Taflah, Bebnine elementary school, Mafjar, Beit Taleb, Daher Raya, Hamriya, Katea, Zaroub, Sharkiya and El Maslakh.
Figure 5-21 Bebnine Spring
Orchards
Solid waste
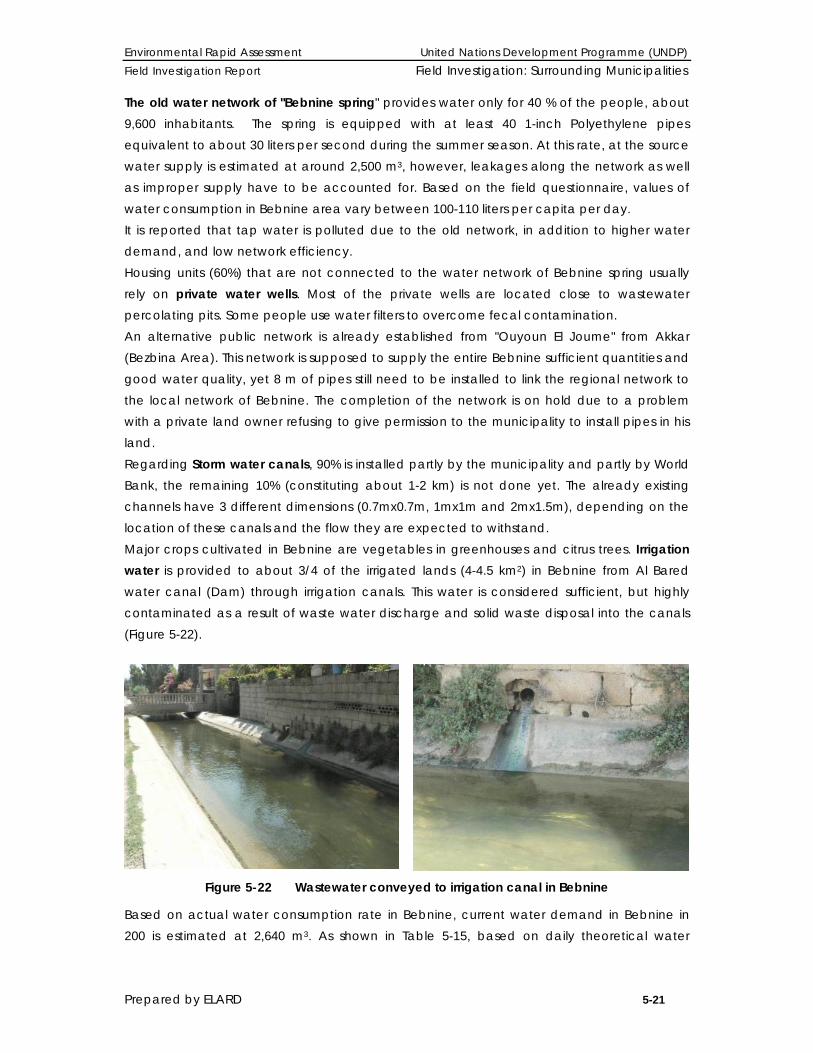
Environmental Rapid Assessment United Nations Development Programme (UNDP) Field Investigation Report Field Investigation: Surrounding Municipalities
Prepared by ELARD 5-21
The old water network of "Bebnine spring" provides water only for 40 % of the people, about 9,600 inhabitants. The spring is equipped with at least 40 1-inch Polyethylene pipes equivalent to about 30 liters per second during the summer season. At this rate, at the source water supply is estimated at around 2,500 m3, however, leakages along the network as well as improper supply have to be accounted for. Based on the field questionnaire, values of water consumption in Bebnine area vary between 100-110 liters per capita per day. It is reported that tap water is polluted due to the old network, in addition to higher water demand, and low network efficiency. Housing units (60%) that are not connected to the water network of Bebnine spring usually rely on private water wells. Most of the private wells are located close to wastewater percolating pits. Some people use water filters to overcome fecal contamination. An alternative public network is already established from "Ouyoun El Joume" from Akkar (Bezbina Area). This network is supposed to supply the entire Bebnine sufficient quantities and good water quality, yet 8 m of pipes still need to be installed to link the regional network to the local network of Bebnine. The completion of the network is on hold due to a problem with a private land owner refusing to give permission to the municipality to install pipes in his land. Regarding Storm water canals, 90% is installed partly by the municipality and partly by World Bank, the remaining 10% (constituting about 1-2 km) is not done yet. The already existing channels have 3 different dimensions (0.7mx0.7m, 1mx1m and 2mx1.5m), depending on the location of these canals and the flow they are expected to withstand. Major crops cultivated in Bebnine are vegetables in greenhouses and citrus trees. Irrigation water is provided to about 3/4 of the irrigated lands (4-4.5 km2) in Bebnine from Al Bared water canal (Dam) through irrigation canals. This water is considered sufficient, but highly contaminated as a result of waste water discharge and solid waste disposal into the canals (Figure 5-22).
Figure 5-22 Wastewater conveyed to irrigation canal in Bebnine
Based on actual water consumption rate in Bebnine, current water demand in Bebnine in 200 is estimated at 2,640 m3. As shown in Table 5-15, based on daily theoretical water
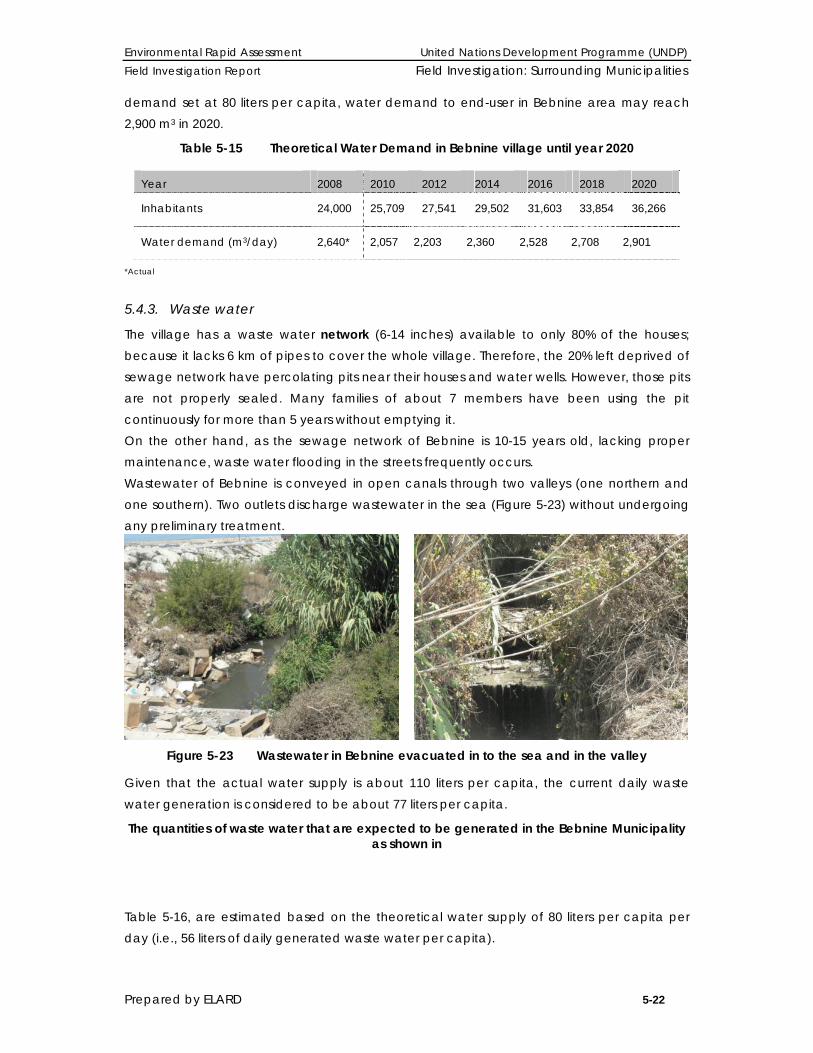
Environmental Rapid Assessment United Nations Development Programme (UNDP) Field Investigation Report Field Investigation: Surrounding Municipalities
Prepared by ELARD 5-22
demand set at 80 liters per capita, water demand to end-user in Bebnine area may reach 2,900 m3 in 2020.
Table 5-15 Theoretical Water Demand in Bebnine village until year 2020
*Actual
5.4.3. Waste water
The village has a waste water network (6-14 inches) available to only 80% of the houses; because it lacks 6 km of pipes to cover the whole village. Therefore, the 20% left deprived of sewage network have percolating pits near their houses and water wells. However, those pits are not properly sealed. Many families of about 7 members have been using the pit continuously for more than 5 years without emptying it. On the other hand, as the sewage network of Bebnine is 10-15 years old, lacking proper maintenance, waste water flooding in the streets frequently occurs. Wastewater of Bebnine is conveyed in open canals through two valleys (one northern and one southern). Two outlets discharge wastewater in the sea (Figure 5-23) without undergoing any preliminary treatment.
Figure 5-23 Wastewater in Bebnine evacuated in to the sea and in the valley
Given that the actual water supply is about 110 liters per capita, the current daily waste water generation is considered to be about 77 liters per capita.
The quantities of waste water that are expected to be generated in the Bebnine Municipality as shown in
Table 5-16, are estimated based on the theoretical water supply of 80 liters per capita per day (i.e., 56 liters of daily generated waste water per capita).
Year 2008 2010 2012 2014 2016 2018 2020
Inhabitants 24,000 25,709 27,541 29,502 31,603 33,854 36,266
Water demand (m3/day) 2,640* 2,057 2,203 2,360 2,528 2,708 2,901
Environmental Rapid Assessment United Nations Development Programme (UNDP) Field Investigation Report Field Investigation: Surrounding Municipalities
Prepared by ELARD 5-23
Table 5-16 Theoretical waste water generation in Bebnine village until year 2020
*Actual
5.4.4. Electricity
Lamps of 100 W are usually used in most of the houses in Bebnine. Few people rely on energy saving lamps. Usually electricity is provided around 12 hours per day. Those who have electricity generators (5 A to 20 A) usually operate them for about 6 hours a day.
5.4.5. Environmental Concerns
The major issues of Environmental concern highlighted in the Municipality of Bebnine are presented in Table 5-17.
Table 5-17 Issues of Environmental concern in the Municipality of Bebnine
Solid Waste Water Supply Waste water Others
Current Status
• Disposal of solid waste at the road sides and in irrigation water canals
• Landfill in Beit El Hosh
• Disposal in a non lined site
• Ground water polluted from percolation pits
• Leakages in water network pipes
• Water pipes improperly spread
• Lack of water consumption efficiency measures
• 20% have percolation pits, no network coverage
• Conveying wastewater to the valley and to irrigation water network
• Leakages in the Network
• Disposal of raw waste water at the sea
• Effluents could be generated from the followings:
• - Furniture industries
• - Fishing boats industries
• - Painting industry
• - Dairy products industry
• - Olive oil extraction mill
Consumption
/Emissions 25 tons per day
2,640 m3 per day (water supply – not accounting for leakages)
1848 m3 per day
Standard Values
15.36 tons per day*
1,920 m3 per day (not accounting for losses)
1344 m3 per day
*Quantities based on a generation rate of 0.64 kg per capita per day (AUB, 1994) for solid waste, , 56 liters per capita per day for waste water
generation and 80 liters per capita per day for water consumption
Year 2008 2010 2012 2014 2016 2018 2020
Inhabitants 24,000 25,709 27,541 29,502 31,603 33,854 36,266
Waste water generation (m3/day) 1,848* 1,465 1,569 1,681 1,801 1,929 2,067
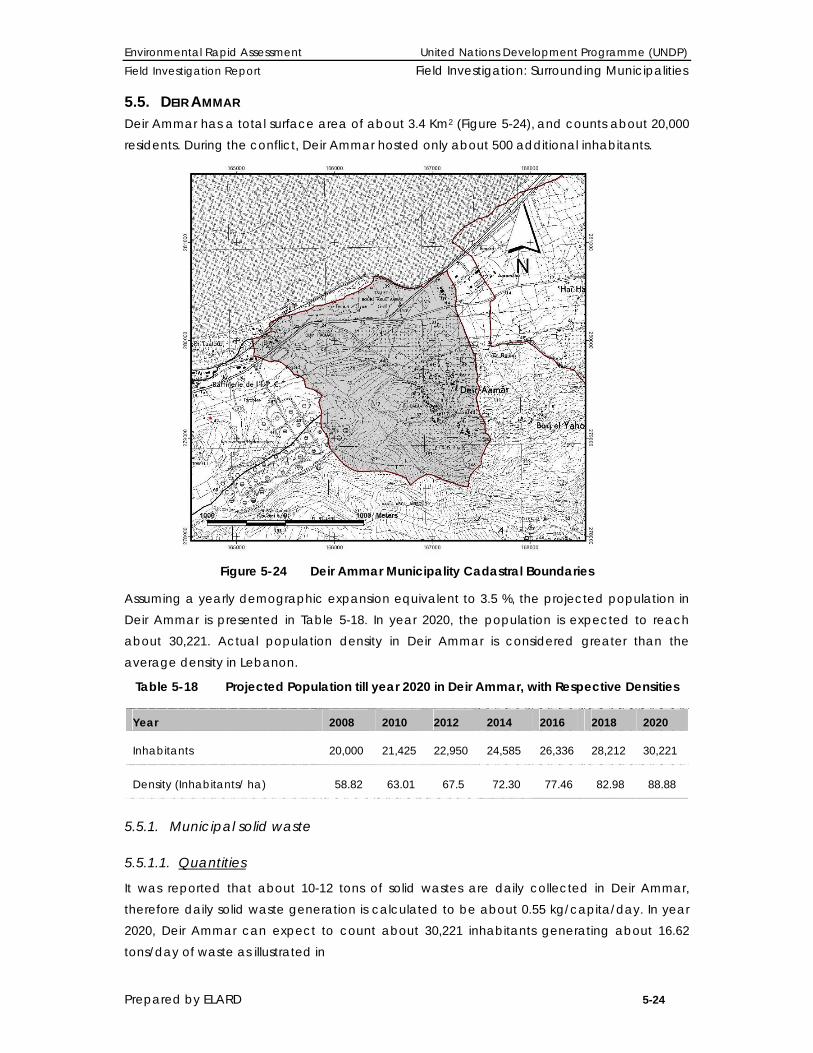
Environmental Rapid Assessment United Nations Development Programme (UNDP) Field Investigation Report Field Investigation: Surrounding Municipalities
Prepared by ELARD 5-24
5.5. DEIR AMMAR Deir Ammar has a total surface area of about 3.4 Km2 (Figure 5-24), and counts about 20,000 residents. During the conflict, Deir Ammar hosted only about 500 additional inhabitants.
Figure 5-24 Deir Ammar Municipality Cadastral Boundaries
Assuming a yearly demographic expansion equivalent to 3.5 %, the projected population in Deir Ammar is presented in Table 5-18. In year 2020, the population is expected to reach about 30,221. Actual population density in Deir Ammar is considered greater than the average density in Lebanon.
Table 5-18 Projected Population till year 2020 in Deir Ammar, with Respective Densities
5.5.1. Municipal solid waste
5.5.1.1. Quantities
It was reported that about 10-12 tons of solid wastes are daily collected in Deir Ammar, therefore daily solid waste generation is calculated to be about 0.55 kg/capita/day. In year 2020, Deir Ammar can expect to count about 30,221 inhabitants generating about 16.62 tons/day of waste as illustrated in
Year 2008 2010 2012 2014 2016 2018 2020
Inhabitants 20,000 21,425 22,950 24,585 26,336 28,212 30,221
Density (Inhabitants/ ha) 58.82 63.01 67.5 72.30 77.46 82.98 88.88

Environmental Rapid Assessment United Nations Development Programme (UNDP) Field Investigation Report Field Investigation: Surrounding Municipalities
Prepared by ELARD 5-25
Table 5-19.
Table 5-19 Number of inhabitants and solid wastes generation in Deir Ammar village until year 2020 considering a demographic expansion of 3.5%
5.5.1.2. Composition
The main municipal waste streams in Deir Ammar consist of organic residues and paper. No medical wastes are generated as Deir Ammar lacks medical clinics and hospitals.
5.5.1.3. Collection and disposal
It is frequent in Deir Ammar that people dispose their unsorted wastes in plastic bags, and then near Municipality’s barrels (Figure 5-25). A private pickup shown in Figure 5-26 collects municipal solid wastes every two days. Collection is usually properly performed, expect when residents of Deir Ammar do not respect schedules of disposal and collection, which leads to waste piling in the respective disposal areas.
Figure 5-25 Wastes disposed outside barrels in Deir Ammar
Year 2008 2010 2012 2014 2016 2018 2020
Inhabitants 20,000 21,425 22,950 24,585 26,336 28,212 30,221
Solid Waste generation
(tons/day) 11 11.8 12.6 13.5 14.5 15.5 16.6
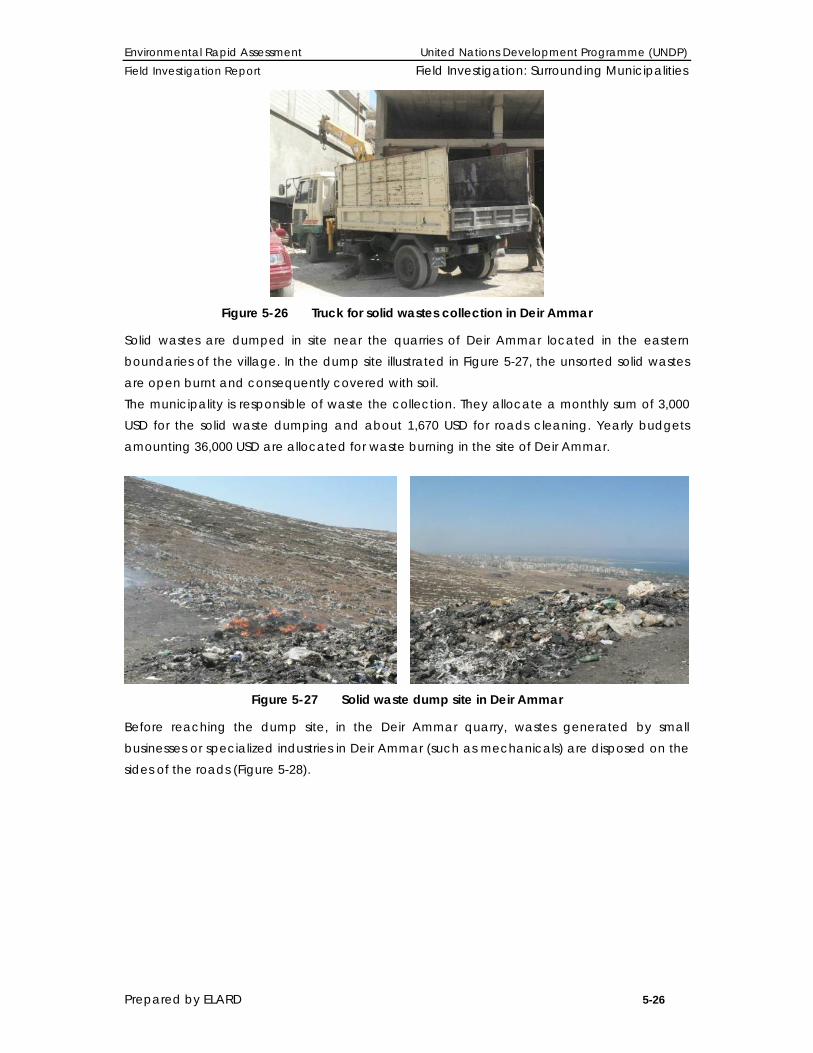
Environmental Rapid Assessment United Nations Development Programme (UNDP) Field Investigation Report Field Investigation: Surrounding Municipalities
Prepared by ELARD 5-26
Figure 5-26 Truck for solid wastes collection in Deir Ammar
Solid wastes are dumped in site near the quarries of Deir Ammar located in the eastern boundaries of the village. In the dump site illustrated in Figure 5-27, the unsorted solid wastes are open burnt and consequently covered with soil. The municipality is responsible of waste the collection. They allocate a monthly sum of 3,000 USD for the solid waste dumping and about 1,670 USD for roads cleaning. Yearly budgets amounting 36,000 USD are allocated for waste burning in the site of Deir Ammar.
Figure 5-27 Solid waste dump site in Deir Ammar
Before reaching the dump site, in the Deir Ammar quarry, wastes generated by small businesses or specialized industries in Deir Ammar (such as mechanicals) are disposed on the sides of the roads (Figure 5-28).

Environmental Rapid Assessment United Nations Development Programme (UNDP) Field Investigation Report Field Investigation: Surrounding Municipalities
Prepared by ELARD 5-27
Figure 5-28 Wastes dumped outside Deir Ammar dump site
5.5.2. Water supply
The main water resource in Deir Ammar is the well belonging to the North Water Authorities Part of North Lebanon Establishment, used for drinking and domestic use (Figure 5-29). The entire village is connected to the water network which s about 0.5 m below ground surface. The old water network often depicts leakage problems (Figure 5-30) that are usually remediated shortly.
Figure 5-29 Well in Deir Ammar for Water Authorities of the North

Environmental Rapid Assessment United Nations Development Programme (UNDP) Field Investigation Report Field Investigation: Surrounding Municipalities
Prepared by ELARD 5-28
Figure 5-30 Repaired water leakage in Deir Ammar
There are about 40 wells in Deir Ammar used locally for domestic purposes, in addition to a currently non- exploited 5-inch public well. According to the questionnaire conducted in the village, water consumption ranges between 60 and 80 liters/capita/day. Whereas the Municipality informed us that water is scarce in Deir Ammar and that some people buy water to fulfill their water demand needs. As shown in Figure 5-22, on the basis of a daily water demand of 70 liters per day in Deir Ammar, actual water consumption in 2008 is about 1,400 m3. Projected water demand in year 2020 is expected to reach about 2,418 m3.
Table 5-20 Theoretical Water Demand in Deir Ammar Municipality till 2020
*Actual
The cultivated land in Deir Ammar is about 2.4 km2 mainly cultivated olives, almond trees (mainly eliminated due to a massive disease) and vegetables in greenhouses. Irrigation water is provided only from private wells, lacking irrigation water canals.
5.5.3. Wastewater
A waste water network covers the whole village. Waste water pipes having variable diameters of 6 to16 Inches are buried 1 to 1.2 m below ground surface. Wastewater is discharged to the sea via 2 outlets without undergoing any preliminary treatment, as illustrated in Figure 5-31.
Figure 5-31 Wastewater sea outlet in Deir Ammar
Leakage problems are frequent along the network of Deir Ammar since the pipes are relatively tight downstream on highway side. Figure 5-32 below shows a leakage point that
Year 2008 2010 2012 2014 2016 2018 2020
Inhabitants 20,000 21,425 22,950 24,585 26,336 28,212 30,221
Water Demand
(m3/day) 1,400* 1,714 1,836 1,967 2,107 2,257 2,418

Environmental Rapid Assessment United Nations Development Programme (UNDP) Field Investigation Report Field Investigation: Surrounding Municipalities
Prepared by ELARD 5-29
often floods on the highway. Storm water canals are almost lacking in Deir Ammar. Rain water flows in the streets down way to the beach.
Figure 5-32 Waste water network leakage on the highway in Deir Ammar
The current daily waste water generation is considered to be about 49 liters per capita per day, on the basis of an average water consumption of about 70 liters /capita/day. Based on a theoretical water supply of 80 liter per capita per day, the quantities of waste water that are expected to be generated in Deir Ammar Municipality are estimated as per Table 5-21.
Table 5-21 Theoretical waste water generation in Deir Ammar village until year 2020
*Actual
5.5.4. Electricity
Inhabitants of Deir Ammar use normal lamps (100 and 200 W) as well as energy saving lamps (40, 60 or 85 W). Electricity is provided around 12 hours per day. A private party provides electricity to the village to compensate electricity interruptions at a rate of 850 LBP/KW provided.
5.5.5. Relevant Industries
There are industries and special disposal sites in Deir Aamar area identified during the site investigation. These are as follows:
• The Electricity Plant of Deir Ammar (Figure 5‐33) is located on the seashore of the village and operates all day long. As per the conducted survey, people are suffering from air pollution which is negatively affecting their health. It was also reported that
Year 2008 2010 2012 2014 2016 2018 2020
Inhabitants 20,000 21,425 22,950 24,585 26,336 28,212 30,221
Waste water generation (m3/day) 980* 1,200 1,285 1,377 1,475 1,580 1,692
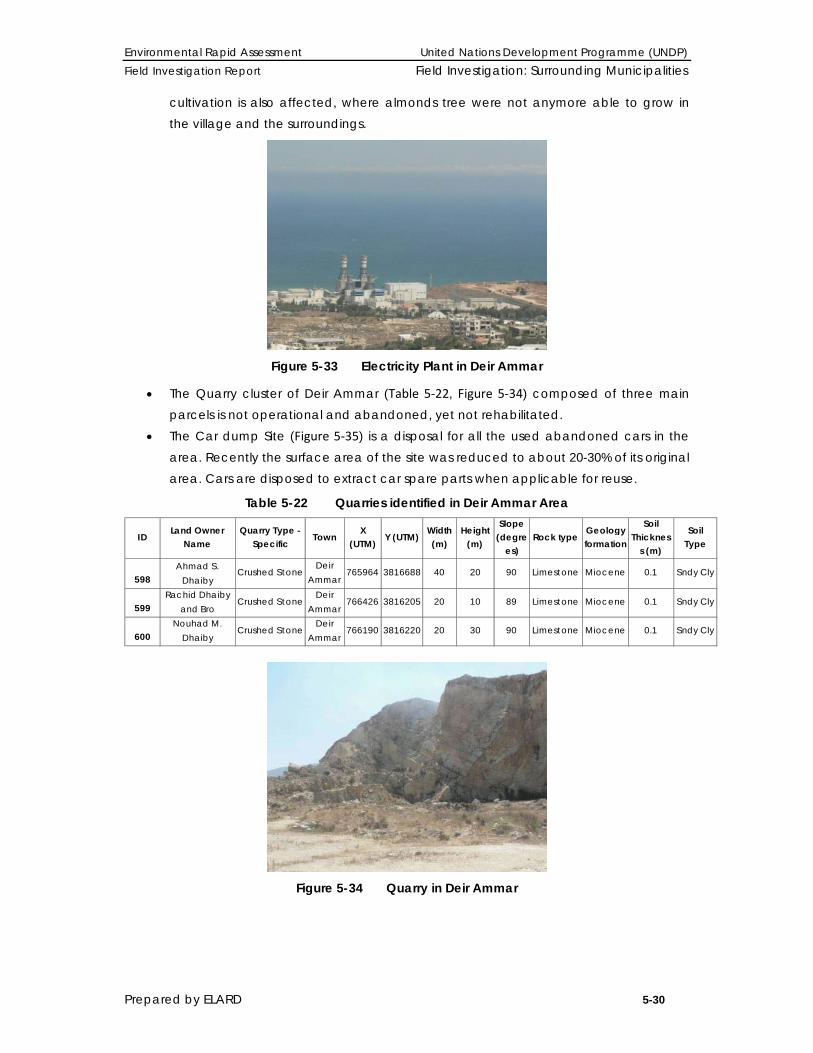
Environmental Rapid Assessment United Nations Development Programme (UNDP) Field Investigation Report Field Investigation: Surrounding Municipalities
Prepared by ELARD 5-30
cultivation is also affected, where almonds tree were not anymore able to grow in the village and the surroundings.
Figure 5-33 Electricity Plant in Deir Ammar
• The Quarry cluster of Deir Ammar (Table 5‐22, Figure 5‐34) composed of three main parcels is not operational and abandoned, yet not rehabilitated.
• The Car dump Site (Figure 5‐35) is a disposal for all the used abandoned cars in the area. Recently the surface area of the site was reduced to about 20-30% of its original area. Cars are disposed to extract car spare parts when applicable for reuse.
Table 5-22 Quarries identified in Deir Ammar Area
IDLand Owner
NameQuarry Type -
SpecificTown
X (UTM)
Y (UTM)Width (m)
Height (m)
Slope (degre
es)Rock type
Geology formation
Soil Thicknes
s (m)
Soil Type
598Ahmad S.
DhaibyCrushed Stone
Deir Ammar
765964 3816688 40 20 90 Limestone Miocene 0.1 Sndy Cly
599Rachid Dhaiby
and BroCrushed Stone
Deir Ammar
766426 3816205 20 10 89 Limestone Miocene 0.1 Sndy Cly
600Nouhad M.
DhaibyCrushed Stone
Deir Ammar
766190 3816220 20 30 90 Limestone Miocene 0.1 Sndy Cly
Figure 5-34 Quarry in Deir Ammar
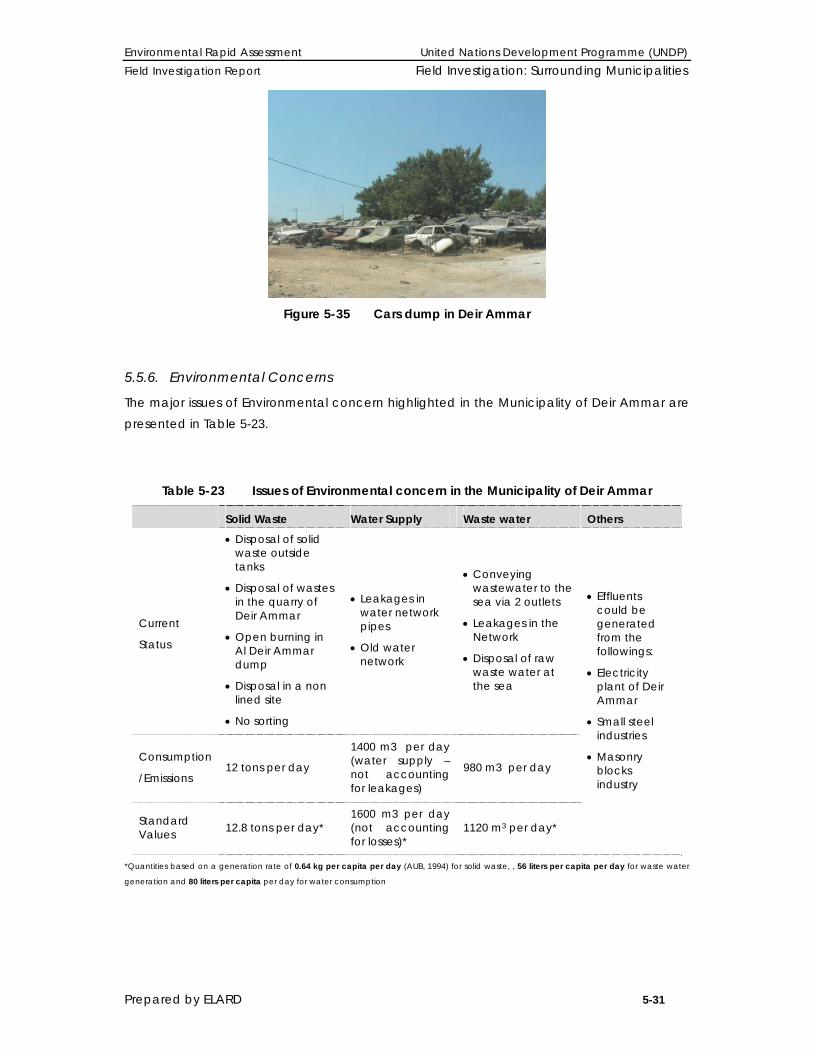
Environmental Rapid Assessment United Nations Development Programme (UNDP) Field Investigation Report Field Investigation: Surrounding Municipalities
Prepared by ELARD 5-31
Figure 5-35 Cars dump in Deir Ammar
5.5.6. Environmental Concerns
The major issues of Environmental concern highlighted in the Municipality of Deir Ammar are presented in Table 5-23.
Table 5-23 Issues of Environmental concern in the Municipality of Deir Ammar
Solid Waste Water Supply Waste water Others
Current
Status
• Disposal of solid waste outside tanks
• Disposal of wastes in the quarry of Deir Ammar
• Open burning in Al Deir Ammar dump
• Disposal in a non lined site
• No sorting
• Leakages in water network pipes
• Old water network
• Conveying wastewater to the sea via 2 outlets
• Leakages in the Network
• Disposal of raw waste water at the sea
• Effluents could be generated from the followings:
• Electricity plant of Deir Ammar
• Small steel industries
• Masonry blocks industry
Consumption
/Emissions 12 tons per day
1400 m3 per day (water supply – not accounting for leakages)
980 m3 per day
Standard Values 12.8 tons per day*
1600 m3 per day (not accounting for losses)*
1120 m3 per day*
*Quantities based on a generation rate of 0.64 kg per capita per day (AUB, 1994) for solid waste, , 56 liters per capita per day for waste water
generation and 80 liters per capita per day for water consumption

Environmental Rapid Assessment United Nations Development Programme (UNDP) Field Investigation Report Field Investigation: Surrounding Municipalities
Prepared by ELARD 5-32
5.6. MENIEH Menieh (Figure 5-36) has a total surface area of about 13.5 Km2, and counts about 43,000 residents. During the conflict, the population increased almost by 1000 capita due to immigrants flux from the conflict areas. After the conflict, the population was reestablished to its original state. Assuming a yearly demographic expansion equivalent to 3.5 %, the projected population in the Menieh area is presented in Table 5-24, as Menieh is expected to count about 64,976 inhabitants in year 2020.
Figure 5-36 El Menieh Cadastral Boundaries
Table 5-24 Projected Population till year 2020 in Menieh, with Respective Densities
Given that the average population densities in Lebanon vary between 3.74 inhabitants per hectare for total land and 22.9 inhabitants per hectare for arable land, population densities in Menieh are considered relatively high.
Year 2008 2010 2012 2014 2016 2018 2020
Inhabitants 43,000 46,063 49,343 52,858 56,623 60,656 64,976
Density (Inhabitants/ ha) 31.8 34.1 36.6 39.1 41.9 44.9 48.1

Environmental Rapid Assessment United Nations Development Programme (UNDP) Field Investigation Report Field Investigation: Surrounding Municipalities
Prepared by ELARD 5-33
5.6.1. Municipal solid waste
5.6.1.1. Quantities
According to the head of municipality, about 30 tons of municipal solid wastes are generated daily. A daily rate of approximately 0.7 kg per capita can be attributed to Menieh Municipality. Assuming a demographic expansion of 3.5%, Menieh is expected to count about 64,976 inhabitants by year 2020 generating about 45.48 tons/day of waste as illustrated in Table 5-25.
Table 5-25 Number of inhabitants and solid wastes generation in Menieh village until year 2020 considering a demographic expansion of 3.5%
5.6.1.2. Composition
Organic residues and paper waste constitute the main solid waste streams in Menieh. Cans and glass are rarely found in waste since inhabitants rely mainly on consumption of fresh rather than industrial/canned food. There is one hospital in Menieh with small clinics. Generated medical wastes are disposed along with municipal solid waste.
5.6.1.3. Collection and disposal
With respect to the disposal at household level, most of the inhabitants dispose their unsorted wastes in plastic bags in barrels belonging to the municipality. Solid wastes are collected by 2 private compactors (Figure 5-37) twice per week, except in the slaughter houses where collection is performed on a daily basis. The poor frequency of collection results in overloading of barrels (Figure 5-38) and in foul smells in the surroundings.
Year 2008 2010 2012 2014 2016 2018 2020
Inhabitants 43,000 46,063 49,343 52,858 56,623 60,656 64,976
Solid Waste
generation (T/day) 30 32.2 34.5 37 39.6 42.5 45.5
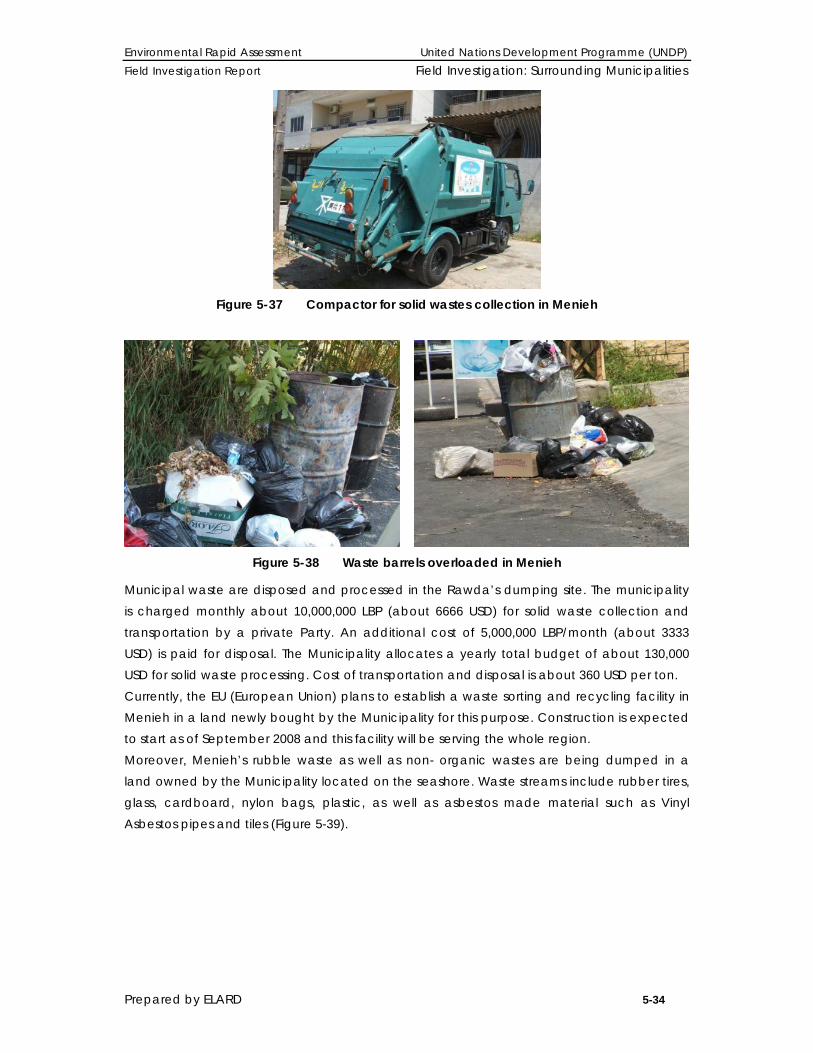
Environmental Rapid Assessment United Nations Development Programme (UNDP) Field Investigation Report Field Investigation: Surrounding Municipalities
Prepared by ELARD 5-34
Figure 5-37 Compactor for solid wastes collection in Menieh
Figure 5-38 Waste barrels overloaded in Menieh
Municipal waste are disposed and processed in the Rawda’s dumping site. The municipality is charged monthly about 10,000,000 LBP (about 6666 USD) for solid waste collection and transportation by a private Party. An additional cost of 5,000,000 LBP/month (about 3333 USD) is paid for disposal. The Municipality allocates a yearly total budget of about 130,000 USD for solid waste processing. Cost of transportation and disposal is about 360 USD per ton. Currently, the EU (European Union) plans to establish a waste sorting and recycling facility in Menieh in a land newly bought by the Municipality for this purpose. Construction is expected to start as of September 2008 and this facility will be serving the whole region. Moreover, Menieh’s rubble waste as well as non- organic wastes are being dumped in a land owned by the Municipality located on the seashore. Waste streams include rubber tires, glass, cardboard, nylon bags, plastic, as well as asbestos made material such as Vinyl Asbestos pipes and tiles (Figure 5-39).

Environmental Rapid Assessment United Nations Development Programme (UNDP) Field Investigation Report Field Investigation: Surrounding Municipalities
Prepared by ELARD 5-35
Figure 5-39 Menieh seashore dump
5.6.2. Water supply
The main source for water supply in Menieh is Ouyoun El Samak spring used for drinking and domestic use (Figure 5-40). About 50% of the housing units are not connected to the public network which has been available for over 60 years. The network located at about 0.5 meters below ground portrays various leakage problems, as shown in Figure 5-41, resulting in a relatively high discrepancy between quantities of water supply and effective water consumption.
Figure 5-40 Ouyoun El Samak Spring Flowing Underground
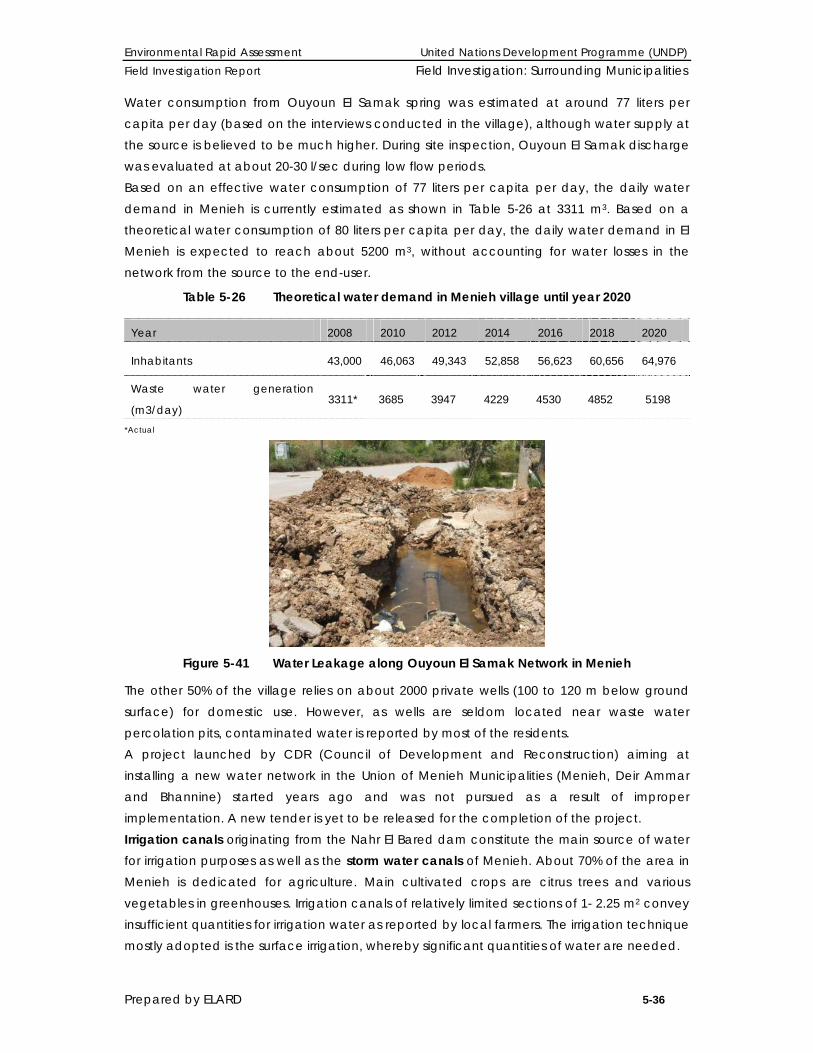
Environmental Rapid Assessment United Nations Development Programme (UNDP) Field Investigation Report Field Investigation: Surrounding Municipalities
Prepared by ELARD 5-36
Water consumption from Ouyoun El Samak spring was estimated at around 77 liters per capita per day (based on the interviews conducted in the village), although water supply at the source is believed to be much higher. During site inspection, Ouyoun El Samak discharge was evaluated at about 20-30 l/sec during low flow periods. Based on an effective water consumption of 77 liters per capita per day, the daily water demand in Menieh is currently estimated as shown in Table 5-26 at 3311 m3. Based on a theoretical water consumption of 80 liters per capita per day, the daily water demand in El Menieh is expected to reach about 5200 m3, without accounting for water losses in the network from the source to the end-user.
Table 5-26 Theoretical water demand in Menieh village until year 2020
*Actual
Figure 5-41 Water Leakage along Ouyoun El Samak Network in Menieh
The other 50% of the village relies on about 2000 private wells (100 to 120 m below ground surface) for domestic use. However, as wells are seldom located near waste water percolation pits, contaminated water is reported by most of the residents. A project launched by CDR (Council of Development and Reconstruction) aiming at installing a new water network in the Union of Menieh Municipalities (Menieh, Deir Ammar and Bhannine) started years ago and was not pursued as a result of improper implementation. A new tender is yet to be released for the completion of the project. Irrigation canals originating from the Nahr El Bared dam constitute the main source of water for irrigation purposes as well as the storm water canals of Menieh. About 70% of the area in Menieh is dedicated for agriculture. Main cultivated crops are citrus trees and various vegetables in greenhouses. Irrigation canals of relatively limited sections of 1- 2.25 m2 convey insufficient quantities for irrigation water as reported by local farmers. The irrigation technique mostly adopted is the surface irrigation, whereby significant quantities of water are needed.
Year 2008 2010 2012 2014 2016 2018 2020
Inhabitants 43,000 46,063 49,343 52,858 56,623 60,656 64,976
Waste water generation
(m3/day) 3311* 3685 3947 4229 4530 4852 5198

Environmental Rapid Assessment United Nations Development Programme (UNDP) Field Investigation Report Field Investigation: Surrounding Municipalities
Prepared by ELARD 5-37
5.6.3. Wastewater
About 70% of the houses are connected to the local waste water network; the remaining 30% use percolating pits and septic tanks. The network is 8 to12-Inch wide located at a depth of 1 m below ground. Waste water in Menieh is evacuated directly to the sea, through two outlets without undergoing any preliminary treatment, as illustrated in Figure 5-42.
Figure 5-42 Wastewater sea outlets in Menieh
Given that the actual water supply is about 77 liters per capita, daily waste water generation is considered to be currently about 54 liters per capita. The quantities of waste water that are expected to be generated in the Menieh Municipality are estimated based on a water supply of 80 liters per capita per day (Table 5-27)
Table 5-27 Theoretical waste water generation in Menieh village until year 2020 considering a demographic expansion of 3.5%
*Actual
5.6.4. Electricity
Most of the housing units in Menieh are equipped with lamps of 100 W as well as energy saving lamps (60 W). Usually electricity is provided around 10-12 hours per day. Private electrical generators are not frequent. In order to remediate for frequent electricity interruptions, people either use public electricity generators or use private UPS (Uninterruptible Power Supply) systems.
Year 2008 2010 2012 2014 2016 2018 2020
Inhabitants 43,000 46,063 49,343 52,858 56,623 60,656 64,976
Waste water generation
(m3/day) 2,318* 2,580 2,763 2,960 3,170 3,397 3,638
Environmental Rapid Assessment United Nations Development Programme (UNDP) Field Investigation Report Field Investigation: Surrounding Municipalities
Prepared by ELARD 5-38
5.6.5. Environmental Concerns
The main environmental issues identified in the municipality of Menieh in the solid waste, water supply and waste water sectors are presented in Table 5-28.
Environmental Rapid Assessment United Nations Development Programme (UNDP) Field Investigation Report Field Investigation: Surrounding Municipalities
Prepared by ELARD 5-39
Table 5-28 Issues of Environmental concern in the Municipality of Menieh
Solid Waste Water Supply Waste water Others
Current Status
• Disposal of solid waste at the road sides
• Open burning in Al Rawda dump
• Disposal in a non lined site
• Improper sorting
• Ground water polluted from percolation pits
• Leakages in water network pipes
• Old water network
• 30% have percolation pits, no network coverage
• Conveying wastewater to the sea via 2 outlets
• Leakages in the Network
• Disposal of raw waste water at the sea
• Effluents could be generated from the followings:
• - Furniture industries
• Masonry blocks industries Consumption
/Emissions 30 tons per day
3311 m3 per day (water supply – not accounting for leakages)
2318 m3 per day
Standard Values
27.52 tons per day*
3440 m3 per day (not accounting for losses)*
2318 m3 per day*
*Quantities based on a generation rate of 0.64 kg per capita per day (AUB, 1994) for solid waste, , 56 liters per capita per day for waste water
generation and 80 liters per capita per day for water consumption
5.7. BEDDAWI Baddawi (Figure 5-43) is one of the six surrounding municipalities indirectly affected by Nahr el Bared conflict as it hosts the Beddawi Camp which was the first destination for Palestinian refugees. It covers a surface area of about 5.1 km2.
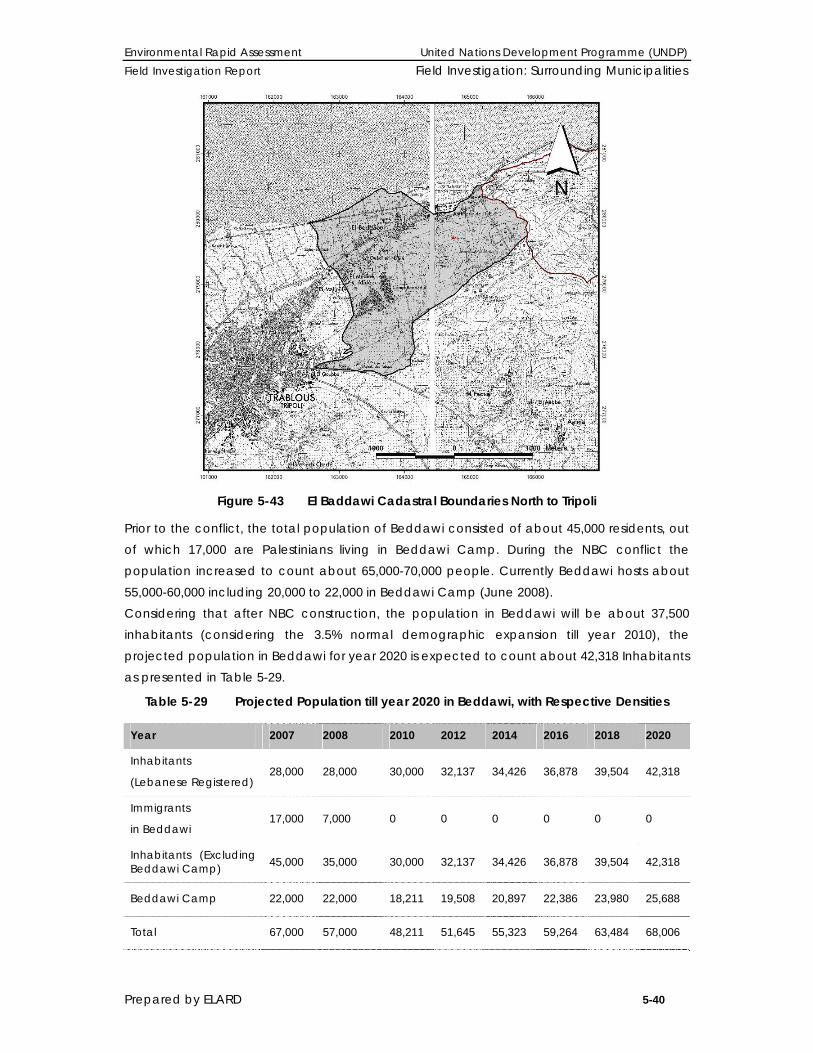
Environmental Rapid Assessment United Nations Development Programme (UNDP) Field Investigation Report Field Investigation: Surrounding Municipalities
Prepared by ELARD 5-40
Figure 5-43 El Baddawi Cadastral Boundaries North to Tripoli
Prior to the conflict, the total population of Beddawi consisted of about 45,000 residents, out of which 17,000 are Palestinians living in Beddawi Camp. During the NBC conflict the population increased to count about 65,000-70,000 people. Currently Beddawi hosts about 55,000-60,000 including 20,000 to 22,000 in Beddawi Camp (June 2008). Considering that after NBC construction, the population in Beddawi will be about 37,500 inhabitants (considering the 3.5% normal demographic expansion till year 2010), the projected population in Beddawi for year 2020 is expected to count about 42,318 Inhabitants as presented in Table 5-29.
Table 5-29 Projected Population till year 2020 in Beddawi, with Respective Densities
Year 2007 2008 2010 2012 2014 2016 2018 2020
Inhabitants
(Lebanese Registered) 28,000 28,000 30,000 32,137 34,426 36,878 39,504 42,318
Immigrants
in Beddawi 17,000 7,000 0 0 0 0 0 0
Inhabitants (Excluding Beddawi Camp) 45,000 35,000 30,000 32,137 34,426 36,878 39,504 42,318
Beddawi Camp 22,000 22,000 18,211 19,508 20,897 22,386 23,980 25,688
Total 67,000 57,000 48,211 51,645 55,323 59,264 63,484 68,006

Environmental Rapid Assessment United Nations Development Programme (UNDP) Field Investigation Report Field Investigation: Surrounding Municipalities
Prepared by ELARD 5-41
Population density in Beddawi is considered significantly high with respect to the average population densities in Lebanon varying between 3.74 inhabitants per hectare for total land and 22.9 inhabitants per hectare for arable land.
5.7.1. Municipal solid waste
5.7.1.1. Quantities
According to the head of municipality, the quantity of solid waste generated by 35,000
inhabitants consisting of local residents and immigrants is about 13 tons/day. Municipal solid
waste generation per capita is equivalent to about or 0.37 kg/capita/day, whereas before
the conflict the quantity of collected solid waste ranged between 8 to 9 tons/day generated
by about 28,000 inhabitants ( at a rate of 0.32 kg/capita/day)
Assuming a demographic expansion known to be 3.5%, Beddawi can expect to hold about
42,318 persons by year 2020 generating about 15.66 tons/day of municipal solid waste (Table
5-30) considering that by year 2010 people from NBC shall return to the new and old camp
after completion of reconstruction.
Table 5-30 Daily Solid Wastes Generation Rates in Beddawi Village until year 2020
5.7.1.2. Composition
According to the Municipality of Beddawi and local people, the solid waste in Beddawi is composed in majority of organic matters and paper waste. It was reported that in absence of clinics and sanitation facilities, no medical wastes are generated in the Beddawi area.
5.7.1.3. Collection & Disposal
Beddawi Municipality constitutes along with Tripoli and Al Mina the Union of Al Fayha’ Municipalities. Therefore, solid waste collection, road cleanup and waste disposal fall under the responsibility of Lavajet which charges the municipality for waste collection a yearly sum of 2,200,000 LBP (1,466 USD). At household level, unsorted solid waste is disposed in plastic bags, in the Lavajet tanks/ barrels found near their houses covering almost the entire village (Figure 5-44). Some sorting takes place in-situ prior to collection.
Total Density (Inhabitants/ ha) 131 111.76 95 101 108 116 124 133
Density (Inhabitants/ ha). Excluding Beddawi camp
88 69 59 63 68 72 77 83
Year 2008 2010 2012 2014 2016 2018 2020
Inhabitants 35,000 30,000 32,137 34,426 36,878 39,504 42,318
Solid Waste generation (T/day) 13 11.1 11.9 12.7 13.6 14.6 15.6

Environmental Rapid Assessment United Nations Development Programme (UNDP) Field Investigation Report Field Investigation: Surrounding Municipalities
Prepared by ELARD 5-42
Figure 5-44 Temporary waste collection – “Lavajet”
Waste is collected daily by Lavajet vehicles, but in some regions collection takes place only 2-3 times per week. According to the conducted survey and filled questionnaires, collection is not properly done, since waste remains in and around the tanks. Solid waste is disposed in Abu Ali landfill serving the Municipality of Tripoli, El Mina and Beddawi (Union of Al Fayha’ Municipalities) (See section 4.3.3) Currently, the quality of Lavajet’s services deteriorated for many reasons:
1) High flux of refugees generating considerable quantities of solid wastes (about 3.7 tons/day considering that nearly 10,000 live outside Beddawi Palestinian Camp).
2) Insufficient number of Lavajet’s vehicles being also old and used. 3) Last occurring conflicts between Jabal Mohsen and Beb Al Tabbane resulting in
cessation of Lavajet’s work since most of its workers are residents of these regions.
5.7.2. Water supply
Beddawi has currently two water sources: 1) The network from the Water Authorities of Tripoli (Hab water) and 2) Private wells for every building or house falling East to the highway.
The water network of Hab Grotto provides water to almost 7000 families. It is used for drinking and domestic use, yet many install filters. Those who are not provided with the water network, have to supply water from their private wells. However, the problem arises in the quality if this water. The reason behind this pollution started in Arafat war in 1983 which targeted oil refineries of IPC (Iraq Petroleum Company) resulting in fuel percolation to groundwater. Adding to this problem, IPC (Figure 5-45) nowadays disposes its oil in ground pits (Figure 5-46) and fuel is allowed permanently to infiltrate in the soil. Thus most wells located below and south to IPC became contaminated with fuel and unsafe to use.

Environmental Rapid Assessment United Nations Development Programme (UNDP) Field Investigation Report Field Investigation: Surrounding Municipalities
Prepared by ELARD 5-43
Figure 5-45 IPC fuel tanks
Figure 5-46 Ground pits of fuel at IPC percolating to groundwater
According to our field investigation, water reservoirs (Figure 5-47) as well as water being used at house levels in the polluted area in Beddawi have a brick color associated to fuel contamination due to ground pits of fuel in APC as well as to Arafat war. Some people install filters to be able to use this polluted water, and some others filter it using primitive techniques (Figure 5-48) and even drink it. Few are the people who analyze their water due to the high cost of water analysis; water is being consumed.
Figure 5-47 Water reservoir showing a brick colored scum in the bottom due to pollution
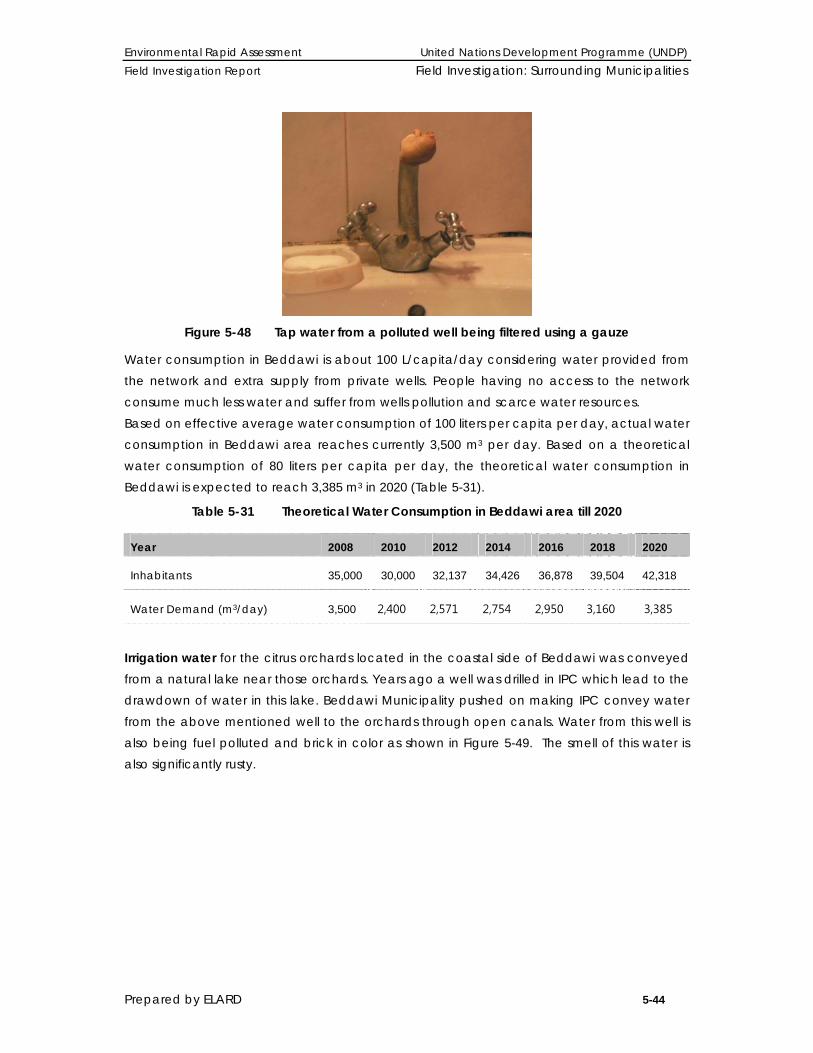
Environmental Rapid Assessment United Nations Development Programme (UNDP) Field Investigation Report Field Investigation: Surrounding Municipalities
Prepared by ELARD 5-44
Figure 5-48 Tap water from a polluted well being filtered using a gauze
Water consumption in Beddawi is about 100 L/capita/day considering water provided from the network and extra supply from private wells. People having no access to the network consume much less water and suffer from wells pollution and scarce water resources. Based on effective average water consumption of 100 liters per capita per day, actual water consumption in Beddawi area reaches currently 3,500 m3 per day. Based on a theoretical water consumption of 80 liters per capita per day, the theoretical water consumption in Beddawi is expected to reach 3,385 m3 in 2020 (Table 5-31).
Table 5-31 Theoretical Water Consumption in Beddawi area till 2020
Irrigation water for the citrus orchards located in the coastal side of Beddawi was conveyed from a natural lake near those orchards. Years ago a well was drilled in IPC which lead to the drawdown of water in this lake. Beddawi Municipality pushed on making IPC convey water from the above mentioned well to the orchards through open canals. Water from this well is also being fuel polluted and brick in color as shown in Figure 5-49. The smell of this water is also significantly rusty.
Year 2008 2010 2012 2014 2016 2018 2020
Inhabitants 35,000 30,000 32,137 34,426 36,878 39,504 42,318
Water Demand (m3/day) 3,500 2,400 2,571 2,754 2,950 3,160 3,385

Environmental Rapid Assessment United Nations Development Programme (UNDP) Field Investigation Report Field Investigation: Surrounding Municipalities
Prepared by ELARD 5-45
Figure 5-49 Irrigation water canal conveyed from IPC fuel contaminated well to Beddawi
cultivated land
In Beddawi there are no storm water drainage canals. Rainwater flows freely in the streets down to the sea or sometimes reaches the wastewater open canals and the irrigation water canals.
5.7.3. Wastewater
The village has a 1-2 m deep network available to almost all the town except Beddawi camp and its surrounding area as well as to the surroundings of the Police Station. The network’s dimension is 8-14 inch, and is about 30 to 40 years old. Leakage problems, often to occur, are treated on daily basis. Wastewater of Beddawi is withdrawn to the sea via open canals (Figure 5-50) directly to the sea (Figure 5-51) without undergoing any preliminary treatment.
Figure 5-50 Open canals of wastewater towards the sea
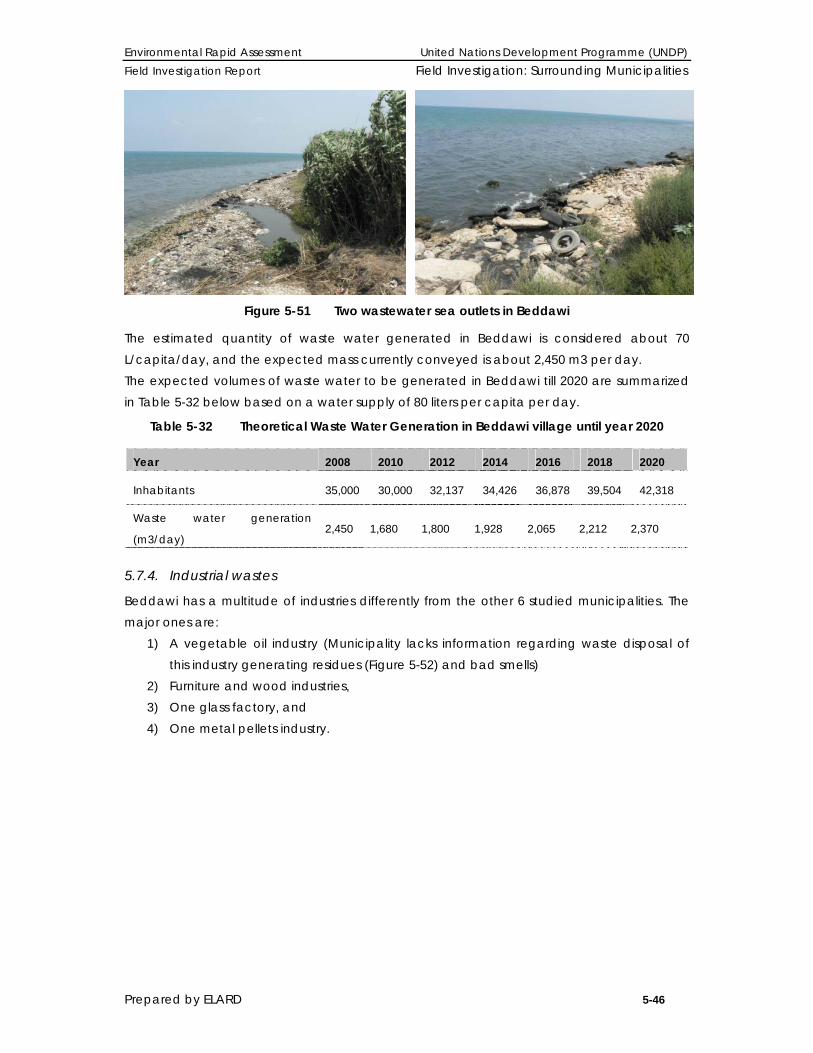
Environmental Rapid Assessment United Nations Development Programme (UNDP) Field Investigation Report Field Investigation: Surrounding Municipalities
Prepared by ELARD 5-46
Figure 5-51 Two wastewater sea outlets in Beddawi
The estimated quantity of waste water generated in Beddawi is considered about 70 L/capita/day, and the expected mass currently conveyed is about 2,450 m3 per day. The expected volumes of waste water to be generated in Beddawi till 2020 are summarized in Table 5-32 below based on a water supply of 80 liters per capita per day.
Table 5-32 Theoretical Waste Water Generation in Beddawi village until year 2020
5.7.4. Industrial wastes
Beddawi has a multitude of industries differently from the other 6 studied municipalities. The major ones are:
1) A vegetable oil industry (Municipality lacks information regarding waste disposal of this industry generating residues (Figure 5-52) and bad smells)
2) Furniture and wood industries, 3) One glass factory, and 4) One metal pellets industry.
Year 2008 2010 2012 2014 2016 2018 2020
Inhabitants 35,000 30,000 32,137 34,426 36,878 39,504 42,318
Waste water generation
(m3/day) 2,450 1,680 1,800 1,928 2,065 2,212 2,370
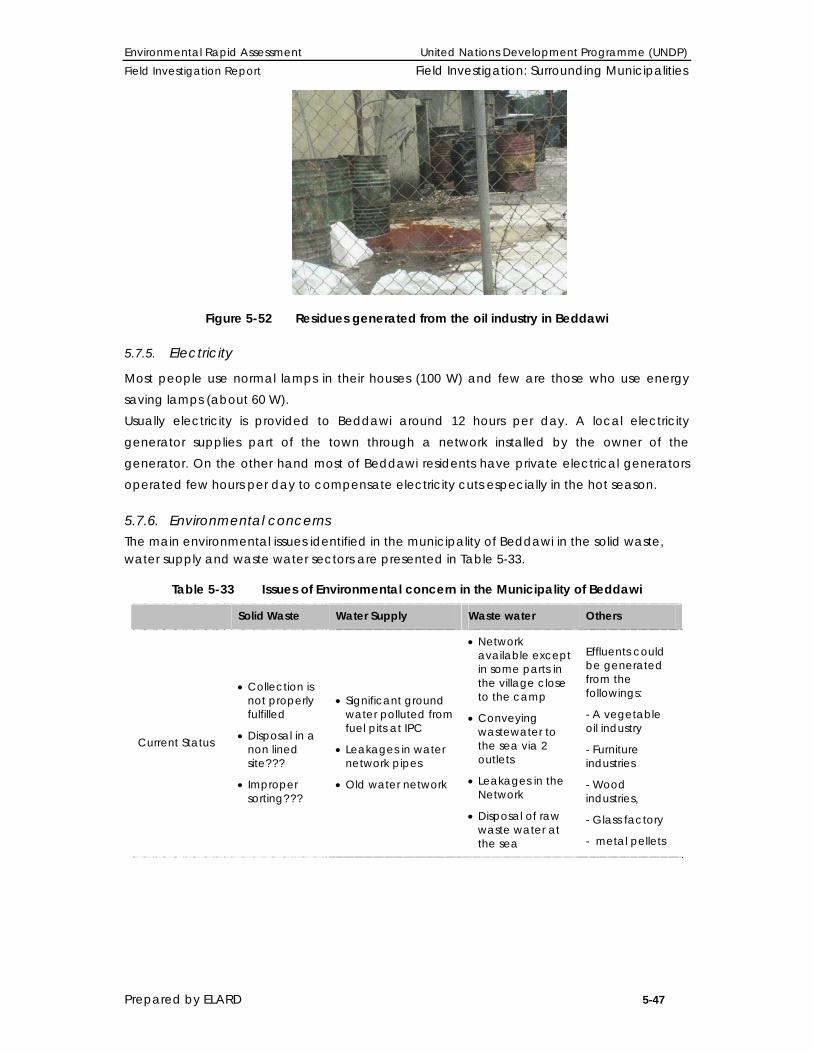
Environmental Rapid Assessment United Nations Development Programme (UNDP) Field Investigation Report Field Investigation: Surrounding Municipalities
Prepared by ELARD 5-47
Figure 5-52 Residues generated from the oil industry in Beddawi
5.7.5. Electricity
Most people use normal lamps in their houses (100 W) and few are those who use energy saving lamps (about 60 W). Usually electricity is provided to Beddawi around 12 hours per day. A local electricity generator supplies part of the town through a network installed by the owner of the generator. On the other hand most of Beddawi residents have private electrical generators operated few hours per day to compensate electricity cuts especially in the hot season.
5.7.6. Environmental concerns The main environmental issues identified in the municipality of Beddawi in the solid waste, water supply and waste water sectors are presented in Table 5-33.
Table 5-33 Issues of Environmental concern in the Municipality of Beddawi
Solid Waste Water Supply Waste water Others
Current Status
• Collection is not properly fulfilled
• Disposal in a non lined site???
• Improper sorting???
• Significant ground water polluted from fuel pits at IPC
• Leakages in water network pipes
• Old water network
• Network available except in some parts in the village close to the camp
• Conveying wastewater to the sea via 2 outlets
• Leakages in the Network
• Disposal of raw waste water at the sea
Effluents could be generated from the followings:
- A vegetable oil industry
- Furniture industries
- Wood industries,
- Glass factory
- metal pellets

Environmental Rapid Assessment United Nations Development Programme (UNDP) Field Investigation Report Field Investigation: Surrounding Municipalities
Prepared by ELARD 5-48
Solid Waste Water Supply Waste water Others
Consumption
/Emissions 13 tons per day
3500 m3 per day consumption (water supply – not accounting for leakages) before NBC construction
3000 m3 per day consumption (water supply – not accounting for leakages) after NBC construction
2450 m3 per day (before NBC construction)
2100 m3 per day (water supply (after NBC construction)
industry
Standard Values
22.4 tons per day (before NBC construction)
19.2 tons per day (after NBC construction)
2800 m3 per day (water supply – not accounting for leakages) before NBC construction
2400 m3 per day (water supply – not accounting for leakages) after NBC construction
1960 m3 per day (before NBC construction)
1680 m3 per day (water supply (after NBC construction)
*Quantities based on a generation rate of 0.64 kg per capita per day (AUB, 1994) for solid waste, , 56 liters per capita per day for waste water
generation and 80 liters per capita per day for water consumption
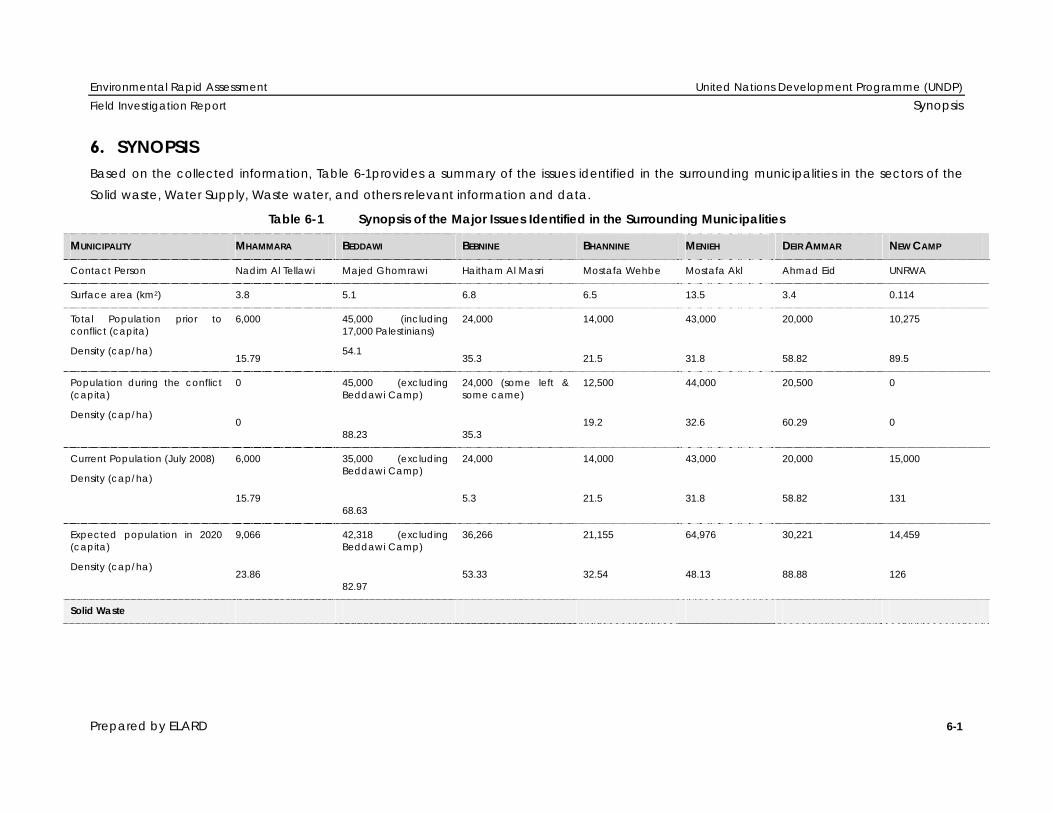
Environmental Rapid Assessment United Nations Development Programme (UNDP) Field Investigation Report Synopsis
Prepared by ELARD 6-1
6. SYNOPSIS Based on the collected information, Table 6-1provides a summary of the issues identified in the surrounding municipalities in the sectors of the Solid waste, Water Supply, Waste water, and others relevant information and data.
Table 6-1 Synopsis of the Major Issues Identified in the Surrounding Municipalities
MUNICIPALITY MHAMMARA BEDDAWI BEBNINE BHANNINE MENIEH DEIR AMMAR NEW CAMP
Contact Person Nadim Al Tellawi Majed Ghomrawi Haitham Al Masri Mostafa Wehbe Mostafa Akl Ahmad Eid UNRWA
Surface area (km2) 3.8 5.1 6.8 6.5 13.5 3.4 0.114
Total Population prior to conflict (capita)
Density (cap/ha)
6,000
15.79
45,000 (including 17,000 Palestinians)
54.1
24,000
35.3
14,000
21.5
43,000
31.8
20,000
58.82
10,275
89.5
Population during the conflict (capita)
Density (cap/ha)
0
0
45,000 (excluding Beddawi Camp)
88.23
24,000 (some left & some came)
35.3
12,500
19.2
44,000
32.6
20,500
60.29
0
0
Current Population (July 2008)
Density (cap/ha)
6,000
15.79
35,000 (excluding Beddawi Camp)
68.63
24,000
5.3
14,000
21.5
43,000
31.8
20,000
58.82
15,000
131
Expected population in 2020 (capita)
Density (cap/ha)
9,066
23.86
42,318 (excluding Beddawi Camp)
82.97
36,266
53.33
21,155
32.54
64,976
48.13
30,221
88.88
14,459
126
Solid Waste
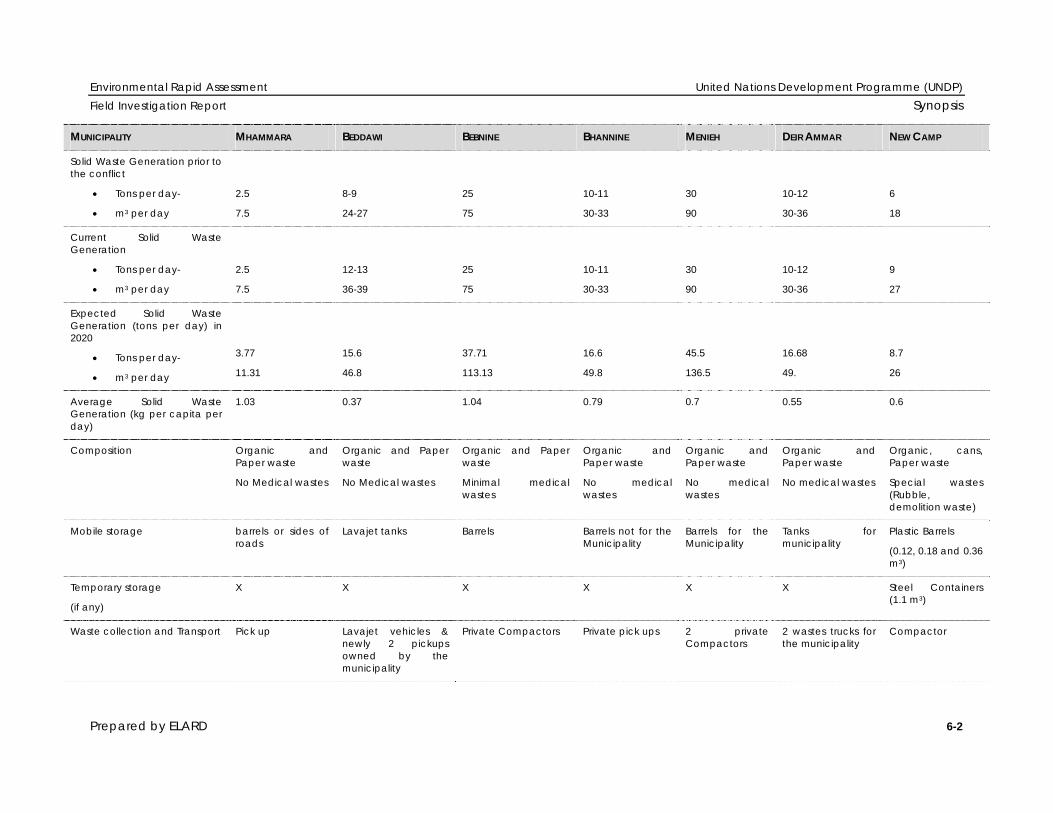
Environmental Rapid Assessment United Nations Development Programme (UNDP) Field Investigation Report Synopsis
Prepared by ELARD 6-2
MUNICIPALITY MHAMMARA BEDDAWI BEBNINE BHANNINE MENIEH DEIR AMMAR NEW CAMP
Solid Waste Generation prior to the conflict
• Tons per day-
• m3 per day
2.5
7.5
8-9
24-27
25
75
10-11
30-33
30
90
10-12
30-36
6
18
Current Solid Waste Generation
• Tons per day-
• m3 per day
2.5
7.5
12-13
36-39
25
75
10-11
30-33
30
90
10-12
30-36
9
27
Expected Solid Waste Generation (tons per day) in 2020
• Tons per day-
• m3 per day
3.77
11.31
15.6
46.8
37.71
113.13
16.6
49.8
45.5
136.5
16.68
49.
8.7
26
Average Solid Waste Generation (kg per capita per day)
1.03 0.37 1.04 0.79 0.7 0.55 0.6
Composition Organic and Paper waste
No Medical wastes
Organic and Paper waste
No Medical wastes
Organic and Paper waste
Minimal medical wastes
Organic and Paper waste
No medical wastes
Organic and Paper waste
No medical wastes
Organic and Paper waste
No medical wastes
Organic, cans, Paper waste
Special wastes (Rubble, demolition waste)
Mobile storage barrels or sides of roads
Lavajet tanks Barrels Barrels not for the Municipality
Barrels for the Municipality
Tanks for municipality
Plastic Barrels
(0.12, 0.18 and 0.36 m3)
Temporary storage
(if any)
X X X X X X Steel Containers (1.1 m3)
Waste collection and Transport Pick up Lavajet vehicles & newly 2 pickups owned by the municipality
Private Compactors Private pick ups 2 private Compactors
2 wastes trucks for the municipality
Compactor
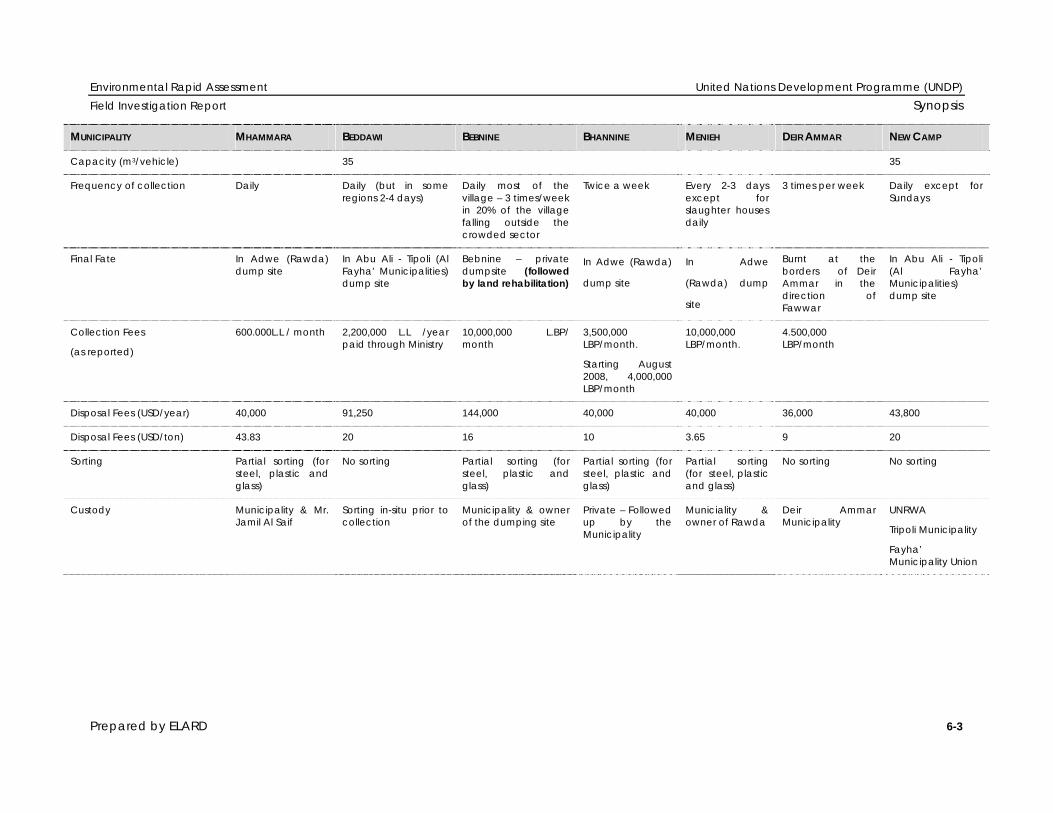
Environmental Rapid Assessment United Nations Development Programme (UNDP) Field Investigation Report Synopsis
Prepared by ELARD 6-3
MUNICIPALITY MHAMMARA BEDDAWI BEBNINE BHANNINE MENIEH DEIR AMMAR NEW CAMP
Capacity (m3/vehicle) 35 35
Frequency of collection Daily Daily (but in some regions 2-4 days)
Daily most of the village – 3 times/week in 20% of the village falling outside the crowded sector
Twice a week Every 2-3 days except for slaughter houses daily
3 times per week Daily except for Sundays
Final Fate In Adwe (Rawda) dump site
In Abu Ali - Tipoli (Al Fayha’ Municipalities) dump site
Bebnine – private dumpsite (followed by land rehabilitation)
In Adwe (Rawda)
dump site
In Adwe
(Rawda) dump
site
Burnt at the borders of Deir Ammar in the direction of Fawwar
In Abu Ali - Tipoli (Al Fayha’ Municipalities) dump site
Collection Fees
(as reported)
600.000L.L / month 2,200,000 L.L /year paid through Ministry
10,000,000 L.BP/ month
3,500,000 LBP/month.
Starting August 2008, 4,000,000 LBP/month
10,000,000 LBP/month.
4.500,000 LBP/month
Disposal Fees (USD/year) 40,000 91,250 144,000 40,000 40,000 36,000 43,800
Disposal Fees (USD/ton) 43.83 20 16 10 3.65 9 20
Sorting Partial sorting (for steel, plastic and glass)
No sorting Partial sorting (for steel, plastic and glass)
Partial sorting (for steel, plastic and glass)
Partial sorting (for steel, plastic and glass)
No sorting No sorting
Custody Municipality & Mr. Jamil Al Saif
Sorting in-situ prior to collection
Municipality & owner of the dumping site
Private – Followed up by the Municipality
Municiality & owner of Rawda
Deir Ammar Municipality
UNRWA
Tripoli Municipality
Fayha’ Municipality Union

Environmental Rapid Assessment United Nations Development Programme (UNDP) Field Investigation Report Synopsis
Prepared by ELARD 6-4
MUNICIPALITY MHAMMARA BEDDAWI BEBNINE BHANNINE MENIEH DEIR AMMAR NEW CAMP
Additional comments - Over use of Lavajet vehicles rendering them less efficient
- New brooms bought for the municipality
In the landfill, lime is broadcasted before dumping in order to protect groundwater. This landfill is turned into orchards
A new land in Menieh for a recycling plant – EU project serving the region. Construction might start in September 2008
The major problem in this village is solid waste collection & dumping -
Project with EU in Menieh serving the region.
Soil is used to cover the waste. Approximately once per month wastes are burned.
Project with EU in Menieh serving the region.
Prior to conflict, municipal solid waste of the new camp were disposed in the old camp by a private party
Waste water
Waste water Generation prior to the conflict (m3 per day)
285.6 1,960 1,848 686 2,318 980 745
Current Waste water Generation (m3 per day)
285.6 2,450 1,848 686 2,318 980 1666
Average Waste water Generation (Liters per capita per day)
47.6 70 77 49 54 49 72
Expected Waste water Generation (m3 per day) in 2020 on the basis of 56 l/cap/day
507.7 2,370 2,067 1,058 3,638 1,692 810
Network Only for 300 houses 3.5 km network
Available in the village -
Exceptions:
فوق المغفر ‐
األرض الكبيرة ‐
فوق (المنكوبين ‐وقرب )المخيم
Network available – lacks only 6km of pipes to cover the whole village – municipality is ready to install once the 6km (about 1000pipes costing about 30.000USD) are provided
Only for 200 houses
Available Covers the whole village but needs replacement since it is too tight especially on the highway side
Dimensions No info 8in - 14in 6 in to 14 in No info 8in to 12 in 6in to 16in

Environmental Rapid Assessment United Nations Development Programme (UNDP) Field Investigation Report Synopsis
Prepared by ELARD 6-5
MUNICIPALITY MHAMMARA BEDDAWI BEBNINE BHANNINE MENIEH DEIR AMMAR NEW CAMP
Coverage 300 houses inside the village only – houses outside the village, percolation pits (4x4m)
95% 80% of the village 14-15% 70% of houses 100%
Outlet/final fate Part to the sea (North) & part to the river
2 sea outlets (open canal):
1- Abu Ali River
2- the sea
2 outlets on the valley towards the sea
2 closed pipes:
One linked to the Northern outlet of Menieh and the other to the river in the new camp
2 canals into the sea
2 outlets to the sea
Treatment/ Type X X X X X X X
Percolation pits (availability) Could not be specified
20% of the village (out of 3500 houses)
Great number of percolation pits
30% of the houses
None
Depth of Network 1.2-1.5 m 0.5m (near buildings)- 1m-1.5m-2m
0.5m-2m sometimes up to 5 m
1.70m 1m-2m and more
1m-1.2m
Age 4-5 years 30-40years 6 months – 10 to 15 years
5-6 years 50% 3 years
20%5 years
4 years & 15-20 years
Future Plans for Waste Water
Reported Leakages / Comments
- Leakage at the highway level (could be due to a plug.
- Network affected by military vehicles’ circulation
Nothing mentioned – but given the age, it is probable.
No leakage due to permanent maintenance by a special team
Some directly convey their wastewater to water canals
No leakage – But when leakage occurs, direct maintenance intervention
Leakage is frequent – no equipment for plugging treatment, usually done manually.
Water Supply

Environmental Rapid Assessment United Nations Development Programme (UNDP) Field Investigation Report Synopsis
Prepared by ELARD 6-6
MUNICIPALITY MHAMMARA BEDDAWI BEBNINE BHANNINE MENIEH DEIR AMMAR NEW CAMP
Public Resource Well in the village 130m deep
Hab water from Water Authorities of Tripoli and Private wells
Ain Bebnine + 10 public wells
Ouyoun El Samak spring
Ouyoun El Samak spring
Well for Water Authorities of the North
Well Gineen, Well Hamed, Well 10
Use Drinking and domestic use
Drinking and domestic use
Drinking and domestic use
Drinking and domestic use
Drinking and domestic use
Drinking and domestic use
Domestic
Network Covering the village only
For 7000 families for the village only
Available for 40% of the village
Water is insufficient – 35 years old network
Available (60 years ago)
Available Complete: Recently installed
HDPE Pipes
Depth of network 50-60cm – not in the same area of wastewater network
About 1m No idea No info 0.5m and more 50cm 60-70 cm BG
Dimensions (inches) 2” 1” 4”
Coverage/beneficiaries Feeding about 320 families
Beddawi village only 40% from Bebnine water
And others from 10 wells.
60% 50% Almost complete coverage
Others Private Resources (wells springs)
Private wells for People living in the “Bassatine” (cultivated land). 25 to 60m deep
Private wells for each building and house. Most of them are polluted by fuel since Arafat war in 1983 targeting oil refineries
10 Wells managed by the municipality for sectors in the village +
Great number of private wells
5% private wells. Highly polluted due to percolation pits at close vicinity
About 2000 private wells
One 5” public well not used at all + about 40 private wells of good water quality (Absence of percolation pits) + few springs only for drinking water
Private wells inside the camp
Well Characteristics 20-60m deep 90-105 m deep; SWL 10m
50-150 m deep 20-25m 10-50-100-120m No information Depths: 25-60 m BG
SWL: 4-9 m
Available Water Resources
Aquifers exploited
Quaternary
85 (m3/hour)

Environmental Rapid Assessment United Nations Development Programme (UNDP) Field Investigation Report Synopsis
Prepared by ELARD 6-7
MUNICIPALITY MHAMMARA BEDDAWI BEBNINE BHANNINE MENIEH DEIR AMMAR NEW CAMP
Water supply
(Liters/cap/day)
68
2-3 hours for each block, i.e. 18 hours/24
100
Water supplied continuously
104
Polluted water – people purchase potable water
70
Polluted water due to percolation pits
77
Some people purchase potable water
70
Very poor – once to twice a week
99-125 (Prior to conflict)
60-247 (Current)
Water Supply
(m3/day)
408 3,500 2,500 980 3,311 1,400 1065 (prior to conflict)
2380 (Current)
Projected Water demand
(m3/day) in 2020
725 3,385 2,900 1,692 5,198 2,417 1,157
Reported Water Quality
Reported problems/contaminations
Good
Most of private wells polluted by fuel
Deteriorated due to network
Deteriorated quality – some people purchase water for drinking and domestic use
Deteriorated quality due to network
Good
Background Information (History)
4-5 years before the conflict the water reservoir was rehabilitated to collect water from “Ain Yaacoub” from the coastal side of Akkar. Another source was from “Hrar” the mountainous side of Akkar
A network is already established from Ouyoun El Joume from Akkar (Governmental) – High standards – still 8m (Not allowed by the owners of the land) are needed to feed the entire village with good quality & quantity water
A New project (CDR ) started years ago and was stopped due to bad implementation and till now, no new contractor
Storm Water
Network Primal network near the highway
No special canals. Sometimes conveyed to irrigation channels
- Part is finished (municipality) - Part under construction (WB)
- Part missing
Irrigation and storm water network at the same time
Available – directly discharging to the sea In the summer used as irrigation network
Very few
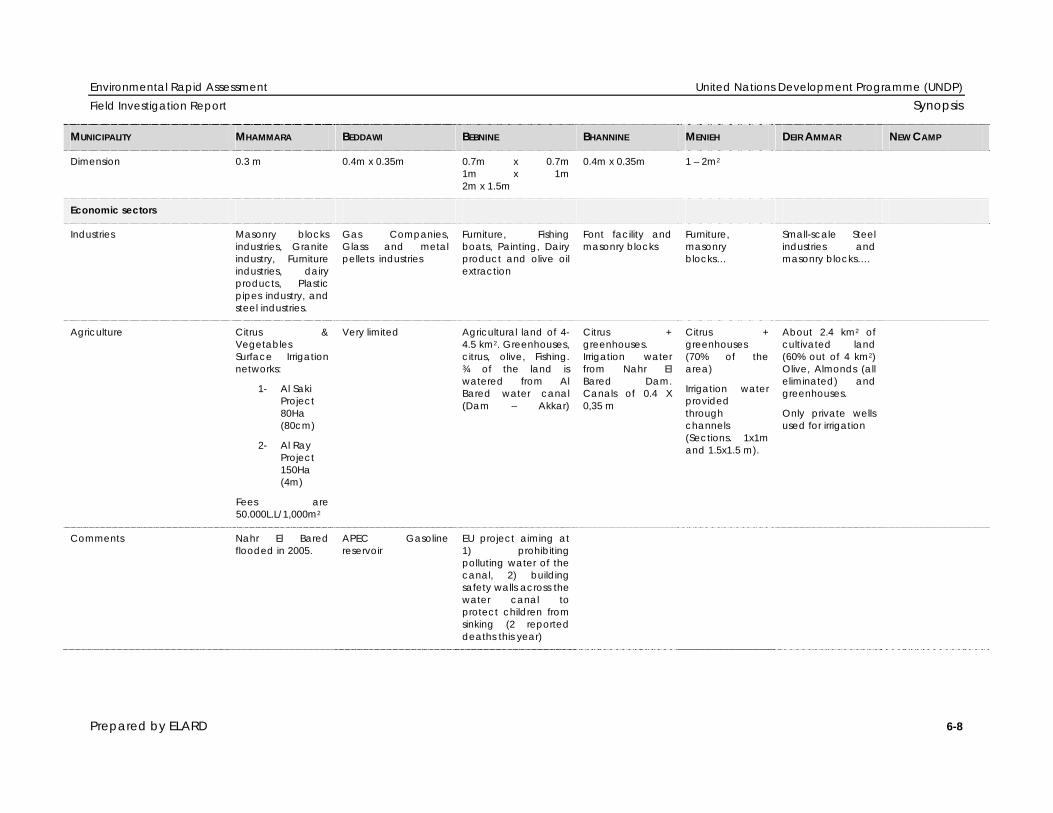
Environmental Rapid Assessment United Nations Development Programme (UNDP) Field Investigation Report Synopsis
Prepared by ELARD 6-8
MUNICIPALITY MHAMMARA BEDDAWI BEBNINE BHANNINE MENIEH DEIR AMMAR NEW CAMP
Dimension 0.3 m 0.4m x 0.35m 0.7m x 0.7m 1m x 1m 2m x 1.5m
0.4m x 0.35m 1 – 2m2
Economic sectors
Industries Masonry blocks industries, Granite industry, Furniture industries, dairy products, Plastic pipes industry, and steel industries.
Gas Companies, Glass and metal pellets industries
Furniture, Fishing boats, Painting, Dairy product and olive oil extraction
Font facility and masonry blocks
Furniture, masonry blocks…
Small-scale Steel industries and masonry blocks….
Agriculture Citrus & Vegetables Surface Irrigation networks:
1- Al Saki Project 80Ha (80cm)
2- Al Ray Project 150Ha (4m)
Fees are 50.000L.L/1,000m2
Very limited Agricultural land of 4-4.5 km2. Greenhouses, citrus, olive, Fishing. ¾ of the land is watered from Al Bared water canal (Dam – Akkar)
Citrus + greenhouses. Irrigation water from Nahr El Bared Dam. Canals of 0.4 X 0,35 m
Citrus + greenhouses (70% of the area)
Irrigation water provided through channels (Sections. 1x1m and 1.5x1.5 m).
About 2.4 km2 of cultivated land (60% out of 4 km2) Olive, Almonds (all eliminated) and greenhouses.
Only private wells used for irrigation
Comments Nahr El Bared flooded in 2005.
APEC Gasoline reservoir
EU project aiming at 1) prohibiting polluting water of the canal, 2) building safety walls across the water canal to protect children from sinking (2 reported deaths this year)

Environmental Rapid Assessment United Nations Development Programme (UNDP) Field Investigation Report Synopsis
Prepared by ELARD 6-9
MUNICIPALITY MHAMMARA BEDDAWI BEBNINE BHANNINE MENIEH DEIR AMMAR NEW CAMP
Damages recorded during the conflict
Electricity transformer at the entry of the village – highway side
X Partial damages at the household level
Partial damages at the household level
Partial damages of some glass and wood at houses level
X
Project allocated by UNDP & World Bank
Roads at the entry of the village, water drainage channels and retaining walls will be constructed. Shown that the budget allocated to Mhammara is small compared to the extent of damage, UNDP will additionally support the Municipality through the rehabilitation of 2 electricity stations and public lighting in the village.
Providing equipment that will be used both for waste collection and disposal as well as public works usually taken on by the Municipality:
2 Vans & 1 pick up
Equipment, furniture and other facilities (audio visual equipment for offices, conference and meeting rooms and Computer Learning Center) for the municipality with the aim to enhance its capacity as a service provider.
Rehabilitation of road networks, first part completed by the municipality through World Bank budget allocation, the second part (2 additional roads) will be completed through the contribution of UNDP. A road was rehabilitated as well with its water canals and retaining walls
Rehabilitation of irrigation channels for agricultural activities.
World Bank will offer a large budget (Given its largest population amongst the 6 municipalities) to cover most of infrastructure needs.
Municipality previously built its new building which included a space for a public clinic. In collaboration with expertise from the World Health Organization (WHO), equipment will be provided to enable a complete health care coverage of the region.

Environmental Rapid Assessment United Nations Development Programme (UNDP) Field Investigation Report Appendix
Prepared by ELARD 6-1
APPENDIX A Questionnaires

QUESTIONNAIRE-Surrounding Municipalities UNDP
Name of surveyor: Fay Mushantaf Location: Beddawi
Date: 17/07/08
Prepared by ELARD 1
ELARD SURVEY IN THE SURROUNDING MUNICIPALITIES
I. Background Information
a. Location: Beddawi
b. Name:
II. Household information
a. Number of members/family: 8
b. Number of rooms in the house: 6
III. Municipal Wastes
a. Solid waste disposal at household level (tanks, special places): In bags then in
“Lavaget” tanks
b. Quantity/volume/Mass of waste per day: 6.5 kg (0.8 kg/capita/day)
c. Type of waste/Composition: Mostly organic
d. Fate of each type: No sorting
e. Collection of Waste: “Lavajet”
f. Frequency of Collection: Daily
g. Rate the Collection: Good (they put powder to dry the ground) but they leave
garbage on the ground.
h. Any problem related to wastes collection: No
Has the quality of municipal services delivery changed (since the crisis)?No
IV. Wastewater
Waste Water Evacuation (network or percolation pits)? Network
a. Any flooding of pit tanks or channels? No
V. Water Supply
a. Source of water? Water from network (habb water)
b. Is Quantity sufficient? Yes
c. Any seasonal fluctuations? Yes
d. Any unusual taste or odour? Chlorine, except when filter is installed
e. Any major water leakages noted? At the Network and house level? No
f. How often you get the water reservoir refilled, if any? Its automatic
g. Capacity of the water reservoir: 2000 L
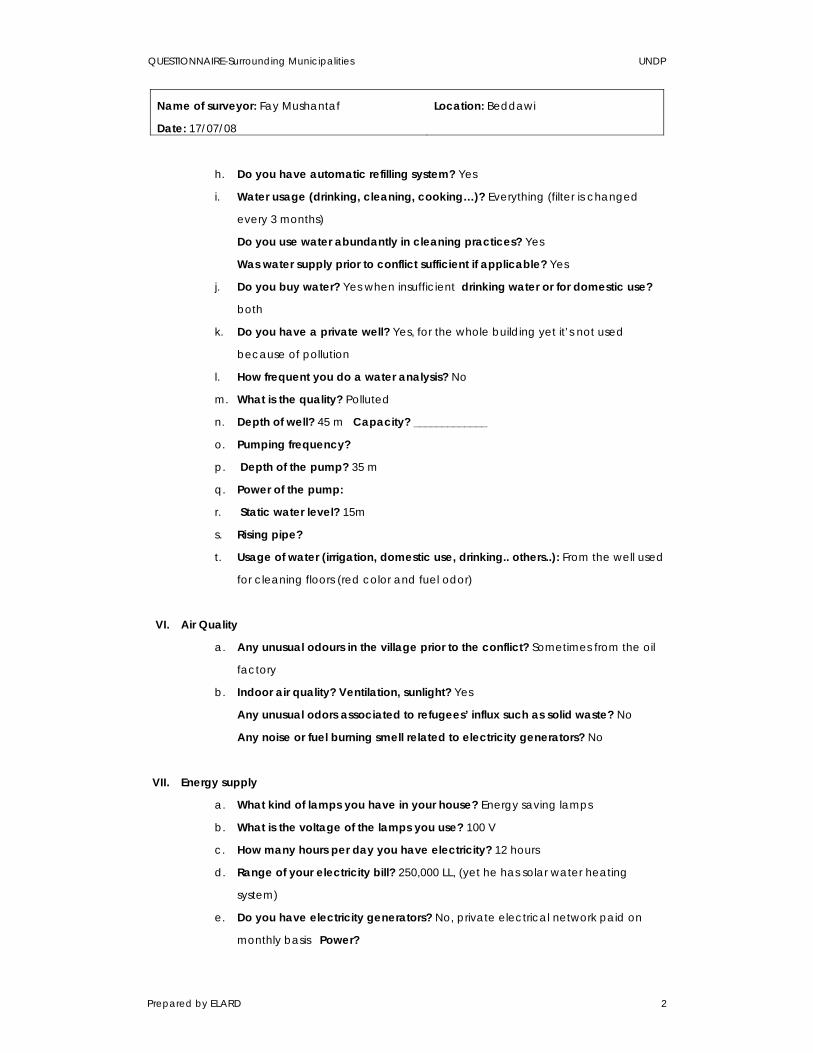
QUESTIONNAIRE-Surrounding Municipalities UNDP
Name of surveyor: Fay Mushantaf Location: Beddawi
Date: 17/07/08
Prepared by ELARD 2
h. Do you have automatic refilling system? Yes
i. Water usage (drinking, cleaning, cooking…)? Everything (filter is changed
every 3 months)
Do you use water abundantly in cleaning practices? Yes
Was water supply prior to conflict sufficient if applicable? Yes
j. Do you buy water? Yes when insufficient drinking water or for domestic use?
both
k. Do you have a private well? Yes, for the whole building yet it’s not used
because of pollution
l. How frequent you do a water analysis? No
m. What is the quality? Polluted
n. Depth of well? 45 m Capacity? _____________
o. Pumping frequency?
p. Depth of the pump? 35 m
q. Power of the pump:
r. Static water level? 15m
s. Rising pipe?
t. Usage of water (irrigation, domestic use, drinking.. others..): From the well used
for cleaning floors (red color and fuel odor)
VI. Air Quality
a. Any unusual odours in the village prior to the conflict? Sometimes from the oil
factory
b. Indoor air quality? Ventilation, sunlight? Yes
Any unusual odors associated to refugees’ influx such as solid waste? No
Any noise or fuel burning smell related to electricity generators? No
VII. Energy supply
a. What kind of lamps you have in your house? Energy saving lamps
b. What is the voltage of the lamps you use? 100 V
c. How many hours per day you have electricity? 12 hours
d. Range of your electricity bill? 250,000 LL, (yet he has solar water heating
system)
e. Do you have electricity generators? No, private electrical network paid on
monthly basis Power?
QUESTIONNAIRE-Surrounding Municipalities UNDP
Name of surveyor: Fay Mushantaf Location: Beddawi
Date: 17/07/08
Prepared by ELARD 3
f. How many hours you operate the generator?
g. What electrical equipment you have? Refrigerator/ washing machine/ TV/
iron/water heater
VIII. Other relevant information
a. Any damage was recorded in your village related to the NBC conflict?
Economic decline
b. Any other problem regarding above mentioned topics? No

QUESTIONNAIRE-Surrounding Municipalities UNDP
Name of surveyor: Fay Mushantaf Location: Beddawi
Date: 17/07/08
Prepared by ELARD 4
ELARD SURVEY IN THE SURROUNDING MUNICIPALITIES
IX. Background Information
a. Location: Beddawi
b. Name: Khaled Ghomraweh
X. Household information
a. Number of members/family: 7
b. Number of rooms in the house: 6
XI. Municipal Wastes
i. Solid waste disposal at household level (tanks, special places): In bags and
then in “Lavajet” tanks.
j. Quantity/volume/Mass of waste per day: 5 kg (0.7 kg/capita/day)
k. Type of waste/Composition: mostly organic then paper, then glass and cans.
l. Fate of each type : no sorting done
m. Collection of Waste: “Lavajet”
n. Frequency of Collection: Daily
o. Rate the Collection: 70% good
p. Any problem related to wastes collection: Some leftovers on the road
q. Has the quality of municipal services delivery changed (since the crisis)? No
XII. Wastewater
a. Waste Water Evacuation (network or percolation pits)? Network b. Any flooding of pit tanks or channels? No
XIII. Water Supply
a. Source of water? Water well
b. Is Quantity sufficient? Yes
c. Any seasonal fluctuations? No
d. Any unusual taste or odour? In year 2003 water became polluted due to the
fuel in IPC.
e. Any major water leakages noted? At the Network and house level? No
f. How often you get the water reservoir refilled, if any? Automatically
g. Capacity of the water reservoir : 2000 L (USUALLY USES 1000 L/DAY)
h. Do you have automatic refilling system? No

QUESTIONNAIRE-Surrounding Municipalities UNDP
Name of surveyor: Fay Mushantaf Location: Beddawi
Date: 17/07/08
Prepared by ELARD 5
i. Water usage (drinking, cleaning, cooking…)? All except drinking
j. Do you use water abundantly in cleaning practices? yes
k. Was water supply prior to conflict sufficient if applicable?
l. Do you buy water? Yes drinking water or for domestic use? For drinking and
cooking
m. Do you have a private well? Yes
n. How frequent you do a water analysis? No analysis
o. What is the quality? Good quality
p. Depth of well? 75 m Capacity? 1 inch
q. Pumping frequency? Daily
r. Depth of the pump? 73 m
s. Power of the pump: 1.5 hp
t. Static water level? 12 m
u. Rising pipe? No idea
v. Usage of water (irrigation, domestic use, drinking.. others..): All except drinking
and cooking
XIV. Air Quality
a. Any unusual odours in the village prior to the conflict? Oil factory and
“Lavajet“ trucks
b. Indoor air quality? Ventilation, sunlight? Yes
c. Any unusual odors associated to refugees’ influx such as solid waste? Waste
far from “Lavajet” tanks all on the roads
d. Any noise or fuel burning smell related to electricity generators: No
XV. Energy supply
a. What kind of lamps you have in your house? Energy saving lamps
b. What is the voltage of the lamps you use? 40 W
c. How many hours per day you have electricity? 12 HRS-16 HRS
d. Range of your electricity bill? 40,000 LL - 60,000LL
e. Do you have electricity generators? Yes Power? 3500 Watt
f. How many hours you operate the generator? 1-2 hrs /day
g. What electrical equipment you have? All electrical equipment including AC
and Water heater
QUESTIONNAIRE-Surrounding Municipalities UNDP
Name of surveyor: Fay Mushantaf Location: Beddawi
Date: 17/07/08
Prepared by ELARD 6
XVI. Other relevant information
a. Any damage was recorded in your village related to the NBC conflict?
Palestinians moving to Beddawi
b. Any other problem regarding above mentioned topics? Yellow cloud due to
electricity station in Deir Ammar especially at the beginning of its operation.
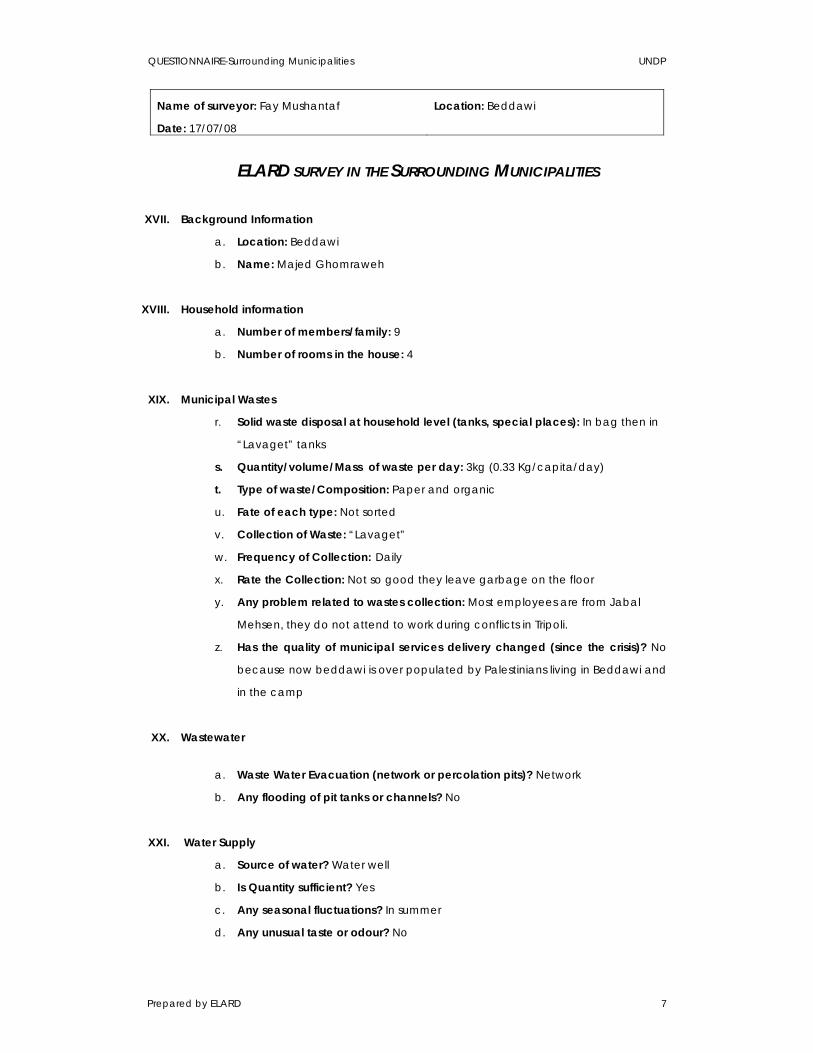
QUESTIONNAIRE-Surrounding Municipalities UNDP
Name of surveyor: Fay Mushantaf Location: Beddawi
Date: 17/07/08
Prepared by ELARD 7
ELARD SURVEY IN THE SURROUNDING MUNICIPALITIES
XVII. Background Information
a. Location: Beddawi
b. Name: Majed Ghomraweh
XVIII. Household information
a. Number of members/family: 9
b. Number of rooms in the house: 4
XIX. Municipal Wastes
r. Solid waste disposal at household level (tanks, special places): In bag then in
“Lavaget” tanks
s. Quantity/volume/Mass of waste per day: 3kg (0.33 Kg/capita/day)
t. Type of waste/Composition: Paper and organic
u. Fate of each type: Not sorted
v. Collection of Waste: “Lavaget”
w. Frequency of Collection: Daily
x. Rate the Collection: Not so good they leave garbage on the floor
y. Any problem related to wastes collection: Most employees are from Jabal
Mehsen, they do not attend to work during conflicts in Tripoli.
z. Has the quality of municipal services delivery changed (since the crisis)? No
because now beddawi is over populated by Palestinians living in Beddawi and
in the camp
XX. Wastewater
a. Waste Water Evacuation (network or percolation pits)? Network
b. Any flooding of pit tanks or channels? No
XXI. Water Supply
a. Source of water? Water well
b. Is Quantity sufficient? Yes
c. Any seasonal fluctuations? In summer
d. Any unusual taste or odour? No
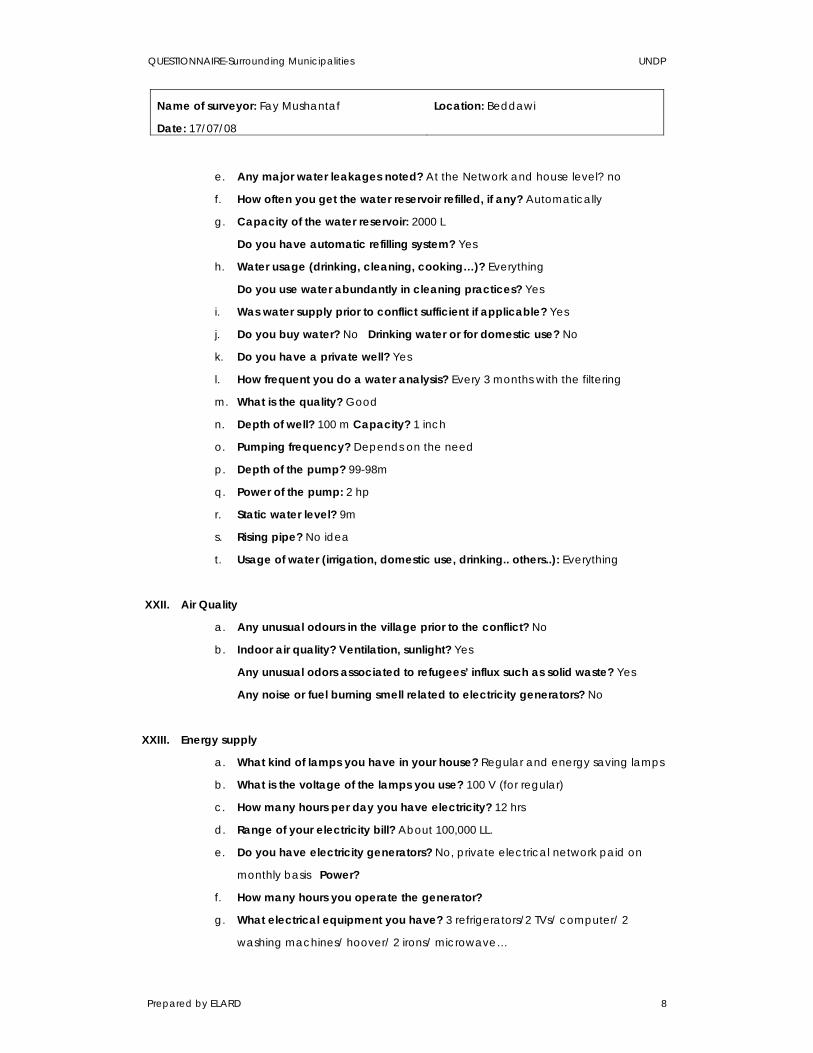
QUESTIONNAIRE-Surrounding Municipalities UNDP
Name of surveyor: Fay Mushantaf Location: Beddawi
Date: 17/07/08
Prepared by ELARD 8
e. Any major water leakages noted? At the Network and house level? no
f. How often you get the water reservoir refilled, if any? Automatically
g. Capacity of the water reservoir: 2000 L
Do you have automatic refilling system? Yes
h. Water usage (drinking, cleaning, cooking…)? Everything
Do you use water abundantly in cleaning practices? Yes
i. Was water supply prior to conflict sufficient if applicable? Yes
j. Do you buy water? No Drinking water or for domestic use? No
k. Do you have a private well? Yes
l. How frequent you do a water analysis? Every 3 months with the filtering
m. What is the quality? Good
n. Depth of well? 100 m Capacity? 1 inch
o. Pumping frequency? Depends on the need
p. Depth of the pump? 99-98m
q. Power of the pump: 2 hp
r. Static water level? 9m
s. Rising pipe? No idea
t. Usage of water (irrigation, domestic use, drinking.. others..): Everything
XXII. Air Quality
a. Any unusual odours in the village prior to the conflict? No
b. Indoor air quality? Ventilation, sunlight? Yes
Any unusual odors associated to refugees’ influx such as solid waste? Yes
Any noise or fuel burning smell related to electricity generators? No
XXIII. Energy supply
a. What kind of lamps you have in your house? Regular and energy saving lamps
b. What is the voltage of the lamps you use? 100 V (for regular)
c. How many hours per day you have electricity? 12 hrs
d. Range of your electricity bill? About 100,000 LL.
e. Do you have electricity generators? No, private electrical network paid on
monthly basis Power?
f. How many hours you operate the generator?
g. What electrical equipment you have? 3 refrigerators/2 TVs/ computer/ 2
washing machines/ hoover/ 2 irons/ microwave…

QUESTIONNAIRE-Surrounding Municipalities UNDP
Name of surveyor: Fay Mushantaf Location: Beddawi
Date: 17/07/08
Prepared by ELARD 9
XXIV. Other relevant information
a. Any damage was recorded in your village related to the NBC conflict?
Population increased
b. Any other problem regarding above mentioned topics? Fuel containers of July
war 2006 stored in IPC
QUESTIONNAIRE-Surrounding Municipalities UNDP
Name of surveyor: Nadine Aoun Location: Menieh
Date: 04/08/08
Prepared by ELARD 1
ELARD SURVEY IN THE SURROUNDING MUNICIPALITIES
I. Background Information
a. Location: Menieh
b. Name: Abdel Hafiz Sammour
II. Household information
a. Number of members/family: 3
b. Number of rooms in the house: 5
III. Municipal Wastes
a. Solid waste disposal at household level (tanks, special places): Closed bags
then in barrels
b. Quantity/volume/Mass of waste per day: 5Kg (1.66Kg/capita/day)
c. Type of waste/Composition: Organic, paper, glass
d. Fate of each type: Aadoui
e. Collection of Waste: Private
f. Frequency of Collection: Once per week
g. Rate the Collection: Medium
h. Any problem related to wastes collection: Leftovers, and bad smell from the
pick ups
Has the quality of municipal services delivery changed (since the crisis)? No
IV. Wastewater
a. Waste Water Evacuation (network or percolation pits)? Network
b. Any flooding of pit tanks or channels? Sometimes storm water is diverted to
waste water network and so flooding occurs occasionally
V. Water Supply
a. Source of water? Private well for 40 houses (200 persons)
b. Is Quantity sufficient? Yes
c. Any seasonal fluctuations? Yes
d. Any unusual taste or odour? No, calcareous
e. Any major water leakages noted? At the Network and house level?

QUESTIONNAIRE-Surrounding Municipalities UNDP
Name of surveyor: Nadine Aoun Location: Menieh
Date: 04/08/08
Prepared by ELARD 2
_________________________________________________________________________.
f. How often you get the water reservoir refilled, if any? 10 hrs/day as long as the
electricity is on
g. Capacity of the water reservoir: 1000L (500 L consumption /day)
h. Do you have automatic refilling system? No
i. Water usage (drinking, cleaning, cooking…)? Everything
j. Do you use water abundantly in cleaning practices? Yes
k. Was water supply prior to conflict sufficient if applicable?
l. Do you buy water? Yes drinking water or for domestic use?
m. Do you have a private well? Yes
n. How frequent you do a water analysis? Twice/year (from ministry)
o. What is the quality? Good but high in CaCO3
p. Depth of well? 50m Capacity? 2 in
q. Pumping frequency? 10 hrs
r. Depth of the pump? 40m
s. Power of the pump 2HP
t. Static water level? 20m
u. Rising pipe?
Usage of water (irrigation, domestic use, drinking.. others..): Everything
VI. Air Quality
a. Any unusual odours in the village prior to the conflict? Smell of waste from the
trucks
b. Indoor air quality? Ventilation, sunlight? Yes
Any unusual odors associated to refugees’ influx such as solid waste? Solid
waste
Any noise or fuel burning smell related to electricity generators: No
VII. Energy supply
a. What kind of lamps you have in your house? All energy saving
b. What is the voltage of the lamps you use? 60W
c. How many hours per day you have electricity? 10 hrs/day
d. Range of your electricity bill? 65,000LL
e. Do you have electricity generators? No, UPS Power?
f. How many hours you operate the generator?

QUESTIONNAIRE-Surrounding Municipalities UNDP
Name of surveyor: Nadine Aoun Location: Menieh
Date: 04/08/08
Prepared by ELARD 3
g. What electrical equipment you have? Everything
VIII. Other relevant information
a. Any damage was recorded in your village related to the NBC conflict? Yes
b. Any other problem regarding above mentioned topics? Black cloud from Deir
Ammar Electricity plant
QUESTIONNAIRE-Surrounding Municipalities UNDP
Name of surveyor: Nadine Aoun Location: Menieh
Date: 04/08/08
Prepared by ELARD 4
ELARD SURVEY IN THE SURROUNDING MUNICIPALITIES
Background Information
c. Location: Menihe
d. Name: Bilal Mostafa Alameddine
IX. Household information
a. Number of members/family: 3
b. Number of rooms in the house: 6
X. Municipal Wastes
i. Solid waste disposal at household level (tanks, special places): Closed bags
and then in barrels of the municipality
j. /volume/Mass of waste per day: 3 Kg (1Kg/capita/day)
k. Type of waste/Composition: Organic/paper/cans+plastic
l. Fate of each type: No sorting
m. Collection of Waste: Municipality hires 4 people responsible of 4 sectors. Then
dump it in Aadoui
n. Frequency of Collection: Twice per week
o. Rate the Collection: Good
Any problem related to wastes collection: Some leftovers
Has the quality of municipal services delivery changed (since the crisis? No
XI. Wastewater
a. Waste Water Evacuation (network or percolation pits)? Network _
b. Any flooding of pit tanks or channels? No
XII. Water Supply
a. Source of water? Private well
b. Is Quantity sufficient? Yes
c. Any seasonal fluctuations? Yes
d. Any unusual taste or odour? Only calcareous
e. Any major water leakages noted? At the Network and house level? No
f. How often you get the water reservoir refilled, if any? 1 hr/day
g. Capacity of the water reservoir: 4 m3

QUESTIONNAIRE-Surrounding Municipalities UNDP
Name of surveyor: Nadine Aoun Location: Menieh
Date: 04/08/08
Prepared by ELARD 5
h. Do you have automatic refilling system? No
i. Water usage (drinking, cleaning, cooking…)? Everything
j. Do you use water abundantly in cleaning practices? Yes
k. Was water supply prior to conflict sufficient if applicable?
l. Do you buy water? No drinking water or for domestic use?
m. Do you have a private well? Yes
n. How frequent you do a water analysis? No
o. What is the quality? Good without analysis
p. Depth of well? 12m Capacity? 2 inches
q. Pumping frequency? 2 hrs/day
r. Depth of the pump? Non submerging pump
s. Power of the pump: 3/4 HP
t. Static water level? In winter it floods to land surface
u. Rising pipe?
Usage of water (irrigation, domestic use, drinking.. others..): Everything
XIII. Air Quality
a. Any unusual odours in the village prior to the conflict? No
b. Indoor air quality? Ventilation, sunlight? Yes
Any unusual odors associated to refugees’ influx such as solid waste? Yes, lots
of solid wastes
c. Any noise or fuel burning smell related to electricity generators:
A black cloud from Deir Ammar Electrical plant affecting almonds’ orchards
XIV. Energy supply
a. What kind of lamps you have in your house? 50% energy saving & 50% normal
b. What is the voltage of the lamps you use? 120W and 60W
c. How many hours per day you have electricity? 10 hrs
d. Range of your electricity bill? 30,000-40000LL
e. Do you have electricity generators? No, only UPS Power?
f. How many hours you operate the generator?
g. What electrical equipment you have? Everything
XV. Other relevant information
a. Any damage was recorded in your village related to the NBC conflict?
QUESTIONNAIRE-Surrounding Municipalities UNDP
Name of surveyor: Nadine Aoun Location: Menieh
Date: 04/08/08
Prepared by ELARD 6
b. Any other problem regarding above mentioned topics?
QUESTIONNAIRE-Surrounding Municipalities UNDP
Name of surveyor: Nadine Aoun Location: Menieh
Date: 04/08/08
Prepared by ELARD 7
ELARD SURVEY IN THE SURROUNDING MUNICIPALITIES
XVI. Background Information
a. Location: Menieh
b. Name: Jean
XVII. Household information
a. Number of members/family: 13
b. Number of rooms in the house: 6
XVIII. Municipal Wastes
p. Solid waste disposal at household level (tanks, special places): Closed bags
and then barrels
q. Quantity/volume/Mass of waste per day: 7Kg (0.54Kg/capita/day)
r. Type of waste/Composition: Organic and paper
s. Fate of each type:
t. Collection of Waste: Municipality
u. Frequency of Collection: Once per week
v. Rate the Collection: Medium
w. Any problem related to wastes collection? No
x. Has the quality of municipal services delivery changed (since the crisis)? No
XIX. Wastewater
a. Waste Water Evacuation (network or percolation pits)? Network
b. Any flooding of pit tanks or channels? No
XX. Water Supply
a. Source of water? Ouyoun El Samak spring
b. Is Quantity sufficient? Not always
c. Any seasonal fluctuations? Yes
d. Any unusual taste or odour? No
Any major water leakages noted? At the Network and house level? No
e. How often you get the water reservoir refilled, if any? 2-3 days
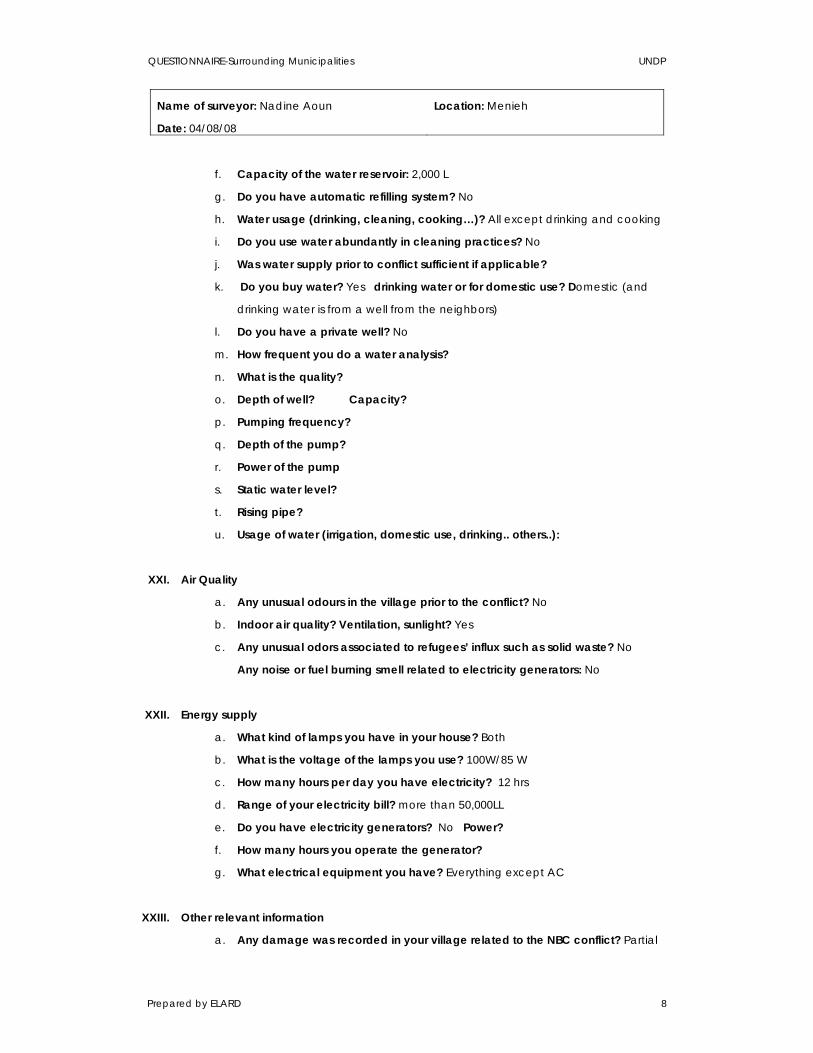
QUESTIONNAIRE-Surrounding Municipalities UNDP
Name of surveyor: Nadine Aoun Location: Menieh
Date: 04/08/08
Prepared by ELARD 8
f. Capacity of the water reservoir: 2,000 L
g. Do you have automatic refilling system? No
h. Water usage (drinking, cleaning, cooking…)? All except drinking and cooking
i. Do you use water abundantly in cleaning practices? No
j. Was water supply prior to conflict sufficient if applicable?
k. Do you buy water? Yes drinking water or for domestic use? Domestic (and
drinking water is from a well from the neighbors)
l. Do you have a private well? No
m. How frequent you do a water analysis?
n. What is the quality?
o. Depth of well? Capacity?
p. Pumping frequency?
q. Depth of the pump?
r. Power of the pump
s. Static water level?
t. Rising pipe?
u. Usage of water (irrigation, domestic use, drinking.. others..):
XXI. Air Quality
a. Any unusual odours in the village prior to the conflict? No
b. Indoor air quality? Ventilation, sunlight? Yes
c. Any unusual odors associated to refugees’ influx such as solid waste? No
Any noise or fuel burning smell related to electricity generators: No
XXII. Energy supply
a. What kind of lamps you have in your house? Both
b. What is the voltage of the lamps you use? 100W/85 W
c. How many hours per day you have electricity? 12 hrs
d. Range of your electricity bill? more than 50,000LL
e. Do you have electricity generators? No Power?
f. How many hours you operate the generator?
g. What electrical equipment you have? Everything except AC
XXIII. Other relevant information
a. Any damage was recorded in your village related to the NBC conflict? Partial

QUESTIONNAIRE-Surrounding Municipalities UNDP
Name of surveyor: Nadine Aoun Location: Menieh
Date: 04/08/08
Prepared by ELARD 9
damage
b. Any other problem regarding above mentioned topics? Waste water network
is needed.

QUESTIONNAIRE-Surrounding Municipalities UNDP
Name of surveyors: Nadine Aoun Location: Deir Ammar
Date: 04/08/08
Prepared by ELARD 1
ELARD SURVEY IN THE SURROUNDING MUNICIPALITIES
I. Background Information
a. Location: Deir Ammar
b. Name: Ahmad Al Dhaiby
II. Household information
a. Number of members/family: 5
b. Number of rooms in the house: 4
III. Municipal Wastes
a. Solid waste disposal at household level (tanks, special places): Closed bags
and then tanks
b. Quantity/volume/Mass of waste per day: 5kg (1Kg/capita/day)
c. Type of waste/Composition: Organic and paper
d. Fate of each type:
e. Collection of Waste: Municipality
f. Frequency of Collection: Daily
g. Rate the Collection: Good
h. Any problem related to wastes collection? Tanks are not clean due liquid of
waste
Has the quality of municipal services delivery changed (since the crisis)? No
IV. Wastewater
a. Waste Water Evacuation (network or percolation pits)? Network
b. Any flooding of pit tanks or channels? Sometimes
V. Water Supply
a. Source of water? Network
b. Is Quantity sufficient? No
c. Any seasonal fluctuations? No
d. Any unusual taste or odour? Good
e. Any major water leakages noted? At the Network and house level?
Sometimes, old network
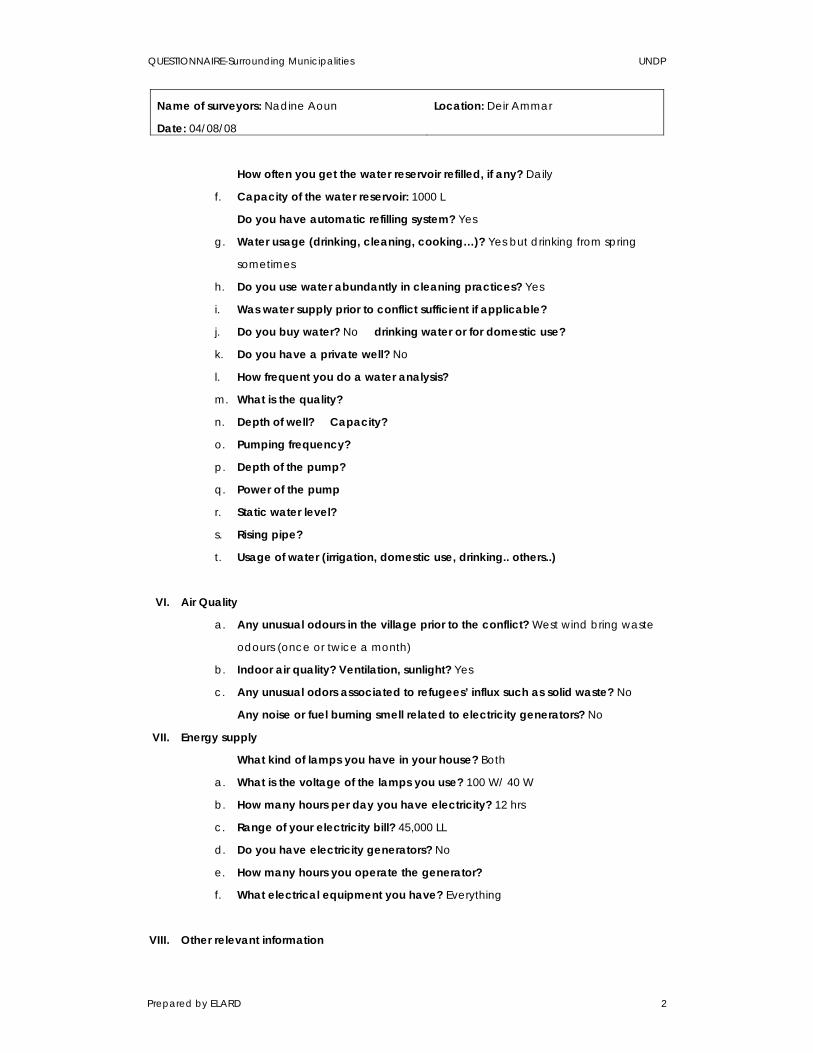
QUESTIONNAIRE-Surrounding Municipalities UNDP
Name of surveyors: Nadine Aoun Location: Deir Ammar
Date: 04/08/08
Prepared by ELARD 2
How often you get the water reservoir refilled, if any? Daily
f. Capacity of the water reservoir: 1000 L
Do you have automatic refilling system? Yes
g. Water usage (drinking, cleaning, cooking…)? Yes but drinking from spring
sometimes
h. Do you use water abundantly in cleaning practices? Yes
i. Was water supply prior to conflict sufficient if applicable?
j. Do you buy water? No drinking water or for domestic use?
k. Do you have a private well? No
l. How frequent you do a water analysis?
m. What is the quality?
n. Depth of well? Capacity?
o. Pumping frequency?
p. Depth of the pump?
q. Power of the pump
r. Static water level?
s. Rising pipe?
t. Usage of water (irrigation, domestic use, drinking.. others..)
VI. Air Quality
a. Any unusual odours in the village prior to the conflict? West wind bring waste
odours (once or twice a month)
b. Indoor air quality? Ventilation, sunlight? Yes
c. Any unusual odors associated to refugees’ influx such as solid waste? No
Any noise or fuel burning smell related to electricity generators? No
VII. Energy supply
What kind of lamps you have in your house? Both
a. What is the voltage of the lamps you use? 100 W/ 40 W
b. How many hours per day you have electricity? 12 hrs
c. Range of your electricity bill? 45,000 LL
d. Do you have electricity generators? No
e. How many hours you operate the generator?
f. What electrical equipment you have? Everything
VIII. Other relevant information
QUESTIONNAIRE-Surrounding Municipalities UNDP
Name of surveyors: Nadine Aoun Location: Deir Ammar
Date: 04/08/08
Prepared by ELARD 3
a. Any damage was recorded in your village related to the NBC conflict? Cars
and bombing
b. Any other problem regarding above mentioned topics? Diseases related to
power plant (brain cancer). Almond orchards also deteriorated
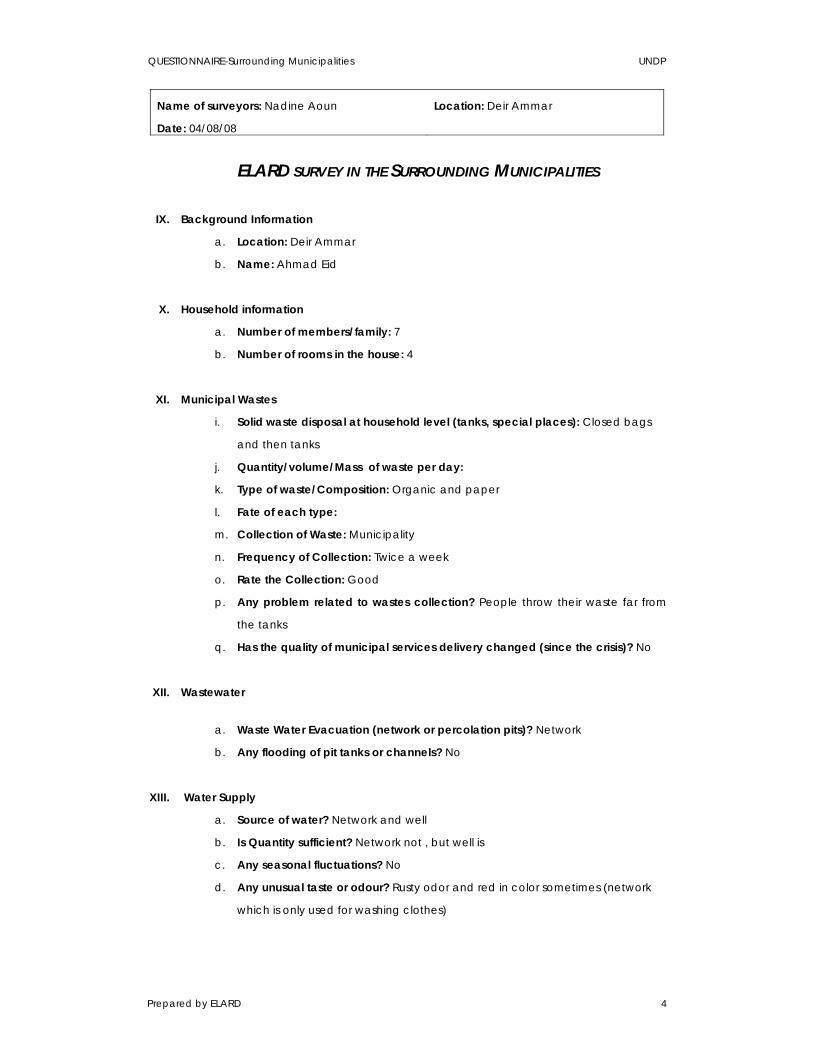
QUESTIONNAIRE-Surrounding Municipalities UNDP
Name of surveyors: Nadine Aoun Location: Deir Ammar
Date: 04/08/08
Prepared by ELARD 4
ELARD SURVEY IN THE SURROUNDING MUNICIPALITIES
IX. Background Information
a. Location: Deir Ammar
b. Name: Ahmad Eid
X. Household information
a. Number of members/family: 7
b. Number of rooms in the house: 4
XI. Municipal Wastes
i. Solid waste disposal at household level (tanks, special places): Closed bags
and then tanks
j. Quantity/volume/Mass of waste per day:
k. Type of waste/Composition: Organic and paper
l. Fate of each type:
m. Collection of Waste: Municipality
n. Frequency of Collection: Twice a week
o. Rate the Collection: Good
p. Any problem related to wastes collection? People throw their waste far from
the tanks
q. Has the quality of municipal services delivery changed (since the crisis)? No
XII. Wastewater
a. Waste Water Evacuation (network or percolation pits)? Network
b. Any flooding of pit tanks or channels? No
XIII. Water Supply
a. Source of water? Network and well
b. Is Quantity sufficient? Network not , but well is
c. Any seasonal fluctuations? No
d. Any unusual taste or odour? Rusty odor and red in color sometimes (network
which is only used for washing clothes)
QUESTIONNAIRE-Surrounding Municipalities UNDP
Name of surveyors: Nadine Aoun Location: Deir Ammar
Date: 04/08/08
Prepared by ELARD 5
e. Any major water leakages noted? At the Network and house level? Yes in
network
f. How often you get the water reservoir refilled, if any?
g. Capacity of the water reservoir: 4000 L (for 20 people)
h. Do you have automatic refilling system? No
i. Water usage (drinking, cleaning, cooking…)? Network used for washing
clothes only
j. Do you use water abundantly in cleaning practices? Yes
k. Was water supply prior to conflict sufficient if applicable?
l. Do you buy water? No drinking water or for domestic use?
m. Do you have a private well? Yes
n. How frequent you do a water analysis? 1 year ago
o. What is the quality? High in iron (when pumped and subjected to sunlight, it
gives a yellow color, when hot it becomes red) the IPC drilled a well that gave
sulfur
p. Depth of well? 70 m Capacity? 1 inch
q. Pumping frequency? 6 hrs/Daily
r. Depth of the pump? 40m
s. Power of the pump: 1.5 HP
t. Static water level? 62 m
u. Rising pipe?
v. Usage of water (irrigation, domestic use, drinking.. others..): All except drinking
water is filtered and then drank
XIV. Air Quality
a. Any unusual odours in the village prior to the conflict? Eectric plant of Deir
Ammar
b. Indoor air quality? Ventilation, sunlight? Yes
c. Any unusual odors associated to refugees’ influx such as solid waste? No
Any noise or fuel burning smell related to electricity generators? No
XV. Energy supply
a. What kind of lamps you have in your house? Both
b. What is the voltage of the lamps you use? 100 W and 85 W
c. How many hours per day you have electricity? 12 hrs
d. Range of your electricity bill? 50000LL

QUESTIONNAIRE-Surrounding Municipalities UNDP
Name of surveyors: Nadine Aoun Location: Deir Ammar
Date: 04/08/08
Prepared by ELARD 6
e. Do you have electricity generators? No Power?
f. How many hours you operate the generator?
g. What electrical equipment you have? Everything
XVI. Other relevant information
a. Any damage was recorded in your village related to the NBC conflict? Partial
damages in houses
b. Any other problem regarding above mentioned topics? Lots of motorcycles

QUESTIONNAIRE-Surrounding Municipalities UNDP
Name of surveyors: Nadine Aoun Location: Deir Ammar
Date: 04/08/08
Prepared by ELARD 7
ELARD SURVEY IN THE SURROUNDING MUNICIPALITIES
XVII. Background Information
a. Location: Deir Ammar
b. Name: Omar Khawla
XVIII. Household information
a. Number of members/family: 7
b. Number of rooms in the house: 4
XIX. Municipal Wastes
r. Solid waste disposal at household level (tanks, special places): Closed bags
and then tanks
s. Quantity/volume/Mass of waste per day: 4.5 kg (0.64Kg/capita/day)
t. Type of waste/Composition: Organic and paper
u. Fate of each type:
v. Collection of Waste: Municipality
w. Frequency of Collection: Three times a week
x. Rate the Collection: Good
y. Any problem related to wastes collection? No
z. Has the quality of municipal services delivery changed (since the crisis)? No
XX. Wastewater
a. Waste Water Evacuation (network or percolation pits)? Network
b. Any flooding of pit tanks or channels? No (only few places and the higher side)
XXI. Water Supply
a. Source of water? Network
b. Is Quantity sufficient? No due to electricity shortage
c. Any seasonal fluctuations? Yes
d. Any unusual taste or odour? Calcareous
e. Any major water leakages noted? At the Network and house level? Sometimes
(old network)
f. How often you get the water reservoir refilled, if any? Daily
QUESTIONNAIRE-Surrounding Municipalities UNDP
Name of surveyors: Nadine Aoun Location: Deir Ammar
Date: 04/08/08
Prepared by ELARD 8
g. Capacity of the water reservoir: 2000 L
h. Do you have automatic refilling system? No
i. Water usage (drinking, cleaning, cooking…)? Everything
j. Do you use water abundantly in cleaning practices? Yes
k. Was water supply prior to conflict sufficient if applicable?
l. Do you buy water? No drinking water or for domestic use?
m. Do you have a private well? Yes
n. How frequent you do a water analysis? No because its 2 months old
o. What is the quality?
p. Depth of well? 80m Capacity? 3714 L/ 1 hrs
q. Pumping frequency? Daily
r. Depth of the pump? 77m
s. Power of the pump: 1.5 HP (1 in)
t. Static water level? 50 m
u. Rising pipe?
v. Usage of water (irrigation, domestic use, drinking.. others..): Not yet used
XXII. Air Quality
a. Any unusual odours in the village prior to the conflict? No
b. Indoor air quality? Ventilation, sunlight? Yes
c. Any unusual odors associated to refugees’ influx such as solid waste? No
d. Any noise or fuel burning smell related to electricity generators? No
XXIII. Energy supply
a. What kind of lamps you have in your house? Normal
b. What is the voltage of the lamps you use?100 W and 200 W
c. How many hours per day you have electricity? 12 hrs
d. Range of your electricity bill? 30,000-35000LL
e. Do you have electricity generators? No Power?
f. How many hours you operate the generator?
g. What electrical equipment you have? Everything except microwave and AC
XXIV. Other relevant information
Any damage was recorded in your village related to the NBC conflict?
Bombing

QUESTIONNAIRE-Surrounding Municipalities UNDP
Name of surveyors: Nadine Aoun Location: Deir Ammar
Date: 04/08/08
Prepared by ELARD 9
a. Any other problem regarding above mentioned topics? Electricity plant
(cancer blood and brain) almonds and cultivation
QUESTIONNAIRE-Surrounding Municipalities UNDP
Name of surveyor: Carlo Bekhazi Location: Bebnine
Date: 23/07/08
Prepared by ELARD 1
ELARD SURVEY IN THE SURROUNDING MUNICIPALITIES
I. Background Information
a. Location: Bebnine
b. Name:
II. Household information
a. Number of members/family: 7
b. Number of rooms in the house: 8
III. Municipal Wastes
a. Solid waste disposal at household level (tanks, special places): Only in bags
then to barrels
b. Quantity/volume/Mass of waste per day: 2Kg (0.28Kg/capita/day)
c. Type of waste/Composition: Organic, plastic
d. Fate of each type: No sorting
e. Collection of Waste: Municipality
f. Frequency of Collection: Every 2 days
g. Rate the Collection: Not very good, they only take the bags
h. Has the quality of municipal services delivery changed (since the crisis)? No
IV. Wastewater
a. Waste Water Evacuation (network or percolation pits)? Network
b. Any flooding of pit tanks or channels? Yes there is flooding because the pipes
are too small relatively to the generated volumes
V. Water Supply
a. Source of water? Bebnine spring
b. Is Quantity sufficient? No
c. Any seasonal fluctuations? Yes
d. Any unusual taste or odour? A taste when insufficient in summer
e. Any major water leakages noted? At the Network and house level? No.
f. How often you get the water reservoir refilled, if any? Water always on

QUESTIONNAIRE-Surrounding Municipalities UNDP
Name of surveyor: Carlo Bekhazi Location: Bebnine
Date: 23/07/08
Prepared by ELARD 2
shortage
g. Capacity of the water reservoir: 1200 Liters
h. Do you have automatic refilling system? No
i. Water usage (drinking, cleaning, cooking…)? Everything
j. Do you use water abundantly in cleaning practices? It depends on availability
k. Was water supply prior to conflict sufficient if applicable? Yes
l. Do you buy water? Yes drinking water or for domestic use? Both
m. Do you have a private well? No
n. How frequent you do a water analysis?
o. What is the quality?
p. Depth of well? Capacity?
q. Pumping frequency?
r. Depth of the pump?
s. Power of the pump
t. Static water level?
u. Rising pipe?
v. Usage of water (irrigation, domestic use, drinking.. others..)
VI. Air Quality
a. Any unusual odours in the village prior to the conflict? Waste water
b. Indoor air quality? Ventilation, sunlight? Yes
Any unusual odors associated to refugees’ influx such as solid waste? No
refugees
Any noise or fuel burning smell related to electricity generators: No
VII. Energy supply
a. What kind of lamps you have in your house? Normal
b. What is the voltage of the lamps you use? 100W
c. How many hours per day you have electricity? 4hrs
d. Range of your electricity bill? 40.000LL
e. Do you have electricity generators? No Power?
f. How many hours you operate the generator?
g. What electrical equipment you have? Everything
VIII. Other relevant information
QUESTIONNAIRE-Surrounding Municipalities UNDP
Name of surveyor: Carlo Bekhazi Location: Bebnine
Date: 23/07/08
Prepared by ELARD 3
a. Any damage was recorded in your village related to the NBC conflict?
b. Any other problem regarding above mentioned topics?
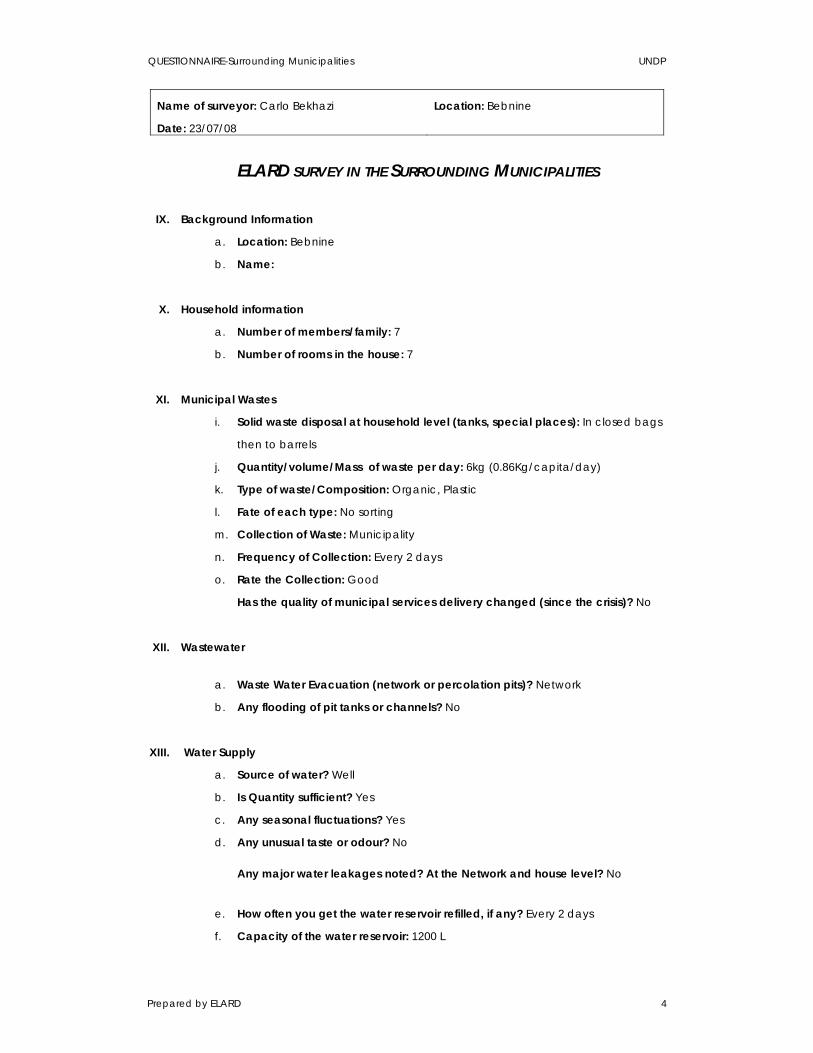
QUESTIONNAIRE-Surrounding Municipalities UNDP
Name of surveyor: Carlo Bekhazi Location: Bebnine
Date: 23/07/08
Prepared by ELARD 4
ELARD SURVEY IN THE SURROUNDING MUNICIPALITIES
IX. Background Information
a. Location: Bebnine
b. Name:
X. Household information
a. Number of members/family: 7
b. Number of rooms in the house: 7
XI. Municipal Wastes
i. Solid waste disposal at household level (tanks, special places): In closed bags
then to barrels
j. Quantity/volume/Mass of waste per day: 6kg (0.86Kg/capita/day)
k. Type of waste/Composition: Organic, Plastic
l. Fate of each type: No sorting
m. Collection of Waste: Municipality
n. Frequency of Collection: Every 2 days
o. Rate the Collection: Good
Has the quality of municipal services delivery changed (since the crisis)? No
XII. Wastewater
a. Waste Water Evacuation (network or percolation pits)? Network
b. Any flooding of pit tanks or channels? No
XIII. Water Supply
a. Source of water? Well
b. Is Quantity sufficient? Yes
c. Any seasonal fluctuations? Yes
d. Any unusual taste or odour? No
Any major water leakages noted? At the Network and house level? No
e. How often you get the water reservoir refilled, if any? Every 2 days
f. Capacity of the water reservoir: 1200 L
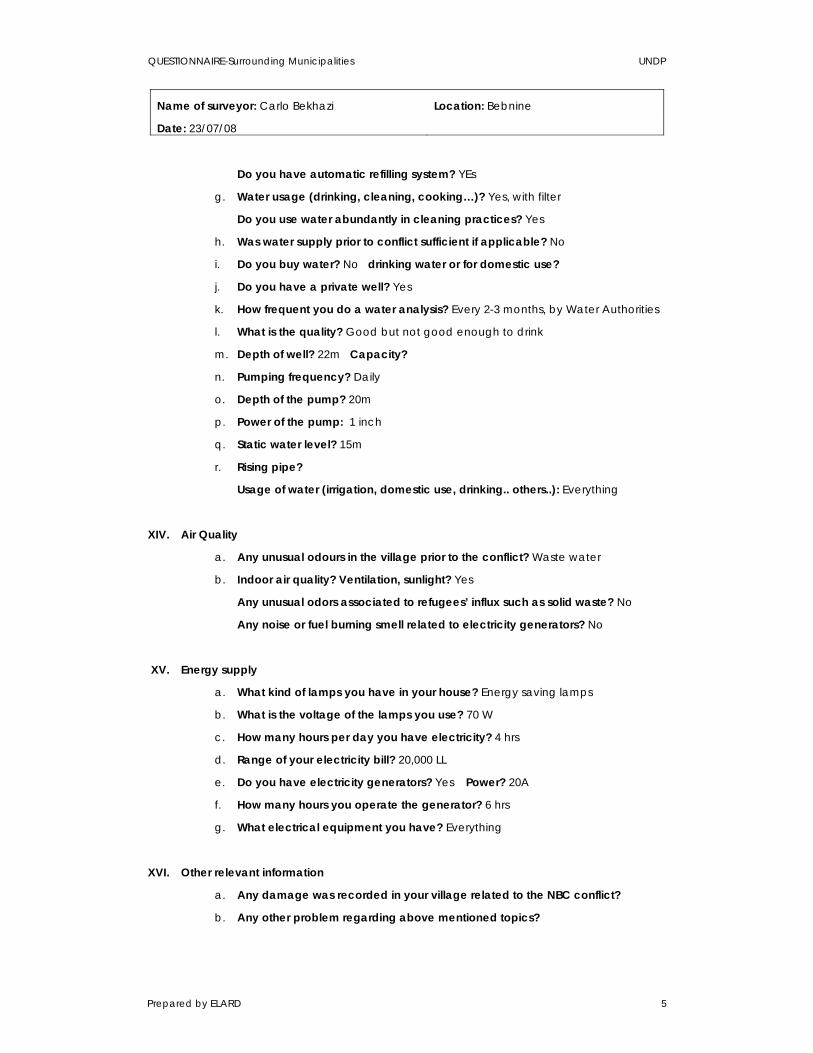
QUESTIONNAIRE-Surrounding Municipalities UNDP
Name of surveyor: Carlo Bekhazi Location: Bebnine
Date: 23/07/08
Prepared by ELARD 5
Do you have automatic refilling system? YEs
g. Water usage (drinking, cleaning, cooking…)? Yes, with filter
Do you use water abundantly in cleaning practices? Yes
h. Was water supply prior to conflict sufficient if applicable? No
i. Do you buy water? No drinking water or for domestic use?
j. Do you have a private well? Yes
k. How frequent you do a water analysis? Every 2-3 months, by Water Authorities
l. What is the quality? Good but not good enough to drink
m. Depth of well? 22m Capacity?
n. Pumping frequency? Daily
o. Depth of the pump? 20m
p. Power of the pump: 1 inch
q. Static water level? 15m
r. Rising pipe?
Usage of water (irrigation, domestic use, drinking.. others..): Everything
XIV. Air Quality
a. Any unusual odours in the village prior to the conflict? Waste water
b. Indoor air quality? Ventilation, sunlight? Yes
Any unusual odors associated to refugees’ influx such as solid waste? No
Any noise or fuel burning smell related to electricity generators? No
XV. Energy supply
a. What kind of lamps you have in your house? Energy saving lamps
b. What is the voltage of the lamps you use? 70 W
c. How many hours per day you have electricity? 4 hrs
d. Range of your electricity bill? 20,000 LL
e. Do you have electricity generators? Yes Power? 20A
f. How many hours you operate the generator? 6 hrs
g. What electrical equipment you have? Everything
XVI. Other relevant information
a. Any damage was recorded in your village related to the NBC conflict?
b. Any other problem regarding above mentioned topics?

QUESTIONNAIRE-Surrounding Municipalities UNDP
Name of surveyor: Carlo Bekhazi Location: Bebnine
Date: 23/07/08
Prepared by ELARD 6
ELARD SURVEY IN THE SURROUNDING MUNICIPALITIES
XVII. Background Information
a. Location: Bebnine
b. Name:
XVIII. Household information
a. Number of members/family: 11
b. Number of rooms in the house: 7
XIX. Municipal Wastes
p. Solid waste disposal at household level (tanks, special places): In bag then
barrels
q. Quantity/volume/Mass of waste per day: 3 bags, about 6-7 kg
(0.59/capita/day)
r. Type of waste/Composition: Everything except food
s. Fate of each type: No sorting
t. Collection of Waste: Municipality
u. Frequency of Collection: Every 2 weeks
v. Rate the Collection: Very bad, generates bad smells
w. Has the quality of municipal services delivery changed (since the crisis)? No
XX. Wastewater
Waste Water Evacuation (network or percolation pits)? Percolation pits
x. Any flooding of pit tanks or channels? Yes, pits never been emptied
XXI. Water Supply
a. Source of water? Water well for the neighbours
b. Is Quantity sufficient? No
c. Any seasonal fluctuations? Yes in summer
d. Any unusual taste or odour? No
e. Any major water leakages noted? At the Network and house level?
f. How often you get the water reservoir refilled, if any? Depending on electricity

QUESTIONNAIRE-Surrounding Municipalities UNDP
Name of surveyor: Carlo Bekhazi Location: Bebnine
Date: 23/07/08
Prepared by ELARD 7
g. Capacity of the water reservoir: 1200 L
Do you have automatic refilling system? No
Water usage (drinking, cleaning, cooking…)? Everything
h. Do you use water abundantly in cleaning practices? Only when water is
sufficient
i. Was water supply prior to conflict sufficient if applicable? Yes
j. Do you buy water? Yes drinking water or for domestic use? Both
k. Do you have a private well? No
l. How frequent you do a water analysis? Monthly by AUB
m. What is the quality? Good
n. Depth of well? 100m Capacity?
o. Pumping frequency? Depends on availability
p. Depth of the pump?
q. Power of the pump:
r. Static water level?
s. Rising pipe?
Usage of water (irrigation, domestic use, drinking.. others..): Everything
XXII. Air Quality
a. Any unusual odours in the village prior to the conflict? Sometimes garbage left
uncollected for days
b. Indoor air quality? Ventilation, sunlight? Yes
Any unusual odors associated to refugees’ influx such as solid waste? No
Any noise or fuel burning smell related to electricity generators? Yes noise
XXIII. Energy supply
a. What kind of lamps you have in your house? Normal
b. What is the voltage of the lamps you use? 100 W
c. How many hours per day you have electricity? 4 hrs
d. Range of your electricity bill? About 25,000LL
e. Do you have electricity generators? Yes Power? 5A
f. How many hours you operate the generator? 6 hrs
g. What electrical equipment you have? TV/ Refrigerator/ washing machine
QUESTIONNAIRE-Surrounding Municipalities UNDP
Name of surveyor: Carlo Bekhazi Location: Bebnine
Date: 23/07/08
Prepared by ELARD 8
XXIV. Other relevant information
a. Any damage was recorded in your village related to the NBC conflict? No
b. Any other problem regarding above mentioned topics? No

QUESTIONNAIRE-Surrounding Municipalities UNDP
Name of surveyor: Nadine Aoun Location: Bhannine
Date: 05/08/08
Prepared by ELARD 1
ELARD SURVEY IN THE SURROUNDING MUNICIPALITIES
I. Background Information
a. Location: Bhannine
b. Name:
II. Household information
a. Number of members/family: 2
b. Number of rooms in the house: 4
III. Municipal Wastes
a. Solid waste disposal at household level (tanks, special places): Closed bags
and then barrels
b. Quantity/volume/Mass of waste per day: 1.5 kg (0.75Kg/capita/day)
c. Type of waste/Composition: Organic and paper
d. Fate of each type:
e. Collection of Waste: Private
f. Frequency of Collection: Twice per week
g. Rate the Collection: Medium
h. Any problem related to wastes collection? No
Has the quality of municipal services delivery changed (since the crisis)? No
IV. Wastewater
a. Waste Water Evacuation (network or percolation pits)? Percolation pit
b. Any flooding of pit tanks or channels? No
V. Water Supply
a. Source of water? Network (paid 220,000 LL yearly)
b. Is Quantity sufficient? No
c. Any seasonal fluctuations? Yes
d. Any unusual taste or odour? Good
e. Any major water leakages noted? At the Network and house level? Leakage
(Network is old)
f. How often you get the water reservoir refilled, if any? Daily but not sufficient

QUESTIONNAIRE-Surrounding Municipalities UNDP
Name of surveyor: Nadine Aoun Location: Bhannine
Date: 05/08/08
Prepared by ELARD 2
g. Capacity of the water reservoir: 1200 L
h. Do you have automatic refilling system? No
i. Water usage (drinking, cleaning, cooking…)? Everything
j. Do you use water abundantly in cleaning practices? No
k. Was water supply prior to conflict sufficient if applicable? Was better
l. Do you buy water? _yes_drinking water or for domestic use? 1-2 citterns per
month
m. Do you have a private well? No
n. How frequent you do a water analysis?
o. What is the quality?
p. Depth of well? Capacity?
q. Pumping frequency?
r. Depth of the pump?
s. Power of the pump:
t. Static water level?
u. Rising pipe?
Usage of water (irrigation, domestic use, drinking.. others..):
VI. Air Quality
a. Any unusual odours in the village prior to the conflict? Bad odor
b. Indoor air quality? Ventilation, sunlight? Yes
c. Any unusual odors associated to refugees’ influx such as solid waste? Yes but
for a very short time
Any noise or fuel burning smell related to electricity generators? Yes
VII. Energy supply
a. What kind of lamps you have in your house? Normal
b. What is the voltage of the lamps you use? 100 W
c. How many hours per day you have electricity? 12 hrs, now 18 hrs
d. Range of your electricity bill? .40-50,000 LL
e. Do you have electricity generators? Yes Power? 2800 W
f. How many hours you operate the generator? 6 hrs
g. What electrical equipment you have? All except AC
VIII. Other relevant information

QUESTIONNAIRE-Surrounding Municipalities UNDP
Name of surveyor: Nadine Aoun Location: Bhannine
Date: 05/08/08
Prepared by ELARD 3
a. Any damage was recorded in your village related to the NBC conflict? Yes
b. Any other problem regarding above mentioned topics? Waste water to
irrigation network

QUESTIONNAIRE-Surrounding Municipalities UNDP
Name of surveyor: Nadine Aoun Location: Bhannine
Date: 05/08/08
Prepared by ELARD 4
ELARD SURVEY IN THE SURROUNDING MUNICIPALITIES
IX. Background Information
a. Location: Bhannine
b. Name:
X. Household information
a. Number of members/family: 5
b. Number of rooms in the house: 3
XI. Municipal Wastes
i. Solid waste disposal at household level (tanks, special places): Closed bags
and then barrels
j. Quantity/volume/Mass of waste per day: 4 kg (0.8kg/capita/day)
k. Type of waste/Composition: Organic and paper
l. Fate of each type:
m. Collection of Waste: Private
n. Frequency of Collection: Twice per week
o. Rate the Collection: Good, cleans well
p. Any problem related to wastes collection?
q. Has the quality of municipal services delivery changed (since the crisis)? No
XII. Wastewater
a. Waste Water Evacuation (network or percolation pits)? Our block to the
network but all others have percolating pits
b. Any flooding of pit tanks or channels? Percolating pits flood sometimes and
they are left
XIII. Water Supply
a. Source of water? Well only
b. Is Quantity sufficient? Yes
c. Any seasonal fluctuations? No
d. Any unusual taste or odour? No
e. Any major water leakages noted? At the Network and house level?
f. How often you get the water reservoir refilled, if any? Daily
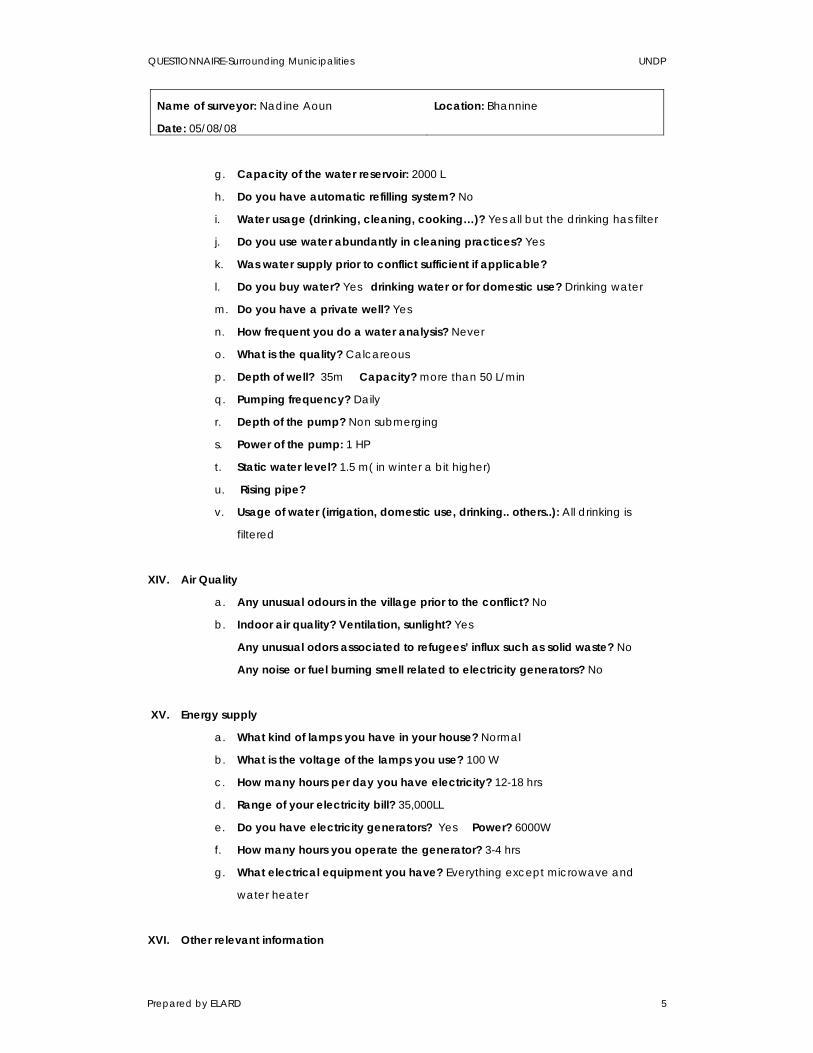
QUESTIONNAIRE-Surrounding Municipalities UNDP
Name of surveyor: Nadine Aoun Location: Bhannine
Date: 05/08/08
Prepared by ELARD 5
g. Capacity of the water reservoir: 2000 L
h. Do you have automatic refilling system? No
i. Water usage (drinking, cleaning, cooking…)? Yes all but the drinking has filter
j. Do you use water abundantly in cleaning practices? Yes
k. Was water supply prior to conflict sufficient if applicable?
l. Do you buy water? Yes drinking water or for domestic use? Drinking water
m. Do you have a private well? Yes
n. How frequent you do a water analysis? Never
o. What is the quality? Calcareous
p. Depth of well? 35m Capacity? more than 50 L/min
q. Pumping frequency? Daily
r. Depth of the pump? Non submerging
s. Power of the pump: 1 HP
t. Static water level? 1.5 m( in winter a bit higher)
u. Rising pipe?
v. Usage of water (irrigation, domestic use, drinking.. others..): All drinking is
filtered
XIV. Air Quality
a. Any unusual odours in the village prior to the conflict? No
b. Indoor air quality? Ventilation, sunlight? Yes
Any unusual odors associated to refugees’ influx such as solid waste? No
Any noise or fuel burning smell related to electricity generators? No
XV. Energy supply
a. What kind of lamps you have in your house? Normal
b. What is the voltage of the lamps you use? 100 W
c. How many hours per day you have electricity? 12-18 hrs
d. Range of your electricity bill? 35,000LL
e. Do you have electricity generators? Yes Power? 6000W
f. How many hours you operate the generator? 3-4 hrs
g. What electrical equipment you have? Everything except microwave and
water heater
XVI. Other relevant information

QUESTIONNAIRE-Surrounding Municipalities UNDP
Name of surveyor: Nadine Aoun Location: Bhannine
Date: 05/08/08
Prepared by ELARD 6
a. Any damage was recorded in your village related to the NBC conflict? No
b. Any other problem regarding above mentioned topics? Poultry manure

QUESTIONNAIRE-Surrounding Municipalities UNDP
Name of surveyor: Nadine Aoun Location: Bhannine
Date: 05/08/08
Prepared by ELARD 7
ELARD SURVEY IN THE SURROUNDING MUNICIPALITIES
XVII. Background Information
a. Location: Bhannine
b. Name:
XVIII. Household information
a. Number of members/family: 6
b. Number of rooms in the house: 4
XIX. Municipal Wastes
a. Solid waste disposal at household level (tanks, special places): In closed bags
and then barrels
b. Quantity/volume/Mass of waste per day: 7Kg (1.16Kg/capita/day)
c. Type of waste/Composition: Organic and pare
d. Fate of each type: Sometimes plastics are sorted and burned near the
house
e. Collection of Waste: Private
f. Frequency of Collection: Once a week
g. Rate the Collection: Poor frequency and leftovers on the road
h. Any problem related to wastes collection? No
i. Has the quality of municipal services delivery changed (since the crisis)? It
deteriorated
XX. Wastewater
a. Waste Water Evacuation (network or percolation pits)? Network
b. Any flooding of pit tanks or channels? Yes
XXI. Water Supply
a. Source of water? Private well
b. Is Quantity sufficient? Yes
c. Any seasonal fluctuations? Yes
d. Any unusual taste or odour? No, water is calcareous
e. Any major water leakages noted? At the Network and house level?
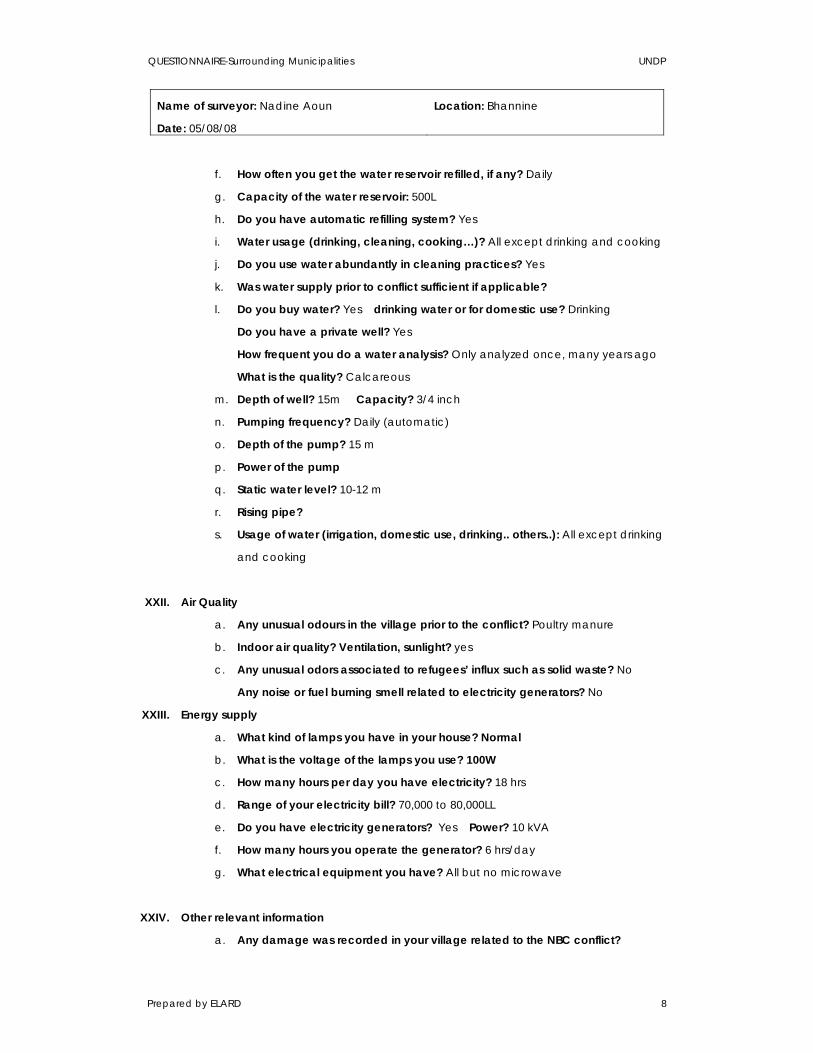
QUESTIONNAIRE-Surrounding Municipalities UNDP
Name of surveyor: Nadine Aoun Location: Bhannine
Date: 05/08/08
Prepared by ELARD 8
f. How often you get the water reservoir refilled, if any? Daily
g. Capacity of the water reservoir: 500L
h. Do you have automatic refilling system? Yes
i. Water usage (drinking, cleaning, cooking…)? All except drinking and cooking
j. Do you use water abundantly in cleaning practices? Yes
k. Was water supply prior to conflict sufficient if applicable?
l. Do you buy water? Yes drinking water or for domestic use? Drinking
Do you have a private well? Yes
How frequent you do a water analysis? Only analyzed once, many years ago
What is the quality? Calcareous
m. Depth of well? 15m Capacity? 3/4 inch
n. Pumping frequency? Daily (automatic)
o. Depth of the pump? 15 m
p. Power of the pump
q. Static water level? 10-12 m
r. Rising pipe?
s. Usage of water (irrigation, domestic use, drinking.. others..): All except drinking
and cooking
XXII. Air Quality
a. Any unusual odours in the village prior to the conflict? Poultry manure
b. Indoor air quality? Ventilation, sunlight? yes
c. Any unusual odors associated to refugees’ influx such as solid waste? No
Any noise or fuel burning smell related to electricity generators? No
XXIII. Energy supply
a. What kind of lamps you have in your house? Normal
b. What is the voltage of the lamps you use? 100W
c. How many hours per day you have electricity? 18 hrs
d. Range of your electricity bill? 70,000 to 80,000LL
e. Do you have electricity generators? Yes Power? 10 kVA
f. How many hours you operate the generator? 6 hrs/day
g. What electrical equipment you have? All but no microwave
XXIV. Other relevant information
a. Any damage was recorded in your village related to the NBC conflict?

QUESTIONNAIRE-Surrounding Municipalities UNDP
Name of surveyor: Nadine Aoun Location: Bhannine
Date: 05/08/08
Prepared by ELARD 9
b. Any other problem regarding above mentioned topics? Poultry manure and
solid waste that should be removed daily

QUESTIONNAIRE-Surrounding Municipalities UNDP
Name of surveyor: Nadine Aoun Location: Mhammara
Date: 15/07/08
Prepared by ELARD 1
ELARD SURVEY IN THE SURROUNDING MUNICIPALITIES
I. Background Information
a. Location: Mhammara
b. Name: Hoda Zaatar
II. Household information
a. Number of members/family: 7
b. Number of rooms in the house: 5
III. Municipal Wastes
a. Solid waste disposal at household level (tanks, special places): In bags and
then in barrels
b. Quantity/volume/Mass of waste per day: 2 kg/ day (0.28kg/capita/day)
c. Type of waste/Composition: Mostly cans, then organic, then paper, then glass
d. Fate of each type: No sorting
e. Collection of Waste: Municipality
f. Frequency of Collection: Daily except on Sundays
g. Rate the Collection: Good
h. Any problem related to wastes collection: Not all the waste is collected,
sometimes the trucks are broken
i. Has the quality of municipal services delivery changed (since the crisis)? No
IV. Wastewater
a. Waste Water Evacuation (network or percolation pits)? Network
b. Any flooding of pit tanks or channels? Yes a lot
V. Water Supply
a. Source of water? Well of Mhammara
b. Is Quantity sufficient? It was sufficient 1-2 years ago
c. Any seasonal fluctuations? Yes in summer
d. Any unusual taste or odour? No
e. Any major water leakages noted? At the Network and house level? Network is
very bad
f. How often you get the water reservoir refilled, if any? Daily (2 hrs/24 hrs)

QUESTIONNAIRE-Surrounding Municipalities UNDP
Name of surveyor: Nadine Aoun Location: Mhammara
Date: 15/07/08
Prepared by ELARD 2
g. Capacity of the water reservoir: 1000 L
Do you have automatic refilling system? Yes
h. Water usage (drinking, cleaning, cooking…)? For everything
Do you use water abundantly in cleaning practices? Yes
i. Was water supply prior to conflict sufficient if applicable? Same
j. Do you buy water? No drinking water or for domestic use? (in the village they
buy for everything)
k. Do you have a private well? No
l. How frequent you do a water analysis?
m. What is the quality?
n. Depth of well? Capacity?
o. Pumping frequency?
p. Depth of the pump?
q. Power of the pump:
r. Static water level?
s. Rising pipe?
Usage of water (irrigation, domestic use, drinking.. others..)
VI. Air Quality
a. Any unusual odours in the village prior to the conflict? Mostly solid waste and
animal manure
b. Indoor air quality? Ventilation, sunlight? Yes
Any unusual odors associated to refugees’ influx such as solid waste? No
Any noise or fuel burning smell related to electricity generators? Yes
VII. Energy supply
a. What kind of lamps you have in your house? Some are energy saving lamps
b. What is the voltage of the lamps you use? 120 w
c. How many hours per day you have electricity? 10 hrs/day
d. Range of your electricity bill? 20,000 L.L. - 25,000 L.L.
e. Do you have electricity generators? Yes Power? 3500 W
f. How many hours you operate the generator? 6 hrs/day
g. What electrical equipment you have? Refrigerator/TV/iron/washing machine…
VIII. Other relevant information

QUESTIONNAIRE-Surrounding Municipalities UNDP
Name of surveyor: Nadine Aoun Location: Mhammara
Date: 15/07/08
Prepared by ELARD 3
a. Any damage was recorded in your village related to the NBC conflict?
Transformers/houses/cars/roads
b. Any other problem regarding above mentioned topics? No
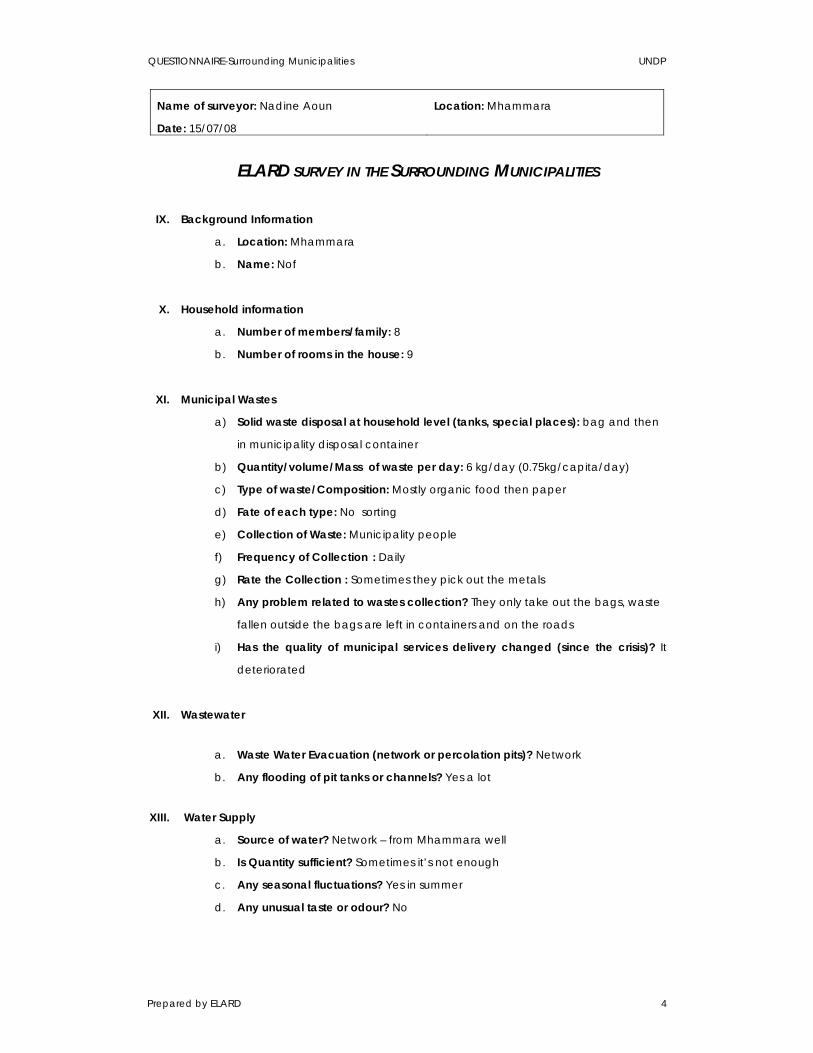
QUESTIONNAIRE-Surrounding Municipalities UNDP
Name of surveyor: Nadine Aoun Location: Mhammara
Date: 15/07/08
Prepared by ELARD 4
ELARD SURVEY IN THE SURROUNDING MUNICIPALITIES
IX. Background Information
a. Location: Mhammara
b. Name: Nof
X. Household information
a. Number of members/family: 8
b. Number of rooms in the house: 9
XI. Municipal Wastes
a) Solid waste disposal at household level (tanks, special places): bag and then
in municipality disposal container
b) Quantity/volume/Mass of waste per day: 6 kg/day (0.75kg/capita/day)
c) Type of waste/Composition: Mostly organic food then paper
d) Fate of each type: No sorting
e) Collection of Waste: Municipality people
f) Frequency of Collection : Daily
g) Rate the Collection : Sometimes they pick out the metals
h) Any problem related to wastes collection? They only take out the bags, waste
fallen outside the bags are left in containers and on the roads
i) Has the quality of municipal services delivery changed (since the crisis)? It
deteriorated
XII. Wastewater
a. Waste Water Evacuation (network or percolation pits)? Network
b. Any flooding of pit tanks or channels? Yes a lot
XIII. Water Supply
a. Source of water? Network – from Mhammara well
b. Is Quantity sufficient? Sometimes it’s not enough
c. Any seasonal fluctuations? Yes in summer
d. Any unusual taste or odour? No
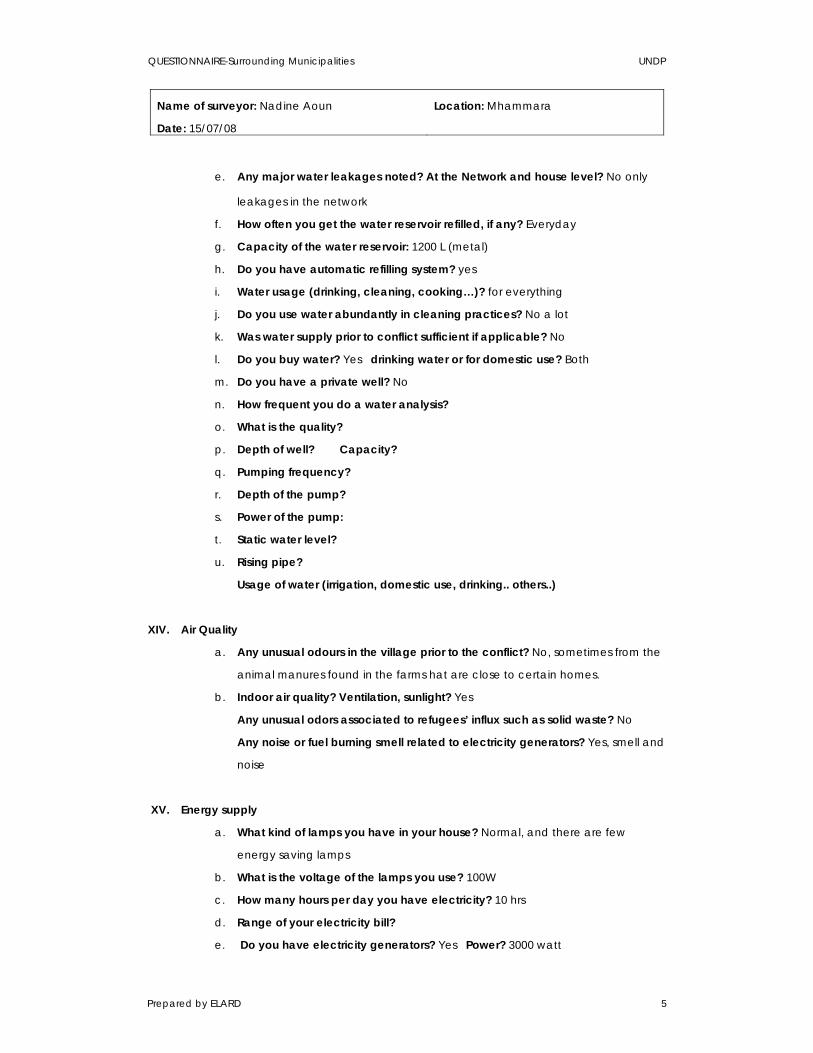
QUESTIONNAIRE-Surrounding Municipalities UNDP
Name of surveyor: Nadine Aoun Location: Mhammara
Date: 15/07/08
Prepared by ELARD 5
e. Any major water leakages noted? At the Network and house level? No only
leakages in the network
f. How often you get the water reservoir refilled, if any? Everyday
g. Capacity of the water reservoir: 1200 L (metal)
h. Do you have automatic refilling system? yes
i. Water usage (drinking, cleaning, cooking…)? for everything
j. Do you use water abundantly in cleaning practices? No a lot
k. Was water supply prior to conflict sufficient if applicable? No
l. Do you buy water? Yes drinking water or for domestic use? Both
m. Do you have a private well? No
n. How frequent you do a water analysis?
o. What is the quality?
p. Depth of well? Capacity?
q. Pumping frequency?
r. Depth of the pump?
s. Power of the pump:
t. Static water level?
u. Rising pipe?
Usage of water (irrigation, domestic use, drinking.. others..)
XIV. Air Quality
a. Any unusual odours in the village prior to the conflict? No, sometimes from the
animal manures found in the farms hat are close to certain homes.
b. Indoor air quality? Ventilation, sunlight? Yes
Any unusual odors associated to refugees’ influx such as solid waste? No
Any noise or fuel burning smell related to electricity generators? Yes, smell and
noise
XV. Energy supply
a. What kind of lamps you have in your house? Normal, and there are few
energy saving lamps
b. What is the voltage of the lamps you use? 100W
c. How many hours per day you have electricity? 10 hrs
d. Range of your electricity bill?
e. Do you have electricity generators? Yes Power? 3000 watt

QUESTIONNAIRE-Surrounding Municipalities UNDP
Name of surveyor: Nadine Aoun Location: Mhammara
Date: 15/07/08
Prepared by ELARD 6
f. How many hours you operate the generator? 3 Hrs
g. What electrical equipment you have? Refrigerator/ TV/ hair dryer/ iron/
washing machines…
XVI. Other relevant information
a. Any damage was recorded in your village related to the NBC conflict? No
b. Any other problem regarding above mentioned topics? No
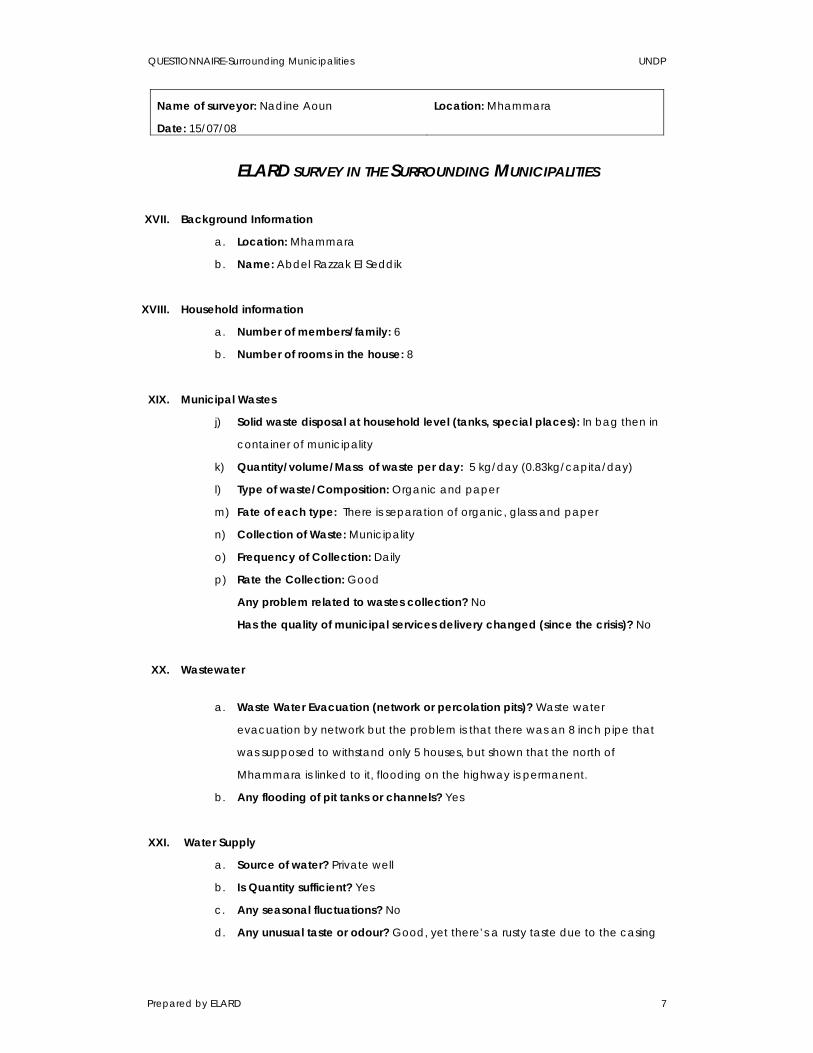
QUESTIONNAIRE-Surrounding Municipalities UNDP
Name of surveyor: Nadine Aoun Location: Mhammara
Date: 15/07/08
Prepared by ELARD 7
ELARD SURVEY IN THE SURROUNDING MUNICIPALITIES
XVII. Background Information
a. Location: Mhammara
b. Name: Abdel Razzak El Seddik
XVIII. Household information
a. Number of members/family: 6
b. Number of rooms in the house: 8
XIX. Municipal Wastes
j) Solid waste disposal at household level (tanks, special places): In bag then in
container of municipality
k) Quantity/volume/Mass of waste per day: 5 kg/day (0.83kg/capita/day)
l) Type of waste/Composition: Organic and paper
m) Fate of each type: There is separation of organic, glass and paper
n) Collection of Waste: Municipality
o) Frequency of Collection: Daily
p) Rate the Collection: Good
Any problem related to wastes collection? No
Has the quality of municipal services delivery changed (since the crisis)? No
XX. Wastewater
a. Waste Water Evacuation (network or percolation pits)? Waste water
evacuation by network but the problem is that there was an 8 inch pipe that
was supposed to withstand only 5 houses, but shown that the north of
Mhammara is linked to it, flooding on the highway is permanent.
b. Any flooding of pit tanks or channels? Yes
XXI. Water Supply
a. Source of water? Private well
b. Is Quantity sufficient? Yes
c. Any seasonal fluctuations? No
d. Any unusual taste or odour? Good, yet there’s a rusty taste due to the casing

QUESTIONNAIRE-Surrounding Municipalities UNDP
Name of surveyor: Nadine Aoun Location: Mhammara
Date: 15/07/08
Prepared by ELARD 8
Any major water leakages noted? At the Network and house level? No
e. How often you get the water reservoir refilled, if any? Always it’s automatic
f. Capacity of the water reservoir: 3000 L
Do you have automatic refilling system? Yes
g. Water usage (drinking, cleaning, cooking…)? Everything except drinking and
cooking
h. Do you use water abundantly in cleaning practices? Yes (1000-1500 L/day)
i. Was water supply prior to conflict sufficient if applicable? Same
j. Do you buy water? Yes drinking water or for domestic use? Yes
k. Do you have a private well? Yes
l. How frequent you do a water analysis? Every 3 months
m. What is the quality? Rusty
n. Depth of well? 35m Capacity? 1 inch
o. Pumping frequency? Permanently
p. Depth of the pump? 27m
q. Power of the pump: 2 HP
r. Static water level? 25m
s. Rising pipe? 0.5m
t. Usage of water (irrigation, domestic use, drinking.. others..): Everything except
drinking.
XXII. Air Quality
a. Any unusual odours in the village prior to the conflict? Mainly waste water
b. Indoor air quality? Ventilation, sunlight? Yes
Any unusual odors associated to refugees’ influx such as solid waste? No
Any noise or fuel burning smell related to electricity generators? No
XXIII. Energy supply
a. What kind of lamps you have in your house? Energy saving lamps
b. What is the voltage of the lamps you use? 100W
c. How many hours per day you have electricity? 10 hrs
d. Range of your electricity bill? 60,000 - 80,000 LL
e. Do you have electricity generators? Yes Power? 30 kva
f. How many hours you operate the generator? 10 hours

QUESTIONNAIRE-Surrounding Municipalities UNDP
Name of surveyor: Nadine Aoun Location: Mhammara
Date: 15/07/08
Prepared by ELARD 9
g. What electrical equipment you have? Refrigerator/TV/microwave/Vacuum
cleaner/hair dryer/AC
XXIV. Other relevant information
a. Any damage was recorded in your village related to the NBC conflict? Houses
b. Any other problem regarding above mentioned topics? Electricity, water
supply(water does not reach everybody due to the network)