Embed Size (px)
Citation preview

Republic of the Philippines
Department of Budget and Management 1
BUDGET PHILOSOPHY
AND REFORMS
The Proposed FY 2017 Budget

Republic of the Philippines
Department of Budget and Management 2
A Just and Disciplined Fiscal PolicyDeficit will expand to 3.0 percent of GDP over the Medium-Term to support expenditure priorities. Proposed FY 2017 disbursements will reach P2.9 Trillion, nearly twice the disbursements in 2010.
2

Republic of the Philippines
Department of Budget and Management 3
1,473.0 1,580.0
1,829.01,998,4 2,019.1
2,414.6
3,001.8
3,350.0
3,825.1
4,208.6
4,634.1
5,163.1
5,702.6
2010 2011 2012 2013 2014 2015 2016 2017 2018 2019 2020 2021 2022
Debt Burden
General Public Services
Defense
Social Services
Economic Services
Achieving Equitable ProsperitySpending for Social Services will expand from 7.7% Of GDP in 2016 to 9.1% of GDP by 2022. Economic Services will rise from 5.7% of GDP to 6.8% of GDP during this period. This will be possible with the decline of the Debt Burden and Gen Public Services, as a percent of GDP.
3

Republic of the Philippines
Department of Budget and Management 4
What you see is what you get (WYSWYG)Government underspending will be addressed through greater efforts in capacity building and public financial management (PFM) reforms.
Streamline process for
release and use of funds
Improve budget planning
and preparation alongside
agency capacity building
Compliance with
Supreme Court
decisions

Republic of the Philippines
Department of Budget and Management 5
Fast-tracking ImplementationIn order to overcome the underspending problem, a number of new measures will be undertaken.
24/7 construction work for major
infrastructure projects
Strengthening project monitoring
Simplification of the IRR of the
Government Procurement
Reform Law
Capacitating Cabinet Secretaries
and senior officials

Republic of the Philippines
Department of Budget and Management 6
Accountability to the PeopleThe budget will be transparent and participatory. Upholding the people’s right to information will allow them to hold the government accountable.
Issuance of Executive Order
No. 2, s. 2016, implementing the
proposed Freedom of Information Bill
Emphasis on transparency,
accountability, and civil society
participation.

Republic of the Philippines
Department of Budget and Management 7
LGUs as Able Partners in DevelopmentLocal Government Units (LGUs) will be strengthened in order to respond immediately and effectively to problems and deliver basic services and their mandates.
Capacity building for LGUs on
generating resources and delivering
basic services
Additional support to LGUs based
on implementation of higher good
governance standards

Republic of the Philippines
Department of Budget and Management 8
Governance and Budget ReformsReforms will be pursued to restore public trust in the government.
Budget Reform Act
Government Rightsizing
MUP Compensation and
Pension Reform

Republic of the Philippines
Department of Budget and Management 9
AGGREGATES AND
KEY DIMENSIONS
The Proposed FY 2017 Budget

Republic of the Philippines
Department of Budget and Management 10
2017 Budget Higher Than 2016
20162017
(Proposed)Growth
2016-2017
3,001.8 3,350.0 11.6%
IN BILLION PESOS

Republic of the Philippines
Department of Budget and Management 11
Top 10 Executive Departments
51.9%OF THE TOTAL
BUDGET FOR FY 2017
PHP 1,738.0BILLION 1. DEPED
P567.6 B16.9% Share
2. DPWH
P458.6 B13.7% Share
3. DILGP150.1 B
4.5%
7. DOTrP55.5 B
1.7%
5. DNDP134.5 B
4.0%
6. DSWDP129.9 B
3.9%
4. DOHP144.3 B
4.3%
9. DENRP29.4B
0.9%
10. DOFP23.0 B
0.7%
8. DAP45.3 B
1.4%

Republic of the Philippines
Department of Budget and Management 12
AMT RANK AMT RANK AMT %
DepEd 433.4 1 567.6 1 134.2 31.0%
DPWH 397.1 2 458.6 2 61.5 15.5%
DILG 125.4 3 150.1 3 24.7 19.7%
DOH 125.0 4 144.3 4 19.3 15.5%
DND 117.7 5 134.5 5 16.8 14.3%
DSWD 110.9 6 129.9 6 19.0 17.1%
DOTr 44.3 8 55.5 7 11.2 25.2%
DA 48.9 7 45.3 8 (3.7) -7.5%
DENR 22.3 9 29.4 9 7.1 31.9%
DOF 20.2 10 23.0 10 2.7 13.6%
TOTAL 1,445.2 1,738.0 292.8 20.3%
DEP'T2016 GAA 2017 NEP GROWTH
Top 10 Executive Departments

Republic of the Philippines
Department of Budget and Management 13
FY 2017 NG Budget, By Expense Class
Personnel
ServicesP997.0 billion, 29.8%
Maintenance
ExpendituresP534.5 billion, 16.0%
Debt BurdenP351.6 billion, 10.5%
Allocation to LGUs*P554.9 billion, 16.6%
Support to
GOCCsP131.5 billion, 3.9%
Infrastructure
and other Capital OutlaysP780.6 billion, 23.3%
Php3,350BILLION
*Includes other transfers to LGUs

Republic of the Philippines
Department of Budget and Management 14
NG Budget, By Sector
28%
37%
4%
17%
14%28%
40%
4%
17%
11%
Economic Services Social ServicesDefense General Public ServicesDebt Burden
2016 2017

Republic of the Philippines
Department of Budget and Management 15Republic of the Philippines
Department of Budget and Management 15
LGU Empowerment
1/ GAA levels
Particulars
Allotment to LGUs Php421.44 B Php485.83 B Php554.86 B
Internal Revenue Allotment Php389.86 B Php428.62 B Php486.89 B
Special Shares Php26.11 B Php35.92 B Php30.97 B
BODBF Php0.05 B Php0.05 B Php0.05 B
LGSF Php3.03 B Php19.08 B Php34.62 B
LGUs in the Proceeds of Fire Code Fees Php0.20 B Php0.20 B PHP 0.20 B
MMDA Php2.19 B Php1.96 B PHP 2.13 B
2016 20172015 1/
15

Republic of the Philippines
Department of Budget and Management 16Republic of the Philippines
Department of Budget and Management 16
Budget Level By RegionIN THOUSAND PESOS, UNLESS STATED OTHERWISE
2016 2017
Amount Percent
Total Regionalized Budget 1,769.3 2,221.9 452.6 104.1 58.9 66.3
NCR 445.7 519.3 73.6 16.5 14.8 15.5
LUZON 628.3 782.2 153.9 24.5 20.9 23.4
Region I 79.0 98.1 19.1 24.2 2.6 2.9
CAR 44.0 56.4 12.4 28.2 1.5 1.7
Region II 64.2 80.4 16.2 25.2 2.1 2.4
Region III 140.9 167.4 26.4 18.7 4.7 5.0
Region IV 203.7 259.1 55.5 27.2 6.8 7.7
Region V 96.5 120.8 24.3 25.2 3.2 3.6
VISAYAS 298.3 374.8 76.5 25.6 9.9 11.2
Region VI 109.3 139.0 29.6 27.1 3.6 4.1
Region VII 100.9 123.3 22.3 22.1 3.4 3.7
Region VIII 88.1 112.6 24.5 27.9 2.9 3.4
MINDANAO 396.9 545.5 148.6 37.4 13.2 16.3
Region IX 69.9 90.3 20.4 29.2 2.3 2.7
Region X 84.0 116.9 32.9 39.2 2.8 3.5
Region XI 69.9 108.3 38.4 54.8 2.3 3.2
Region XII 65.8 97.2 31.4 47.6 2.2 2.9
CARAGA 53.5 76.7 23.2 43.4 1.8 2.3
ARMM 53.7 56.0 2.3 4.3 1.8 1.7
Non-Regionalized 1,232.5 1,128.1 (104.4) (8.5) 41.1 33.7
Nationwide 747.7 718.1 (29.5) (4.0) 24.9 21.4
Central Office 484.8 409.9 (74.9) (15.4) 16.2 12.2
TOTAL 3,001.8 3,350.0 348.2 11.6 100.0 100.0
GAA As Adjusted
PARTICULARS
Increase/(Decrease)
2016-2017
Share to Budget
2016 2017
Republic of the Philippines
Department of Budget and Management 17Republic of the Philippines
Department of Budget and Management 17
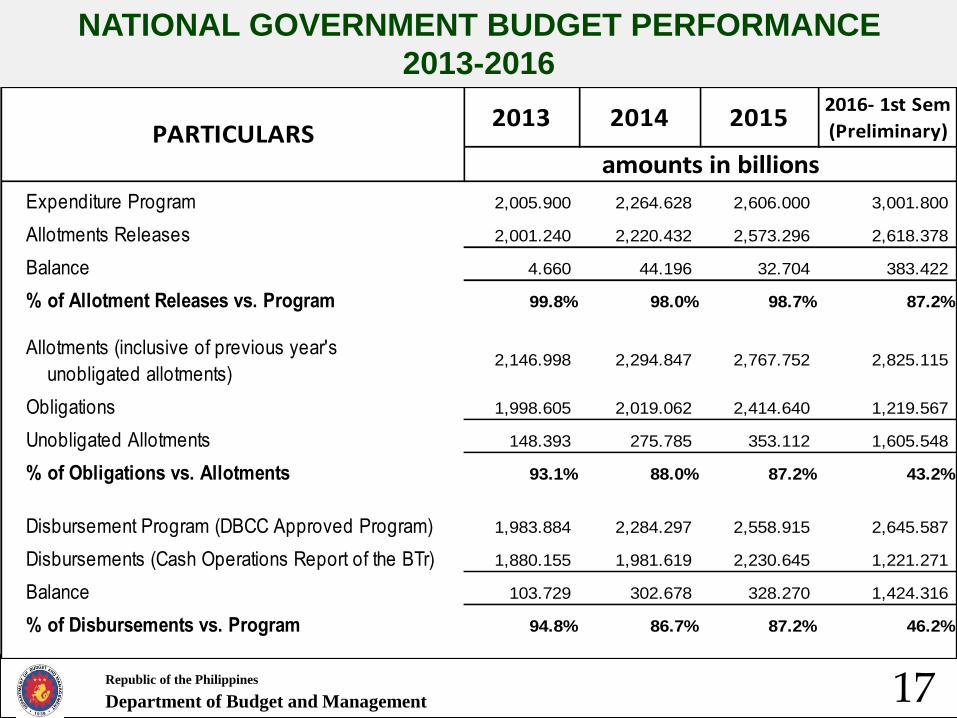
2013 2014 20152016- 1st Sem
(Preliminary)
Expenditure Program 2,005.900 2,264.628 2,606.000 3,001.800
Allotments Releases 2,001.240 2,220.432 2,573.296 2,618.378
Balance 4.660 44.196 32.704 383.422
% of Allotment Releases vs. Program 99.8% 98.0% 98.7% 87.2%
Allotments (inclusive of previous year's
unobligated allotments) 2,146.998 2,294.847 2,767.752 2,825.115
Obligations 1,998.605 2,019.062 2,414.640 1,219.567
Unobligated Allotments 148.393 275.785 353.112 1,605.548
% of Obligations vs. Allotments 93.1% 88.0% 87.2% 43.2%
Disbursement Program (DBCC Approved Program) 1,983.884 2,284.297 2,558.915 2,645.587
Disbursements (Cash Operations Report of the BTr) 1,880.155 1,981.619 2,230.645 1,221.271
Balance 103.729 302.678 328.270 1,424.316
% of Disbursements vs. Program 94.8% 86.7% 87.2% 46.2%
amounts in billionsPARTICULARS
NATIONAL GOVERNMENT BUDGET PERFORMANCE
2013-2016