Embed Size (px)
Citation preview
Review ArticleThe Proportion of Regulatory T Cells in Patients with AnkylosingSpondylitis: A Meta-Analysis
Na-Lin Lai ,1 Sheng-Xiao Zhang ,1 Jia Wang ,1 Jia-Qian Zhang,1 Cai-Hong Wang ,1
Chong Gao,2 and Xiao-Feng Li 1
1Department of Rheumatology, The Second Hospital of Shanxi Medical University, 382 Wuyi Road, Taiyuan, Shanxi 030001, China2Department of Pathology, Brigham and Women’s Hospital, Harvard Medical School, Boston, MA, USA
Correspondence should be addressed to Xiao-Feng Li; [email protected]
Received 24 March 2019; Revised 19 July 2019; Accepted 30 August 2019; Published 23 October 2019
Academic Editor: Nejat K. Egilmez
Copyright © 2019 Na-Lin Lai et al. This is an open access article distributed under the Creative Commons Attribution License,which permits unrestricted use, distribution, and reproduction in any medium, provided the original work is properly cited.
Objective. Accumulating evidence indicates that regulatory T cells (Tregs) may be involved in the pathogenesis of ankylosingspondylitis (AS). As different markers have been used to identify Tregs, some studies on the proportions of Tregs in AS patientshave generated considerable controversy. To clarify the status of Tregs in such patients, we determine the proportion changes ofperipheral Tregs during development of the disease, with different cellular markers. Methods. We systematically searchedEmbase, PubMed, Cochrane, Web of Knowledge, FDA.gov, and Clinical Trials.gov for the studies reporting the proportion ofTregs in AS patients. Using the PRISMA guidelines, we performed a random-effects meta-analysis of the frequencies ofperipheral Tregs defined in different ways. Inconsistency was evaluated using the I-squared index (I2), and publication bias wasassessed by examining funnel plot asymmetry using the Begger and Egger tests. Results. A total 29 studies involving 1732participants were included in the meta-analysis. Their conclusions of using the diversity of Tregs surface markers wereinconsistent with each other. No significant difference in the proportions of Tregs was evident regardless of the definitions used[−0.709, (−1.455, 0.037, p = 0:063), I2 = 97:3%]. Six studies used “single CD25-positive” cells as Tregs, which revealed a significantincrease in AS patients compared with healthy blood donors [0.736, (0.138, 1.334), p = 0:016, I2 = 80:7%]. Notably, the proportionsof “CD4+CD25+FOXP3+,” “CD4+CD25highCD127low/−,” or “CD4+CD25+CD127low” T cells were lower in AS patients [−2.856,(−4.645, −1.066), p = 0:002; −1.812, (−2.648, −0.977), p < 0:001; −1.12, (−1.605, −0.635), p < 0:001]. Tregs defined as “CD25high,”“CD25bright,” “CD25bright/highCD127low/−,” “CD4+FOXP3+,” “CD4+CD25highFOXP3+,” and “CD4+CD25+CD127−” did not differ inproportion between AS patients and healthy blood donors. Conclusions. The levels of Tregs varied based on the cellularidentification markers used. The proportions of CD4+CD25+FOXP3+Tregs, CD4+CD25highCD127low/−, or CD4+CD25+CD127low
in blood of AS patients were significantly decreased as compared with those in healthy blood donors, and our findings lendsupport to the idea that the Treg status of AS patients is important. And we recommend the above as the best definition of Tregswhen evaluating the status of such patients.
1. Introduction
Ankylosing spondylitis (AS) is a common inflammatoryrheumatic disease that affects the axial skeleton, causingcharacteristic inflammatory back pain, asymmetrical periph-eral oligoarthritis, enthesitis, and specific organ involvementsuch as anterior uveitis, psoriasis, and chronic inflammatorybowel disease, which can lead to structural and functionalimpairments and a decrease in quality of life [1]. To date,the disease etiology remains unclear. Reduced proportion
and deficient function of CD4+ regulatory T cells (Tregs, withimmune modulation and suppression) have been implicatedin the pathogenesis of different immune-mediated rheumaticdiseases [2–4]. In the case of AS, few studies have been car-ried out to analyze the levels of Tregs in the peripheral bloodof patients; however, low percentages [5–8] or functionalimpairment of Tregs [9, 10] has been reported in the periph-eral blood (PB) of patients with AS, suggesting an imbalancebetween Tregs and the adaptive immune response. More-over, AS patients treated with anti-TNF therapy showed
HindawiJournal of Immunology ResearchVolume 2019, Article ID 1058738, 11 pageshttps://doi.org/10.1155/2019/1058738

similar levels of Treg cells to those observed in healthy sub-jects [11]. These data suggest a possible role of Tregs in AS.
However, initial studies of Treg status in PB of patientswith AS are controversial. One reason for the inconsistenciesmay be the multiple phenotypes of Tregs, which have beenidentified using different markers [12]. Tregs were firstdescribed as a peripheral CD4+ subset expressing interleu-kin- (IL-) 2 receptor alpha chains (CD25) [13]. As early as2004, Cao et al. [14] used CD4+CD25bright to identify periph-eral Tregs in peripheral blood of AS patients. However, CD25was expressed not only on Tregs but also on activated cellslacking regulatory functions, although the CD4+ T cell subsetexpressed the highest levels of CD25 (CD4+, CD25high) andexhibited in vitro immunosuppressive features [15]. Fork-head box protein P3 (FOXP3), a transcription factorexpressed at high levels in authentic Tregs, plays a key rolein Treg development and is thought to be one of the mostspecific Treg cell markers [16]. Since 2008, scholars havebeen studying the proportion and function of peripheralFOXP3+Tregs of AS patients [9, 17]. However, the markercannot be used to sort live cells, as the protein is intracellular.In addition, CD127, the alpha chain of the IL-7 receptor, wasreported to be upregulated on human T cells after activa-tion and downregulated on Tregs [18]. Thus, costainingfor CD127 and CD25 has been proposed to efficiently dis-criminate between Tregs and activated T cells [19]. The studyof CD4+CD25+CD127−Tregs in AS patients began in 2011.Zhao et al. used CD25+CD127− to define peripheral Tregsin new-onset AS patients firstly [6]. Furthermore, CD8+-
CD122+ T cell is a newly discovered natural immune regula-tory T cells with immune negative regulation function [20],which may be involved in the pathogenesis and disease pro-gression of AS [21]. The available data on the proportionsand phenotypes of Tregs of AS patients are contradictory;some studies using the same or different markers to analyzeperipheral Tregs of AS patients have obtained different oreven opposite results [22–25].
To better understand Treg malfunctions in patientswith AS, we meta-analyzed reports documenting the pro-portion of peripheral Treg cells among CD4+ T cells inthe PB of patients with AS, as well as healthy blood donorsin this study.
2. Methods
2.1. Data Sources and Searches. This meta-analysis was con-sistent with that of the Preferred Reporting Items for System-atic Reviews and Meta-Analyses (PRISMA) Statement, and ithad been registered at the International Prospective Registerof Systematic Reviews (PROSPERO) (CRD42019120790).We searched for relevant studies published between January1, 1950, and November 1, 2018, using PubMed, Embase,Cochrane, Web of Knowledge, Clinical Trials.gov, and FDA.-gov, with no restrictions in terms of the primary outcome orpublication language. We used the MeSH terms “Spondylitis,Ankylosing” and “T−lymphocytes, regulatory” and theircombination. All potentially eligible studies were consideredexcept for reviews and murine experiments. Key articleslisted in the references were retrieved manually.
2.2. Study Selection and Data Extraction. The inclusion cri-teria were evaluation of the proportion of Tregs amongCD4+ T cells of AS patients using the 1984 Modified NewYork AS Criteria [26], available as a full text article, andinformation on the number of patients and healthy blooddonors. Two investigators independently selected and identi-fied relevant publications, and a third investigator resolvedany disagreements. The evidence levels of the studies wereassessed based on the 2011 guidelines of the Oxford Centrefor Evidence-Based Medicine. Quality assessment was donewith the Newcastle-Ottawa Quality Assessment Scale, whichcan be used to assess the quality of nonrandomized studies.
We recorded patient baseline characteristics and theircountry of origin, the year of publication, the number ofpatients and healthy blood donors, the definition of Tregs used(including CD4+CD25+, CD4+CD25bright, CD4+CD25high,CD25low/−FOXP3+, FOXP3+, CD25+FOXP3+, CD25high
FOXP3+, CD25+CD127−, CD25bright/highCD127low/−, andCD25highCD127low/−FOXP3+), and the mean (or median)and standard deviation (SD) of the proportion of Tregs amongCD4+ T cells. Data on the proportion of Tregs in patients withHLA-B27(+) and HLA-B27(−) were also extracted.
2.3. Statistical Analysis. For continuous outcomes (the pro-portions of Tregs among CD4+/CD8+ T cells of patients withAS and healthy blood donors), we calculated standard-ized mean differences (SMDs) and compared these valuesby using a random-effects model (REM) (the DerSimonianand Laird method) [27]. When Treg percentages werereported as medians with interquartile ranges (IQRs), wecalculated means and SD (SD = IQR/1.35). The Cochranechi-squared test was used to explore between-study hetero-geneity. As heterogeneity was high (I2 > 75%), we drewforest plots and performed subgroup analyses to explorethe possible effects of study characteristics on outcomes.Publication bias was assessed by examining funnel plotasymmetry using the Begger and Egger tests (p ≥ 0:05). Apreplanned sensitivity analysis was performed by omittingeach study individually and calculating the remainingpooled effect. All statistical analyses were conducted usingStata software (ver. 12.0).
3. Results
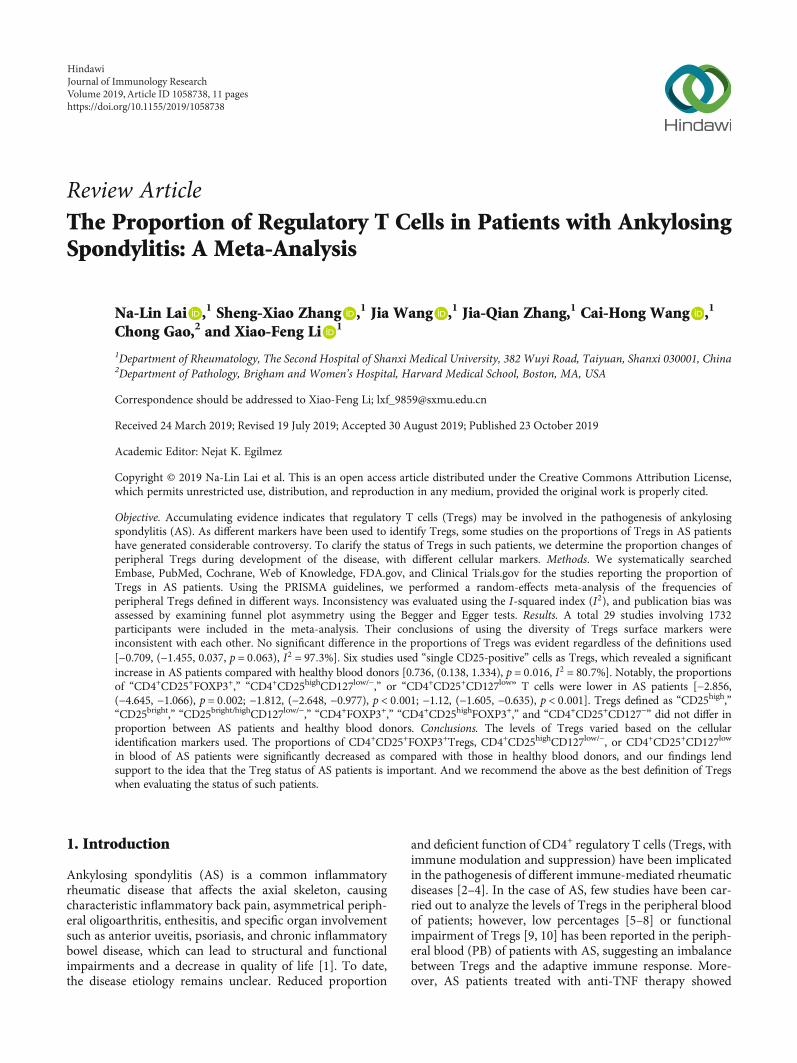
3.1. Study Characteristics. We identified 564 studies. And29 of them (with data on 980 patients and 752 healthyblood donors) were included in the analysis (Figure 1), andall of them used a reliable flow cytometric analysis todetect the proportions of peripheral Tregs. The details areshown in Table 1. The average age of the AS patients wasbetween 24.8 and 52.13 years, the proportion of males rangedfrom 0 to 100%, the average disease duration was from 1.6 to13.3 years, the average erythrocyte sedimentation rate (ESR)was from 15.2 to 57.3mm/hour, the average C-reactive pro-tein (CRP) was from 6.63 to 77.1mg/l, and the Bath Ankylos-ing Spondylitis Disease Activity Index (BASDAI) [28] fromwas 1.19 to 51.94. Patients were treated with glucocorticoids,NSAIDs, DMARDs, immunosuppressants including cyclo-phosphamide (CTX) and cyclosporine, and biological agents.
2 Journal of Immunology Research
All healthy blood donors were age and sex matched, healthy,and without any autoimmune disease. All studies were poor-quality case-control studies or case series; thus, they were allof evidence level 4. We regarded all studies as case-controlstudies and scored them using the Newcastle-Ottawa QualityAssessment Scale (NOQAS); all studies had a score of 3–5.
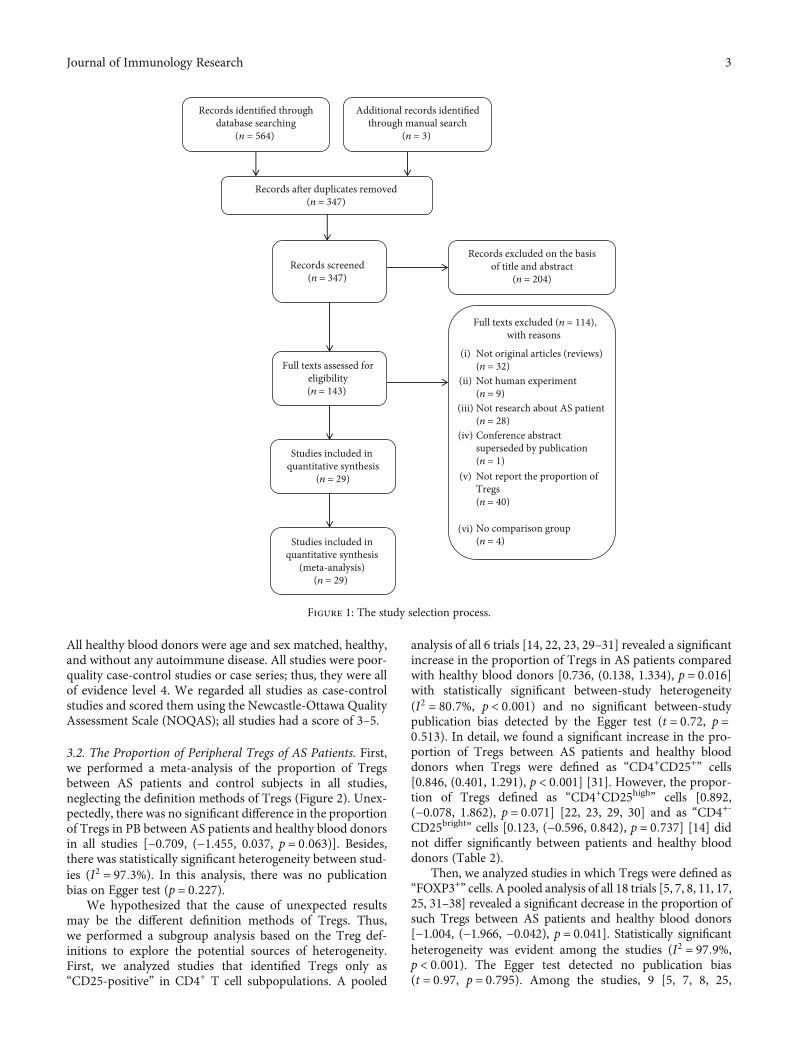
3.2. The Proportion of Peripheral Tregs of AS Patients. First,we performed a meta-analysis of the proportion of Tregsbetween AS patients and control subjects in all studies,neglecting the definition methods of Tregs (Figure 2). Unex-pectedly, there was no significant difference in the proportionof Tregs in PB between AS patients and healthy blood donorsin all studies [−0.709, (−1.455, 0.037, p = 0:063)]. Besides,there was statistically significant heterogeneity between stud-ies (I2 = 97:3%). In this analysis, there was no publicationbias on Egger test (p = 0:227).
We hypothesized that the cause of unexpected resultsmay be the different definition methods of Tregs. Thus,we performed a subgroup analysis based on the Treg def-initions to explore the potential sources of heterogeneity.First, we analyzed studies that identified Tregs only as“CD25-positive” in CD4+ T cell subpopulations. A pooled
analysis of all 6 trials [14, 22, 23, 29–31] revealed a significantincrease in the proportion of Tregs in AS patients comparedwith healthy blood donors [0.736, (0.138, 1.334), p = 0:016]with statistically significant between-study heterogeneity(I2 = 80:7%, p < 0:001) and no significant between-studypublication bias detected by the Egger test (t = 0:72, p =0:513). In detail, we found a significant increase in the pro-portion of Tregs between AS patients and healthy blooddonors when Tregs were defined as “CD4+CD25+” cells[0.846, (0.401, 1.291), p < 0:001] [31]. However, the propor-tion of Tregs defined as “CD4+CD25high” cells [0.892,(−0.078, 1.862), p = 0:071] [22, 23, 29, 30] and as “CD4+-
CD25bright” cells [0.123, (−0.596, 0.842), p = 0:737] [14] didnot differ significantly between patients and healthy blooddonors (Table 2).
Then, we analyzed studies in which Tregs were defined as“FOXP3+” cells. A pooled analysis of all 18 trials [5, 7, 8, 11, 17,25, 31–38] revealed a significant decrease in the proportion ofsuch Tregs between AS patients and healthy blood donors[−1.004, (−1.966, −0.042), p = 0:041]. Statistically significantheterogeneity was evident among the studies (I2 = 97:9%,p < 0:001). The Egger test detected no publication bias(t = 0:97, p = 0:795). Among the studies, 9 [5, 7, 8, 25,
Studies included inquantitative synthesis
(meta-analysis)(n = 29)
Records identified throughdatabase searching
(n = 564)
Records after duplicates removed(n = 347)
Records screened(n = 347)
Full texts assessed foreligibility(n = 143)
Studies included in quantitative synthesis
(n = 29)
Additional records identifiedthrough manual search
(n = 3)
Records excluded on the basisof title and abstract
(n = 204)
Full texts excluded (n = 114),with reasons
Not original articles (reviews)(n = 32) Not human experiment(n = 9)Not research about AS patient(n = 28)Conference abstractsuperseded by publication(n = 1)Not report the proportion ofTregs(n = 40)
No comparison group(n = 4)
(i)
(ii)
(iii)
(iv)
(v)
(vi)
Figure 1: The study selection process.
3Journal of Immunology Research

31, 32, 34, 35, 38] used “CD4+CD25+FOXP3+” to defineTregs, which showed that the proportion of Tregs in ASpatients appeared to be lower than in healthy blooddonors [−2.856, (−4.645, −1.066), p = 0:002]. However,pooling of these data with those of other studies [17, 31]identifying Tregs as “CD4+CD25low/−FOPX3+” cells revealeda higher proportion of Tregs in patients than in healthy blooddonors [0.683, (0.161, 1.206), p = 0:01]. Tregs were identified
as simply “FOXP3+” cells [11, 33, 37]; and “CD25highFOXP3+”cells [9, 17, 36] [0.383, (−0.663, 1.429), p = 0:473; 0.868,(−0.756, 2.492), p = 0:295] were not shown to be significantlydifferent between patients and healthy blood donors (Table 2).
Finally, the other four groups [6, 39–41] that used“CD127-negative” in CD4+ T cell subgroups to define Tregsshowed that such cell numbers decreased in AS patients[−1.003, (−1.713, −0.294), p = 0:006] with statistical
Table 1: Characteristics of the individual studies included in the meta-analysis.
Author (ref.)Publishyear
Country ELaQb
Casenumbers Tregs’ definition
% of Tregs among CD4+ T cells[mean (or median)± SD]
AS HC AS HD p
Duojia Cao et al. [14] 2004 Sweden 4 6 10 29 CD25brightCD4+ 1:31 ± 0:68 1:23 ± 0:64 ns
Jau-Ling Suen et al. [17] 2008Taiwan,China
4 6 23 36 CD4+CD25highFOXP3+ 0:97 ± 0:33 0:86 ± 0:39 ns
Éric Toussirot et al. [32] 2009 France 4 6 32 15 CD4+CD25+FOXP3+ 8:2 ± 0:61 7:94 ± 1:04 ns
Frauke Forger et al. [29] 2009 Swiss 4 7 15 18 CD4+CD25high 2:22 ± 1:47 2:12 ± 1:42 <0.01Francesco Ciccia et al. [22] 2010 Italy 4 8 18 15 CD4+CD25high 1:08 ± 0:4 0:25 ± 0:12 <0.05Christian Dejaco et al. [23] 2010 Austria 4 5 22 17 CD4+CD25high 13:54 ± 16:55 3:08 ± 2:48 ns
Heiner Appel et al. [33] 2011 Germany 4 6 19 20 CD4+FOXP3+ 5:55 ± 2:54 5:18 ± 1:99 ns
Ming-Han Chen et al. [30] 2011Taiwan,China
4 7 23 25 CD4+CD25high+ 2:18 ± 0:11 2:16 ± 0:1 ns
Yanfeng Wu et al. [5] 2011 China 4 8 51 49 CD4+CD25+FOXP3+ 1:23 ± 0:13 2:56 ± 0:16 <0.001S-S Zhao et al. [6] 2011 China 4 8 14 18 CD4+CD25highCD127low/− 0:57 ± 0:29 1:65 ± 0:75 <0.001
Katayoon Bidad et al. [46] 2012 Iran 4 7 18 18CD4+FOXP3+
RORγt−Tbet−9:7 ± 1:2 16:1 ± 3 0.048
Leonardo Limon-Camachoet al. [11]
2012 Mexico 4 5 39 25 CD4+FOXP3+ 7:3 ± 1:3 5:3 ± 1:7 0.01
Yong Gao et al. [34] 2012 China 4 8 40 37 CD4+CD25+FOXP3+ 3:77 ± 0:81 4:69 ± 1:23 <0.05Li Xueyi et al. [7] 2013 China 4 6 222 68 CD4+CD25+FOXP3+ 2:14 ± 0:44 4:99 ± 0:49 <0.001Lingying Ye et al. [62] 2013 China 4 6 21 22 CD4+CD45RO+FOXP3high 0:48 ± 0:07 0:73 ± 0:07 <0.05Wei Ji et al. [39] 2014 China 4 7 20 20 CD4+CD25+CD127low 40:1 ± 17:5 58:6 ± 10:2 <0.05Zhang Xin et al. [8] 2014 China 4 5 10 10 CD4+CD25+FOXP3+ 2:72 ± 0:26 5:17 ± 0:31 <0.001
Hsien-Tzung Liao et al. [31] 2015Taiwan,China
4 8 69 30 CD4+CD25+FOXP3+ 1:73 ± 1:08 1:51 ± 0:48 <0.001
Yuxing Shan et al. [24] 2015 China 4 6 20 10 CD4+FOXP3+CXCR5+ 5:57 ± 1:28 3:08 ± 0:59 <0.0001Chenggong Wang et al. [35] 2015 China 4 6 45 20 CD4+CD25+FOXP3+ 1:81 ± 0:81 1:23 ± 0:52 ns
Elliott TJ Dunn et al. [36] 2016New
Zealand4 7 6 10 CD4+FOXP3+CD25high 1:43 ± 0:37 0:43 ± 0:15 ns
Huifang Guo et al. [9] 2016 China 4 8 39 17 CD4+CD25highFOXP3+ 5:62 ± 0:4 5:89 ± 0:2 ns
Zhongliang Duan et al. [40] 2017 China 4 7 21 16 CD4+CD25+CD127low 2:7 ± 0:8 3:47 ± 0:83 0.03
Zofia Gula et al. [37] 2017 Poland 4 7 48 23 CD4+FOXP3+ 28:83 ± 11:71 34:39 ± 20:65 ns
Dan Xu et al. [25] 2017 China 4 7 17 93 CD4+CD25+FOXP3+ 22:58 ± 12:8 35:57 ± 6:48 <0.01
Mingfei Wang et al. [10] 2018 China 4 7 26 26CD4+CD25+
FOXP3+CD127−6:32 ± 1:5 5:44 ± 1:02 <0.05
Mohammad JavadFattahietal [38].
2018 Iran 4 7 30 15 CD4+CD25+FOXP3+ 2:7 ± 0:23 3:3 ± 0:47 0.45
Renfang Han et al. [21] 2018 China 4 6 40 40 CD8+CD122+ 10:72 ± 6:32 1:21 ± 0:82 <0.05Sonja Dulic et al. [41] 2018 Hungary 4 8 22 10 CD4+CD25+CD127– 5:708 ± 2:05 5:715 ± 0:79 ns
AS: ankylosing spondylitis; HD: healthy donors. aEvidence level (EL) of each study was based on Oxford Centre for Evidence-Based Medicine 2011. bQuality (Q) of each study was based on the Newcastle-Ottawa Quality.
4 Journal of Immunology Research

heterogeneity (I2 = 73:1%, p = 0:011) and no publication bias(t = −0:37, p = 0:747). More specifically, pooling the data ofstudies in which Tregs were identified as “CD4+-
CD25highCD127low/−” cells [6] and “CD4+CD25+CD127low”cells [39, 40] revealed a significant decrease between ASpatients and healthy blood donors [−1.812, (−2.648,−0.977), p < 0:001; −1.12, (−1.605, −0.635), p < 0:001], butno significant difference was observed when Tregs weredefined as “CD4+CD25+CD127−” cells [−0.004, (−0.751,0.744), p = 0:992] [41] (Table 2).
Due to the heterogeneity in the meta-analysis, therandom-effects model was applied in preparing forestplots. We hypothesized that the significant heterogeneitymight have been caused by differences in the experimentalmethods, and clinical type and severity of disease amongthe different studies.
3.3. Disease Activity and the Proportion of Tregs in PB. Tofurther assess the effect of disease activity, we analyzed 2
studies [9, 21] that reported the proportion of Tregs in activeand stable AS patients regardless of the Tregs definitions used(Figure 3). All of these 2 studies used the Ankylosing Spondy-litis Disease Activity Score (ASDAS) [42–44] to evaluate thedisease activity. Guo H. et al. [9] found no significant differ-ences in the percentages of Tregs among patients with activeAS and patients with stable AS, but Han R. et al. [21] showeda significant increase. We found no difference in the propor-tion of Tregs in patients with active compared with stable AS[−0.234, (−3.267, 2.799), p = 0:880]. The heterogeneity, asassessed by the I2 statistic, was 95.3% (p < 0:0001).
4. Discussion
It is now widely accepted that Treg cells play a key role in themaintenance of immune tolerance and homeostasis [3, 45].However, the role of Tregs in peripheral immune tolerancein patients with AS has not been fully elucidated in previousstudies [7, 21, 31]. During the process, the markers used in
Note: weights are from a random-effects analysis
Overall (I−squared = 97.3%, p = 0.000)
Zofia Gula et al. [37]
Hsien−Tzung Liao et al. [31]
Chenggong Wang et al. [35]
Katayoon Bidad et al. [46]
Lingying Ye et al. [62]Li Xueyi et al. [7]Yong Gao et al. [34]
Mingfei Wang et al. [10]
Christian Dejaco et al. [23]
Mohammad Javad Fattahietal. [38]
Frauke Forger et al. [29]
Sonja Dulic et al. [41]
Jau−Ling Suen et al. [17]
Huifang Guo et al. [9]
Zhang Xin et al. [8]
Yuxing Shan et al. [24]
Zhongliang Duan et al. [40]
Renfang Han et al. [21]
Elliott TJ Dunn et al. [36]
Ming−Han Chen et al. [30]
Éric Toussirot et al. [32]
Duojia Cao et al. [14]
Wei Ji et al. [39]
Francesco Ciccia et al. [22]
Yanfeng Wu et al. [5]
Heiner Appel et al. [33]
StudyID
Leonardo Limon−Camacho et al. [11]
S−S Zhao et al. [6]
Dan Xu et al. [25]
–0.71 (–1.46, 0.04)
–0.37 (–0.87, 0.13)
0.23 (–0.20, 0.66)
0.79 (0.24, 1.33)
–2.80 (–3.73, –1.87)
–3.57 (–4.55, –2.59)–6.30 (–6.89, –5.72)–0.89 (–1.36, –0.42)
0.69 (0.13, 1.25)
0.83 (0.17, 1.49)
–2.12 (–2.88, –1.35)
0.07 (–0.62, 0.75)
–0.00 (–0.75, 0.74)
1.18 (0.61, 1.74)
–0.77 (–1.35, –0.18)
–8.56 (–11.50, –5.63)
2.25 (1.29, 3.21)
–0.95 (–1.63, –0.26)
2.11 (1.56, 2.66)
3.97 (2.19, 5.76)
0.19 (–0.38, 0.76)
0.34 (–0.28, 0.95)
0.12 (–0.60, 0.84)
–1.29 (–1.98, –0.61)
2.70 (1.74, 3.66)
–9.14 (–10.48, –7.80)
0.16 (–0.47, 0.79)
1.36 (0.81, 1.92)
–1.81 (–2.65, –0.98)
–1.68 (–2.24, –1.11)
100.00
3.56
3.58
3.55
3.43
3.413.543.57
3.55
3.52
3.49
3.52
3.50
3.55
3.54
2.32
3.42
3.52
3.55
3.00
3.55
3.54
3.51
3.52
3.42
3.24
3.53
%weight
3.55
3.47
3.55
SMD (95% CI)
3.00
3.55
0–11.5 11.5
Figure 2: Forest plot of the overall meta-analysis of regulatory T cell (Treg) proportions in peripheral blood (PB), regardless of the Tregdefinitions used, between ankylosing spondylitis (AS) patients and healthy blood donors (HD).
5Journal of Immunology Research

the identification of Tregs are inconsistent by flow cytometryin previous studies; therefore, the proportion of peripheralTreg of AS patients has always been reported controversially[5, 24, 29, 46]. Our overall meta-analysis found no significantdifference in Treg proportions between patients and healthyblood donors, although significant between-study heteroge-neity was evident. We considered that the primary reasonsfor such unexpected results were due to inconsistent defini-tions of Tregs based on diverse markers used; thus, we suba-nalyzed the Treg data by the markers used for Tregidentification, including CD25, FOXP3, and CD127.
Currently, researches on Tregs mainly focus on CD4+-
Tregs. Expression of CD25 (α chain of family IL-2R) correlatespositively with Treg functionality [47]. The Treg-suppressive
capacity is restricted to the CD4+ T cells that express thehighest levels of CD25 [48]. We found out that AS patientshad a higher proportion of Tregs termed “single CD25-positive” than had healthy blood donors. However, whenTregs were defined as “CD4+CD25high” or “CD4+CD25bright,”no significant differences were found between AS patientsand healthy blood donors. And other activated CD4+ T cellsalso express CD25 [45, 48], indicating that use of the surfacemarker CD25 alone is inadequate. In 2008, Han G. et al. [49]found out that CD25high cells that included a large propor-tion of FOXP3− cells could not be classified as Tregs. Theexpressions of the transcription factor FOXP3 or othermarkers are considered more specific for the identificationof Tregs than CD25 [50].
Table 2: Subgroup analysis based on different definitions of Tregs in PB of patients with AS.
Definition of Tregs Number of studiesTest of association
Test ofheterogeneity
Egger’s test
SMD 95% CI p value I2 p value t p value
Single CD25-positive 6 0.736 (0.138, 1.334) 0.016 80.7% <0.001 0.72 0.513
CD4+CD25+ 1 0.846 (0.401, 1.291) <0.001 – – – –
CD4+CD25high 4 0.892 (−0.078, 1.862) 0.071 87% <0.001 2.74 0.112
CD4+CD25bright 1 0.123 (−0.596, 0.842) 0.737 – – – –
Associated with FOXP3-positive 18 −1.004 (−1.966, −0.042) 0.041 97.9% <0.001 0.97 0.795
CD4+FOXP3+ 3 0.383 (−0.663, 1.429) 0.473 90.4% <0.001 −11.62 0.143
CD4+CD25+FOXP3+ 9 −2.856 (−4.645, −1.066) 0.002 98.6% <0.001 6.06 0.42
CD4+CD25highFOXP3+ 3 0.868 (−0.756, 2.492) 0.295 92.6% <0.001 2.91 0.862
CD4+CD25low/−FOPX3+ 3 0.683 (0.161, 1.206) 0.01 68.4% 0.042 9.58 0.783
Associated with CD127-negative 4 −1.003 (−1.713, −0.294) 0.006 73.1% 0.011 −0.37 0.747
CD4+CD25highCD127low/− 1 −1.812 (−2.648, −0.977) <0.001 – – – –
CD4+CD25+CD127low 2 −1.12 (−1.605, −0.635) <0.001 0.0% 0.486 – –
CD4+CD25+CD127− 1 −0.004 (−0.751, 0.744) 0.992 – – – –
PB: peripheral blood; AS: ankylosing spondylitis; SMD: standard mean difference; CI: confidence interval; I2: I-squared index. Magnitude of Cohen’s d effectsize (SMD): 0.2–0.5, small effect; 0.5–0.8, medium effect; and ≥0.8, large effect.
Note: weights are from a random-effects analysis
Overall (I−squared = 95.3%, p = 0.000)
StudyID
Huifang Guo et al. [9]
Renfang Han et al. [21]
–0.23 (–3.27, 2.80)
SMD (95% CI)
–1.76 (–2.50, –1.01)
1.34 (0.26, 2.42)
100.00
%weight
50.82
49.18
0–3.27 3.27
Figure 3: Forest plot of the overall meta-analysis of regulatory T cell (Treg) proportions in peripheral blood (PB), regardless of the Tregdefinition used, in patients with active and stable AS.
6 Journal of Immunology Research

FOXP3 is a pivotal regulator of Treg fictional geneexpression, being required for both Treg generation and sur-vival [51]. The mutations of the FOXP3 gene disturb thefunction of Tregs, therefore resulting in the developmentof various autoimmune diseases [52]. Decreased FOXP3expression causes an immune disease by subverting the sup-pressive function of Treg cells and converting Treg cells intoeffector cells [53]. However, when Tregs were defined as“FOXP3-positive” cells, the proportions of such cells didnot differ between AS patients and healthy blood donorsbecause the definitions of Tregs were complicated by theaddition of CD25 status, giving “CD25-negative andFOXP3-positive” and “CD25 and FOXP3 double positive.”We also found that AS patients had a higher proportion ofTregs termed “CD4+CD25low/−FOXP3+” than had healthyblood donors. This phenomenon may be explained by thefindings that the CD4+CD25low/−FOPX3+ cells were dysfunc-tional Tregs [54, 55] and may even be previously activatedconventional T cells [56].
However, the detection of FOXP3 requires cell perme-abilization, thereby preventing isolation of viable Tregs. Sub-sequently, the extracellular marker CD127 was establishedfor the identification of Tregs [57–59]. Some scholars believethat CD4+CD25+CD127low/− is the best surface marker ofnatural Tregs and alive Tregs, which not only can avoid inter-ference of other activated T cells, but can also be used to con-duct preliminary functional studies [19]. We found that theratio of “CD127-negative” in peripheral blood of patientswith AS was significantly lower than that of the controlgroup, further suggesting that CD127 combined with othermarkers could indeed be used to label Tregs.
CD8+Tregs are similar to CD4+Treg and also haveimmunomodulatory effects. However, due to the lack of spe-cific surface markers, few studies have been conducted onCD8+Treg [60, 61]. In 2015, Churland G. et al. [61] havefound that the proportion of CD8+Tregs in the peripheralblood of healthy people is less than one-tenth of that ofCD4+Tregs, which makes the study of CD8+Tregs more dif-ficult. In this study, we found that only one study [21]reported the expression of CD8+Treg in peripheral blood ofpatients with AS, and a comprehensive analysis showed thatthere was a higher proportion of CD8+Treg in AS group thanin the healthy control group. The specific marker, expression,and function of CD8+Treg need further study.
Some studies have used other markers to indicate differ-ent subsets of Tregs [24, 46, 62]. Human FOXP3+ cells havebeen subdivided into three functionally and phenotypi-cally distinct subsets [63]: naïve Tregs (FOXP3+CD45RA+),short-lived and highly suppressive activated Tregs (FOX-P3highCD45RA−), and non-Tregs (FOXP3low CD45RA−).Although human naturally occurring Tregs may expresseither CD45RA or CD45RO, the majority of natural Tregsin adults are CD45RO+, which increases significantly withage [64, 65]. Ye L. et al. [62] found that in AS patients, the fre-quencies of effector Tregs (CD4+FOXP3highCD45RO+) andnaïve Tregs (CD4+FOXP3lowCD45RO−) were decreased. T-bet is an immune cell-specific member of the T-box familyof transcription factors, which is required for the functionalfitness of pTregs (also known as induced or adaptive Tregs
[66–68]). Only Bidad K. [46] observed that FOXP3+CD4+-
RORγt−Tbet− Tregs in AS patients were significantly lowerthan in healthy blood donors. A specialized subset of Tregsthat are characterized by a high expression level of CXC che-mokine receptor 5 (CXCR5), T follicular regulatory (Tfr)cells are important for the control of humoral immuneresponses [69, 70]. To date, it is still challenging to valuethe real status of above Treg subsets in patients with AS.
Further, the controversial status of Tregs in PB of ASpatients might also be related to the different disease status,such as different treatment, disease activity, or markers ofinflammation. It appears that the effects of corticosteroids(CS) on Treg numbers in patients with autoimmune diseasesare disease-specific [71]. Treg cell numbers increased in CS-treated patients with SLE [72, 73] but decreased in CS-treated patients with psoriasis [74] and was not clearly definedin multiple sclerosis patients [75, 76]. Some studies foundthat disease-modifying antirheumatic drugs (DMARDs)can normalize the distribution of Tregs in RA patients [77–79]. Long-term anti-TNF therapy may increase Tregs in ASand other autoimmune diseases [41, 62, 80]. However, stud-ies about CS and DMARDs on peripheral blood Tregs in ASpatients are still lacking. In addition to drugs, disease activityalso affects the proportion of peripheral blood Tregs [81, 82].But our subgroup analysis found no difference in the propor-tion of Tregs in patients with active compared with stable AS.However, this conclusion needs to be confirmed by morestudies on the proportion of Tregs and the activity of AS.One study also observed that the highest correlation coeffi-cient was between CD4+CD25+FoxP3+Tregs and CRP orESR [31]. But the true relationship between Tregs andinflammatory markers needs further studies.
Our meta-analysis had several limitations. Firstly, sever-ity of the disease and clinical subtypes in AS patients werenot consistent across studies. Moreover, although we did asubgroup analysis of disease activity, the results are question-able due to the small number of studies included. Second, wedid not consider disease duration or treatment, as both thedrugs used and disease staging were inconsistent; however,these factors might affect the proportion of Tregs in PB.Thirdly, there were differences in experimental methodsbetween studies. A flow cytometric expert must run throughall experiments: Some of the flow cytometric assays in thepapers used here might even be disqualified. Meanwhile,the definition of Tregs in some studies also includedCD127low or CD25high rather than completely the same defi-nition makers. Moreover, Tregs are usually evaluated in PB,in which tissue Treg status may fluctuate.
5. Conclusion
Our study suggests that the reported variations of Treg statusamong AS patients are due to using inconsistent definitionsor markers for Tregs. We found the best definition of Tregsas CD4+CD25+FOXP3+ or CD4+CD25high/+CD127low/−. Fur-ther studies are needed to validate our results in independentcohorts of patients with larger sample sizes using the abovedefinitions of Tregs as accurate and standard definition of
7Journal of Immunology Research

Tregs. Our findings lend support to the idea that the Treg sta-tus of AS patients is important.
Disclosure
National Science Foundation of China had no involvementin the study design; in the collection, analysis, or interpreta-tion of data; in the writing of the manuscript; or in the deci-sion to submit the manuscript for publication.
Conflicts of Interest
The authors declare that they have no competing interests.
Authors’ Contributions
NLL, SXZ, and XFL participated in the study design. NLL,JW, and JQZ participated in the data collection and inter-preted the data. NLL and SXZ performed the statistical anal-ysis under the supervision of CH W and XFL. NLL and SXZwrote the draft manuscript, and CHW and CG helped revisethe manuscript. All authors read and approved the final man-uscript. Na-Lin Lai and Sheng-Xiao Zhang contributed to thework equally and should be regarded as co-first authors.
Acknowledgments
We wish to acknowledge funding in support of XFLand CHW by the National Science Foundation of China(81871295 and 81471618).
Supplementary Materials
Supplementary Table 1: background of AS patients in eachstudy. Supplementary Figure 1: forest plot of the overallmeta-analysis of regulatory T cell (Treg) proportions inperipheral blood (PB), identified as single CD25-positive,between ankylosing spondylitis (AS) patients and healthyblood donors (HD). Supplementary Figure 2: forest plotof the overall meta-analysis of regulatory T cell (Treg) pro-portions in peripheral blood (PB), identified with FOXP3-positive, between ankylosing spondylitis (AS) patients andhealthy blood donors (HD). Supplementary Figure 3: forestplot of the overall meta-analysis of regulatory T cell (Treg)proportions in peripheral blood (PB), identified withCD127-negative, between ankylosing spondylitis (AS)patients and healthy blood donors (HD). (SupplementaryMaterials)
References
[1] J. Braun and J. Sieper, “Ankylosing spondylitis,” The Lancet,vol. 369, no. 9570, pp. 1379–1390, 2007.
[2] C. Dejaco, C. Duftner, B. Grubeck-Loebenstein, andM. Schirmer, “Imbalance of regulatory T cells in human auto-immune diseases,” Immunology, vol. 117, no. 3, pp. 289–300,2006.
[3] A. Liston and D. H. Gray, “Homeostatic control of regulatoryT cell diversity,” Nature Reviews Immunology, vol. 14, no. 3,pp. 154–165, 2014.
[4] A. M. Gizinski and D. A. Fox, “T cell subsets and their role inthe pathogenesis of rheumatic disease,” Current Opinion inRheumatology, vol. 26, no. 2, pp. 204–210, 2014.
[5] Y. Wu, M. Ren, R. Yang et al., “Reduced immunomodulationpotential of bone marrow-derived mesenchymal stem cellsinduced CCR4+CCR6+Th/Treg cell subset imbalance in anky-losing spondylitis,” Arthritis Research & Therapy, vol. 13,no. 1, article R29, 2011.
[6] S. S. Zhao, J. W. Hu, J. Wang, X.-J. Lou, and L.-L. Zhou,“Inverse correlation between CD4+CD25highCD127low/− regu-latory T-cells and serum immunoglobulin A in patients withnew-onset ankylosing spondylitis,” The Journal of Interna-tional Medical Research, vol. 39, no. 5, pp. 1968–1974, 2011.
[7] L. Xueyi, C. Lina, W. Zhenbiao, H. Qing, L. Qiang, and P. Zhu,“Levels of circulating Th17 cells and regulatory T cells in anky-losing spondylitis patients with an inadequate response toanti-TNF-α therapy,” Journal of Clinical Immunology,vol. 33, no. 1, pp. 151–161, 2013.
[8] X. Zhang, P. Wang, Y. F. Wu et al., “Allogeneic blood transfu-sion alleviates hip joint pain induced by ankylosing spondyli-tis,” Chinese Journal of Tissue Engineering Research, vol. 18,no. 9, pp. 1465–1470, 2014.
[9] H. Guo, M. Zheng, K. Zhang et al., “Functional defects inCD4+ CD25high FoxP3+ regulatory cells in ankylosing spondy-litis,” Scientific Reports, vol. 6, no. 1, 2016.
[10] M. Wang, C. Liu, A. Bond et al., “Dysfunction of regulatoryT cells in patients with ankylosing spondylitis is associatedwith a loss of Tim-3,” International Immunopharmacology,vol. 59, pp. 53–60, 2018.
[11] L. Limón-Camacho, M. I. Vargas-Rojas, J. Vázquez-Melladoet al., “In vivo peripheral blood proinflammatory T cells inpatients with ankylosing spondylitis,” The Journal of Rheuma-tology, vol. 39, no. 4, pp. 830–835, 2012.
[12] M. Bonelli, J. S. Smolen, and C. Scheinecker, “Treg and lupus,”Annals of the Rheumatic Diseases, vol. 69, Supplement 1,pp. i65–i66, 2010.
[13] N. Arenas-Ramirez, J. Woytschak, and O. Boyman, “Interleu-kin-2: biology, design and application,” Trends in Immunol-ogy, vol. 36, no. 12, pp. 763–777, 2015.
[14] D. Cao, R. van Vollenhoven, L. Klareskog, C. Trollmo, andV.Malmström, “CD25brightCD4+ regulatory T cells are enrichedin inflamed joints of patients with chronic rheumatic disease,”Arthritis Research & Therapy, vol. 6, no. 4, pp. R335–R346,2004.
[15] S. Létourneau, C. Krieg, G. Pantaleo, and O. Boyman, “IL-2-and CD25-dependent immunoregulatory mechanisms in thehomeostasis of T-cell subsets,” The Journal of Allergy and Clin-ical Immunology, vol. 123, no. 4, pp. 758–762, 2009.
[16] S. Hori, T. Nomura, and S. Sakaguchi, “Control of regulatory Tcell development by the transcription factor Foxp3,” Science,vol. 299, pp. 1057–1061, 2003, J Immunol, 2017, 198(3): 981-985.
[17] J. L. Suen, H. T. Li, Y. J. Jong, B.-L. Chiang, and J.-H. Yen,“Altered homeostasis of CD4+ FoxP3+ regulatory T-cell sub-populations in systemic lupus erythematosus,” Immunology,vol. 127, no. 2, pp. 196–205, 2009.
[18] A. H. Banham, “Cell-surface IL-7 receptor expression facili-tates the purification of FOXP3+ regulatory T cells,” Trendsin Immunology, vol. 27, no. 12, pp. 541–544, 2006.
[19] J. Sun, D. N. Tang, T. Fu, and P. Sharma, “Identification ofhuman regulatory T cells in the setting of T-cell activation
8 Journal of Immunology Research

and anti–CTLA-4 immunotherapy on the basis of expressionof latency-associated peptide,” Cancer Discovery, vol. 2, no. 2,pp. 122–130, 2012.
[20] Y. H. Lee, Y. Ishida, M. Rifa'i, Z. Shi, K. Isobe, andH. Suzuki, “Essential role of CD8+CD122+ regulatory T cellsin the recovery from experimental autoimmune encephalo-myelitis,” The Journal of Immunology, vol. 180, no. 2,pp. 825–832, 2008.
[21] R. Han, X. Yang, M. Chen et al., “Changes and clinical signif-icance of CD8+CD122+ T cells in the peripheral blood ofpatients with ankylosing spondylitis,” Clinical Rheumatology,vol. 37, no. 3, pp. 639–646, 2018.
[22] F. Ciccia, A. Accardo-Palumbo, A. Giardina et al., “Expansionof intestinal CD4+CD25(high) Treg cells in patients withankylosing spondylitis: a putative role for interleukin-10 inpreventing intestinal Th17 response,” Arthritis and Rheuma-tism, vol. 62, no. 12, pp. 3625–3634, 2010.
[23] C. Dejaco, C. Duftner, A. Klauser, and M. Schirmer,“Altered T-cell subtypes in spondyloarthritis, rheumatoidarthritis and polymyalgia rheumatica,” Rheumatology Inter-national, vol. 30, no. 3, pp. 297–303, 2010.
[24] Y. Shan, C. Qi, J. Zhao et al., “Higher frequency of peripheralblood follicular regulatory T cells in patients with new onsetankylosing spondylitis,” Clinical and Experimental Pharmacol-ogy & Physiology, vol. 42, no. 2, pp. 154–161, 2015.
[25] D. Xu, J. Fan, Q. Chen, K. Qin, X. Li, and C. Gao, “Low dose IL-2 therapy can recovery Th17/Treg cell balance in patients withankylosing spondylitis,” Annals of the Rheumatic Diseases,vol. 76, p. 63, 2017.
[26] S. van der Linden, H. A. Valkenburg, and A. Cats, “Evaluationof diagnostic criteria for ankylosing spondylitis. A proposal formodification of the New York criteria,” Arthritis and Rheuma-tism, vol. 27, no. 4, pp. 361–368, 1984.
[27] R. DerSimonian and R. Kacker, “Random-effects model formeta-analysis of clinical trials: an update,” Contemporary Clin-ical Trials, vol. 28, no. 2, pp. 105–114, 2007.
[28] S. Garrett, T. Jenkinson, L. G. Kennedy, H. Whitelock,P. Gaisford, and A. Calin, “A new approach to defining diseasestatus in ankylosing spondylitis: the Bath Ankylosing Spondy-litis Disease Activity Index,” The Journal of Rheumatology,vol. 21, no. 12, pp. 2286–2291, 1994.
[29] F. Forger, P. M. Villiger, and M. Ostensen, “Pregnancy inpatients with ankylosing spondylitis: do regulatory T cells playa role?,” Arthritis and Rheumatism, vol. 61, no. 2, pp. 279–283,2009.
[30] M. H. Chen, W. S. Chen, H. T. Lee, C.-Y. Tsai, and C.-T. Chou,“Inverse correlation of programmed death 1 (PD-1) expres-sion in T cells to the spinal radiologic changes in Taiwanesepatients with ankylosing spondylitis,” Clinical Rheumatology,vol. 30, no. 9, pp. 1181–1187, 2011.
[31] H. T. Liao, Y. F. Lin, C. Y. Tsai, and C.-T. Chou, “Regulatory Tcells in ankylosing spondylitis and the response after adalimu-mab treatment,” Joint, Bone, Spine, vol. 82, no. 6, pp. 423–427,2015.
[32] É. Toussirot, P. Saas, M. Deschamps et al., “Increased produc-tion of soluble CTLA-4 in patients with spondylarthropathiescorrelates with disease activity,” Arthritis Research & Therapy,vol. 11, no. 4, article R101, 2009.
[33] H. Appel, P. Wu, R. Scheer et al., “Synovial and peripheralblood CD4+FoxP3+ T cells in spondyloarthritis,” The Journalof Rheumatology, vol. 38, no. 11, pp. 2445–2451, 2011.
[34] Y. Gao, Y. Song, Y. X. Fan et al., “The alteration of Thl7 cellsand CD4+CD25+FoxP3+ regulatory T cells in patients withankylosing spondylitis,” Chinese Journal of Microbiology andImmunology, vol. 32, no. 4, pp. 318–322, 2012.
[35] C. Wang, Q. Liao, Y. Hu, and D. Zhong, “T lymphocytesubset imbalances in patients contribute to ankylosing spon-dylitis,” Experimental and Therapeutic Medicine, vol. 9, no. 1,pp. 250–256, 2015.
[36] E. T. Dunn, E. S. Taylor, S. Stebbings, M. Schultz, A. G. Butt,and R. A. Kemp, “Distinct immune signatures in the colon ofCrohn's disease and ankylosing spondylitis patients in theabsence of inflammation,” Immunology and Cell Biology,vol. 94, no. 5, pp. 421–429, 2016.
[37] Z. Gula, M. Stec, M. Rutkowska-Zapala et al., “The absolutenumber of circulating nonclassical (CD14+CD16++) mono-cytes negatively correlates with DAS28 and swollen joint countin patients with peripheral spondyloarthritis,” Polish Archivesof Internal Medicine, vol. 127, no. 12, pp. 846–853, 2017.
[38] M. J. Fattahi, H. Ahmadi, F. Jafarnezhad-Ansariha et al., “Oraladministration effects of β-D-mannuronic acid (M2000) onTh17 and regulatory T cells in patients with ankylosing spon-dylitis,” Biomedicine & Pharmacotherapy, vol. 100, pp. 495–500, 2018.
[39] W. Ji, H. Li, F. Gao, Y. Chen, L. Zhong, and D. Wang, “Effectsof tripterygium glycosides on interleukin-17 and CD4+CD25+-
CD127low regulatory T-cell expression in the peripheral bloodof patients with ankylosing spondylitis,” Biomedical Reports,vol. 2, no. 4, pp. 517–520, 2014.
[40] Z. Duan, Y. Gui, C. Li et al., “The immune dysfunction inankylosing spondylitis patients,” Bioscience Trends, vol. 11,no. 1, pp. 69–76, 2017.
[41] S. Dulic, Z. Vásárhelyi, A. Bajnok et al., “Analysis of the T-cellsubset composition in ankylosing spondylitis patients withlong-standing anti-TNF therapy,” Annals of the RheumaticDiseases, vol. 76, p. 780, 2017.
[42] C. Lukas, R. Landewe, J. Sieper et al., “Development of anASAS-endorsed disease activity score (ASDAS) in patientswith ankylosing spondylitis,” Annals of the Rheumatic Dis-eases, vol. 68, no. 1, pp. 18–24, 2009.
[43] D. van der Heijde, E. Lie, T. K. Kvien et al., “ASDAS, a highlydiscriminatory ASAS-endorsed disease activity score inpatients with ankylosing spondylitis,” Annals of the RheumaticDiseases, vol. 68, no. 12, pp. 1811–1818, 2009.
[44] P. Machado, R. Landewe, E. Lie et al., “Ankylosing SpondylitisDisease Activity Score (ASDAS): defining cut-off values fordisease activity states and improvement scores,” Annals ofthe Rheumatic Diseases, vol. 70, no. 1, pp. 47–53, 2011.
[45] S. Sakaguchi, “Regulatory T cells: history and perspective,”Methods in Molecular Biology, vol. 707, pp. 3–17, 2011.
[46] K. Bidad, E. Salehi, A. Jamshidi et al., “Effect of all-transretinoic acid on Th17 and T regulatory cell subsets inpatients with ankylosing spondylitis,” The Journal of Rheuma-tology, vol. 40, no. 4, pp. 476–483, 2013.
[47] S. Sakaguchi, N. Sakaguchi, M. Asano, M. Itoh, and M. Toda,“Immunologic self-tolerance maintained by activated T cellsexpressing IL-2 receptor alpha-chains (CD25). Breakdown ofa single mechanism of self-tolerance causes various autoim-mune diseases,” The Journal of Immunology, vol. 155, no. 3,pp. 1151–1164, 1995.
[48] C. Baecher-Allan, J. A. Brown, G. J. Freeman, and D. A. Hafler,“CD4+CD25high regulatory cells in human peripheral blood,”
9Journal of Immunology Research
The Journal of Immunology, vol. 167, no. 3, pp. 1245–1253,2001.
[49] G. M. Han, N. J. O'Neil-Andersen, R. B. Zurier, and D. A. Law-rence, “CD4+CD25high T cell numbers are enriched in theperipheral blood of patients with rheumatoid arthritis,” Cellu-lar Immunology, vol. 253, no. 1-2, pp. 92–101, 2008.
[50] C. Dejaco, C. Duftner, and M. Schirmer, “Are regulatory T-cells linked with aging?,” Experimental Gerontology, vol. 41,no. 4, pp. 339–345, 2006.
[51] L. Lu, J. Barbi, and F. Pan, “The regulation of immune toler-ance by FOXP3,” Nature Reviews Immunology, vol. 17,no. 11, pp. 703–717, 2017.
[52] M. Noack and P. Miossec, “Th17 and regulatory T cell balancein autoimmune and inflammatory diseases,” AutoimmunityReviews, vol. 13, no. 6, pp. 668–677, 2014.
[53] Y. Y. Wan and R. A. Flavell, “Regulatory T-cell functions aresubverted and converted owing to attenuated Foxp3 expres-sion,” Nature, vol. 445, no. 7129, pp. 766–770, 2007.
[54] S. Nadkarni, C. Mauri, and M. R. Ehrenstein, “Anti-TNF-αtherapy induces a distinct regulatory T cell population inpatients with rheumatoid arthritis via TGF-β,” The Journal ofExperimental Medicine, vol. 204, no. 1, pp. 33–39, 2007.
[55] M. Bonelli, A. Savitskaya, C. W. Steiner, E. Rath, J. S. Smolen,and C. Scheinecker, “Phenotypic and functional analysis ofCD4+CD25−Foxp3+ T cells in patients with systemic lupuserythematosus,” The Journal of Immunology, vol. 182, no. 3,pp. 1689–1695, 2009.
[56] H. X. Yang, W. Zhang, L. D. Zhao et al., “Are CD4+-
CD25−Foxp3+ cells in untreated new-onset lupus patients reg-ulatory T cells?,” Arthritis Research & Therapy, vol. 11, no. 5,article R153, 2009.
[57] W. Liu, A. L. Putnam, Z. Xu-Yu et al., “CD127 expressioninversely correlates with FoxP3 and suppressive function ofhuman CD4+ T reg cells,” Journal of Experimental Medicine,vol. 203, no. 7, pp. 1701–1711, 2006.
[58] D. J. Hartigan-O'Connor, C. Poon, E. Sinclair, and J. M.McCune, “Human CD4+ regulatory T cells express lowerlevels of the IL-7 receptor alpha chain (CD127), allowing con-sistent identification and sorting of live cells,” Journal ofImmunological Methods, vol. 319, no. 1-2, pp. 41–52, 2007.
[59] S. F. Ziegler, “FOXP3: of mice and men,” Annual Review ofImmunology, vol. 24, pp. 209–226, 2006.
[60] E. Xystrakis, A. S. Dejean, I. Bernard et al., “Identification of anovel natural regulatory CD8 T-cell subset and analysis of itsmechanism of regulation,” Blood, vol. 104, no. 10, pp. 3294–3301, 2004.
[61] G. Churlaud, F. Pitoiset, F. Jebbawi et al., “Human and mouseCD8+CD25+FOXP3+ regulatory T cells at steady state andduring interleukin-2 therapy,” Frontiers in Immunology,vol. 6, p. 171, 2015.
[62] L. Ye, L. Zhang, J. Goodall, H. Gaston, and H. Xu, “Altered fre-quencies of regulatory T-cell subsets in ankylosing spondylitisand rheumatoid arthritis patients and their response to anti-TNF therapy,” Rheumatology, vol. 52, pp. 135-136, 2013.
[63] M. Miyara, Y. Yoshioka, A. Kitoh et al., “Functional delinea-tion and differentiation dynamics of human CD4+ T cellsexpressing the FoxP3 transcription factor,” Immunity,vol. 30, no. 6, pp. 899–911, 2009.
[64] L. S. Taams, J. Smith, M. H. Rustin, M. Salmon, L. W. Poulter,and A. N. Akbar, “Human anergic/suppressive CD4+CD25+ Tcells: a highly differentiated and apoptosis-prone population,”
European Journal of Immunology, vol. 31, no. 4, pp. 1122–1131, 2001.
[65] N. J. Booth, A. J. McQuaid, T. Sobande et al., “Different prolif-erative potential and migratory characteristics of human CD4+
regulatory T cells that express either CD45RA or CD45RO,”The Journal of Immunology, vol. 184, no. 8, pp. 4317–4326,2010.
[66] V. Lazarevic, L. H. Glimcher, and G. M. Lord, “T-bet: a bridgebetween innate and adaptive immunity,” Nature ReviewsImmunology, vol. 13, no. 11, pp. 777–789, 2013.
[67] M. A. Koch, G. Tucker-Heard, N. R. Perdue, J. R. Killebrew,K. B. Urdahl, and D. J. Campbell, “The transcription factorT-bet controls regulatory T cell homeostasis and function dur-ing type 1 inflammation,” Nature Immunology, vol. 10, no. 6,pp. 595–602, 2009.
[68] M. L. Sprouse, M. A. Scavuzzo, S. Blum et al., “High self-reactivity drives T-bet and potentiates Treg function intissue-specific autoimmunity,” JCI Insight, vol. 3, no. 2, 2018.
[69] Y. Chung, S. Tanaka, F. Chu et al., “Follicular regulatory T cellsexpressing Foxp3 and Bcl-6 suppress germinal center reac-tions,” Nature Medicine, vol. 17, no. 8, pp. 983–988, 2011.
[70] I. Wollenberg, A. Agua-Doce, A. Hernández et al., “Regulationof the germinal center reaction by Foxp3+ follicular regulatoryT cells,” The Journal of Immunology, vol. 187, no. 9, pp. 4553–4560, 2011.
[71] L. Cari, F. De Rosa, G. Nocentini, and C. Riccardi, “Context-dependent effect of glucocorticoids on the proliferation, differ-entiation, and apoptosis of regulatory T cells: a review of theempirical evidence and clinical applications,” InternationalJournal of Molecular Sciences, vol. 20, no. 5, 2019.
[72] N. A. Azab, I. H. Bassyouni, Y. Emad, G. A. A. El-Wahab,G. Hamdy, and M. A. Mashahit, “CD4+CD25+ regulatory Tcells (TREG) in systemic lupus erythematosus (SLE) patients:the possible influence of treatment with corticosteroids,” Clin-ical Immunology, vol. 127, no. 2, pp. 151–157, 2008.
[73] A. Mathian, R. Jouenne, D. Chader et al., “Regulatory T cellresponses to high-dose methylprednisolone in active systemiclupus erythematosus,” PLoS One, vol. 10, no. 12, articlee0143689, 2015.
[74] R. R. M. C. Keijsers, I. Joosten, A. G. M. Hendriks, H. J. P.M. Koenen, P. E. J. van Erp, and P. C. M. van de Kerkhof,“Balance of Treg versus T-effector cells during systemictreatment with adalimumab and topical treatment withcalcipotriol-betamethasone dipropionate ointment,” Experi-mental Dermatology, vol. 24, no. 1, pp. 65–67, 2015.
[75] M. Braitch, S. Harikrishnan, R. A. Robins et al., “Glucocorti-coids increase CD4+CD25high cell percentage and Foxp3expression in patients with multiple sclerosis,” Acta Neurolo-gica Scandinavica, vol. 119, no. 4, pp. 239–245, 2009.
[76] N. G. Muls, H. A. Dang, C. J. M. Sindic, and V. van Pesch,“Regulation of Treg-associated CD39 in multiple sclerosisand effects of corticotherapy during relapse,” Multiple Sclero-sis, vol. 21, no. 12, pp. 1533–1545, 2015.
[77] G. Guggino, A. Giardina, A. Ferrante et al., “The in vitro addi-tion of methotrexate and/or methylprednisolone determinesperipheral reduction in Th17 and expansion of conventionalTreg and of IL-10 producing Th17 lymphocytes in patientswith early rheumatoid arthritis,” Rheumatology International,vol. 35, no. 1, pp. 171–175, 2015.
[78] X. Yu, C. Wang, J. Luo, X. Zhao, L. Wang, and X. Li, “Combi-nation with methotrexate and cyclophosphamide attenuated
10 Journal of Immunology Research

maturation of dendritic cells: inducing Treg skewing and Th17suppression in vivo,” Clinical and Developmental Immunology,vol. 2013, Article ID 238035, 12 pages, 2013.
[79] C. Lina, W. Conghua, L. Nan, and Z. Ping, “Combined treat-ment of etanercept and MTX reverses Th1/Th2, Th17/Tregimbalance in patients with rheumatoid arthritis,” Journal ofClinical Immunology, vol. 31, no. 4, pp. 596–605, 2011.
[80] D. X. Nguyen and M. R. Ehrenstein, “Anti-TNF drives regula-tory T cell expansion by paradoxically promoting membraneTNF-TNF-RII binding in rheumatoid arthritis,” The Journalof Experimental Medicine, vol. 213, no. 7, pp. 1241–1253, 2016.
[81] X. Valencia, C. Yarboro, G. Illei, and P. E. Lipsky, “DeficientCD4+CD25high T regulatory cell function in patients withactive systemic lupus erythematosus,” The Journal of Immu-nology, vol. 178, no. 4, pp. 2579–2588, 2007.
[82] S. X. Zhang, X. W. Ma, Y. F. Li et al., “The proportion of reg-ulatory T cells in patients with systemic lupus erythematosus:a meta-analysis,” Journal of Immunology Research, vol. 2018,Article ID 7103219, 11 pages, 2018.
11Journal of Immunology Research

Stem Cells International
Hindawiwww.hindawi.com Volume 2018
Hindawiwww.hindawi.com Volume 2018
MEDIATORSINFLAMMATION
of
EndocrinologyInternational Journal of
Hindawiwww.hindawi.com Volume 2018
Hindawiwww.hindawi.com Volume 2018
Disease Markers
Hindawiwww.hindawi.com Volume 2018
BioMed Research International
OncologyJournal of
Hindawiwww.hindawi.com Volume 2013
Hindawiwww.hindawi.com Volume 2018
Oxidative Medicine and Cellular Longevity
Hindawiwww.hindawi.com Volume 2018
PPAR Research
Hindawi Publishing Corporation http://www.hindawi.com Volume 2013Hindawiwww.hindawi.com
The Scientific World Journal
Volume 2018
Immunology ResearchHindawiwww.hindawi.com Volume 2018
Journal of
ObesityJournal of
Hindawiwww.hindawi.com Volume 2018
Hindawiwww.hindawi.com Volume 2018
Computational and Mathematical Methods in Medicine
Hindawiwww.hindawi.com Volume 2018
Behavioural Neurology
OphthalmologyJournal of
Hindawiwww.hindawi.com Volume 2018
Diabetes ResearchJournal of
Hindawiwww.hindawi.com Volume 2018
Hindawiwww.hindawi.com Volume 2018
Research and TreatmentAIDS
Hindawiwww.hindawi.com Volume 2018
Gastroenterology Research and Practice
Hindawiwww.hindawi.com Volume 2018
Parkinson’s Disease
Evidence-Based Complementary andAlternative Medicine
Volume 2018Hindawiwww.hindawi.com
Submit your manuscripts atwww.hindawi.com