Embed Size (px)
Citation preview

Directorate General Internal Policies of the Union
Policy Department Structural and Cohesion Policies
AGRICULTURE AND RURAL DEVELOPMENT
THE PROMOTION OF NON-FOOD CROPS
STUDY
IP/B/AGRI/ST/2005-02 29/07/2005 PE 363.789 EN

This study was requested by the European Parliament's committee on Agriculture and Rural Development. This paper is published in the following languages: - Original: EN. - Translation: FR, DE. Author: The National Non-Food Crops Centre1, United Kingdom Responsible Official: Eva CASALPRIM-CALVÉS Policy Department Structural and Cohesion Policies RMD 06J049 B-1047 Brussels Tel: +32(0)2 283 21 18 Fax: +32(0)2 284 69 29 E-mail: [email protected] Manuscript completed in July 2005. Paper copies can be obtained through: - E-mail: [email protected] - Site intranet: http://www.ipolnet.ep.parl.union.eu/ipolnet/cms/lang/en/pid/456 Brussels, European Parliament, 2005. The opinions expressed in this document are the sole responsibility of the author and do not necessarily represent the official position of the European Parliament. Reproduction and translation for non-commercial purposes are authorized, provided the source is acknowledged and the publisher is given prior notice and sent a copy.
1 Prepared by L. Hodsman, M. Smallwood and D. Williams.

Directorate General Internal Policies of the Union
Policy Department Structural and Cohesion Policies
AGRICULTURE AND RURAL DEVELOPMENT
THE PROMOTION OF NON-FOOD CROPS
STUDY
Abstract: This report attempts to chart the nature and extent of non-food uses of crops in the enlarged European Union and to examine how the sector can be promoted. Major factors impacting on development of non-food uses of crops are addressed, including: international trade and environmental agreements, European policy, enlargement, competitiveness, market considerations and technology.
The current non-food applications of crops are reviewed and likely developments up to 2 010 discussed. This is followed by a critical evaluation of outcomes that have been predicted from adoption of non-food uses of crops, including environmental benefits and impacts on consumer prices and farm incomes. The report concludes by reviewing the incentives that are in place across the EU and in member states to support development of non-food crops.
IP/B/AGRI/ST/2005_02 PE 363.789 EN


The Promotion of Non-Food Crops
PE 363.789 iii
Executive Summary
Non-food uses of crops can provide important new markets for farmers in the European Union. Developing this sector has the potential to bring social, economic, and environmental benefits. For instance:
Use of bio-based renewable raw materials for energy and fuel can help realise Europe’s ambitions to reduce Greenhouse Gas (GHG) Emissions.
Introduction of new crops grown for industrial purposes may provide new habitats; and benefit biodiversity.
Development of biodegradable materials can contribute to waste reduction and avoid pollution of the environment.
Employment and rural development can benefit substantially. Industry can find opportunities to innovate in converting natural materials into
consumer products. This report attempts to chart the nature and extent of non-food uses of crops in the enlarged European Union and to examine how the sector can be promoted. Major factors impacting on development of non-food uses of crops are addressed, including: international trade and environmental agreements, European policy, enlargement, competitiveness, market considerations and technology. The current non-food applications of crops are reviewed and likely developments up to 2 010 discussed. This is followed by a critical evaluation of outcomes that have been predicted from adoption of non-food uses of crops, including environmental benefits and impacts on consumer prices and farm incomes. The report concludes by reviewing the incentives that are in place across the EU and in member states to support development of non-food crops. 1. International agreements
Two international agreements have a particularly significant impact on non-food crops and their markets – the Kyoto protocol and World Trade Organisation rules. Non-food crops have a significant role to play in satisfying the EU’s Kyoto obligations to reduce greenhouse gas emissions (GHGs). The obligation to put in place domestic measures to reduce GHGs is an important driver for non-food crop markets. Fuel and energy are the large-scale applications potentially offering the most significant reductions. However, the contribution of crop-based renewable materials should not be overlooked as their production may produce greater GHG savings per hectare of crop than energy and fuel applications. World Trade Organisation rules allow support for environmental measures within the “Green box”. Following CAP Reform, decoupling subsidy payments from production has rendered them “Green Box compliant”. Decoupling has also reduced incentives for overproduction and the creation of surpluses, which Europe has traditionally exported onto world markets with the aid of export subsidies. This support can now be expected to decline. Current WTO rules should therefore not inhibit promotion of non-food crops and may well have the effect of encouraging transfer from food production into non-food cropping. The eventual results of the continuing negotiations based on the Doha Ministerial Declaration are not yet clear.

The Promotion of Non-Food Crops
PE 363.789 iv
2. European policy
A large number of EU policies and a considerable body of legislation have an impact on non-food markets for EU grown crops. CAP reform is one of the most significant recent changes and impacts directly on growers. However, a range of other policies affects the markets for non-food crops. Some policies are aimed specifically at encouraging non-food uses such as biofuels; however many have as their primary aim environmental benefits or the regulation of markets. The reformed Common Agricultural Policy - including de-coupling, set-aside, support for energy and fuel crops and non-food uses of starch - has provided the pre-conditions for cultivation of non-food crops. However, farmers will only take up this option if the markets into which they are selling are profitable and secure. EU policy shows an awareness of the potential for biomass energy and biofuels to contribute to environmental objectives, to security of energy supply and to new market opportunities for farmers. A number of instruments have been put in place in recent years that appear to have contributed to an expansion of these sectors. However, as the Commission has acknowledged, growth has not been on the scale hoped for and further actions will be needed if targets for electricity and fuel are to be met. On materials from non-food crops, there is little sign of real activity to encourage the sector at a European level. More importantly, broader legislation, particularly legislation on waste, is not currently framed so as to enable the EU to gain the most benefit from non-food crops. 3. Other major factors in the development of non-food crop markets
Europe is a world leader and cost-competitive with other developed nations in production of oilseed for purposes such as biodiesel but despite high yields per hectare, carbohydrate and fibre crops grown in the EU do not compete on price. Using bioethanol as an example, production costs in the EU (using wheat as the feedstock) are almost three times those of Brazil (using sugar cane) and approaching double those of Australia (sugar cane) and the United States (corn). Enlargement has introduced a substantial resource of solid fuel biomass into the EU but the new member states are unlikely to contribute significantly to the biofuel feedstock needs of the EU-15. Rising fossil oil prices favour the development of fuels, energy and materials from crops. But a number of adverse factors remain, including the cost of crop feedstock, poor consumer awareness of many crop-derived products and technologies, the lack of established supply chains, poor information flows between stakeholders and the need for diverse consumers to create a robust, competitive non-food market for agricultural products. The absence of a harmonised, coherent bioenergy market is a factor constraining development of crops for fuel and energy purposes. In terms of technology, development of biorefineries that can extract value from the completely agricultural feedstock will reduce costs of crop-derived products. Biotechnology will have crucial role to play in the long-term development of crops for industry and there is a need for new agricultural and processing technologies for novel non-food crops.

The Promotion of Non-Food Crops
PE 363.789 v
4. Current non-food uses of crops Renewable materials are already utilised on a significant scale worldwide, with an estimated 71 million tonnes of crop-derived industrial materials produced annually. European countries show varying levels of activity, primarily determined by the level of Government commitment towards sustainability and renewables. 4.1. Fuel and Energy The most significant non-food applications of crops in both volume and value terms, are fuel and energy. Total energy generation from biomass is in the region of 56 million tonnes oil equivalent each year and the EU produced over two million tonnes of bio-fuel in 2004. A significant area of land would need to be dedicated to fuel and energy crop production to meet the 2010 targets for renewable energy and transport fuel. The EU is currently leading activity in the energy sector as technology is well developed and both crop productivity and quality are high. Both the biomass and fuels sector offer significant opportunity for adding value at the agriculture end of the supply chain, in terms of on-farm primary processing and potentially end-use. The major barrier to increased production and uptake at present is feedstock cost in comparison to cheaper feedstock's (e.g. waste for heat generation) or cheaper imports (e.g. palm oil for biodiesel production). 4.2. Oil Crops Industrial markets for oil crops are dominated by biodiesel, but surfactants and lubricants consume significant and growing quantities of vegetable oil. Paints, solvents, polymers, and linoleum also use renewable oil. Future growth within the non-energy oils sector will depend to a large extent on public policy and measures that are taken at a country or EU level to support introduction of renewable raw materials. There are major opportunities resulting from the high and continually increasing price of fossil oil and the high crop productivity and favourable crop profiles generated in the EU. The weaknesses are based around competing feedstock and oil sources and low consumer awareness and thus uptake of such renewable based products. 4.3. Fibre Crops Crops that are grown specifically for non-food and non-energy purposes include fibre crops such as hemp and flax, which are used in textiles, paper, composites, construction packaging, filters, and insulation. Three sectors show potential for significant substitution of synthetic materials with renewable raw materials; wood-based panels, fibre reinforced composites (particularly in automotives) and insulation products. All of these renewable materials offer performance benefits in comparison to their synthetic counterparts. Due to high processing costs, it is expected that renewables are likely to become cost-competitive first in the higher value market sectors with less penetration of lower value markets. Environmental concerns and legislation are driving natural fibre markets; however, competition from alternative feedstocks or imported fibres poses a significant threat.

The Promotion of Non-Food Crops
PE 363.789 vi
4.4. Carbohydrate Crops In addition to bio-ethanol markets, starch from carbohydrate crops feed a range of industrial applications. Approximately half the starch produced in the EU is used for non-food purposes, principally for paper, board and organic chemicals, but also for a large number of other industrial applications. The EU non-food starch market is predicted to rise from 3.6 million tonnes per annum to 5.5 million tonnes per annum by 2010. The land area required to satisfy this prediction is however small in comparison to that which could be used for fuel and energy crops. Biodegradable polymers and detergents are two sectors showing greatest potential for expansion within this timescale. The EU currently has the technology lead in starch-based biodegradable polymers and expansion is likely in this sector in response to environmental concerns and legislation driving a growing market, in addition to the rising price of fossil oil - the major competing feedstock. The major limiting factors are likely to be low consumer awareness and poor product performance in certain applications. 4.5. Speciality Crops Speciality crops are usually grown on a small scale for use in pharmaceuticals, medicinals, flavours, and fragrances, novel products and other speciality chemicals. Due to increased awareness of sustainability and the environment, the demand for natural plant-derived personal care products is set to increase significantly over coming years. This sector offers significant potential for the farmer to add value before the farm gate and reap high returns if secure contracts are in place. The EU also has the advantage of good husbandry skills and well-developed traceability schemes, both of which are vital in such niche high value market sectors. 5. Environmental impacts of adoption of non-food crop technology
Over their life cycle, most crop-derived products produce less greenhouse gas (GHG) emissions than their synthetic counterparts, because crops absorb CO2 during photosynthesis as they grow. However, crop-derived products are rarely ‘carbon neutral’ because CO2 is released during cultivation, harvesting and processing into the final product. Energy crops offer a valuable means to reduce GHG emissions. Both the nature of the feedstock and technology used to convert the feedstock into energy has a significant impact on GHG emissions. All renewable technologies however deliver emission savings greater than fifty percent relative to current non-renewable technologies. At present agricultural land is not in short supply. However, it is possible that continuing demand for food and rising markets for non-food crops could lead to competition for land. If this situation were to arise, it is worth being aware that using land to grow crops to manufacture biopolymers can save more GHGs per hectare than using the same land to grow energy crops. The impact on biodiversity of switching agricultural land to non-food crops is likely to be positive in many cases. Most novel non-food crops require low inputs, in terms of chemicals and fertilisers, and are therefore likely to have a positive influence in comparison to intensive food production systems. It is also likely to be beneficial to biodiversity to increase the variety of

The Promotion of Non-Food Crops
PE 363.789 vii
crops and hence the range of farmland habitats. However, biodiversity may suffer if intensive crops are grown on set-aside land that would otherwise be left fallow. Some crop-derived products also offer the advantage of biodegradability, thus reducing waste if handled correctly. In order for this to remain a positive effect, waste segregation systems must be in place to prevent biodegradable materials being land filled as opposed to composted. In addition, many products derived from renewable materials carry health and safety benefits when compared with synthetic counterparts such as glass fibre or synthetic metal working fluids. 6. Impact on consumer prices
Consumer prices for crop-derived products are currently higher than for petrochemical competitors. Reasons for this include: more expensive renewable feedstocks, lack of technologies to convert low cost crop wastes, small scale of production, under-developed conversion technology and market failures arising because the environmental costs of competitor products are externalised. However, the performance advantages of some natural materials outweigh the extra initial cost of feedstock. Over the coming years, consumer prices for crop-derived materials will fall as new technologies and economies of scale start to impact and measures are taken to internalise the environmental cost of competing materials. 7. Impact on farm incomes and employment
Total income from farming has been unstable over recent years due to fluctuating market prices for commodity crops such as wheat, oilseed rape, sugar beet, maize, and potatoes, as well as factors such as poor climate conditions and rising prices for inputs such as energy, fuel, chemicals, and fertiliser. Non-food crops are only likely to have a positive effect on farm incomes if production volume is regulated through grower contracts and the minimum price paid to growers is above the cost of production. Production of energy crops on marginal land and utilisation of agricultural wastes for energy generation offer potential to increase farm income. Biofuel markets can absorb surpluses and stabilise prices for commodity crops as well as attracting aid under the energy crops scheme. There are opportunities for growers to gain through taking a stake in the conversion of crop to product. It has been estimated that biomass fuels could also create 500 000 jobs in agricultural industries by 2020. Biofuels can generate 16 jobs per thousand tonnes of oil equivalent. Speciality crops can produce high returns but volumes are low and so this will not help farmers across the board. Risks of loss of income are higher if growers are dependent on a single customer for their product. 8. The role of standards in promoting non-food uses of crops
The industrial use of crops is still small in both value and volume terms. The sector will only grow and prosper if it delivers high quality products that build consumer confidence. Low quality product will have negative effects on prospects of the entire industry.

The Promotion of Non-Food Crops
PE 363.789 viii
An effective way to build consumer confidence can be to establish readily understood and recognised standards that are supported by product manufacturers, original equipment manufacturers, and Government. Such standards can unlock a route to the development of quality, economy, and industrial efficiency and can open international markets to new crop-derived products by eliminating barriers to the free flow of goods. Non-food uses of crops can be supported by standards that either are more easily met by natural products than competitors or ensure bio-based products achieve a quality equivalent to or better than petrochemical competitors or require a minimum proportion of renewable content. 9. Incentives for non-food uses of crops
The majority of EU Member States now have policies in place to support renewable materials. However, there is a great deal of variation in use, legislation, incentives and in the markets supported. Currently the majority of incentives apply specifically to energy-related markets; however, there are programmes in place in some Member States to support other renewable materials such as natural fibre insulation, biodegradable polymers, and biolubricants. The range of support measures currently available to encourage production, uptake, and use of renewable based materials include:
Production support. Direct market support. Investment support. Government Procurement. Public information campaigns. Research, Development and Demonstration funding.
Production support for energy crops appears to be of limited effectiveness in promoting non-food crops. The stimulation of the market for renewable heat, energy, and fuel via feed in tariffs or renewable portfolio standards supported by tradable green certificates is more effective. Fiscal support schemes have been an effective means to stimulate biofuel production in the EU. An obligation for renewable heat appears to be a strong mechanism to stimulate this market. Governments are very large-scale consumers of a huge range of products and therefore have significant market influence. Both national and local scale public procurement strategies are an effective means of demonstrating commitment and confidence in renewable materials, thus enhancing consumer awareness and uptake. Five member states have established National Centres with a specific responsibility for collaboration and publication of information on non-food crops and uses. The effectiveness of information gathering and dissemination is difficult to quantify, although provision of data is clearly a pre-requisite for introduction of agricultural materials to the EU’s industrial base. 10. Investment in Research, Development and Demonstration
In March 2002, the Barcelona European Council set a target for the EU to increase the average research investment level from 1.9% of GDP at present to 3% of GDP by 2010. Set against a research investment in the United States, which currently exceeds that in the EU by €120 billion per annum, there is a clear need for strengthening EU research to build the long-term potential for innovation, growth, and employment creation in Europe.

The Promotion of Non-Food Crops
PE 363.789 ix
The availability of renewable materials from agriculture for energy and materials varies geographically within the EU and each member state runs their own specific research programmes to satisfy local needs. Significant sums have been invested in R&D under the framework programmes, some of which has underpinned development of the EU as technology leader in aspects of non-food crop technology. Public sector investment in RD&D, especially in energy conversion technologies is essential. End-user involvement, effective technology transfer and dissemination are key to successful implementation of these technologies. 11. Recommendations
The maximum area eligible for additional aid under the Energy Crops Scheme needs to be increased above the current EU ceiling of 1.5 million hectares. It is predicted that by 2011, in order to meet the EU targets, a total of over 13 million hectares of energy crops will be required for fuel and energy generation, thus rendering the current ceiling almost insignificant.
Both the Kyoto Protocol and bio-fuel Directive targets should be made mandatory with robust monitoring mechanisms in place.
A mandatory requirement for renewable heat generation will stimulate efficient use of biomass as a renewable energy source and development of new local markets for agricultural products.
An EU-wide monitoring system should be established to ensure that biodiversity within the EU is not compromised by bio-based production of fuel, energy and materials. Further research may be needed as the complex interaction of agricultural systems and biodiversity is imperfectly understood.
Research should be funded to develop cultivars of oilseed, carbohydrate, and biomass crops with lower demands for nitrogenous fertilisers as well as management practices that reduce inputs without compromising yield. The benefits of this would be maximising the potential GHG savings from adoption of renewables, reducing the eutrophication potential of bio-based products and minimising the area of land needed to satisfy demand for fuel, energy and materials.
In several areas, EU environmental and other legislation has unintended effects that hinder the uptake of renewable raw materials by industry. The legislation should be reviewed and revised to remove these effects.
Transparent, publicly available data together with a widely accepted tool for Life Cycle Assessment should be developed at a European level to reveal life cycle benefits of renewable raw materials. This will inform development of standards specifying minimum levels of renewable raw material. In turn, this will underpin environmentally benign procurement and other incentivisation strategies and assist with the internalisation of environmental costs.
There is a need to harmonise product standards and support for renewables throughout the EU. This will create an internal market for agricultural products for energy and fuel purposes. Support should be based on the environmental benefit accruing and should be linked to CO2 trading.

The Promotion of Non-Food Crops
PE 363.789 x
Public procurement strategies should support introduction of materials derived from bio-based renewable raw materials. These strategies need to be implemented alongside a public education programme to raise awareness of the potential uses of renewables and of their wider environmental and health benefits.
Support for dissemination and technology translation of European RD&D on biomaterials, bio-energy and biofuels should be maintained and extended and a public awareness campaign considered.
Integration of national RD&D activities into bio-materials is needed at a European level and this could be carried forward through the ERA-NET scheme. A significant EU-wide research programme on technology for conversion of biomass, especially ligno-cellulosics, into energy, fuel, and chemicals is needed.

The Promotion of Non-Food Crops
PE 363.789 xi
List of Tables Page
Table 1: Detail of current crop activity (where data is available) 2004 [84]. 24
Table 2: Swot analysis of solid energy crops in the EU 26
Table 3: Swot analysis of transport fuel crops in the EU 30
Table 4: Crops grown for energy purposes; including biofuels and biomass, on a country-by-country basis (2004) 32
Table 5: Current activity by application, on a country-by-country basis (2004) 32
Table 6: Swot analysis of oil crops in the EU 34
Table 7: Current production and future potential for oil based products (2004) 34
Table 8: Crops grown for oil-based industrial applications, country-by-country (2004) 36
Table 9: Current activity in oil-based applications, country-by-country (2004) 36
Table 10: Swot analysis of fibre crops in the EU 38
Table 11: Current production and future potential of fibre-based products (2004) 38
Table 12: Crops grown for fibre-based industrial applications, country-by-country (2004) 40
Table 13: Current activity in fibre-based applications, country-by-country (2004) 41
Table 14: Swot analysis of carbohydrate crops in the EU 43
Table 15: Current production and future potential of starch-based products (2004) 43
Table 16: Crops grown for starch-based industrial applications, country-by-country (2004) 45
Table 17: Applications of activity, country-by-country (2004) 46
Table 18: Agricultural land used within the eu for cultivation of speciality crops (ha) [84] 47
Table 19: Swot analysis of speciality crops in the EU 48
Table 20: Crops produced from speciality markets, country-by-country (2004) 49
Table 21: Current activity in speciality market sectors, country-by-country (2004) 49
Table 22: Comparison of cost and advantages of natural versus glasswool insulation in the UK [117] 56
Table 23: Production costs of non-food crops for bioethanol production (average 1996 – 2003) [101] 60
Table 24: Member State incentives for adoption of bio-lubricants 72
Table 25: Summary of types of support offered by Member States for biomass energy Applications [73, 74] 73
Table 26: EU wide funding programmes for biomaterials, bioenergy and biofuels [84, 113, 114] 78
Table 27: Total expenditure per EU Country on Rtd&D for RES in 2001 (Million Euro) [114] 82

The Promotion of Non-Food Crops
PE 363.789 xii
The Promotion of Non-Food Crops
PE 363.789 xiii
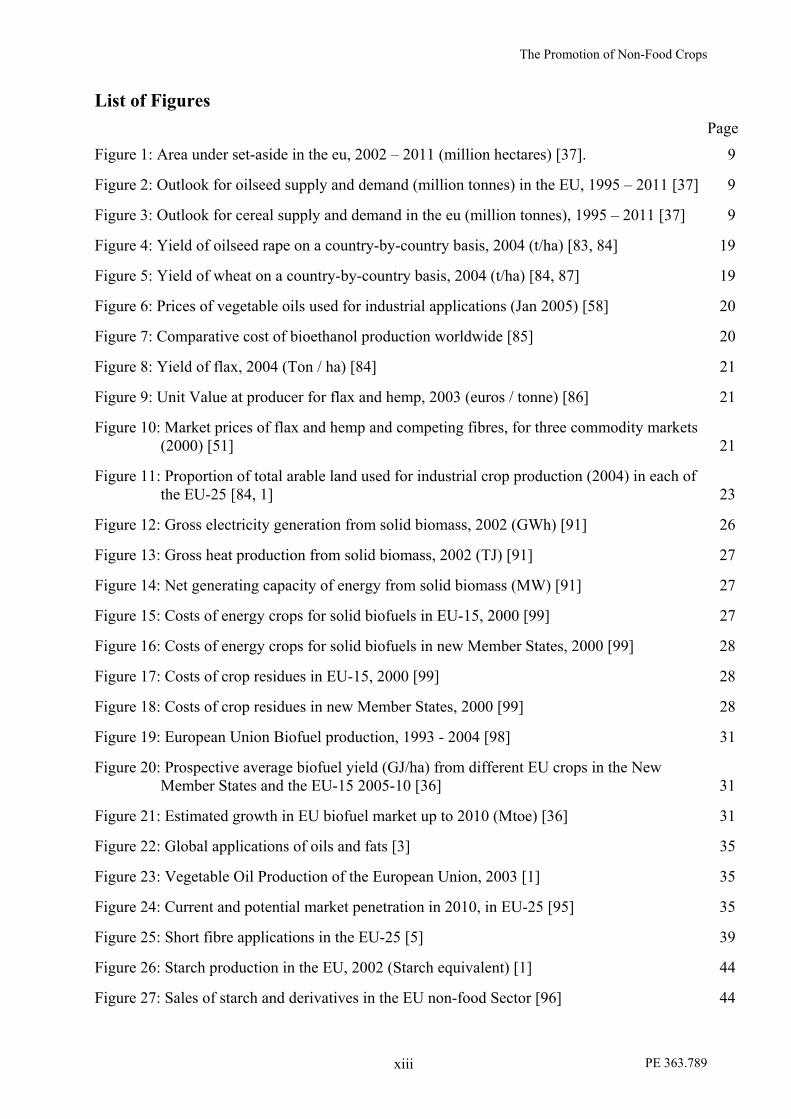
List of Figures Page
Figure 1: Area under set-aside in the eu, 2002 – 2011 (million hectares) [37]. 9
Figure 2: Outlook for oilseed supply and demand (million tonnes) in the EU, 1995 – 2011 [37] 9
Figure 3: Outlook for cereal supply and demand in the eu (million tonnes), 1995 – 2011 [37] 9
Figure 4: Yield of oilseed rape on a country-by-country basis, 2004 (t/ha) [83, 84] 19
Figure 5: Yield of wheat on a country-by-country basis, 2004 (t/ha) [84, 87] 19
Figure 6: Prices of vegetable oils used for industrial applications (Jan 2005) [58] 20
Figure 7: Comparative cost of bioethanol production worldwide [85] 20
Figure 8: Yield of flax, 2004 (Ton / ha) [84] 21
Figure 9: Unit Value at producer for flax and hemp, 2003 (euros / tonne) [86] 21
Figure 10: Market prices of flax and hemp and competing fibres, for three commodity markets (2000) [51] 21
Figure 11: Proportion of total arable land used for industrial crop production (2004) in each of the EU-25 [84, 1] 23
Figure 12: Gross electricity generation from solid biomass, 2002 (GWh) [91] 26
Figure 13: Gross heat production from solid biomass, 2002 (TJ) [91] 27
Figure 14: Net generating capacity of energy from solid biomass (MW) [91] 27
Figure 15: Costs of energy crops for solid biofuels in EU-15, 2000 [99] 27
Figure 16: Costs of energy crops for solid biofuels in new Member States, 2000 [99] 28
Figure 17: Costs of crop residues in EU-15, 2000 [99] 28
Figure 18: Costs of crop residues in new Member States, 2000 [99] 28
Figure 19: European Union Biofuel production, 1993 - 2004 [98] 31
Figure 20: Prospective average biofuel yield (GJ/ha) from different EU crops in the New Member States and the EU-15 2005-10 [36] 31
Figure 21: Estimated growth in EU biofuel market up to 2010 (Mtoe) [36] 31
Figure 22: Global applications of oils and fats [3] 35
Figure 23: Vegetable Oil Production of the European Union, 2003 [1] 35
Figure 24: Current and potential market penetration in 2010, in EU-25 [95] 35
Figure 25: Short fibre applications in the EU-25 [5] 39
Figure 26: Starch production in the EU, 2002 (Starch equivalent) [1] 44
Figure 27: Sales of starch and derivatives in the EU non-food Sector [96] 44

The Promotion of Non-Food Crops
PE 363.789 xiv
Figure 28: Projections for % penetration of the polymer market by bio-based polymers [97] 44
Figure 29: Comparison of Greenhouse gas emissions using different bio-energy technologies [61] 53
Figure 30: Representative Greenhouse Gas Outputs for Biodiesel Production from Oilseed Rape in the UK [11] 54
Figure 31: Prices of some renewable polymers December 2004 [116] 56
Figure 32: Total income from farming per head (‘000 Euro per AWU, real terms 2002 prices) [84] 59
Figure 33: Index of the real income of factors in agriculture per annual work unit in the EU-15 (Base Year 2000) [84] 60
Figure 34: Index of the real income of factors in agriculture per annual work unit in The New Member States (base year 2000) [84] 60
Figure 35: Guideline for returns in the UK on the novel oilseed crop, Crambe [100] 61
Figure 36: Distribution of projects and EU funding by research activities within the three programmes covering Biomass in FP4 [63] 80
Figure 37: Funding provided to FP3 and FP4 for the Environment and MAST Programmes and FP5 for the Environment and Sustainable Development Sub-Programme [113] 80
Figure 38: COST Expenditure Distribution by domain (2004) [113] 81
Figure 39: Number of COST Actions by domain (2002 – 2004) [113] 81
Figure 40: The overall financing of RTD&D For RES in Europe in 2001 (EU and European Member States – Government and Private Sector) [114] 82
The Promotion of Non-Food Crops
PE 363.789 xv
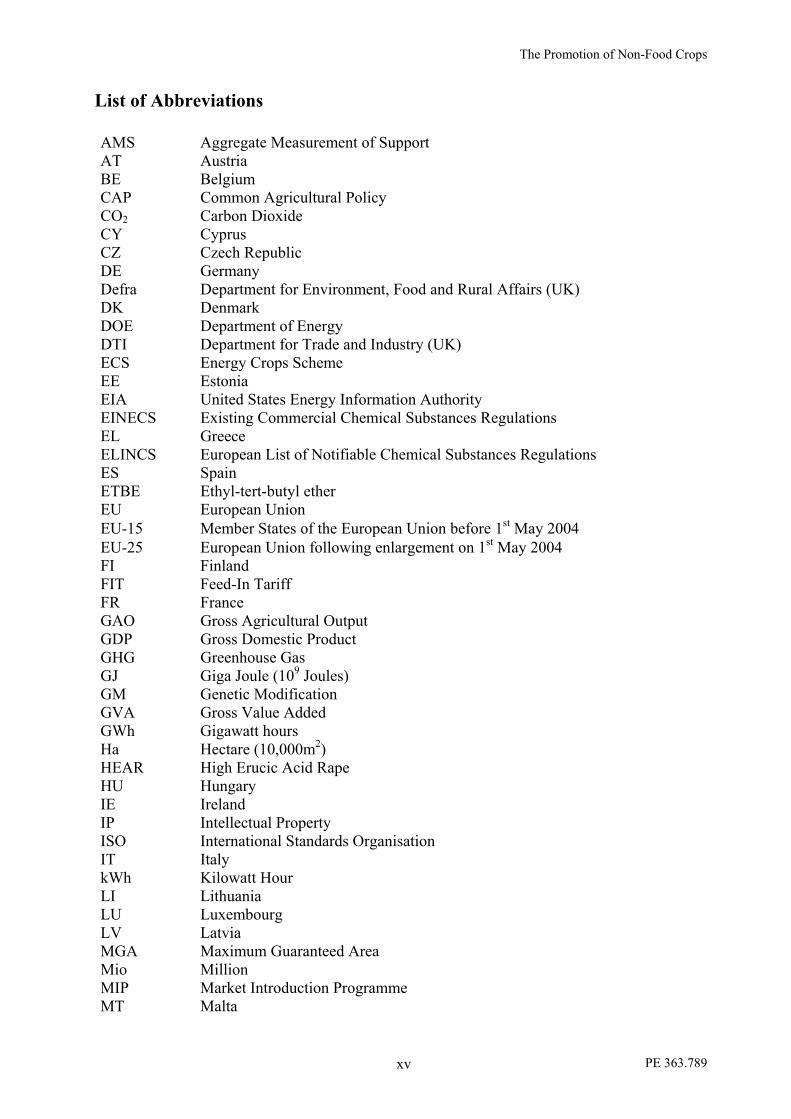
List of Abbreviations AMS Aggregate Measurement of Support AT Austria BE Belgium CAP Common Agricultural Policy CO2 Carbon Dioxide CY Cyprus CZ Czech Republic DE Germany Defra Department for Environment, Food and Rural Affairs (UK) DK Denmark DOE Department of Energy DTI Department for Trade and Industry (UK) ECS Energy Crops Scheme EE Estonia EIA United States Energy Information Authority EINECS Existing Commercial Chemical Substances Regulations EL Greece ELINCS European List of Notifiable Chemical Substances Regulations ES Spain ETBE Ethyl-tert-butyl ether EU European Union EU-15 Member States of the European Union before 1st May 2004 EU-25 European Union following enlargement on 1st May 2004 FI Finland FIT Feed-In Tariff FR France GAO Gross Agricultural Output GDP Gross Domestic Product GHG Greenhouse Gas GJ Giga Joule (109 Joules) GM Genetic Modification GVA Gross Value Added GWh Gigawatt hours Ha Hectare (10,000m2) HEAR High Erucic Acid Rape HU Hungary IE Ireland IP Intellectual Property ISO International Standards Organisation IT Italy kWh Kilowatt Hour LI Lithuania LU Luxembourg LV Latvia MGA Maximum Guaranteed Area Mio Million MIP Market Introduction Programme MT Malta

The Promotion of Non-Food Crops
PE 363.789 xvi
Mtoe Million tonnes oil equivalent MW Mega Watt (106 Watt) NL Netherlands OEM Original Equipment Manufacturer OSR Oilseed Rape PLA Poly Lactic Acid PO Poland PT Portugal R&D Research and Development RD&D Research, Development and Demonstration RES Renewable Energy Sources RES-E Renewable Energy Sources - Electricity RME Rape Methyl Ester RPS Renewable Portfolio Standard RTD&D Research, Technological Development and Demonstration SE Sweden SI Slovenia SK Slovakia SME Small to Medium-Sized Enterprise (<250 employees) SPS Single Payment Scheme SRC Short Rotation Coppice TGC Tradable Green Certificate TILLING Targeted Induced Local Lesion TJ Terra Joules (1012 Joules) UK United Kingdom US United States of America VOC Volatile Organic Compounds WTO World Trade Organisation

The Promotion of Non-Food Crops
PE 363.789 xvii
Table of Contents Page Executive Summary iii
List of tables xi
List of figures xiii
List of abbreviations xv
1. Introduction 1
2. The international context for promotion of non-food crops 3
2.1. World trade organisation rules 3
2.2. The Kyoto protocol 4
3. The EU policy context 7
3.1. The impact of CAP reform on non-food crops 7
3.2. Energy policies 10
3.3. Transport fuel policy 11
3.4. Waste policies 11
3.5. Non-food crops and the end of life-vehicle directive 11
3.6. Environmental legislation 12
3.7. Conclusion 13
4. Other major factors impacting on non-food uses of crops 15
4.1. Productivity and costs in the eu and worldwide 15
4.2. Enlargement 16
4.3. Market considerations 16
4.4. Technology 17 5. Review of the current non-food uses of crops and those under technical development
in the EU and worldwide 23 5.1. Biomass energy crops 25
5.2. Transport fuel crops 29
5.3. Oil crops 33
5.4. Fibre crops 37
5.5. Carbohydrate crops 42
5.6. Speciality crops 47

The Promotion of Non-Food Crops
PE 363.789 xviii
6. Environmental impacts of non-food crops and their uses 51
6.1. Greenhouse gas (GHG) emissions 51
6.2. Pollution 51
6.3. Biodiversity 52
6.4. Waste minimisation 52
6.5. Health and safety 52
6.6. Recommendations 53
7. Review of impact on consumer prices 55
7.1. Case studies 55
8. Impact of non-food uses of crops on farm incomes across Europe 57
8.1. European farm incomes – the context 57
8.2. Effect of non-food crops on farm incomes - general 57
8.3. Biomass for solid fuel 58
8.4. Transport biofuels 58
8.5. Crops grown for other markets 59
9. The role of standards in promoting non-food uses of crops 63
9.1. Standard that can be satisfied more easily by renewables 63
9.2. Standard for a bio-based product - biodiesel 64
9.3. Standard requiring a minimum proportion of renewable raw material - lubricant 64
9.4. Recommendations 65
10. Review and assessment of incentives for non-food uses of crops across Europe 67
10.1.Production incentives 67
10.2.Investment incentives 68
10.3.Feed-in-tariff (FIT) support systems 68
10.4.Renewable portfolio standard (RPS) support schemes 68
10.5.Fiscal support schemes 69
10.6.Government procurement 69
10.7.Public information campaigns 69
10.8.Negative aspects of support for bioenergy 70
10.9.Examples of successful and unsuccessful incentivisation 70

The Promotion of Non-Food Crops
PE 363.789 xix
10.10. The international context 71
10.11. Recommendations 71 11. Review of investment in research, development and demonstration of non-food crops and uses 75 11.1.RD&D in Europe – the context 75
11.2.EU funded RD&D 75
11.3.National funding programmes 76
11.4.Recommendations 77
12. Bibliography 83
13. Annex 89

The Promotion of Non-Food Crops
PE 363.789 1
1. Introduction Non-food uses of crops have been widely cited as providing important new markets for farmers in the European Union. Societal, economic and environmental benefits have been predicted to arise from development of this sector. For instance, use of bio-based renewable raw materials for energy and fuel can help satisfy Europe’s responsibilities to reduce Greenhouse Gas (GHG) emissions. Introduction of new crops grown for industrial purposes may provide new habitats; increasing biodiversity and development of biodegradable materials can contribute to waste reduction and avoid pollution of the environment. Importantly, opportunities for employment and rural development have been predicted as well as for innovation in converting natural materials into consumer products. This report attempts to chart the nature and extent of non-food uses of crops in the enlarged European Union and how promotion of the sector can be achieved. The first section addresses major factors impacting on development of non-food uses of crops, including international trade and environmental agreements, European policy, enlargement and other factors, such as competitiveness, market considerations and technology. The second section reviews the current non-food applications of crops and looks at likely developments up to 2 010. This is followed by a critical evaluation of outcomes that have been predicted from adoption of non-food uses of crops, including environmental benefits and impacts on consumer prices and farm incomes. The report concludes by reviewing incentives that are in place across the EU and in member states to support development of non-food crops.

The Promotion of Non-Food Crops
PE 363.789 2

The Promotion of Non-Food Crops
PE 363.789 3
2. The international context for promotion of non-food crops The two international agreements that have the most significant impact on non-food crops and their uses are the World Trade Organisation rules and the Kyoto protocol.
2.1. World Trade Organisation rules
2.1.1. The current rules The Agriculture Agreement within the Final Act of the Uruguay Round covers world trade in non-food crops. Non-tariff border measures were replaced by tariffs providing similar protection. Developed countries had to reduce tariffs on agricultural products by an average 36% by 2000, maintain current access opportunities and establish minimum access quotas where current access was less than 3% of domestic consumption. The previous scale of EU quotas means that, even after application of the required tariff reductions, imports are precluded in the majority of sectors except where preference arrangements are in place. The Total Aggregate Measurement of [domestic] Support (Total AMS) was required to be reduced by 20%. No reduction was required for “green box” measures - those that have, at most, a minimal impact on trade. Green box policies include: general government services, for example in the areas of research, disease control and infrastructure; direct payments to producers, such as certain forms of “decoupled” income support; structural adjustment assistance; and direct payments under environmental or regional programmes. "Blue box" policies are also excluded from Total AMS. These cover direct payments under production-limiting programmes and other support making up no more than 5% of the production value. The value of export subsidies was reduced by 36% against a 1986-90 base period level by 2000 and the quantity of subsidized exports by 21% over the same period. “Peace” provisions include an understanding that certain actions available under the Subsidies Agreement will not be applied to green box policies and domestic support and export subsidies in conformity with commitments. The peace provisions expired in 2003 and no decision has been taken on their continuation.
2.1.2. Future development of WTO rules Article 20 of Agriculture Agreement commits members to a “long-term objective of substantial progressive reductions in support and protection”. The November 2001 Doha Ministerial Declaration commits to “comprehensive negotiations aimed at: substantial improvements in market access; reductions of, with a view to phasing out, all forms of export subsidies; and substantial reductions in trade-distorting domestic support”. The deadline for completing the negotiations, 1 January 2005, was officially postponed on 1 August 2004, without a new date set. On 1 August 2004, the General Council agreed a work programme. Agriculture negotiations are to continue on reductions in trade-distorting domestic support, improvements in market access (but with countries being able to restrict access for “sensitive products”), controls on food aid, review of the blue and green boxes and setting an end date for elimination of export subsidies.

The Promotion of Non-Food Crops
PE 363.789 4
2.1.3. Implications for non-food crops The June 2003 agreement on CAP reform has significant implications for external trade. Most important was the decision to decouple subsidy payments from production. In doing so, payments became Green Box compatible, being "domestic support measures … which … have no, or at most, minimal trade-distorting effects or effects on production" and thus no longer liable to reduction commitments. By breaking the link between subsidy and production, decoupling also reduces incentives for overproduction and the creation of surpluses, which Europe has traditionally exported onto world markets with the aid of export subsidies. These subsidies can now be expected to decline. The net effect of this and other measures to deliver WTO obligations will tend to be to make conventional food crops less attractive to many farmers. Some may sell up their holdings to others who are prepared to compete on global food commodity markets. Others will seek alternative uses for their land. Non-food crops may provide the answer for some. Certain non-food crops are viable without subsidy - for example high value, low volume crops for pharmaceutical use where quality of supply and traceability are vital. Others may be supported by green box payments because of their environmental benefits - for example, energy crops intended to contribute to reductions in carbon dioxide emissions. It is worth noting that parts of the WTO rules outside the agriculture agreement may affect non-food crop markets. For example, the Agreement on Government Procurement sets rules on transparency and non-discrimination on the basis of country of origin and would limit the ability of the EU to source exclusively domestic production of crop-based materials. Moreover, the Agreement on Technical Barriers to Trade sets rules to ensure that technical regulations and standards do not constitute unnecessary barriers to international trade. There remains considerable uncertainty over the final conclusion to the negotiations begun at Doha and no firm conclusions can therefore be drawn about the implications.
2.2. The Kyoto Protocol The United Nations Framework Convention on Climate Change sets an overall framework for intergovernmental efforts to tackle climate change resulting from emissions of carbon dioxide and other heat-trapping gases. The text of the Convention was adopted in 1992 and entered into force in 1994 with 166 signatories including the EU and USA. When they adopted the Convention, governments knew that it would not be sufficient to tackle climate change. The Kyoto Protocol was therefore negotiated and adopted on 11 December 1997. Considerable “unfinished business” remained even after the Kyoto Protocol was adopted. The Protocol sketched out its “mechanisms” and compliance system, for example, but did not flesh out how they would operate. A new round of negotiations was therefore launched which culminated with the adoption of the Marrakesh Accords in 2001. The 1997 Kyoto Protocol commits parties to individual, legally binding targets to limit or reduce their greenhouse gas emissions. The individual targets include 8% reductions for EU 15 and the majority of the new member states. The targets cover emissions of the six main greenhouse gases and the maximum amount of emissions (measured as the equivalent in CO2) is known as a Party’s “assigned amount”. The Protocol includes provisions for the review of its commitments. Negotiations on targets for the second commitment period are due to start in 2005, by which time parties must have made “demonstrable progress” in meeting commitments.

The Promotion of Non-Food Crops
PE 363.789 5
To achieve their targets, Parties must put in place “domestic policies and measures”. They may offset their emissions by increasing the amount of greenhouse gases removed from the atmosphere by carbon “sinks”. Changes in land use may increase or decrease this offset. The Protocol establishes three innovative “mechanisms” known as “joint implementation”, the “clean development mechanism” and “emissions trading”. These are designed to help Parties cut the cost of meeting their emissions targets by taking advantage of opportunities to reduce emissions, or increase greenhouse gas removals, that cost less in other countries than at home. While the cost of limiting emissions varies considerably from region to region, the benefit for the atmosphere is the same. However, domestic action must constitute a significant element of each Party’s efforts to meet their commitments. The Marrakesh Accords provide for businesses, non-governmental organizations and other entities to participate in the three mechanisms, under the authority and responsibility of governments. Under “joint implementation”, a Party may implement a project that reduces emissions or increases removals by sinks in the territory of another Party, and count the reduced emission against its own target. Under the “clean development mechanism” (CDM), Parties may claim emission reductions from projects in countries that are not Parties. A levy from CDM projects will help finance adaptation activities in particularly vulnerable developing countries. Under “emissions trading”, a Party may transfer some of the emissions under its assigned amount to another Party that finds it more difficult to meet its emissions target. It may also transfer emissions that it has acquired through the CDM, joint implementation or sink activities. In order to prevent countries from over-selling and being unable to meet their own targets, Parties must hold a commitment period reserve that cannot be traded.
2.2.1. Implications for non-food crops The ability of non-food crops to substitute for petrochemical feedstocks for energy, fuel and materials means that they can play a major part in helping the EU meet its target reduction in greenhouse gas emissions. Although energy and fuels are potentially the large-scale uses of non-food crops and can globally contribute the most to reducing carbon emissions, the contribution of materials should not be overlooked as the production of renewable materials may produce greater savings per hectare than energy/fuel applications. The actions discussed elsewhere in this report on the encouragement of the benefits non-food crops including energy crop support, targets for renewable energy and fuels and so on are all highly relevant to reaping greenhouse gas emission reductions. It is also vital to ensure that legislative and policy issues, such as the sometimes-perverse effects of waste legislation (see 3.4) are satisfactorily resolved. EU rules on emission trading will not initially extend to agriculture and so there is no current potential to use this mechanism to favour non-food crops.

The Promotion of Non-Food Crops
PE 363.789 6

The Promotion of Non-Food Crops
PE 363.789 7
3. The EU policy context A large number of EU policies and a considerable body of legislation have an impact on non-food markets for EU-grown crops. CAP reform is one of the most significant recent changes and impacts directly on growers, however a range of other policies affect the markets for non-food crops, and therefore have an equal or greater effect. Some of these policies are aimed at encouraging non-food uses such as biofuels, but many have as their primary aim environmental benefits or the regulation of markets. The following section sets out a brief summary of some key instruments. We have tried to capture the most important instruments and to exemplify some key thrusts of EU policy and legislation but do not pretend that this is comprehensive, given the breadth and depth of instruments that impact on the non-food sector.
3.1. The impact of CAP reform on non-food crops
Under the Reform of the Common Agricultural Policy, which was announced in 2003, farmers in most Member States will maintain direct income payments based on those received in the reference years 2000-02. In addition, Germany for example has adopted a ‘regional decoupling strategy’ whereby payments are based on geographical location, and thus general land productivity and climatic conditions. This new structure will maintain income stability, but the principle of separating subsidies and production has been established. This “de-coupling” has been predicted to lead to a strong development in non-food agricultural production, particularly renewable energy sources [82].
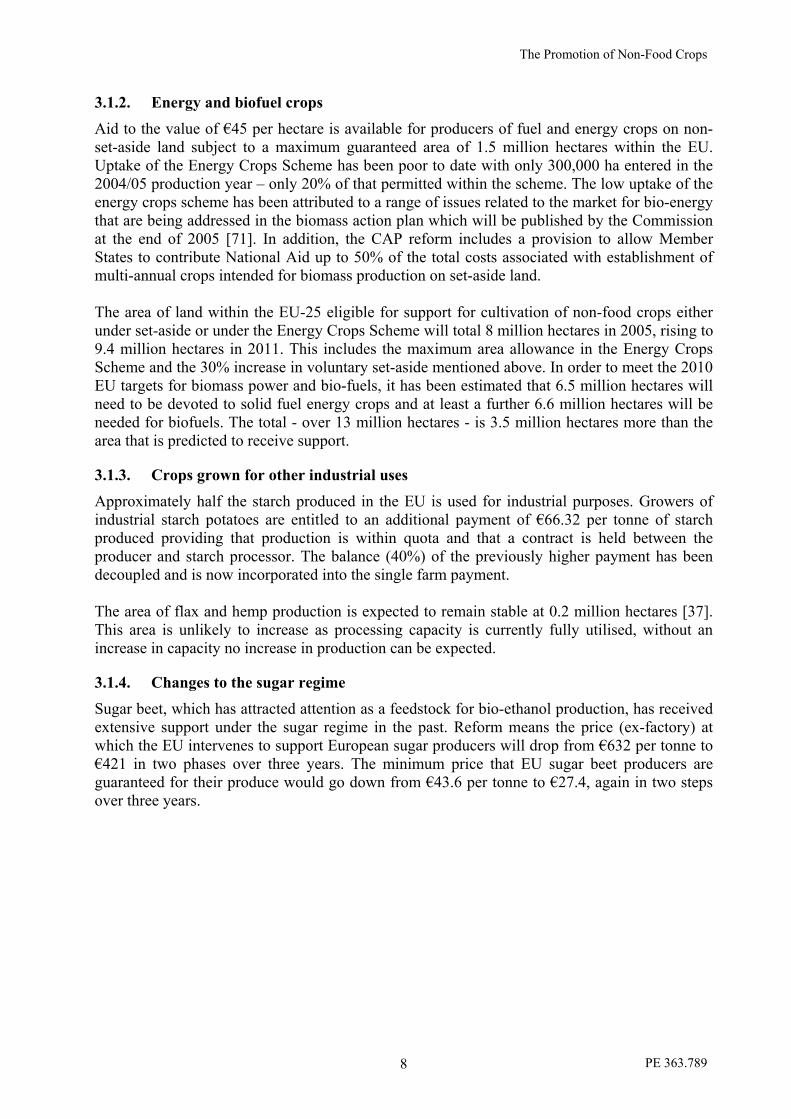
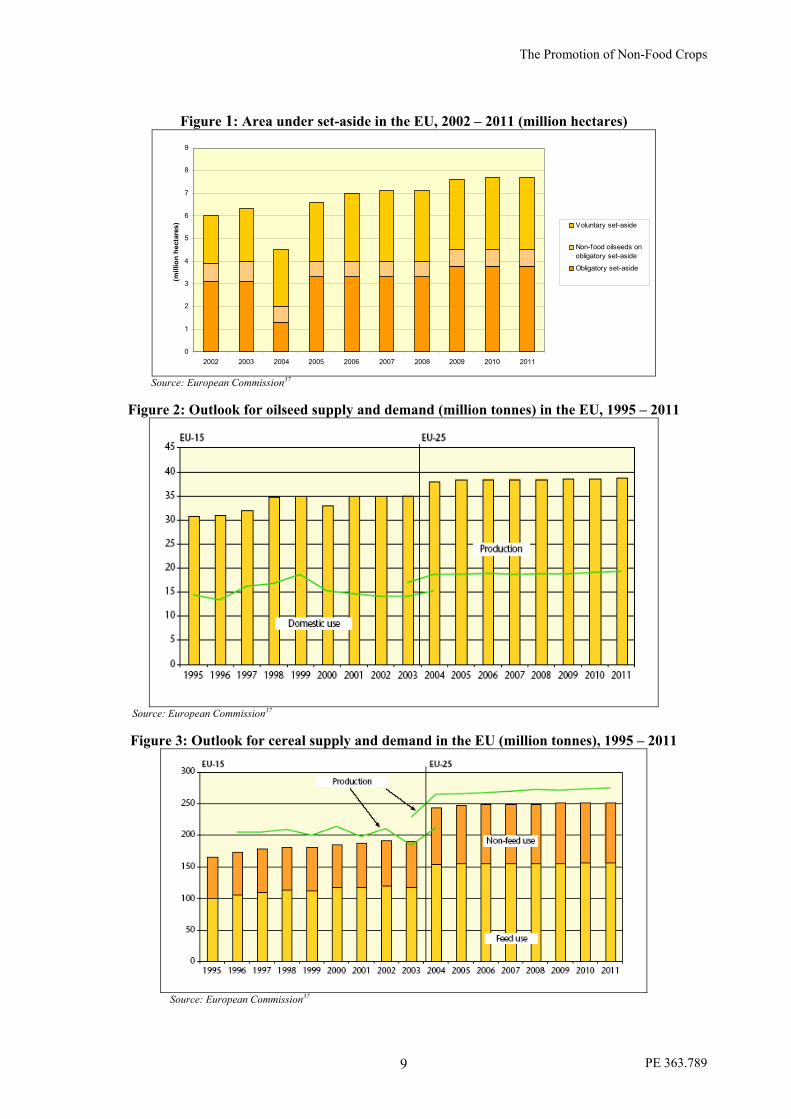
3.1.1. The use of set-aside for non-food crops Under the new scheme, known as ‘Single Farm Payment’, which came into operation on 01st January 2005, the set-aside area in the EU-25 stands at 10% of usable agricultural land, or some 6.6 million ha. In addition a 30% increase in voluntary set-aside has been forecast by 2011 relative to 2002 [37], equating to some 3.4 million hectares (see Figure 1). Set-aside can now be used for production of any crop not intended for animal or human consumption. Farmers are likely to take out of production unfavourable areas; however such land parcels may suit production of more hardy perennial crops such as those for energy generation (e.g. willow, Miscanthus) and a significant increase in production could therefore be expected [56]. CAP reform in itself, under the new single farm payment model, has been predicted to lead to a small increase in the absolute amount of oilseed cultivated between 2004 and 2011; mainly in the new member states [39, 9] (see Figure 2). The area of cereals has also been predicted to remain stable, but the proportion dedicated to non-food uses is likely to grow (see Figure 3). However, countries adopting the Regional decoupling model are likely to see different effects. Using Germany as an example cereal production is predicted to decrease by 8-10% caused by the increase in set-aside and land abandonment. Germany also predict a 6-8% decrease in area of food oilseeds yet a 27% increase in non-food oilseed production, mainly due to the additional support available under the Energy Crops Scheme [119].
The Promotion of Non-Food Crops
PE 363.789 8
3.1.2. Energy and biofuel crops Aid to the value of €45 per hectare is available for producers of fuel and energy crops on non-set-aside land subject to a maximum guaranteed area of 1.5 million hectares within the EU. Uptake of the Energy Crops Scheme has been poor to date with only 300,000 ha entered in the 2004/05 production year – only 20% of that permitted within the scheme. The low uptake of the energy crops scheme has been attributed to a range of issues related to the market for bio-energy that are being addressed in the biomass action plan which will be published by the Commission at the end of 2005 [71]. In addition, the CAP reform includes a provision to allow Member States to contribute National Aid up to 50% of the total costs associated with establishment of multi-annual crops intended for biomass production on set-aside land. The area of land within the EU-25 eligible for support for cultivation of non-food crops either under set-aside or under the Energy Crops Scheme will total 8 million hectares in 2005, rising to 9.4 million hectares in 2011. This includes the maximum area allowance in the Energy Crops Scheme and the 30% increase in voluntary set-aside mentioned above. In order to meet the 2010 EU targets for biomass power and bio-fuels, it has been estimated that 6.5 million hectares will need to be devoted to solid fuel energy crops and at least a further 6.6 million hectares will be needed for biofuels. The total - over 13 million hectares - is 3.5 million hectares more than the area that is predicted to receive support.
3.1.3. Crops grown for other industrial uses Approximately half the starch produced in the EU is used for industrial purposes. Growers of industrial starch potatoes are entitled to an additional payment of €66.32 per tonne of starch produced providing that production is within quota and that a contract is held between the producer and starch processor. The balance (40%) of the previously higher payment has been decoupled and is now incorporated into the single farm payment. The area of flax and hemp production is expected to remain stable at 0.2 million hectares [37]. This area is unlikely to increase as processing capacity is currently fully utilised, without an increase in capacity no increase in production can be expected.
3.1.4. Changes to the sugar regime Sugar beet, which has attracted attention as a feedstock for bio-ethanol production, has received extensive support under the sugar regime in the past. Reform means the price (ex-factory) at which the EU intervenes to support European sugar producers will drop from €632 per tonne to €421 in two phases over three years. The minimum price that EU sugar beet producers are guaranteed for their produce would go down from €43.6 per tonne to €27.4, again in two steps over three years.
The Promotion of Non-Food Crops
PE 363.789 9
Figure 1: Area under set-aside in the EU, 2002 – 2011 (million hectares)
0
1
2
3
4
5
6
7
8
9
2002 2003 2004 2005 2006 2007 2008 2009 2010 2011
(mill
ion
hect
ares
) Voluntary set-aside
Non-food oilseeds onobligatory set-aside
Obligatory set-aside
Source: European Commission37
Figure 2: Outlook for oilseed supply and demand (million tonnes) in the EU, 1995 – 2011
Source: European Commission37
Figure 3: Outlook for cereal supply and demand in the EU (million tonnes), 1995 – 2011
Source: European Commission37

The Promotion of Non-Food Crops
PE 363.789 10
3.2. Energy policies
Biomass is a crucial player in the EU’s aspirations to reduce carbon emissions and many of the EU policies on renewable energy therefore impact on non-food uses of crops. The Commission’s 1996 Green Paper on renewable sources of energy proposed doubling the contribution of renewable sources of energy to gross inland energy consumption from 6% in 1995 to 12% by 2010. The White Paper, which followed in 1997, maintained the 12% objective for 2010 and an action plan was developped to provide fair market opportunities for renewable energies without excessive financial burdens. A Campaign for Take-Off was launched to which included a key action to promote 10,000 MWth of biomass installations, particularly CHP. This closed in 2004 and is being replaced by a Campaign for Sustainable Energy to run to 2007. The Green Paper “Towards a European strategy for the security of energy supply” (COM(2000)769) emphasises the potential role of renewable, particularly biomass, in delivering security of supply and the need to deploy financial measures, information dissemination and technological development as tools to help realise this potential. Directive 2001/77/EEC, which deals with the promotion of electricity produced from renewable energy sources (RES-E), prescribes that member states set indicative 10 year national targets supported by measures to meet them and report on progress every two years. The Commission can propose obligatory targets if member states are unlikely, collectively, to meet the objectives of the Directive. The Commission reported in 2004 that the development of biomass technologies has been hampered by lack of policy coordination and by sufficient funding [70]. The Commission will report by October 2005 on national support schemes, with a proposal for action if necessary. The Commission conclude that more action is needed to promote biomass. In 2001, total biomass production for energy purposes was 56 Mtoe. To achieve the 12% target, 74 Mtoe more are needed by 2010. They propose a Community Biomass Action Plan to be in place by the end of 2005, initiatives to assess and develop the potential of biomass in electricity generation and heating, the use of structural and cohesion funds and action to assist with the placing on the market of biofuels, easing the blending restrictions in Directive 98/70/EC. Directive 2003/96/EEC on the restructuring of the Community framework for the taxation of energy products and electricity allows member states to put in place tax exemptions or reductions for biofuels and for renewable energy, including that generated from biomass. The Sustainable Energy Europe Campaign is intended to contribute to the achievement of EU energy policy goals for renewable energy sources, energy efficiency, clean transport and alternative fuels. The objectives of the Campaign are to: raise awareness among decision-makers; spread best practice; ensure public awareness; and stimulate increased private investment. Benchmarks for 2008 are set in order to measure the progress of sustainable energy actions and serve as goals for decision-makers. These include: 450 new combined heat and power plants and 13,000 new district/centralised heating unit installations; five-fold increase in bioethanol production; three-fold increase in biodiesel production.

The Promotion of Non-Food Crops
PE 363.789 11
3.3. Transport Fuel Policy
Directive 2003/30/EEC on the promotion of the use of biofuels or other renewable fuels for transport, requires member states to ensure that, from 2005, biofuels (liquid and gaseous fuels used for transport and produced from biomass) account for a minimum portion of the fuels sold. The Directive sets indicative targets of 2% market share for biofuels by 2005 and 5.75% by 2010. Member states can, however, set lower national targets if they can justify this on the basis of objective criteria. The Member States must report to the Commission each year on the measures taken to promote the use of biofuels, resources allocated to the production of biomass energy and total quantities of fuel sold for transport. The Commission will report before the end of 2006 on progress and whether legislative proposals are required.
3.4. Waste policies
Directive 74/442/EEC on waste (Waste Framework Directive) sets a framework for tackling waste and its associated environmental problems. A hierarchy is established, in which efforts should first be made to reduce generation of waste, materials should then be reused, value should be recovered through recycling, composting or energy recovery and landfill or other waste disposal should be the last resort. Directive 99/31/EEC on the landfill of waste requires a cut in biodegradable municipal waste to 75% of the 1995 level by 2010, 50% by 2013, and 35% by 2020. Directive 94/62/EEC on packaging and packaging waste sets targets for recovery and recycling of packaging materials. Directive 2000/76/EEC on the incineration of waste requires waste incineration plant to be authorised and to meet stringent standards for temperature control, emissions, recycling of residues, and so on. The use of non-food crops to produce materials and to replace petrochemical feedstocks should, in principle, fit well with waste legislation. Some of the objectives of waste legislation, particularly reduction in carbon emissions, could be considerably assisted by the widespread adoption of renewable materials. However, realising the carbon benefits from the use of renewable materials relies on a suitable means of disposal. This is normally composting or energy recovery. Composting has run into a number of practical difficulties and it has proved difficult, other than in certain niche applications, to find effective ways to separate the waste streams. Energy recovery from incineration has a relatively low place in the waste hierarchy, and is, in some member states at least, highly unpopular with local communities. This inhibits the “grow – use – incinerate” model which may represent a carbon dioxide efficient life cycle for renewable materials.
3.5. Non-food crops and the end of life-vehicle directive
There is considerable scope for innovative uses of crop-derived materials in automotives. For instance, BMW estimate that the natural fibre mats used in panel composites use only 20% of the energy of equivalent glass fibre panels. Added to this, natural fibre panels are lighter and reduce the vehicle’s carbon dioxide emissions through lower fuel consumption. However, the Directive on end-of-life vehicles (2000/53/EC) (ELV) may hinder the use of crop-derived materials. The recycling demanded by the ELV is not environmentally or economically viable for natural fibre composites. Also, the percentage of material that may be incinerated for energy recovery is very low, again preventing realisation of emission reductions through capitalising on the energy potential of renewable materials.

The Promotion of Non-Food Crops
PE 363.789 12
The net effect of ELV may be that manufacturers will revert to less environmentally desirable materials in terms of carbon dioxide and other emissions to satisfy its recycling targets. A more optimistic interpretation is that ELV will provide a driver for development of high performance biodegradable resins suitable for manufacture of composites for automotives. Panels might then be composted, which may be interpreted as recycling. The technology will need to be developed soon, however, as vehicle manufacturers are changing processes and materials now with a view to achieving compliance with the ELV over the coming decade.
3.6. Environmental legislation
EU legislation such as the Habitats Directive, Birds Directive, and Nitrates Directive all has among their effects the placing of restrictions on certain farming activities in certain areas. There could be opportunities in non-food crops for farmers to respond to these imperatives without losing their livelihoods. Non-food crops may benefit biodiversity - partly by adding to the variety of farmland habitats, and some non-food crops require lower inputs of fertilisers, pesticides and so on than do conventional food crops.
3.6.1. VOC Directive Solvents are used in a variety of manufacture, treatment, and cleaning. Most traditional petrochemical solvents are Volatile Organic Compounds (VOC's) or ozone depleting chemicals. Due to their volatility, the total amount of petrochemical solvents lost in the EU atmosphere reaches 5 million tonnes a year. In contrast, oilseed-based solvents are fully biodegradable, non-toxic, odourless and do not contain VOC's or PAC's (Polycyclic Aromatic Carbons). They clean well, are easily applied and can be used manually without specialist equipment. The EU has approved a directive on VOC's setting the objective of a 57% reduction of industrial emissions of volatile organic compounds by 2007. Directive 2004/42/EC on the limitation of emissions of volatile organic compounds due to the use of organic solvents in certain paints and varnishes and vehicle refinishing products establishes values for the maximum VOC content of decorative paints and other products.
3.6.2. The Traditional Herbal Medicinal Products Directive Member states must comply with the Traditional Herbal Medicinal Products Directive (2004/24/EC) by 30th October 2005. The formal recognition that medicinal plants can have powerful effects on the body has necessitated that they be treated in much the same way as synthetic medicines, with respect to safety and quality. However, the safe traditional use and accepted efficacy of many herbal medicines has allowed a simpler regulatory framework to be applied. As a result, for many herbs, there is less need for pre-clinical and clinical studies. By applying common, appropriate regulations throughout the European Community, the desired goal of producing and prescribing safe, effective, high-quality medicines should be achieved. Registered products will be able to move freely throughout the EU, and patients in all member states will have access to the same range of treatments and medicines. 3.6.3. Biocidal Products Directive Directive 98/8/EC concerning the placing of biocidal products on the market sets strict requirements for the production and assessment of data to examine the safety of biocidal products to people and to the environment. These rules are derived in large part from those for plant protection products (Directive 91/414/EEC) and place great costs on those seeking to register new compounds or defend existing ones through the Directive’s review programme.

The Promotion of Non-Food Crops
PE 363.789 13
The net result threatens to be a de facto block on the use of niche products, such as certain antimicrobials based on natural materials.
3.6.4. Chemicals There are similar concerns about the developing legislation on chemicals, the requirements of which act as a brake on the development of new feedstocks and products, including those from non-food crops. These requirements are likely to be increased by the REACH proposals currently under discussion. Clearly there is a need to ensure protection of people and of the environment but ways need to be found to ensure that the process does not unnecessarily hinder novel or niche approaches based on natural materials which are environmentally desirable.
3.6.5. Energy Performance of Buildings Directive 2002/91/EC on the energy performance of buildings lays down requirements for: the general framework for a methodology of calculation of the integrated energy performance of buildings; the application of minimum requirements on the energy performance of new buildings and of large existing buildings subject to major renovation. For new buildings with a total useful floor area over 1,000 m2, Member States shall ensure that the technical, environmental and economic feasibility of alternative systems (such as: decentralised energy supply systems based on renewable energy; CHP; district or block heating or cooling, if available; or heat pumps) is considered and is taken into account before construction starts. Member States shall also ensure that when buildings of the same size undergo major renovation, their energy performance is upgraded in order to meet minimum requirements as far as this is technically, functionally, and economically feasible.
3.7. Conclusion
CAP reform including de-coupling, set-aside, support for energy and fuel crops and non-food starch support has provided the pre-conditions for cultivation of non-food crops, but farmers will only take up this option if the market into which they are selling is profitable and secure. EU policy shows an awareness of the potential for biomass energy and biofuels to contribute to environmental objectives (particularly reduced carbon dioxide emissions), to security of energy supply and to new market opportunities for farmers. A number of instruments have been put in place in recent years, which appear to have contributed to an expansion of these sectors. However, as the Commission has acknowledged, growth has not been on the scale hoped for and further actions will be needed if targets for electricity and fuel are to be met. On materials from non-food crops, there is less sign of real activity to encourage the sector, although member states have introduced legislation to support some biomaterials. More importantly, broader legislation, particularly legislation on waste, does not currently operate to enable the EU to gain the most benefit from non-food crops.

The Promotion of Non-Food Crops
PE 363.789 14

The Promotion of Non-Food Crops
PE 363.789 15
4. Other major factors impacting on non-food uses of crops
4.1. Productivity and costs in the EU and worldwide
4.1.1. EU agriculture produces a high yield per hectare Crop productivity varies on a country-by-country basis, influenced primarily by climate conditions, soil type, technology, and grower education. Although the latter two points can be improved, the former are fixed. Figure 4 and Figure 5 illustrates on a country-by-country basis the productivity of oilseed rape and wheat, both EU crops which are used as feedstock for a range of industrial purposes, including biofuels. This illustrates the typical high productivity per hectare of EU-15 countries compared with the new member states as well as with Canada and the USA. Yield per hectare in China is reported to be approximately half that in the EU.
4.1.2. The EU is world-leader in production of oilseed rape for industrial uses Oilseed rape is an important feedstock for bio-diesel as well as a range of other industrial applications. The EU is the world’s largest producer of rapeseed and production costs compare favourably with Canada [83]. Yields of soy in the EU are comparable to those in the USA but OSR produces a higher yield of oil per hectare than soya. This, combined with the technical advantages of OSR for biodiesel manufacture, mean that OSR is likely to remain the principal EU oilseed feedstock for industrial uses. The production costs of tropical oilseeds such as Jatropha, which are now being cultivated for the biodiesel market in developing countries eg. India and Africa are expected to be significantly lower than EU oilseed production. Although some of this will be imported into the EU, domestic markets within the developing world may be expected to consume a large proportion of this product.
4.1.3. EU carbohydrate and fibre feedstock costs are high Ethanol is currently produced from carbohydrate feedstocks such as sugar and starch that are widely used in production of other non-food products eg biopolymers and platform chemicals. The cost of bioethanol production therefore provides an example of EU competitiveness that might be extrapolated to competitiveness in other non-food uses of carbohydrate crops. Figure 7 illustrates the high gross production costs of bioethanol in the EU compared with a number of global competitors. Even using wheat, the cheapest EU feedstock, EU production costs are around three times those of Brazil. Between fifty and eighty percent of ethanol production costs arise from the raw material so the cost of feedstock production has a significant impact on the price of the industrial end-product. These are significantly lower in the developing world and in the USA than in the EU. Fibre crops are a relatively small component of EU agriculture and yields as well as prices to producers vary across the EU as shown in Figure 8 and Figure 9. The markets for EU fibre crops suffer competition from fibres produced elsewhere in the world as shown in Figure 10. Extraction and processing technologies are poorly developed so there are few opportunities for farmers to add value. In consequence, fibre production in the EU is stagnant or receding. 4.1.4. EU agriculture can support a diverse range of speciality crops Speciality crops which are feedstocks for fine chemicals, pharmaceuticals, personal care and healthcare ingredients are very diverse and broad conclusions on the competitiveness of production either between EU member states or between the EU and the rest of the world are not meaningful. An interesting development, however, is the increasing importance of traceability
The Promotion of Non-Food Crops
PE 363.789 16
and quality to consumers and processors in this sector. The market for natural ingredients for personal care and functional foods is expanding very rapidly and the EU has agricultural and processing technology to support the quality ingredients that are in demand. There may be demand for organic production in this area.
4.2. Enlargement
The new member states bring an extra 38.3 million ha of usable agricultural land to the enlarged European Union [82]. Unused land in these countries tends to be poor due to past management practices and neglect rather than being set-aside because of over-production. The new member states have a lower production cost structure than the EU-15. Growers have not had the modern crop varieties or agricultural technology of the EU-15 and therefore produce lower yields and lower returns. Some of the new member states e.g. Estonia, Poland and Hungary [73] have significant unused biomass resources that can be used for production of heat and electricity in the short term and transport fuel and chemicals in the longer term. If technology to improve yields in arable crops is adopted in these countries, they should be able to produce sufficient biofuels and biomass to satisfy their own 2010 national targets for renewable energy and fuel production, but are unlikely to provide a significant resource to assist in achieving those of the EU-15 [36].
4.3. Market considerations
4.3.1. Cost of crop-derived products Most crop-derived products are currently more expensive than competing materials that use non-renewable feedstocks. In addition to the cost of feedstock, which has until recently been significantly higher for most renewables, there are two principal reasons for this:
1. The technologies against which crop-derived materials compete are usually mature and benefit from economies of scale as well as decades of refinement.
2. The environmental cost of non-renewable materials is externalised – crop-derived materials often gain no financial benefit from their reduced environmental impact.
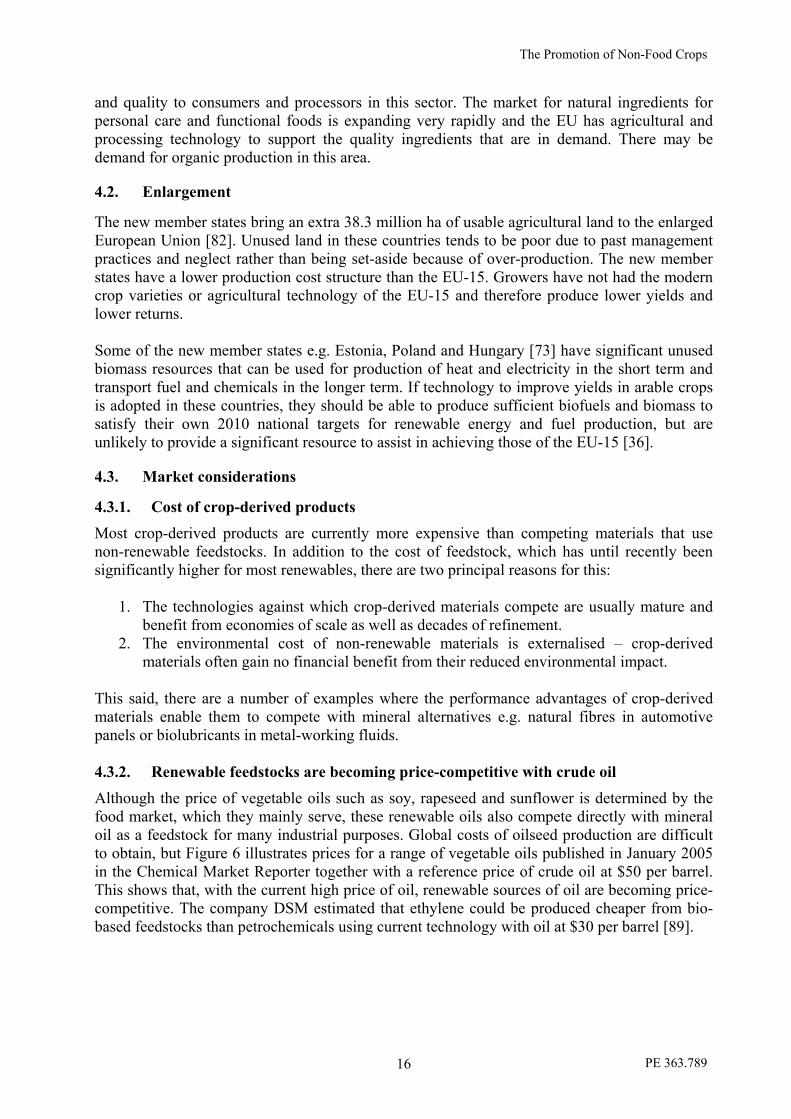
This said, there are a number of examples where the performance advantages of crop-derived materials enable them to compete with mineral alternatives e.g. natural fibres in automotive panels or biolubricants in metal-working fluids. 4.3.2. Renewable feedstocks are becoming price-competitive with crude oil Although the price of vegetable oils such as soy, rapeseed and sunflower is determined by the food market, which they mainly serve, these renewable oils also compete directly with mineral oil as a feedstock for many industrial purposes. Global costs of oilseed production are difficult to obtain, but Figure 6 illustrates prices for a range of vegetable oils published in January 2005 in the Chemical Market Reporter together with a reference price of crude oil at $50 per barrel. This shows that, with the current high price of oil, renewable sources of oil are becoming price-competitive. The company DSM estimated that ethylene could be produced cheaper from bio-based feedstocks than petrochemicals using current technology with oil at $30 per barrel [89].

The Promotion of Non-Food Crops
PE 363.789 17
4.3.3. Consumer awareness A widespread view within the renewables community is that consumers, both within business and amongst the wider public, are unaware of the existence of crop-derived industrial materials or the environmental and performance advantages they offer [3]. Materials based on renewable resources are often assumed to be of lower quality or inferior performance. This negative or non-existent consumer perception has a significant impact on the market for renewable materials. In addition, public perception of genetic modification within the EU limits the technologies that can be applied to development of crops for industrial purposes.
4.3.4. Supply chain issues Poor communication between the agricultural community, academia, the public sector and industrial end-users together with the absence of established supply chains are frequently cited as obstacles to development of non-food uses of crops. There is a need to develop information flows so agricultural producers are aware of what is wanted by industrial markets and to develop contractual links between growers, primary processors and retailers particularly in the new member States. For farmers to gain value from non-food uses of crops, it is important that they have a stake in the conversion technology and gain from the value that is added at that stage. For instance, in the United States, many of the ethanol producing facilities are owned and controlled by farmer co-operatives who supply the feedstock. This type of model is less well developed in the EU than elsewhere and there appears to have been less willingness on the part of agriculture to invest in industry. Farmers need diverse markets for the bio-based feedstocks they are producing – reliance on a single customer who may fail does not provide the robust framework or competitive environment necessary for an effective market. Biomass-based heating offers an opportunity for local farmers to supply a number of buildings with fuel such as wood-chip, spreading the risk of customer failure. Targeting multiple markets also spreads risk – for instance, factories in Brazil can switch easily between sugar and ethanol production depending on the market price at a particular time. Developing viable markets for crop co-products thus adding value to the crop by targeting multiple markets is another means to reduce risk. This is the concept underlying the “biorefinery”, where value is extracted from each part of the feedstock and outputs include not only fuel such as ethanol or biodiesel, but chemicals, fibres, heat and energy. There is no coherent bioenergy market within the EU comparable to that for fossil fuels. Development of a harmonised trade framework supported by appropriate standards, for bio-feedstocks, solid biofuels, transport biofuels and bioelectricity has been widely recognised as a pre-requisite for development of the bio-energy market that is needed to deliver the EU targets for renewable fuel and energy [71].
4.4. Technology
4.4.1. Biotechnology The EU is a world leader in green biotechnology that can be used to modify crop characteristics such as the profile of oil in oilseeds or the types of starch in a carbohydrate crop. In addition to classical breeding, green biotechnologies include non-GM techniques such as marker-assisted breeding and TILLING, as well as GM techniques. As crop varieties are developed to suit specific industrial markets, crops will become more productive and the price obtained by the

The Promotion of Non-Food Crops
PE 363.789 18
grower will increase. The improved profiles will lead to better performance and products based on renewables will become more competitive with their synthetic alternatives [3, 1]. The EU is also developing an increasing focus on white biotechnology - bio-based technologies used for industrial purposes eg biocatalysis [90]. Both green and white biotechnologies, as well as new chemical technologies, are needed to realise the potential of crops as feedstocks for industry.
4.4.2. Agricultural technology New characteristics are required for some industrial applications. For instance wheat cultivars with high C:N ratios may be a good feedstock for bio-ethanol production and work is ongoing in development of OSR with suitable oil profiles for industrial markets. The need for cultivars with lower fertiliser requirements is recognised. Research aimed at improving the yield per hectare of short rotation coppice for biomass applications is also underway. However, cultivars of food crops that have been developed for non-food purposes can pose new risks. For instance, special measures have to be taken to avoid contamination of food grade rapeseed with the high erucic acid variety of rape used for industrial purposes. Novel non-food crops such as hemp or crambe are often constrained by poor harvesting technology, the lack of registered plant protection products, availability of elite germplasm, limited agronomic technology, and knowledge of genetics. These problems are particularly acute in the speciality crop sector, where the scale of individual markets is too small to support the R&D costs to overcome these barriers. The cost of establishment of certain non-food crops may be high and time to first harvest can be several years.
4.4.3. Processing technology Many primary processing technologies are old, expensive, and inefficient – especially for extraction and treatment of fibres from crops such as hemp. Indeed, current methods for production of ethanol use very old technology. The development of techniques such as pyrolysis, gasification, and biocatalysis will enable more efficient use of lignocellulosic bio-materials such as wood and straw than is currently possible. Pilot scale and small scale commercial production facilities are needed to encourage uptake and increase confidence. Development of facilities capable of accepting more than one type of feedstock will reduce capital costs of processing and extracting higher value components prior to use of residual material for heat or energy processes will enable additional value to be extracted from bio-based feedstocks. Since bio-materials arrive at processing facilities in a truck or tanker rather than a pipeline, transport is a major issue. One aspect of moving towards a bio-based economy is likely to be larger numbers of smaller processing units operating at a local scale.

The Promotion of Non-Food Crops
PE 363.789 19
Figure 4: Yield of oilseed rape on a country-by-country basis, 2004 (t/ha)
oilseed rape seed yield (t/ha)
0
0.5
1
1.5
2
2.5
3
3.5
4
4.5
5
Austria
Belgium
Denmark
Finlan
d
France
German
y
Irelan
d
Luxe
mbourg
Netherlan
dsSpa
in
Sweden
United King
dom
Czech
Rep
ublic
Estonia
Hungary
Latvi
a
Lithu
ania
Poland
Slovakia
Slovenia
Canada
t/ha
Source: Canola Council83 and Eurostat84
Figure 5: Yield of wheat on a country-by-country basis, 2004 (t/ha)
Wheat Yield (t/ha)
0
2
4
6
8
10
12
AT BE DK FI FR DE IE LX NL ES SE UK CZ EE HU LV LI PO SK SI AU CA IN US
t/ha
Source: Eurostat84 and USDA87
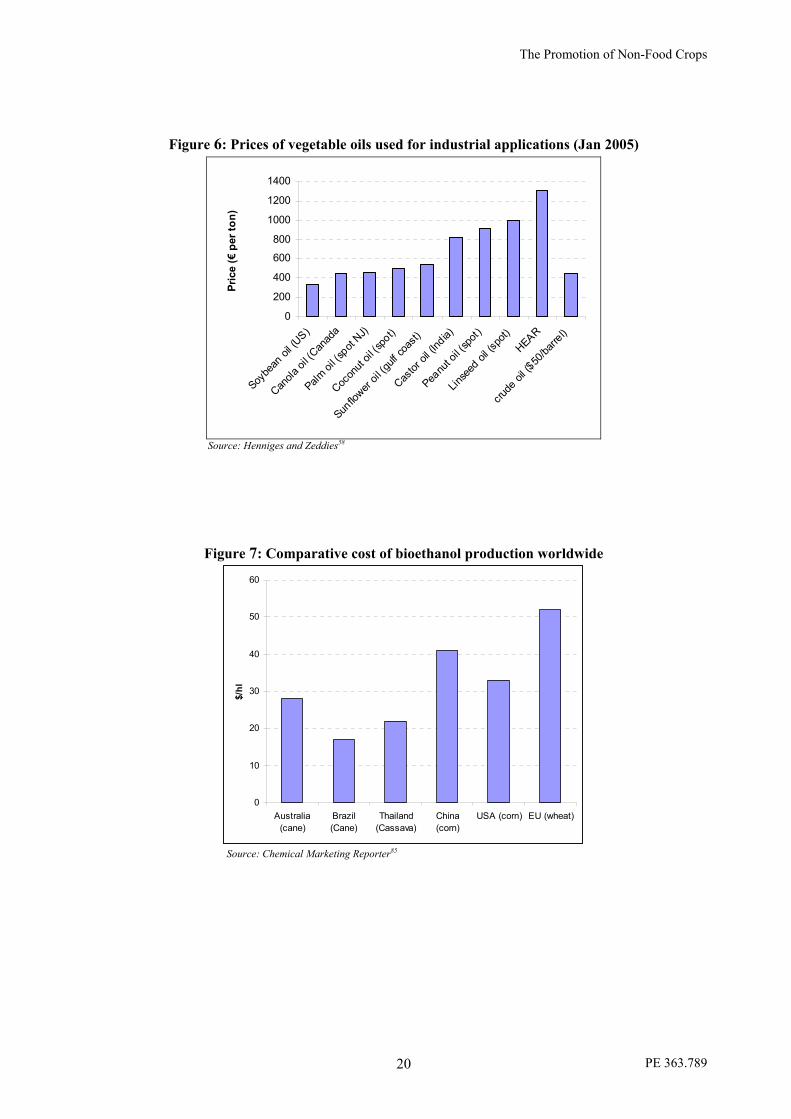
The Promotion of Non-Food Crops
PE 363.789 20
Figure 6: Prices of vegetable oils used for industrial applications (Jan 2005)
0
200
400
600
800
1000
1200
1400
Soybe
an oi
l (US)
Canola
oil (C
anad
a
Palm oi
l (spot
NJ)
Cocon
ut oil
(spo
t)
Sunflo
wer oil
(gulf
coas
t)
Castor
oil (I
ndia)
Peanu
t oil (
spot)
Linse
ed oi
l (spo
t)HEAR
crude
oil ($
50/ba
rrel)
Pric
e (€
per
ton)
Source: Henniges and Zeddies58
Figure 7: Comparative cost of bioethanol production worldwide
0
10
20
30
40
50
60
Australia(cane)
Brazil(Cane)
Thailand(Cassava)
China(corn)
USA (corn) EU (wheat)
$/hl
Source: Chemical Marketing Reporter85

The Promotion of Non-Food Crops
PE 363.789 21
Figure 8: Yield of flax, 2004 (ton / ha)
0
1
2
3
4
5
6
7
8
Belgium
Denmark
France
Netherlan
dsSpa
in
United King
dom
Czech
Rep
ublic
Latvi
a
Lithu
ania
Poland
Slovakia
tonn
es /
ha
Source: Eurostat84
Figure 9: Unit value at producer for flax and hemp, 2003 (euros / tonne)
0
50
100
150
200
250
300
Austria
Finlan
d
German
yIta
ly
Netherlan
dsUK
Hungary
Latvi
a
Canada
euro
s / t
on
Source: Eurostat86
Figure 10: Market prices of flax and hemp and competing fibres, for three commodity markets (2000)
0
0.2
0.4
0.6
0.8
1
1.2
1.4
Flax (EU) Hemp (EU) Jute(Bangladesh)
Sisal (Africaand SouthAmerica)
Kenaf(Bangladesh)
Pric
e in
DM
/kg
(200
0)
Composites
Speciality Pulp
Insulation
Source: Karus, et al 51

The Promotion of Non-Food Crops
PE 363.789 22

The Promotion of Non-Food Crops
PE 363.789 23
5. Review of the current non-food uses of crops and those under technical development in the EU and worldwide
Crops are used as industrial raw materials for a number of reasons; they can offer better technical performance or a more cost-effective raw material and often deliver environmental and sustainability benefits. Renewable materials are already utilised on a significant scale worldwide, with an estimated 71 million tonnes of crop derived industrial materials produced annually [3]. European countries currently show varying levels of activity and commitment within this area which are summarised in terms of land use in Figure 11 below. A further breakdown of current activity is provided in Table 1, where data is currently available. Although this report focuses on industrial materials produced in Europe a significant amount of material is also imported. This is usually because costs are lower, but in some cases the raw material properties can not be obtained from crops that can be grown in the EU. The following sections describe the current use and likely developments by 2010 and 2020 within the non-food crops sector. Activity is categorised by product group, i.e. energy, oil, fibre, carbohydrate and speciality.
Figure 11: Proportion of total arable land used for industrial crop production (2004) in each of the EU-25
0
2
4
6
8
10
12
14
16
% o
f Tot
al a
rabl
e la
nd u
sed
for i
ndus
tria
l cro
p pr
oduc
tion
MT CY IE NL UK PT SE IT SI FI PO DK BE EE AT LV ES LI LX FR DE SK CZ HU EL
Source: Eurostat84 and Holmes1

The Promotion of Non-Food Crops
PE 363.789 24
Table 1: Detail of current crop activity (where data is available) 2004 [84] Country Crop Area (ha) Production (t) Market
(if specified) Sunflower 2,318 - - Flax 175 - Fibre Hemp 50 - Fibre Maize - 70,360 -
Austria
St Johns Wort 24 - Pharmaceutical Oilseed Rape 2,995 - - Belgium Flax 16,270 - Fibre Oilseed Rape - 60,000 Biodiesel Flax 5,694 15,271 Fibre Potato 4,000 - -
Czech Republic
Wheat 25,000 200,000 Bioethanol Denmark Potato - 763,000 Starch Estonia Flax 35 - -
Oilseed Rape - 500 Lubricants Linseed - 100 Paints, varnish Flax 200 - -
Finland
Hemp 100 - - Oilseed Rape 260,000 - Biodiesel Sunflower 51,000 - - Linseed 969 - - Hemp 9,700 58,000 Fibre Flax 68,000 425,000 Fibre Lavandin 19,000 - Cosmetic Lavender 5,000 - Cosmetic
France
Poppy 8,000 - Pharmaceutical Oilseed Rape 668,753 - - Sunflower 18,185 - - Linseed 5,365 - - Flax 225 570 Fibre Hemp 2,700 8,830 Fibre
Germany
Nettle 3 3.3 Fibre Greece Cotton 388,339 1,080,000 Fibre
Hemp 925 3,779 Fibre Hungary Sorghum 3,273 5,496 -
Italy Hemp 900 - Fibre Flax 9,000 9,900 Fibre Linseed 400 500 -
Lithuania
Caraway 6,500 - - Poland Linseed - 50 -
Oilseed Rape 61,534 - - HEAR 13,588 - Slip agent Linseed 731 - - Crambe 1,171 - Slip agent Flax 2,717 - Fibre Hemp 1,413 - Fibre Oat 494 - - Triticale 477 - - Poppy 466 - Pharmaceutical
United Kingdom
Chamomile 175 - -

The Promotion of Non-Food Crops
PE 363.789 25
5.1. Biomass Energy crops
Crops for heat and electricity: Miscanthus and SRC willow are the main crops grown in the EU specifically for energy generation. Other crops such as cereals, sorghum, and reed canary grass are also utilised albeit on a much smaller scale (see Table 4 for a breakdown of National activity). Agricultural residues produced as a by-product of crop production also contribute around 32.7 Mtoe per annum towards total energy generation from biomass, which is in the region of 56 Mtoe per annum [74]. Figure 12 and Figure 13 illustrate current electricity and heat generation levels in active countries. Other countries may be producing biomass on a small scale or this industry may still be under development. Crops for energy production are generally grown on land offering otherwise low financial returns, i.e. set-aside. In the EU, the annual set-aside allocation is in the region of 7.8 million hectares, a significant proportion of which could be dedicated to energy production [99]. Production costs (€/GJ) can vary significantly depending on production method, energy source and region of production. Figure 15 and Figure 16 illustrate the cost variation between the EU-15 and new Member States for energy crops produced for solid biomass. The EU-15 can produce energy more economically than the new Member States due to technology and resources available to them. On the other hand Figure 17 and Figure 18 illustrate costs of crop residues for energy generation (€/GJ) and it can broadly be interpreted that crop resides as an energy source are more economically viable in the new Member States than the old EU-15, mainly due to resource and existing markets. In comparison, assuming an average cost of energy from energy crops as 4 euro/GJ in the EU-15 and almost 10 euro/GJ in the new Member States and from crop residues 3 euro/GJ in the EU-15 and around 2 euro/GJ in the new Member States it is clear crop residues provide a cheaper source of energy. Crop residues also have the advantage of offering the grower an additional market and thus adding value to existing crops and production systems, whereas when producing energy crops for solid biofuels, the grower is targeting a single market and has less opportunity to add value to the crop product [99].
5.1.1. Future potential The White Paper of the Commission ‘Energy for the Future: Renewable Sources of Energy’ recognised that biomass production would need to triple its current level to contribute to CO2 reduction targets [52]. Annual biomass production for energy purposes in the EU currently amounts to some 56 Mtoe per annum. In order to achieve the 2010 targets of 12% renewable energy supply a further 74 Mtoe is required [71]. As an indicative figure, considering land area suitable for energy crop production, agricultural residues and wood, biomass availability for energy purposes totals some 182 Mtoe per annum in the EU-25 [73]. Taking into account current levels of production and potential developments it is anticipated the 2010 renewable electricity target for the EU of 22% will not be achieved. It is predicted a maximum of 18-19% replacement will be achieved within this timescale. This amounts to some 9% replacement as a proportion of energy production as a whole, still significantly lower than the required 12% contribution by 2010.

The Promotion of Non-Food Crops
PE 363.789 26
Figure 14 illustrates net generating capacity for those countries in the EU-25 currently active in energy production from solid biomass; these data include forest products, which currently constitute a large proportion. For smaller production areas, data is not yet available, however capacity may increase significantly over coming years if suitable technology becomes available. Table 2: SWOT analysis of solid energy crops in the EU
Strengths Weaknesses
Solid fuel crops can grow on poor land.
Low labour requirement.
Low inputs.
Technology lead in some biomass conversion.
Solid fuel crops expensive relative to wastes.
Time lag on return on investment in perennial energy crops.
Opportunities Threats
Enormous market supported by EU-wide legislation and financial incentives.
Potential to add value of agricultural wastes.
High price of oil.
Breeding programmes will increase yields of energy crops.
Biotechnology will release new markets for lignocellulosic crops.
Competition with municipal biodegradable waste.
Lack of policy support for biomass heating.
Limited land area supported by energy crops scheme.
Competition with other renewable energy technologies.
Absence of harmonised bioenergy market.
Figure 12: Gross electricity generation from solid biomass, 2002 (GWh)
0
2000
4000
6000
8000
10000
12000
AU BE CZ
DK FI FR
GER HU
IRE IT NL
POL
POR
SE SK SP UK
(GW
h)
Source: OECD91

The Promotion of Non-Food Crops
PE 363.789 27
Figure 13: Gross heat production from solid biomass, 2002 (TJ)
0
10000
20000
30000
40000
50000
60000
70000
80000
90000
AU BE CZ
DK FI FR
GER HU
IRE IT NL
POL
POR
SE SK SP UK
(TJ)
Source: OECD91
Figure 14: Net generating capacity of energy from solid biomass (MW)
0
200
400
600
800
1000
1200
1400
1600
1800
SK HU BE UK DK POR SP GER IT AU FI SE
(MW
)
Source: OECD91
Figure 15: Costs of energy crops for solid biofuels in EU-15, 2000
Source: Nikolaou, et al 99

The Promotion of Non-Food Crops
PE 363.789 28
Figure 16: Costs of energy crops for solid biofuels in new Member States, 2000
Source: Nikolaou, et al 99
Figure 17: Costs of crop residues in EU-15, 2000
Source: Nikolaou, et al 99
Figure 18: Costs of crop residues in new Member States, 2000
Source: Nikolaou, et al 99

The Promotion of Non-Food Crops
PE 363.789 29
5.2. Transport fuel crops
The Directive 2003/30/EC sets indicative targets for biofuels in EU transport at 2% for 2005, or approximately 5 million tonnes of oil equivalent (Mtoe) rising to 5.75% by the end of 2010 [36]. The major markets for biofuels in this timescale are Biodiesel and Bioethanol. Bio-ethanol or the derivative, ethyl-tert-butyl ether (ETBE) can be viewed as a substitute for petrol, whilst biodiesel replaces diesel fuels. They can be mixed with conventional petrol or diesel respectively, without engine modification and can be handled by existing fuel infrastructure. In the longer term, biomass will also be an important source of transport fuels and for the “hydrogen economy”. Production of crops for fuel amounted to some 2.1 million hectares in 2004; however, this area is significantly lower than envisaged requirements [92]. Figure 20 shows that significantly more fuel can be produced per hectare of land from carbohydrate crops than from oil crops. However, the need for break crops and the changing market for diesel versus petrol for cars mean that both biofuels are likely to develop in parallel. Bioethanol is currently manufactured by fermentation of carbohydrate crops such as wheat, potatoes, and sugar beet in the EU. The European countries leading expansion in bioethanol production are Spain and Germany, with existing capacity in France and Sweden. Growth in production of ethanol has been slower than expected, but still significant as shown in Figure 19, total production is anticipated to be in the region of 1.5 billion litres in 2005 [93]. Oilseed rape is the principal feedstock for biodiesel. It is most commonly converted into methyl esters, rape methyl ester (RME) and glycerol. Almost 2 million tonnes of Biodiesel were produced in the EU in 2004, primarily in Germany, France, and Italy with Denmark and the Czech Republic also contributing a significant volume. An average annual increase in production of 35% has been apparent over the ten-year period; 1994 to 2004 (see Figure 19).
5.2.1. Future potential It has been predicted that meeting the 2% biofuel target will not significantly distort the agricultural production patterns of the EU. However, the 5.75% biofuel substitution target has the potential to occupy 10 - 25% of the EU-25 arable land area [36]. Although the new member states will provide a small complement to the EU-15 biofuel production, they are unlikely to act as large suppliers of biofuels for an enlarged EU [36]. A large proportion of the European biofuel market could be satisfied by imports from countries such as Brazil and India, which are able to produce ethanol and biodiesel at much lower cost than in the EU. Prediction of the effect of the Commission’s longer term objective to replace 20% of conventional fuels by 2020 is more difficult because developments in technology can produce step changes in the costs of production and areas of land that are needed. For instance, new technologies may enable use of agricultural wastes such as straw and wood for bioethanol production within the 2010-20 timescale. Large sums have been invested worldwide in this technology and optimistic estimates from the USA suggest this could reduce the cost of bioethanol to $0.66 per gallon [94]. In the same timescale, there is the potential to integrate the manufacture of platform chemicals and materials with production of fuels in a model based on the oil refinery – christened the biorefinery – thus adding value and reducing costs.

The Promotion of Non-Food Crops
PE 363.789 30
Table 3: SWOT analysis of transport fuel crops in the EU
Strengths Weaknesses
Favourable oil profile of Oilseed rape for biodiesel production.
High productivity of oil per hectare.
Leading role of EU in biodiesel production.
Cost of European-sourced oil & carbohydrate.
Agricultural inputs limit GHG saving.
High cost of GHG saving relative to other biomass energy.
Opportunities Threats
Growing market supported by EU biofuel directive.
Potential for farmers to gain from investment in conversion of crop to fuel.
Potential for secure contracts with local biofuel producers.
High price of fossil oil.
Biofuel market not harmonised and biofuel Directive not mandatory.
Competition with imports from areas where production is cheaper.
Limited land area supported by energy crops scheme.
Technology lead of USA in bioethanol production.
Potential for low returns if crops grown for commodity market.

The Promotion of Non-Food Crops
PE 363.789 31
Figure 19: European Union Biofuel production, 1993 - 2004
0
200000
400000
600000
800000
1000000
1200000
1400000
1600000
1800000
2000000
Prod
uctio
n (t
onne
s)
1993 1994 1995 1996 1997 1998 1999 2000 2001 2002 2003 2004
Bioethanol
Biodiesel
Source: Observ’ER98
Figure 20: Prospective average biofuel yield (GJ/ha) from different EU crops
in the New Member States and the EU-15 2005-10
0
20
40
6080
100
120
140
160
sunfl
ower
rape
seed
wheat
potat
o
suga
r bee
t
GJ/
ha
NewlyAcceedingStatesEU-15
Source: Kavalov36
Figure 21: Estimated growth in EU biofuel market up to 2010 (Mtoe)
0
2
4
6
8
10
12
14
16
18
1993
1995
1997
1999
2001
2003
2005
2007
2009
Mto
e
biodiesel
boethanol
total
Source: Kavalov36

The Promotion of Non-Food Crops
PE 363.789 32
Table 4: Crops grown for energy purposes; including biofuels and biomass, on a country-by-country basis (2004) Crop AT BE DE DK EL ES FI FR IRL IT LU NL PL SE UK CY CZ EE HU LI LV MT PT SI SK ENERGY OSR D Sunflower Sugar Beet D D Wheat D Potatoes Miscanthus D SRC D RCG Sorghum Olive Camelina Chicory D Cereal Straw
Source: 1, 3, 13 – 25, 26 - 34, 41 – 50 Table 5: Current activity by application, on a country-by-country basis (2004) Market AT BE DE DK EL ES FI FR IRL IT LU NL PL SE UK CY CZ EE HU LI LV MT PT SI SK Energy Biodiesel Bioethanol Biomass P
Source: 1, 4, 13 – 25, 29, 41 - 50
Key: _____ Current activity R Research underway D Developmental stage

The Promotion of Non-Food Crops
PE 363.789 33
5.3. Oil crops
The food and feed markets are the largest consumers of vegetable oils (see Figure 22) and biodiesel dominates industrial markets on a volume basis. However, oil crops have a wide range of other non-food applications. Four major oil crops form the principal feedstocks for the industrial oils sector in the EU-25: Oilseed Rape, Soya, Sunflower, and Linseed (see Figure 23). Other minority crops grown as industrial oil sources within Europe include castor and crambe, Table 8 illustrates on a country-by-country basis which crops are currently grown for industrial applications. Although vegetable oils are often more expensive than mineral oils, they offer novel functionalities, for instance Crambe abyssinica produces an oil rich in erucic acid which is used in the plastics industry. There are currently six industrial applications, which dominate the vegetable-oils sector:
Surfactants / detergents / soaps – primarily used in cleaners (54%), leather and paper (13%), chemical processes (10%), food industry (3%), agriculture (8%) and other applications [1].
Lubricants – derived from vegetable oils offer performance advantages in metal working applications and their lack of toxicity and biodegradability offers markets where there is total loss or high risk of leakage into environmentally sensitive situations (e.g. chainsaws and landscaping machinery). Performance currently limits application in the large engine oil market.
Paints and surface coatings – vegetable oils are currently used in the manufacture of gloss paints, resins, varnishes, printing inks, and slip agents.
Solvents – there is increasing interest in the use of ‘biosolvents’ because of health and environmental concerns. Applications include; inks / coatings, adhesives, extraction agent, rubber / polymer manufacture, cosmetics, cleaning and agrochemicals.
Polymers – most commonly produced as packaging materials, vegetable oil derivatives can be used in manufacture of polymers in various forms.
Linoleum – manufactured entirely from natural products and becoming increasingly fashionable and more popular due to environmental concerns.
The three applications currently generating most activity are surfactants, lubricants and surface coatings. See Table 9 for country-by-country activity in each of the above areas. Current market penetration by renewable raw materials in the key sectors ranges from 1.5 – 52% (see Figure 24 below).
5.3.1. Future Potential The potential industrial market for oilseeds will depend to a large extent on public policy and measures that are taken at a country or EU level to support introduction of renewable raw materials. See Figure 24 for market projections for the three major market sectors, with and without supportive policies and measures. Estimations of total potential markets for bio-lubricants vary, but a realistic short to medium term forecast appears to be around 20% (~755,000 tonnes per annum) [12]. This volume would comprise a 100% application in areas where high intended or accidental loss to the environment occurs; for example chain saw oils, vacuum pumps or pneumatic tool oils, concrete demoulding oils, etc. Major potential application sectors are civil work, agriculture, and forest machines, marine and surface water activities. It would however be possible to extend application further in the longer term with greater substitution than initially perceived [3].

The Promotion of Non-Food Crops
PE 363.789 34
In terms of crop potential, opportunities prevail for production of novel oilseeds for higher value applications. For example, Crambe, which could substitute, HEAR as a source of erucic acid for the plastics industry. Further detail on potential added value and returns can be seen in Figure 35. Table 6: SWOT analysis of oil crops in the EU
Strengths Weaknesses
Favourable oil profile of Oilseed rape.
High productivity of oil per hectare.
EU technology lead in biolubricants and paints.
Cost of European-sourced oil.
Oil profiles of European crops not suitable for all applications.
Weak or non-existent supply chains.
Opportunities Threats
Environmental concerns and legislation driving a growing market for products.
Breeding programmes will produce suitable oil profiles.
High price of fossil oil.
Specialist oil crops can produce high returns for committed growers.
Competition with cheaper imported vegetable oil.
Low user awareness of vegetable-oil derived products and their benefits.
Little opportunity for farmers to gain from converting oil to product.
Competition with biodiesel market.
Table 7: Current production and future potential for oil based products (2004)
Market EU Production (million tonnes)
Raw Material Current % renewable (potential by 2010)
Surfactants / detergent
2.4 Coconut, palm, rape, sunflower
20% (60 - 65% potential)
Lubricants 10.2 Rape, sunflower, palm, coconut
2% (20 - 30% potential)
Paints / coatings 3.3 Linseed, castor, sunflower, soy, tung
Data unavailable
Solvents 4 – 4.5 Rapeseed, coconut, Soya (US)
1.5% (12.5% potential)
Polymers 33 Soy, rapeseed, castor, linseed, sunflower
1% (5-10% potential)
Linoleum 56 million m2 Linseed oil, wood flour, cork dust, pine tree resins, limestone, jute backing
Data unavailable
Source: Johansson3, ERRMA4 and ECCP95

The Promotion of Non-Food Crops
PE 363.789 35
Figure 22: Global applications of oils and fats
Nutrition81.7MT
Chemicals / Fuel
14.2MTAnimal Feed
5.2MT
Source: Johansson3
Figure 23: Vegetable Oil Production of the European Union, 2003
Soybean Oil, 30.0% (2.6MT)
Rapeseed Oil, 43.0% (3.7MT)
Other Oils, 4.7% (0.4MT)
Linseed Oil, 2.3% (0.2MT)
Sunflow er Oil, 20.0% (1.7MT)
Source: Holmes1
Figure 24: Current and potential market penetration in 2010, in EU-25
0
10
20
30
40
50
60
70
Market penetration
(%)
Lubricants Solvents Surfactants
Market sector
2000
2010 - w ithoutpolicies andmeasures
2010 - w ithpolicies andmeasures
Source: ECCP95
Data for 2010 market potential of solvents with policies and measures not available.
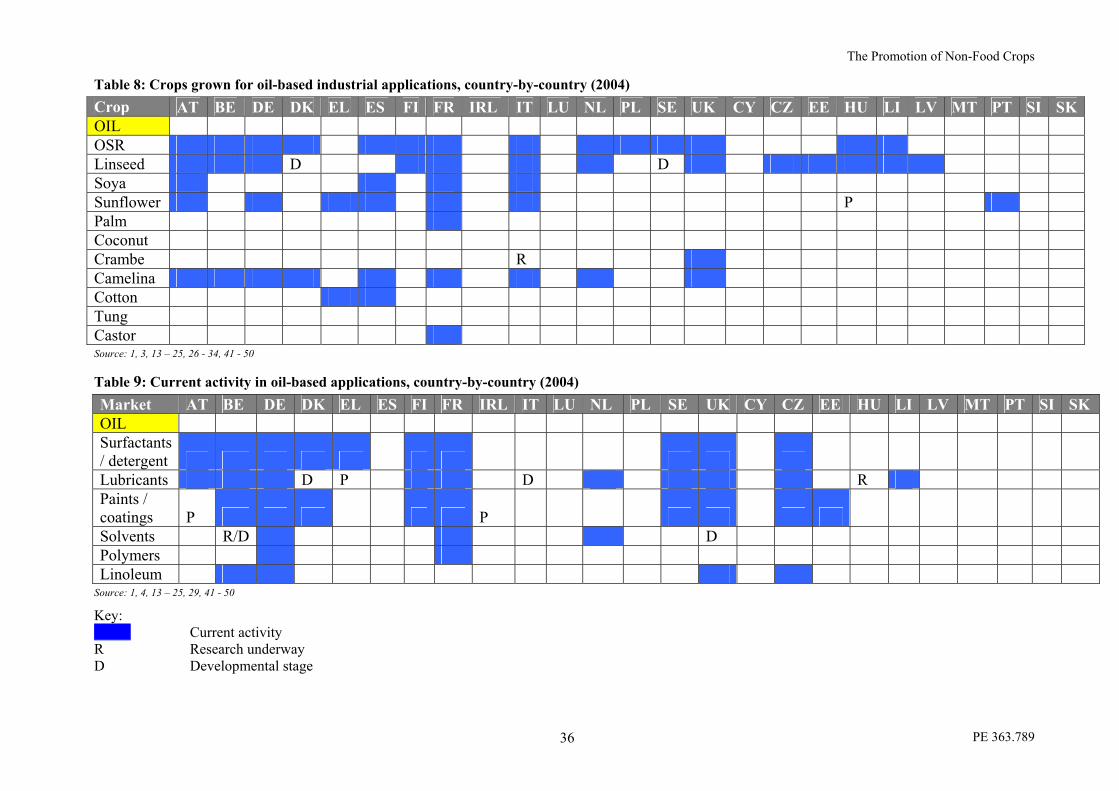
The Promotion of Non-Food Crops
PE 363.789 36
Table 8: Crops grown for oil-based industrial applications, country-by-country (2004) Crop AT BE DE DK EL ES FI FR IRL IT LU NL PL SE UK CY CZ EE HU LI LV MT PT SI SK OIL OSR Linseed D D Soya Sunflower P Palm Coconut Crambe R Camelina Cotton Tung Castor Source: 1, 3, 13 – 25, 26 - 34, 41 - 50
Table 9: Current activity in oil-based applications, country-by-country (2004) Market AT BE DE DK EL ES FI FR IRL IT LU NL PL SE UK CY CZ EE HU LI LV MT PT SI SK OIL Surfactants / detergent Lubricants D P D R Paints / coatings P P Solvents R/D D Polymers Linoleum
Source: 1, 4, 13 – 25, 29, 41 - 50
Key: _____ Current activity R Research underway D Developmental stage

The Promotion of Non-Food Crops
PE 363.789 37
5.4. Fibre crops
Although cotton dominates the natural fibre market worldwide, the four major crops grown within the EU for the natural fibre industry are flax, hemp, cereal straw and Miscanthus. Cotton is also grown in a small number of countries (see Table 12). Those currently under development, showing potential to become mainstream include reed canary grass, nettle, sorghum and kenaf. Interest in natural fibres is increasing because of environmental legislation and concerns as well as performance advantages in composites and insulation products. The environmental impacts of cotton cultivation (pesticide use and demand for water) are leading to interest in alternative sources of fibre for apparel. Fibre is either categorised as long or short, depending on the source and end use of the material; long fibre is gathered from the stems of most fibre crops and is used primarily in higher value markets such as apparel and textile production. Short fibre, on the other hand is derived from the shives and hurds, the woody core of the plants and is used in the lower value markets such as paper and board, wood-fibre panels, horse bedding and composite production [1]. Key market sectors for European fibres: Textiles – finer fibres are used in high quality textiles such as apparel and home textiles,
coarser fibres have applications in rope, bags, canvas, etc. Pulp and Paper – two types of paper are derived from plant fibre; speciality paper such
as cigarette papers, bank notes, hygiene products and other technical papers, and commodity papers for use in large scale operations such as newsprint.
Wood-based panels – plant based fibres can be used as a wood substitute in particle board and medium-density fibreboard.
Fibre reinforced composites – plant based fibres can replace glass fibre in composite materials, for example in the automotive industry their light weight and resilience confer performance advantages.
Fibre / Cement composites – plant based fibres can be used as a wood fibre substitute, combined with cement offering high tensile strength, impact resistance, workability and insulation properties.
Packaging materials – moulded short fibre has potential to replace polystyrene packaging materials in some applications, natural fibre can also be used as a twine substituting polypropylene in certain applications.
Filters and absorbents – natural fibres offer good absorbency properties and are suited to filter based applications and high absorbency applications such as horse bedding and pet litter.
Insulation products – natural fibres retain their insulating properties under a range of moisture conditions and have a longer working life as well as offering health and safety benefits to handlers.
5.4.1. Future Potential High processing costs for fibre products mean that producers and processors of plant fibres are still reliant on Government support and subsidy for cost-effective production. The medium and high value market sectors are likely to become cost competitive in the first instance with lower value markets finding it difficult to compete.

The Promotion of Non-Food Crops
PE 363.789 38
The three sectors showing most potential to substitute existing synthetic materials with renewable raw materials are wood-based panels (10% by 2010), fibre reinforced composites (20% by 2010, particularly in automotives) and insulation products (10% by 2010). Table 10: SWOT analysis of fibre crops in the EU
Strengths Weaknesses
Performance of natural fibres in composites and insulation.
High productivity per ha.
EU technology lead in natural fibre composites.
Cost of European-sourced fibre.
Harvesting and extraction of fibre inefficient.
Technology for fully biodegradable composites not established.
Weak or non-existent supply chains for some potential users.
Waste segregation for biodegradable composites not in place.
Opportunities Threats
Environmental concerns and legislation driving a growing market for some products.
Potential for farmer to add value to crop before the farm gate.
EU-wide policy support for non-food crops.
Competition with cheaper imported fibres.
Competition with established non-renewable alternatives.
Low user awareness of natural fibre products and their benefits.
Table 11: Current production and future potential of fibre-based products (2004)
Market EU Production (million tonnes)
Raw Material Current % renewable (potential by 2010)
Pulp and paper 95 Flax, hemp, cereal straw <1% Wood-based panels
2 Flax, hemp, cereal straw, miscanthus
(10% potential)
Fibre reinforced composites
0.25 (automotive only)
Flax, sisal, jute, kenaf, hemp
15% (20% potential)
Insulation Data unavailable Flax, hemp 4% (10% potential)
Source: 1, 3, 4, 51, 96

The Promotion of Non-Food Crops
PE 363.789 39
Figure 25: Short fibre applications in the EU-25
Speciality pulp66%Composites for
automotives6%
Construction and insulation
3.1%
Traditional uses; tw ine, rope, etc
1.25%
Geotextiles and agricultural
textiles0.7%
Other composites
0.25%
Export to non-EU countries
12.5%
Apparel and home textiles
9.5%Pulp for paper
0.15%
Source: Cresson5

The Promotion of Non-Food Crops
PE 363.789 40
Table 12: Crops grown for fibre-based industrial applications, country-by-country (2004)
Crop AT BE DE DK EL ES FI FR IRL IT LU NL PL SE UK CY CZ EE HU LI LV MT PT SI SK FIBRE Flax Hemp Cereal Straw Miscanthus D RCG R R R Nettle R D Cotton Sisal Jute Kenaf Sorghum D Source: 1, 3, 13 – 25, 26 - 34, 41 - 50

The Promotion of Non-Food Crops
PE 363.789 41
Table 13: Current activity in fibre-based applications, country-by-country (2004)
Market AT BE DE DK EL ES FI FR IRL IT LU NL PL SE UK CY CZ EE HU LI LV MT PT SI SK FIBRE Textiles R Paper and Pulp R D D Wood-based panels D P Fibre reinforced composites R P P P D Fibre cement composites R D D Packaging materials P Filters + absorbents Insulation products R P P Polymers + plastics Others
Key: Source: 1, 4, 13 – 25, 29, 41 - 50 _____ Current activity R Research underway D Developmental stage

The Promotion of Non-Food Crops
PE 363.789 42
5.5. Carbohydrate crops
Virtually all plants produce carbohydrate in one form or another; however it is those which store carbohydrate in the form of starch or sugar which are of interest for industrial applications. Maize, wheat and potato dominate the industrial starch sector (see Figure 26) and the principal sugar-producing crop is sugar beet. Other crops offering significant potential include chicory, barley and rye (see Table 16 for country-by-country activity). All starch/sugar extraction processes produce valuable by-products which are currently used in animal feed, these include bran, flour, gluten and proteins [1]. The largest potential non-food market for carbohydrate crops is bioethanol for fuel (see 5.2). However, starch for other non-food applications constitutes 46% of total EU starch production, equating to 3.6 million tonnes per annum. Two markets currently dominate the non-food sector; paper and board manufacture and organic chemicals (see Figure 27).
Paper and board – starch is used in paper bags, tissues, packaging paper, corrugating board and stationery. Starch is known to improve the printability of paper.
Biodegradable polymers – starch can be used as feedstock to produce a range of fully biodegradable polymers suitable for applications such as bags, packaging and films.
Adhesives and glues – starch-based adhesives are primarily used as paper bonds in products such as corrugated board, paste, adhesive tapes, bags and envelopes.
Agrochemicals – starch is used as an encapsulation agent for pesticides, binders in fertilisers and in seed coatings and plant health products.
Detergents – starches are used to produce biodegradable, non-toxic and skin friendly detergents.
Paints – starch is used in gloss and emulsion as a stabiliser. Cosmetics and toiletries – starch is used in many products as film formers, thickeners,
emulsifiers, conditioners, moisturisers, emollients, dispersants and water proofers. Pharmaceuticals - starch has many applications, from coating and dusting tablets, to
medicinal films and in the formulation of medicinal preparations. Textiles – starch can be used as a sizing agent, adhesive for fabric lengths and a textile
printing thickener, however more recent developments have seen textiles produced directly from renewable sources.
Water purification – starch-based products can be used as a coagulant or flocculent for purification purposes.
Construction – starch esters can be used in mineral cements or mixed products , offering improved strength and consistency.
Super-absorbent products – the main application within this sector is disposable nappies, incorporation of starch improves absorption.
5.5.1. Future Potential
The total EU starch market is expected to rise to 12 million tonnes by 2010, with proportions of 54% and 46% currently utilised by the food and non-food sectors respectively: the market for non-food starch is therefore likely to be in the region of 5.5 million tonnes per annum [96]. Biodegradable polymers and detergents are the two sectors showing significant potential for increased market penetration. Figure 28 shows the potential growth of the bio-based polymer market under different policy and market scenarios [98]. It is worth noting that the area of land needed to satisfy even the high growth scenario is approximately 2.5% of the total land area

The Promotion of Non-Food Crops
PE 363.789 43
devoted to cultivation of cereals in the EU-15 – i.e. negligible by comparison to fuel and energy crops. Table 14: SWOT analysis of carbohydrate crops in the EU
Strengths Weaknesses
Established and technically sophisticated starch industry with supply chains in place.
High productivity of carbohydrate per hectare.
EU technology lead in starch-based biodegradable biopolymers.
Cost of European-sourced carbohydrate.
Performance of starch-based products for some applications.
Weak or non-existent supply chains for some potential users.
Waste segregation for biodegradable polymers not in place.
Opportunities Threats
Environmental concerns and legislation driving a growing market for products.
Rising price of fossil oil.
EU-wide policy support for non-food crops.
Competition with cheaper imported carbohydrate.
Low user awareness of carbohydrate derived products and their benefits.
Little opportunity for farmers to gain from converting carbohydrate to product.
Competition with bioethanol market.
US lead in PLA polymers. Table 15: Current production and future potential of starch-based products (2004) Market EU Production
(million tonnes) Raw Material Current % renewable
(potential) Paper and board Data unavailable
Potato, maize, cereals [2.3 million tonnes]
Plastics 40 Potato, maize, cereal, tapioca
0.09 – 0.1% (2% potential)
Detergents 0.6 Maize, tapioca (60 – 65% potential)
Source: Holmes1, Johansson3, ERRMA4 and Braganza et al 96 * Data provided for three of the major market sectors, additional data is currently unavailable.

The Promotion of Non-Food Crops
PE 363.789 44
Figure 26: Starch production in the EU, 2002 (Starch equivalent)
Wheat, 36% (3.1MT)
Maize, 46% (3.9MT)
Potatoes, 18% (1.6MT)
Source: Holmes1
Figure 27: Sales of starch and derivatives in the EU non-food sector
Paper & Board38%
(1.37mt)
Other17%
(0.6mt)
Pharmaceuticals6%
(0.2mt)
Organic Chemicals
39%(1.4mt)
Source: Braganza et al
Figure 28: Projections for % penetration of the polymer market by bio-based polymers
0
0,51
1,52
2,5
33,5
44,5
5
2000 2010 2020
% s
ubst
itutio
n
w ithout support
w ith policy support
high grow th
Source: Crank et al 97

The Promotion of Non-Food Crops
PE 363.789 45
Table 16: Crops grown for starch-based industrial applications, country-by-country (2004)
Crop AT BE DE DK EL ES FI FR IRL IT LU NL PL SE UK CY CZ EE HU LI LV MT PT SI SK Starch Potato Maize Wheat Barley Sugar Beet Chicory D Tapioca
Source: 1, 3, 13 – 25, 26 - 34, 41 - 50

The Promotion of Non-Food Crops
PE 363.789 46
Table 17: Applications of activity, country-by-country (2004)
Market AT BE DE DK EL ES FI FR IRL IT LU NL PL SE UK CY CZ EE HU LI LV MT PT SI SK Starch Paper + board Biodegradable plastics R R R Adhesives + glues D Agrochemicals R Detergents Paints R Cosmetics + toiletries R Pharmaceuticals Textiles Water purification R Construction Super absorbent products Other
Source: 1, 4, 13 – 25, 29, 41 - 50 Key: _____ Current activity R Research underway D Developmental stage

The Promotion of Non-Food Crops
PE 363.789 47
5.6. Speciality crops
A wide range of speciality crops are grown throughout the EU, usually on a small scale for niche applications (see Table 20 and Table 21 for a breakdown of national activity). There are five key market sectors for speciality crops:
Essential oils – used in the food industry for flavouring, the cosmetic industry for fragrances and the pharmaceutical industry for their functional properties. The primary markets are the flavours and fragrances markets.
Medicinal – broken into two sub-sectors; medicinal drugs and herbal supplements. Perfumes & cosmetics – used for their fragrant properties. Speciality chemicals – natural dyes derived from plant material, used in textiles, paints
and coverings, arts and crafts and inks. Novel products – anti-microbials and biocides with applications in medicinal
preparations, plant health products, food and personal care and hygiene products. Broadly categorised, figures below provide an overview of the EU crop areas grown for the above applications.
Table 18: Agricultural land used within the EU for cultivation of speciality crops (ha) Crop / Group 2004 Production
area (ha) Speciality oilseeds, e.g. poppy, mustard, sesame Herbs / aromatic plants, e.g. thyme, rosemary Caraway Essential oils, e.g. lavender, mint TOTAL
652,353 109,850 17,201 24,435
803,839
Source: Eurostat84
5.6.1. Future Potential In April 2004 the Traditional Herbal Medicines Directive (2004/24/EC) was published with amendments to provide a simplified registration procedure for traditional herbal medicine products, to be implemented in 2006. This offers a significant opportunity to launch new herbal products and generate growth in this area over future years. Quality assurance and traceability are becoming increasingly important, particularly for plants with medicinal properties. A strategy to monitor both aspects must be in place prior to commercialisation. Due to increased awareness in sustainability and the environment the demand for natural plant-derived personal care products is also set to increase significantly over coming years.

The Promotion of Non-Food Crops
PE 363.789 48
Table 19: SWOT analysis of speciality crops in the EU
Strengths Weaknesses
High productivity per ha.
Husbandry skills of EU agriculture.
Poor communication along the supply chain.
Breeding too expensive for the size of individual speciality markets.
Limited availability of extraction facilities.
Opportunities Threats
Consumer-driven, growing market for natural products.
Herbal Medicines Directive will drive demand for high quality, traceable products.
High returns possible if secure contracts in place.
Potential for farmer to add value to crop before the farm gate.
EU-wide policy support for non-food crops.
Competition with cheaper imported speciality crops.
Limited areas of individual speciality crops needed.
Regulation designed for single chemical entity synthetic products limits application of extracts eg as anti-microbials.

The Promotion of Non-Food Crops
PE 363.789 49
Table 20: Crops produced from speciality markets, country-by-country (2004)
Crop AT BE DE DK EL ES FI FR IRL IT LU NL PL SE UK CY CZ EE HU LI LV MT PT SI SK SPECIALITY Mint Lavender Poppy
Source: 1, 3, 13 – 25, 26 - 34, 41 - 50 * This data provides a guide to current crop production activity and is by no means complete, Line 1 of the table illustrates whether the country is active in speciality crop production, however it is difficult to identify individual crop species in most instances. Table 21: Current activity in speciality market sectors, country-by-country (2004)
Market AT BE DE DK EL ES FI FR IRL IT LU NL PL SE UK CY CZ EE HU LI LV MT PT SI SK Speciality Essential oils P Medicinal plants D P P Perfumes + cosmetics D P P Chemicals (dyes, etc) Novel products
Source: 1, 4, 13 – 25, 29, 41 - 50 Key: _____ Current activity R Research underway D Developmental stage

The Promotion of Non-Food Crops
PE 363.789 50

The Promotion of Non-Food Crops
PE 363.789 51
6. Environmental impacts of non-food crops and their uses
6.1. Greenhouse Gas (GHG) Emissions
Over their life-cycle most crop-derived products produce less greenhouse gas emissions than those based on petro-chemicals, because crops absorb CO2 during photosynthesis as they grow. Crop-derived products are rarely “carbon neutral” however, because CO2 is released during cultivation, harvesting and processing into the final product. Biomass can play a dual role in relation to abatement of carbon emissions 1) as substitute for fossil fuels and 2) as a carbon store. The two non-food applications of crops that are likely to have the most significant impact on Europe’s GHG emissions are energy from biomass and liquid bio-fuels. Figure 29 illustrates the carbon emissions per unit of energy from a range of bio-energy technologies. This shows that all the technologies deliver emission savings greater than fifty percent relative to current non-renewable technologies. The technology used to convert the feedstock into energy has a significant impact on GHG emissions – generation of electricity by combustion of wood chip releases nearly double the GHGs of electricity generated using pyrolysis of the same material. The nature of the energy feedstock is also important – GHGs arising from biodiesel manufactured from waste vegetable oil are around a third of those from biodiesel from oilseed rape. Over half the GHG emissions from biodiesel arise from nitrogenous fertilisers used in the cultivation of OSR (See Figure 30). Reduction in fertiliser usage might seem the obvious answer to this issue, but often the resulting reduction in yield actually produces a worse GHG profile than the high nitrogen scenario. Road transport is responsible for 28% of the EU’s CO2 emissions and more than 90% of the predicted increases up to 2010. Biofuels have significant potential to reduce this impact and the energy efficiency of cultivation of biofuel crops and their conversion into usable energy is critical to their effectiveness in abating climate change. A second major source of GHG emissions is temperature control in buildings: for instance, buildings are responsible for around half the total energy use in the UK and the vast majority of this energy is used for heating. Using current technology, heating medium to large scale buildings with woodchip can reduce GHGs by over 90%. Although it is not usually predicted that competition for land will be an issue in the immediate future, it may become so in the longer term. It is therefore maybe worth noting that use of land to grow crops to manufacture biopolymers can save more GHGs per hectare than using the same land to grow energy crops [97].
6.2. Pollution
Often products derived from crops are biodegradable and therefore do not persist in the environment. A good example of the environmental benefit of this is lubricants. Biolubricants derived from vegetable oils are usually free of aromatics, biodegradable and non-water polluting. This has led a number of European member states to introduce incentives or legislation to encourage their use in environmentally sensitive areas. Although bio-based products usually score better than their petro-chemical counterparts in greenhouse gas emissions, they usually score worse in the potential to cause eutrophication.
The Promotion of Non-Food Crops
PE 363.789 52
This is because nitrogenous fertilisers or organic manures that are applied to the crops have the potential to pollute waterways causing excess algal growth.
6.3. Biodiversity
The most important effects on biodiversity arising from non-food uses of crops will come from those crops that are cultivated at very large scale i.e. fuel and energy crops. These include traditional arable crops such as wheat, potato and oil seed rape and novel crops such as Miscanthus and Short Rotation Coppice. In the case of traditional crops, the Farm Scale Evaluations carried out in the UK revealed the importance of crop management systems in biodiversity of agricultural landscapes. However, these management systems are likely to be similar for traditional crops whether they are grown for a food or non-food purpose i.e. Biodiversity effects will arise from landscape level changes in scale of cultivation of certain traditional crops rather than alterations in agricultural practice. Although the 2% target for biofuels in transport is not expected to dramatically affect scale of cultivation, the 5.75% 2010 target could require up to 25% of agricultural land to be devoted to biofuels in the EU-25 member states [36]. For novel crops, there is some evidence that Short Rotation Coppice enhances the biodiversity of some agricultural landscapes [112], although its widespread cultivation may have quite profound effects on the hydrology of an area [110]. Some studies on Miscanthus suggest that this energy crop may have a poorer level of diversity than other crops. The biodiversity impact of cultivation of other novel crops for non-food purposes is likely to be less because of their smaller scale of cultivation. In addition, many novel crops, such as hemp, require lower agricultural inputs of fertiliser and pesticides and can assist in accumulation of carbon in the soil. These properties, together with the new ecological niches they introduce into the agricultural landscape are likely to have a positive influence on biodiversity.
6.4. Waste minimisation
Non-food uses of crops can impact on many aspects of waste management and minimisation. The most widely cited benefit is the biodegradability of many products derived from crops. However, this is only a benefit if the material is segregated into a waste stream destined for energy production or composting; if biodegradable products are mixed into waste that will be landfilled, they will produce methane, which has a far higher global warming potential than CO2, and many sites do not collect methane effectively. Biodegradable plastics derived from crop-based materials have niche applications such as food packaging and agricultural mulch films, which will enable recovery through composting in food wrapping. Also some agricultural wastes are present in excess, and can be used for energy generation without compromising soil stability or fertility. 6.5. Health and safety
Non-food products derived from crops usually have health and safety benefits when substituting for conventional alternatives. For instance, introduction of vegetable-oil based metal working fluids into car manufacturing reduces oil mists with associated reductions in respiratory disorders. Insulation products based on renewable materials such as wool and plant fibres present much lower hazards to operatives than do alternative products such as glass fibre. There

The Promotion of Non-Food Crops
PE 363.789 53
are instances, however, where renewable materials can present new hazards, for instance biodegradable oils may support growth of pathogenic micro-organisms.
6.6. Recommendations
In order to maximise the potential GHG savings from adoption of biofuels, reduce the eutrophication potential of bio-based products and the area of land needed to satisfy demand for fuel, energy and materials, research should be funded to develop cultivars of oilseed and carbohydrate crops with lower demands for nitrogenous fertilisers as well as management practices that reduce inputs without compromising yield.
Support should be offered to assist in introduction of new conversion technologies that reduce emissions from biofuel production and increase its efficiency.
An EU-wide monitoring system should be established to ensure that biodiversity within the EU is not compromised by bio-based production of fuel, energy, and materials.
Figure 29: Comparison of Greenhouse gas emissions using different bio-energy technologies [61]
0 0.01 0.02 0.03 0.04 0.05 0.06 0.07 0.08
Reference technology - Diesel from crude oil
Rapeseed oil from oilseed rape (64%)
biodiesel from oilseed rape (53%)
biodiesel from recyled vegetable oil (85%)
Ethanol from lignocellulosics (w heat straw ) (85%)
Ethanol from sugar beet (54%)
Ethanol from w heat (67%)
Reference technology: - heat from oil-f ired boiler
Heat (small scale) by combustion of w ood chip (93%)
Reference technology - Electricity - UK Grid
Electricity (large scale) by combustion of w ood chip (86%)
Electricity (large scale) by combustion of miscanthus (84%)
Electricity (large scale) by combustion of straw (55%)
Electricity by gasif ication of w ood chip (96%)
Electricity by pyrolysis of w ood chip (91%)
CHP (large scale w ith industrial load) by combustion of w ood chip (95%)
CHP (small scale) by gasif ication of w ood chip from SRC (97%)
Source: Elsayed et al 61
N.B.: Figure in brackets is the % saving using reference technology.

The Promotion of Non-Food Crops
PE 363.789 54
Figure 30: Representative Greenhouse Gas Outputs for Biodiesel Production from Oilseed Rape in the UK
Source: Coombs et al 11
cultivation less credit7%
esterification23%
oil extraction3%
storage1%
refining2%
distribution2%
transport3%
drying2%
nitrogen fertiliser57%
The Promotion of Non-Food Crops
PE 363.789 55
7. Review of impact on consumer prices In the short term, consumer prices for non-food products derived from crops are likely to be higher than for equivalent materials derived from fossil or mineral resources. The major reasons underlying this is:
1. Usually renewable feedstock is more expensive than non-renewable. 2. Technologies for converting renewables into industrial products are in their infancy and
are competing with mature and refined technology. 3. Crop-based materials are usually manufactured in small facilities and do not benefit from
the economies of scale enjoyed by their competitors. 4. The environmental cost of competing materials is usually externalised and bio-based
materials often gain no financial advantage from their lower environmental impact. In some cases, however, the performance advantages of natural materials actually reduce costs and lower the price of the final product. For instance, the lubricity of vegetable oil metal working fluids has extended the working life of engine machinery in the automotive industry. Natural fibres are lighter and fracture less easily than glass fibre leading to their widespread use in car panels. Starch-based polymers can replace carbon black in tyres, improving tyre performance and reducing fuel use. As illustrated in Figure 6, the high price of oil is making renewable feedstocks price-competitive with mineral oil and therefore increasing the cost of petrochemical derived products. Consumers can see a direct effect of this e.g. the price of polyethylene is rising because of the cost of the petrochemical feedstock. Interestingly, at an oil price of $24 per barrel, ethylene can be manufactured from bioethanol as cheaply as from petrochemicals and using a much less energy intensive process. The price of oil will have a major impact on the competitiveness of agricultural products as feedstock for materials, where tax is a less important component of the price to the consumer than in fuel. In the longer term, consumer prices for crop-derived materials will fall as new technologies and economies of scale start to impact and measures are taken to internalise the environmental cost of competing materials.
7.1. Case studies
Figure 31 compares the price of polyethylene, which uses a petrochemical feedstock, with two starch-based polymers manufactured in the EU, two polymers that are manufactured at a commercial scale in the USA and one which is manufactured at development scale. This illustrates that scale of production has a huge impact on price and also shows that commercial bio-polymers are approaching the price of established competing materials. Table 22 shows that natural fibre insulation is around three times the price of glass fibre insulation but has a number of advantages, to some of which a monetary value is attached (e.g. performance and handling safety). A monetary value is starting to be added to some of the environmental advantages, e.g. legislation is driving up the cost of waste disposal, but others e.g. renewability and embodied energy still have no price tag. Transport of the bulky insulation material from France adds around thirty percent to the cost of product in the UK, whereas glasswool is widely manufactured and incurs lower transport costs.

The Promotion of Non-Food Crops
PE 363.789 56
Figure 31: Prices of some renewable polymers December 2004
0
2
4
6
8
10
12
Starch:Novamont,Mater-Bi
Starch:Rodenberg,
Solanyl
PHBPolyester:Metabolix,dev scale
PLAPolyester:
Cargill Dow,Natureworks
PTTPolyester: DuPont: Sorona
Polyethylenereference
euro
/kg
Source: Smith116
Table 22: Comparison of cost and advantages of natural versus glasswool insulation in the UK Isonat natural hemp fibre insulation £7-10 per m2 Rock wool insulation £2 - 3 per m2 Advantages of natural fibre insulation over rock wool insulation:
Environmental Embodied energy Waste minimisation Renewable materials
Technical Thermal properties Acoustic properties Fire performance Certification
Social / Economic Health Agricultural opportunity Sustainability
Commercial Customer requirements Availability Technical support
Source: Newman117

The Promotion of Non-Food Crops
PE 363.789 57
8. Impact of non-food uses of crops on farm incomes across Europe
8.1. European farm incomes – the context
Total income from farming has been somewhat unstable over recent years (see Figure 32) due to fluctuating market prices for commodity crops such as wheat, oilseed rape, sugar beet, maize and potatoes as well as factors like poor climate conditions. Input prices have shown a 1.6% increase from 2003, primarily from increased prices for energy; fuel, fertilisers and chemicals. However, this has not been reflected in the end product price paid to the producer, thus having a negative effect on income [84]. Figure 33 and Figure 34 illustrate changes in farm income seen over recent years in the EU-15 and the new Member States. The latter can expect a substantial rise in real income due to direct income payments, the effects of rural development and increased productivity. Enlargement of the EU has added some 30% to the land available for agricultural production, but gross value added (GVA) of agriculture is only expected to increase by some 6% in the short term [9, 37]. Following CAP reform and introduction of the Single Farm Payment, an overall initial decline in real incomes has been predicted, prior to a rise from 2008 onwards as growers gain confidence in the new scheme and become involved in new enterprises and therefore new market streams. Overall, agricultural income can be expected to rise by some 8.5% by 2009 [37]. CAP reform means that growers are now free to consider new market opportunities such as those presented by non-food crops. It is hoped this will stabilise income, reduce the risk presented to growers by fluctuating market prices and secure increased incomes for the more active and entrepreneurial farmers [56].
8.2. Effect of non-food crops on farm incomes - general
The opportunity offered to farmers by non-food markets are as diverse as the applications – ranging from use of straw bales for building houses to cultivating high value pharmaceutical plants under highly controlled conditions. It is therefore difficult to make generalisations on the effect on farm incomes of non-food uses of crops. What is clear, however, is that non-food crops are only likely to have a positive impact on farm incomes if two mechanisms are in place:
1. Production volume is regulated Production volume must be regulated through means of grower contracts, meaning the markets are secure prior to commitment from the growers. If this is not the case there is a significant risk of over production, causing market flooding and a severe fall in price.
2. Minimum guaranteed price is secured The minimum price paid to the grower must be above the cost of production - under the new Single Farm Payment scheme growers are financially better off leaving ground fallow in comparison to marketing crops at a lower value than it costs to produce.
By way of example, a study recently carried out by the Economic Analysis Division of the Directorate-General of Agriculture in Belgium shows that an increase in production of non-food crops would only have a positive impact on incomes if a minimum price can be guaranteed for harvested product. Table 23 provides details of production costs for three major feedstocks to the bioethanol industry. The minimum guaranteed price for harvested material must equate to at

The Promotion of Non-Food Crops
PE 363.789 58
least the total cost of production to make production economically viable. Therefore, prices paid by a bioethanol plant to the producer of wheat, sugar beet and potatoes must be at least €162.5 per tonne, €25.79 per tonne and €55.17 per tonne respectively for agricultural incomes to see a positive effect (see Table 23). Work is still underway in Belgium for data on oilseed rape, however it is currently estimated that rape oil costs approximately €0.47/litre for the farmer to produce, hence the price paid to the producer must exceed €192.23 per tonne, for income to see a positive impact.
8.3. Biomass for solid fuel
The Renewable Energy targets set for 2010 and 2020 offer real opportunities for income generation in the rural economy. Energy crops offer the most significant opportunity to increase farm incomes since many energy crops can be grown on marginal land where returns are low. However, the restrictive Maximum Permitted Area of 1.5 million hectares, which can be entered into the Energy Crops Scheme, could limit production potential. There is also some opportunity for farmers to add value to agricultural wastes through supplying straw or manure for energy generation. It has been estimated that 500,000 jobs could be created in the EU agricultural industry to provide primary biomass fuels for the 2020 target for renewable energy production [81]. Renewable energy technologies use less imported goods and services than conventional energy technologies, so their use provides great stimulus to both direct and indirect employment in domestic manufacturing. Whilst biomass does offer new opportunities for income generation, the €45/ha energy crop payment to producers is negligible compared with the total support offered by some Member States for generation of renewable energy. Even with secure contracts in place, energy crop growers can be exposed to loss of income through failure of the operator that they are supplying (see 10.9.3). As for other non-food uses of crops, growers can gain extra income through participation in processing of the crop.
8.4. Transport biofuels
With the backing of a European Directive, biofuels offer a growing market for both cereals and oilseeds which can absorb surpluses and stabilise prices for commodity crops. Although there is no obvious reason why the biofuel market should pay more to the grower than food and feed markets for the same crops, oilseed rape grown for biofuels offers a number of opportunities for farmers to increase income. The crop can be grown on set-aside or non set-aside land under the new SPS and can generate additional aid under the Energy Crops Scheme if grown on non set-aside land. Also it can be cultivated using conventional equipment and machinery as required for cereal cultivations and hence does not incur additional investment, and finally farmers are becoming better educated on the cultivation of oilseed rape and productivity is continually increasing. There is also an opportunity for growers to gain income through ownership of the plant that converts the crop to fuel. Following the reform of the Common Agricultural Policy a slight decline in cereal production has been predicted, hence reducing the value of income generated by the cereals industry. By contrast oilseed revenues, including those for non-food production, are expected to rise slightly, between 0.7 – 1.1% Gross Agricultural Output (GAO) resulting from increased productivity and the additional aid received by the crop under the Energy Crops Scheme [37].

The Promotion of Non-Food Crops
PE 363.789 59
Biofuels have a good employment balance, generating around 16 jobs per kilotonne oil equivalent, nearly all in rural areas [70].
8.5. Crops grown for other markets
High incomes can be gained from growing speciality crops – Figure 35 illustrates a UK example of returns from the specialist industrial oilseed crop, Crambe. The overall impact of speciality crops on farm incomes is not likely to be significant in the immediate future, however, because the areas involved are minor. It is particularly important for farmers to grow speciality crops to contract, as the individual markets for each crop are relatively small and over production can easily occur. It is not clear what effect non-fuel and energy uses of commodity crops is likely to have on farm incomes, other than when grown under contract on set-aside. The areas of land are not enormous and often the crop-derived materials are purchased as commodities, the price being defined by the food market. In the new Member States, the impact on farm incomes seen by the introduction of non-food crops is predicted to be minimal. Many of the new Member States expect non-food crops will remain a niche and relatively small scale industry and will therefore have no significant impact [102]. Figure 32: Total income from farming per head (‘000 Euro per AWU, real terms 2002 prices)
Source: Eurostat84

The Promotion of Non-Food Crops
PE 363.789 60
Figure 33: Index of the real income of factors in agriculture per annual work unit in the EU-15 (base year 2000)
0
20
40
60
80
100
120
140
160
2001 2002 2003 2004
Inde
x of
real
agr
icul
tura
l inc
ome
(200
0 ba
se y
ear) be
dk
de
gr
es
fr
ie
it
lu
nl
at
pt
f i
se
uk
Source: Eurostat84
Table 23: Production costs of non-food crops for bioethanol production (average 1996 – 2003)
Cost per hectare (€ per hectare) Crop Yield (t/ha)
Bioethanol production per tonne
(L/T)
Bioethanol production per hectare
(L/ha) Operations Ground Material Total
Cost per
tonne (€ / t)
Cost per litre (€ / t)
Wheat S. Beet Potatoes
8 70 41
349 100 125
2,792 7,000 5,125
450 955 1,412
500 500 500
350 350 350
1,300 1,805 2,262
162.5 25.79 55.17
0.47 0.26 0.44
Source: Lixon101
Figure 34: Index of the real income of factors in agriculture per annual work unit in the New Member States (base year 2000)
0
50
100
150
200
250
300
2001 2002 2003 2004
Inde
x of
real
agr
icul
tura
l inc
ome
(200
0 ba
se y
ear)
cz
ee
lv
lt
hu
mt
pl
si
sk
Source: Eurostat84

The Promotion of Non-Food Crops
PE 363.789 61
Figure 35: Guideline for returns in the UK on the novel oilseed crop, Crambe [100]
Inputs / Outputs Units Unit Cost (€) Input Total (€)
Seed (tonnes per year) 1250t
Oil Yield 375t 752 per tonne 281,905
Meal Yield 875t 120 per tonne 105,250
Outputs Output Total
(€)
Labour 1250 hrs 7.50 per hour 9,400
Power 1250 hrs 1.50 per hour 1,880
Agronomy 500 hectares 256 per hectare 127,800
Gross Margin 248,075
Source: CNAP et al 100 Assumptions: 10 farmers in a ring each growing 50 hectares at seed yield 2.5 tonnes per hectare, 1,250 tons per year, and the oil is sold into the industrial sector at low value. If selling seed direct the gross margin would be: €163 per tonne x 1250 tonnes = €135,000, therefore a difference of €30,000, equating to €24 per tonne of seed produced.

The Promotion of Non-Food Crops
PE 363.789 62

The Promotion of Non-Food Crops
PE 363.789 63
9. The role of standards in promoting non-food uses of crops The industrial use of crops is new and still small in both value and volume terms. It will only be successful, if it delivers high quality products, which build consumer confidence. Low quality will have negative effects not only on the company producing or marketing individual products, but on the entire industry. Establishment of standards that are supported by manufacturers, original equipment manufacturers, and consumers as well as Governments is an essential pre-requisite for quality, economy, industrial efficiency and a key issue in development of new products and international markets through eliminating barriers to the free flow of goods. There are three ways in which standards can be used to promote non-food uses of crops:
1. establishment of standards that are more easily satisfied by renewable materials than those based on petrochemicals;
2. standards to ensure that bio-based products achieve a quality equivalent or better than petrochemical competitors;
3. standards that require a certain proportion of renewable material. We have selected three standards that exemplify these approaches. The first, EN 13432, provides a standard for compostability that applies to all packaging regardless of whether it is of petrochemical or renewable resources. The second is a standard for biodiesel, i.e. one that is specific to a non-food material from a crop. Our third example is a standard for lubricants that underpins a European eco-label, which requires a certain proportion of renewable material in products that carry the label. It should be noted that these examples all arise from established bodies represented on the International Standards Organisation (ISO). However, there are a range of other technical specification or standardising documents such as company standards, codes of practice, public contract specifications and regulations. These can be very influential e.g. the World-Wide Fuel Charter specifications for maximum percentages of biodiesel in blends may limit adoption of biodiesel.
9.1. Standard that can be satisfied more easily by renewables
Packaging consumed approximately 14.5 million tonnes of plastic within the EU-15 in 2002. EN 13432 is one of five packaging standards mandated by the Commission to implement the Packaging and Packaging Waste Directive (94/62). It specifies requirements and procedures to determine the compostability and anaerobic treatability of packaging and packaging materials. Many of the plastics that can now be produced from renewable materials are compostable, unlike most petrochemical polymers. EN 13432 has enabled development of a logo for biodegradable packaging, including biodegradable plastic, which is accepted by industrial composters and waste management authorities across the EU. Further, a number of European manufacturers of biodegradable polymers have signed an Environmental Agreement in the Form of a Unilateral Industry Self-Commitment concerning Biodegradable and Compostable Polymers which is founded round EN 13432. They aim to guarantee that the environmental performance of the polymers complies with internationally agreed technical specifications, thereby enhancing consumer confidence, lowering environmental impacts, and contributing to sustainable development in industrial production. It has also enabled exemption of compostable plastics from the “Green Dot” scheme in Germany, reducing costs for waste disposal.

The Promotion of Non-Food Crops
PE 363.789 64
The European Standard EN13432 has played a crucial role in development and stabilisation of the market for biodegradable polymers, which is mainly based on materials that use renewable feedstocks.
9.2. Standard for a bio-based product - biodiesel
Standards are important for producers, users and suppliers of biodiesel. Authorities need them for evaluation of risks to health, safety and the environment. Original Equipment Manufacturer (OEM) guarantees will be invalid if the fuel used in their vehicles is not approved by them. ie standards are a pre-requisite for introduction of biodiesel into the market. European standards for biodiesel for automotives (EN14214) and for heating (EN 14213) were mandated by the Commission at the beginning of 1997 arising from its white paper on renewable energy. EN14214 was introduced in 2003 replacing standards that had been established in Austria, Czech Republic, France, Germany, Italy and Sweden. ASTM international, formerly known as the American Society for testing and materials, approved a standard for 100% biodiesel, ASTM D6751, in 2001. Both standards have been developed for stand alone, 100% pure biodiesel which allows their use in extension of mineral diesel in blends from 5% upwards. Standards for biodiesel have been introduced in Australia, Canada and Brazil and are under consideration in Japan, South Korea and Argentina. These are mainly based on the European and ASTM standards. The European standard for biodiesel is generally regarded as the most stringent. An important characteristic of both the EN and ASTM standards is that they specify the physical and chemical attributes needed for satisfactory operation of the end product and do not restrict either the source of raw material or the manufacturing process. This “fit for purpose” approach enables innovation whilst ensuring the quality of the end product. As is the case for the packaging standard described above, the standard is being used by the American biodiesel industry to develop a voluntary fuel supplier certification program, BQ-9000.
9.3. Standard requiring a minimum proportion of renewable raw material - lubricant
Lubricants are consumed in volumes sufficient to have an impact on CO2 emissions and a significant proportion are used in total loss applications such as chainsaw oils, or are spilt into the environment accidentally. They often contain compounds that are bio-accumulative and have a high potential to pollute the aquatic environment. The need for ecologically benign lubricants was reflected in the existence of national eco-labels in a number of European countries. They were therefore selected as a product group for fast-tracking through the European eco-labelling system. Under Regulation (EC) No 1980/2000, the Community eco-label may be awarded to a product possessing characteristics which enable it to contribute significantly to improvements in relation to key environmental aspects. The eco-label provides an assurance of environmental performance that is recognised throughout the EU and obviates the need for multiple registrations through the individual eco-labelling schemes of member states. Eco-labels have been established for product groups ranging from domestic appliances to camp sites. The important criterion from the perspective of encouraging use of crop-derived feedstocks is a requirement that products qualifying for the eco-label contain a minimum proportion of renewable raw material - 45 – 70% depending on the product group. This is on the basis that use of renewable raw materials is inherently more sustainable as well as reducing CO2 emissions.

The Promotion of Non-Food Crops
PE 363.789 65
9.4. Recommendations Introduction of minimum levels of renewable raw material into eco-standards. Development of transparent, publicly available data together with a widely accepted
tool for LCA assessment at a European level to reveal life cycle benefits of renewable raw materials and underpin environmentally benign procurement strategies.
Development of harmonised standards for the bio-energy market. Persist with “fit for purpose” approach to bio-based products.

The Promotion of Non-Food Crops
PE 363.789 66

The Promotion of Non-Food Crops
PE 363.789 67
10. Review and assessment of incentives for non-food uses of crops across Europe
The majority of EU Member States now have renewable related policies in place; however there is a great deal of variation in use, legislation, incentives and market supported. Currently the majority of incentives apply specifically to energy-related markets, but there are programmes in place in some member states to support other renewable materials such as natural fibre insulation, biodegradable polymers, and biolubricants. Uptake of renewable energy has been slow and it has been widely predicted that, at current levels of activity, the targets set for renewable energy by 2010 will not be reached. Lack of progress in implementing biomass-based capacity is largely responsible for the shortfall, so there is some urgency in developing effective incentives for biomass-based renewable energy production. The range of support measures includes:
Production support for instance the energy crops scheme. Direct market support founded in regulation (e.g. the RES-E and biofuels directives)
and implemented via (a) market price support (feed-in tariffs (FITs), (b) fiscal stimulation or (c) market volume support (renewable portfolio standards (RPS) or tenders).
Investment support through tax breaks, subsidies or low interest rate loans. Research, Development and Demonstration funding. Public information campaigns.
Table 25 summarises the measures in place in the EU member states in 2004 to support biomass energy applications.
10.1. Production Incentives
As discussed in Part I, the Energy Crops Scheme permits growers to receive an additional area based payment of €45 per hectare for all dedicated energy crops grown on non-set aside land together with up to 50% of the costs of establishment of perennial energy crops. Uptake of production incentives has been low and some member states therefore have schemes in place to supplement the basic payment. For instance, in the UK schemes offer establishment grants for short rotation coppice and Miscanthus and up to 50% of the costs for setting up producer groups through funding administrative, capital and training costs for a limited period. The €45 per ha production subsidy is a blunt instrument because it is based on a unit of land rather than a unit of energy: for instance the €45/ha energy crop payment translates to ~ €1 GJ for OSR compared with approximately €0.22 per GJ for SRC (assuming an average yield of 11 tonnes per hectare of SRC and an energy content of 18 GJ/t [72] and 40 GJ/ha for OSR [36]). Like other energy subsidies, production support can divert material from existing, commercially viable non-food supply chains, such as oleochemicals [75]. Although production support may provide a limited stimulus to production of energy crops, market support is probably a more effective instrument.

The Promotion of Non-Food Crops
PE 363.789 68
10.2. Investment Incentives
Investment incentives are important to offset the large capital investments required to create biomass supply chains. Structural Funds currently operate in all EU Member States with the aim to support economic development and reduce the differences between regions, it is suggested such funds could provide a key funding source for bioenergy and renewable based investments, particularly in the new Member States. As can be seen from Table 25, capital grants or preferential loans to support biomass are widespread in the EU member states. However, experience with other renewable technologies has shown that supporting investment in plant rather than in output of energy can have drawbacks such as overstating capacity and inefficient performance [76]. There is also little opportunity for the State to pass on the cost of support to consumers.
10.3. Feed-in-tariff (FIT) support systems
A feed in tariff is the price per unit of electricity that a utility or supplier has to pay for renewable electricity from private generators. The rate is mandated by law and is usually fixed for a period 5-15 years. Spain, France Denmark and Germany all have successful feed-in laws that have helped put Europe in the lead for renewable energy use throughout the world. The Czech Republic has also recently adopted this approach. The additional cost of the renewable electricity is borne by the State or can be passed on to consumers. This mechanism has proved successful in a number of countries by rapidly increasing the production and use of renewable energy, however, as it contains no payments relating to efficiency of production, it is often perceived as an inefficient means of energy procurement. The effectiveness of FIT in stimulation of renewable energy production depends on the commercial attractiveness of the pre-set rate – too high a rate will lead to over-shoot and too low a rate to undershoot of policy goals. This demands significant foresight on the part of the regulator.
10.4. Renewable Portfolio Standard (RPS) support schemes
The renewable portfolio standard is a requirement for generators, retail suppliers or consumers of electricity to source a minimum percentage of their electricity from eligible renewable resources. The RPS scheme can be supported by a system of “Tradable Green Certificates” which certify that the renewable electricity is from an eligible renewable resource and hence complies with the RPS regulation. The tradable green certificate enables areas which can produce renewable energy at low cost (e.g. from forest residues in some of the new member states) to sell their production to areas where renewable generation has higher costs. This reduces the overall cost of implementing renewable energy generation. TGCs can also be used as the basis of “Green Pricing Schemes” where organisations can volunteer to pay a premium for “green” electricity. RPS is relatively new in the EU, with schemes in place in the UK, Belgium and Sweden as well as voluntary schemes in the Netherlands and Finland. RPS is used effectively in Japan, Australia and several states in the USA. It relies almost entirely on the private market for its implementation. Its supporters claim that market implementation will result in competition, efficiency and innovation that will deliver renewable energy at the lowest possible cost.

The Promotion of Non-Food Crops
PE 363.789 69
10.5. Fiscal Support Schemes
Tax based investment incentives are becoming increasingly popular, designed to increase the availability of investment capital for the commercial exploitation of renewable energy. Individual and corporate investments in renewables projects receive tax reductions or exemptions. Ireland, Denmark, the Netherlands, Germany and Greece currently operate a tax incentive scheme for investment in renewable energy projects [105]. A number of countries have introduced taxes on fossil fuel derived products to reflect the theoretical value of damage caused to the environment, a factor which is not currently taken into consideration in current market prices. Products derived from renewable resources are exempt from such charges thus making market prices more competitive. Reduction in tax on vehicle fuel has proven an effective means to stimulate the market for bio-fuel and the industry that produces it – The leading position of Germany in production and consumption of biodiesel can largely be attributed to a zero tax policy on this biofuel. Several other EU states have introduced tax breaks in an effort to meet targets in the biofuels directive. In France, a scheme of tax exemptions for biofuel production (i.e. a corporation tax concession) has been operating.
10.6. Government Procurement
Government and its agencies are very large scale consumers of a huge range of products and therefore have significant market influence. Exertion of this power to support environmentally friendly products is recognised as an effective means to support sustainable development. The Green Procurement Guide which was published by the European Commission [105] recognises the importance of renewable raw materials as a criterion for environmentally friendly procurement strategies. Public sector procurement has been widely used at a local scale for biofuels in public transport or public sector vehicles and at a national scale for biolubricants. Local scale procurement can be an effective stimulant for biomass energy applications e.g. heating public buildings with biomass will stimulate local production of wood fuel. However strategies implemented at a national level can have larger scale effects. Globally, the most important example of procurement incentivisation is the bio-based products law in the USA, announced under the Farm Security and Rural Investment Law (2002) under which all Federal agency’s must be committed to purchasing only materials of which a high proportion is derived directly from agricultural resources.
10.7. Public Information Campaigns
Five member states, France, Belgium, Germany, the Netherlands and the UK have established national centres with a specific responsibility for collation and publication of information on non-food uses of crops. These organisations work together at a European level through the European Renewable Raw Materials Association and are all active in the DG Enterprise ad-hoc committee on Renewable Raw Materials. Further, at a European level, BioMatNet and Managenergy collate and disseminate online information on EU-funded research, policy and regulation relating to renewable raw materials and bioenergy. The effectiveness of information gathering and dissemination as a mechanism of support is difficult to quantify, although availability of information is clearly a pre-requisite for introduction of agricultural materials to the EU’s industrial base. The number of unique visitors
The Promotion of Non-Food Crops
PE 363.789 70
on a website gives some idea of the usefulness of the resource however – the BioMat website averages 10,000 unique visitors each month and the UK NNFCC over 3,000.
10.8. Negative aspects of support for bioenergy
Under the 2001 guidelines on state aid for environmental protection, state aid is permitted up to €0.05 per kWh to support introduction of new sources of renewable energy. The diversity in both level and nature of incentives for bio-energy (see Table 24 and Table 25) works against a genuine, union-wide internal market for renewable energy in general and bio-energy in particular. Although EU-wide targets for renewable electricity and transport fuel are in place, renewable heat does not yet feature in renewable energy targets. Heating is one of the most CO2–efficient ways to use biomass for energy and has added advantages in creating local employment for rural communities. In some cases subsidy for renewable fuel and energy can compromise existing industrial markets for agricultural products. For instance there have been complaints from the oleochemical industry that State support for biodiesel is increasing the costs of feedstock for products such as lubricants and surfactants [75].
10.9. Examples of successful and unsuccessful incentivisation
10.9.1. The Market Introduction Programme (Germany) Germany has market introduction programmes in place for natural fibre insulation and biolubricants as well as biodiesel. In these programmes the State funds the initial cost of substituting a non-renewable product with a renewable one and some of the ongoing costs over the following three years. This funding is backed up by an awareness building campaign and information resource as well as an extensive programme of R&D&D. The programme is funded by the German Ministry of Agriculture and administered by, FNR, the German agency responsible for R&D in renewable raw materials. The support provided by the MIP removes the risk and cost of converting to biolubricants for the end-user thus stimulating the market. The enlarged market in turn stimulates the development of an industry based on renewables, increases the scale of production and provokes innovation. Importantly, the subsidy is temporary so the danger of creating an industry dependent on State support is limited – the new industry must make its way unprotected in the longer term. Since the biolubricant MIP programme was launched, over 1,700 projects have been supported, more than 7,000 vehicles and machines have been converted and user information has been distributed via a range of media to consumers and the general public to demonstrate the effects.
10.9.2. Procurement by Government agencies (UK) The UK Environment Agency recognised the environmental damage arising from the contamination of environmentally sensitive areas such as forest floors through the use of non-biodegradable lubricants in chain saw oils and hydraulic equipment. In the late 1990s the Environment Agency introduced a requirement that all their contractors should use biodegradable lubricants in their chain saws and hydraulic plant. Other agencies, such as the Forestry Commission and Waterways authorities, followed suit shortly afterwards with local

The Promotion of Non-Food Crops
PE 363.789 71
authorities now beginning to specify similar products. The outcome of this policy is a major penetration of vegetable oil based lubricants in the chain saw market. Most of the biodegradable hydraulic oils which have been introduced to satisfy the requirement are mineral rather than vegetable oil based, because no requirement for renewable component has been included in the specification. An important aspect of incentivisation through public sector procurement is retention of competition amongst suppliers and hence downward pressure on price.
10.9.3. ARBRE Project (UK) The ARBRE plant was the first in the UK generating electricity from wood, with a capacity to generate 10MW, of which 80% would be exported to the grid and 20% used to run the plant. With a requirement of 43,000 oven dried tonnes of wood fuel per year the plant offered a significant opportunity for local farmers who were required to grow 1,500 ha of Short Rotation Coppice (SRC) within a 40 mile radius and tied into 12-year contracts to supply the plant. Costing £30 million in total, this project received EU grant funding to the value of £10 million, plus £3 million from the UK Department for Trade and Industry. Unfortunately, after just eight days the plant ceased operation leaving growers with 1,500ha of semi-mature SRC and no market. It illustrates the risk farmers face if they are dependent on one customer for their product. The plant closure was due to several factors, including design problems, loss of interest by parent company and lack of continued financial support in launch period. This example has led to a fall in confidence of UK growers and made future biomass developments difficult to justify.
10.10. The international context
Bio-based renewables are recipients of significant incentivisation in the USA. For instance the US budget for renewable raw materials for 2005 includes [103]:
Renewable energy programmes receiving $389 million, including $82 million specifically for biomass and biofuels.
$15.5 million allocated to value-added producer grants. $1.5 million for federal procurement of biobased products. $1 million for Biodiesel fuel education. $23 million allocated to renewable energy and energy efficiency. $14 million for biomass research and development. $100 million for the National Bioenergy Programme.
10.11. Recommendations
There is a need to harmonise support for bio-energy through the EU to create a union-wide internal market that will purchase agricultural products for energy purposes. This support should be based on the environmental benefit accruing and should be linked to CO2 trading.
A mandatory requirement for renewable heat generation will stimulate efficient use of biomass as a renewable energy source and development of new local markets for agricultural products.
The maximum area eligible for energy cropping subsidy needs to be increased. Public procurement strategies that support introduction of materials derived from bio-
based renewable raw materials need to be put in place.

The Promotion of Non-Food Crops
PE 363.789 72
Table 24: Member State incentives for adoption of bio-lubricants
Country Type of Incentive Germany Market Introduction programme re-imburses the cost of substituting mineral
lubricants in operating machinery to lubricants containing at least 50% renewable mass content.
Scandinavia Tax exemption on biolubricants. Italy Tax exemption on biolubricants. Portugal Regulation mandating biolubricant in 2 stroke engine oil in outboard engines France R&D programme. Netherlands Tax incentive allowing accelerated depreciation on environmental investments UK Procurement requirement of a number of Government Agencies for
biodegradable lubricants in chain saws and hydraulic machinery operating in environmentally sensitive areas.
Belgium Regulation requiring use of biolubricants in operations near non-navigable waters.
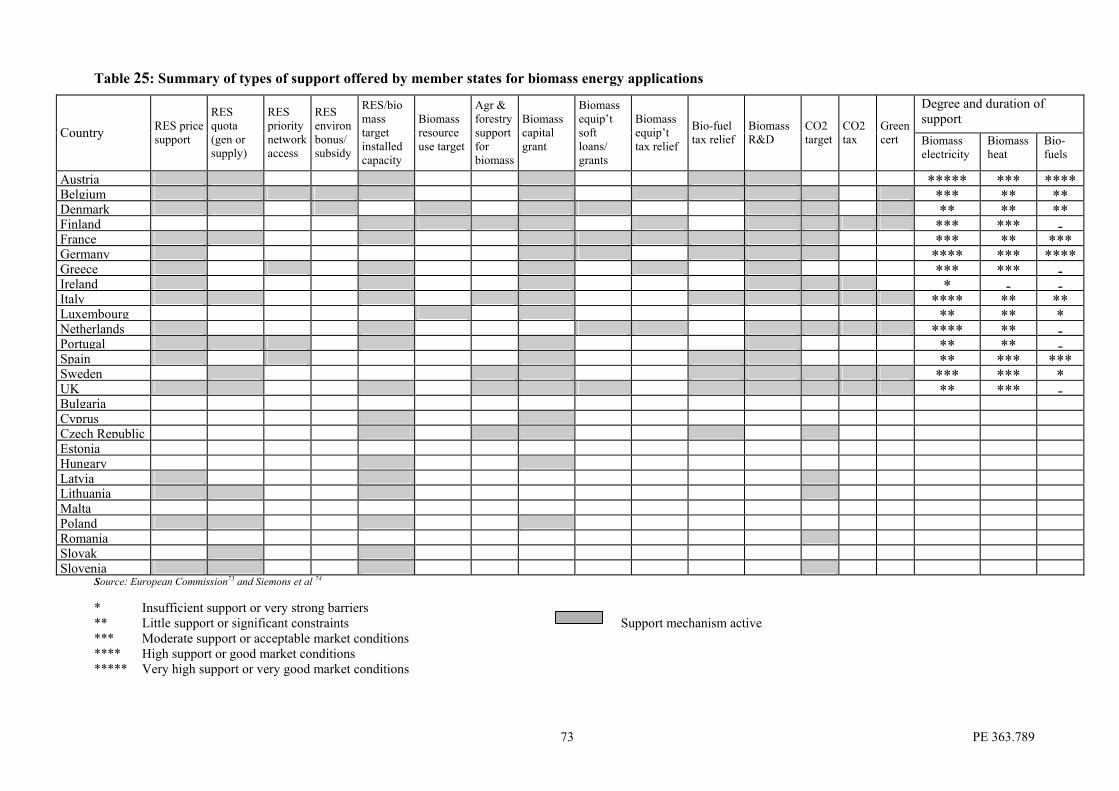
PE 363.789 73
Table 25: Summary of types of support offered by member states for biomass energy applications
Degree and duration of support
Country RES price support
RES quota (gen or supply)
RES priority network access
RES environ bonus/ subsidy
RES/biomass target installed capacity
Biomass resource use target
Agr & forestry support for biomass
Biomass capital grant
Biomass equip’t soft loans/ grants
Biomass equip’t tax relief
Bio-fuel tax relief
Biomass R&D
CO2 target
CO2 tax
Green cert Biomass
electricity Biomass heat
Bio- fuels
Austria ***** *** ****Belgium *** ** **Denmark ** ** **Finland *** *** -France *** ** ***Germany **** *** ****Greece *** *** -Ireland * - -Italy **** ** **Luxembourg ** ** *Netherlands **** ** -Portugal ** ** -Spain ** *** ***Sweden *** *** *UK ** *** -Bulgaria Cyprus Czech Republic Estonia Hungary Latvia Lithuania Malta Poland Romania Slovak Slovenia
Source: European Commission73 and Siemons et al 74 * Insufficient support or very strong barriers ** Little support or significant constraints Support mechanism active *** Moderate support or acceptable market conditions **** High support or good market conditions ***** Very high support or very good market conditions

The Promotion of Non-Food Crops
PE 363.789 74

The Promotion of Non-Food Crops
PE 363.789 75
11. Review of Investment in Research, Development and Demonstration of non-food crops and uses
For farmers to gain additional non-food markets for their crops, new technologies for conversion of agricultural products into industrial materials are needed. Since it is the industrial markets, which will ultimately control whether agricultural products are used in industry, this section focuses on research, development and demonstration related to industrial application of crops, rather than research on crops.
11.1. RD&D in Europe – the context
In March 2002, the Barcelona European Council set a target for the EU to increase the average research investment level from 1.9% of GDP at present to 3% of GDP by 2010, two thirds to be funded by the private sector [76]. This should be set against a research investment in the United States which currently exceeds that of the European Union by more than €120 billion per annum, thus compounding the long-term potential for innovation, growth and employment creation in Europe [76]. The availability of renewable materials from agriculture for energy and materials varies geographically within the EU and individual member states have their own specific research programmes to satisfy local needs. This said, outside the framework programmes, there is little co-operation between member states on research into bio-based materials and energy, which weakens technical progress at a European level. There is also an urgent need to integrate researchers from the new member states into the European Research Area. Many research problems for non-food uses of crops are generic and best tackled at a European level.
11.2. EU funded RD&D
Usually EU-wide research programmes are not specific to non-food crops, biomaterials and bioenergy, however many integrate a factor of renewables in some form. It is therefore often difficult to determine the level of spend on specific activities. Table 26 highlights the major EU-wide RD&D funding programmes of relevance and their financial allocations where available. Frameworks 2, 3, 4 and 5 contained budgets dedicated to non-food crop-related research and it is possible to identify a total EU spend of at least €386 million specifically on industrial use of crops between1988 and 2002. Biomass for energy has been the primary recipient of EU RD&D funding and an example of the types of technology that have been funded in this area is shown in Figure 36. Framework Programme 6 funded little non-food crop research other than biomass for energy and biofuels for transport (within the sustainable development tranche of funding see Table 26). Framework 7, however, includes high profile roles for “Technology Platforms” which bring together senior representatives from industry, academia, and Government to develop strategic research priorities. Renewable raw materials are central to the industrial biotechnology technology platform and it can therefore be expected that non-food crop research will have a higher profile in Framework 7 than in Framework 6. An important aspect of all research programmes is dissemination and archiving of results. Non-food crop research is unique in the EU in having an effective mechanism in place for this through the BioMatNet website.

The Promotion of Non-Food Crops
PE 363.789 76
Europe has ongoing problems in many fields in commercialising research, and non-food crop research is no exception. The high cost of patenting is often cited as one reason for this, together with poor communication between academia and industry, especially SMEs. There are some success stories, however. For instance, European investment in RD&D has contributed significantly to the leading role of Europe in starch-based biodegradable polymers and biolubricants. An effective mechanism for SMEs to benefit from European RD&D is the COST programme, which will pay a research provider to undertake research for a group of SMEs. A number of renewable projects have been undertaken within this programme (see Figure 38 and Figure 39). One important development in overcoming the fragmentation of research into energy from biomass is an ERA-NET in bioenergy, which brings together research funders from Austria, Germany, the Netherlands, UK and Finland to establish common areas of interest, with the option of eventually pooling a proportion of their budgets for bioenergy research [106].
11.3. National funding programmes
Most European states invest in renewable energy research to a lesser or greater extent (see Table 27) and the collective R&D spend of the member states is much greater than that of the EU (see Figure 40).However, many of the less active Member States have no specific budget for non-food crop R&D at present. In the early nineties many countries allocated funds specifically for bioenergy or biomaterial research and development, however very little of this work was commercialised and the funding was therefore withdrawn. Most newly acceding states plus Spain, Finland and Ireland for example currently have no budget allocated to the research and development of non-food crops and biomaterials, aside from energy related support [101, 102, 108]. Germany is currently the most active of the Member States with a total R&D budget in excess of 53 billion Euros, almost 150 million of which is dedicated specifically to non-food crops, uses and technologies (including biomass and transport biofuels) [108]. From the outset the French renewable organisation, AGRICE (Agriculture for Chemicals and Energy) has focused on energy uses, specifically the use of renewable materials for heat and electricity generation. Since 1994 AGRICE has pursued a double-pronged programme aimed at both energy and chemicals. Between 1994 and 2000 AGRICE supported more than 300 research projects, equating to some 500 million Francs in total [107]. Belgium has a budget in excess of €10 million dedicated specifically to biomaterial and bioenergy development, the majority of which is devoted to biodegradable polymers under the Agrofood Valley programme [101]. The UK Government has recently doubled expenditure on non-food crop research to £2 million per annum and in addition allocated a further £1.3 million per annum to promote innovation through supply chain assessment, development and dissemination. Department of Trade and Industry (DTI) has also recently allocated £7 million of funding to support collaborative R&D projects that address bio-based industrial products and processes. Preceding the above programmes the CIMNFC LINK programme ran from 1996 – 2002, providing funding for innovative, pre-competitive research into industrial competitive materials from non-food crops, with a total budget of £13 million, constituting £6 million Government funding and £7 million industry contribution. Biomass energy and fuel R&D programmes are also significant.

The Promotion of Non-Food Crops
PE 363.789 77
11.4. Recommendations
• Support should be provided to maintain and extend the dissemination platform for European RD&D on biomaterials provided by BioMatNet.
• Integration of national RD&D activities into bio-materials is needed at a European level possibly through the ERA-NET scheme.
• A significant EU-wide research programme on technology for conversion of biomass, especially ligno-cellulosics, into energy, fuel and chemicals is needed.

The Promotion of Non-Food Crops
PE 363.789 78
Table 26: EU wide funding programmes for biomaterials, bioenergy and biofuels Programme Description & project details Duration Budget Details and breakdown TOTAL Budget
(EU Contribution) Second Framework Programme (FP2)
ÉCLAIR, 42 projects Improving links between agriculture and industry, encouraging progress in life sciences and biotechnology.
1988 – 1993
EU contribution 65 MECU 65 MECU
Third Framework Programme (FP3)
AIR (Agriculture and Agro-Industry) 1990 – 1996
Total 300 MECU, EU contribution 145 MECU Spend distribution (AIR):
Biomass energy (15%) Green chemicals and polymers (25%) Forest and forest products (25%) Non-food Crops (5% Non-Food Demonstration (30%)
300 MECU (145 MECU)
FAIR – Renewable biomaterials, 63 RTD projects
Total cost 98 million euro, contribution from EU 60 million euro. Spend distribution (FAIR):
Bulk chemicals (9 mio € EU, 18 mio € total) Non-wood fibre (11 mill € EU, 20 mill € total) Bioplastics (16 mio € EU, 26 mio € total) Cosmetics / Pharma (8 mio € EU, 12 mio € total) Food supplements (15 mio € EU, 22 mio € total) Medicinal (5 mio € EU, 7.6 mio € total) Biological control (9 mio € EU, 15 mio total)
98 million € (60 million €)
FAIR – Forest wood chain, 39 projects EU contribution of 38 mio euros (38 million €)
Fourth Framework Programme (FP4)
FAIR / JOULE / THERMIE Bioenergy projects
1994 – 1998
FAIR 20 mio euro JOULE 45 mio euro THERMIE 35 mio euro [see Figure 36Figure 36 and Figure 37]
100 million €
Fifth Framework Programme (FP5)
FP5 – QLK5.2 Non-food research, 21 projects 1998 - 2002
Total cost 72 mio €, EU contribution 43 mio € 72 million € (43 million €)

The Promotion of Non-Food Crops
PE 363.789 79
Quality of Life – Subject Area QLK5.1.1 Sustainable agriculture – plant systems, 25 projects QLK5.3.1 Multifunctional management of forests, 36 projects QLK5.3.2 The Forestry-wood chain, 27 projects QLK3 The Cell Factory, 65 projects QLK1 Food, Nutrition and Health, 5 projects
EU contribution 42 mio € EU contribution 46 mio € EU contribution 33 mio € EU contribution 108 mio € EU contribution 6 mio €
(236 million €)
Consisting of four Thematic Programmes; Quality of Life and Management of Living
Resources User-Friendly Information Society Competitive and Sustainable Growth Energy, Environment and Sustainable Dev.
The total budget for the fourth and most relevant theme was 2,125 mio €, 1,083 mio € of which was dedicated to the Environment and Sustainable Development sub-programme and 1,042 mio € for the Energy sub-programme [see Figure 37].
2,125 million €
Sixth Framework Programme (FP6)
At the Lisbon summit in March 2000, EU Governments called for a better use of European research efforts through creation of an internal market for science and technology – a ‘European Research Area’. No direct non-food research.
2002 - 2006
Total budget is 17,883 mio €; 2,329 for sustainable development, global change and ecosystems and 1,429 for nanotechnologies and nanosciences, knowledge based multifunctional materials and new production processes and devices.
3,758 million €
Seventh Framework Programme (FP7)
The Commission is proposing to run the seventh framework programme over a seven year period, the structure to be decided.
2007 - 2013
A total budget of 72,726 mio € has been proposed, a further breakdown of which is not yet available.
COST (Cooperation in the field of Scientific and Technical Research)
COST is one of the longest running European initiatives encouraging co-operation between scientists and researchers across Europe.
Annual programme - ongoing
Total expenditure in 2004 exceeded 16 mio €, however split between the 14 activity areas the programme funded a significant number of smaller projects at the research stage [see Figure 38/Figure 39].
16 million €
Intelligent Energy for Europe
A new multi-annual programme aimed at providing financial support for local, regional and national initiatives in the field of renewable energy, energy efficiency, the energy aspects of transport and international promotion.
2003 - 2006
A total budget of 200 mio € divided into four fields; SAVE – improving energy efficiency. Budget –
69.8 mio € ALTENER – the promotion of new and renewable
energy for the production of heat and electricity Budget – 80 mio €
STEER –supporting initiatives relating to renewable transport fuels. Budget – 32.6 mio €
COOPENER - supporting promotion of renewable energy in developing countries. Budget – 17.6 mio €
200 million €
Source: Eurostat84, European Commission113 and European Commission114

The Promotion of Non-Food Crops
PE 363.789 80
Figure 36: Distribution of projects and EU funding by research activities within the three
programmes covering Biomass in FP4
Source: European Commission63
Figure 37: Funding provided to FP3 and FP4 for the Environment and MAST Programmes and FP5 for the Environment and Sustainable Development Sub-Programme
Source: European Commission113

The Promotion of Non-Food Crops
PE 363.789 81
Figure 38: COST Expenditure Distribution by domain (2004)
Source: European Commission11
Figure 39: Number of COST Actions by domain (2002 – 2004)
Source: European Commission11

The Promotion of Non-Food Crops
PE 363.789 82
Table 27: Total expenditure per EU Country on RTD&D for RES in 2001 (Million Euro)
Source: European Commission114
Figure 40: The overall financing of RTD&D for RES in Europe in 2001 (EU and European Member States – Government and Private Sector)
Source: European Commission114

The Promotion of Non-Food Crops
PE 363.789 83
12. Bibliography
1. Holmes, C., Summary Report for the European Union 2000-2005, IENICA, 2005. 2. Non-Food / Non-Feed Industrial Uses of Agricultural Products for Alberta: A review of
Research and Development, Crop Diversification Centre North, Alberta Agriculture, Food and Rural Development, 2003.
3. Johansson, D., Renewable Raw Materials - a way to reduced greenhouse gas emissions for the EU industry?, DG Enterprise, 2000.
4. Working Group 'Renewable Raw Materials', Current Situation and Future Prospects of EU Industry Using Renewable Raw Materials, ERRMA, 2002.
5. Cresson, E., Success stories from the Agro-Industrial Research Programmes, European Commission, 1998.
6. Renewable Bioproducts, European Commission, 1997. 7. Report from the Commission to the Council on production trends in the various Member
States and the impact of the reform of the common organisation of the market in flax and hemp grown for fibre on the outlets and economic viability of the sector, European Commission, 2003.
8. Turner, R., Report of Cereal Industry Review, HGCA, London, 2004. 9. Reform of the Common Agricultural Policy: Medium-Term Prospects for Agricultural
Markets and Income in the European Union 2003 - 2010, DG Agriculture, European Commission, 2003.
10. Smith, N. O., Maclean, I., Mille, F. A., and Carruthers, S. P., Crops for Industry and Energy in Europe University of Reading, United Kingdom, 1997.
11. Coombs, J., and Hall, K., Assessment of the Commercial Successes of the AIR programme (1990 - 1996) in the area of Biomaterials and Green Chemicals (Non-Food), CPL Press, Newbury, 2002.
12. Defra, Third Annual Report of the Government Industry Forum on Non-Food Uses of Crops, Department for Environment, Food and Rural Affairs, London, 2004.
13. Rexen, F., Non-Food Production and Research in Scandanavia, IENICA, 2004. 14. Vannini, L., and Venturi, G., Report on non-food production and research in
Mediterranean, IENICA, 2004. 15. Ruckenbauer, P., Update Report from the State of Austria, IENICA, 2004. 16. Falisse, A., Update Report from the State of Belgium, IENICA, 2003. 17. Rexen, F., Update Report from the State of Denmark, IENICA, 2003. 18. Keskitalo, M. and Kontturi, M., Update Report from the State of Finland, IENICA,
2003. 19. Rocher, M. and Host, S., Update Report from the State of France, IENICA, 2003. 20. Gildhorn, K., Update report from the State of Germany, IENICA, 2003. 21. Koukios, E. G., and Georgopoulos, S., Report from the State of Greece, IENICA, 2003. 22. Donnelly, A., Rice, B., and Jones, M., Update Report from the Republic of Ireland,
IENICA, 2003. 23. Kjellin, M., Update Report from the State of Sweden, IENICA, 2004. 24. Copeland, J., Update Report from the State of the United Kingdom, IENICA, 2004. 25. Venturi, G., Update Report from the State of Italy, IENICA, 2003.

The Promotion of Non-Food Crops
PE 363.789 84
26. Summary Report by the Ministry of Agriculture of the Czech Republic: of the situation on agriculture, food-processing industry, forestry and water management, Ministry of Agriculture, Prague, 2003.
27. Agriculture and Rural Development Overview for Estonia, Ministry of Agriculture, Republic of Estonia, 2003.
28. Estadisticas, S. G., Resumen Nacional: Superficies y Producciones Agricolas, Ministerio de Agricultura, Spain, 2004.
29. Grinberga, M., Agriculture and Rural Land Area of Latvia, Ministry of Agriculture, Republic of Latvia, 2004.
30. Agriculture of Lithuania 2004, Ministry of Agriculture, Republic of Lithuania, 2004. 31. Renewable Energy Policy in Latvia, European Renewable Energy Council (EREC),,
Brussels, 2004. 32. Agriculture and Rural Development Operational Programme: Republic of Hungary
2004 - 2006, Ministry of Agriculture and Rural Development, Budapest, 2003. 33. The Rural Development Plan for Malta, 2004 - 2006, Ministry for Rural Affairs and the
Environment, Malta, 2004. 34. Rural Development Plan 2004 - 2006: Slovak Republic, Ministry of Agriculture, Slovak
Republic, 2004. 35. Korbitz, W., New Markets for Biodiesel in Modern Common Rail Diesel Engines, 2005. 36. Kavalov, B., Biofuel Potentials in the EU European Commission Joint Research Centre,
Brussels, 2004. 37. Prospects for Agricultural Markets and Income 2004 - 2011 for EU-25, European
Communities, Luxembourg, 2004. 38. Leguen de Lacroix, E., The Common Agricultural Policy Explained, DG Agriculture,
European Commission, 2004. 39. Ahner, D., CAP Reform and EU Enlargement: The future of the European Agricultural
Policy, DG Agriculture, European Commission, 2004. 40. EU Agriculture and Enlargement, European Commission, Brussels, 2003. 41. Agricultural Situation in the Candidate Countries: Country Report on Cyprus, European
Commission, Brussels, 2002. 42. Agricultural Situation in the Candidate Countries: Country Report on the Czech
Republic, European Commission, Brussels, 2002. 43. Agricultural Situation in the Candidate Countries: Country Report on Estonia, European
Commission, Brussels, 2002. 44. Agricultural Situation in the Candidate Countries: Country Report on Hungary,
European Commission, Brussels, 2002. 45. Agricultural Situation in the Candidate Countries: Country Report on Latvia, European
Commission, Brussels, 2002. 46. Agricultural Situation in the Candidate Countries: Country Report on Lithuania,
European Commission, Brussels, 2002. 47. Agricultural Situation in the Candidate Countries: Country Report on Malta, European
Commission, Brussels, 2002. 48. Agricultural Situation in the Candidate Countries: Country Report on Poland, European
Commission, Brussels, 2002. 49. Agricultural Situation in the Candidate Countries: Country Report on the Slovak
Republic, European Commission, Brussels, 2002.

The Promotion of Non-Food Crops
PE 363.789 85
50. Agricultural Situation in the Candidate Countries: Country Report on Slovenia, European Commission, Brussels, 2002.
51. Karus, M., Kaup, M., and Lohmeyer, D., Study on Markets and Prices for Natural Fibres (Germany and EU), Nova Institute, Germany, 2000.
52. Farmers, Suppliers of Renewable Raw Materials for Energy and Industry in Response to the Major Challenges Facing Society Today, COPA-COGECA, 2003.
53. UK Report to the Commission on Biofuels, 2004. 54. McLaren, J., The Technology Roadmap for Plant/Crop Based Renewable Resources
2020, Renewables Vision 2020, Executive Steering Group, US, 1999. 55. Baricevic, D., Bernath, J., et al., Report of a Working Group on Medicinal and Aromatic
Plants, International Plant Genetic Resources Institute, Rome, 2004. 56. Reform of the Common Agricultural Policy: A Long-term perspective for sustainable
agriculture (Impact Analysis), European Commission, Brussels, 2003. 57. Foreman, L., and Lohmeyer, D., Characteristics and Production Costs of U.S. Soybean
Farms, USDA, 2002. 58. Henniges, O., and Zeddies, J., Competitiveness of Brazilian ehtnol in the EU, 2004. 59. Henniges, O., and Zeddies, J., Economics of bioethanol production in the asia-pacific:
Australi - Thailand - China F.O Lichts, 2005. 60. Fuel ethanol production in the USA and Germany - a cost comparison, 2003. 61. Elsayed, M. A., Matthews, R., and Mortimer, N. D., Carbon and energy balances for a
range of biofuel options, 2003. 62. Engguidanos, M., Soria, A., Kavalov, B., and Jensen, P., Techno-economic analysis of
bio-diesel production in the EU: a short summary for decision makers European Commission Joint Research Centre, 2002.
63. Biomass: Energy resource for the European Union, European Communities, Brussels, 2000.
64. Frost & Sullivan Award Underscores Novamont's Profile as Product Innovator, Business Wire, 2004.
65. Cargill Dow's World-Scale PLA Facility a Major Step in Sustainable Business Practices, Natureworks, 2002.
66. European Investor Relations Roadsho, 2005. 67. Urbanchuk, J.M ., Macro-economic ipacts of S.1058, 2002. 68. LoGerfo, J., Fermentation funding fervour, 2005. 69. Investment in biodiesel should reach $515 million in three years, Agencia Brazil, 2005. 70. The Share of Renewable Energy in the EU, European Commission, Brussels, 2004. 71. Public consultation on the biomass action plan, European Commission, 2005. 72. Renewable Energy Sector in the EU: its employment and export potential, Ecotec
consulting, 2002. 73. The share of renewable energy in the EU: Country Profiles, European Commission,
2004. 74. Siemons, R., Vis, M., van den Berg, D., McChesney, et al., Bio-Energy's role in the EU
energy market: A view of developments until 2020, European Commission, 2004. 75. Oleochemicals firms seek fairness with biodiesel, 2005. 76. Jansen, J.C. Policy support for renewable energy in the European Union: a review of the
regulatory framework and suggestions for adjustment, 2003. 77. Investing in research: an action plan for Europe, European Commission, Brussels, 2003.
The Promotion of Non-Food Crops
PE 363.789 86
78. R&D investment targets and current trends, European Commission, Brussels, 2004. 79. New Jobs in the field of renewable energy and rational use of energy in the European
Union, Predac Project, 2003. 80. The Impact of Renewables on employment and economic growth, Ecotec consulting,
1999. 81. CAP Reform Summary: Special Edition Newsletter, European Commission, Brussels,
2003. 82. Petersen, J., and Hoogeveen, Y., Agriculture and the Environment in the EU Accession
Countries, European Environment Agency, Belgium, 2004. 83. Canola Council of Canada website, 2005. 84. Eurostat website, 2004. 85. Chemical Market Reporter: Prices & People, 2005. 86. Eurostat website, 2005. 87. USDA website: Crop statistics, 2004. 88. Meijer, E.J., Sustainability and Innovation, DSM, 2002. 89. Industrial or White Biotechnology: A driver for sustainable growth in Europe, 2004. 90. The Share of Renewable Energy in the EU, Brussels, 2004. 91. Renewables Information 2004, International Energy Agency, OECD, 2004. 92. European Biodiesel Board: The EU Biodiesel Industry, Belgium, 2004. 93. Turley, D. et al., Environmental Impact of Cereals and Oilseed Rape for Food and
Biofuels in the UK HGCA, London, UK, 2005. 94. Greene, N. et al., Growing Biofuels: How biofuels can help end America's oil
dependence, NRDC, USA, 2004. 95. European Climate Change Programme, Report June 2001. 96. Braganza, R., and Fowler, P., Industrial Markets for Starch, Biocomposites Centre,
Bangor, Wales, 2004. 97. Crank, M., Patel, M., et al., Techno-economic Feasibility of Large-scale Production of
Bio-based Polymers in Europe (PRO-BIP), Utrecht/Karlsruhe, 2004. 98. Biofuels Baromete, Observ'ER, 2005. 99. Nikolaou, A., Remrova, M., and Jeliazkov, I., Biomass Availability in Europe, 2003. 100. CNAP et al., Oilcrop.com, 2004. 101. Lixon, B., Personal Communication, 2005. 102. Kikkas, E., Personal Communication, 2005. 103. Harvesting Clean Energy, Harvesting Clean Energy eNews Bulletin, 2004. 104. Buying Green: A handbook on environmental public procurement, European
Commission, Brussels, 2004. 105. The Renewable Energy Division, DCMR, 2005. 106. Bioenergy - for a greener future, ERA-Net, 2004. 107. Agriculture for Chemicals and Energy, AGRICE, 2005. 108. Scheutte, Personal Communication, 2005. 109. Howard, D., Centre for Ecology and Hydrology, 2005. 110. Mortimer, N.D., Cormack, P., Elsayed, M.A., and Horne, R.E., Evaluation of the
Comparative Energy, Glabol Warming and Socio-Economic Costs and Benefits of Biodiesel, Defra, London, United Kingdom, 2003.

The Promotion of Non-Food Crops
PE 363.789 87
111. Hope, A., and Johnson, B., English Nature Discussion Paper on Biofuels, English Nature, United Kingdom, 2003.
112. Coombs, J., Personal Communication, 2005. 113. European Union Research Policy and Funding, European Commission, 2005. 114. European Research Spending for Renewable Energy Sources, European Commission,
Luxembourg, 2004. 115. Hewett, C., and Foley, J., Employment creation and environmental policy: a literature
review, 2000. 116. Smith, W., Personal Communication, 2005. 117. Newman, G., Personal Communication, 2005. 118. Offermann, F., Kleinhanss, W., Huettel, S., and Keupker, B., Assessing the 2003 CAP
reform impacts on German Agriculture using the farm group model FARMIS, Institute of Farm Economics, Germany, 2004.

The Promotion of Non-Food Crops
PE 363.789 88

The Promotion of Non-Food Crops
PE 363.789 89
13. Annex
Current and potential use of plant-derived materials (2004 data) Market Worldwide
Production (mio tonnes/annum)
EU Production (mio tonnes/annum)
Raw Material EU land area (ha) required
% renewable in EU (potential by 2010)
OIL 100 8.6
Surfactants / detergent / soap
17 2.4 Coconut, palm, rape, sunflower
1,440,000 20% (60-65%)
Lubricants 35 10.2 Rape, sunflower, palm, coconut
2% (20-30%)
Paints / coatings Linseed, castor, sunflower, soy, tung
Solvents 4 – 4.5 Rapeseed, coconut, Soya (US)
1.5% (12.5%)
Polymers 150 33 Soy, rapeseed, castor, linseed, sunflower
1% (5-10%)
Linoleum 56 million m2 Linseed oil, wood flour, cork dust, pine tree resins, limestone, jute backing
50,000 tonnes of linseed oil
FIBRE 50
Textiles Flax Paper and Pulp 350 95 Flax, hemp, cereal straw 37-45,000 tonnes
fibre <1%
Wood-based panels 2 Flax, hemp, cereal straw, miscanthus
6,000 ha (10%)
Fibre reinforced composites
0.25 (automotive) Flax, sisal, jute, kenaf, hemp 15% (20%)
Fibre cement composites Hemp, flax Packaging materials 0.1 (polystyrene
equivalent) Hemp, flax, cereal straw, miscanthus, RCG, sorghum
Filters + absorbents Hemp shiv, flax shiv Insulation products 29 million m3 / year Flax, hemp 25,000 tonnes fibre 4%
(10%)

The Promotion of Non-Food Crops
PE 363.789 90
Polymers + plastics Sorghum Others Starch 57 10 47%
Paper + board 2.3 (renewables) Potato, maize, cereals Biodegradable plastics 150 40 (plastic
consumption) Potato, maize, cereal, tapioca 5 million tonnes of
agricultural product 0.09 – 0.1 % (2%)
Adhesives + glues Tapioca, maize, cereals Agrochemicals Detergents 0.06 Maize, tapioca (60-65%) Paints Potato, maize, waxy maize,
wheat 25%
Cosmetics + toiletries Potato, cereal, maize Pharmaceuticals Chicory, other Textiles Maize (PLA) Water purification Potato Construction Super absorbent products
1.05 Maize (PLA), cereals
Other Speciality
Essential oils 0.06 Mint, lavender, rose, coriander, etc
Medicinal plants 0.7 Poppy, meadowsweet, etc Perfumes + cosmetics Chemicals (dyes, etc) 0.016 (indigo) Woad, madder, marigold, etc Novel products Energy
Biodiesel 1.9 OSR, Sunflower, olive, camelina, RGC
2% (5.75%)
Bioethanol Sugar beet, potatoes, chicory, cereals
2 million ha 2% (5.75%)
Biomass 56 Mtoe Miscanthus, SRC willow, RCG, sorghum, cereal straw
Up to 7.8 million ha (12%)
ource: 1, 3, 4, 51, 95, 96, 97