Embed Size (px)
Citation preview

Africa TransboundaryWater Resources SectorOutlook 2040
The Programme for Infrastructure Development in Africa:Transforming Africa through Modern Infrastructure
AFRICAN UNION»≤jôaE’G OÉ–E’G
UNION AFRICAINEUNIÃO AFRICANA
Programme for Infrastructure Development in Africa
Interconnecting, integratingand transforming a continent
AFRICA TRANSBOUNDARY
WATER RESOURCES
OUTLOOK - 2040

1
Pro
gram
me
for
infra
stru
ctur
e D
evel
opm
ent i
n A
frica
(Pid
a)TR
AN
SB
OU
ND
AR
Y W
ATE
R R
ES
OU
RC
ES
OU
TLO
OK
- A
FRIC
A 2
040
ACKNOWLEDGEMENTS
The completion of the Transboundary Water Resources (TWR) Sector Report and the TWR OutlookReport 2040 as part of the Programme for Infrastructure Development in Africa (PIDA) was a majormilestone in defining Africa’s performance and prospects in the Transboundary Water Resources sector.This helped to inform on the priority TWR projects which are now an integral part of the project investmentportfolio of the PIDA Priority Action Plan (PIDA-PAP) for the period up to 2020.
The support and collaboration of the Regional Economic Communities (RECs) and the Member Statesled not only to the success of PIDA, but also to ensuring that the ownership of PIDA rests with the RECsand Member States who are ultimately, the drivers of PIDA as well as the beneficiaries.
The African Union Commission (AUC) would like to thank those who were involved in the PIDA Study inparticular, the African Development Bank (AfDB), the NEPAD Planning and Coordinating Agency (NPCA),the United Nations Economic Commission for Africa (UNECA), the AMCOW, the River BasinOrganizations and Development Partners. Without their contribution and commitment, this landmarkstudy would not have been possible.
Special thanks are due to the following Sector Experts for their valuable contribution:l Mrs Rhoda Peace TUMUSIIME, Commissioner for Rural Economy and Agriculture, AUCl Mr. Aboubakari BABA-MOUSSA, Director of Infrastructure and Energy, AUCl Dr Abebe Haile GABRIEL, Director of Rural Economy and Agriculture, AUCl Mrs Olushola OLAYIDE, Senior Policy Officer, Water Resources, AUCl Dr Mahamoud MOUSTAPHA, Policy Officer, Water Resources, AUCl Mr Bai Mass TALL, AMCOW Secretary General, AMCOWl Mr Reginald TEKATEKA, former Chair of AMCOW-TAC and ANBO l Ms Aster Denekew YILMA, Geographic Information Systems Officer (UNECA)l Mr. Winfried ZARGES, Water and Infrastructure Manager, GIZl Mr. Harry DEBAKER, ICT Expert and Minister Counselor, EU Delegation to AU Addis Ababal The experts of all the River Basin Organizations selectedl The experts of AfDB, NPCA and RECl All the consultants who worked for this component.

2
Pro
gram
me
for
infra
stru
ctur
e D
evel
opm
ent i
n A
frica
(Pid
a)TR
AN
SB
OU
ND
AR
Y W
ATE
R R
ES
OU
RC
ES
OU
TLO
OK
- A
FRIC
A 2
040
ABBREVIATIONS, ACRONYMS AND UNITS 4DEFINITION 81. INTRODUCTION 91.1 Background 91.2 Outlook 2040 objectives 91.3 Study scope and report structure 91.4 Key messages 11
2. MACRO REGIONAL CONTEXT 122.1 Population growth 122.2 Food demand and food policy objectives 142.3 GDP growth 19
3. BASELINE: CURRENT SITUATION IN THE TRANSBOUNDARY WATER 20RESOURCES SECTOR
3.1 Surface and groundwater resources availability 203.2 Infrastructure 24
3.2.1 Reservoirs and hydropower plants 243.2.2 Irrigated areas 263.2.3 River and lake transport infrastructure 29
3.3 TWR governance 293.3.1 Africa water vision and related declarations 293.3.2 Policy, legal and institutional frameworks for surface water management 293.3.3 Policy, legal and institutional frameworks for groundwater management 30
4. FORECAST WATER REQUIREMENTS – OUTLOOK 2040 324.1 Methodology and assumptions 32
4.1.1 Reference year 324.1.2 Domestic requirements 324.1.3 Industrial requirements 324.1.4 Evaporation from reservoirs 334.1.5 Food and agricultural requirements 334.1.6 Seasonality, climate change and future water availability 344.1.7 Scenarios 354.1.8 Modeling of the water balance 36
4.2 Current and forecast water resources withdrawals and requirements at continental level 374.2.1 Analysis of food requirements (cereals) 374.2.2 Analysis of gross water requirements 384.2.3 Analysis of net water requirements 42
4.3 Current and forecast water resources withdrawals and requirements in the selected basins 434.3.1 Analysis of gross water requirements 434.3.2 Gap between supply and net requirements/level of commitment of the selected basins 46
5. INFRASTRUCTURE GAP IN THE TRANSBOUNDARY WATER 50RESOURCES SECTOR
5.1 Hydropower infrastructure gap 505.1.1 Current picture of the energy sector in Africa 505.1.2 Forecast energy demand 505.1.3 Hydropower infrastructure gap 51
5.2 Irrigation 535.2.1 Current picture of the irrigation sector in Africa 535.2.2 Irrigation infrastructure gap 53
6. CHALLENGES AND RESPONSES 556.1 Key challenges 55
TABLE OF CONTENTS
3
Pro
gram
me
for
infra
stru
ctur
e D
evel
opm
ent i
n A
frica
(Pid
a)TR
AN
SB
OU
ND
AR
Y W
ATE
R R
ES
OU
RC
ES
OU
TLO
OK
- A
FRIC
A 2
040
6.2 Response options 566.3 Governance responses 57
6.3.1 Demand management 586.3.2 Finding a right balance between rain fed and irrigated agriculture 586.3.3 Regional integration, sector integration and trade strategies 596.3.4 Benefit sharing 606.3.5 Strengthening TWRM governance frameworks 61
6.4 Investment responses 626.4.1 Increasing the efficiency of existing infrastructure 626.4.2 Building of new infrastructure 64
7. INVESTMENT NEEDS AND FINANCING OUTLOOK 677.1 Drinking water, sanitation and hygiene 677.2 Water storage for multiple uses 677.3 Irrigation rehabilitation 677.4 Irrigation expansion 677.5 Investment in response to climate change 687.6 Summary of investment needs 68
8. CONCLUSIONS 70

4
Pro
gram
me
for
infra
stru
ctur
e D
evel
opm
ent i
n A
frica
(Pid
a)TR
AN
SB
OU
ND
AR
Y W
ATE
R R
ES
OU
RC
ES
OU
TLO
OK
- A
FRIC
A 2
040
Abbreviations and acronyms
AfDB African Development Bank GroupADF African Development FundAEC African Economic CommunityAGIEAC Authority for the Integrated Water Resources Management for Central AfricaAMCEN African Ministerial Council for EnvironmentAMCOW African Ministers’ Council on WaterAMIWASH African Ministers’ Initiative on Water, Sanitation and HygieneAMU Arab Maghreb UnionANBO African Network of Basin OrganizationsANEW African Civil Society Network on Water and SanitationAU African UnionAUC African Union CommissionAWF African Water FacilityAWFTF African Water Facility Trust FundAWTF African Water Task ForceAWV African Water VisionBADEA Arab Bank for Economic Development in AfricaCAADP Comprehensive Africa Agriculture Development Programme CAR Central African RepublicCARPE Central African Region Programme for the EnvironmentCEMAC Economic and Monetary Community of Central AfricaCEN-SAD Community of Sahel-Saharan StatesCEPGL Economic Community of Great Lakes CountriesCGIAR Consultative Group for International Agricultural Research CICOS International Commission of Congo, Oubangui and Sangha river BasinsCIDA Canadian International Development AgencyCOMESA Common Market for Eastern and Southern AfricaDANIDA Danish International Development AgencyDBSA Development Bank of Southern AfricaDFID Department for International Development (UK)DNA Direcçäo Naçional de AguasDRC Democratic Republic of CongoEAC East African CommunityEAIF Emerging Africa Infrastructure FundECA Economic Commission for AfricaECCAS Economic Community of Central African StatesECOWAS Economic Community for West African StatesENSAP Eastern Nile Subsidiary Action ProgrammeEU European UnionFAO Food and Agriculture Organization (UN)FFEM Fonds français pour l’environnement mondial. (French Fund for Global Environment)GEF Global Environment FacilityGIWA Global International Water AssessmentGIZ German Agency for Development CooperationGNP Gross National ProductGWh Gigawatt hourGWP Global Water PartnershipGWPCA Global Water Partnership for Central Africa
ABBREVIATIONS, ACRONYMS AND UNITS
5
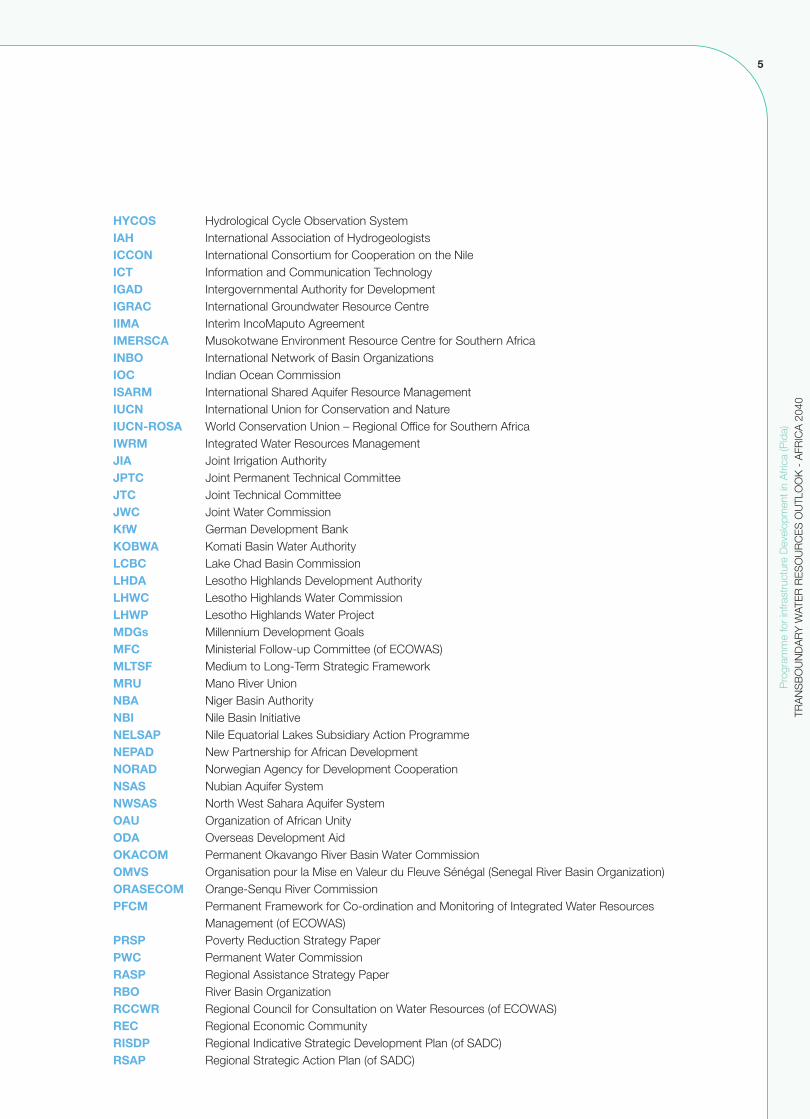
HYCOS Hydrological Cycle Observation SystemIAH International Association of HydrogeologistsICCON International Consortium for Cooperation on the NileICT Information and Communication TechnologyIGAD Intergovernmental Authority for DevelopmentIGRAC International Groundwater Resource CentreIIMA Interim IncoMaputo AgreementIMERSCA Musokotwane Environment Resource Centre for Southern AfricaINBO International Network of Basin OrganizationsIOC Indian Ocean CommissionISARM International Shared Aquifer Resource Management IUCN International Union for Conservation and NatureIUCN-ROSA World Conservation Union – Regional Office for Southern Africa IWRM Integrated Water Resources ManagementJIA Joint Irrigation AuthorityJPTC Joint Permanent Technical CommitteeJTC Joint Technical CommitteeJWC Joint Water CommissionKfW German Development BankKOBWA Komati Basin Water AuthorityLCBC Lake Chad Basin CommissionLHDA Lesotho Highlands Development AuthorityLHWC Lesotho Highlands Water CommissionLHWP Lesotho Highlands Water ProjectMDGs Millennium Development GoalsMFC Ministerial Follow-up Committee (of ECOWAS)MLTSF Medium to Long-Term Strategic FrameworkMRU Mano River UnionNBA Niger Basin AuthorityNBI Nile Basin InitiativeNELSAP Nile Equatorial Lakes Subsidiary Action ProgrammeNEPAD New Partnership for African DevelopmentNORAD Norwegian Agency for Development CooperationNSAS Nubian Aquifer SystemNWSAS North West Sahara Aquifer SystemOAU Organization of African UnityODA Overseas Development AidOKACOM Permanent Okavango River Basin Water CommissionOMVS Organisation pour la Mise en Valeur du Fleuve Sénégal (Senegal River Basin Organization)ORASECOM Orange-Senqu River CommissionPFCM Permanent Framework for Co-ordination and Monitoring of Integrated Water Resources
Management (of ECOWAS)PRSP Poverty Reduction Strategy PaperPWC Permanent Water CommissionRASP Regional Assistance Strategy PaperRBO River Basin OrganizationRCCWR Regional Council for Consultation on Water Resources (of ECOWAS)REC Regional Economic CommunityRISDP Regional Indicative Strategic Development Plan (of SADC)RSAP Regional Strategic Action Plan (of SADC)
Pro
gram
me
for
infra
stru
ctur
e D
evel
opm
ent i
n A
frica
(Pid
a)TR
AN
SB
OU
ND
AR
Y W
ATE
R R
ES
OU
RC
ES
OU
TLO
OK
- A
FRIC
A 2
040
6
Pro
gram
me
for
infra
stru
ctur
e D
evel
opm
ent i
n A
frica
(Pid
a)TR
AN
SB
OU
ND
AR
Y W
ATE
R R
ES
OU
RC
ES
OU
TLO
OK
- A
FRIC
A 2
040
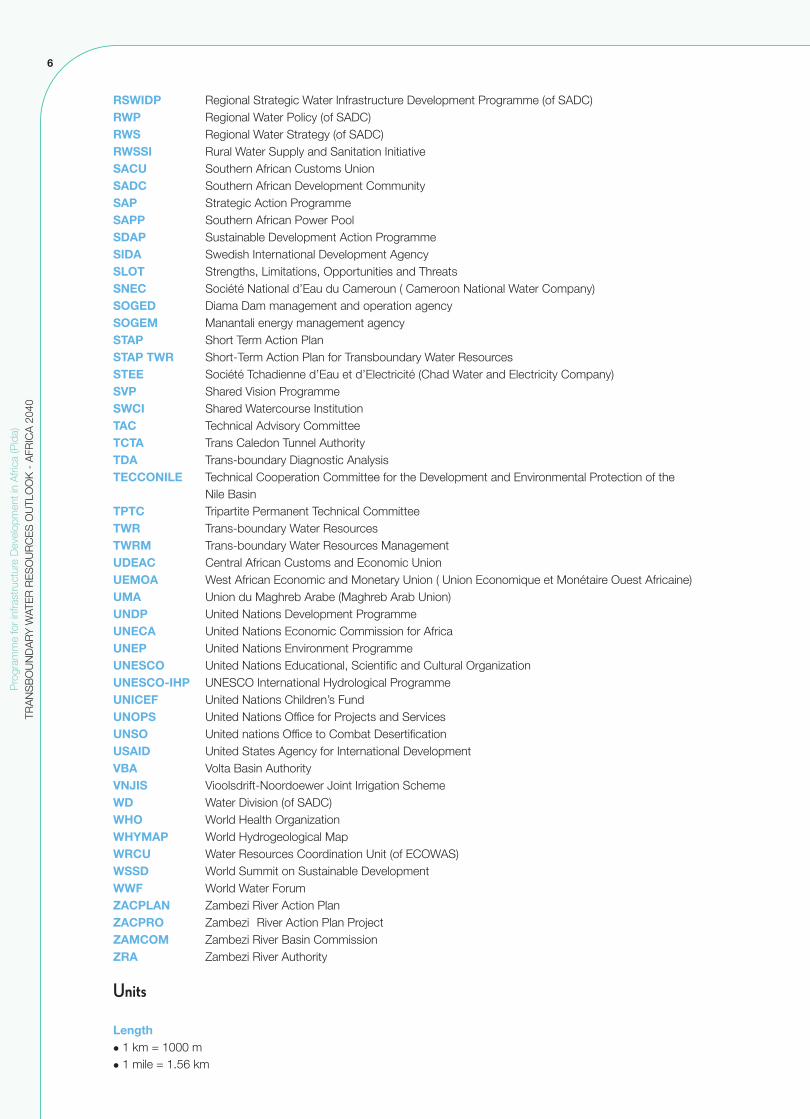
RSWIDP Regional Strategic Water Infrastructure Development Programme (of SADC)RWP Regional Water Policy (of SADC)RWS Regional Water Strategy (of SADC)RWSSI Rural Water Supply and Sanitation InitiativeSACU Southern African Customs UnionSADC Southern African Development CommunitySAP Strategic Action ProgrammeSAPP Southern African Power PoolSDAP Sustainable Development Action ProgrammeSIDA Swedish International Development AgencySLOT Strengths, Limitations, Opportunities and ThreatsSNEC Société National d’Eau du Cameroun ( Cameroon National Water Company)SOGED Diama Dam management and operation agencySOGEM Manantali energy management agencySTAP Short Term Action PlanSTAP TWR Short-Term Action Plan for Transboundary Water Resources STEE Société Tchadienne d’Eau et d’Electricité (Chad Water and Electricity Company)SVP Shared Vision ProgrammeSWCI Shared Watercourse InstitutionTAC Technical Advisory CommitteeTCTA Trans Caledon Tunnel AuthorityTDA Trans-boundary Diagnostic AnalysisTECCONILE Technical Cooperation Committee for the Development and Environmental Protection of the
Nile BasinTPTC Tripartite Permanent Technical CommitteeTWR Trans-boundary Water ResourcesTWRM Trans-boundary Water Resources ManagementUDEAC Central African Customs and Economic UnionUEMOA West African Economic and Monetary Union ( Union Economique et Monétaire Ouest Africaine)UMA Union du Maghreb Arabe (Maghreb Arab Union)UNDP United Nations Development ProgrammeUNECA United Nations Economic Commission for AfricaUNEP United Nations Environment ProgrammeUNESCO United Nations Educational, Scientific and Cultural OrganizationUNESCO-IHP UNESCO International Hydrological ProgrammeUNICEF United Nations Children’s FundUNOPS United Nations Office for Projects and ServicesUNSO United nations Office to Combat DesertificationUSAID United States Agency for International DevelopmentVBA Volta Basin AuthorityVNJIS Vioolsdrift-Noordoewer Joint Irrigation SchemeWD Water Division (of SADC)WHO World Health OrganizationWHYMAP World Hydrogeological MapWRCU Water Resources Coordination Unit (of ECOWAS)WSSD World Summit on Sustainable DevelopmentWWF World Water ForumZACPLAN Zambezi River Action PlanZACPRO Zambezi River Action Plan ProjectZAMCOM Zambezi River Basin CommissionZRA Zambezi River Authority
Units
Lengthl 1 km = 1000 ml 1 mile = 1.56 km

7
Areal 1 acre = 4047 m2 = 0.4047 ha l 1 are = 100 m2 = 0.01 hal 1 feddan = 4200 m2 = 0.42 hal 1 ha = 10 000 m2l 1 km2 = 1 000 000 m2 = 100 ha
Volumel 1 dm3 = 1 litre = 0.001 m3l 1 hm3 = 1 million m3 = 1 000 000 m3 = 0.001 km3l 1 km3 = 1 billion m3
Power and Energyl 1 GW = 1000 MW = 1 000 000 kWl 1 GWh = 1000 MWh
Pro
gram
me
for
infra
stru
ctur
e D
evel
opm
ent i
n A
frica
(Pid
a)TR
AN
SB
OU
ND
AR
Y W
ATE
R R
ES
OU
RC
ES
OU
TLO
OK
- A
FRIC
A 2
040

8
Pro
gram
me
for
infra
stru
ctur
e D
evel
opm
ent i
n A
frica
(Pid
a)TR
AN
SB
OU
ND
AR
Y W
ATE
R R
ES
OU
RC
ES
OU
TLO
OK
- A
FRIC
A 2
040
Below is a list with the definition of some of the keyterms/concepts that are used in this report:
l Water demand: The functional relationshipbetween the value of water (scarcity) and thequantity of water used.l Water requirement: Unlike true demand,requirements do not embed scarcity-sensitiveparameters. A water requirement is merely a pointon a demand curve.l Water withdrawal: The amount of waterdiverted from a source (river, lake or reservoir) orpumped from a groundwater source. This volumedoes not depend on the water requirement ordemand.l Consumption: Water withdrawn from a source(river, lake, reservoir or aquifer) and madeunavailable for further use (typically downstream) iscalled consumptive use. Worldwide, irrigatedagriculture is by far the largest consumptive usesince water is consumed by evapotranspiration forplant growth. Other examples include evaporationlosses from reservoirs, contamination/pollution anddrainage to a saline sink and incorporation into aproduct.l Gross water requirement (GWR): The volumeof water withdrawn from a river, reservoir or aquiferfor a particular use. The fraction of this volume thatis not consumed by the concerned use will beevaporated while the rest will return to the system(return flow).l Net water requirement (NWR): The volume ofwater for consumptive uses. In the context ofirrigation, the net water requirement is the volumeof water evapotranspirated by the plants plus theevaporation losses from the distribution system.l Return flow: Portion of the withdrawals that willeventually drain back to the river system and thusbe available for further use downstream.l Self-Sufficiency Ratio (SSR): Expresses themagnitude of production in relation to domesticutilization. SSR is defined by the following equation:
l Internal (surface and groundwater)renewable water resources (IRWR): Long-termaverage annual flow of rivers and recharge ofaquifers generated from endogenous precipitation.Double counting of surface water and groundwaterresources is avoided by deducting the overlap fromthe sum of the surface water and groundwaterresources. In other words, IRWR refer to the waterresources resulting from rain falling within theborders of the country (combination of surfacewater and groundwater resources). Therefore,IRWR are the only quantities that can be addedtogether for regional or continental assessments.l Global (surface and groundwater) renewablewater resources (GRWR): GRWR are obtainedby adding incoming surface water and groundwaterflows to the IRWR. GRWR take into account thesurface water and groundwater flowing fromneighbouring countries and between neighbouringcountries (rivers that form the border betweencountries). As a matter of fact, GRWR cannot beadded together for regional of continentalassessments.l Natural river discharge: The discharge of theriver (and groundwater flow) that flows into the seain natural conditions. In other words, it representsthe river discharge before the construction ofinfrastructure and withdrawals of water.l Level of commitment of a river or lake basin:The ratio between water consumption and naturalriver discharge, on an annual basis.l Blue water: The water diverted from a source(river, lake or reservoir) or pumped from agroundwater source.l Green water: The rainfall water stored in the soilthat can be used by plants.l Rain fed agriculture: Pure rain-fed agricultureuses only green water to supply the crop waterrequirements.l Irrigated agriculture: In irrigated agriculture,blue water supplements green water to satisfy thecrop water requirements.
DEFINITIONS

9
1.1 Background
Water is of strategic importance to African economies,forming an input to various sectors such as agriculture,industry, mining and power generation. In addition,water resources have the potential to be developed insuch a way as to contribute to the achievement of foodsecurity and poverty eradication objectives. Theefficient and sustainable utilisation of Africa’s waterresources is therefore a cornerstone for socio-economic development and poverty reduction on thecontinent. Increasing water and energy demands forgrowing populations and increased agricultural andindustrial production have to be achieved in theforthcoming decades.
The development of water resources use andmanagement options for Africa needs to be carried outin specific climatic, economic and governanceconditions. Key aspects in this regard include:
l A high degree of natural climatic variability, i.e.naturally variable rainfall patterns with frequentperiods of floods and drought. These are likely tobe further exacerbated by the impacts of globalclimate changel The need for the construction of large dams andassociated inter-basin transfers (IBT) largely as aresponse to the above point, in order to mitigate theimpact of the natural and human induced climaticvariabilityl Population dynamics on the continent, with mostof Africa experiencing significant population growthover the coming decades leading to acommensurate increase in water demand.l Significant variation in regional integration andgovernance frameworks for cooperativemanagement of trans-boundary water resourcesand relative underdevelopment in some regions.
With transboundary water resources constituting nearly80% of Africa’s total freshwater resources, cooperationin the management of shared water resources iscritical. In this context, increased regional cooperationand joint planning, development and management ofwater infrastructure are essential if targets foragricultural and industrial development, food security,energy security, health improvement and others sectorsare to be met. With the effects of climate change furtherexacerbating the highly variable climatic conditionsfound in most parts of the continent, the informed,
strategic selection and implementation of waterinfrastructure projects will need to be a critical factor forsustainable transboundary water resourcesmanagement and for achieving the above-mentionedobjectives.
1.2 Objectives of the Outlook 2040
The ultimate objective of the PIDA (in the TWR sector)is the selection and prioritization of critical trans-boundary water infrastructure projects and thedevelopment of an implementation framework for theseprojects based on an informed picture of the currentsituation, realistic estimates of future waterrequirements and an in-depth assessment of keychallenges and gaps that need to be addressedbetween now and the 2040 time horizon set by theprogramme.
In order to achieve this, the PIDA Study has beenstructured into two phases, which can broadly bedescribed as a diagnostic phase (Phase I) and astrategic planning phase (Phase II). This Outlook 2040Report summarizes the main findings from thediagnostic studies conducted during Phase I of PIDAand forms the basis for the development of the fullstrategic infrastructure development programme(“Strategic Framework” and “Priority ActionProgramme” (PAP)) that will form the key output fromPhase II of PIDA.
The Outlook 2040 provides policy-makers and strategicplanners in regional organisations and nationalgovernments alike with an overview of the currentsituation in the TWR sector as well as the mainchallenges faced. It also includes a range of options foraddressing the identified challenges. The resultspresented in the Outlook 2040 serve as a basis for theformulation of realistic long-term objectives, to betargeted by policies and programmes at the continentallevel in order to anchor infrastructure development intoregional integration and cooperation in Africa.
1.3 Study scope and report structure
There are about 80 international river and lake basinsin Africa (African Water Vision 2025). Most of theserivers and lakes are shared by two to four countries,although some are shared by many more: Congo andNiger (11 countries), Nile (10), and Lake Chad (8),
Pro
gram
me
for
infra
stru
ctur
e D
evel
opm
ent i
n A
frica
(Pid
a)TR
AN
SB
OU
ND
AR
Y W
ATE
R R
ES
OU
RC
ES
OU
TLO
OK
- A
FRIC
A 2
040
INTRODUCTION1.
10
Pro
gram
me
for
infra
stru
ctur
e D
evel
opm
ent i
n A
frica
(Pid
a)TR
AN
SB
OU
ND
AR
Y W
ATE
R R
ES
OU
RC
ES
OU
TLO
OK
- A
FRIC
A 2
040
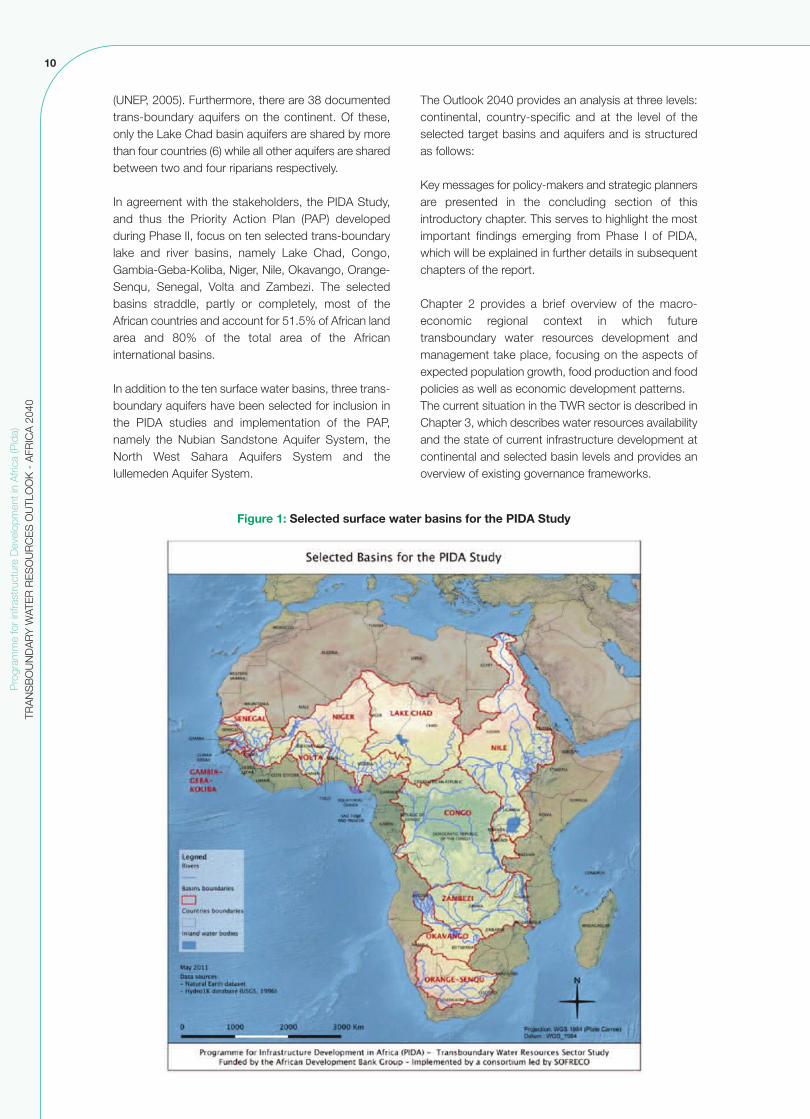
(UNEP, 2005). Furthermore, there are 38 documentedtrans-boundary aquifers on the continent. Of these,only the Lake Chad basin aquifers are shared by morethan four countries (6) while all other aquifers are sharedbetween two and four riparians respectively.
In agreement with the stakeholders, the PIDA Study,and thus the Priority Action Plan (PAP) developedduring Phase II, focus on ten selected trans-boundarylake and river basins, namely Lake Chad, Congo,Gambia-Geba-Koliba, Niger, Nile, Okavango, Orange-Senqu, Senegal, Volta and Zambezi. The selectedbasins straddle, partly or completely, most of theAfrican countries and account for 51.5% of African landarea and 80% of the total area of the Africaninternational basins.
In addition to the ten surface water basins, three trans-boundary aquifers have been selected for inclusion inthe PIDA studies and implementation of the PAP,namely the Nubian Sandstone Aquifer System, theNorth West Sahara Aquifers System and theIullemeden Aquifer System.
The Outlook 2040 provides an analysis at three levels:continental, country-specific and at the level of theselected target basins and aquifers and is structuredas follows:
Key messages for policy-makers and strategic plannersare presented in the concluding section of thisintroductory chapter. This serves to highlight the mostimportant findings emerging from Phase I of PIDA,which will be explained in further details in subsequentchapters of the report.
Chapter 2 provides a brief overview of the macro-economic regional context in which futuretransboundary water resources development andmanagement take place, focusing on the aspects ofexpected population growth, food production and foodpolicies as well as economic development patterns.The current situation in the TWR sector is described inChapter 3, which describes water resources availabilityand the state of current infrastructure development atcontinental and selected basin levels and provides anoverview of existing governance frameworks.
Figure 1: Selected surface water basins for the PIDA Study

11
Chapter 4 describes the results of the detailedmodelling and analysis work carried out during thePhase I of the PIDA Study. Following a detaileddescription of the methodology used for the modellingexercise, it presents the key findings of the waterrequirement forecast at continental and selected basinlevels for the period between now and the year 2040.Based on the results presented in Chapters 3 and 4,the existing infrastructure gap in the TWR sector forAfrica is estimated and described in Chapter 5 of thereport.
Chapter 6 presents an overview of the key challengesfacing the African TWR sector as well as possibleresponse options. Challenges facing the African TWRsector over the forthcoming three decades until 2040are presented in generic form. This is followed by a briefdescription of four key challenges and correspondingresponse options on which the PIDA programme (in theTWR sector) will focus.Based on the analysis in Chapters 5 and 6, an overviewof investment needs estimates for the TWR sector ispresented in Chapter 7, and Chapter 8 concludes thereport.
1.4 Key messages
l The population on the African continent isexpected to double between now and 2040l The demand for food (cereals) in Africa isexpected to double between now and 2040l Energy demand in Africa is expected to increase4-fold by 2040 from current levelsl Africa has the lowest level of water storagecapacity and irrigated agriculture globally, and theinfrastructure gap for hydropower generation andirrigation is largel In some African basins, the forecast waterdemand will soon outstrip available resources if noimprovements in management and efficiency of useare madel The competition between water use sectors andthe environment is likely to increase given thegrowing pressure on freshwater resources l The annual investment needs in the TWR sectorare expected to be around US$ 49 billion per yearl Investments in water infrastructure are highlydependent on integration with transport and energynetworks and are only effective if well integrated intocoherent, cross-sectoral development strategiesand infrastructure investment programmes.
Pro
gram
me
for
infra
stru
ctur
e D
evel
opm
ent i
n A
frica
(Pid
a)TR
AN
SB
OU
ND
AR
Y W
ATE
R R
ES
OU
RC
ES
OU
TLO
OK
- A
FRIC
A 2
040

12
Pro
gram
me
for
infra
stru
ctur
e D
evel
opm
ent i
n A
frica
(Pid
a)TR
AN
SB
OU
ND
AR
Y W
ATE
R R
ES
OU
RC
ES
OU
TLO
OK
- A
FRIC
A 2
040
This section describes the macro-regional context thatis likely to determine the trends of regional andcontinental water demand and thus infrastructureneeds, by 2040 in the TWR sector. The analysisfocuses on the three primary drivers for increased waterdemands in the agricultural, industrial and domesticsectors, namely:
l Population growthl Gross Domestic Production (GDP) growthl Food policy objectives
These drivers also form the basis for the continentaland basin-wide (water) demand forecasts in Chapter 4of this Report.
2.1 Population growth
Human population is increasing and, according toUnited Nations estimates, more than 8.8 billion peoplewill live on Planet Earth in 2040, with most of the globalpopulation growth expected to occur in developingcountries (United Nations, 20111). As illustrated inFigure 2, the population in Africa is expected to almostdouble between 2010 and 2040, with a percentage ofpopulation living in urban areas rising from 43.8% in2010 to 60% in 2040.In the period from 2005 (reference year) to 2040(planning horizon), the African region with the highestannual population growth rate is Eastern Africa (2.21%),followed by Central Africa (2.15%) and Western Africa(2.03%). Southern Africa is expected to experience aslower annual growth rate of 0.52% (see Figure 3). Theaverage annual population growth rate for the wholeAfrican continent is estimated to be around 1.88 %.
2. MACRO REGIONAL CONTEXT
Figure 2: Historical and forecast population in Africa
(Data source: United Nations, World Population Prospects: The 2010 revision).
1 Source: Population Division of the Department of Economic and Social Affairs of the United Nations Secretariat, World Population Prospects:The 2010 Revision, http://esa.un.org/unpd/wpp/index.htm

13
Pro
gram
me
for
infra
stru
ctur
e D
evel
opm
ent i
n A
frica
(Pid
a)TR
AN
SB
OU
ND
AR
Y W
ATE
R R
ES
OU
RC
ES
OU
TLO
OK
- A
FRIC
A 2
040
(Data source: United Nations, World Population Prospects: The 2010 Revision,http://esa.un.org/unpd/wpp/index.htm)
Figure 3: Map of demographic indicator for African regions
Africa (Data source: Gridded Population of the World, GPWv3, 2005).
Figure 4: Map of population density in Africa
14
Pro
gram
me
for
infra
stru
ctur
e D
evel
opm
ent i
n A
frica
(Pid
a)TR
AN
SB
OU
ND
AR
Y W
ATE
R R
ES
OU
RC
ES
OU
TLO
OK
- A
FRIC
A 2
040
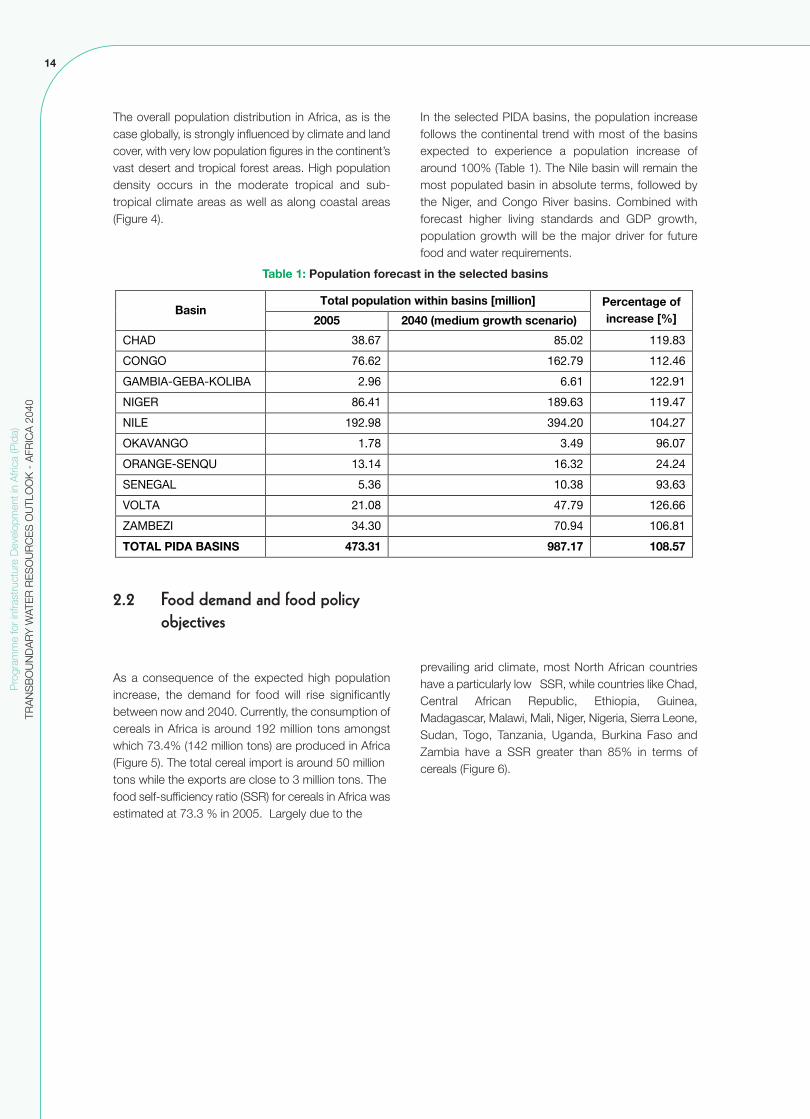
The overall population distribution in Africa, as is thecase globally, is strongly influenced by climate and landcover, with very low population figures in the continent’svast desert and tropical forest areas. High populationdensity occurs in the moderate tropical and sub-tropical climate areas as well as along coastal areas(Figure 4).
In the selected PIDA basins, the population increasefollows the continental trend with most of the basinsexpected to experience a population increase ofaround 100% (Table 1). The Nile basin will remain themost populated basin in absolute terms, followed bythe Niger, and Congo River basins. Combined withforecast higher living standards and GDP growth,population growth will be the major driver for futurefood and water requirements.
Table 1: Population forecast in the selected basins
������������������� �������������������� �������������
������������������ ���������������� ���������� �
����� ���� ���� � �������
������ � � � ��� �� ���
������������������� ��� ��� � ����
������ ����� ������ ������
����� �� ���� ���� �� ���� �
��������� ���� ����� ����
������������� ������ ��� � �� ��
�������� ���� ������ �����
��� �� ����� ���� � ��
!����!�� ������ ����� ������
�!�"#��$%"��"&$'&� �()*)+� ,-(*+(� +�-*�(�
2.2 Food demand and food policy objectives
As a consequence of the expected high populationincrease, the demand for food will rise significantlybetween now and 2040. Currently, the consumption ofcereals in Africa is around 192 million tons amongstwhich 73.4% (142 million tons) are produced in Africa(Figure 5). The total cereal import is around 50 million tons while the exports are close to 3 million tons. The food self-sufficiency ratio (SSR) for cereals in Africa wasestimated at 73.3 % in 2005. Largely due to the
prevailing arid climate, most North African countrieshave a particularly low SSR, while countries like Chad,Central African Republic, Ethiopia, Guinea,Madagascar, Malawi, Mali, Niger, Nigeria, Sierra Leone,Sudan, Togo, Tanzania, Uganda, Burkina Faso andZambia have a SSR greater than 85% in terms ofcereals (Figure 6).

15
It should be noted that in the context of food security,the SSR is often taken to indicate the extent to whicha country relies on its own production resources, i.e.the higher the ratio the greater the self-sufficiency.However, in the context of this analysis, the SSRdepicts the overall production level against total cerealdemand. Thus, where for example a large part of acountry’s production of cereals is exported, the SSRmay be high but the country may still have to relyheavily on imports of food commodities to feed thepopulation. Therefore, the SSR ration as depicted inFigure 6 is not an indicator for the level of access tofood of the population.
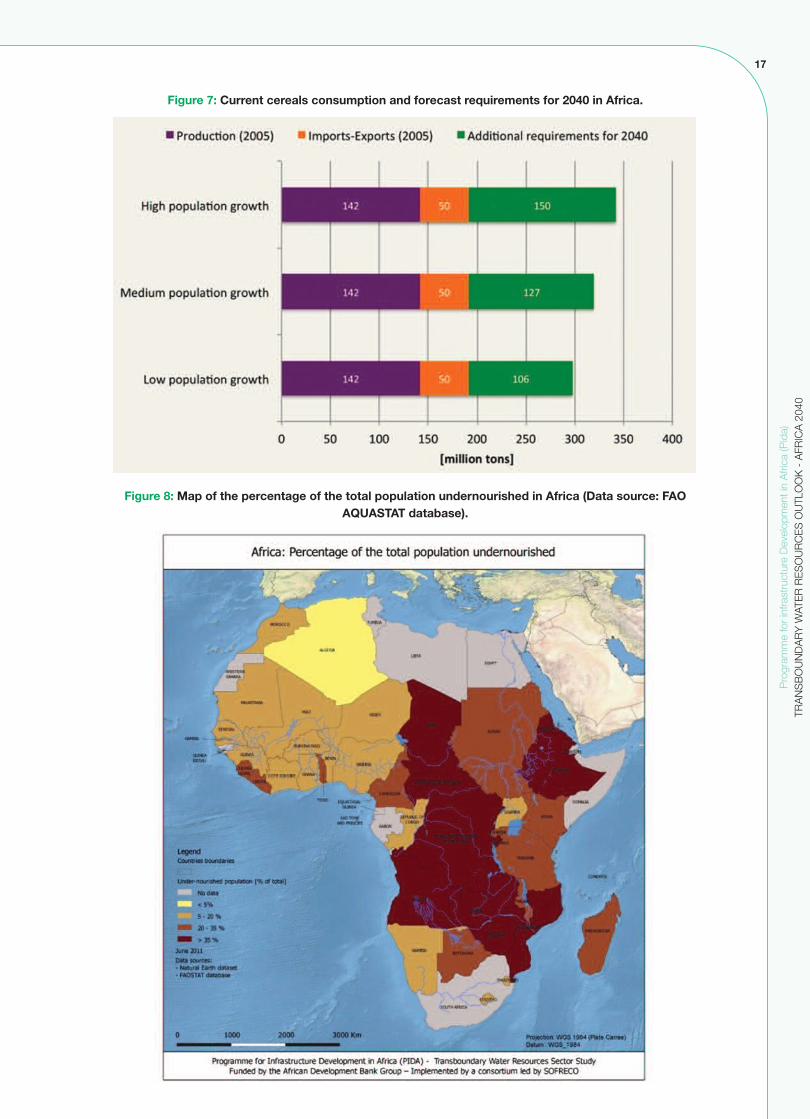
Food access remains a significant challenge in Africawith a high number of people considered
undernourished (Figure 8). Some of the countries withthe highest number of undernourished people areamong those with the highest SSR values in terms oftotal production.
Ensuring increased food production and improvingaccess to food will continue to be a key challenge forthe African continent. It is forecast (see Chapter 4 fordetails) that the increase in total cereal requirements in2040 in Africa (compared to the current situation) isexpected to range between 56% and 78%, dependingon the scenario considered (Figure 7). In terms ofcereals’ quantities, it represents an increase rangingfrom 106 to 150 million tons (compared to 192 milliontons currently).
Pro
gram
me
for
infra
stru
ctur
e D
evel
opm
ent i
n A
frica
(Pid
a)TR
AN
SB
OU
ND
AR
Y W
ATE
R R
ES
OU
RC
ES
OU
TLO
OK
- A
FRIC
A 2
040
Figure 5: Cereals consumption in Africa in 2005
(Data source: FAOSTAT database).

16
Pro
gram
me
for
infra
stru
ctur
e D
evel
opm
ent i
n A
frica
(Pid
a)TR
AN
SB
OU
ND
AR
Y W
ATE
R R
ES
OU
RC
ES
OU
TLO
OK
- A
FRIC
A 2
040
Figure 6: Map of self-sufficiency ratio (SSR) in terms of cereals for Africa
(Data source: FAOSTAT database).
17
Pro
gram
me
for
infra
stru
ctur
e D
evel
opm
ent i
n A
frica
(Pid
a)TR
AN
SB
OU
ND
AR
Y W
ATE
R R
ES
OU
RC
ES
OU
TLO
OK
- A
FRIC
A 2
040
Figure 7: Current cereals consumption and forecast requirements for 2040 in Africa.
Figure 8: Map of the percentage of the total population undernourished in Africa (Data source: FAOAQUASTAT database).
18
Pro
gram
me
for
infra
stru
ctur
e D
evel
opm
ent i
n A
frica
(Pid
a)TR
AN
SB
OU
ND
AR
Y W
ATE
R R
ES
OU
RC
ES
OU
TLO
OK
- A
FRIC
A 2
040
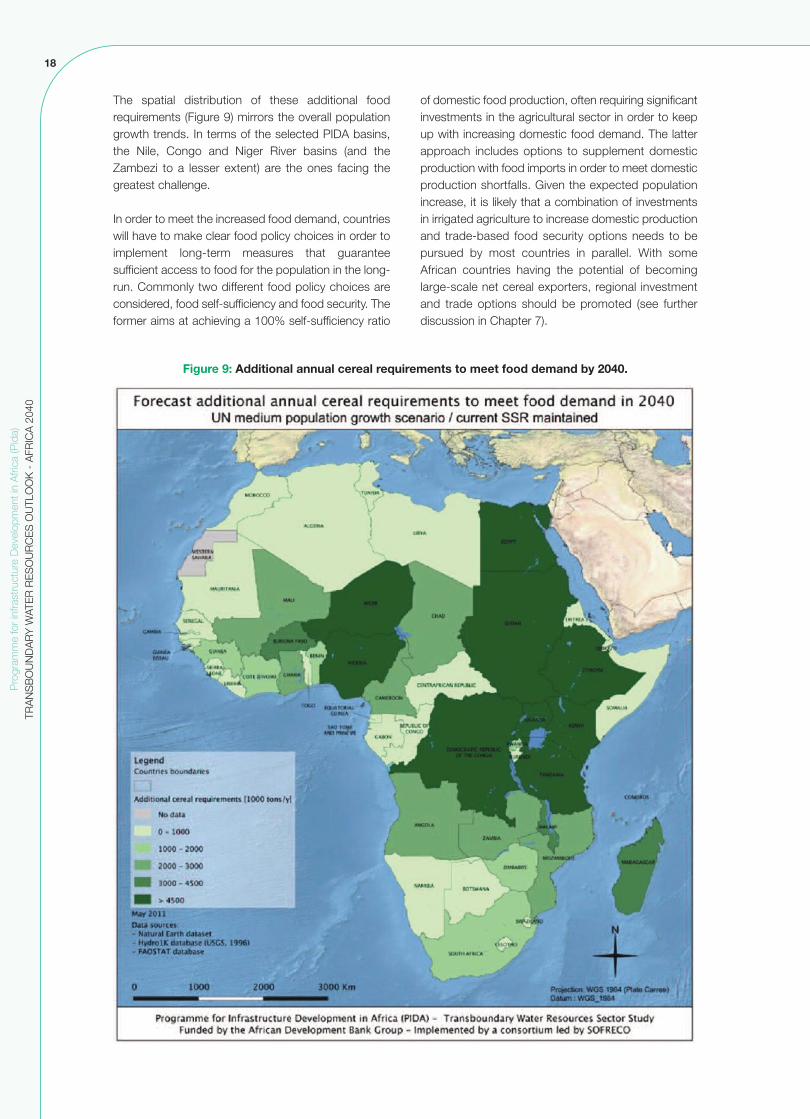
The spatial distribution of these additional foodrequirements (Figure 9) mirrors the overall populationgrowth trends. In terms of the selected PIDA basins,the Nile, Congo and Niger River basins (and theZambezi to a lesser extent) are the ones facing thegreatest challenge.
In order to meet the increased food demand, countrieswill have to make clear food policy choices in order toimplement long-term measures that guaranteesufficient access to food for the population in the long-run. Commonly two different food policy choices areconsidered, food self-sufficiency and food security. Theformer aims at achieving a 100% self-sufficiency ratio
of domestic food production, often requiring significantinvestments in the agricultural sector in order to keepup with increasing domestic food demand. The latterapproach includes options to supplement domesticproduction with food imports in order to meet domesticproduction shortfalls. Given the expected populationincrease, it is likely that a combination of investmentsin irrigated agriculture to increase domestic productionand trade-based food security options needs to bepursued by most countries in parallel. With someAfrican countries having the potential of becominglarge-scale net cereal exporters, regional investmentand trade options should be promoted (see furtherdiscussion in Chapter 7).
Figure 9: Additional annual cereal requirements to meet food demand by 2040.
19
2.3 GDP growth
Detailed macro-economic analyses and forecastscarried out by the PIDA macro-economic expert teamexpect a relatively high economic growth rate for Africabetween now and 2040, estimated to be at 6% peryear.
Around 40 countries out of the 53 are expected toexhibit a growth rate higher than 5% per year onaverage for the period 2008-2040 and 20 Africancountries are forecast to experience an average growthhigher than the continental growth rate of 6%. Nigeria,already one of Africa’s largest economies, with anestimated growth rate of 7.9% per year for the period2008-2040 is among the countries with a growth ratehigher than (continental) average, alongside economiessuch as Angola, Benin, Gambia and Malawi.
Twenty countries are forecast to experience an averagegrowth rate of around 5 to 6% per year and growth inSouth Africa, the continent’s largest (non-oil) economyis expected to be at 4.9 % per year. Only ten countriesare expected to have growth rates lower than thecontinental average.
The forecast high overall GDP growth rate will havesignificant impacts on industrial water requirementssince water is a production factor of nearly all economicgoods. Likewise, with increased economic growth,energy consumption will rise and increase the waterrequirements for the cooling of thermal power plants.Higher GDP also results in higher living standards witha commensurate increase in water requirement fordomestic uses by urban and rural populations.
Pro
gram
me
for
infra
stru
ctur
e D
evel
opm
ent i
n A
frica
(Pid
a)TR
AN
SB
OU
ND
AR
Y W
ATE
R R
ES
OU
RC
ES
OU
TLO
OK
- A
FRIC
A 2
040

20
Pro
gram
me
for
infra
stru
ctur
e D
evel
opm
ent i
n A
frica
(Pid
a)TR
AN
SB
OU
ND
AR
Y W
ATE
R R
ES
OU
RC
ES
OU
TLO
OK
- A
FRIC
A 2
040
This chapter provides an overview of the currentbaseline (at the continental and selected basin levels)in terms of available water resources, existinginfrastructure and TWR governance frameworks. Thebaseline assessment provides a basis for the (waterresources) demand forecast presented in Chapter 4 ofthis report as well as the development of the strategicframework and selection of PIDA projects in Phase II.
3.1 Surface and groundwater resourcesavailability
This water resources availability overview is based onthe concept of internal renewable water resource(IRWR), which is the long-term average annual flow ofrivers and recharge of aquifers generated fromendogenous precipitation. While IRWR exhibits largeregional disparities, in Africa as a whole, the IRWR isestimated at 3931 km3 per year. Africa represents 9.2percent of the world IRWR, compared to 28% in Asiaand 29.1% in South America respectively (Figure 10and Table 2). The IRWR in Africa is distributed betweensurface water (3833.63 km3 per year) and groundwater(1419.28 km3 per year) with an overlap of 1324.19km3 per year.
3. BASELINE: CURRENT SITUATION IN THETRANSBOUNDARY WATER RESOURCES SECTOR
Figure 10: Comparison of internal renewable freshwater resources by world regions
(Data source: FAO AQUASTAT)

21
At the lake or river basin levels, the renewable waterresources available are defined as the natural dischargeof the river (and groundwater flow) that flows into thesea (or inner lake) in natural conditions. In other words,it represents the river discharge before the constructionof infrastructure and withdrawals of water. While in ariver (or lake) basin, the water availability exhibits
seasonal and inter-annual variability, Figure 11 presentsthe natural discharge by considering only long-termaverage annual values calculated with historical recordsthat were available (Global Runoff Data Centre2, GlobalRiver Discharge Database3 or data provided by theL/RBO’s).
Pro
gram
me
for
infra
stru
ctur
e D
evel
opm
ent i
n A
frica
(Pid
a)TR
AN
SB
OU
ND
AR
Y W
ATE
R R
ES
OU
RC
ES
OU
TLO
OK
- A
FRIC
A 2
040
Figure 11: Long-term average annual natural discharge at river mouth.
Table 2: Comparison of IRWR by world regions (Data source: FAO AQUASTAT)
��������������� ������������ �����
������������������������
���������������� !"�� ��������
�#�$%� &�'()� ( * � ( �')!�������� ��� ��� ��������� ���� ����� ����������������� ����� ��� ��������������������������������� ��� ��� ��� ������������� ����� ��� � ��!������� ��� ��� �����"���#�� ���� ���� ���
2 http://www.bafg.de/GRDC/EN/Home/homepage__node.html3 http://www.rivdis.sr.unh.edu/
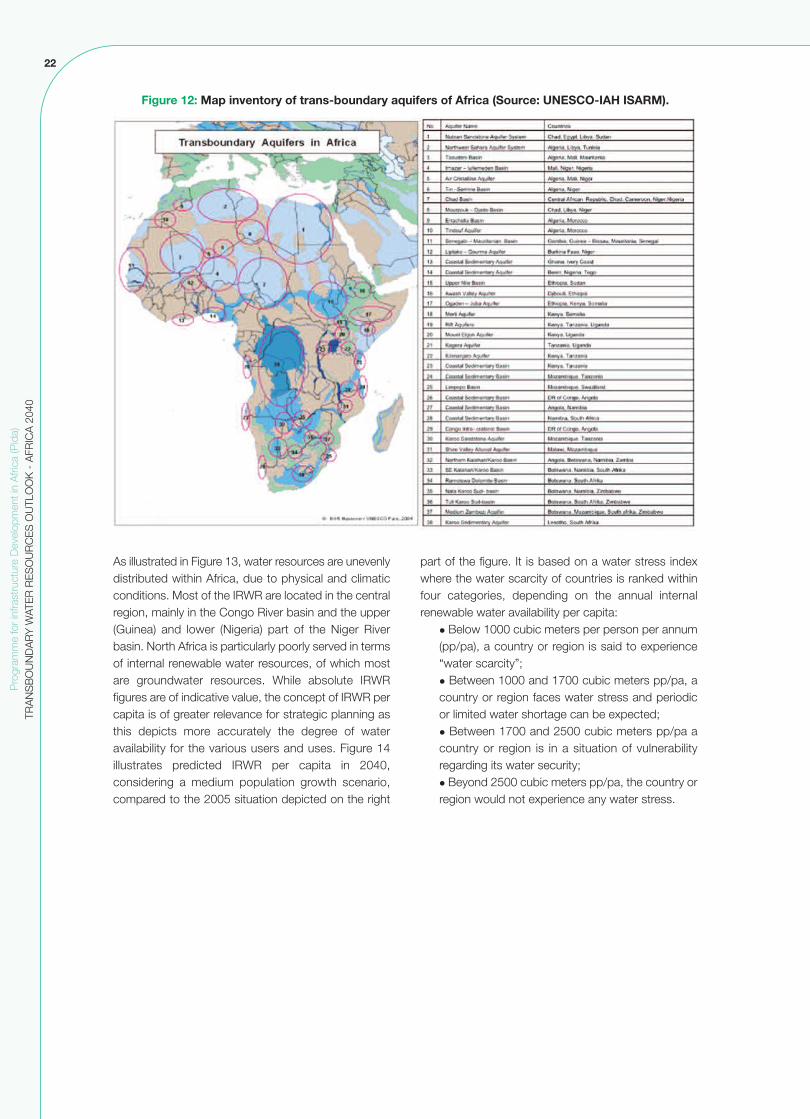
The disparities amongst the selected river basins aresignificant. The river basin with the highest naturaldischarge is the Congo, with a long-term averagenatural flow around 1250 km3 per year, whichrepresents around 7 and 14.5 times the value for thetwo next biggest basins: the Niger and Zambezi Riverbasins respectively. The aggregated annual naturaldischarge in the ten selected basins is around 1773km3/y, which represents 46.3 % of total renewablewater resources in Africa and around 80% of the
renewable water resources in the continent’sinternational basins. There are 38 documented trans-boundary aquifers on the African continent. Tanzaniaand Mozambique each have seven trans-boundaryaquifers that they share with their neighbours. Thelargest number of riparians, six, are found in the LakeChad basin aquifers. Figure 12 shows the geographicaldistribution of the aquifers alongside the key number ofindicative aquifers shown on the map.
22
Pro
gram
me
for
infra
stru
ctur
e D
evel
opm
ent i
n A
frica
(Pid
a)TR
AN
SB
OU
ND
AR
Y W
ATE
R R
ES
OU
RC
ES
OU
TLO
OK
- A
FRIC
A 2
040
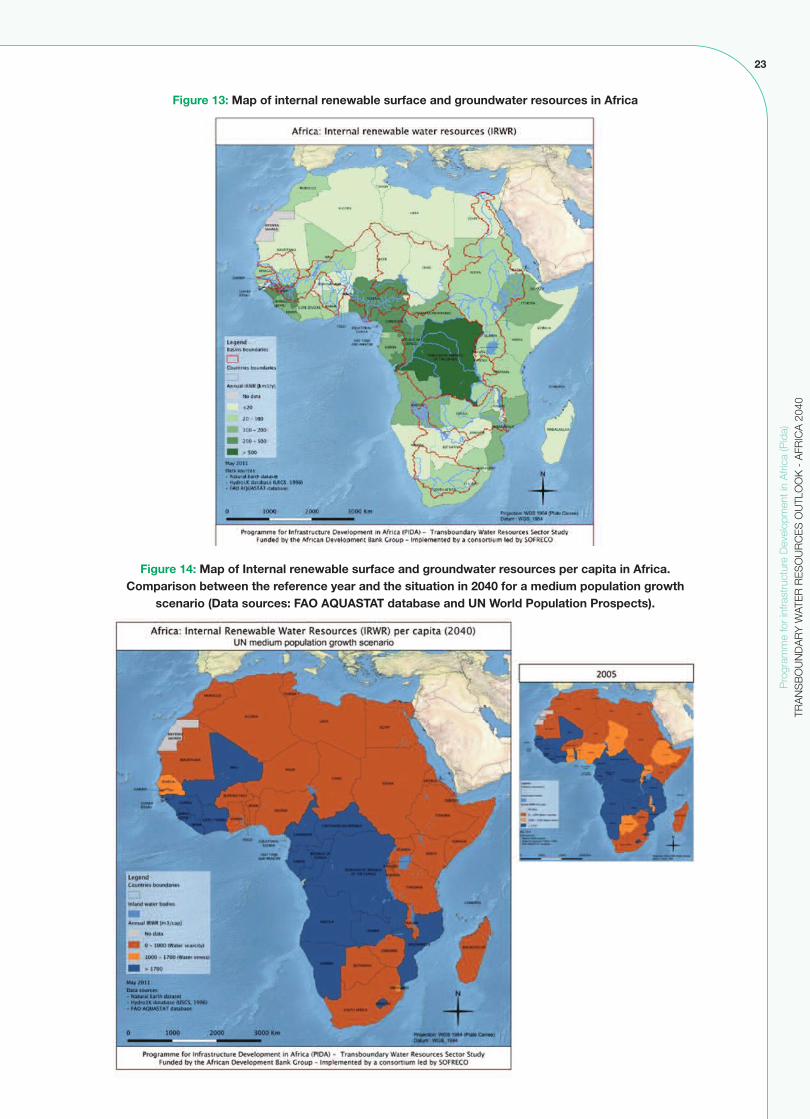
As illustrated in Figure 13, water resources are unevenlydistributed within Africa, due to physical and climaticconditions. Most of the IRWR are located in the centralregion, mainly in the Congo River basin and the upper(Guinea) and lower (Nigeria) part of the Niger Riverbasin. North Africa is particularly poorly served in termsof internal renewable water resources, of which mostare groundwater resources. While absolute IRWRfigures are of indicative value, the concept of IRWR percapita is of greater relevance for strategic planning asthis depicts more accurately the degree of wateravailability for the various users and uses. Figure 14illustrates predicted IRWR per capita in 2040,considering a medium population growth scenario,compared to the 2005 situation depicted on the right
part of the figure. It is based on a water stress indexwhere the water scarcity of countries is ranked withinfour categories, depending on the annual internalrenewable water availability per capita:
l Below 1000 cubic meters per person per annum(pp/pa), a country or region is said to experience“water scarcity”;l Between 1000 and 1700 cubic meters pp/pa, acountry or region faces water stress and periodicor limited water shortage can be expected;l Between 1700 and 2500 cubic meters pp/pa acountry or region is in a situation of vulnerabilityregarding its water security;l Beyond 2500 cubic meters pp/pa, the country orregion would not experience any water stress.
Figure 12: Map inventory of trans-boundary aquifers of Africa (Source: UNESCO-IAH ISARM).
23
Pro
gram
me
for
infra
stru
ctur
e D
evel
opm
ent i
n A
frica
(Pid
a)TR
AN
SB
OU
ND
AR
Y W
ATE
R R
ES
OU
RC
ES
OU
TLO
OK
- A
FRIC
A 2
040
Figure 13: Map of internal renewable surface and groundwater resources in Africa
Figure 14: Map of Internal renewable surface and groundwater resources per capita in Africa.Comparison between the reference year and the situation in 2040 for a medium population growth
scenario (Data sources: FAO AQUASTAT database and UN World Population Prospects).
24
Pro
gram
me
for
infra
stru
ctur
e D
evel
opm
ent i
n A
frica
(Pid
a)TR
AN
SB
OU
ND
AR
Y W
ATE
R R
ES
OU
RC
ES
OU
TLO
OK
- A
FRIC
A 2
040
At present, about half the African continent faces somesort of water stress or water scarcity. The situation ispredicted to become significantly more aggravated by2040. The only regions where the IRWR per capita isconsidered as sufficient are the Congo River basin,Guinea, Guinea Bissau, Sierra Leone and Liberia.Several countries that were in a situation of vulnerabilityin 2005 will become water-stressed or water-scarce in2040. It is also interesting to notice that the majority of
the countries sharing international river basins (exceptCongo) would have to face severe water scarcitychallenges in 2040. While these predictions of water scarcity are calculatedon an average annual basis, seasonal and/or inter-annual distribution of water availability andrequirements are common in African basins and haveto be taken into consideration in the context of basinmanagement and infrastructure planning.
Non-conventional sources of water
Non-conventional sources of water are desalinated water and reused treated wastewater.According to the FAO AQUASTAT database, data on non-conventional sources of water are only available for15 countries. These countries are located in areas where the internal water resources are limited: Northern andto a lesser extend Southern region. It is estimated by FAO that, for Africa, 177.8 million m3 of water aredesalinated annually (amongst which 155.2 million m3 in the Northern region) and 3032.7 million m3 ofwastewater are treated and reused (amongst which 3032 million m3 in the Northern region).
3.2 Infrastructure
3.2.1 Reservoirs and hydropower plants
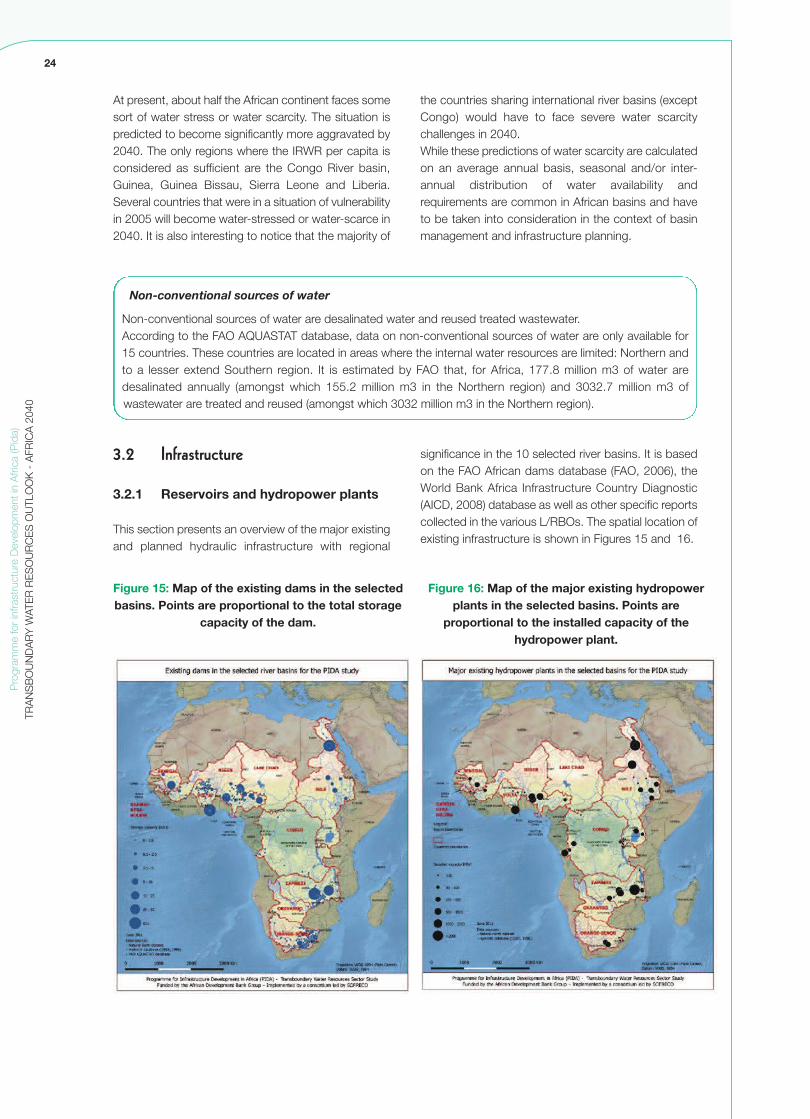
This section presents an overview of the major existingand planned hydraulic infrastructure with regional
significance in the 10 selected river basins. It is basedon the FAO African dams database (FAO, 2006), theWorld Bank Africa Infrastructure Country Diagnostic(AICD, 2008) database as well as other specific reportscollected in the various L/RBOs. The spatial location ofexisting infrastructure is shown in Figures 15 and 16.
Figure 15: Map of the existing dams in the selectedbasins. Points are proportional to the total storage
capacity of the dam.
Figure 16: Map of the major existing hydropowerplants in the selected basins. Points are
proportional to the installed capacity of thehydropower plant.
25
It is worth mentioning that most of the dams in Africahave been built before 1988 with only a few completedin the last two decades (the Lesotho Highlands WaterProject (Katse and Mohale dams and associatedtransfer tunnels) and Tekeze dam (TK-5) in Ethiopiaarguably being the most significant ones). While anumber of pre-investments are ongoing, at present onlya few projects are at the stage of detailed design.
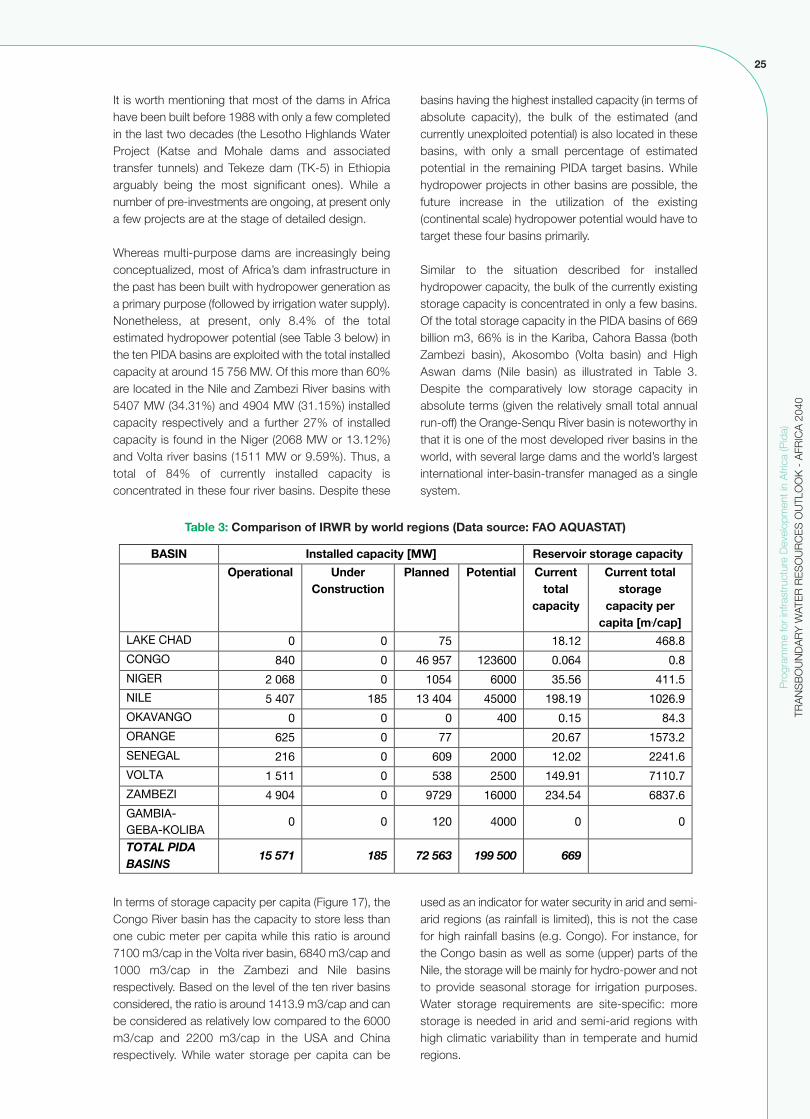
Whereas multi-purpose dams are increasingly beingconceptualized, most of Africa’s dam infrastructure inthe past has been built with hydropower generation asa primary purpose (followed by irrigation water supply).Nonetheless, at present, only 8.4% of the totalestimated hydropower potential (see Table 3 below) inthe ten PIDA basins are exploited with the total installedcapacity at around 15 756 MW. Of this more than 60%are located in the Nile and Zambezi River basins with5407 MW (34.31%) and 4904 MW (31.15%) installedcapacity respectively and a further 27% of installedcapacity is found in the Niger (2068 MW or 13.12%)and Volta river basins (1511 MW or 9.59%). Thus, atotal of 84% of currently installed capacity isconcentrated in these four river basins. Despite these
basins having the highest installed capacity (in terms ofabsolute capacity), the bulk of the estimated (andcurrently unexploited potential) is also located in thesebasins, with only a small percentage of estimatedpotential in the remaining PIDA target basins. Whilehydropower projects in other basins are possible, thefuture increase in the utilization of the existing(continental scale) hydropower potential would have totarget these four basins primarily.
Similar to the situation described for installedhydropower capacity, the bulk of the currently existingstorage capacity is concentrated in only a few basins.Of the total storage capacity in the PIDA basins of 669billion m3, 66% is in the Kariba, Cahora Bassa (bothZambezi basin), Akosombo (Volta basin) and HighAswan dams (Nile basin) as illustrated in Table 3.Despite the comparatively low storage capacity inabsolute terms (given the relatively small total annualrun-off) the Orange-Senqu River basin is noteworthy inthat it is one of the most developed river basins in theworld, with several large dams and the world’s largestinternational inter-basin-transfer managed as a singlesystem.
Pro
gram
me
for
infra
stru
ctur
e D
evel
opm
ent i
n A
frica
(Pid
a)TR
AN
SB
OU
ND
AR
Y W
ATE
R R
ES
OU
RC
ES
OU
TLO
OK
- A
FRIC
A 2
040
Table 3: Comparison of IRWR by world regions (Data source: FAO AQUASTAT)
������ ������ ������������ ����������������������
� ��������� �� ��������������
����� � ������� ����������
������
����������������
��������������� !"����
���������� � � �� � � ���� �� � �
������ �� � ������ ����� ���� � �
������ ��� � � ���� �� ������ ������
����� ���� � �� ������ ��� �� ���� ������
��������� � � � �� ���� ����
������� ���� � � � ���� ������
�������� ���� � ��� �� ����� �������
������ ������ � �� � ��� ������� ����
�������� ����� � ���� ��� ������� � ����
�������������������
� � ��� �� � �
���������������
� � ��� �� � ��� ��� ���� ��� ���� �
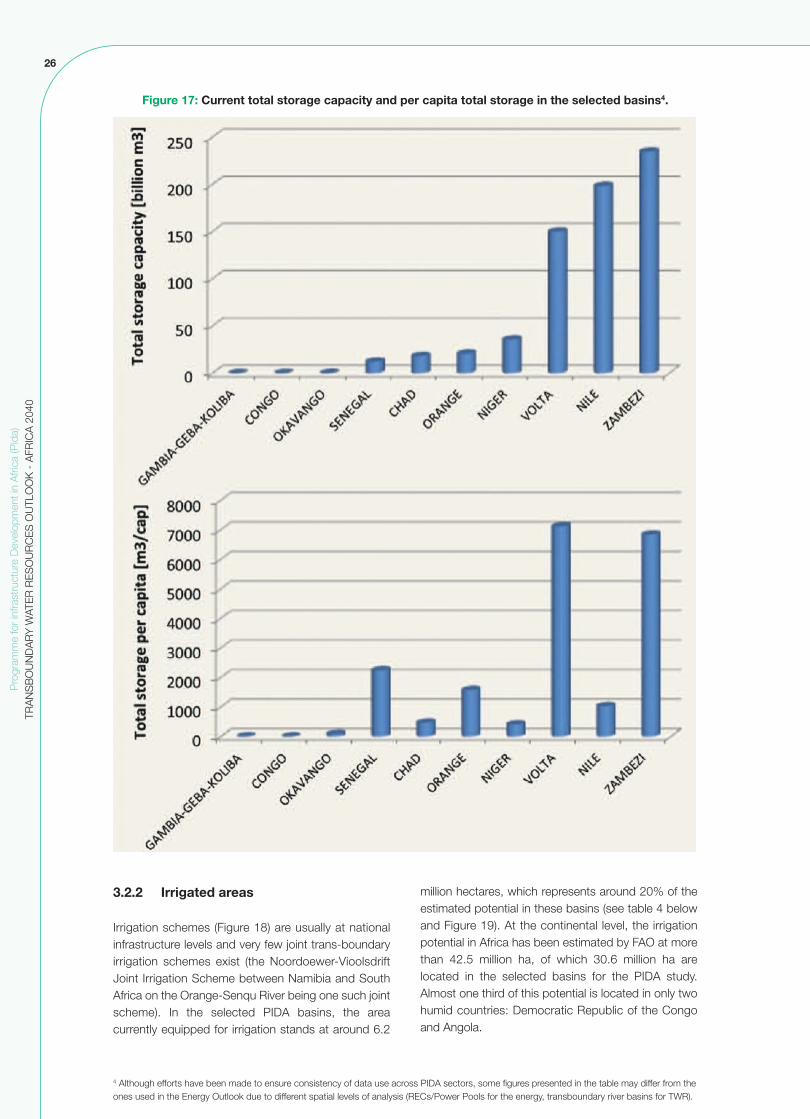
In terms of storage capacity per capita (Figure 17), theCongo River basin has the capacity to store less thanone cubic meter per capita while this ratio is around7100 m3/cap in the Volta river basin, 6840 m3/cap and1000 m3/cap in the Zambezi and Nile basinsrespectively. Based on the level of the ten river basinsconsidered, the ratio is around 1413.9 m3/cap and canbe considered as relatively low compared to the 6000m3/cap and 2200 m3/cap in the USA and Chinarespectively. While water storage per capita can be
used as an indicator for water security in arid and semi-arid regions (as rainfall is limited), this is not the casefor high rainfall basins (e.g. Congo). For instance, forthe Congo basin as well as some (upper) parts of theNile, the storage will be mainly for hydro-power and notto provide seasonal storage for irrigation purposes.Water storage requirements are site-specific: morestorage is needed in arid and semi-arid regions withhigh climatic variability than in temperate and humidregions.
26
Pro
gram
me
for
infra
stru
ctur
e D
evel
opm
ent i
n A
frica
(Pid
a)TR
AN
SB
OU
ND
AR
Y W
ATE
R R
ES
OU
RC
ES
OU
TLO
OK
- A
FRIC
A 2
040
3.2.2 Irrigated areas
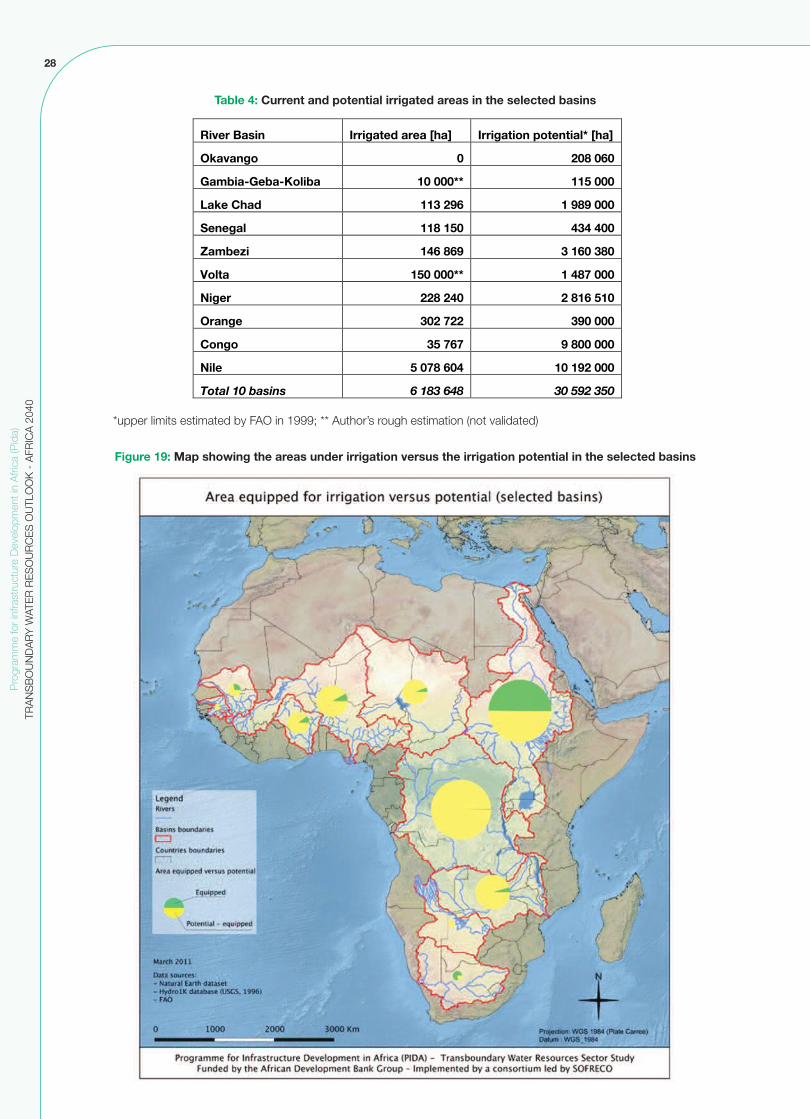
Irrigation schemes (Figure 18) are usually at nationalinfrastructure levels and very few joint trans-boundaryirrigation schemes exist (the Noordoewer-VioolsdriftJoint Irrigation Scheme between Namibia and SouthAfrica on the Orange-Senqu River being one such jointscheme). In the selected PIDA basins, the areacurrently equipped for irrigation stands at around 6.2
million hectares, which represents around 20% of theestimated potential in these basins (see table 4 belowand Figure 19). At the continental level, the irrigationpotential in Africa has been estimated by FAO at morethan 42.5 million ha, of which 30.6 million ha arelocated in the selected basins for the PIDA study.Almost one third of this potential is located in only twohumid countries: Democratic Republic of the Congoand Angola.
Figure 17: Current total storage capacity and per capita total storage in the selected basins4.
4 Although efforts have been made to ensure consistency of data use across PIDA sectors, some figures presented in the table may differ from theones used in the Energy Outlook due to different spatial levels of analysis (RECs/Power Pools for the energy, transboundary river basins for TWR).

27
It should be noted however, that according to the FAO,the irrigation potential is an estimation of both landsuitable for irrigation and available renewable waterresources. The irrigation potential can therefore beoverestimated in some basins. Likewise, this does nottake into account the financial viability of irrigationschemes related to factors such as market access,availability of technical skills and other factors. Critically, the biggest challenge for the expansion ofagricultural production in Africa (both irrigation and rain-fed) is the low efficiency of production. Thus, in additionto increasing the area under production, significantinvestments need to be made in improving productionefficiency if food production targets for 2040 are to bemet.
Irrigation efficiency is probably the most challengingissue for African irrigated agriculture. It is defined asthe ratio between the water consumed by the plantsthrough evapotranspiration and the quantity of waterwithdrawn from the river or reservoir. This ratio is oftenless than 0.5, which means that the volume of waterwithdrawn from the river, lake or reservoir is twice thevolume which is actually consumed (evapotranspirated)by the crops. African countries suffering from severewater scarcity (e.g. Morocco) are subsidizing theprovision of efficient irrigation technologies. This shouldbe the approach in many other countries since morethan one third of Africa’s population suffers from waterscarcity and half of the African countries will suffer from“water stress” by 2025.
Pro
gram
me
for
infra
stru
ctur
e D
evel
opm
ent i
n A
frica
(Pid
a)TR
AN
SB
OU
ND
AR
Y W
ATE
R R
ES
OU
RC
ES
OU
TLO
OK
- A
FRIC
A 2
040
Figure 18: Map of the irrigation density in Africa
(Data source: FAO AQUASTAT, 2002).
28
Pro
gram
me
for
infra
stru
ctur
e D
evel
opm
ent i
n A
frica
(Pid
a)TR
AN
SB
OU
ND
AR
Y W
ATE
R R
ES
OU
RC
ES
OU
TLO
OK
- A
FRIC
A 2
040
Table 4: Current and potential irrigated areas in the selected basins
���������� ������ ������������� ������ ����� � ����������
�������� �� ��������
������������ ������ !�������� !!"�����
#����$���� !!%��&�� !�&�&�����
'������ !!��!"�� (%(�(���
)����*�� !(����&� %�!���%���
+�� �� !"�������� !�(�,�����
-����� �����(�� ���!��"!��
������ %���,��� %&������
$���� %"�,�,� &���������
-���� "��,����(� !��!&������
������������� ����� ��� �����������
*upper limits estimated by FAO in 1999; ** Author’s rough estimation (not validated)
Figure 19: Map showing the areas under irrigation versus the irrigation potential in the selected basins
29
Pro
gram
me
for
infra
stru
ctur
e D
evel
opm
ent i
n A
frica
(Pid
a)TR
AN
SB
OU
ND
AR
Y W
ATE
R R
ES
OU
RC
ES
OU
TLO
OK
- A
FRIC
A 2
040
3.2.3 Rivers and lakes transport infrastructure
The main regional inland waterways in Africa are limitedto five rivers, the Nile, the Congo, the Niger, the Senegaland the lower Zambezi Rivers, and three lakes, LakeVictoria, Lake Tanganyika and Lake Malawi. Theseinternational inland waterways are important, being asource of livelihood for millions of people using them astraditional channels of trade and communication. Tofoster integration with lake and river shipping, it isessential to link them with multimodal transport throughmodern trans-shipment stations to road and railnetworks — increased use could be made of theAfrican rivers by integrating transport networks acrossthe continent. Below is a brief overview of the majorexisting and planned transport infrastructure in theselected basins.
Currently, river and lake transport serve essentially onlythe people living directly along rivers while river and lakebased long haul traffic has practically completelydisappeared. The main reason is that the rivers andlakes are neither maintained appropriately normaintained for navigation and transport purposes. Forexample, dredging is not carried out, the navigationsystems are not correctly maintained and the fleets areold and in very poor condition.
Lake ports have serious infrastructure problems, withthe exception of Bujumbura on the Lake Tanganyika.On Lake Victoria, the rail links at each of the ports arerelatively well maintained except for Jinja. But, with theexception of Mwanza, none of the ports is equipped toeffectively handle increased volumes of general andcontainer traffic.
In the Senegal River basin, the OMVS, with supportfrom the World Bank, is preparing a Senegal RiverBasin Integrated Multimodal Transport system. Theobjective is to restore the river transport system of theSenegal River and to enhance it by connecting it to asystem that integrates it to land-based groundtransportation. In the Zambezi River basin, plans existto re-open the Shire–Zambezi waterway from Nsanje,in Southern Malawi, to the Indian Ocean port of Chinde,in Mozambique. This will enable barges and medium-sized seagoing vessels direct waterway access to theIndian Ocean. In the Congo River basin, theInternational Commission of the Congo-Oubangui-Sangha Bassin (CICOS) aims to developintergovernmental cooperation to enhance interiornavigation and is currently preparing a strategic plan toimprove the transport along the Congo and itstributaries. Also, the potential of the Niger River mustbe highlighted: more than three-fourths of its totallength could be used by commercial shipping.
3.3 TWR governance
3.3.1 Africa Water Vision and related declarations
The central water related policy instrument for thecontinent is the African Water Vision 2025, which aimsfor «an Africa where there is an equitable andsustainable use and management of water resourcesfor poverty alleviation, socioeconomic development,regional cooperation, and the environment.»
The Vision was created by the United NationsEconomic Commision for Africa, and designed to aidin the development of a future where the full potentialof Africa’s water resources can be readily unleashed tostimulate and sustain growth in the region’s economicdevelopment and social well-being. The Africa WaterVision 2025 is supported by a series of high-level policystatements such as the:
l Abuja Ministerial Declaration on Water: A Key toSustainable Development in Africa (2002) l Sirte Declaration on the challenges ofimplementing integrated and sustainabledevelopment on agriculture and water in Africa(2004) l Declaration of Water and Energy Ministers ofJohannesburg (2006) l Ministerial Declaration of Tunis ending the FirstAfrican Water Week (2008)l Sharm El Sheikh Declaration on Water andSanitation (2008)
These declarations underscore the commitment ofAfrican leaders to water resources development forimproved and optimized use of the continent’s waterresources for social and economic development on thecontinent. At the same time, these high-leveldeclarations create awareness, symbolize politicalcommitment and aim at ensuring an enablingregulatory and institutional framework within regionsand AU Member States in the management of waterresources.
3.3.2 Policy, legal and institutional frameworks for surface water management
The PIDA governance review found that generally thereis a high degree of commonality between policyobjectives across the continent and water is recognizedthroughout as a key driver for achieving economicgrowth and improved social conditions. In terms of the legal framework, there are numerousbilateral and multilateral basin-specific agreements butfew regionally agreed rules for TWRM in the form of

30
Pro
gram
me
for
infra
stru
ctur
e D
evel
opm
ent i
n A
frica
(Pid
a)TR
AN
SB
OU
ND
AR
Y W
ATE
R R
ES
OU
RC
ES
OU
TLO
OK
- A
FRIC
A 2
040
regional (framework) agreements. Currently, only theSADC region has adopted a regional frameworkagreement (Revised SADC Protocol on SharedWatercourses) and no other African REC has adopteda similar regional legal framework. However, ECOWAShas put in place a strong policy framework forIntegrated Water Resources Management and isfinalizing a legal framework for trans-boundary waterresources. It is believed that doing so would greatlyfacilitate the achievement of regional policy objectivesthrough the implementation of regional trans-boundarywater management programmes. With the UNConvention on the Law of the Non-Navigational Usesof International Watercourses, a state of the art globalagreement is readily available on which future regionalagreements at the REC level can be based.
The institutional architecture for TWRM can broadly becategorized into three levels, namely the continental,regional (REC) and Lake/River Basin levels (L/RBO).At the continental level, the African Union Commission(AUC), the principal executive organ of the AU is taskedwith, among other things, the preparation of strategicplans and studies for the consideration of the ExecutiveCouncil. The AUC further elaborates,promotes, coordinates and harmonizes the programsand policies of the Union with those of the RECs. TheAfrican Ministers’ Council on Water (AMCOW) wasformed by the AU in 2002 with the objective ofpromoting cooperation, security, social and economicdevelopment and poverty eradication among MemberStates through the management of water resourcesand the provision of water supply services. AMCOW isnow a recognized specialized Technical Committee forWater and Sanitation at the AU Summit in Sharm elSheikh and in 2008 it was designated as theresponsible authority for the implementation of the«African Water Vision 2025».
AMCOW maintains a number of key initiatives drivingwater related development in Africa, such as:
l The African Water Facility l The African Ministers’ Initiative on Water,Sanitation and Hygiene (AMIWASH)l Rural Water Supply and Sanitation Initiative(RWSSI), andl The African Water Sector Monitoring andEvaluation
A key initiative of the African Union is the NewPartnership for Africa’s Development (NEPAD). Theinitiative is organized in a number of thematic areas, ofwhich “Climate Change and Natural ResourceManagement” and “Regional Integration andInfrastructure” have a direct bearing for trans-boundarywater management. NEPAD maintains a sectorprogramme for water which was developed to address
the many challenges in managing water resources onthe continent. Among these are the threats posed bydrought, floods and climate change. NEPAD’s waterprogramme is complemented by its sector programmefor energy, which also relates to issues of trans-boundary water management, particularly thegeneration of hydropower.
At the regional level, the Regional EconomicCommunities (RECs) are the centre of the TWRMinstitutional framework. While originally the objective ofthe RECs is the facilitation of greater regional integrationand trade through the creation of Free-Trade Areas,most RECs have since expanded beyond a narrowertrade focus and adopted a strong regionaldevelopment mandate including areas of trade,transport, energy, natural resources management anddevelopment to name but a few. The degree to whichthey deal with trans-boundary water managementdiffers considerably between the eight recognisedRECs. Whereas some do not engage strongly (or at all)with trans-boundary water matters, other RECs havecreated a strong policy, legal and institutionalframework for trans-boundary water management intheir region. As noted above, the Southern AfricanDevelopment Community (SADC) arguably currentlyhas the strongest framework and is the most activedriver of trans-boundary water resources managementand development, but other RECs are increasinglytaking on a stronger role.
At the basin level, L/RBOs play a central role in TWRM.While some RBOs have already been established manydecades ago (e.g. OMVS for the Senegal River), the lasttwo decades have seen a proliferation of RBOs so thattoday nearly all major shared basins on the continenthave one or more established L/RBOs showing thatthey are increasingly seen as institutions for advancingregional integration agendas. However, at present onlyvery few L/RBOs have a mandate for infrastructuremanagement and operation while the majority ofL/RBOs are focused on determining an overallmanagement system for the basin that balances socio-economic development needs, with the need forprotecting the basin’s biodiversity and theenvironmental services the basin provides to itspopulation.
3.3.3 Policy, legal and institutional frameworks for groundwater management
The governance framework for the management oftrans-boundary groundwater is comparatively lessdeveloped. However, efforts are increasingly made tostrengthen the management architecture for sharedgroundwater.
31
At present, groundwater is considered only to a verylimited extent in continental or regional policies anddesignated policies for the management anddevelopment of shared groundwater do not exist.Likewise, regional legal frameworks for themanagement of shared aquifers do not exist on thecontinent, with the exception of the Revised SADCWater Protocol on Shared Watercourses. However, itshould be noted that the SADC Revised Protocolcovers only aquifers that are connected to surfacewater resources and not so-called confined aquifers.
The development of continental or regional legalframeworks for the management of shared aquiferswould considerably strengthen the managementframeworks for shared aquifers in Africa. The UNInternational Law Commission’s Draft Articles on theLaw of Trans-boundary Aquifers and Aquifer Systemsmight provide valuable guidance in this regard.
In terms of the institutional framework, AMCOW hasestablished an Africa Groundwater Commission at thecontinental level. Its main objective is to generateongoing political buy-in and support in a roll-out of theAMCOW Brazzaville decisions towards the vision of “AnAfrica where groundwater resources are valued andutilized sustainably by empowered stakeholders.” TheCommission’s work includes acting as a soundingboard for implementing decisions by AMCOW and byother Multi-stakeholder Consultations in order toprovide strategic advice on collaborative aspects ongroundwater resources management in Africa. At the regional level, the SADC, ECOWAS, IGAD have
been involved in the development or the managementof trans-boundary aquifers. While their policies are notnecessarily consistent as they each have differentoperational objectives, they have demonstrated aninterest that is motivated by their Member States.These policies are increasingly addressing issuesconcerning trans-boundary groundwater management.
In addition, non-REC regional organisations such asCEDARE and OSS contribute to capacity developmentand the conduct of pre-feasibility assessments forshared aquifer development.At the shared aquifer system level–analogous tolake/river basin for surface water–only threecooperative structures for the management of trans-boundary aquifers exist, and are at various stages oftheir development. Additional structures are currentlybeing set up for some aquifer systems in Southern andWest Africa. A key gap is the current lack ofmanagement arrangements for the conjunctive use oftrans-boundary surface and groundwater resources.Efforts in this regard are only being made, for examplethe Orange-Senqu River Commission (ORASECOM)has, in recent years, set up a groundwater task teamthat, among other things, is exploring conjunctive useand management options. Among the selected PIDAbasins, important trans-boundary aquifer systemsunderlie the Lake Chad, Niger and Nile basins and therespective basin commissions are increasingly lookingto include the management of these aquifers in theirscope of work in conjunction with the management ofthe basin’s surface water resources.
Pro
gram
me
for
infra
stru
ctur
e D
evel
opm
ent i
n A
frica
(Pid
a)TR
AN
SB
OU
ND
AR
Y W
ATE
R R
ES
OU
RC
ES
OU
TLO
OK
- A
FRIC
A 2
040
32
Pro
gram
me
for
infra
stru
ctur
e D
evel
opm
ent i
n A
frica
(Pid
a)TR
AN
SB
OU
ND
AR
Y W
ATE
R R
ES
OU
RC
ES
OU
TLO
OK
- A
FRIC
A 2
040
This chapter provides an overview of forecast waterrequirements for the 2040 horizon. After a descriptionof the methodology and assumptions that were usedfor modeling purposes, the results are presented at thecontinental and country levels as well as at the basinlevel for the selected PIDA basins.
4.1 Methodology and assumptions
The methodology addresses both sides of the waterbalance – supply and demand - and consequentlyassumptions and parameters are required to assessboth sides of the equation. The assumptions andparameters used reflect the predominant factors thatare likely to determine the trends of regional andcontinental infrastructure supply and demand over theperiod until 2040.
As noted, water requirements are likely to increase by2040 due to population and economic growth,urbanization, and possible climate change. Projectionsof water requirements are derived for majorconsumptive uses of which the following have beenincluded in the model: irrigated agriculture, domesticand industrial use and evaporation from reservoirs.
Future water requirements for non-consumptive usessuch as hydropower generation, navigation, recreationand environmental flows are not included in the presentanalysis, given the coarse spatial and temporalresolution of the model used for this study.
The forecast focuses on water quantity. Water qualityis not considered in the model as this would require alevel of analysis that is beyond the scope of this study.However, it is here emphasized that ensuring theavailability of adequate quality water for the respectiveuses as well as water quantity are critical issues thatwill pose increased challenges over the years until2040.
4.1.1 Reference year
For consistency purposes, the year 2005 was used asthe reference year for data inputs wherever possible.The selected reference year appeared to be the mostrecent year in common for all databases that were usedto carry out the analysis. Nevertheless, some data wasunavailable for the year 2005, in which case the most
coherent data was used.
4.1.2 Domestic requirements
For domestic water uses, the following data sourcesare used and assumptions made:
l The population forecast for 2040 was taken fromthe World Population Prospects database5
weighted by the population density of the country’sland area in the basin. The spatial distribution of thepopulation is taken from the Gridded Population ofthe World (GPWv3) database6 and is illustrated inFigure 4. Starting from the 2005 reference year, thecalculated percentage of countries’ total populationliving within basins’ boundaries is assumed toremain constant until 2040. l For the percentage of population residing in urbanareas, the United Nations World UrbanizationProspects for the period 2040-2045 were used.The ratio is illustrated in Figure 2.l There is no seasonal variation l Per capita water consumption in rural areas = 60litres per dayl Per capita water consumption in urban areas =200 litres per day l System efficiency (�)= 60%
It is recognized that the assumed water requirementsfor rural and domestic areas are relatively highcompared to current level but they take into accountthe expected high increase of living standards of theAfrican continent in the coming 30 years.
4.1.3 Industrial requirements
Water is a key input for virtually all industrial productionprocesses. By far the largest share of industrial waterintake is used for cooling and condensation, particularlyin steam-electric power plants as well as in almost allmanufacturing and refining operations. Likewise, wateris used for the washing of raw materials andequipment, to convey production inputs, and can bepart of the product itself. For macro-level forecastpurposes, these uses are not distinguished but ratheraggregated into a single use for which the followingassumptions apply:
l For countries’ water withdrawals for industrialpurposes, the data from the FAO-AQUASTAT onlinedatabase7 reference year 2005 was used;l The increase in countries’ GDP is the main driver
4. FORECAST WATER REQUIREMENTS – OUTLOOK 2040
5 http://www.un.org/esa/population/unpop.htm6 http://sedac.ciesin.columbia.edu/gpw/global.jsp7 http://www.fao.org/nr/water/aquastat/main/index.stm
33
of the increase in water requirements for industrialpurposes;l The relationship between GDP and industrialwater requirements is extrapolated from UNESCOdata8 for 5 regions in Africa (North, South, East,West and Central);l Industrial water withdrawals are weighted by thepercentage of the countries’ population within thebasin. The spatial distribution of the population istaken from the Gridded Population of the World(GPWv3) database and is illustrated in Figure 4. Thecalculated percentage of countries’ total populationliving within basins boundaries is expected toremain constant from the 2005 reference year until2040;l Countries’ projected GDP for the period until2040 was forecast by the PIDA macro-economicteam and is used by all sectors;l There is no recycling of wastewater;l The ratio between water withdrawals andconsumption is estimated to range from 8% to 16% depending on the region in Africa (North, South,East, West and Central), according to UNESCOdata9.
4.1.4 Evaporation from reservoirs
Evaporation losses from large man-made reservoirscan be significant and must be included in the waterbalance equation. Where the data was available,evaporation losses from planned reservoirs wereextrapolated from the losses from neighbouringreservoirs using the ratio between the areas at fullsupply elevation (FSL).
4.1.5 Food and agricultural requirements
For an estimate of the amount of food that has to becultivated by 2040, the following assumptions are used:
l Food production will be targeted at closing thegap between domestic production and demand interms of total cereals (e.g. wheat, maize, rice). Theself-sufficiency ratio (SSR) is expected to remainconstant10 for the forecasted population in theselected basins. This last assumption can beconsidered as relatively cautious as the FAO11
forecasts a slight decrease in SSR by 2030 and2050. l This study forecasts a caloric requirement of 1900
calories/day and a typical caloric content of 3600calories per kilogram of grain. This leads to anannual caloric cereal requirement (CCR) expectedto be 190 kg/cap/year12.l The population forecast for 2040 was taken fromthe World Population Prospects database13
weighted by the population density of the country’sland area in the basin. The spatial distribution of thepopulation is taken from the Gridded Population ofthe World (GPWv3) database14 and is illustrated inFigure 4. Starting from the 2005 reference year, thecalculated percentage of countries’ populationliving within basin boundaries is expected to remainconstant until 2040.
In order to translate this amount of food into theequivalent water requirement for agriculture, thefollowing information is required:
l Average cereal yields (T/ha) in 2040 for eachirrigated areal Crop water requirements (m3/ha/year) in eachirrigated areal Overall irrigation system efficiencyl Percentage of return flows that will drain back tothe river systeml The ratio between irrigated and rain-fed area forcereals: pure rain-fed agriculture uses only green15
water to supply the crop water requirements whilein irrigated agriculture, blue16 water supplementsgreen water to satisfy the crop water requirements.
In order to avoid a biased forecast (due to unrealisticratio between rain-fed and irrigated area), the approachused was to estimate the maximum amount of irrigationthat might have to be developed by 2040 byconsidering that irrigation expansion will be targeted atclosing the gap between domestic production anddemand in terms of cereals (e.g. wheat, maize, rice).The self-sufficiency ratio (SSR) is expected to remainconstant17 for the forecasted population in the selectedbasins as illustrated in Figure 6. It is understood thatthe assumption of considering irrigation as the onlysource for improving food security is unrealistic inpractice. However, this assumption is of analyticalinterest, as it is used here to help bracket the range andscope of the analysis and to provide reference points.This scenario will provide an estimated upper limit onprojected water requirement for agriculture and iscommonly used, including recently by the World Bank,
Pro
gram
me
for
infra
stru
ctur
e D
evel
opm
ent i
n A
frica
(Pid
a)TR
AN
SB
OU
ND
AR
Y W
ATE
R R
ES
OU
RC
ES
OU
TLO
OK
- A
FRIC
A 2
040
8 Shiklomanov, I. A., World Water Resources and their Use Database. A Joint SHI/UNESCO-IHP product, available athttp://webworld.unesco.org/water/ihp/db/shiklomanov/, 19999 Shiklomanov, I. A., World Water Resources and their Use Database. A Joint SHI/UNESCO-IHP product, available athttp://webworld.unesco.org/water/ihp/db/shiklomanov/, 199910 SSR close to current situation will be estimated from the data available in the FAOstat database (http://faostat.fao.org/)11 FAO (2006), World agriculture: towards 2030/2050 – Interim report, Rome.12 C. Funk and M. Brown, Food Security Volume 1, Number 3, 271-289, DOI: 10.1007/s12571-009-0026-y13 http://www.un.org/esa/population/unpop.htm14 http://sedac.ciesin.columbia.edu/gpw/global.jsp15 Green water. It corresponds to the rainfall water stored in the soil that can be used by plants.16 Blue water. It corresponds to the water diverted from a source (river, lake or reservoir) or pumped from a groundwater source.17 SSR close to current situation will be estimated from the data available in the FAOstat database (http://faostat.fao.org/)
34
Pro
gram
me
for
infra
stru
ctur
e D
evel
opm
ent i
n A
frica
(Pid
a)TR
AN
SB
OU
ND
AR
Y W
ATE
R R
ES
OU
RC
ES
OU
TLO
OK
- A
FRIC
A 2
040
in its analysis of the development opportunities in theZambezi River basin18.To estimate the maximum amount of irrigation thatmight have to be developed by 2040, the followingassumptions have been used:
l Average cereal yields (T/ha) in 2040 come fromthe FAO report “Demand for products of irrigatedagriculture in Sub-Saharan Africa” published in2006.l Crop water requirements (m3/ha/year) in eachcountry are taken from the following reference:Irrigation Potential in Africa: a basin approach, FAOLand and Water Bulletin 4, 1997.l The overall irrigation system efficiency is expectedto be 50%.l The percentage of return flows is expected to be50%.l Irrigation expansion will be targeted at closing thegap between domestic production and demand interms of cereals (e.g. wheat, maize, rice).
4.1.6 Seasonality, climate change and future water availability
Temporal resolution: water availability in a river basinexhibits seasonal and inter-annual variation. Given themacro-level nature of the analysis and data available, ayearly time step is adopted for the analysis and theseasonal variability of water availability in the system(river discharge) is not considered. Likewise theassumption is made that historical weather patterns arerepresentative of possible future conditions (see furtherexplanation under climate change impacts below).
Possible impacts of climate change: According to theIPPC19, (2007), the observed increase in global average
temperature would very likely be due to the increase ingreen house gas concentrations in the atmosphere.Also, “it is likely that there has been significant anthropogenicwarming over the past 50 years averaged over eachcontinent (except Antarctica), (IPPC, 200720)”, asillustrated in Figure 20.
In the future, beside the impacts on water availability(both in quantity and seasonality), Africa would beaffected by an increase in temperature that can impactthe crop water requirements and crop yields: higher airtemperatures induce higher evapotranspiration ratesand therefore higher crop water requirements. It is worth mentioning that the continental trendhighlighted in Figure 20 can vary regionally: someregions could be affected by an increase in rainfall ortemperature while others could be affected by adecrease.
It is now widely accepted by the internationalcommunity that climate change will affect the hydrologyof rivers and lakes and thus overall, freshwaterresources availability. Making use of Global CirculationModels (GCM) results could be useful to assess theimpact of global change on future water availability21.However, GCM provides results in terms of rainfall(depending on the region) and not in terms of riverdischarge and groundwater recharge. To obtainvaluable information for the present PIDA study, itwould require the implementation of spatially distributedhydrological models (transformation of rainfall into run-off), for the ten selected basins. Although it is valuable,this is a very complex scientific exercise and is wellbeyond the scope of the PIDA Study. It is thereforenecessary to make use of the above-statedassumption (see under temporal resolution).
18 The Zambezi River Basin, A Multi-Sector Investment Opportunities Analysis. World Bank, June 2010.19 IPCC Fourth Assessment Report: Climate Change 2007 http://www.ipcc.ch/publications_and_data/ar4/syr/en/mains2-4.html)20 IPCC Fourth Assessment Report: Climate Change 2007 (http://www.ipcc.ch/publications_and_data/ar4/syr/en/mains2-4.html)21 Climate Change 2007: Impacts, Adaptation and Vulnerability. Contribution of Working Group II to the Fourth Assessment Report of theIntergovernmental Panel on Climate Change (IPCC), Cambridge University Press, Cambridge, United Kingdom, 2007
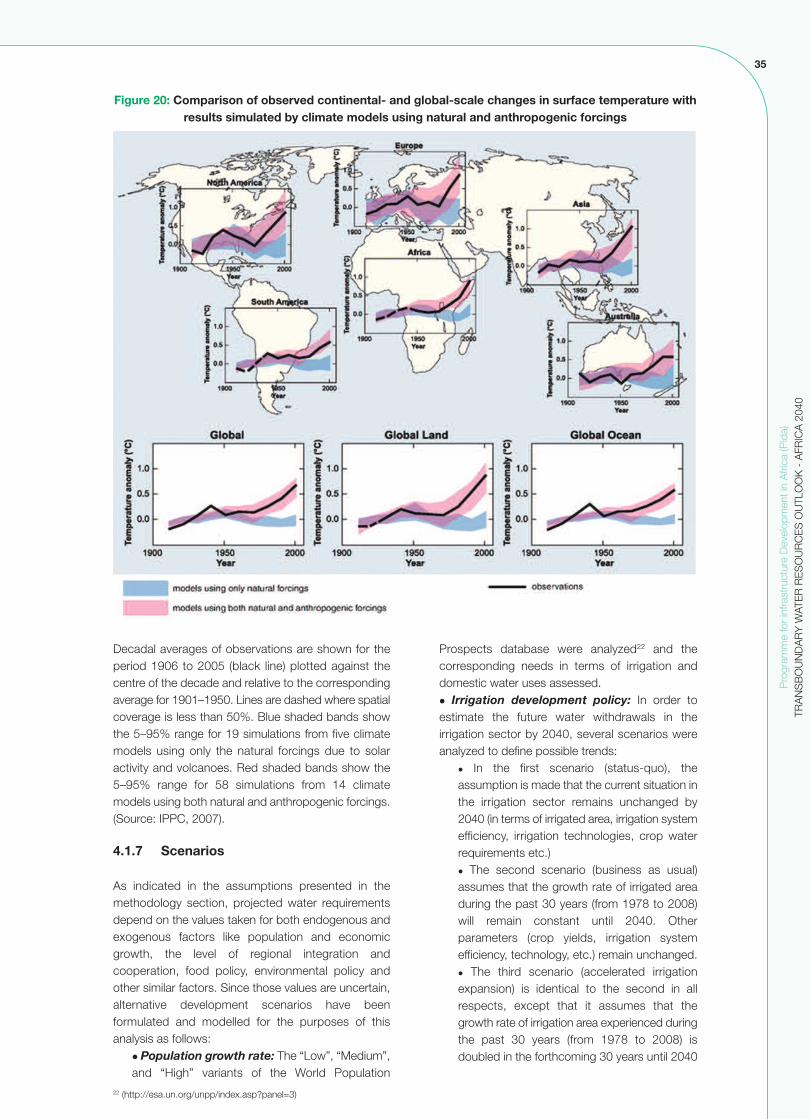
35
Decadal averages of observations are shown for theperiod 1906 to 2005 (black line) plotted against thecentre of the decade and relative to the correspondingaverage for 1901–1950. Lines are dashed where spatialcoverage is less than 50%. Blue shaded bands showthe 5–95% range for 19 simulations from five climatemodels using only the natural forcings due to solaractivity and volcanoes. Red shaded bands show the5–95% range for 58 simulations from 14 climatemodels using both natural and anthropogenic forcings.(Source: IPPC, 2007).
4.1.7 Scenarios
As indicated in the assumptions presented in themethodology section, projected water requirementsdepend on the values taken for both endogenous andexogenous factors like population and economicgrowth, the level of regional integration andcooperation, food policy, environmental policy andother similar factors. Since those values are uncertain,alternative development scenarios have beenformulated and modelled for the purposes of thisanalysis as follows:
l Population growth rate: The “Low”, “Medium”,and “High” variants of the World Population
Prospects database were analyzed22 and thecorresponding needs in terms of irrigation anddomestic water uses assessed.l Irrigation development policy: In order toestimate the future water withdrawals in theirrigation sector by 2040, several scenarios wereanalyzed to define possible trends:
l In the first scenario (status-quo), theassumption is made that the current situation inthe irrigation sector remains unchanged by2040 (in terms of irrigated area, irrigation systemefficiency, irrigation technologies, crop waterrequirements etc.)l The second scenario (business as usual)assumes that the growth rate of irrigated areaduring the past 30 years (from 1978 to 2008)will remain constant until 2040. Otherparameters (crop yields, irrigation systemefficiency, technology, etc.) remain unchanged.l The third scenario (accelerated irrigationexpansion) is identical to the second in allrespects, except that it assumes that thegrowth rate of irrigation area experienced duringthe past 30 years (from 1978 to 2008) isdoubled in the forthcoming 30 years until 2040
Pro
gram
me
for
infra
stru
ctur
e D
evel
opm
ent i
n A
frica
(Pid
a)TR
AN
SB
OU
ND
AR
Y W
ATE
R R
ES
OU
RC
ES
OU
TLO
OK
- A
FRIC
A 2
040
Figure 20: Comparison of observed continental- and global-scale changes in surface temperature withresults simulated by climate models using natural and anthropogenic forcings
22 (http://esa.un.org/unpp/index.asp?panel=3)
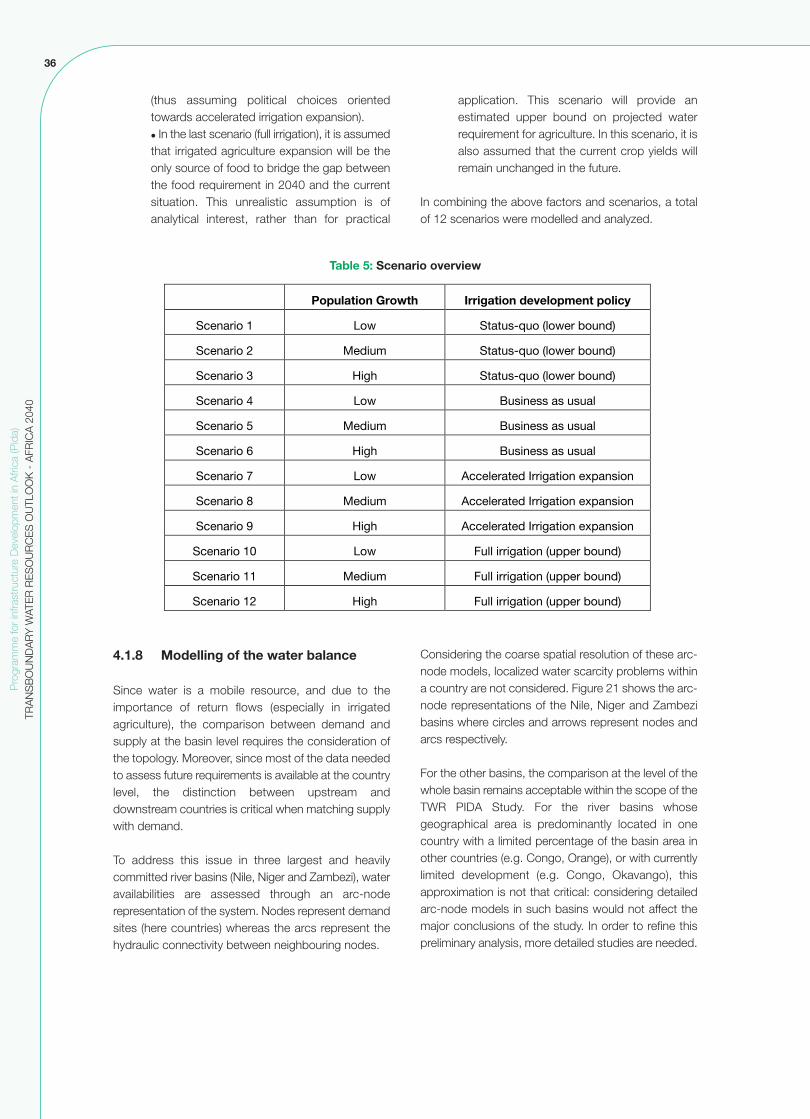
36
Pro
gram
me
for
infra
stru
ctur
e D
evel
opm
ent i
n A
frica
(Pid
a)TR
AN
SB
OU
ND
AR
Y W
ATE
R R
ES
OU
RC
ES
OU
TLO
OK
- A
FRIC
A 2
040
(thus assuming political choices orientedtowards accelerated irrigation expansion).l In the last scenario (full irrigation), it is assumedthat irrigated agriculture expansion will be theonly source of food to bridge the gap betweenthe food requirement in 2040 and the currentsituation. This unrealistic assumption is ofanalytical interest, rather than for practical
application. This scenario will provide anestimated upper bound on projected waterrequirement for agriculture. In this scenario, it isalso assumed that the current crop yields willremain unchanged in the future.
In combining the above factors and scenarios, a totalof 12 scenarios were modelled and analyzed.
Table 5: Scenario overview
� ������������ ��� �������������������������
�������� ��� � � ������������������
��������� ������ � � ������������������
��������� ���� � � ������������������
��������� ��� ���������������
�������� ������ ���������������
��������! ���� ���������������
��������" ��� #������� ��$����� ����%&������
��������' ������ #������� ��$����� ����%&������
��������( ���� #������� ��$����� ����%&������
��������) ��� *��������� �����&&��������
�������� ������ *��������� �����&&��������
��������� ���� *��������� �����&&��������
4.1.8 Modelling of the water balance
Since water is a mobile resource, and due to theimportance of return flows (especially in irrigatedagriculture), the comparison between demand andsupply at the basin level requires the consideration ofthe topology. Moreover, since most of the data neededto assess future requirements is available at the countrylevel, the distinction between upstream anddownstream countries is critical when matching supplywith demand.
To address this issue in three largest and heavilycommitted river basins (Nile, Niger and Zambezi), wateravailabilities are assessed through an arc-noderepresentation of the system. Nodes represent demandsites (here countries) whereas the arcs represent thehydraulic connectivity between neighbouring nodes.
Considering the coarse spatial resolution of these arc-node models, localized water scarcity problems withina country are not considered. Figure 21 shows the arc-node representations of the Nile, Niger and Zambezibasins where circles and arrows represent nodes andarcs respectively.
For the other basins, the comparison at the level of thewhole basin remains acceptable within the scope of theTWR PIDA Study. For the river basins whosegeographical area is predominantly located in onecountry with a limited percentage of the basin area inother countries (e.g. Congo, Orange), or with currentlylimited development (e.g. Congo, Okavango), thisapproximation is not that critical: considering detailedarc-node models in such basins would not affect themajor conclusions of the study. In order to refine thispreliminary analysis, more detailed studies are needed.

37
With the above assumptions and data sources,projections of future water requirements in Africa werecalculated for the different scenarios presented in Table5. The results are first presented at the continental leveland subsequently at the selected PIDA basins level.These water requirements are the volume of waterneeded to meet the needs of the domestic, agriculturaland industrial sectors (including evaporation lossesfrom reservoirs where data was available) should therebe no limit on water and financial resources.
4.2 Current and forecast water resources withdrawals and requirements at continental level
As indicated in the previous sections, waterrequirements are expected to increase significantly by2040, with food production through irrigated agriculturerepresenting, by far the largest consumption. Thissection gives an overview of the difference between thewater requirements and the volume of water availableat the continental level.
4.2.1 Analysis of food requirements (cereals)
As illustrated above, the projection of food requirementfor the 2040 horizon is based on the assumption thatproduction increases in irrigated agriculture will betargeted at closing the gap between domesticproduction and demand in terms of cereals (e.g. wheat,maize, rice). Considering a caloric cereal requirementof 190 kg/cap/year, the forecast additional fooddemand, in terms of cereals, was estimated for eachscenario considered in Table 5. The future foodrequirement will only vary depending on the populationgrowth scenario i.e. low, medium and high as otherfactors taken into account do not impact the forecastfood demand. The results are presented in Figure 22where the current cereal consumption and forecastcereal requirements in Africa (for the various scenarios)are illustrated.
Pro
gram
me
for
infra
stru
ctur
e D
evel
opm
ent i
n A
frica
(Pid
a)TR
AN
SB
OU
ND
AR
Y W
ATE
R R
ES
OU
RC
ES
OU
TLO
OK
- A
FRIC
A 2
040
Figure 21: Map of the arc-node models for the Nile, Niger and Zambezi River basins.

38
Pro
gram
me
for
infra
stru
ctur
e D
evel
opm
ent i
n A
frica
(Pid
a)TR
AN
SB
OU
ND
AR
Y W
ATE
R R
ES
OU
RC
ES
OU
TLO
OK
- A
FRIC
A 2
040
The current cereal consumption is estimated by thesum of the current production and imports minusexports23. It is shown in the figure that:
l Currently, the consumption of cereals in Africa isaround 192 million tons of which 73.4% (142 milliontons) are produced in Africa. The total cereal exportis around 3 million tons while the imports are closeto 53 million tons.l The increase in total cereal requirements in Africa(compared to the current situation) is expected torange between 56% and 78% depending on thescenario considered. In terms of cereals quantities,it represents an increase ranging from 106 to 150million tons (compared to 192 million tonscurrently).
As mentioned in Chapter 2, the spatial distribution ofthese additional food requirements is illustrated inFigure 9. Not surprisingly, these requirements closelymirror the predicted population distribution. The Nile,Congo and Niger River basins (and the Zambezi to alesser extent), face the highest increased in foodrequirements.
4.2.2 Analysis of gross water requirements
Continental figures and sector’s contributionsFigure 23 shows the total forecast (2040) annual grosswater requirements for the twelve scenarios at thecontinental level. This is the volume of water that mustbe withdrawn from the river system for domestic,industrial and agricultural uses. Evaporation losses fromthe large man-made reservoirs are also included where
data was available. The total water withdrawals for thereference year 2005 are shown for comparativepurposes.
In 2005, the volume of water withdrawn from the riversystems across Africa was about 265 km3 (or billionm3) per year of which 66 km3 per year lost byevaporation losses from man-made reservoirs, 9 km3/yfor industrial uses, 21 km3 per year for domestic usesand 170 km3 for the agricultural sector.
It is estimated that by 2040, the gross waterrequirement for domestic uses will range between 135-161 km3 per year, depending on the population growthrate scenario. In other words, the impact of the futurepopulation growth rate on the gross water requirementscan be as high as 20%. According to the estimatedfuture annual GDP growth rate of 6%, industrial grosswater requirements will total around 35 km3 per year.Finally, evaporation losses from man-made reservoirswill represent a significant part of the requirements, witha total of around 77 km3 per year, more than twice thegross water requirement for industrial uses.
For the agricultural sector, the water withdrawals in2040 will vary depending on a series of economical,technical, climatic and political conditions, and factorsthat are difficult (if not impossible) to predict. However,modelling the four scenarios (for irrigated agriculturedevelopment) described above provides a goodindication of the expected order of magnitude of thefuture withdrawals for the irrigation sector:Status-quo scenario: If the current situation in theirrigation sector remains unchanged at the 2040
Figure 22: Current cereals consumption and forecast requirements for 2040 in Africa.
23 Total cereals production, imports and exports are available for each country in the FAOSTAT online database
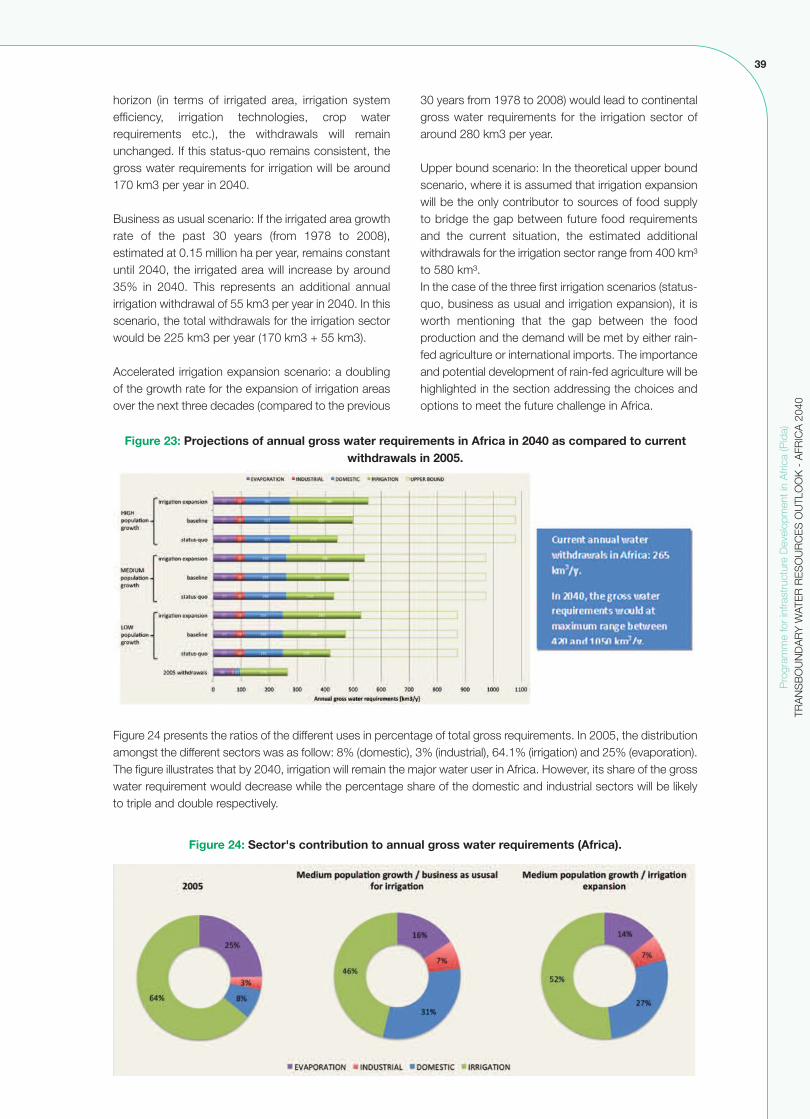
39
horizon (in terms of irrigated area, irrigation systemefficiency, irrigation technologies, crop waterrequirements etc.), the withdrawals will remainunchanged. If this status-quo remains consistent, thegross water requirements for irrigation will be around170 km3 per year in 2040.
Business as usual scenario: If the irrigated area growthrate of the past 30 years (from 1978 to 2008),estimated at 0.15 million ha per year, remains constantuntil 2040, the irrigated area will increase by around35% in 2040. This represents an additional annualirrigation withdrawal of 55 km3 per year in 2040. In thisscenario, the total withdrawals for the irrigation sectorwould be 225 km3 per year (170 km3 + 55 km3).
Accelerated irrigation expansion scenario: a doublingof the growth rate for the expansion of irrigation areasover the next three decades (compared to the previous
30 years from 1978 to 2008) would lead to continentalgross water requirements for the irrigation sector ofaround 280 km3 per year.
Upper bound scenario: In the theoretical upper boundscenario, where it is assumed that irrigation expansionwill be the only contributor to sources of food supplyto bridge the gap between future food requirementsand the current situation, the estimated additionalwithdrawals for the irrigation sector range from 400 km³to 580 km³. In the case of the three first irrigation scenarios (status-quo, business as usual and irrigation expansion), it isworth mentioning that the gap between the foodproduction and the demand will be met by either rain-fed agriculture or international imports. The importanceand potential development of rain-fed agriculture will behighlighted in the section addressing the choices andoptions to meet the future challenge in Africa.
Pro
gram
me
for
infra
stru
ctur
e D
evel
opm
ent i
n A
frica
(Pid
a)TR
AN
SB
OU
ND
AR
Y W
ATE
R R
ES
OU
RC
ES
OU
TLO
OK
- A
FRIC
A 2
040
Figure 23: Projections of annual gross water requirements in Africa in 2040 as compared to currentwithdrawals in 2005.
Figure 24: Sector's contribution to annual gross water requirements (Africa).
Figure 24 presents the ratios of the different uses in percentage of total gross requirements. In 2005, the distributionamongst the different sectors was as follow: 8% (domestic), 3% (industrial), 64.1% (irrigation) and 25% (evaporation).The figure illustrates that by 2040, irrigation will remain the major water user in Africa. However, its share of the grosswater requirement would decrease while the percentage share of the domestic and industrial sectors will be likelyto triple and double respectively.
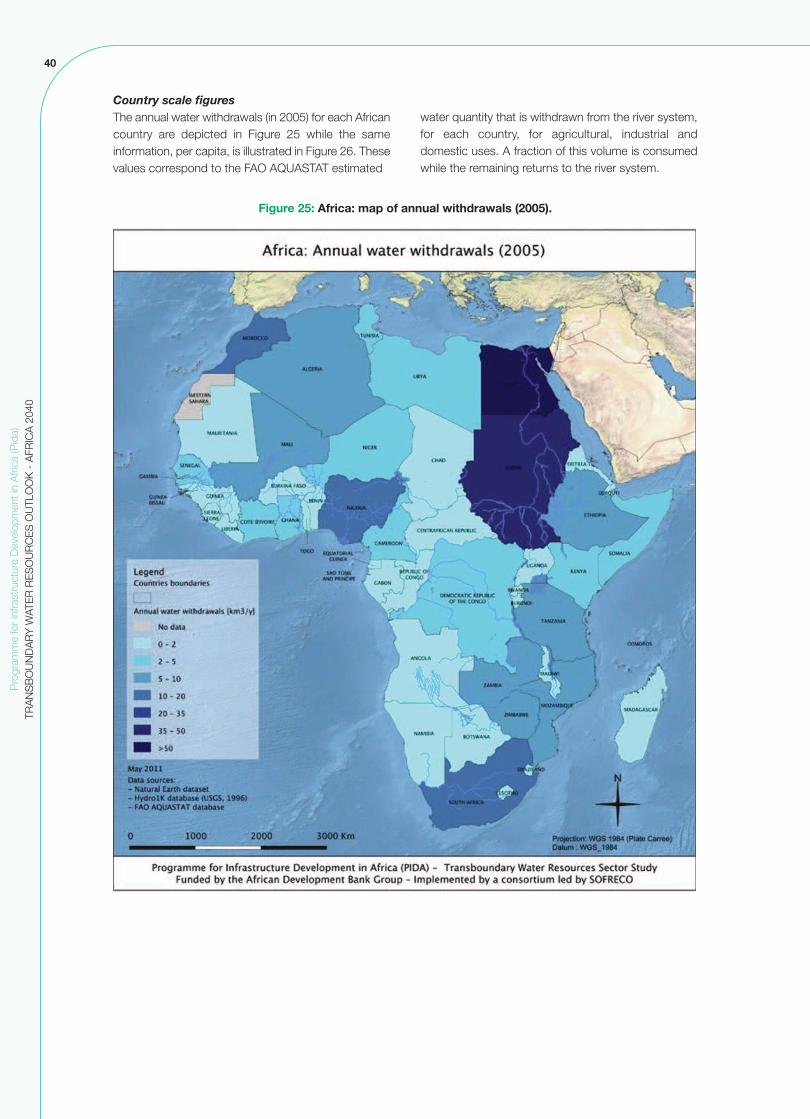
40
Pro
gram
me
for
infra
stru
ctur
e D
evel
opm
ent i
n A
frica
(Pid
a)TR
AN
SB
OU
ND
AR
Y W
ATE
R R
ES
OU
RC
ES
OU
TLO
OK
- A
FRIC
A 2
040
Country scale figuresThe annual water withdrawals (in 2005) for each Africancountry are depicted in Figure 25 while the sameinformation, per capita, is illustrated in Figure 26. Thesevalues correspond to the FAO AQUASTAT estimated
water quantity that is withdrawn from the river system,for each country, for agricultural, industrial anddomestic uses. A fraction of this volume is consumedwhile the remaining returns to the river system.
Figure 25: Africa: map of annual withdrawals (2005).

41
Figure 27 shows countries’ annual gross waterrequirements for the year 2040 considering a mediumpopulation growth rate and business as usual irrigationdevelopment scenario (irrigated area growth rate of thepast 30 years remains constant until 2040, all otherparameters remain unchanged).The map illustratesthat:
l In 2040, most of the countries in the Nile basinwill have a high gross water requirement for water(> 50 km3/y)l The pressure on the water resources in the Nigerand Orange Rivers is also likely to increase andmost of the riparian countries have now gross waterrequirement exceeding 15 km3/y
Pro
gram
me
for
infra
stru
ctur
e D
evel
opm
ent i
n A
frica
(Pid
a)TR
AN
SB
OU
ND
AR
Y W
ATE
R R
ES
OU
RC
ES
OU
TLO
OK
- A
FRIC
A 2
040
Figure 26: Map of annual water withdrawals per capita (2005).

42
Pro
gram
me
for
infra
stru
ctur
e D
evel
opm
ent i
n A
frica
(Pid
a)TR
AN
SB
OU
ND
AR
Y W
ATE
R R
ES
OU
RC
ES
OU
TLO
OK
- A
FRIC
A 2
040
4.2.3 Analysis of net water requirements
A distinction must be made between gross waterrequirements and net water requirements. While theformer is the volume of water withdrawn from the river,reservoir or aquifer, the latter refers to the requirementneeded for actual consumption uses. The difference isthe combined losses that occur between point ofabstraction and point of use. Hence, compared togross water requirements, net water requirements arelower by a factor proportional to the efficiencies in thedifferent water-using activities.
Figure 28 shows the annual net water requirements forthe reference year 2005, as compared to the netrequirements by 2040 for the various scenarios. On thebasis of the assumptions on efficiencies introduced inthe methodology, Figure 28 shows that the netconsumption for the year 2005 is around 165 km3/ywhile the gross requirements were around 265 km3/y.By 2040, the net annual water requirement forecastcould range from 248 to 318 km3/y depending on thedevelopment scenario considered, with an upper limitof around 580 km3 per year.
Figure 27: Africa: Forecasted annual gross water requirement (2040).
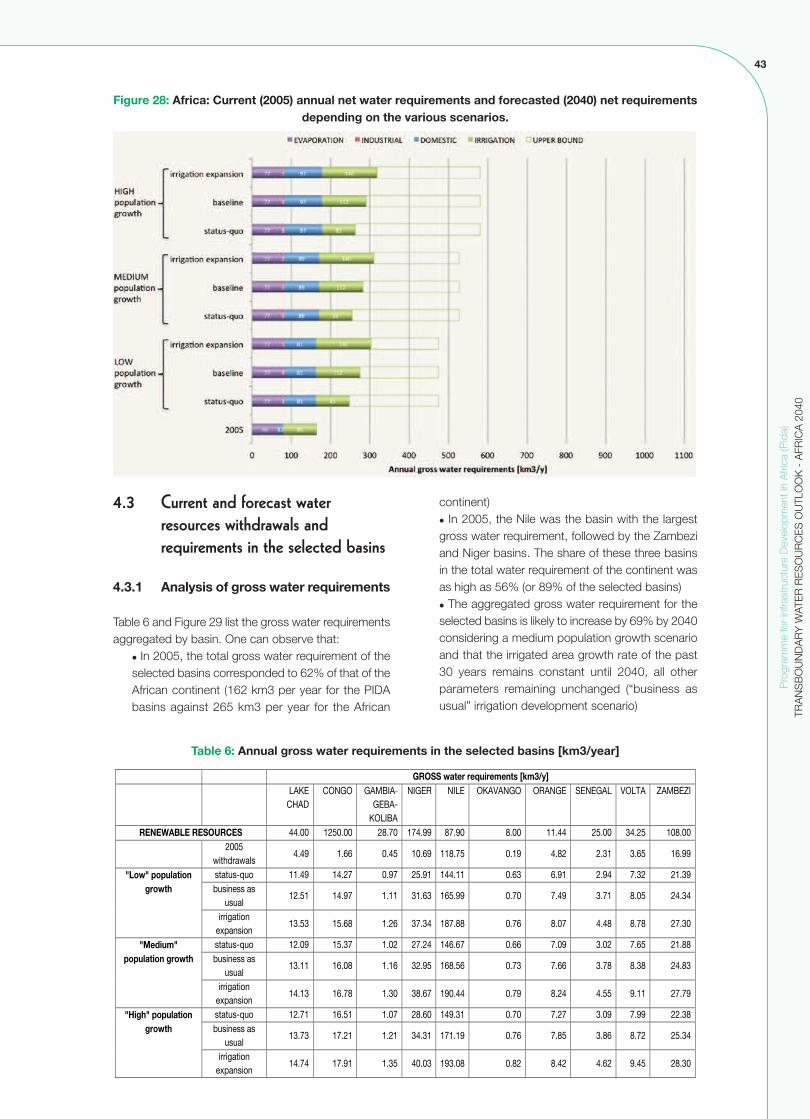
43
4.3 Current and forecast water resources withdrawals and requirements in the selected basins
4.3.1 Analysis of gross water requirements
Table 6 and Figure 29 list the gross water requirementsaggregated by basin. One can observe that:
l In 2005, the total gross water requirement of theselected basins corresponded to 62% of that of theAfrican continent (162 km3 per year for the PIDAbasins against 265 km3 per year for the African
continent) l In 2005, the Nile was the basin with the largestgross water requirement, followed by the Zambeziand Niger basins. The share of these three basinsin the total water requirement of the continent wasas high as 56% (or 89% of the selected basins)l The aggregated gross water requirement for theselected basins is likely to increase by 69% by 2040considering a medium population growth scenarioand that the irrigated area growth rate of the past30 years remains constant until 2040, all otherparameters remaining unchanged (“business asusual” irrigation development scenario)
Pro
gram
me
for
infra
stru
ctur
e D
evel
opm
ent i
n A
frica
(Pid
a)TR
AN
SB
OU
ND
AR
Y W
ATE
R R
ES
OU
RC
ES
OU
TLO
OK
- A
FRIC
A 2
040
Figure 28: Africa: Current (2005) annual net water requirements and forecasted (2040) net requirementsdepending on the various scenarios.
Table 6: Annual gross water requirements in the selected basins [km3/year]
� � ������������ �������������� � �����
�������� ��� ��-
�� ����� ��
����� ���� ������ ����� ������� ����� ��� ����
�������������������� ������ �������� ������ ������� ������ ����� ������ ������ ������ ������� � �����
� !"#$%�%&'������ ��((� ����� ���(�� ������� ����� ����� ����� ��(�� �(����
�� ���! !�"�� ��# ��$�
'!%!)'�*)+� ������ ������ ����� ������ ������� ��(�� (���� ����� ����� ������,)' -.''�%'�
)')%&������� ������ ����� ���(�� �(����� ����� ����� ����� ����� ������
$$ /%! +-�.01%-' +-�
������ ���(�� ���(� ������ ������� ���(� ����� ����� ����� ������
�%& ����! !�"�� ��# ��$�
'!%!)'�*)+� ������ ������ ����� ������ ��(�(�� ��((� ����� ����� ��(�� ������,)' -.''�%'�
)')%&������� �(���� ���(� ������ �(���(� ����� ��((� ����� ����� ������
$$ /%! +-�.01%-' +-�
������ �(���� ����� ���(�� ������� ����� ����� ����� ����� ������
�' #$��! !�"�� ��# ��$�
'!%!)'�*)+� ������ �(���� ����� ���(�� ������� ����� ����� ����� ����� ������,)' -.''�%'�
)')%&������� ������ ����� ������ ������� ���(� ����� ���(� ����� ������
$$ /%! +-�.01%-' +-�
������ ������ ����� ������ ������� ����� ����� ��(�� ����� ������

44
Pro
gram
me
for
infra
stru
ctur
e D
evel
opm
ent i
n A
frica
(Pid
a)TR
AN
SB
OU
ND
AR
Y W
ATE
R R
ES
OU
RC
ES
OU
TLO
OK
- A
FRIC
A 2
040
Figure 30 shows the relative contribution of the varioususes for 2005 and the two most likely scenarios(“business as usual” and “accelerated” irrigationexpansion scenario, both of them assuming a mediumpopulation growth). One can see that:
l In 2005, 71.2% of the gross water requirements(withdrawals) were made to be used in irrigatedagriculture. This highlights the central role ofagriculture in the analysis
l In 2040, that proportion will decrease and reachbetween 54% and 59% for the medium populationgrowth scenario depending on the irrigationdevelopment policy.l The largest differences between scenarios areobserved for the domestic sector, given theexpected population growth and higher livingstandards; the industrial sector remains fairlyconstant.
Figure 29: Annual gross water requirements in the selected basins for a medium population growthscenario.

45
Figure 31 shows the annual net water requirements for the year 2005 and the net water requirements consideringa medium population growth scenario and the various irrigation development scenarios.
Pro
gram
me
for
infra
stru
ctur
e D
evel
opm
ent i
n A
frica
(Pid
a)TR
AN
SB
OU
ND
AR
Y W
ATE
R R
ES
OU
RC
ES
OU
TLO
OK
- A
FRIC
A 2
040
Figure 30: Different sector's contribution to gross water requirements in the selected basins.
Figure 31: Annual net water requirements in the selected basins.

46
Pro
gram
me
for
infra
stru
ctur
e D
evel
opm
ent i
n A
frica
(Pid
a)TR
AN
SB
OU
ND
AR
Y W
ATE
R R
ES
OU
RC
ES
OU
TLO
OK
- A
FRIC
A 2
040
4.3.2 Gap between supply and net requirements/Level of commitment of the selected basins
Level of commitmentThe level of commitment in a river basin is defined asthe ratio between water consumption and the naturalrenewable resource available in the river basin. In otherwords, the total current available yield (availablerenewable resources before infrastructure) is comparedwith water consumption at the basin level, taking intoaccount the possible use of return flows. The objectiveis to make a distinction between basins that are likelyto be fully committed and those where there is stillsome degree of flexibility for water allocation todomestic, industrial and agricultural activities.
Figure 32 presents the level of commitment modelledfor the medium population growth rate scenario whileconsidering three irrigation development scenarios. Thesituation in 2005 is also presented for comparativepurposes. A spatial illustration of the same informationis presented in Figure 33. It shows that:
l Currently, the Nile basin is almost fully committedwhile the level of commitment of the Orange-Senqubasin is around 30%l In 2040, the level of commitment in the selectedbasins may remain as low as 0.8% in the Congo,while it will rapidly approach 100% in the Nilel The river basins where the level of commitmentwill be close to or exceed 15% are: Zambezi, Volta,Orange-Senqu, Lake Chad and Nile.
Figure 32: Percentage of commitment in the selected basins.
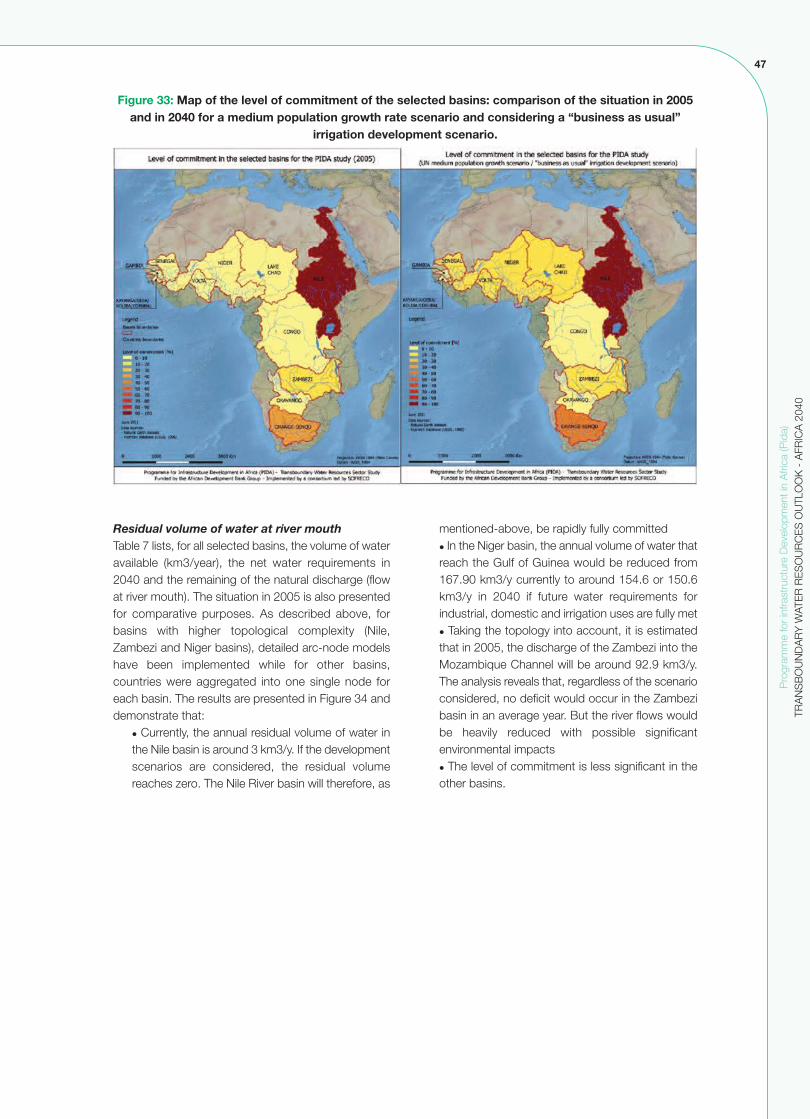
47
Residual volume of water at river mouthTable 7 lists, for all selected basins, the volume of wateravailable (km3/year), the net water requirements in2040 and the remaining of the natural discharge (flowat river mouth). The situation in 2005 is also presentedfor comparative purposes. As described above, forbasins with higher topological complexity (Nile,Zambezi and Niger basins), detailed arc-node modelshave been implemented while for other basins,countries were aggregated into one single node foreach basin. The results are presented in Figure 34 anddemonstrate that:
l Currently, the annual residual volume of water inthe Nile basin is around 3 km3/y. If the developmentscenarios are considered, the residual volumereaches zero. The Nile River basin will therefore, as
mentioned-above, be rapidly fully committedl In the Niger basin, the annual volume of water thatreach the Gulf of Guinea would be reduced from167.90 km3/y currently to around 154.6 or 150.6km3/y in 2040 if future water requirements forindustrial, domestic and irrigation uses are fully met l Taking the topology into account, it is estimatedthat in 2005, the discharge of the Zambezi into theMozambique Channel will be around 92.9 km3/y.The analysis reveals that, regardless of the scenarioconsidered, no deficit would occur in the Zambezibasin in an average year. But the river flows wouldbe heavily reduced with possible significantenvironmental impacts l The level of commitment is less significant in theother basins.
Pro
gram
me
for
infra
stru
ctur
e D
evel
opm
ent i
n A
frica
(Pid
a)TR
AN
SB
OU
ND
AR
Y W
ATE
R R
ES
OU
RC
ES
OU
TLO
OK
- A
FRIC
A 2
040
Figure 33: Map of the level of commitment of the selected basins: comparison of the situation in 2005and in 2040 for a medium population growth rate scenario and considering a “business as usual”
irrigation development scenario.
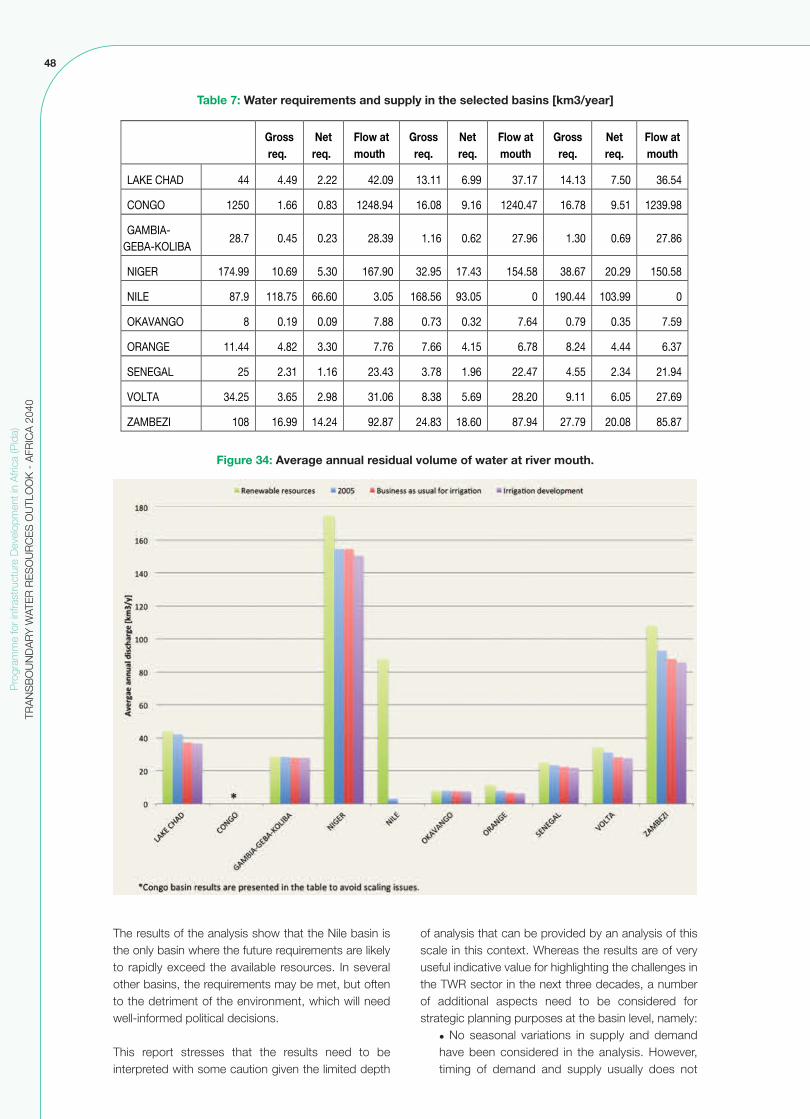
48
Pro
gram
me
for
infra
stru
ctur
e D
evel
opm
ent i
n A
frica
(Pid
a)TR
AN
SB
OU
ND
AR
Y W
ATE
R R
ES
OU
RC
ES
OU
TLO
OK
- A
FRIC
A 2
040
The results of the analysis show that the Nile basin isthe only basin where the future requirements are likelyto rapidly exceed the available resources. In severalother basins, the requirements may be met, but oftento the detriment of the environment, which will needwell-informed political decisions.
This report stresses that the results need to beinterpreted with some caution given the limited depth
of analysis that can be provided by an analysis of thisscale in this context. Whereas the results are of veryuseful indicative value for highlighting the challenges inthe TWR sector in the next three decades, a numberof additional aspects need to be considered forstrategic planning purposes at the basin level, namely:
l No seasonal variations in supply and demandhave been considered in the analysis. However,timing of demand and supply usually does not
Table 7: Water requirements and supply in the selected basins [km3/year]
� �����������
�������
��� ��������
�����������
�������
��� ��������
�����������
�������
��� ��������
���������� � �� ���� � �� ����� ���� ����� ���� �� � ����
������ ��� � ���� ��� ����� �� �� ���� �� �� ����� ���� �������
�������������������
���� �� ��� ����� ���� ��� ����� �� � ��� �����
������ ����� � ��� �� � ���� � ����� ���� ����� ����� � ��� �� ���
����� ���� ������ ��� � � �� ������ �� �� � �� � � ���� �
��������� �� ��� �� ���� ��� ��� ��� ��� ��� ����
������� ��� ��� �� � ���� ���� ��� ���� ��� � ����
�������� ��� ���� ���� ���� ���� ���� ���� ��� ��� ����
������ ���� ���� ���� �� �� ���� ���� ��� � ���� � �� �����
�������� � �� ����� ��� ����� ���� ��� � ���� ����� � �� �����
Figure 34: Average annual residual volume of water at river mouth.

49
match and therefore requires the construction andoperation of reservoirs (dams) to provide seasonalriver discharge regulation for irrigation, domesticand industrials usesl The analysis is based on average values fordemand and supply. However, supply and to alesser extent demand, exhibit high seasonal andinter-annual variability. For example, in the Nilebasin, the annual volume of water at Aswan can bebelow 50 km3/y during dry years but it can behigher than 120 km3/y during wet yearsl Environmental uses are not included in theprojections: minimum flow requirements, high andlow flows patterns (artificial floods) etc. This meansthat areas with no projected water deficit maynevertheless face important environmentalconsequences. The above-mentioned projecteddeficits would also increase should minimum flow
discharges to the sea be imposed (e.g. to preventsea water intrusion in the coastal aquifer, fishproduction, etc.). It would be useful for furtheranalysis to make simulations with several values ofthe ratio between projected river flow at the mouthand natural flow.
Figure 35 shows the percentage of natural flow thatwould be used (in an average year) if each countrydecides to consume as much as required (net waterrequirements)—assuming a medium population growthand considering a “business as usual” irrigationdevelopment scenario (irrigated area growth rate of thepast 30 years remains constant until 2040—all otherparameters remain unchanged). The higher this ratio,the more competition between sectors (including theenvironment) is likely to occur.
Pro
gram
me
for
infra
stru
ctur
e D
evel
opm
ent i
n A
frica
(Pid
a)TR
AN
SB
OU
ND
AR
Y W
ATE
R R
ES
OU
RC
ES
OU
TLO
OK
- A
FRIC
A 2
040
Figure 35: Percentage of natural flow which would be used (in an average year) if each countrydecides to consume as much as required to maintain the current SSR and assuming a medium
population growth.

50
Pro
gram
me
for
infra
stru
ctur
e D
evel
opm
ent i
n A
frica
(Pid
a)TR
AN
SB
OU
ND
AR
Y W
ATE
R R
ES
OU
RC
ES
OU
TLO
OK
- A
FRIC
A 2
040
This section presents a quantitative estimate ofinfrastructure gaps in the trans-boundary waterresources sector focusing on hydropower andirrigation.
5.1 Hydropower infrastructure gap
A cross-sectoral analysis has been carried out with thePIDA energy team in order to provide coherence ofanalysis between the PIDA sectors.
5.1.1 Current picture of the energy sectorin Africa
Africa has 15% of the world’s population but accountsfor only 3% of the world’s primary energy consumption(renewable energy and waste excluded) and 5-6% ofthe world’s final energy consumption (renewable energyand waste included). Electricity consumption per capitais 1/6 of world overall average. Access rates,particularly in Sub-Saharan Africa, are amongst thelowest in the world with only 1/5 of the populationhaving access to electricity. The continent thereforeneeds to make renewed efforts to increase theexploitation of its significant energy generationpotential.
The incentive to pool energy resources in Africa isstrong and led to the formation of regional power poolsin the 1990s. However, cross-border power trade hasyet to take off outside of the Southern Africa PowerPool (SAPP) as noted. In West Africa, power trade isonly 5% of total consumption. In the meantime, manySub-Saharan African countries continue to experiencean acute shortage in energy supply which will take timeto overcome. This obstacle makes the goal of universalaccess to electricity by 2040 very challenging for a
majority of African countries. Expanding regional energyintegration is therefore an essential step to improveaffordability by households if these universal accessgoals are to be achieved.
5.1.2 Forecast energy demand
The PIDA energy sector team defined the projectionsin terms of energy produced and consumed (kWh) andpeak demand to be met (kW) through availablegeneration capacity using optimum and least costtechnology mix, and high voltage transmission flowsthrough existing, reinforced and new lines. This (TWR)analysis reflects the following findings of the PIDAenergy team which are used as a basis:
Overall, the power demand is forecasted to increaseconsiderably by a factor of four (410%) over the perioduntil 2040 for the African continent. The average growthrate of energy demand is 5.5% p.a over the entireperiod (from 2009 to 2040). The evolution of the powerand energy demand during the forecast period (from2009 to 2040) is depicted in Figure 36 where it showsthat, overall, the continent will need 447.4 GW ofadditional capacity to reach a capacity of 556.5 GW intotal (PIDA energy sector).
Furthermore, under the assumption of the PIDA energysector team, it appears that the costs ofinterconnections are very small compared to the totalgeneration costs (about 1% of the total generationcosts) while the costs of building new transmission lineswould be small compared to the cost of building thenew additional power plants. As a consequence, anunderlying assumption for the analysis is that a full pan-Africa interconnected power grid will be operational in2040.
5. INFRASTRUCTURE GAP IN THE TRANSBOUNDARY WATER RESOURCES SECTOR
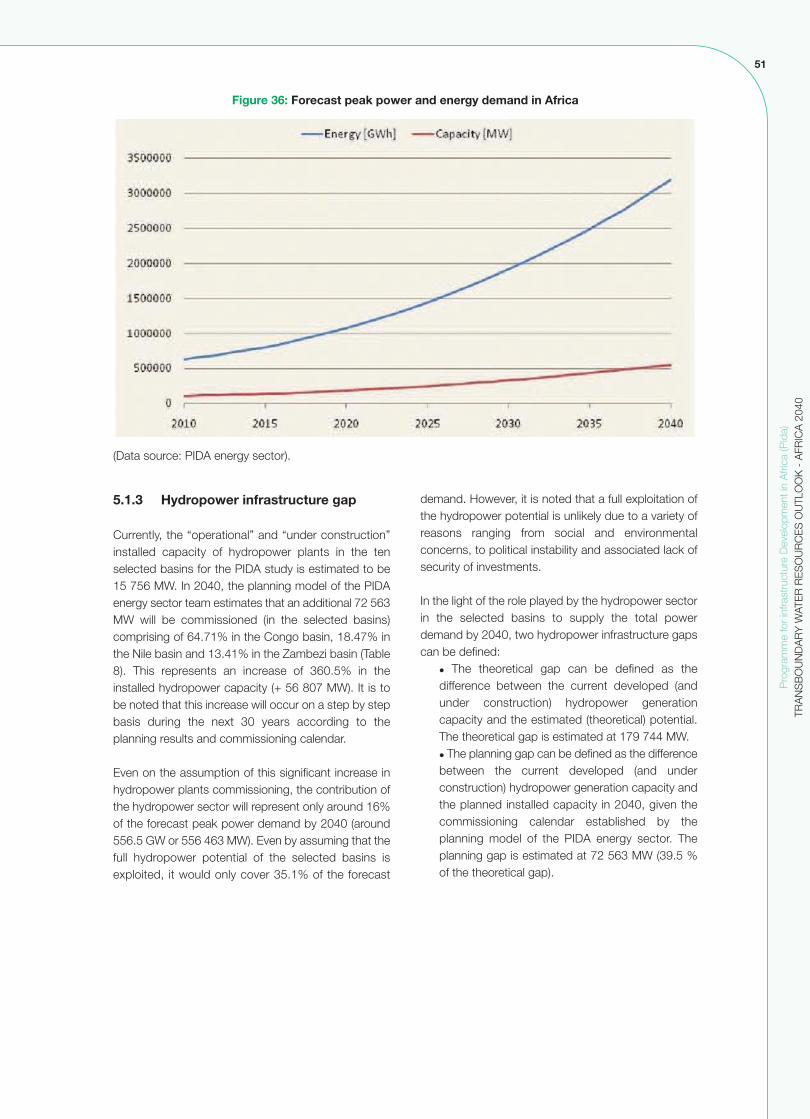
51
5.1.3 Hydropower infrastructure gap
Currently, the “operational” and “under construction”installed capacity of hydropower plants in the tenselected basins for the PIDA study is estimated to be15 756 MW. In 2040, the planning model of the PIDAenergy sector team estimates that an additional 72 563MW will be commissioned (in the selected basins)comprising of 64.71% in the Congo basin, 18.47% inthe Nile basin and 13.41% in the Zambezi basin (Table8). This represents an increase of 360.5% in theinstalled hydropower capacity (+ 56 807 MW). It is tobe noted that this increase will occur on a step by stepbasis during the next 30 years according to theplanning results and commissioning calendar.
Even on the assumption of this significant increase inhydropower plants commissioning, the contribution ofthe hydropower sector will represent only around 16%of the forecast peak power demand by 2040 (around556.5 GW or 556 463 MW). Even by assuming that thefull hydropower potential of the selected basins isexploited, it would only cover 35.1% of the forecast
demand. However, it is noted that a full exploitation ofthe hydropower potential is unlikely due to a variety ofreasons ranging from social and environmentalconcerns, to political instability and associated lack ofsecurity of investments.
In the light of the role played by the hydropower sectorin the selected basins to supply the total powerdemand by 2040, two hydropower infrastructure gapscan be defined:
l The theoretical gap can be defined as thedifference between the current developed (andunder construction) hydropower generationcapacity and the estimated (theoretical) potential.The theoretical gap is estimated at 179 744 MW.l The planning gap can be defined as the differencebetween the current developed (and underconstruction) hydropower generation capacity andthe planned installed capacity in 2040, given thecommissioning calendar established by theplanning model of the PIDA energy sector. Theplanning gap is estimated at 72 563 MW (39.5 %of the theoretical gap).
Pro
gram
me
for
infra
stru
ctur
e D
evel
opm
ent i
n A
frica
(Pid
a)TR
AN
SB
OU
ND
AR
Y W
ATE
R R
ES
OU
RC
ES
OU
TLO
OK
- A
FRIC
A 2
040
Figure 36: Forecast peak power and energy demand in Africa
(Data source: PIDA energy sector).

52
Pro
gram
me
for
infra
stru
ctur
e D
evel
opm
ent i
n A
frica
(Pid
a)TR
AN
SB
OU
ND
AR
Y W
ATE
R R
ES
OU
RC
ES
OU
TLO
OK
- A
FRIC
A 2
040
Table 8: Operational, under construction and planned hydropower plants in the selected basins24
������������ ������������
��������� �� �������������� ����� � �������
���������� � � �� �
�� ��� ��� � ����� ������
������������������� � � ��� ���
����� ����� � ����� ���
���� ���� ���� ������ ����
����� ��� � � � ��
��� ����� ��� ���� � � �
�� ����� ���� � ��� ���
������ ����� � ���� ����
���� �� ����� � ���� ����
��������������� � � ��� �� � ��� ��� ���� ���
Table 9: Hydropower infrastructure gaps in the selected basins
������������ ������������
������������� �����������
���������� � ��
�� ��� ������ ������
�������������������
��� ���
����� ����� ����
���� ������ ������
����� ��� �� �
��� ����� ��� ����� �
�� ����� ����� ���
������ ���� ����
���� �� ������ �����
��������������� � ������ �������
24 Although efforts have been made to ensure consistency of data use across PIDA sectors, some figures presented in the table may differ fromthe ones used in the Energy Outlook due to different spatial scales of analysis (RECs/Power Pools for the energy, transboundary river basins forTWR).
Figure 37: Map of the major planned hydropower plants in the selected basins. Points are proportionalto the installed capacity of the hydropower plant.

53
5.2 Irrigation
5.2.1 Current picture of the irrigation sector in Africa
At present, irrigation is relatively marginal particularly inCentral Africa where the percentage of area equippedfor irrigation (regarding the cultivated area) is below 5%in most countries and even below 1% in somecountries. This is largely due to the humid climate thatprovides good conditions for rain-fed agriculture. Onthe other hand, irrigation plays a crucial role in Northernand Southern regions where the climatic conditions aredrier (arid and semi-arid). Currently, merely 20% of thepotential irrigation area in Africa is exploited. During thepast decade (from 1998 to 2008), the annual growthrate of area equipped for irrigation in Africa was onlyhalf of that observed in the world (0.62% regarding1.10% respectively). In terms of irrigated area, thisrepresents an annual increase of 81 030 ha per year inAfrica while it was 3 178 300 ha per year in the world.A comprehensive description of the current situation ofthe irrigation sector in Africa and in the ten selectedbasins can be found in section 3.2.2 of this report.
5.2.2 Irrigation infrastructure gap
Based on the findings presented in Chapter 4 (ForecastWater Requirements – Outlook 2040), it can beextrapolated that:
l In 2005, the cereal consumption (production +imports – exports) in Africa was 191.89 million tonsof which 34.18 million tons were produced byirrigated area (estimation). As a consequence, thedifference (157.71 million tons) must be providedby rain-fed agriculture (107.48 million tons) and anet import balance of 50.23 million tons)l In 2040, assuming that through the “business asusual” irrigation development scenario, the cropyield of irrigated cereals would increase by 10% andthat the current self-sufficiency ratio for cerealswould remain constant, the irrigated cerealproduction would be around 66.96 million tonswhile the requirements would be around 319.34million tons (assuming a medium population growthscenario). As a consequence, it would benecessary to cultivate 252.38 million tons of cerealthrough rain-fed agriculture or imported l In 2040, assuming the “accelerated irrigationexpansion” scenario and the similar assumptions
as in the previous scenario, the irrigated productionwould be around 79.58 million tons of cereals. Asa consequence, the gap to be filled by rain-fed andnet imports of cereals would be around 240 milliontons.
Based on this forecast of cereal requirements, therequired land surface that will need to be irrigated by2040 can be roughly estimated25. Assuming that in2040 rain-fed agriculture will be able to produce 50%more than at the present time, rain fed cerealproduction would then be around 161.22 milliontons/year. The remaining food requirements (158.12million tons) would then have to be produced throughirrigated agriculture.
Assuming a crop yield increase reaching 4 tons/ha anda cropping intensity26 of 1.5, the total irrigated areashould then be 26.3 million ha for a medium populationgrowth scenario. This would be an increase of 12.85million hectares compared to 2008. The situation is summarized in table below (Table 10).In light of the above observations, it is evident that theforecast demand for food for 2040 can only be metwith an intensification of both irrigated and rain-fedagriculture. The various options to bridge the estimatedgap and intensify the food production are as follow:
l Find the right balance between rain-fed andirrigation agriculturel Increase agriculture productivityl Expand irrigated area and increase irrigationefficiencyl Increase the yield of stressed river basins (forinstance by reducing evaporated areas)l Consider inter-basins water transfers.
These options will be addressed in the next section.However, it should be noted that irrigation expansion isexpensive and is not the only way to provide foodsecurity in Africa. As water resources per capita willbecome increasingly scarce, priority should be given tothe production of high-value crops. While irrigationexpansion will still be needed in arid and semi-aridregions, there is a huge potential for improved rain-fedagriculture practices especially for small-holders whichcould have profound impacts on crop yield and henceimproved food security. Achieving food security is acomplicated issue that includes inputs availability,market infrastructure, trade, research, extension andother factors and will be further discussed in thefollowing chapter on options.
Pro
gram
me
for
infra
stru
ctur
e D
evel
opm
ent i
n A
frica
(Pid
a)TR
AN
SB
OU
ND
AR
Y W
ATE
R R
ES
OU
RC
ES
OU
TLO
OK
- A
FRIC
A 2
040
25 The percentage of the total cereal production that comes from irrigated agriculture is available for only a few countries. Where it is not available,this percentage is assumed to be equal to the ratio between irrigated and rainfed agriculture.26 Cropping intensity is the ratio between irrigated crop areas (where double or triple cropping areas are counted twice or three times respectively),and the physical areas equipped for irrigation.

54
Pro
gram
me
for
infra
stru
ctur
e D
evel
opm
ent i
n A
frica
(Pid
a)TR
AN
SB
OU
ND
AR
Y W
ATE
R R
ES
OU
RC
ES
OU
TLO
OK
- A
FRIC
A 2
040
Table 10: Irrigation infrastructure gap
������������� �������� ���
���� ������������� ������������� ��������
����� ������� ��������
��������� ���������������������
��� ��������
����������� �� �� ��� ��� ��� �� ���
������������������������������������������������
��� � � ��� ��� �� ���
����������������!������
�"�������������������������������������
��� �� �� ��� ��� ��� � �
27 Business as usual scenario assumes that the irrigated area growth rate of the last 30 years (from 1978 to 2008), would remain constant until2040.28 Accelerated irrigation expansion scenario assumes that the irrigated area growth rate of the last 30 years (from 1978 to 2008) is multiplied by afactor two until 2040.
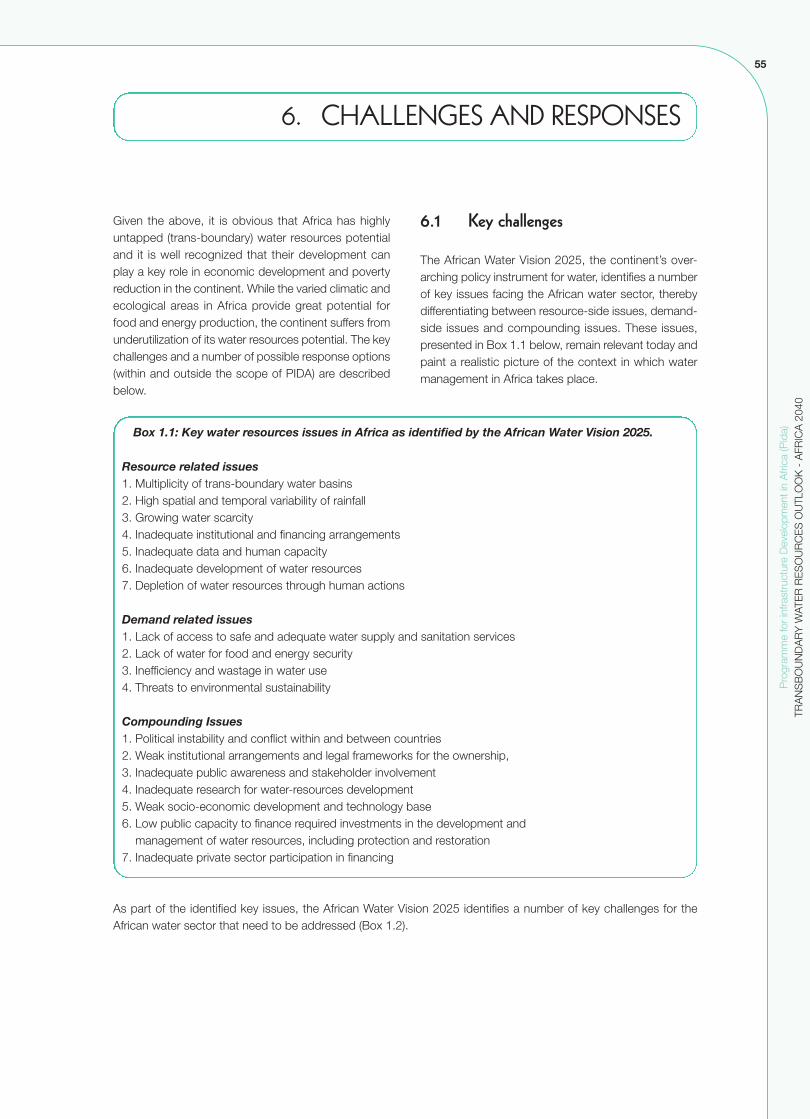
55
Given the above, it is obvious that Africa has highlyuntapped (trans-boundary) water resources potentialand it is well recognized that their development canplay a key role in economic development and povertyreduction in the continent. While the varied climatic andecological areas in Africa provide great potential forfood and energy production, the continent suffers fromunderutilization of its water resources potential. The keychallenges and a number of possible response options(within and outside the scope of PIDA) are describedbelow.
6.1 Key challenges
The African Water Vision 2025, the continent’s over-arching policy instrument for water, identifies a numberof key issues facing the African water sector, therebydifferentiating between resource-side issues, demand-side issues and compounding issues. These issues,presented in Box 1.1 below, remain relevant today andpaint a realistic picture of the context in which watermanagement in Africa takes place.
Pro
gram
me
for
infra
stru
ctur
e D
evel
opm
ent i
n A
frica
(Pid
a)TR
AN
SB
OU
ND
AR
Y W
ATE
R R
ES
OU
RC
ES
OU
TLO
OK
- A
FRIC
A 2
040
CHALLENGES AND RESPONSES6.
Box 1.1: Key water resources issues in Africa as identified by the African Water Vision 2025.
Resource related issues1. Multiplicity of trans-boundary water basins2. High spatial and temporal variability of rainfall3. Growing water scarcity4. Inadequate institutional and financing arrangements5. Inadequate data and human capacity6. Inadequate development of water resources7. Depletion of water resources through human actions
Demand related issues1. Lack of access to safe and adequate water supply and sanitation services2. Lack of water for food and energy security3. Inefficiency and wastage in water use4. Threats to environmental sustainability
Compounding Issues1. Political instability and conflict within and between countries2. Weak institutional arrangements and legal frameworks for the ownership, 3. Inadequate public awareness and stakeholder involvement4. Inadequate research for water-resources development5. Weak socio-economic development and technology base6. Low public capacity to finance required investments in the development and
management of water resources, including protection and restoration7. Inadequate private sector participation in financing
As part of the identified key issues, the African Water Vision 2025 identifies a number of key challenges for theAfrican water sector that need to be addressed (Box 1.2).

56
Pro
gram
me
for
infra
stru
ctur
e D
evel
opm
ent i
n A
frica
(Pid
a)TR
AN
SB
OU
ND
AR
Y W
ATE
R R
ES
OU
RC
ES
OU
TLO
OK
- A
FRIC
A 2
040
As illustrated above, the key issues and challengesfacing the African water sector are manifold. While theyprovide an adequate picture of the overall context inwhich the PIDA operates, not all of them can be directlyaddressed by the programme with its clear focus oninvestments and infrastructure development. In thecontext of PIDA, four main categories of challengeswhich the programme can respond to, directly orindirectly have been identified.
Inadequate amount of available water resourcesin some basins in light of forecast demandChapter 4 of this report has presented the forecastwater demand at the continental and basin levels. Theresults for the latter show clearly that the level ofcommitment in some of the selected PIDA basins isalready high and increasing significantly, leadingeventually to a situation where total demands willoutstrip supply.
Inadequate governance frameworksChapter 3.3 describe the governance frameworks fortrans-boundary water resources in Africa and identifythe weaknesses in current TWRM governanceframeworks. On the one hand, the inadequacies relateto the legal and institutional (less so the policy)architecture for TWRM itself. On the other hand, asignificant shortcoming is the inadequate integrationand coherence of different sector policies (transport,energy, trade) and strategies within an overarchingregional economic strategy.
Inefficient existing infrastructureExisting water infrastructure in Africa is often operatingbelow full capacity and/or with a high degree ofinefficiency. Several hydropower dams on thecontinent, for various reasons, no longer use the fullgeneration capacity once installed. Likewise, manyirrigation schemes use outdated technology with highwater losses.
Inadequate levels of infrastructure developmentAs illustrated in Chapter 3, the current levels of storagecapacity, installed hydropower generation capacity andareas under irrigation in Africa are very low comparedto international standards. Likewise, the growth rate ininfrastructure development, particularly with respect toirrigation, falls significantly short of that experienced inother developing regions, particularly Asia, and isinadequate in light of the forecast future water, food andenergy demands.
6.2 Response options
In order to address these four key challenges, anumber of response options have been identified,categorised into the two broad options of “governanceresponses” and “investment responses”. A tabularoverview of challenges and corresponding responsesis provided below before the response options arediscussed in further detail.
Box 1.2: Key challenges for the African water sector as identified by the African Water Vision 2025.
1. Ensuring that all have sustainable access to safe and adequate water supply andsanitation services to meet basic needs.2. Ensuring that water does not become the limiting factor in food and energysecurity.3. Ensuring that water for sustaining the environment and life-supporting ecosystemsis adequate, both in quantity and quality.4. Reforming water-resources institutions to establish good governance and anenabling environment for sustainable management of national and trans-boundarywater basins and for securing regional cooperation on water-quantity and water quality issues.5. Securing and retaining skilled and motivated water professionals.6. Developing effective systems and capacity for research and development in waterand for the collection, assessment, and dissemination of data and information onwater resources.7. Developing effective and reliable strategies for coping with climate variability andchange, growing water scarcity, and the disappearance of water bodies.8. Reversing the growth of man-made water-quantity and quality problems, such as over-exploitation of renewable and non-renewable water resources, pollution and degradation of watersheds and ecosystems.9. Achieving sustainable financing for investments in water supply, sanitation,irrigation, hydropower and other uses, and for the development, protection andrestoration of national and trans-boundary water resources.10. Mobilizing political will, creating awareness and securing commitment among allwith regard to water issues, including appropriate gender and youth involvement.
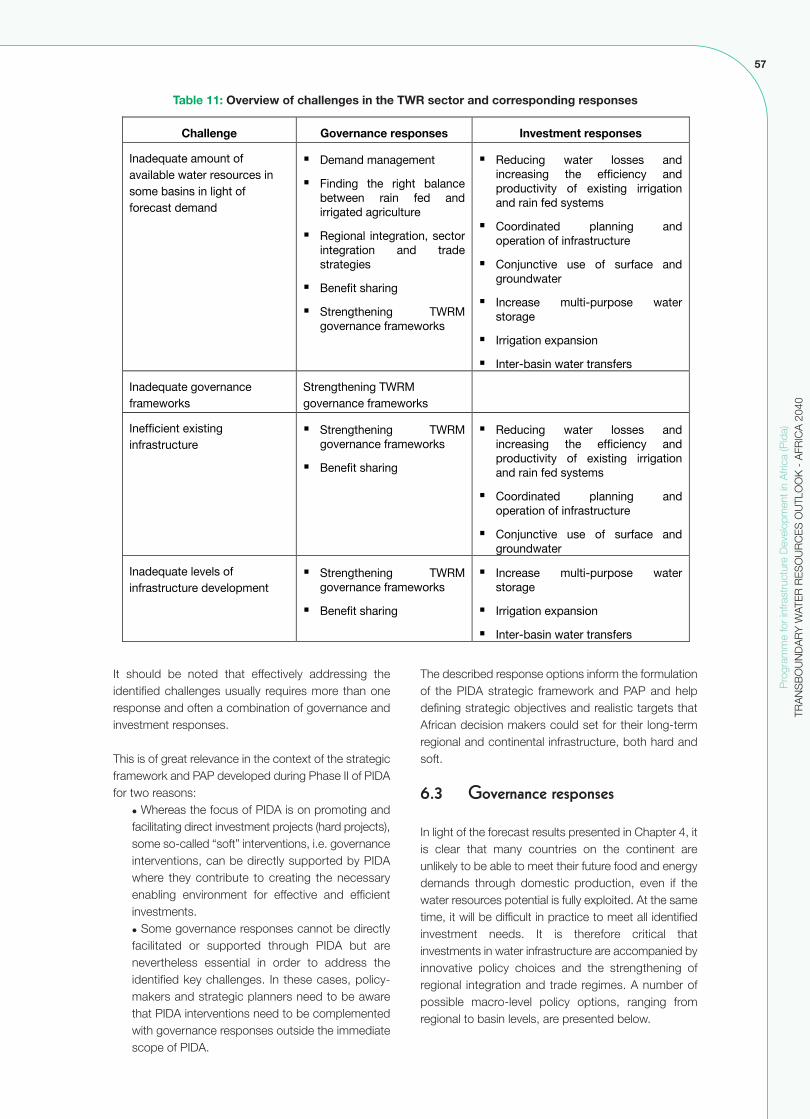
57
It should be noted that effectively addressing theidentified challenges usually requires more than oneresponse and often a combination of governance andinvestment responses.
This is of great relevance in the context of the strategicframework and PAP developed during Phase II of PIDAfor two reasons:
l Whereas the focus of PIDA is on promoting andfacilitating direct investment projects (hard projects),some so-called “soft” interventions, i.e. governanceinterventions, can be directly supported by PIDAwhere they contribute to creating the necessaryenabling environment for effective and efficientinvestments.l Some governance responses cannot be directlyfacilitated or supported through PIDA but arenevertheless essential in order to address theidentified key challenges. In these cases, policy-makers and strategic planners need to be awarethat PIDA interventions need to be complementedwith governance responses outside the immediatescope of PIDA.
The described response options inform the formulationof the PIDA strategic framework and PAP and helpdefining strategic objectives and realistic targets thatAfrican decision makers could set for their long-termregional and continental infrastructure, both hard andsoft.
6.3 Governance responses
In light of the forecast results presented in Chapter 4, itis clear that many countries on the continent areunlikely to be able to meet their future food and energydemands through domestic production, even if thewater resources potential is fully exploited. At the sametime, it will be difficult in practice to meet all identifiedinvestment needs. It is therefore critical thatinvestments in water infrastructure are accompanied byinnovative policy choices and the strengthening ofregional integration and trade regimes. A number ofpossible macro-level policy options, ranging fromregional to basin levels, are presented below.
Pro
gram
me
for
infra
stru
ctur
e D
evel
opm
ent i
n A
frica
(Pid
a)TR
AN
SB
OU
ND
AR
Y W
ATE
R R
ES
OU
RC
ES
OU
TLO
OK
- A
FRIC
A 2
040
Table 11: Overview of challenges in the TWR sector and corresponding responses
���������� ������ ����������� ��������������������
������������������ ������������������������������������������������������
� �������������
� ������� ��� ����� �������������� ���� ��� �����������������������
� �������� ����������������������������� ��� ���������������
� ��������������
� ������������� ������ �������������� �
� �������� ����� ������ ������������� ��� ���������! ���"������� ��! �� �#������ ���������������������!����
� $���������� "������� ����"�����������������������
� $��%����� � ��� �� ������� ��������������
� �������� ����&"��"��� ������������
� �����������#"������
� �����&�������������������
������������ �������������� �
������������������� �������������� �
������������#��������������������
� ������������� ������ �������������� �
� ��������������
� �������� ����� ������ ������������� ��� ���������! ���"������� ��! �� �#������ ���������������������!����
� $���������� "������� ����"�����������������������
� $��%����� � ��� �� ������� ��������������
������������ ��������������������� ���"���
� ������������� ������ �������������� �
� ��������������
� �������� ����&"��"��� ������������
� �����������#"������
� �����&�������������������
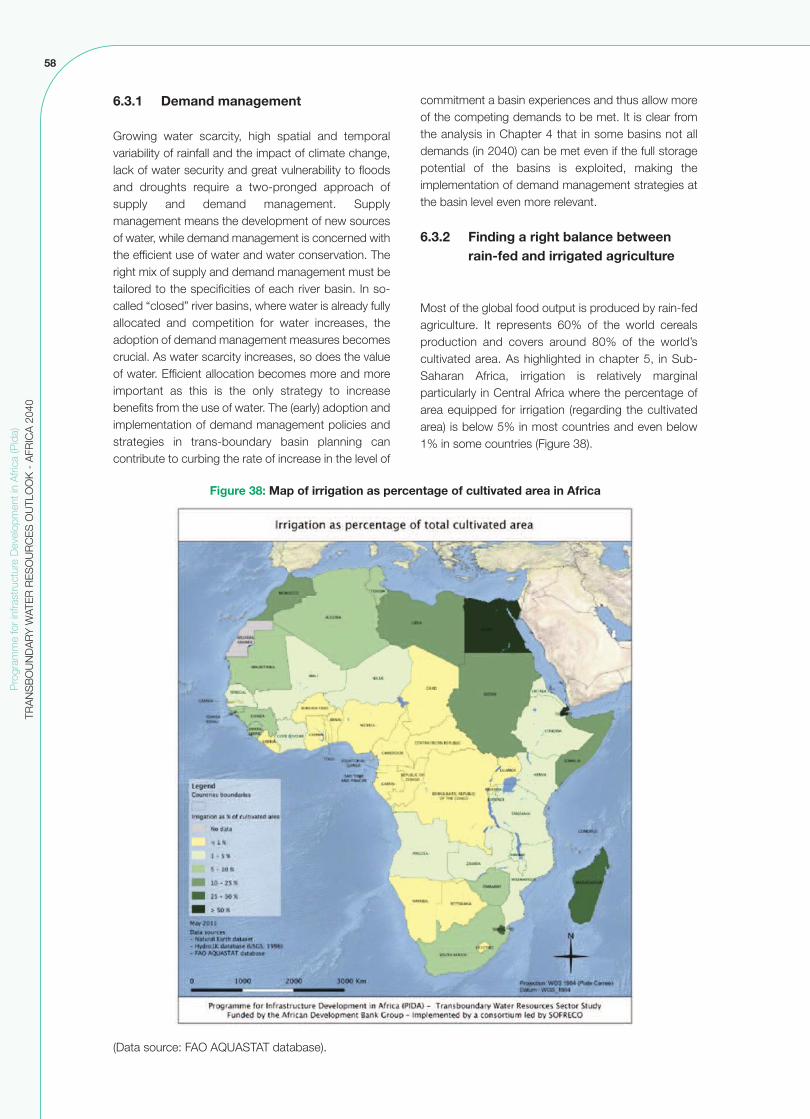
58
Pro
gram
me
for
infra
stru
ctur
e D
evel
opm
ent i
n A
frica
(Pid
a)TR
AN
SB
OU
ND
AR
Y W
ATE
R R
ES
OU
RC
ES
OU
TLO
OK
- A
FRIC
A 2
040
6.3.1 Demand management
Growing water scarcity, high spatial and temporalvariability of rainfall and the impact of climate change,lack of water security and great vulnerability to floodsand droughts require a two-pronged approach ofsupply and demand management. Supplymanagement means the development of new sourcesof water, while demand management is concerned withthe efficient use of water and water conservation. Theright mix of supply and demand management must betailored to the specificities of each river basin. In so-called “closed” river basins, where water is already fullyallocated and competition for water increases, theadoption of demand management measures becomescrucial. As water scarcity increases, so does the valueof water. Efficient allocation becomes more and moreimportant as this is the only strategy to increasebenefits from the use of water. The (early) adoption andimplementation of demand management policies andstrategies in trans-boundary basin planning cancontribute to curbing the rate of increase in the level of
commitment a basin experiences and thus allow moreof the competing demands to be met. It is clear fromthe analysis in Chapter 4 that in some basins not alldemands (in 2040) can be met even if the full storagepotential of the basins is exploited, making theimplementation of demand management strategies atthe basin level even more relevant.
6.3.2 Finding a right balance between rain-fed and irrigated agriculture
Most of the global food output is produced by rain-fedagriculture. It represents 60% of the world cerealsproduction and covers around 80% of the world’scultivated area. As highlighted in chapter 5, in Sub-Saharan Africa, irrigation is relatively marginalparticularly in Central Africa where the percentage ofarea equipped for irrigation (regarding the cultivatedarea) is below 5% in most countries and even below1% in some countries (Figure 38).
Figure 38: Map of irrigation as percentage of cultivated area in Africa
(Data source: FAO AQUASTAT database).

59
Currently, people relying on rain-fed agriculture arehighly vulnerable to short- and medium-term droughtand are therefore not inclined to invest in (costly)agricultural inputs that could significantly increase yields(IWMI, 2007). Important agricultural practices such asimproving the soil moisture conservation could play arole in upgrading rain-fed agriculture that could thenprovide supplemental irrigation. From that perspective,it is clear that investment in rain-fed agriculture cancontribute to poverty alleviation and sustainableenvironmental improvement.
As pointed out by IWMI (2007) in their ComprehensiveAssessment of Water for Agriculture, the agriculturalwater resources management options are manifold andrange from purely rain fed to fully irrigated with manyintermediate options (Figure 39). As one moves frompurely rain fed systems (where green water is the onlysource of water for agriculture) to irrigation, more bluewater (surface and groundwater) is used to increasecrop production. This often provides a goodopportunity for multiple uses such as fisheries andlivestock rearing alongside crop production.
Pro
gram
me
for
infra
stru
ctur
e D
evel
opm
ent i
n A
frica
(Pid
a)TR
AN
SB
OU
ND
AR
Y W
ATE
R R
ES
OU
RC
ES
OU
TLO
OK
- A
FRIC
A 2
040
Figure 39: The spectrum from rain fed to irrigated
(Source: IWMI, 2007)
Achieving food security will require a good balancebetween rain-fed and irrigated agriculture (and in thecase of many countries supplementation through foodimports). Determining an appropriate balance betweenrain-fed and irrigated agriculture depends on thecountry or region specifics as well as many factors suchas the climatic zone, economy, access to technologies,and others. The potential contribution of rain-fedagriculture to future world food production and its rolein achieving food security is still a controversial issueamongst sector professionals. Forecast estimates ofthe role of rain-fed and irrigation vary greatly (IWMI,2007). Moreover, focusing on rain-fed agriculture onlycarries considerable risks (IWMI, 2007) if increase incrop yields and measures for better water managementdo not materialize at the rate it is supposed to occur.However, improving food security cannot be achievedthrough irrigated agriculture alone and investments inimproving crop yields and the efficiency of rain-fedagriculture overall need to be a political priority and
complement any future investments in irrigationexpansion.
At the same time, the climate-proofing of investmentsin both rain-fed and irrigated agriculture needs to beensured. It is now well recognized by the internationalcommunity that climate change will affect temperaturesand precipitation patterns with potentially significantimpacts (at least in some regions) on water availabilityand crop water requirements. According to IPPCexperts, a large part of Sub-Saharan Africa will beadversely impacted. It is therefore important to considerthe possible climate change impacts in futureinfrastructure planning and management of projects.
6.3.3 Regional integration, sector integration and trade strategies
This report has highlighted the uneven distribution of

60
Pro
gram
me
for
infra
stru
ctur
e D
evel
opm
ent i
n A
frica
(Pid
a)TR
AN
SB
OU
ND
AR
Y W
ATE
R R
ES
OU
RC
ES
OU
TLO
OK
- A
FRIC
A 2
040
water resources across the continent and pointed outthe fact that some countries will continue to have to relyon food imports while others have huge potential tobecome food exporters (even when using mostly rainfed agriculture).
In this context, the possibility of so-called “virtual watertrade strategies” should be explored. Virtual waterrefers to the quantity of water used in when a productresults from the process. As the final product (e.g.wheat) does not contain that water anymore it is called“virtual” water. Virtual water trade essentially means thatwater scarce countries can potentially mitigate the localscarcity of water by importing large amounts of virtualwater instead of building new water supplyinfrastructure. In other words, water scarce countriescould for example primarily import grain (which requiressignificant amounts of water during production) for localuse instead of producing it locally. Through the exportof food stuffs on the other hand, water rich countriescould make use of their water abundance by becominglarge-scale exporters of water intensive goods,primarily agricultural goods. For some water-richdeveloping countries, export oriented agriculture couldbe a driver of economic growth and substantiallycontribute to poverty reduction. While such virtual watertrade is de facto already practised by some countries,including African countries, its implementation at theregional level within Africa is only starting to beconsidered. In this context, it is noted that the NileBasin Initiative (NBI) has recently commissioned a studyexploring the possibility of a virtual water trade strategyfor Nile basin States.
Any trade-based solutions, whether virtual water tradeor other strategies, require significant improvements intrade regimes and supporting infrastructure, mainlytransport. The conditions for cross-border trade inAfrica are currently far from optimal. Even if thecountries with high export potential were able toproduce enough food stuffs for export (followinginvestments in rain-fed and irrigated agriculture) inter-regional grain trade would be impeded by thenumerous trade barriers that are still in place. Effectivelyusing the full potential of regional markets in Africacould prove to be a major growth factor if certain tradeimpeding factors were to be removed. Despite theestablishment of Free-Trade Areas (for example thelaunch of a regional trade blocs comprised of themembers of SADC, EAC and COMESA in June 2011),the elimination of tariff and non-tariff barriers has inpractice been neglected. Likewise, for grain trade,which requires large volumes of cereal to be moved,transport costs are an important factor that influencesthe competitiveness of a production region. In order todevelop a competitive agricultural sector, many Africancountries already have to overcome disadvantages
(compared to suppliers from outside the region whichdo not face such constraints), resulting from thedistorted nature of international agricultural trade. Theunderdeveloped transport links on the continent are afurther impediment for the development of acompetitive sector. Consequently, the existing regionalinitiatives to build a functioning and cost-effectiveregional transport network need to be continued andintensified in order to make trade-based solutions aviable policy option for African regions.
Thus, sector integration as promoted by PIDA is animportant step in the right direction and needs to beactively supported by political and policy decision-makers and strategic planners. Whereas theimportance of transport networks has been illustratedabove, the same is true for the link betweeninvestments in water infrastructure and energy. On theone hand, through the generation of hydro-power,water, can be a substantial component of the overallenergy generation capacity. On the other hand,investments in irrigated agriculture are highlydependent on the availability of (cheap) energy. Theavailability of energy (for the pumping of water) isessential for future expansion of irrigation and energycosts are a significant cost factor in irrigated agriculture.While energy costs for irrigation are highly site-specificand a continental forecast of additional energy needsassociated with the described irrigation scenarios is notpossible, it is clear that there is a strong inter-dependence between energy availability and thepossibility of irrigation expansion. It is thus clear thatinvestments in water infrastructure need to be wellintegrated into coordinated, cross-sectoral investmentand infrastructure plans (primarily transport and energy)in order to achieve the desired outcomes.
6.3.4 Benefit sharing
The concept of benefit sharing is increasinglyrecognised as a promising option for improving thebasket of options to address water resources scarcity.Its implementation in practice is gaining momentum.Benefit sharing has been proposed as an alternative tothe volumetric allocation of water, potentially offeringgreater scope for underpinning equitable agreementsbetween riparians (Sadoff & Grey, 200229). In thecontext of trans-boundary watercourses, the conceptcan be defined “as the process where riparianscooperate in optimising and equitably dividing thegoods, products and services connected directly orindirectly to the watercourse, or arising from the use ofits waters” (Phillips & Woodhouse, 201030), thusextending the benefits from the river beyond the river.
The rationale for the benefit sharing approach is that ininternational river basins (and more specifically in basins
29 Sadoff, C.W. and D. Grey (2002) Beyond the river: the benefits of cooperation on international rivers. Water Policy, 4, 389-403.30 Phillips, D.J.H. and Woodhouse, M. (2010) A Guideline on Benefit Sharing in Trans-boundary Watercourses in theSouthern African Development Community (SADC). Gaborone, GIZ.

61
approaching closure), re-allocation of water resource,due to development of the water resources system,can be problematic. Benefit sharing, at least in its mostadvanced form, is based on the concept of sharing thebenefits from the water instead of the physical wateritself through a basin-wide cooperation process (Phillips& Woodhouse, 2010).
Broadly four types of benefits have been identified(Table 12) of which some have already been elaboratedin the preceding sections.
A possible option for benefit sharing that has beenproposed (Phillips, 2010) would for example be wherea downstream riparian would support damconstruction and hydropower development by itsupstream neighbour, but would negotiate seasonal
flows that protect its agricultural sector and tourismrevenues. Hydropower could be traded to thedownstream riparian at favourable terms, reflecting thecooperation between the parties and the fact that thenew dam represents an additional consumptive use ofwater upstream. The downstream riparian couldimprove its agricultural and tourism sectors (in partthrough the energy provided by the dam) and couldtrade staple crops back to the upstream party atfavourable costs. While the development of benefitsharing options for specific basins requires a lot ofdetailed analysis and strategic planning, it is clear thatinnovative concepts such as these need to beincreasingly used and accompany infrastructureinvestments if the above-mentioned challenges are tobe addressed effectively.
Pro
gram
me
for
infra
stru
ctur
e D
evel
opm
ent i
n A
frica
(Pid
a)TR
AN
SB
OU
ND
AR
Y W
ATE
R R
ES
OU
RC
ES
OU
TLO
OK
- A
FRIC
A 2
040Table 12: Benefit types and opportunities (adapted from Sadoff & Grey, 2002)
������������ ��� �������
��������������� � � ������� ���������� ������� ����������������� ���� ���������������� �������������� �������������� �������� ��
��������������� ����� ������� ���������� ���������� ��������� �������������������������� �������� ������ �������������� ���������� ������ ������� ���������� ����
���������� ���������� ������� ���������� ���������� ��������� �������� �������������� ������������������������������ ����������������� ���������������� ��� ������� ����!����� ����
��������������� ������� ������� �� ��� ������������������ ��� ������ � ���� �����
6.3.5 Strengthening TWRM governance
frameworks
In addition to the macro-level policy options presentedin the preceding section, improvements to thegovernance frameworks for TWRM in a narrower sensealso need to be made in order to ensure the optimal,sustainable utilisation of the continent’s water resourcesand the effectiveness and efficiency of waterinfrastructure investments.
The governance analysis conducted during Phase I ofPIDA (see Chapter 3.3-) has highlighted theshortcomings in the current governance frameworks.While the macro-level alignment and integration ofpolicies need to be strengthened (see 6.3.3 above), thewater policy framework (in the narrower sense) on thecontinent is relatively solid and the main shortcomingslie in the legal and institutional architecture.
The overview and analysis presented in the precedingchapters have highlighted the benefits of strongregional frameworks within which trans-boundary water
resources management and development take place.RECs, RBOs (of various types and mandates) as wellas Member States all are important cogs that togethermove the engine of trans-boundary water resourcesmanagement or development. To stay in the picture,the absence or malfunctioning of any of the cogs canbring the engine to a standstill or at least impactnegatively on its performance. That said, where RECsare not (yet) in a position to exercise their role (for oneor more of the reasons cited above), RBOs arenevertheless important platforms for driving trans-boundary water resources management anddevelopment, although the desired regionalcoordination of development efforts across basinboundaries will be more difficult to achieve.
As noted, some of the main governance relatedreasons for slow identification and implementation oftrans-boundary water resources development optionsinclude underdeveloped legal frameworks, inadequateplanning and limited coordination mechanisms.Therefore, the creation of strong planning mechanismsat the REC and RBO levels, supported by relevantimplementation capacity at the national level is

62
Pro
gram
me
for
infra
stru
ctur
e D
evel
opm
ent i
n A
frica
(Pid
a)TR
AN
SB
OU
ND
AR
Y W
ATE
R R
ES
OU
RC
ES
OU
TLO
OK
- A
FRIC
A 2
040
recommended to improve project identification andimplementation. Cooperative approaches at the basinand/or regional levels increase the basket of optionsand thus increase the probability of making the “right”decision that achieves a good balance between theurgent need for social and economic development andsustainable long-term natural resources use. Given that conditions in each basin and region areunique, this report cannot make tailor-maderecommendations for each but the following genericrecommendations are applicable to all regions of thecontinent, but may vary in degree.
l Clearly define the role and mandate of each RECwith respect to trans-boundary water managementand developmentl Strengthen the capacity of RECs to facilitate thedevelopment of regional policy, and legalframeworks with particular emphasis on sectorintegration and coherent cross-sectoral planningl Establish regional legal frameworks for trans-boundary water management l Support the harmonisation of policy andlegislation at the national level with regional policyobjectives and legal frameworksl Over time, facilitate the development of basin-specific agreement in line with the adopted regionallegal frameworksl Support the establishment of RBOs for all majorbasins where they do not yet existl In line with the above, assist countries inidentifying the RBO types best suited for thespecific management and development needs ofthe basinl Strengthen the capacity of RBOs to play aneffective role in coordination with regional actors(REC) and joint planning between Member States
l Assist RECs and RBOs with creating thenecessary planning and management tools toidentify the best development options and makingthe “right” investment choices
6.4 Investment responses
6.4.1 Increasing the efficiency of existing infrastructure
Reducing water losses and increasing theefficiency and productivity of existing irrigationand rain fed systemsIn the future, the nature of the investment at the nationallevel in the irrigation sector will be a key factor in thesustainable development of the international riverbasins. Investments need to be targeted at increasingefficiency and productivity, requiring a combination oftechnical and policy measures. High water savings, substantial increases in irrigatedareas and a high rate of return on investment can onlybe achieved if the irrigation efficiency and the waterproductivity are significantly increased throughambitious capacity building investments that are ableto reach millions of farmers. Therefore, besides theincrease of irrigated areas, the increase of irrigationefficiency (ratio between water consumed by the plantsand water withdrawn from the river or reservoir) as wellas the water productivity (food production per cubicmeter of water) are of utmost importance.
Figure 40 and Table 13 present the estimated current(year 2000) and maximum crop yields in irrigated andrain-fed agricultural systems for Sub-Saharan andNorth Africa (Data source: IWMI, 200731) showingsignificant yield gaps (i.e. the gap between potentialyield and actual yield).
31 Water for Food, Water for Life: A Comprehensive Assessment of Water Management in Agriculture, London: Earthscan & Colombo (Eds.),2007
Table 13: Major actual and potential cereals yields in Africa (Data source: IWMI, 2007).
����������������
� ������������� ��� ����������������� ���
������� ���������� ��������� ���������� ���������
���� !� "#!� $#%� !#&�
'�(�� "#%� "� )#�� &�
���*�� �#%� "#&� "#$� +#+�
�����������������������
� ������������� ��� ����������������� ���
������� ���������� ��������� ���������� ���������
���� !#&� #%� +#%� !#$�
'�(�� &#�� �#�#� ,#,� �#�#�
���*�� +#"� #,� "!#�� &#!�

63
Based on the concept of “more crop per drop”,initiatives such as the FAO’s International ActionProgramme on Water and Sustainable AgriculturalDevelopment place emphasis on increasing water useefficiency through modernization and improvement ofexisting irrigation schemes and rehabilitation ofwaterlogged and salinized irrigated lands. The IPTRIDProgramme (International Programme for Technologyand Research in Irrigation and Drainage), a programmeinitiated by the World Bank and hosted by the FAO, ispromoting capacity building and technology transfer forincreased water productivity in agriculture incooperation with a large network of internationalresearch centres.
IFPRI Study for the World Bank (within the AICDproject) on «Irrigation Investment Needs in Sub-Saharan Africa», estimates that, of the 6 millionhectares presently equipped for irrigation (in SSA),approximately 1 million hectares are in need ofrehabilitation. The percentage share of irrigation-equipped areas in need of rehabilitation variesdramatically across countries (Figure 41) ranging fromalmost zero in South Africa and Madagascar to nearly100 percent in Lesotho. Of the three largest irrigatingcountries on the continent, Sudan has the highestneed, with more than 60 percent of its 1.9 millionhectares of irrigation-equipped land in need ofrehabilitation.
Pro
gram
me
for
infra
stru
ctur
e D
evel
opm
ent i
n A
frica
(Pid
a)TR
AN
SB
OU
ND
AR
Y W
ATE
R R
ES
OU
RC
ES
OU
TLO
OK
- A
FRIC
A 2
040
Figure 40: Gaps between current and maximum potential major cereals crop yields in Sub-Saharanand Northern Africa.

64
Pro
gram
me
for
infra
stru
ctur
e D
evel
opm
ent i
n A
frica
(Pid
a)TR
AN
SB
OU
ND
AR
Y W
ATE
R R
ES
OU
RC
ES
OU
TLO
OK
- A
FRIC
A 2
040
It should be noted that some countries are alreadycharacterized by high agricultural productivity andefficiency, limiting their possibilities for furtherimprovements. As proposed by IWMI (2007), a key firststep towards improved agriculture productivity andefficiency (both rain-fed and irrigated) would be thedevelopment of low-cost technologies that can berapidly implemented and can quickly producesignificant results in countries with low efficiency levels.
Coordinated planning and operation ofinfrastructureDams and reservoirs are central components of largewater resources management systems. They providehydraulic head and storage for hydropower generationbut also serve as seasonal (or over-year) storagecapacity for multiple purposes (irrigation, industrial andmunicipal water uses, and flood control). The numerousobjectives of reservoirs and dams are often conflicting,especially during extreme hydrological conditions. Forexample, if both hydropower generation and irrigatedagriculture are operating objectives, a trade-off mustbe found between storing water during the wet seasonto make it available during the dry season, when thecrop water requirements are the highest and releasingwater for base-load hydro-electricity generation.Likewise, navigation is sensitive to water levels, whichmust be more or less constant throughout the year asbelow and above certain limits the possibility of bargenavigation ceases.
The operating rules of reservoirs have evolved over timewith environmental and ecological concerns becomingincreasingly important. Likewise, reservoirs that wereprimarily designed for a single objective must now beoperated as multipurpose projects in order to serve theneeds of various use sectors (including theenvironment). The optimisation and harmonisation ofoperating rules for coordinated, basin-wideinfrastructure operations in trans-boundary basins
provide huge potential for maximising the efficiency ofexisting infrastructure. The recently completedharmonisation of dam operating rules in the Zambezibasin might provide valuable lessons in this regard.
Conjunctive use of surface and groundwaterThis report has highlighted that the conjunctive use ofsurface and groundwater in Africa is still in its infancy.There is therefore a need for investment in infrastructurethat will utilize and improve groundwater managementand conjunctive use of water resources. In thedevelopment of water resources, priority should begiven to new sources of water where synergies withgroundwater resources are possible. A key advantageof the conjunctive management of surface water andgroundwater is that groundwater can be used tosupplement highly variable surface waters and that thepumping of groundwater helps reduce salinity bylowering the water table. In order to fully exploit thepotential of conjunctive use, a number of technicalaspects need to be further studied before selecting thedifferent options and elaborating a programme ofconjunctive use of surface and groundwater. Amongstothers, it is necessary to assess the groundwaterstorage availability, the production capacity of theaquifer(s) in term of potential discharge, the naturalrecharge, the induced natural recharge, the potentialfor artificial recharge and the comparative economicand environmental benefits derived from the variouspossible options. Given the high potential of conjunctiveuse options, such (soft) studies should be advanced inorder to determine the full basket of options and thishas been taken into consideration for the developmentof the PAP in Phase II of PIDA.
6.4.2 Building of new infrastructure
Increase multipurpose water storageAs highlighted throughout this report, Africa has the
Figure 41: Percentage of irrigated-equipped area requiring rehabilitation (Source: adapted from FAOAquasta database).
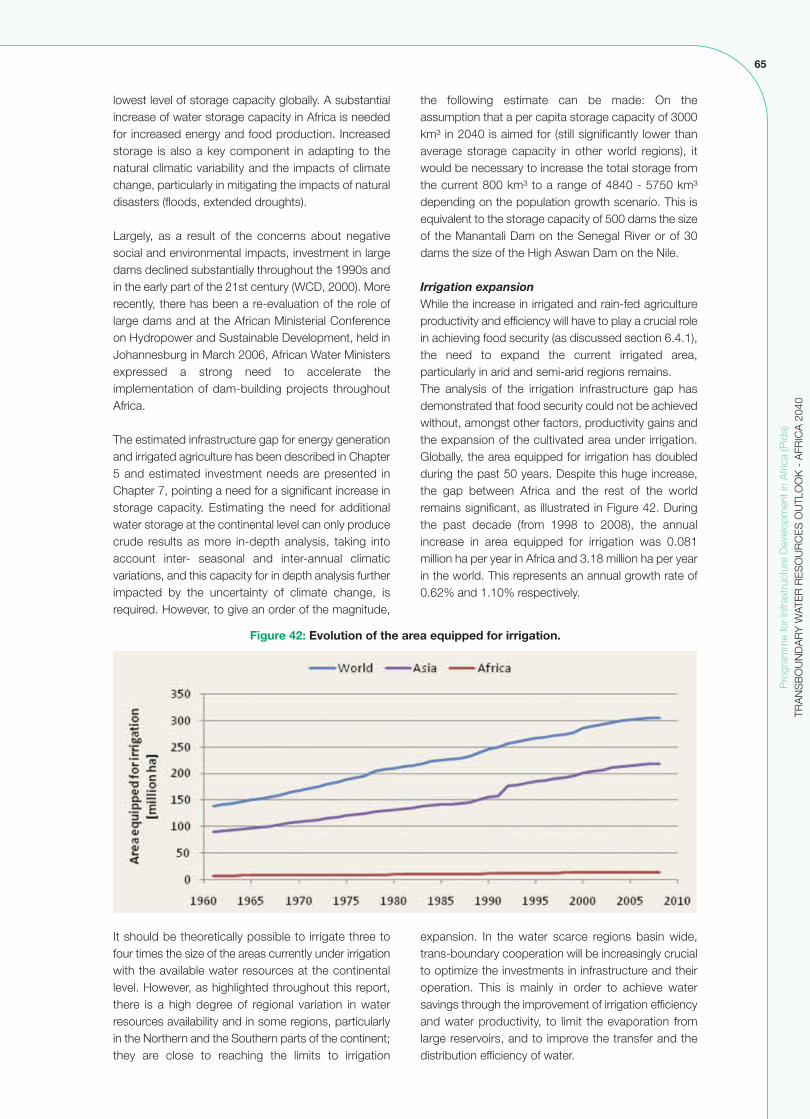
65
lowest level of storage capacity globally. A substantialincrease of water storage capacity in Africa is neededfor increased energy and food production. Increasedstorage is also a key component in adapting to thenatural climatic variability and the impacts of climatechange, particularly in mitigating the impacts of naturaldisasters (floods, extended droughts).
Largely, as a result of the concerns about negativesocial and environmental impacts, investment in largedams declined substantially throughout the 1990s andin the early part of the 21st century (WCD, 2000). Morerecently, there has been a re-evaluation of the role oflarge dams and at the African Ministerial Conferenceon Hydropower and Sustainable Development, held inJohannesburg in March 2006, African Water Ministersexpressed a strong need to accelerate theimplementation of dam-building projects throughoutAfrica.
The estimated infrastructure gap for energy generationand irrigated agriculture has been described in Chapter5 and estimated investment needs are presented inChapter 7, pointing a need for a significant increase instorage capacity. Estimating the need for additionalwater storage at the continental level can only producecrude results as more in-depth analysis, taking intoaccount inter- seasonal and inter-annual climaticvariations, and this capacity for in depth analysis furtherimpacted by the uncertainty of climate change, isrequired. However, to give an order of the magnitude,
the following estimate can be made: On theassumption that a per capita storage capacity of 3000km³ in 2040 is aimed for (still significantly lower thanaverage storage capacity in other world regions), itwould be necessary to increase the total storage fromthe current 800 km³ to a range of 4840 - 5750 km³depending on the population growth scenario. This isequivalent to the storage capacity of 500 dams the sizeof the Manantali Dam on the Senegal River or of 30dams the size of the High Aswan Dam on the Nile.
Irrigation expansion While the increase in irrigated and rain-fed agricultureproductivity and efficiency will have to play a crucial rolein achieving food security (as discussed section 6.4.1),the need to expand the current irrigated area,particularly in arid and semi-arid regions remains.The analysis of the irrigation infrastructure gap hasdemonstrated that food security could not be achievedwithout, amongst other factors, productivity gains andthe expansion of the cultivated area under irrigation.Globally, the area equipped for irrigation has doubledduring the past 50 years. Despite this huge increase,the gap between Africa and the rest of the worldremains significant, as illustrated in Figure 42. Duringthe past decade (from 1998 to 2008), the annualincrease in area equipped for irrigation was 0.081million ha per year in Africa and 3.18 million ha per yearin the world. This represents an annual growth rate of0.62% and 1.10% respectively.
Pro
gram
me
for
infra
stru
ctur
e D
evel
opm
ent i
n A
frica
(Pid
a)TR
AN
SB
OU
ND
AR
Y W
ATE
R R
ES
OU
RC
ES
OU
TLO
OK
- A
FRIC
A 2
040
Figure 42: Evolution of the area equipped for irrigation.
It should be theoretically possible to irrigate three tofour times the size of the areas currently under irrigationwith the available water resources at the continentallevel. However, as highlighted throughout this report,there is a high degree of regional variation in waterresources availability and in some regions, particularlyin the Northern and the Southern parts of the continent;they are close to reaching the limits to irrigation
expansion. In the water scarce regions basin wide,trans-boundary cooperation will be increasingly crucialto optimize the investments in infrastructure and theiroperation. This is mainly in order to achieve watersavings through the improvement of irrigation efficiencyand water productivity, to limit the evaporation fromlarge reservoirs, and to improve the transfer and thedistribution efficiency of water.

66
Pro
gram
me
for
infra
stru
ctur
e D
evel
opm
ent i
n A
frica
(Pid
a)TR
AN
SB
OU
ND
AR
Y W
ATE
R R
ES
OU
RC
ES
OU
TLO
OK
- A
FRIC
A 2
040
Based on the analysis of the irrigation infrastructure gapin the preceding chapter, it is anticipated that anincrease in irrigated area of 12.8 million hectares by2040, compared to 2008, would help to reduce thisgap, bringing the total irrigated area to approximately26.3 million ha. The ratio between irrigated cerealproduction and total cereal production would beapproximately 50 % under this scenario. However, toachieve this, the irrigation expansion rate would have
to be much higher than that experienced in the past 20years.
Table 14 suggests indicative development targets forthe selected basins in the PIDA study. These are broadrough figures and are presented here primarily as astarting point for discussion with the stakeholders.Further detailed analysis for each basin needs to beconducted for these initial estimates to improve.
Table 14: Indicative irrigation development target in the selected basins
������
����������������� �������
�������������� �����������������
������
��������������������������
����������� �� �� ��� �����
������� ��� � ���� ����
�������������������� �� ��� ����
������� �� �� � ��� �����
������ ������ ����� �����
���������� ��� �� �� ����
�������������� ��� ���� ���
��������� �� ����� �����
��� ��� ���� �� ��� �����
!����!��� ���� ����� ������
������ ���� ���� � ����
Inter-basin water transfersInter-basin water transfers (IBT) are transfers of waterfrom basins with a (current) surplus of water to water-scarce basins. Whereas few IBTs exist in other Africanregions, many such schemes have been implementedin Southern Africa, including the Lesotho HighlandsWater Project, the world’s biggest international IBT.Further IBTs in the SADC region are currently beingplanned or are in pending implementation. IBTs are complex technical undertakings that require
in-depth technical and environmental studies prior toimplementation. Likewise, IBTs require a high degree oftechnical coordination and cooperative management.Two or more hydrologically separate basins aretechnically linked through a transfer. Despite thesechallenges, IBTs have proven to be valuable optionswhere they have been implemented and should beconsidered as possible options for other Africanregions.

67
In 2000, the annual investment needs for reaching theAfrican Water Vision goals in the water resources sectorwere estimated at around 20 billion US$ per year. Outof 20 billion US$, 12 billions US$ were devoted to basicneeds (i.e. domestic water supply), sanitation andhygiene. These figures were updated in the AfricaRegional Paper for the 5th World Water Forum (2009),which estimated annual investment needs of 50 billionUS$ in the water sector.
7.1 Drinking water, sanitation and hygiene
The infrastructure gap for (domestic) water andsanitation supply has not been analyzed in this studyas this is essentially a national issue with relativelylimited trans-boundary impacts. Nonetheless, asnapshot of the estimated investment needs in thisarea is presented here in order to provide a morecomprehensive picture of total investment needs in thewater sector. The cost of domestic water supply hasincreased rapidly over the past decades. According toSeckler (1993), the per capita investment required toprovide water and sanitation services in urban areas isaround 500 US$/cap. The Africa Regional Paper forthe 5th World Water Forum (2009) refers to an annualinvestment requirement of $US 12 billion to meet thebasic water supply and sanitation services in Africaoverall. In addition, it is estimated that additional $US5 billion will be necessary to upgrade wastewaterinfrastructure to ensure adequate water qualitystandards.
As mentioned in Chapter 4, North Africa is alreadyusing non-conventional sources of water such asdesalination. Given the growing water scarcity, it canbe expected that the desalination needs will increase.The Africa Regional Paper for the 5th World WaterForum (2009) refers to an annual investment need of$US 1 billion to support desalination in North Africa.
7.2 Water storage for multiple uses
A substantial increase of water storage capacity isneeded for increased water security, for reducing theimpacts of climate variability and for preventingdisasters exacerbated by climate change. Thus, it islikely that investment in large dams in Africa willincrease in the near future. While multi-purpose damsare increasingly being conceptualized, planned and
built, hydropower generation is generally the maindriver for the construction of large dams. Theinvestment requirements for multi-purpose projects willthus largely depend on the forecast energy demandsand the availability and cost of the various types ofenergy sources. The currently installed hydropowergeneration capacity in the 10 selected basins is around15.5 TW while the hydropower potential is around 200TW. In Chapter 5, the hydropower infrastructure gaphas been estimated at around 72 563 MW (with anupper bound of 179 744 MW). The Africa RegionalPaper for the 5th World Water Forum (2009) refers toan annual investment need of $US 20 billion forhydropower-driven infrastructure. In addition it refers toan annual investment need of $US 5 billion for storageprojects where hydropower generation is not a feasibleoption within multipurpose planning.
7.3 Irrigation rehabilitation
According to the AICD, 1 million ha of land currentlyunder irrigation in Sub-Saharan Africa needrehabilitation, at a cost of US$1900 per hectare,excluding storage costs. On this basis, the investmentneeds for rehabilitation of existing schemes in SSAwould be $US 1.9 billion. This would include investmentin applied research and ambitious agricultural extensionprogrammes aiming at more efficient on-farm irrigationtechnologies and irrigation management approaches(demand management). While rehabilitation andmodernization are also needed in the Northern part ofAfrica, reliable data has not been found to assess theinvestment requirement in this region.
7.4 Irrigation expansion
The development of new sources of water will becomemore costly as the best and cheapest options arealready used. In a recent study on the costs andperformances of irrigation projects, the InternationalWater Management Institute (IWMI) found that thecapital investment costs of irrigated area expansion inSub-Saharan Africa and North Africa were 5 600US$/ha and 6000 US$/ha respectively. These valuesare far more expensive than in Asia or South-Americadue partly to high transaction costs and the high failurerate of irrigation projects (IWMI, 2007). It is worthmentioning that the poor supporting infrastructureaddressed by the other PIDA sectoral studies (i.e.transport, energy) are partly responsible for the high
Pro
gram
me
for
infra
stru
ctur
e D
evel
opm
ent i
n A
frica
(Pid
a)TR
AN
SB
OU
ND
AR
Y W
ATE
R R
ES
OU
RC
ES
OU
TLO
OK
- A
FRIC
A 2
040
INVESTMENT NEEDS AND FINANCINGOUTLOOK
7.

68
Pro
gram
me
for
infra
stru
ctur
e D
evel
opm
ent i
n A
frica
(Pid
a)TR
AN
SB
OU
ND
AR
Y W
ATE
R R
ES
OU
RC
ES
OU
TLO
OK
- A
FRIC
A 2
040
failure rate. However, both the cost and performanceof irrigation projects have improved over time,especially in Sub-Saharan Africa. One of the interestingfindings of the AICD (2008) study on irrigationinvestment needs in SSA is that only lower-costtechnologies and approaches are viable on anysignificant scale in Sub-Saharan Africa (AICD, 2008).Finally, the report also stresses the positive impact onthe unit cost when the project is implemented within abigger multipurpose project.
Based on the forecast results presented in Chapter 4,the irrigation infrastructure gap has been estimated insection 5.2 to be around 12.85 million hectares forAfrica overall. Assuming a cost32 of $US 5 800 per ha,the investment need for irrigation expansion at thecontinental level would be in the range of $US 74.53billion, over the next 30 years or approximately $US 2.5billion per year.
It is important to note that this amount does not includeoperation and maintenance (O&M) costs that increaseas the irrigated area expands. The Africa RegionalPaper for the 5th World Water Forum (2009) refers toan annual investment need of $US 5 billion forcombined irrigation development and O&M costs.
Most of this investment would have to be made at thenational level. However, it is worth noting that the gapin the irrigation infrastructure has been estimatedassuming that rain-fed agriculture will be able toproduce 50% more than today by improving its
productivity and expanding its area under cultivation.Also, an improvement of irrigated agricultureproductivity has been assumed (in terms of crop yield).Consequently, investment needs for the extension ofirrigated agriculture would be significantly higher ifspecific investments for improving efficiency andproductivity of both rain-fed and irrigated agriculture arenot made.
7.5 Investment in response to climate change
The water sector will require substantial investments inorder to respond to climate change. As predictions byglobal climate models are converging, it appearsincreasingly likely that weather patterns will becomemore variable and will include more extreme events.Rainfall distribution and volumes will change, andinvestment in increased groundwater and surfacestorage capacity will be required in order to providesufficient supply for extended drought periods on theone hand, and flood control on the other hand.
7.6 Summary of investment needsBy combining the estimate in the Africa Regional Paperfor the 5th World Water Forum (2009) and cross-referencing them with a range of sources, Table 15gives an indicative summary overview of investmentneeds while the distribution across interventioncategories is illustrated in Figure 43.
32 The capital costs of irrigation are defined to include all expenses incurred in developing and establishing irrigation schemes beginning withdesign and planning up to implementation and completion of the project just before the start of regular operation.
Table 15: Indicative Investment Requirements in the Water Sector
��������������� �� �������������� �
��������������� ������� �����
����������������������������� �
������������������������� ��
��� ������� �
������������� �
� ��� �������������� �
!"�������#���$���%����� �� � ��
������ ���

69
The order of the magnitude of the total investmentneeds in the water sector in Africa would thus be in therange of $US 48.9 billion per year. Of these categories,desalination is the only factor without relevance in termsof TWRM. Drinking water supply and urban wastewater have limited relevance for TWRM in general(because, although investment needs are high, theoverall amount of water required is relatively small) butmay be of significance in specific basins with a highconcentration of urban areas. That said, even wherethe water use in question is of relevance for the trans-boundary management of the resource, the
infrastructure investment itself could still be national(e.g. for a national irrigation scheme in a trans-boundarybasin). The portion which would be considered as aregional investment need in the scope of the PIDAprogramme will therefore be estimated in the secondphase of the PIDA Study, after a realistic investmentprogramme has been identified in cooperation with thekey stakeholders. Likewise, the proposed financingmechanism will be tailored to the specific programmeonce the investment needs for PIDA type projects havebeen determined in more detail in Phase II.
Pro
gram
me
for
infra
stru
ctur
e D
evel
opm
ent i
n A
frica
(Pid
a)TR
AN
SB
OU
ND
AR
Y W
ATE
R R
ES
OU
RC
ES
OU
TLO
OK
- A
FRIC
A 2
040
Figure 43: Relative distribution amongst activities of the annual investment needs in the TWR sector.Figures are in billion US$ per year.

70
Pro
gram
me
for
infra
stru
ctur
e D
evel
opm
ent i
n A
frica
(Pid
a)TR
AN
SB
OU
ND
AR
Y W
ATE
R R
ES
OU
RC
ES
OU
TLO
OK
- A
FRIC
A 2
040
With African population expected to double by 2040,water demand for food and energy production,industrial growth and domestic water supply will growsignificantly. While on a continental average Africaseems to have sufficient water resources, the highlyuneven distribution of water resources across thecontinent means that many countries and trans-boundary lake or river basins will face increasing levelsof water scarcity or water stress. This is exacerbatedby the high degree of natural climatic variability andexpected impacts of climate change.
The results of the water demand forecast presented inthis report highlight the expected trends in waterdemand and provide an illustrative picture of the scaleof the challenge. At the same time, the report highlightsthat Africa has significant water resources potential thatis currently unused. At present, the African continenton average has the lowest level of water infrastructuredevelopment globally with respect to both storagecapacity and irrigation development.
With water being of strategic importance for socio-economic development, it is clear that more strategicwater infrastructure needs to be built in Africa in orderto better harness the continent’s water resourcespotential. At the same time, the report highlights theimportance of refurbishing already existinginfrastructure, which is often no longer working at fullcapacity. In this context it is noted that most of theexisting large-scale water infrastructure on thecontinent has been built several decades ago and very
few water infrastructure projects have beenimplemented in the past two decades. PIDA providesan estimate of the existing infrastructure gap andrequired investment needs for the period until 2040. The findings of the Outlook 2040 form the basis for thedevelopment of the strategic framework and PriorityAction Plan for infrastructure development in Africaduring Phase II of PIDA. In this context, the report haspresented the key challenges that PIDA can meet. Itfurther presents a number of response options that canbe addressed either directly through PIDA, or throughother PIDA interventions.
A key message emerging from the study in that contextis that water infrastructure investments will only beeffective in addressing the challenges outlined ifaccompanied by the strengthening of managementframeworks for trans-boundary water managementand increased regional and basin-wide cooperation.The report further highlights that investments ininfrastructure alone will not be sufficient to meet thechallenges but these have to be accompanied byinnovative policies and strategies, such as increasingthe efficiency of rain-fed agriculture, improved regionaltrade environments or the development of benefitsharing arrangements. Likewise, the report emphasisesthat investments in water infrastructure are highlydependent on adequate energy and transportinfrastructure and therefore need to be well integratedinto coordinated, cross-sectoral investment andinfrastructure plans in order to achieve the desiredoutcomes.
8. CONCLUSIONS