Embed Size (px)
Citation preview
The Production Possibilities Curve
The Production Possibilities Curve
(PPC)Using Economic Models…
Step 1: Explain concept in wordsStep 2: Use numbers as examplesStep 3: Generate graphs from numbersStep 4: Make generalizations using graph
2
What is the Production Possibilities Curve?• A production possibilities curve (PPC) is a model
that shows alternative ways that an economy can use its scarce resources
• This model graphically demonstrates scarcity, trade-offs, opportunity costs, and efficiency.
4 Key Assumptions• Only two goods can be produced • Full employment of resources• Fixed Resources (Ceteris Paribus)• Fixed Technology
3
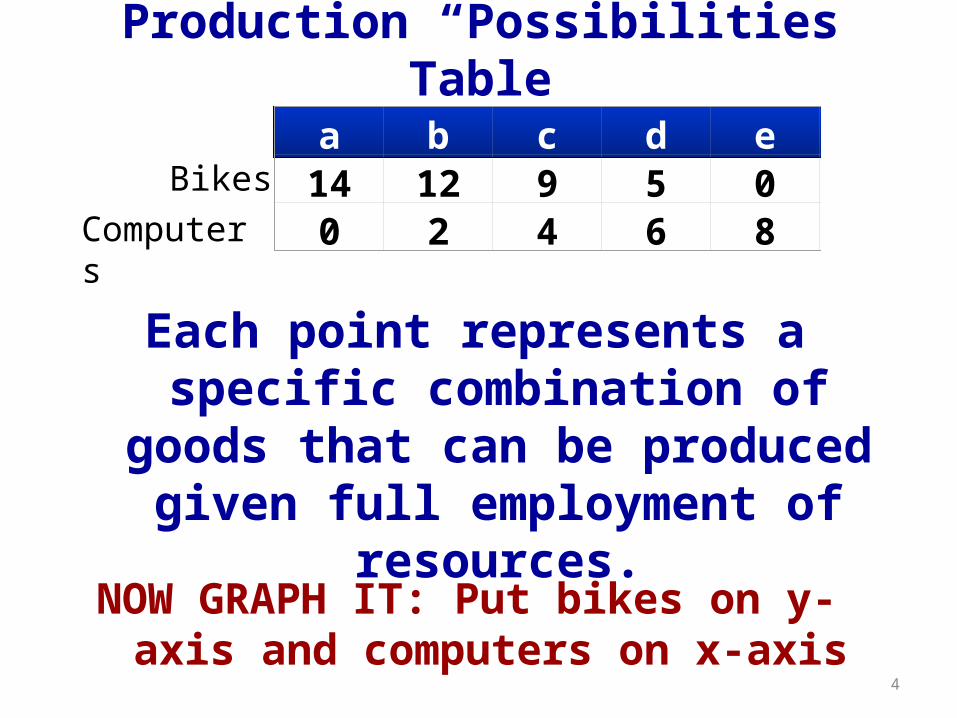
a b c d e f14 12 9 5 0 00 2 4 6 8 10
Bikes
Computers
NOW GRAPH IT: Put bikes on y-axis and computers on x-axis
Production “Possibilities” Table
Each point represents a specific combination of goods that can be
produced given full employment of resources.
4
Bik
es
Computers
14
12
10
8
6
4
2
0
0 2 4 6 8 10
A
B
C
D
E
G
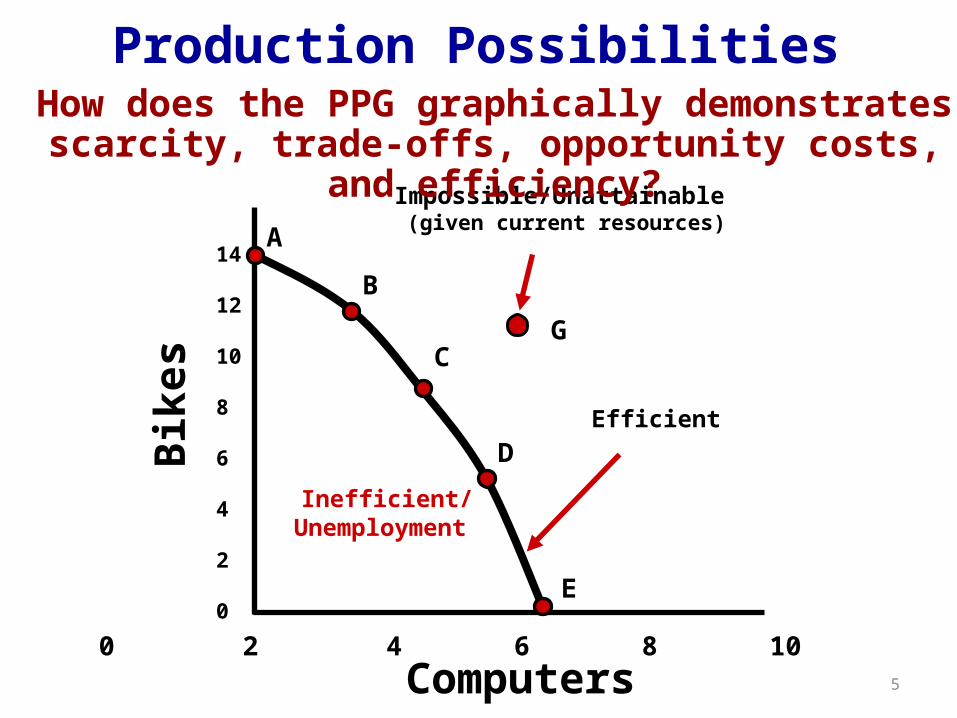
Inefficient/ Unemployment
Impossible/Unattainable (given current resources)
Efficient
Production PossibilitiesHow does the PPG graphically demonstrates scarcity, trade-
offs, opportunity costs, and efficiency?
5
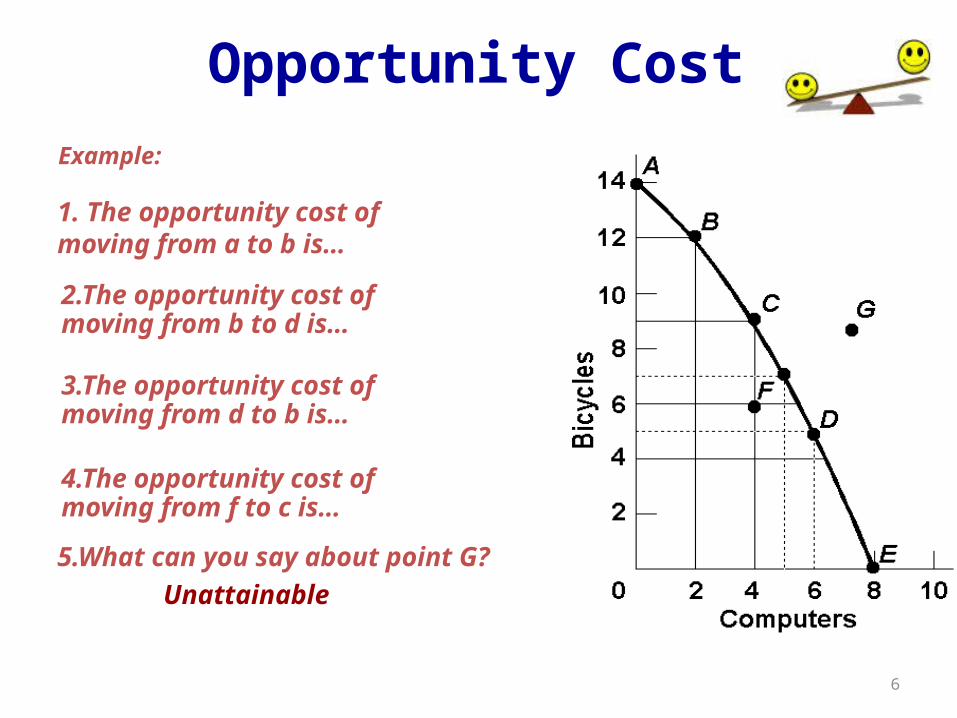
2.The opportunity cost of moving from b to d is…
4.The opportunity cost of moving from f to c is…
3.The opportunity cost of moving from d to b is…
5.What can you say about point G?
Unattainable
1. The opportunity cost of moving from a to b is…
Example:
Opportunity Cost
6
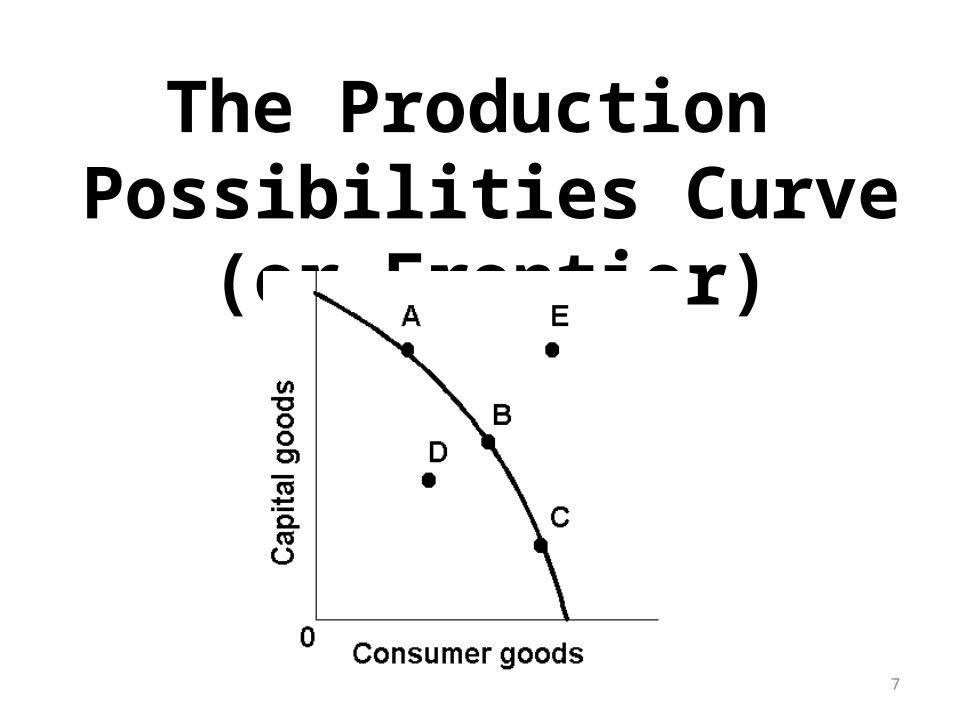
The Production Possibilities Curve (or Frontier)
7
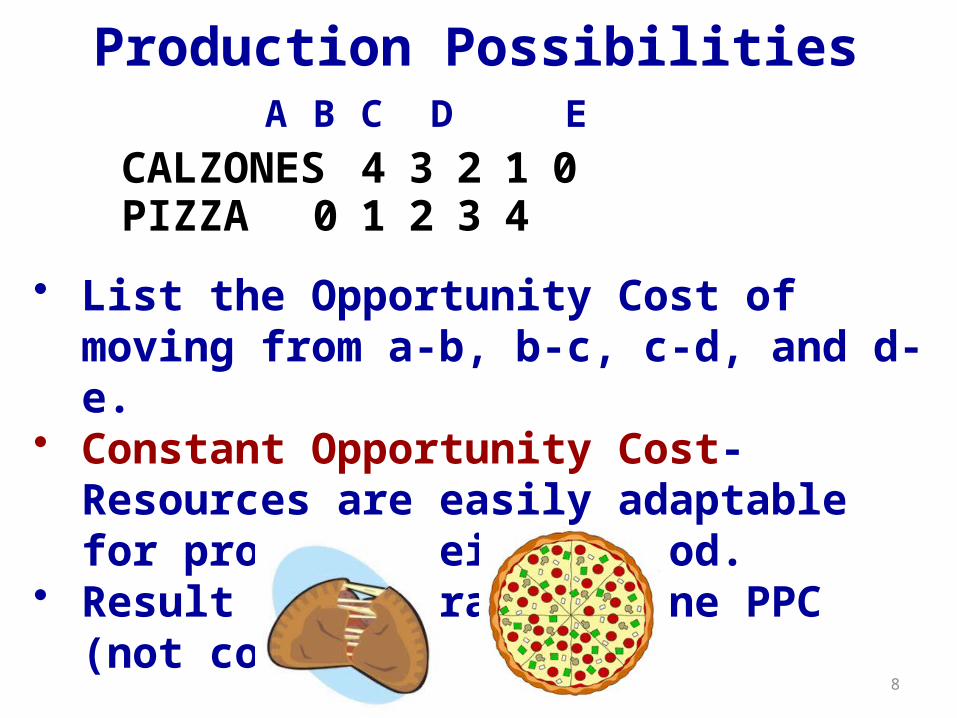
PIZZA 0 1 2 3 4CALZONES 4 3 2 1 0
• List the Opportunity Cost of moving from a-b, b-c, c-d, and d-e.
• Constant Opportunity Cost- Resources are easily adaptable for producing either good.
• Result is a straight line PPC (not common)
Production PossibilitiesA B C D E
8
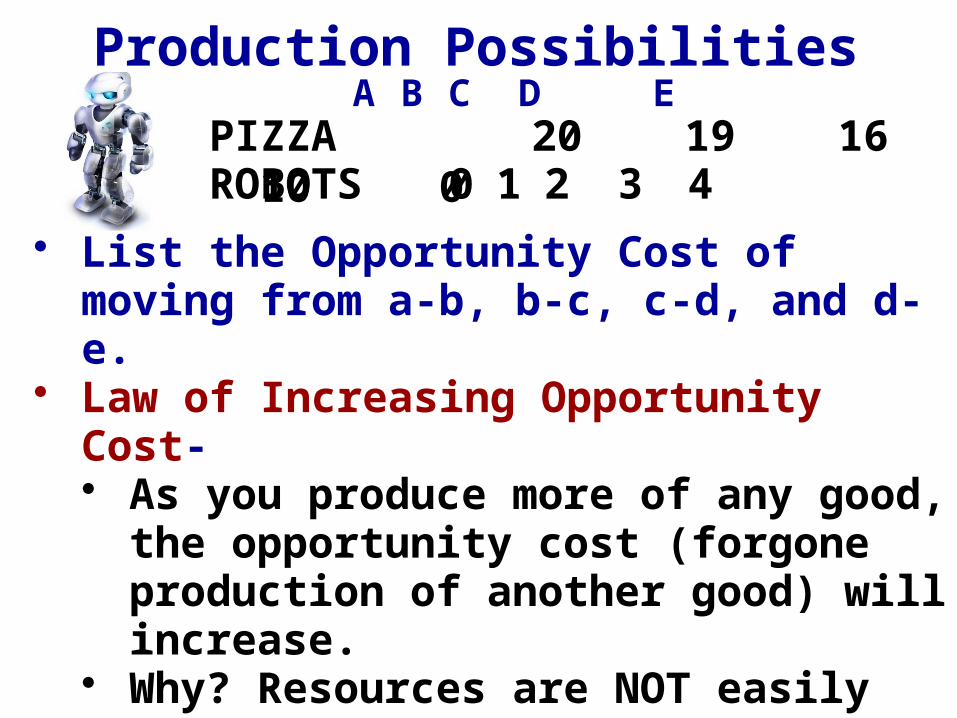
PIZZA 20 19 16 10 0ROBOTS 0 1 2 3 4
• List the Opportunity Cost of moving from a-b, b-c, c-d, and d-e.
• Law of Increasing Opportunity Cost-• As you produce more of any good, the
opportunity cost (forgone production of another good) will increase.
• Why? Resources are NOT easily adaptable to producing both goods.
• Result is a bowed out (Concave) PPC
A B C D EProduction Possibilities
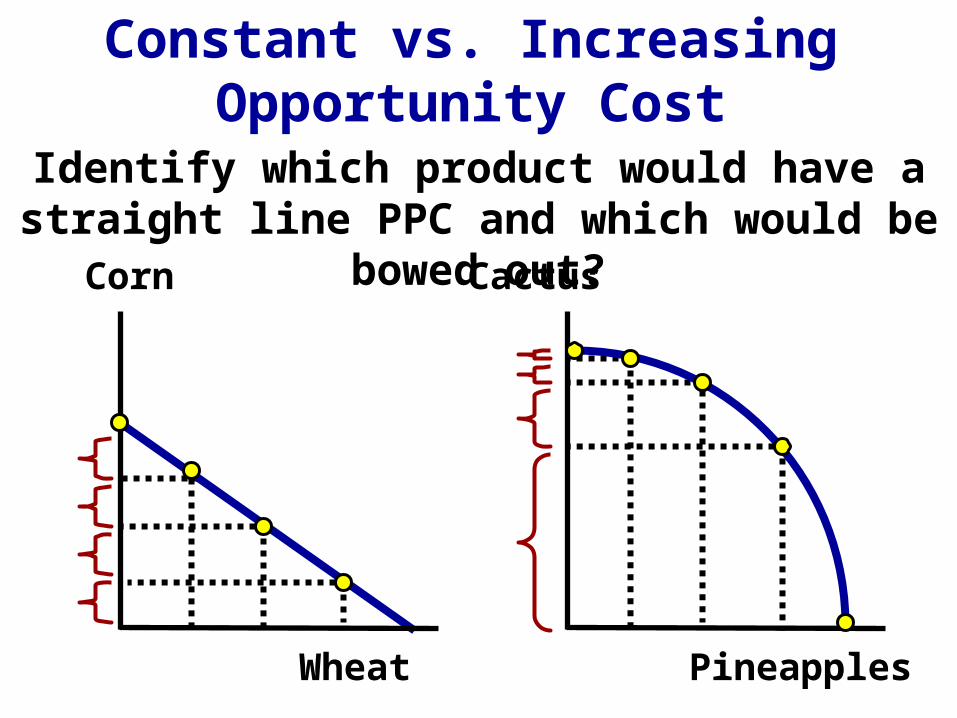
Constant vs. Increasing Opportunity Cost
Corn
Wheat
Cactus
Pineapples
Identify which product would have a straight line PPC and which would be bowed out?
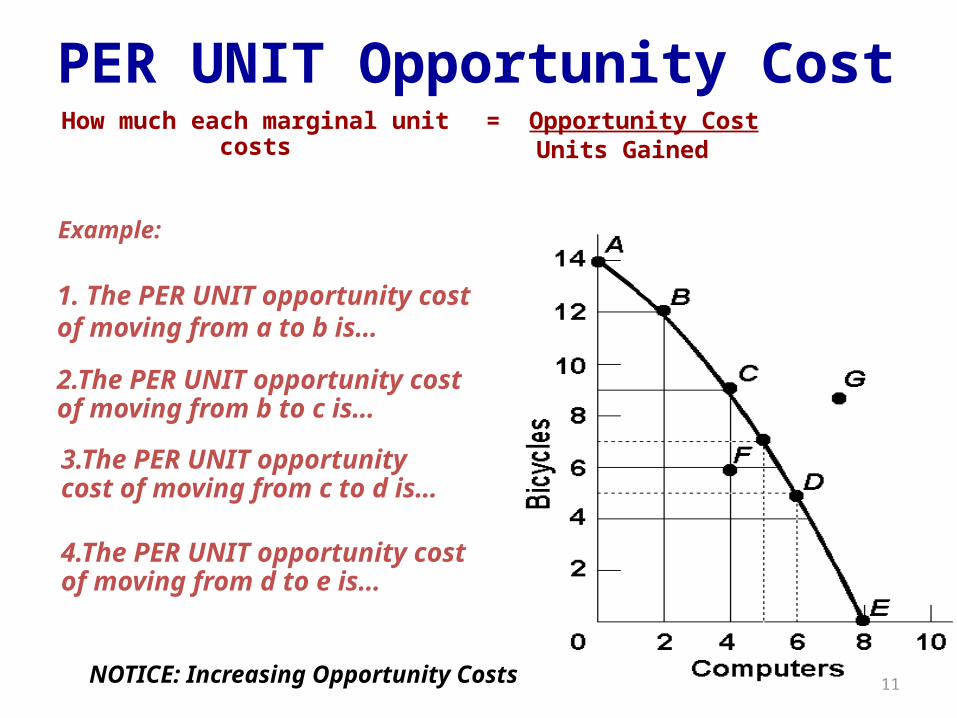
2.The PER UNIT opportunity cost of moving from b to c is…
4.The PER UNIT opportunity cost of moving from d to e is…
3.The PER UNIT opportunity cost of moving from c to d is…
= Opportunity CostUnits Gained
1. The PER UNIT opportunity cost of moving from a to b is…
Example:
PER UNIT Opportunity CostHow much each marginal unit costs
NOTICE: Increasing Opportunity Costs 11
The Production Possibilities Curve and Efficiency
12
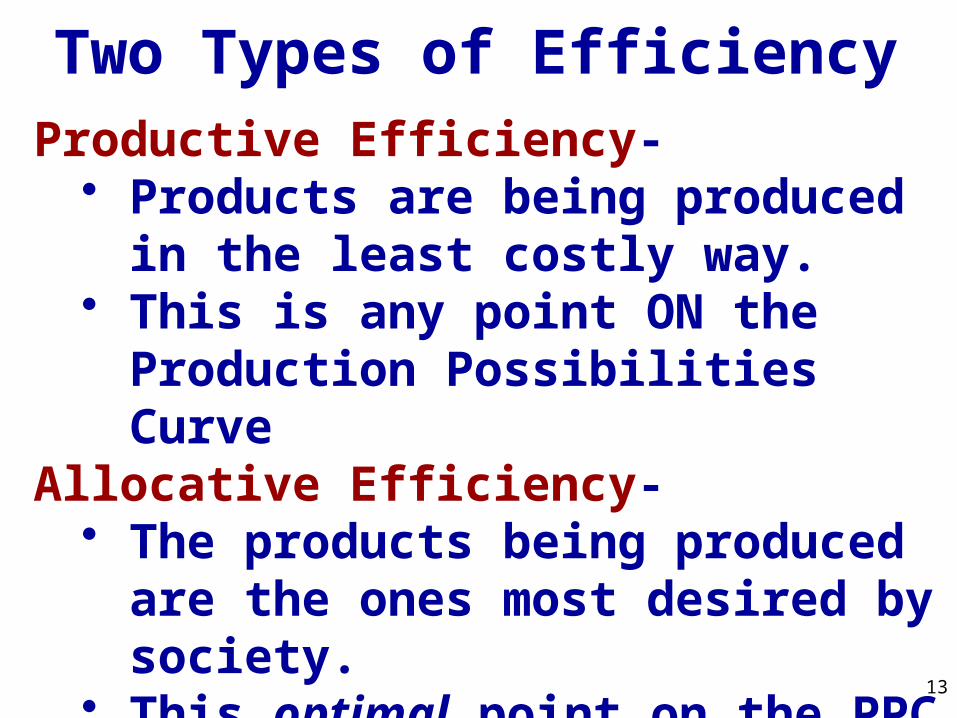
Productive Efficiency- • Products are being produced in the least
costly way. • This is any point ON the Production
Possibilities CurveAllocative Efficiency-
• The products being produced are the ones most desired by society.
• This optimal point on the PPC depends on the desires of society.
Two Types of Efficiency
13
Productive and Allocative EfficiencyB
ikes
Computers
14
12
10
8
6
4
2
0
0 2 4 6 8 10
A
B
C
D
F
E
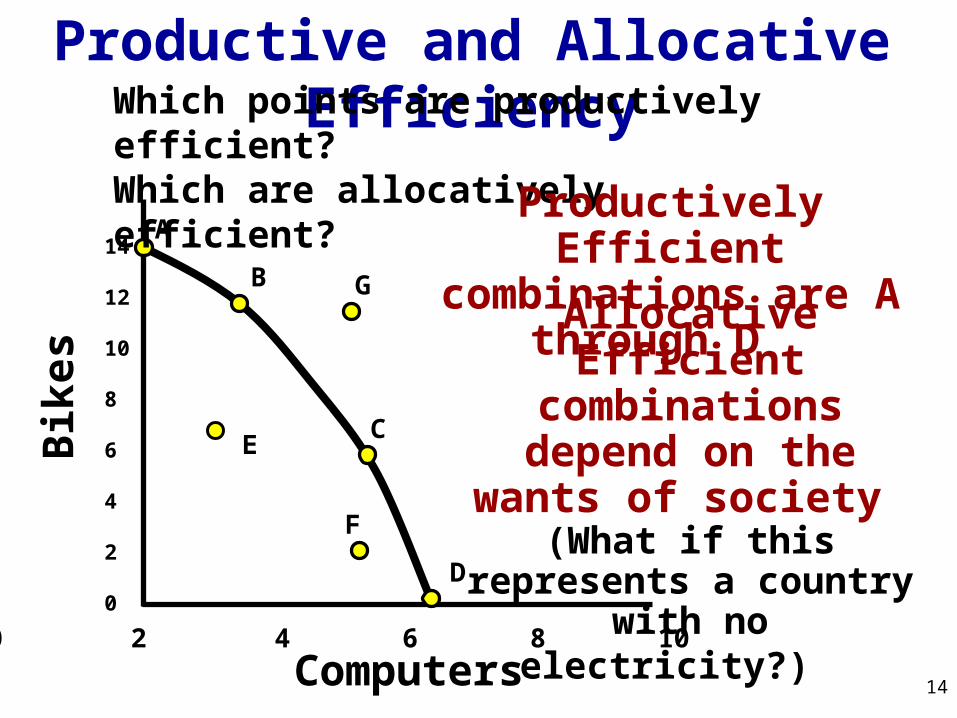
Which points are productively efficient?Which are allocatively efficient?
G
14
Productively Efficient combinations are A through D
Allocative Efficient combinations depend on
the wants of society (What if this represents a
country with no electricity?)
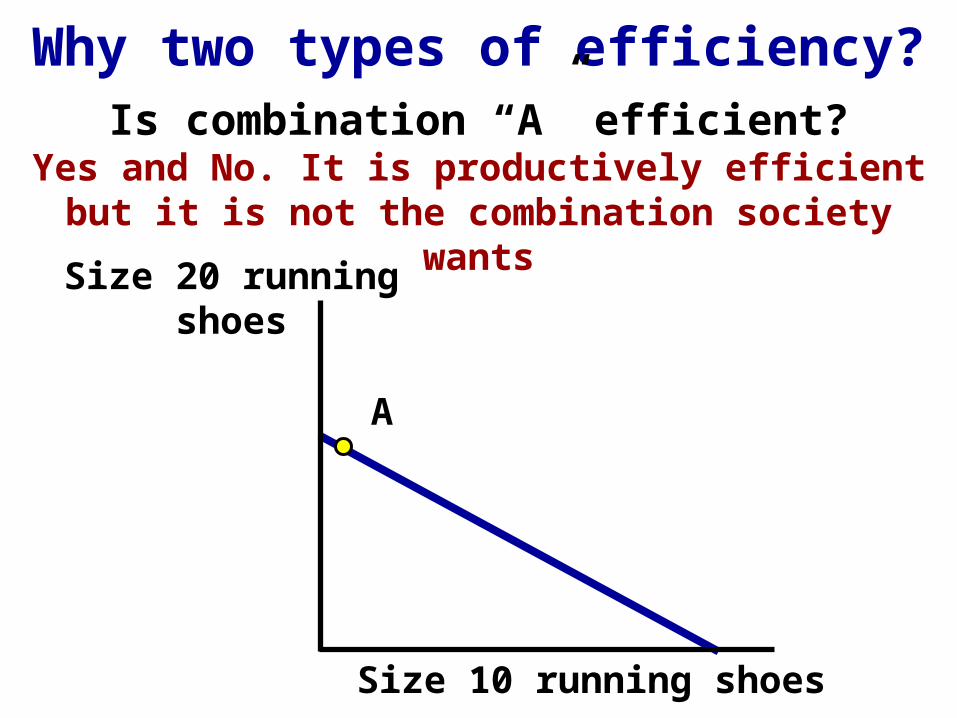
Why two types of efficiency?
Size 20 running shoes
Size 10 running shoes
A
Is combination “A” efficient?Yes and No. It is productively efficient but it is not the
combination society wants
Shifting the Production Possibilities Curve
16
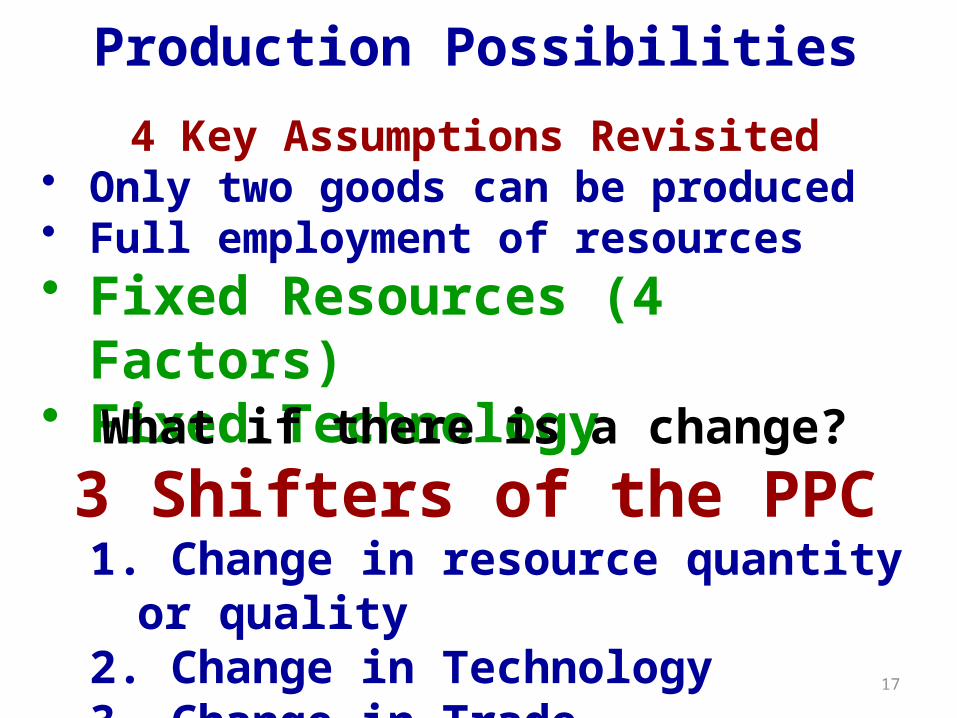
4 Key Assumptions Revisited• Only two goods can be produced • Full employment of resources• Fixed Resources (4 Factors)• Fixed Technology
What if there is a change?
3 Shifters of the PPC1. Change in resource quantity or quality
2. Change in Technology3. Change in Trade 17
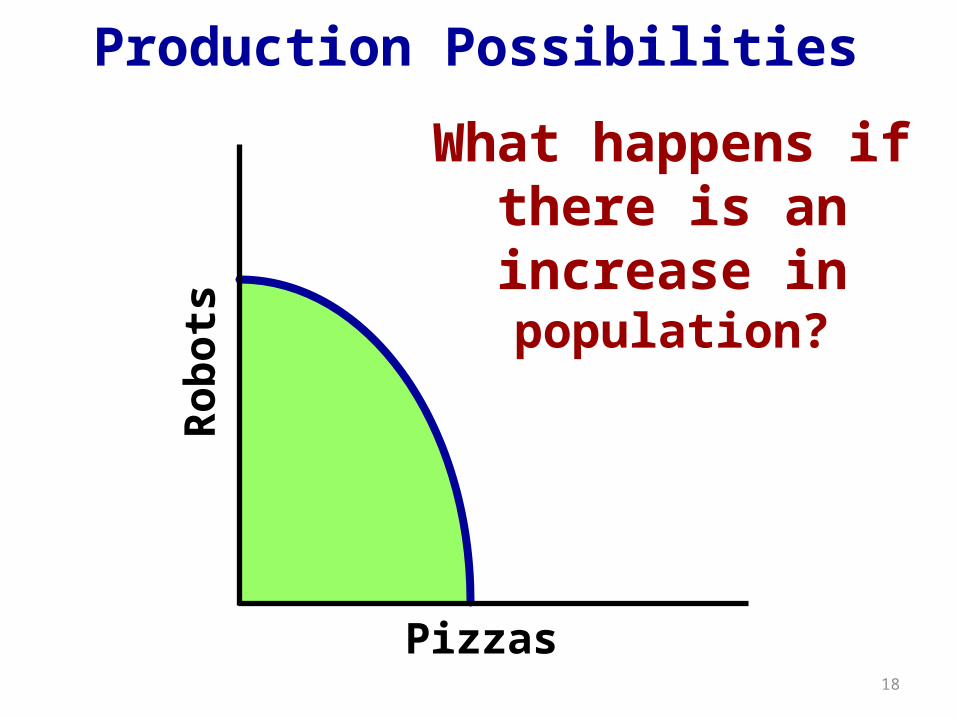
Production Possibilities
Ro
bo
ts
Pizzas
What happens if there is an increase
in population?
18
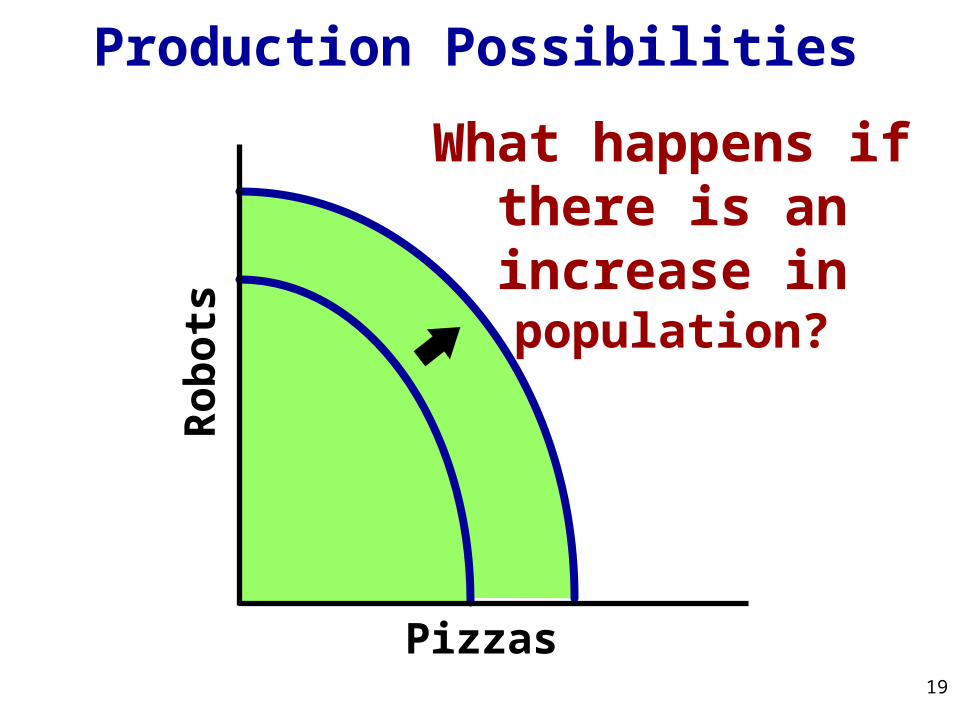
Production Possibilities
Ro
bo
ts
Pizzas
What happens if there is an increase
in population?
19
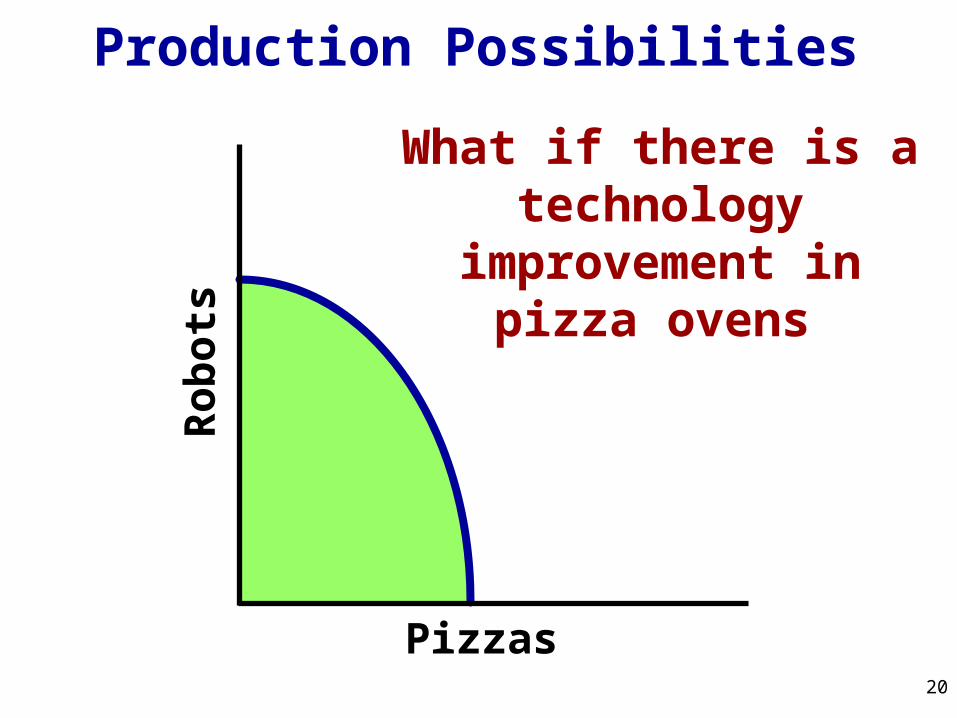
Production Possibilities
Ro
bo
ts
Pizzas
What if there is a technology improvement
in pizza ovens
20
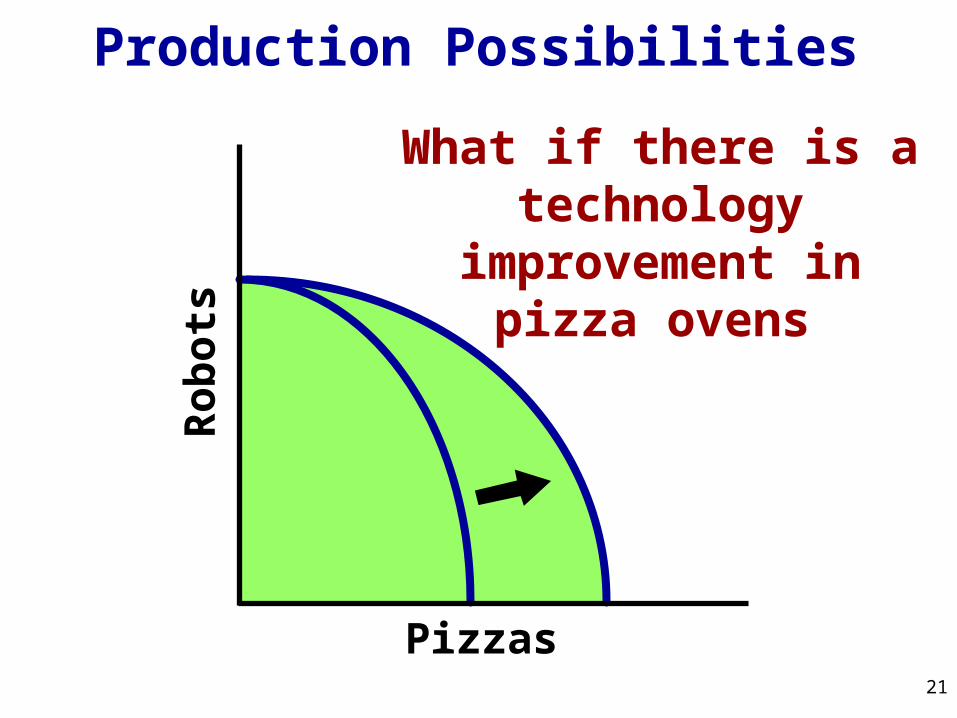
Production Possibilities
Ro
bo
ts
Pizzas
What if there is a technology improvement
in pizza ovens
21
Production Possibilities
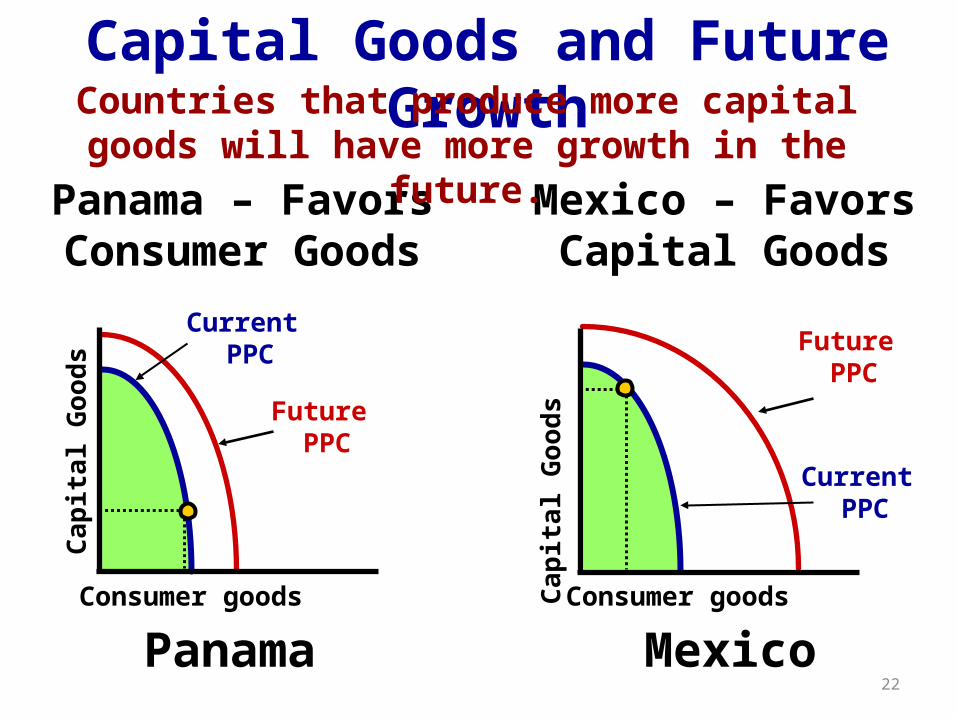
Panama – Favors Consumer Goods
Mexico – Favors Capital Goods
Consumer goods
Capi
tal G
oods
Current PPC
Future PPC
Consumer goods
Capi
tal G
oods
Future PPC
Current PPC
Capital Goods and Future Growth
MexicoPanama22
Countries that produce more capital goods will have more growth in the future.
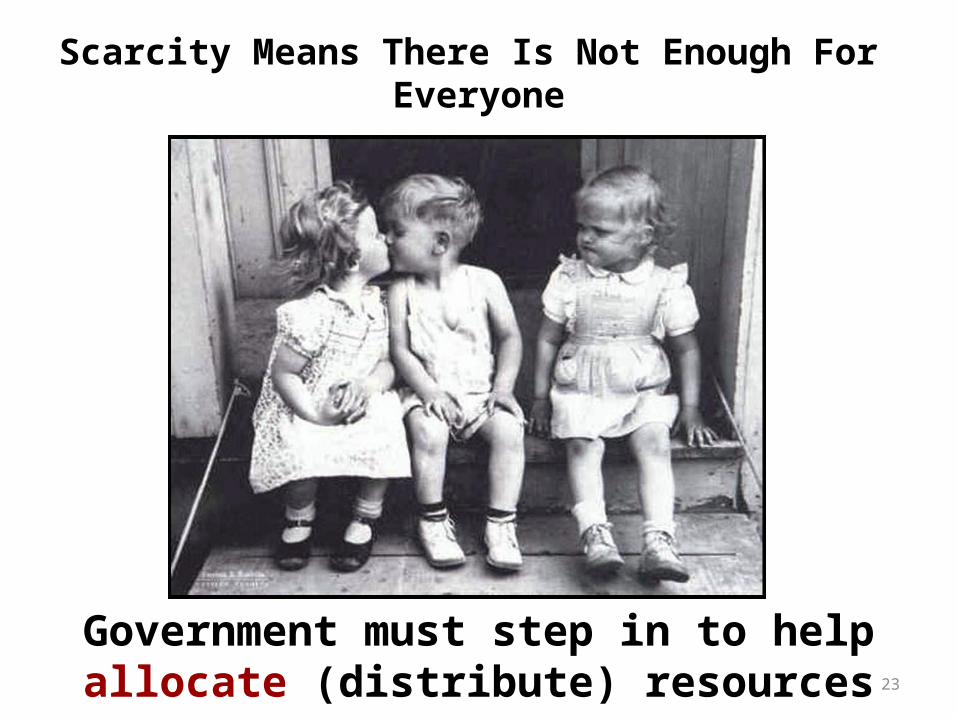
Scarcity Means There Is Not Enough For Everyone
Government must step in to help allocate (distribute) resources 23
Scarcity Bus RideScenario:
A group of 40 college students get on a bus to go to a dance 30 miles away.
Shortly after leaving, the bus finds that it is two heavy to go over a large hill
10 students need to get off the busYou and your partner need to find 5 different ways
to decide who should get off the bus.1. Are any of the solutions fair?2. How are resources allocated in communism?3. How are resources allocated in capitalism?4. What role do prices play in capitalism? 24
Every society must answer three questions:
The Three Economic Questions1. What goods and services should be
produced? 2. How should these goods and services be
produced? 3. Who consumes these goods and services?
The way these questions are answered determines the economic system
An economic system is the method used by a society to produce and distribute goods and
services. 25


![Production Possibilities Curve [ better known as the “PPC”]](https://img.pdfslide.us/doc/110x75/56816490550346895dd661af/production-possibilities-curve-better-known-as-the-ppc.jpg)