Embed Size (px)
Citation preview
The Prevalence of Physical Disability in Southwestern OntarioAuthor(s): D. WILLIAM WOOD and R. JAY TURNERSource: Canadian Journal of Public Health / Revue Canadienne de Sante'e Publique, Vol. 76, No.4 (July/August 1985), pp. 262-265Published by: Canadian Public Health AssociationStable URL: http://www.jstor.org/stable/41989058 .
Accessed: 16/06/2014 18:51
Your use of the JSTOR archive indicates your acceptance of the Terms & Conditions of Use, available at .http://www.jstor.org/page/info/about/policies/terms.jsp
.JSTOR is a not-for-profit service that helps scholars, researchers, and students discover, use, and build upon a wide range ofcontent in a trusted digital archive. We use information technology and tools to increase productivity and facilitate new formsof scholarship. For more information about JSTOR, please contact [email protected].
.
Canadian Public Health Association is collaborating with JSTOR to digitize, preserve and extend access toCanadian Journal of Public Health / Revue Canadienne de Sante'e Publique.
http://www.jstor.org
This content downloaded from 195.34.79.158 on Mon, 16 Jun 2014 18:51:24 PMAll use subject to JSTOR Terms and Conditions
The Prevalence of Physical Disability in
Southwestern Ontario*
D. WILLIAM WOOD, M.P.H., Ph.D.** and R. JAY TURNER, Ph.D.***
We conducted a community survey in 10 counties of Southwestern Ontario of 22,680 individuals in 10,972 households. In this survey we determined the extent of disability and found 1,509 individuals over the age of 18 years that were disabled (i.e., a prevalence of 67 per 1,000 households).
Nous avons effe ctivé un sondage auprès de 22 680 personnes vivant dans 10 972 foyers de dix comtés du sud-ouest de l'Ontario. Nous avons déterminé le degré d'incapacité et découvert que 1509 personnes de plus de 18 ans étaient handicapées (soit une fréquence de 67 pour 1000).
Knowledge planning about health
the and
physically social service
disabled programs1-2.
is required We for
planning health and social service programs1-2. We report a survey of persons aged 18 and over with self- reported long-term or permanent physical disabilities living in the ten counties of Southwestern Ontario in 1980-82. "Long-term disability" was defined as duration of three months or more.
We used a two-stage cluster sampling technique. The primary sampling units were enumeration areas (EA's) defined by the 1976 Canadian Census. The first stage was to draw a random sample of 200 enumeration areas, the second stage was random selection of households.
We estimated that detailed interviews with about 1000 disabled subjects would be required to evaluate community adjustment and its correlates. To reach this goal we set out to screen 10,000 households. We actually conducted initial screening interviews to identify the disabled at 10,972 households containing 22,680 adults aged 18 and over. This paper reports results derived from the screening interview which included questions on the demographic characteris- tics of each household member and the nature of any disabil-
*Supported by the National Health Research Development Program, Health and Welfare Canada, a National Health Scientist Award to R. Jay Turner, and a grant from the Ontario Ministry of Health (CRD257). A version of this paper was presented at The Annual Meeting of The Canadian Public Health Association, June 1984, Calgary, Alberta. Address communications to Dr. D. William Wood, Assistant Professor, School of Public Health, University of Hawaii at Manoa, Honolulu, Hawaii, 96822
♦♦Department of Community Health Development, School of Public Health, Uni- versity of Hawaii.
♦♦♦Health Care Research Unit, The University of Western Ontario.
ities reported. Data from the in-depth interviews are being reported elsewhere.
Because physical disabilities are more prevalent in urban than in rural areas2 and we wanted to interview sufficient numbers of the rural disabled to allow separate analyses, we oversampled rural households. The sampling ratio was 3:1 and this is adjusted for in most tables.
RESULTS Total prevalence as well as age and sex-specific rates of
disabling conditions are presented in Table I. An overall prevalence rate of approximately 67 per 1 ,000 was observed. This rate refers only to the prevalence of chronic conditions that have resulted in activity limitation. Approximately 50% of the population has some type of chronic condition3, but most suffer no notable activity limitation. We are concerned here with this much smaller population for whom activity limitations are a central feature of their chronic condition.
The total prevalence rate we observed departs somewhat from those reported by others. Comparisons of prevalence rates, however, should be made cautiously. Different opera- tional definitions of disability, varying age criteria for the populations studied and different methods of data collec- tion may all contribute to variations in observed prevalence rates. The Canada Health Survey4 reported that 1 16 per 1,000
(1 1.6%) of the non-institutionalized population of all ages, had some degree of activity limitation because of chronic health conditions.
262 Canadian Journal of Public Health Vol. 76, July/ August 1985
This content downloaded from 195.34.79.158 on Mon, 16 Jun 2014 18:51:24 PMAll use subject to JSTOR Terms and Conditions
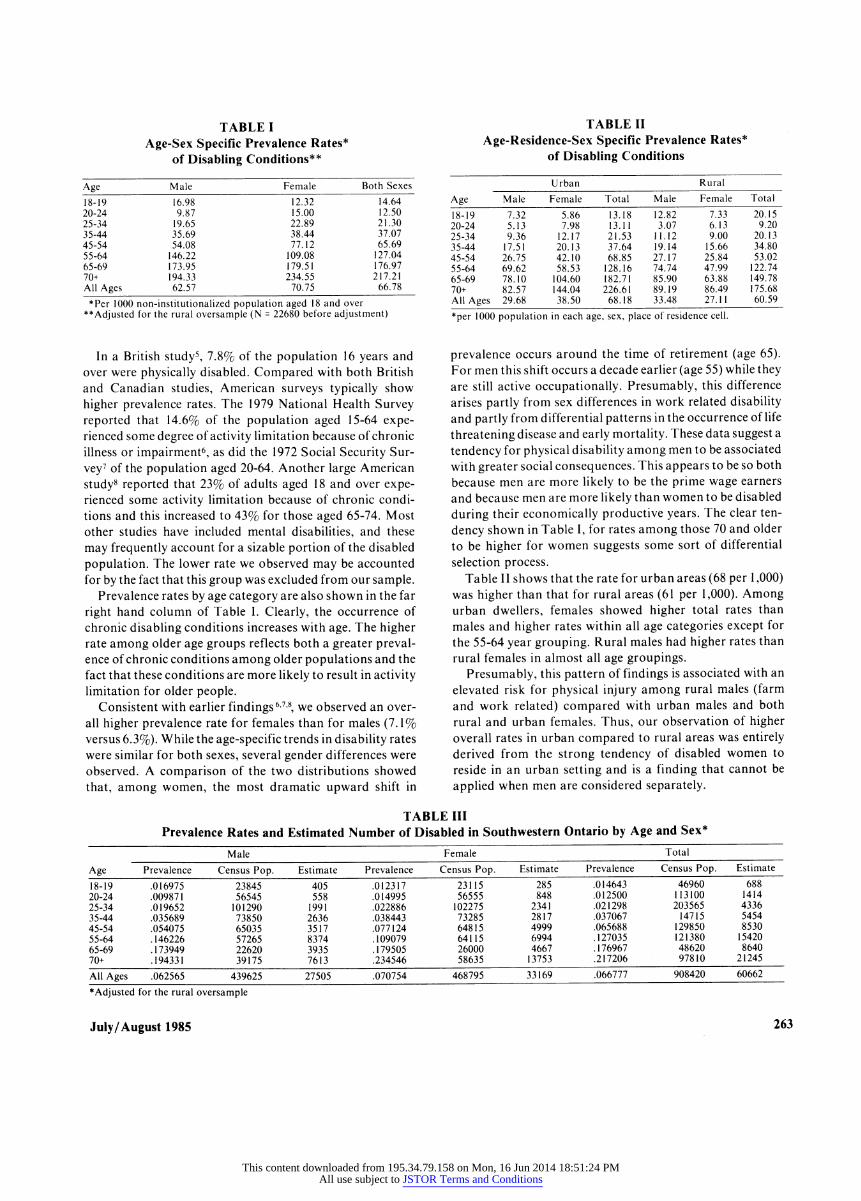
TABLE I Age-Sex Specific Prevalence Rates*
of Disabling Conditions**
Age Male Female Both Sexes 18-19 16^98 1232 '4M 20-24 9.87 15.00 12.50 25-34 19.65 22.89 21.30 35-44 35.69 38.44 37.07 45-54 54.08 77.12 65.69 55-64 146.22 109.08 127.04 65-69 173.95 179.51 176.97 70+ 194.33 234.55 217.21 All Ages 62.57 70.75 66.78 *Per 1000 non-institutionalized population aged 18 and over
♦♦Adjusted for the rural oversample (N = 22680 before adjustment)
In a British study5, 7.8% of the population 16 years and over were physically disabled. Compared with both British and Canadian studies, American surveys typically show higher prevalence rates. The 1979 National Health Survey reported that 14.6% of the population aged 15-64 expe- rienced some degree of activity limitation because of chronic illness or impairment6, as did the 1972 Social Security Sur- vey7 of the population aged 20-64. Another large American study8 reported that 23% of adults aged 18 and over expe- rienced some activity limitation because of chronic condi- tions and this increased to 43% for those aged 65-74. Most other studies have included mental disabilities, and these may frequently account for a sizable portion of the disabled population. The lower rate we observed may be accounted for by the fact that this group was excluded from our sample.
Prevalence rates by age category are also shown in the far right hand column of Table I. Clearly, the occurrence of chronic disabling conditions increases with age. The higher rate among older age groups reflects both a greater preval- ence of chronic conditions among older populations and the fact that these conditions are more likely to result in activity limitation for older people.
Consistent with earlier findings67-8, we observed an over- all higher prevalence rate for females than for males (7. 1% versus 6.3%). While the age-specific trends in disability rates were similar for both sexes, several gender differences were observed. A comparison of the two distributions showed that, among women, the most dramatic upward shift in
TABLE II Age-Residence-Sex Specific Prevalence Rates*
of Disabling Conditions
Urban Rural Age Male Female Total Male Female Total 18-19 7J2 5M mŠ 1Ž82 133 20.15 20-24 5.13 7.98 13.11 3.07 6.13 9.20 25-34 9.36 12.17 21.53 11.12 9.00 20.13 35-44 17.51 20.13 37.64 19.14 15.66 34.80 45-54 26.75 42.10 68.85 27.17 25.84 53.02 55-64 69.62 58.53 128.16 74.74 47.99 122.74 65-69 78.10 104.60 182.71 85.90 63.88 149.78 70+ 82.57 144.04 226.61 89.19 86.49 175.68 All Ages 29.68 38.50 68.18 33.48 27.11 60.59 ♦per 1000 population in each age, sex, place of residence cell.
prevalence occurs around the time of retirement (age 65). For men this shift occurs a decade earlier (age 55) while they are still active occupationally. Presumably, this difference arises partly from sex differences in work related disability and partly from differential patterns in the occurrence of life threatening disease and early mortality. These data suggest a tendency for physical disability among men to be associated with greater social consequences. This appears to be so both because men are more likely to be the prime wage earners and because men are more likely than women to be disabled during their economically productive years. The clear ten- dency shown in Table I, for rates among those 70 and older to be higher for women suggests some sort of differential selection process.
Table 11 shows that the rate for urban areas (68 per 1 ,000) was higher than that for rural areas (61 per 1,000). Among urban dwellers, females showed higher total rates than males and higher rates within all age categories except for the 55-64 year grouping. Rural males had higher rates than rural females in almost all age groupings.
Presumably, this pattern of findings is associated with an elevated risk for physical injury among rural males (farm and work related) compared with urban males and both rural and urban females. Thus, our observation of higher overall rates in urban compared to rural areas was entirely derived from the strong tendency of disabled women to reside in an urban setting and is a finding that cannot be applied when men are considered separately.
TABLE III Prevalence Rates and Estimated Number of Disabled in Southwestern Ontario by Age and Sex*
Male Female Total Age Prevalence Census Pop. Estimate Prevalence Census Pop. Estimate Prevalence Census Pop. Estimate 18-19 .016975 23845 405 .012317 23115 285 .014643 46960 688 20-24 .009871 56545 558 .014995 56555 848 .012500 113100 1414 25-34 .019652 101290 1991 .022886 102275 2341 .021298 203565 4336 35-44 .035689 73850 2636 .038443 73285 2817 .037067 14715 5454 45-54 .054075 65035 3517 .077124 64815 4999 .065688 129850 8530 55-64 .146226 57265 8374 .109079 64115 6994 .127035 121380 15420 65-69 .173949 22620 3935 .179505 26000 4667 .176967 48620 8640 70+ .194331 39175 7613 .234546 58635 13753 .217206 97810 21245 All Ages .062565 439625 27505 .070754 468795 33169 .066777 908420 60662 ♦Adjusted for the rural oversample
July/August 1985 263
This content downloaded from 195.34.79.158 on Mon, 16 Jun 2014 18:51:24 PMAll use subject to JSTOR Terms and Conditions
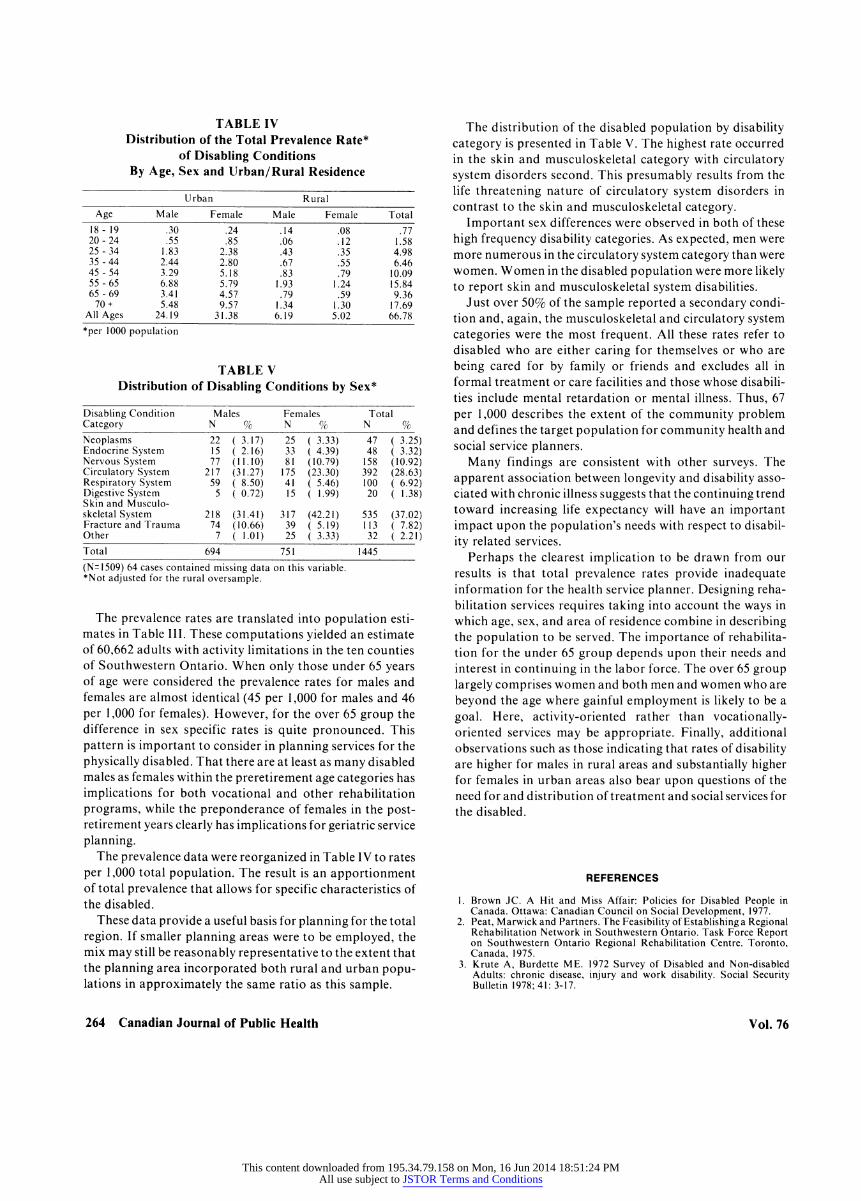
TABLE IV Distribution of the Total Prevalence Rate*
of Disabling Conditions By Age, Sex and Urban/Rural Residence
Urban Rural Age Male Female Male Female Total
18 - 19 JO 24 TÏ4 ^08 Til 20- 24 .55 .85 .06 .12 1.58 25 - 34 1.83 2.38 .43 .35 4.98 35 - 44 2.44 2.80 .67 .55 6.46 45 - 54 3.29 5.18 .83 .79 10.09 55 - 65 6.88 5.79 1.93 1.24 15.84 65 - 69 3.41 4.57 .79 .59 9.36 70+ 5.48 9.57 1.34 1.30 17.69
All Ages 24.19 31.38 6J9 102 66.78 *per 1000 population
TABLE V Distribution of Disabling Conditions by Sex*
Disabling Condition Males Females Total Category N % N % N % Neoplasms 22 ( 3.17) 25 ( 3.33) 47 ( 3.25) Endocrine System 15 ( 2.16) 33 ( 4.39) 48 ( 3.32) Nervous System 77 (11.10) 81 (10.79) 158 (10.92) Circulatory System 217 (31.27) 175 (23.30) 392 (28.63) Respiratory System 59 ( 8.50) 41 ( 5.46) 100 ( 6.92) Digestive System 5 ( 0.72) 15 ( 1.99) 20 ( 1.38) Skin and Musculo- skeletal System 218 (31.41) 317 (42.21) 535 (37.02) Fracture and Trauma 74 (10.66) 39 ( 5.19) 113 ( 7.82) Other 7 ( 1.01) 25 ( 3.33) 32 ( 2.21) Total 694 751 1445 (N=1509) 64 cases contained missing data on this variable. *Not adjusted for the rural oversample.
The prevalence rates are translated into population esti- mates in Table III. These computations yielded an estimate of 60,662 adults with activity limitations in the ten counties of Southwestern Ontario. When only those under 65 years of age were considered the prevalence rates for males and females are almost identical (45 per 1,000 for males and 46 per 1,000 for females). However, for the over 65 group the difference in sex specific rates is quite pronounced. This pattern is important to consider in planning services for the physically disabled. That there are at least as many disabled males as females within the preretirement age categories has implications for both vocational and other rehabilitation programs, while the preponderance of females in the post- retirement years clearly has implications for geriatric service planning.
The prevalence data were reorganized in Table IV to rates per 1,000 total population. The result is an apportionment of total prevalence that allows for specific characteristics of the disabled.
These data provide a useful basis for planning for the total region. If smaller planning areas were to be employed, the mix may still be reasonably representative to the extent that the planning area incorporated both rural and urban popu- lations in approximately the same ratio as this sample.
The distribution of the disabled population by disability category is presented in Table V. The highest rate occurred in the skin and musculoskeletal category with circulatory system disorders second. This presumably results from the life threatening nature of circulatory system disorders in contrast to the skin and musculoskeletal category.
Important sex differences were observed in both of these high frequency disability categories. As expected, men were more numerous in the circulatory system category than were women. Women in the disabled population were more likely to report skin and musculoskeletal system disabilities.
Just over 50% of the sample reported a secondary condi- tion and, again, the musculoskeletal and circulatory system categories were the most frequent. All these rates refer to disabled who are either caring for themselves or who are being cared for by family or friends and excludes all in formal treatment or care facilities and those whose disabili- ties include mental retardation or mental illness. Thus, 67 per 1,000 describes the extent of the community problem and defines the target population for community health and social service planners.
Many findings are consistent with other surveys. The apparent association between longevity and disability asso- ciated with chronic illness suggests that the continuing trend toward increasing life expectancy will have an important impact upon the population's needs with respect to disabil- ity related services.
Perhaps the clearest implication to be drawn from our results is that total prevalence rates provide inadequate information for the health service planner. Designing reha- bilitation services requires taking into account the ways in which age, sex, and area of residence combine in describing the population to be served. The importance of rehabilita- tion for the under 65 group depends upon their needs and interest in continuing in the labor force. The over 65 group largely comprises women and both men and women who are beyond the age where gainful employment is likely to be a goal. Here, activity-oriented rather than vocationally- oriented services may be appropriate. Finally, additional observations such as those indicating that rates of disability are higher for males in rural areas and substantially higher for females in urban areas also bear upon questions of the need for and distribution of treatment and social services for the disabled.
REFERENCES
1. Brown JC. A Hit and Miss Affair: Policies for Disabled People in Canada. Ottawa: Canadian Council on Social Development, 1977.
2. Peat, Marwick and Partners. The Feasibility of Establishing a Regional Rehabilitation Network in Southwestern Ontario. Task Force Report on Southwestern Ontario Regional Rehabilitation Centre. Toronto, Canada, 1975.
3. Krute A, Burdette ME. 1972 Survey of Disabled and Non-disabled Adults: chronic disease, injury and work disability. Social Security Bulletin 1978; 41: 3-17.
264 Canadian Journal of Public Health Vol. 76
This content downloaded from 195.34.79.158 on Mon, 16 Jun 2014 18:51:24 PMAll use subject to JSTOR Terms and Conditions

4. Statistics Canada. The Health of Canadians: Report of the Canada Health Survey, 1981, Ottawa: Minister of Supply and Services Canada.
5. Bennett AE, Garrad J, Halil T. Chronic disease and disability in the community: a prevalence study. Br Med J 1970; 3: 762-76.
6. Department of Health, Education and Welfare. Current estimates from the Health Interview Survey, 1981, United States, Vital and Health Statistics, Series 10, No. 136.
7. Allan, K. First findings of the 1972 Survey of the Disabled: general characteristics. Social Security Bulletin 1976; 39-18-37.
8. Nagi SZ. An epidemiology ot disability among adults in the united States. Milbank Mem Fund Quart / Health and Society 1976; 54: 439-467.
Received: April 18, 1984 Accepted: June 12, 1985
This content downloaded from 195.34.79.158 on Mon, 16 Jun 2014 18:51:24 PMAll use subject to JSTOR Terms and Conditions