Embed Size (px)
Citation preview

i
THE SUPPORTIVENESS OF THE
ENVIRONMENT AND VISUAL-
MOTOR INTEGRATION OF
CHILDREN RESIDING IN A
RESIDENTIAL CHILD CARE
FACILITY IN MAURITIUS _______________________________________________________________________
Anne Tait
A research report submitted to the Faculty of Health Sciences,
University of the Witwatersrand, Johannesburg, in partial fulfilment of
the requirements for the degree of Master of Science in Occupational
Therapy.
Johannesburg,
November 2014

ii
DECLARATION
I, Anne Tait declare that this dissertation is my own work. It is being submitted for the
degree of Master of Science in Occupational Therapy to the University of the
Witwatersrand, Johannesburg. It has not been submitted before for any degree or
examination at this or any other University.
Signed:
14th Day of November 2014

iii
DEDICATION
This report is dedicated to all the children who are not loved, and have been neglected
through our imperfect society through our failing as adults, to prioritise their needs above
our own. May these findings help in highlighting the needs of the most vulnerable in our
society.
iv
ABSTRACT
Part 1 of this study determined the demographic factors, including body mass index (BMI)
associated with development, and the environmental supportiveness, as determined by
the HOME Inventory, of 50 typical children living in the community in Mauritius. Their
normally distributed developmental status, using the Beery-Buktenika Developmental Test
of Visual-Motor Integration (Beery VMI) confirmed their demographic and environmental
factors were within acceptable limits, and were not associated with developmental delay.
Based on the results of Part 1 as a standard for assessing development, Part 2 of the
study considered the developmental status of 50 children living in a residential child care
facility in Mauritius. Demographic information indicated exposure to factors associated
with developmental delay, with HOME inventory scores falling below the accepted
medians for the majority of the subscales. The below average scores on the Beery VMI,
indicated developmental delay in child care group which should be further researched and
addressed by occupational therapy.
v
ACKNOWLEDGEMENTS
I would like to thank the residential child care facility who agreed to the use of their
facilities, and the participation of the children in this study. I would also like to thank my
supervisor, Denise Franzsen, who spent many hours (after hours) helping to complete this
study.
vi
TABLE OF CONTENTS
DECLARATION ................................................................................................................. ii
DEDICATION.................................................................................................................... iii
ABSTRACT ...................................................................................................................... iv
ACKNOWLEDGEMENTS .................................................................................................. v
TABLE OF CONTENTS .................................................................................................... vi
LIST OF TABLES ............................................................................................................. xi
OPERATIONAL DEFINITIONS ........................................................................................ xii
ABBREVIATIONS ........................................................................................................... xiii
CHAPTER 1 INTRODUCTION ......................................................................................... 1
1.1 Introduction ............................................................................................................ 1
1.2 Statement of the problem ....................................................................................... 4
1.3 Purpose of the research ......................................................................................... 5
1.4 Aims of the study .................................................................................................... 5
1.4.1 Objectives of the study ......................................................................................... 5 1.5 Justification for the Research ...................................................................................... 6
CHAPTER 2 LITERATURE REVIEW ................................................................................ 7
2.1 Introduction ................................................................................................................. 7
2.2. The environmental context ......................................................................................... 7
2.2.1 Home environment ............................................................................................... 8 2.2.2 Effect of the home environment on development .................................................. 8 2.2.3 The residential child care facility environment ....................................................... 9
2.2.3.1 Culture of or type of residential child care facility .......................................... 11 2.2.3.2 Length of stay in a residential child care facility ............................................ 13 2.2.3.3 Quality of care giving in a residential child care facility ................................. 14 2.2.3.4 Factors protecting against developmental delay in the residential child care facility environment .................................................................................................. 16 2.2.3.5 Caregiver characteristics .............................................................................. 17
2.3 Socioeconomic status (SES) ............................................................................... 18
2.3.1 Effects of socioeconomic status (SES) on child development ............................. 19 2.3.2 Effects of socioeconomic status (SES) on childhood nutrition ............................. 19
vii
2.4 Effects of the environmental context and socioeconomic status (SES) on the education occupational performance area ...................................................................... 21
2.4.1 The effects of environmental contexts on Visual Motor Integration ..................... 23 2.5 Summary .................................................................................................................. 25
CHAPTER 3 RESEARCH METHODOLOGY .................................................................. 27
3.1 Research design .................................................................................................. 27
3.2 PART 1 Assessment of children in the community in Mauritius ................................. 28
3.2.1 Context of the study............................................................................................ 28 3.2.2 Sampling ....................................................................................................... 28
3.2.2.1 Inclusion criteria ........................................................................................... 29 3.2.2.2 Exclusion criteria .......................................................................................... 29 3.2.2.3 Sample size ................................................................................................. 29 3.2.2.4 Recruitment of community participants ........................................................ 29
3.3 PART2: Assessment of children in residential child care facilities in Mauritius .......... 30
3.3.1 Context of the study............................................................................................ 30 3.3.2 Sampling ....................................................................................................... 31
3.3.2.1 Inclusion and exclusion criteria .................................................................... 31 The criteria for inclusion and exclusion were the same as for the community group. 31 3.3.2.2 Sample size ................................................................................................. 31
3.3.2.3 Recruitment of participants .............................................................................. 31 3.4 Research methods .................................................................................................... 31
3.4.1 Measurement techniques .............................................................................. 31 3.4.1.1 Demographic questionnaire (Appendix D) ....................................................... 32
3.4.1.2 The Beery-Buktenica Developmental Test of Visual-Motor Integration, 5th Edition (Beery VMI) (Appendix E, E1) ...................................................................... 32 3.4.1.3 Home Observation for Measurement of the Environment inventory (HOME) (Appendix F) .............................................................................................. 33 3.4.1.4 Assessment of nutrition – Body Mass Index (BMI) (Appendix D) ........... 35
3.4.2 Research procedure ...................................................................................... 36 3.4.2.1 Assessments of child participants ................................................................ 36
3.4.2.2 Assessments with caregivers, parents and child participants ........................... 37 3.4.2 Data management .............................................................................................. 37 3.4.3 Ethical considerations ................................................................................... 37 4.3.4 Data Analysis ................................................................................................ 38
CHAPTER 4 RESULTS .................................................................................................. 40
4.1 Introduction ............................................................................................................... 40
4.2 PART 1: Assessment of children in the community in Mauritius ................................ 40
4.2.1 Factors associated with development in children ................................................ 40 4.2.1.1 Demographics of the participants and their parents ..................................... 40 4.2.1.2 Nutritional Status .......................................................................................... 42 4.2.1.3 Environmental supportiveness ..................................................................... 43 4.2.1.4 The Beery-Buktenica Developmental Test of Visual Motor Integration ......... 45 Visual Motor integration ........................................................................................... 46
viii
Visual Perception ..................................................................................................... 47 Motor Co-ordination ................................................................................................. 47
4.2.2 Association between the Beery-Buktenica Developmental Test of Visual Motor Integration scores, demographic Factors and the HOME Inventory ............................. 48
4.2.2.1 Association between the Beery-Buktenica Developmental Test of Visual Motor Integration Scores and Body Mass Index ................................................................. 48 4.2.2.2 Association between the Beery-Buktenica Developmental Test of Visual Motor Integration Scores and the HOME Inventory ............................................................ 48
4.3 PART 2 Assessment of children in a residential child care facility in Mauritius .......... 49
4.3.1 Factors associated with development ................................................................. 49 4.3.1.1 Demographics of the participants and caregivers ......................................... 49 4.3.1.2 Care History of participants in the child care group ...................................... 51 4.3.1.2 Nutritional status .......................................................................................... 52 4.3.1.3 Environmental supportiveness ..................................................................... 53 4.3.1.4 Beery-Buktenica Developmental Test of Visual Motor Integration (Beery VMI) ................................................................................................................................ 55 Visual Motor Integration ........................................................................................... 56 Visual Perception ..................................................................................................... 56 Motor Co-ordination ................................................................................................. 57
4.3.2. Relative risk for developmental delay in visual motor integration for child care group ........................................................................................................................... 57 4.3.3 Association between the Beery-Buktenica Developmental Test of Visual Motor Integration Scores, demographic factors and the HOME Inventory ............................. 58
4.3.3.1 Association between the Beery-Buktenica Developmental Test of Visual Motor Integration Scores and Body Mass Index and length of stay in the residential child care facility ............................................................................................................... 58 4.3.3.2 Association between the Beery-Buktenica Developmental Test of Visual Motor Integration scores and the HOME Inventory ............................................................ 59
4.4 Summary .................................................................................................................. 60
CHAPTER 5 DISCUSSION............................................................................................. 63
5.1 Introduction ............................................................................................................... 63
5.2 PART 1: Factors associated with development for children living in the community in Mauritius ......................................................................................................................... 63
5.2.1 Demographic factors .......................................................................................... 63 5.2.2 The Supportiveness of the Environment ............................................................. 64 5.2.3 Visual Motor Integration ...................................................................................... 65 5.2.4 Association between the factors associated with development, the environment and Visual Motor Integration ........................................................................................ 66
5.3 PART 2: Factors associated with development for children living in a residential child care facility in Mauritius ................................................................................................... 66
5.3.1 Demographic factors .......................................................................................... 66 5.3.2 The Supportiveness of the Environment ............................................................. 69 5.3.3 Visual Motor Integration ...................................................................................... 72 5.3.4 Association between the factors associated with development, the environment and Visual Motor Integration ........................................................................................ 73
5.4 Limitations of the study ............................................................................................. 74
ix
5.4.1 Data collection .................................................................................................... 74 5.4.2 Test administration ............................................................................................. 75
5.4.2.1 Administration of the assessments ............................................................... 75 5.4.2.2 Beery VMI .................................................................................................... 75 5.4.2.3 HOME Inventory .......................................................................................... 76 5.2.4.4. Body Mass Index ........................................................................................ 77
5.5 Bias ....................................................................................................................... 77 5.6 Summary .................................................................................................................. 77
CHAPTER 6 CONCLUSION ........................................................................................... 80
6.1 Recommendations from the research ....................................................................... 80
REFERENCES ............................................................................................................... 84
APPENDIX A: Permission to involve the specific children in the residential child care facility ............................................................................................................................. 97
APPENDIX B: Verbal assent from child participants ....................................................... 98
APPENDIX E: Beery-Buktenika Developmental Test of Visual-Motor Integration .......... 104
APPENDIX E1: Standard Score Interpretation for Beery VMI ....................................... 105
APPENDIX F: HOME Inventory .................................................................................... 106
APPENDIX F1: Middle Childhood (6-10 years) HOME Record Form ............................ 106
APPENDIX F2: Early Adolescent (10-15 years) HOME Record Form ........................... 101
APPENDIX F4: Mean, Standard Deviation and Median for HOME Inventory – Early Adolescent .................................................................................................................... 104
APPENDIX G: Letter of Permission and Ethical Approval from the Ministry of Health and Quality of Life in Mauritius ............................................................................................. 105

x
LIST OF FIGURES
Figure 3.1 Outline of research design for Part 1 .............................................................. 28
Figure 3.2 Outline of research design for Part 2 .............................................................. 30
Figure 4.1 Income of one parent of participants in the community group......................... 42
Figure 4.2 Percentage body mass index according to z scores for the community group 43
Figure 4.3 Key cut offs for BMI ........................................................................................ 43
Figure 4.4 Expected and observed performance on visual motor integration standard scores for community group ............................................................................................ 46
Figure 4.5 Expected and observed performance on visual perceptual standard scores for the community group ...................................................................................................... 47
Figure 4.6 Expected and observed performance on motor co-ordination standard scores for typical, community group ........................................................................................... 48
Figure 4.7 Income of caregivers of the participants in the Child care group .................... 51
Figure 4.8 Percentage body mass index according to z scores for the child care group .. 52
Figure 4.9 Expected and observed performance on visual motor integration standard scores for child care group .............................................................................................. 56
Figure 4.10 Expected and observed performance on visual perceptual standard scores for the child care group ........................................................................................................ 56
Figure 4.11 Expected and observed performance on motor co-ordination standard scores for child care group ......................................................................................................... 57
Figure 4.12 Percentage relative risk for the childcare group relative to the community group for dysfunction in visual motor integration, visual perception and motor coordination . ...................................................................................................................................... 58
xi
LIST OF TABLES
Table 4.1 Demographics of the participants and their parents in the community group ... 41
Table 4.2 Body mass Index for the community group...................................................... 43
Table 4.3 Mean Standard Scores on the HOME Inventory for community groups ........... 44
Table 4.4 Mean Standard Scores on the components of the HOME Inventory for Middle Childhood community group ........................................................................................... 44
Table 4.5 Mean Standard Scores on the components of the HOME Inventory for early adolescent, community group ......................................................................................... 45
Table 4.6 Mean Standard Scores on the Beery-Buktenica Developmental Test of Visual Motor Integration for the community group ...................................................................... 46
Table 4.7 Correlation between the Standard Scores on the Beery-Buktenica Developmental Test of Visual Motor Integration and body mass index and age for the community group ............................................................................................................ 48
Table 4.8 Correlation between the HOME Inventory and standard scores on the Beery-Buktenica Developmental Test of Visual Motor Integration for the community group ...... 49
Table 4.9 Demographics of the participants and caregivers in the child care group ........ 50
Table 4.10 Age of admission and length of stay in the residential child care facility ........ 51
Table 4.11 Body Mass Index for the child care group...................................................... 52
Table 4.12 Mean Standard Scores on the HOME Inventory for the child care group ....... 53
Table 4.13 Mean Standard Scores on the components of the HOME Inventory for Middle Childhood child care group ............................................................................................. 53
Table 4.14 Mean Standard Scores on the components of the HOME Inventory for early adolescent child care group ............................................................................................ 54
Table 4.15 Mean Standard Scores on the Beery-Buktenica Developmental Test of Visual Motor Integration for child care group ............................................................................. 55
Table 4.16 Correlation between the standard scores on the Beery-Buktenica Developmental Test of Visual Motor Integration and body mass index and age for the child care group ...................................................................................................................... 59
Table 4.17 Correlation between the HOME Inventory and standard scores on the Beery-Buktenica Developmental Test of Visual Motor Integration for the child care group ........ 60

xii
OPERATIONAL DEFINITIONS
Environment: The physical (1–3), social, (2,3), cultural (2) and attitudinal (2)
surroundings of an individual or group.
Child development: The growth and resultant changes a child progresses through as
he/she masters increasingly ‘complex levels of moving, thinking, feeling, and relating to
others’ (4).
Visual-Motor Integration (VMI): The term visual-motor integration (VMI) refers to the
interaction of visual skills, visual-perceptual skills, and motor skills (5). It describes the
degree to which an individual can combine the visual image of shapes with the matching
motor output, in an activity such as handwriting (6,7).
Residential Child Care Facility: The term ‘residential child care facility’ refers to a place
or facility, which provides care for children who can no longer be cared for in the
community. In Mauritius, residential care institutions are charitable/non-governmental,
although work in collaboration with the Ministry to provide care and safety as per the Child
Protection Act (8).
Body Mass Index (BMI): Body mass index was used in this study to measure nutritional
status (9). BMI was calculated using weight (kg) divided by height (m2), and compared to
the WHO growth standards (10).
xiii
ABBREVIATIONS
Beery VMI = Beery-Buktenica Developmental Test of Visual Motor Integration
BMI = Body mass index
HDI = Human Development Index
HOME = Home Observation for Measurement of the Environment
LOS = Length of stay
NICHD = National Institute of Health and Human Development
OT = Occupational Therapy
RCCF = Residential child care facility
SES = Socioeconomic status
SD = Standard deviation
USA = United States of America
VP = Visual perception
WHO = World Health Organisation
W/H = Weight for height
Ns = Not significant
MUR = Mauritian rupees
1
CHAPTER 1 INTRODUCTION
1.1 Introduction
Deprivation, in its various forms, may have serious and lasting consequences for
developmental outcomes in children (10). Sherr (2005) states that ‘early experiences and
development affect [a child’s] future socialisation, maturation, achievement and emotional
qualities’(11, p. 3). In many of the developed counties of the world this would include
intervention by an occupational therapist. However there are a limited number of
occupational therapists as the training in Mauritius was only started in 2003. Assessing
development to facilitate better educational outcomes for children, especially those who
have been deprived should be a major concern for occupational therapists working in the
community setting.
For occupational therapists to understand developmental delay associated with
deprivation a number of risk factors must be considered. Those identified as most
influential on development in young children include the environment and family unit (12)
in which the child lives, their socioeconomic (13) and nutritional status. These factors
rarely operate in isolation and therefore prevention and intervention strategies used to
facilitate development must be multi factorial. It is widely accepted that a functional family
unit (14) and a stimulus rich environment are important for an infant’s typical brain
development (15–18) and essential if the child is to reach their normal developmental
milestones (14). For adequate development it is imperative that children feel safe, are
healthy, are responded to sensitively and appropriately, and are encouraged to reach their
potential (19). Unfortunately many families are unable to provide for these needs, due to a
lack of resources (20–22), and children may experience deprivation if they live in a low
socioeconomic environment (14,20,23). This also holds true for many children placed in
residential care who are often deprived of ‘expected experiences’, and the ‘typical
environment’, experienced by other children (12).
A low-income, deprived environment has been shown to affect a child’s ability to develop
optimally, as their home life has been reported to be more chaotic and less well resourced
(22), with fewer stimulating experiences (24). A lack of parental and particularly maternal
factors has been shown to result in less than optimal development, including lower
education levels (25,26), health and stress levels (27,28), with consequences for the care
provided to these children (29).
2
If exposure to these environmental risk factors occurs in the first 3-5 years of life,the
consequences appear to be more detrimental (30), as small disruptions at this stage in
development may have long-term implications for the developing brain, and its capacity to
function optimally (16), which continue to impact on development (31), even after this
crucial period. This occurs not only because the continual lack of resources in the physical
environment affecting the child's socio-emotional development but is also due to poor
nutrition where the lack of adequate nutrients also can have long-term effects on the
developing brain's structure (29). Research on low socioeconomic groups in Mauritius,
where this study was done, has shown that both chronic underweight and obesity exists
when body mass index (BMI) is used to determine the nutritional status in children. This
has been ascribed to restricted access to adequate and suitable food.(9).
It has been found that in countries with economic constraints, there is an increase in
admission to residential child care, as the circumstances of communities and families
result in parents no longer being able to care for their children at home (32). The situation
in Mauritius is no different and children are placed in residential child care facilities if they
are found to be from deprived ‘utterly non-stable families’ (8).
Children in residential care often suffer a double burden deprivation, where
institutionalisation is combined with the effects of a low socioeconomic status (SES),
either prior to or during their placement in the facility. Research has confirmed that
neglect, chronic stress, poor environmental circumstances, and institutionalisation of
children in residential care, can result in even greater delay in development
(12,14,17,19,33,34). The negative consequences of residential child care on development
have been attributed to the culture of institutions and lack of environmental
supportiveness, as the institutions often care for large numbers of children, frequently
placing the primary focus of concern on the physical care of children, and establishing
routines, with insufficient attention being given to interaction with children (35). High child
to caregiver ratios often limit the physical experiences of the children, as well as the time
they spend in interaction with any adult (33). Not unexpectedly family type of group homes
has been shown to be preferable to larger institutions in which a large number of children
co habit (36,37).
Length of stay in a residential child care facility (38,39) and age of admission (40,41),
have also been shown to play a role in the degree to which the environment of the
institution impacts development. Negative correlations between length of
institutionalisation and cognitive abilities have been found in several studies quoted by
Maclean (2003)(39), although later research states that a longer stay in the residential

3
child care facility does not necessarily lead to greater developmental delays. Age of
admission was found to be more important than length of stay as children who were
younger at the time of placement, seemed to lag behind more than those placed when
they were older (42). This may be due to the pre-placement experiences being more
stimulating than the residential child care environment (43). There are also limited
international publications on the impact of extended periods of time in residential child
care on children living in such facilities, especially on those who were admitted after the
age of six years (37).
The risk factors for child development described above, have been found to be strong
predictors of later outcomes, in terms of academic performance, social, emotional, and
cognitive ability of children from deprived environments (44). Studies using data from The
International Human Dimension Programme on Global Environmental Change (IHDP),
found that the impact of family income could be strongly linked to intelligent quotient (IQ)
scores, which is supported by the lower Peabody Picture Vocabulary Test (PPVT) scores
of children from families with low incomes.
Children from low socioeconomic circumstances have been shown to be at-risk for school
failure (45), although low income has been shown to have little influence on the number of
years of schooling completed (46). Johnson, Browne and Hamilton-Giachritis (2006)(47)
found that the majority of studies investigating intellectual development reported that
institutional care was also associated with poor cognitive performance and lower IQ
scores, showing that the environmental supportiveness in family care was preferable to
residential child care facility living, when considering cognitive development. Some of the
studies indicated however that early removal to very poor family care could result in
improved cognitive functioning.
Noble, Norman, and Farah (2005)(48) proposed that poor academic achievement in
children from low-income situations, might be related to the development of certain skills
fundamental to learning, and basic academic skills. These developmental deficits could
have a cumulative effect on later development and learning. Measures of fundamental
skills associated with outcomes of cognitive and academic abilities, include visual
perception and visual-motor integration (VMI) . These skills are assessed and facilitated in
occupational therapy, in children who have developmental delay, with the view of
improving their ability to achieve at school (49).
Visual motor integration refers to the interaction of visual skills, visual-perceptual skills,
and motor skills (5). It represents the ability to combine the visual image of shapes with
the matching motor output. Delay in the development of VMI has been associated with

4
poor academic performance caused by underlying visual-cognitive deficits, including poor
fine motor ability, visual discrimination problems, or inability to integrate these various
functions (6,23,50). The Beery-Buktenica Developmental Test of Visual Motor Integration
(Beery VMI) is frequently used in clinical practice to assess visual analysis and VMI skills
(5). Research has demonstrated that the ability to copy geometric forms can be correlated
with reading readiness and academic achievement (51). Recent studies by Pienaar,
Barhorst and Twisk (2013)(52), and Carlson, Rowe and Curby (2013)(53) have confirmed
this relationship, especially in children from low SES groups.
1.2 Statement of the problem
Since occupational therapy education only started in Mauritius in 2003 there has been no
published research examining the factors and standardised tests used internationally to
assess development, or their appropriateness for and applicability to the population of
Mauritius. Thus assessments to determine the client factors and performance skills
related to the occupational performance area of education and academic performance,
like visual perceptual abilities and visual and motor abilities have not been determined for
typical children living in the community in Mauritius. In addition the demographic and
environmental factors associated with development of children living in a typical
community in Mauritius need to be established, so that the effects of residential care on
development can be examined.
There is also limited information on the developmental delay of children living in
residential child care facilities in Mauritius or on the intervention provided. Literature
indicates that children living in residential child care facilities are likely to have been
exposed to factors that place them at risk for developmental delay, but no published
studies on the supportiveness of the environment, or development of the children in the 10
residential child care facilities listed on the island of Mauritius, by the Mauritius National
Progress Report of the Special Session of the General Assembly on Children (2006) were
found (54).
Delay in the development of performance skills in older school going children in residential
care (41) of VMI in particular, has been shown to impact on the occupational performance
area of education, and the level of this delay needs to be determined (55). However, there
is little information available on such factors or skills and their association of the quality of
the environment on VMI in older children living in residential child care facilities. The lack
of studies conducted leaves relevant authorities and therapists with limited knowledge on
the extent of or the specifics of the problems, which may need intervention.

5
1.3 Purpose of the research
The main purpose of the research was to determine the supportiveness of the
environment in a residential child care facility in Mauritius, using the HOME inventory, for
children between six and 16 years of age, and to establish to what extent these children
experience delays in VMI. Other factors which influence development, such as BMI,
length of stay in the residential child care facility, as well as caregiver education and
income, were also considered. The association between the quality of the environment,
the VMI scores and these factors was established. To determine if living in a residential
child care facility impacts on the development of these children, these same factors were
assessed in a typical group of children in the same age range, living in a typical
community setting to determine the normative values for these factors for children in
Mauritius.
1.4 Aims of the study
The study was comprised of two parts
Part 1
To establish the demographic factors associated with development of typical children
living in the community in Mauritius and to establish if normative values on standardised
tests can be used to assess their environmental supportiveness and VMI developmental
status and if there is any association between these factors.
Part 2
To establish the demographic data, environmental supportiveness and VMI
developmental status for children living in a residential child care facility in Mauritius and
to establish if there is any association between these factors.
1.4.1 Objectives of the study
Part 1
1. To determine the factors associated with development in typical children living in the
community in Mauritius. The factors measured included the demographics: BMI (as an
indication of nutritional status) and caregiver characteristics, as well as the
environmental supportiveness as determined by the HOME inventory.
2. To establish if the Beery VMI can be used to determine the developmental status of
children between six and 16 years living in a community in Mauritius
6
3. To determine association between demographic factors and environmental
supportiveness and the Beery VMI for children between six and 16 years living in the
community in Mauritius
Part 2
4. To determine how factors associated with development differ for children living in a
residential child care facility in Mauritius. The factors measured included the
demographics: care history, BMI (as an indication of nutritional status) and caregiver
characteristics, as well as the environmental supportiveness as determined by the
HOME inventory.
5. To determine the developmental status of VMI in children between six and 16 years
living in a residential child care facility in Mauritius.
6. To determine association between demographic factors and environmental
supportiveness and the Beery VMI for children between six and 16 years living in the
community and in a residential child care facility in Mauritius
1.5 Justification for the Research
There is limited research internationally related to the development of older children living
in residential care. There is also no published research on the effects of living in
residential child care facilities in Mauritius.This research investigated the supportiveness
of the environment and other factors impacting on the development for children between
six and 16 years, both in a residential child care facility and the surrounding community.
The results of this research were intended to highlight the role that the environment plays
in influencing the development of the children in the community and residential child care
facilities, and the possible association of the environmental factors on the performance
skill of VMI, which may impact on the performance area of education. The evidence from
this research can thus raise the awareness of child development in Mauritius with
particular emphasis on the residential child care facilities. Exploration of some of the
environmental factors will assist in guiding interventions, aimed at alleviating the problems
faced,and in addition, the results of this study will be of value to occupational therapists in
Mauritius, in understanding the environmental context in which children from residential
child care facilities live, and the specific developmental challenges of the children in
relation to VMI and performance in the education occupational performance area. The
study will provide guidance for the occupational therapists, in facilitating improved
developmental outcomes in these children.
7
CHAPTER 2 LITERATURE REVIEW
This literature review will consider the adverse effects of environmental factors related to
the contexts of child care facilities, low SES and social environment. In addition, the
association between these factors and the development of visual-motor integration (VMI)
performance skills needed for achievement in the occupational performance area of
education will also be reviewed. For the purpose of this review, demographic information
and the specific external factors measured by the HOME inventory as well as the internal
factors that have been associated with developmental delay in children were also
considered. These included nutritional status (measured using BMI) and age of the
participants.
2.1 Introduction
Research shows that the factors influencing a child’s development and their ability to
perform their occupations are numerous including external or environmental factors, such
as: pre-birth and birth circumstances (18,56), culture (57), religion and physical, social and
cultural contexts of the child. All these factors may be influenced by SES(14). Internal
influencing factors include: the sex of the child (14,18), the child’s race (14,18,58), the
birth order of the child (17,18,59), the personal characteristics of the child (57), genetic
inheritance (14,56), biological differences (60), chronic illness (16), and physical
impairments, such as reduced vision or hearing ability (56,61). Development is affected by
an interplay of these external and internal factors, which work together towards a child’s
maturation (62). External and internal factors differ, as the external factors can be
influenced, and therefore changed or modified by amongst others, occupational
therapists, and are therefore the focus of this study.
Occupational therapists therefore need to understand the environmental impact on a
child’s occupational performance, as they often make recommendations to structure, alter,
or adapt the environment in order to optimise and support occupational performance
(2,63).
2.2. The environmental context
The effect of environmental factors and their influence on occupation are as complex as
they are numerous, with different environments helping as well as hindering satisfactory
occupational performance (2,64). The development of the brain is influenced by the
quality of environment, with animal studies showing that the early environment, including:
8
nutrition, presence of toxins, stress and limited stimulation and social interaction, can
affect brain structure and function, with lasting cognitive and emotional effects (16). Poor
environments resulting in deprivation, including the age when deprivation occurred,
duration and life history prior to deprivation, may also affect the way a child responds to
the environment (60). A disadvantaged unsupportive environment, either in the home or
outside of the home has been shown to exert a negative influence on child development.
It is not clear however if this effect is global or specific with different aspects of the
environment influencing different aspects of development (59).
2.2.1 Home environment
It has already been shown that from infancy the home environment begins to play a role in
influencing development (9,16). Specific environmental factors such as a mother’s
educational level, resources in the home, social (14,58) and emotional aspects of the
home environment (58), family size, household crowding and presence or absence of a
father (7,23), have all been linked with risk for delays in child development. Chronic stress
(14,66), a child’s behavioural repertoire (67), and life experiences (17,58), have also all
been shown to impact development. In addition, it was found by Mistry, Benner, Tan and
Kim (2009)(28), amongst a sample of 444 Chinese American adolescents, that a child’s
perception of family economic stress and financial constraints, which affect them directly,
result in emotional distress, depression and poor academic performance.
There is evidence that the home environments of families with a low SES are more likely
to be disorganised, with the parents being more stressed. They are thus less able to be
responsive and sensitive to their children, and to meet their needs (27), increasing the
likelihood of children being placed into residential child care facilities. The United Aid for
Azerbaijan (UAFA) report (2007)(68) found the primary reasons for children’s placement
in residential care, were low income or poverty, and broken family structures, when
parents were no longer able to provide for their children.
2.2.2 Effect of the home environment on development
With no perfect comparison groups in nature, reasons for differences between family-
reared children and children in residential child care cannot be definitively explained (39).
It has however been found that family care is preferable to other forms of care for many
children, even in disadvantaged circumstances, due to the presence of a consistent
caregiver, giving the child a perception of security and stability, and a positive identity.
This is supported by data gathered by the National Institute of Health and Human
Development (NIHHD) from a large sample children (n= 1916) in the United States of
9
America (USA), which showed that the best levels of positive care-giving were seen when
children were cared for in home based care settings, with small numbers of children, or
alone at home (69).
Vorria, Wolkind, Rutter, Pickles, and Hobsbaum (1998)(70) in their comparison of nine
and 11 year old children living in institutions or the community, attending the same state
primary schools, found the boys in child care had more emotional and behavioural
problems and were more hyperactive than the family reared boys. Similarly, a
comparison of family reared infants with institution-reared infants found a high rate of
disorganised attachment among the institution-raised infants (71). Thus it has been
concluded that even in poor circumstances in a family home, most young children will
have less physical under-development, reduced intellectual, social and behavioural
abilities, and emotional and attachment disorders, than those in residential institutional
care (72). The majority of research conducted on institutionalisation of children (including
paid child care) (19) supports the concept that environmental factors in institutional care
are linked to developmental delay (5,19,21,33,35,73–75). However, Giagazoglou,
Kouliousi, Sidiropoulou, and Fahantidou (2012) state that ongoing research is required “to
explore the institutional factors and their influence on children’s development, as it seems
that a combination of factors, rather than a single one, causes the developmental
differences observed between family and institutionally raised preschoolers” (57, p. 969).
2.2.3 The residential child care facility environment
Research confirms the existence of different forms of residential care for children (30).
These include conventional institutions in which children are cared for in a large group,
and family-type homes, in which children are cared for in small family groups. When
children enter residential child care later in life however, the environment prior to
admission and reason for admission has been important in determining their
developmental outcomes (39).
A number of factors have been described in relation to developmental delay, seen in
children living in residential child care. These include the culture and management of the
facility, the caregiver characteristics and the length of stay in the facility. Developmental
delays in children in residential care are mostly associated with the culture of institutions.
Most residential child care facilities care for large numbers of children, and the children
cared for may have to contend with poverty, poor health, poor nutrition, deficient care and
recurrent infections (76). In general, staff working in these facilities, have been reported to
prioritise the physical care of children, and the establishment of routines as their primary
concern. The insufficient focus on interaction with children (35) is probably related to the

10
lack of resources as a result of socio-economic problems related to residential care,
resulting in poorly trained and underpaid carers (75). There is however a large variation in
the type of care offered by different facilities, and research describing the institutions is
limited (73).
In 2003 it was reported that the facilities in Romania were characterised by a fixed daily
routine, a high ratio of children to caregivers, and a management led by medical
personnel (30). An extreme example of poor care, reported by Fisher, Ames, Chisholm,
and Savoie (1997)(38), in a Romanian residential child care facility, included severe
deprivation in children, who spent 20 out of 24 hours in their cots, rocking themselves, and
shifting their weight from foot to foot, while holding onto the cot rails. The walls were not
decorated and the children did not have their own toys. The caregiver-to-child ratio was
1:10 to 1:20, and the routine was rigid, with minimal interaction between caregivers and
children. It was found that these children had more eating problems, medical problems,
and stereotyped behaviour problems than children in institutions which provided better
care, and a more supportive environment. Similar findings emerged in a Russian study on
the characteristics of children and caregivers in residential child care facilities for young
children, where a lack of warm, caring, sensitive, reciprocal interaction between caregiver
and child were found. These factors were reported as most likely to produce higher rates
of social, emotional and mental limitations (73). The resultant social-emotional problems in
these children have been shown to lead to poor self-awareness (33), difficulty forming
secure relationships (21,35), attachment difficulties (77), indiscriminate friendliness (21),
and behavioural difficulties (73,78). Frank, Klass, Earls, and Eisenberg (1996)(74)
reported that living in a residential child care facility during early childhood, leads to a
greater chance that the children will develop into psychiatrically impaired, and
economically unproductive adults.
A study by Giese and Dawes (1999)(33), involving preschool children (n=15) in South
Africa, who had been placed in a residential child care facility after being removed from
circumstances where they were seen to be at risk, due to sexual and physical abuse and
neglect, found similar social-emotional problems, as well as communication problems in
the children. These receptive and expressive communication problems were attributed to
a lack of social interaction. Other problem areas assessed using the Grover
developmental Charts, included poor interaction with objects and fine motor co-ordination;
as well as body management and mobility. This is supported by other research where
gross and fine motor problems have been associated with institutional care (77), and
11
attributed to high child to caregiver ratios, which limit the physical experiences of young
children (33).
Thus living in residential care has been identified as one of many variables that are
associated with the coexistence of perceptual, social, intellectual, and emotional delay
due to deprivation (39). Little et al. (2005)(37) pointed out, that children living in
institutions in the USA tended to be children from low socio-economic backgrounds, which
in itself can result in delay (20), resulting in two environmental contexts affecting the
development of these children.
2.2.3.1 Culture of or type of residential child care facility
Sinclair and Gibbs (1998)(79, p. 114) reviewed the culture of 48 different homes and
found them to range from the ‘benign’ to the ‘malignant’. Due to the lack of perfect
comparisons (39), the high degree of variability between institutions, and the lack of
descriptions in published studies of the institutions in which the children live (73), it is
difficult to be specific about which factors, related to the culture within residential child
care facilities, contribute to developmental delays (39,80).
Studies that established the importance of the physical environment showed that more
stimulating care occurred in centres and child care homes that were spacious and well
equipped, with better organized space, and more varied materials, and in child care
homes that provided soft, comfortable areas for the children to carry out their daily
occupations (69).
It has also been found that the way the facilities were managed had an effect on the
impact that institutional living had on a child. Fewer developmental delays were evident
amongst children who were in an environment, where staff was allowed more autonomy
and the routine was less strict, when compared to residential child care facilities where
staff were forced to follow a strict routine. In environments with a strict routine, staff were
involved primarily with physical care, and issued instructions instead of talking to the
children through conversation (81). These findings were supported by the South African
study by Giese and Dawes (1999)(33), who suggested that the very regulated care limited
opportunities for the development of skills needed for appropriate social interaction,
participation in co-operative play in free play sessions and excursions.
The last two decades however, have seen a transition toward family-type living in
residential child care, based on studies which indicate family care is preferable. Devine
(2004)(82) reported that youth felt a sense of belonging in family type homes, that they
had never previously experienced in large dormitory type child care facilities. Sinclair and
12
Gibbs (1998)(79) found that some of the damaging effects of institutional living can be
diminished by children living in small homes, if staff are in agreement about aims and
methods of care, and managers having control of admissions. Taneja, Siriam, Beri,
Sreenivas, Aggarwal, and Kaur (2002)(76) also showed that the development of deprived
infants and toddlers in residential child care facilities improved enormously when their
surroundings become more stimulating.
These findings were supported by Wolff and Fesseha (1998)(83) who compared the
cognitive development and mental health of Eritrean war orphans, living in two
orphanages, in which the staff to child ratio was 1 to 17. They confirmed that the
management style in the child care facility, and the way in which staff interacted with the
children, correlated significantly with the cognitive outcomes and emotional state of both
the groups of orphans. In orphanage A, in a large town, younger children lived in a
dormitory while the older children, grouped according to chronological age, lived
separately. Orphanage B however was in the country near a large town, and the children
were mixed, so that the older children could help the younger ones with chores and
homework. Both groups attended school, mixing freely with children living in the local
community. Evaluations included a staff organisation questionnaire, child management
inventory, behavioural symptom questionnaire, projective picture and various cognitive
measures. It was suggested that the more autonomous style of child care in orphanage B
was more effective in addressing the emotional needs of the children. They also showed
that if personal relationships with an adult or a coherent community can be maintained,
then this could mitigate the adverse effects of the lack of a parent.
Another study showing that the effects of residential care are less if children are cared for
in a family type setting, was completed by Munoz-Hoyos, Augustin-Morales, Ruiz-Cosano,
Molina-Carballo, Fernández-García, and Galdó-Munoz, (2001)(36), who compared two
groups of children who were cared for in institutional settings in Spain. The first group
included 101 children in a large traditional institution (in 1986), and the second group
comprised 66 children (in 1996) in a smaller institution based on a family model. Growth
and nutrition, along with development, were found to be favourable in the second group
but these results were affected by a flawed methodology and interfering variables. The
groups were assessed ten years apart, and 84% of the second group had stayed in the
institution less than two years and no longer than three years, whereas only 37.62% of the
first group had stayed for less than two years, with the majority having stayed for two to
nine years. The children who had stayed longer (in the second group) probably had more
exposure to risk factors related to group living. The methodology was further affected by
13
observable changes in the ten year period acknowledged by the researchers, These
changes included an improved economic climate, greater nutritional capacity and
awareness, better health care, improved communication (i.e. via the media) and legal
reforms protecting minors, all of which may have affected the study results. Different tests
were also used for children aged over the age of eight years with the reason given that
children’s reasoning ability matured as they grew. This resulted in smaller groups, making
results less generalizable to larger populations.
However, other factors such as age of admission (40,41), family stability prior to
admission to the residential child care facility (37), and length of stay in the institution
(37,38), have also been shown to play a role in determining the effects of living in a
residential child care facility.
As the children in the current study had only female caregivers, a literature search was
conducted to establish if this could influence child development. Literature available was
lacking. Ball and Moselle (2007)(84) wrote a review on fathers’ contributions to children’s
well-being, which highlights the important role that a father plays in the development of a
child, with children from single parent families being at an increased risk of becoming
single parents themselves, and more likely to have children at a younger age. The
presence or absence of a father figure therefore needs to be considered when addressing
developmental difficulties.
2.2.3.2 Length of stay in a residential child care facility
Length of stay and the age of admission into a residential child care facility, are two
interrelated factors which have been shown to impact child development (38,40,41).
Rutter (1998)(40), found that children who were institutionalised for longer than six months
were delayed in intellectual and social development, as well as being smaller and less
well nourished. When Fisher et al (1997)(38) measured internalising behaviours
characterised by withdrawal, and externalising behaviours such as temper outbursts, and
destructive behaviour, they found these behaviours all correlated positively with the total
time the children had spent in a residential child care facility. Their participants were
children who had spent at least eight months in a Romanian orphanage offering poor
care, prior to adoption in Canada. Results also showed that the adopted children had
higher internalising scores and no significant differences on their externalising scores,
when compared to Canadian-born children (matched for sex and age) who were not
adopted. Flanagan (1999)(41) also showed that children admitted as infants and removed
from a residential child care facility after the age of four years, presented with more delays
than those removed earlier.
14
Later research however, found that length of stay does not impact developmental delay.
Van Ijzendoorn, Luijk, and Juffer (2008) (75) in their meta-analysis, showed that children
placed in care before 12 months, performed less well than their peers raised in families,
thus coming to the conclusion that it is the age of admission to a residential child care
facility, that played a role in developmental delay. They showed no association between
longer stays in residential child care facilities and intellectual delays, a finding which was
supported by Giagazoglou et al. in their study in 2012, which showed length of stay in a
residential child care facility was not a predictor of developmental delay (57).
Thus it would appear that culture of, or the type of residential child care facility, and age of
admission, must be considered when reviewing the studies on length of stay in residential
child care facilities, with many studies having shown that the quality of care in institutions
is as important as it is in families in the community (70). However, since every residential
child care facility is different and operates differently (80), the factors described above, as
well as the quality of care offered, must be considered for each unique environment.
2.2.3.3 Quality of care giving in a residential child care facility
Factors contributing to delay of children in residential care facilities have also been shown
to be related to the quality of care giving, and have been associated with the lack of a
nurturing relationship with a single caregiver (21,81), the lack of one-on-one stimulation,
and care-giving being inconsistent. A high child/caregiver ratio has been a consistent
factor, common in most institutions, when reporting poor quality care (19,30,33,76,77,81),
and has been linked to the socio-economic circumstances of the institution (43), and the
size of the group (69). Help from volunteers and professionals, has also been shown to be
lower in institutions with a low SES (43).
Vorria, Papaligoura, Dunn, Van Ijzendoorn, Steele, Kontopoulou, and Sarafidou,
(2003)(71) pointed out that children reared in residential settings often experienced
frequent changes of caregivers, and these caregivers had several infants to care for, and
knew that the children they cared for would eventually leave. These factors may have
reduced the caregivers’ emotional involvement with the children, resulting in the children
presenting with emotional and relationship problems. Roy, Rutter, and Pickles (2004)(78)
noted that attention deficit hyperactivity disorder was frequently associated with
experiences of multiple caregivers in residential child care facilities.
In a study by Vorria, Papaligoura, Sarafidou, Kopakaki, Dunn, Van Ijzendoorn, and
Kontopoulou, in 2006, it was found that children raised in residential care facilities were
less able to comprehend emotions, were less secure than children raised in a family
15
environment, and had more cognitive delay. They reported this was probably due to the
environment being under stimulating, and the limited opportunities the children had to
form relationships, due to low infant/caregiver interaction, and decreased social interaction
between the children and the caregivers. These children had also had adverse early
experiences, and were separated from the caregivers, who were their initial attachment
figures (21). However, research indicates that the effects of long-term separation from
initial attachment figures have most often been seen to reduce with time (37). Frequent
separations related to shift changes (a common practice in child care facilities), were more
of a concern, but were not as damaging among older school going children, as this would
be happening even among family reared children (21).
Specific factors that have been associated with positive care-giving (77), improved adult-
child interactions and more desirable child outcomes include the caregiver’s years of
experience, qualifications of staff, higher wages, group size with favourable adult/child
ratios (19,33), a child-centred approach, and the provision of care in safer and more
stimulating environments (76,77). It would appear however, that the type and
management style of the institution, and staff/child ratios override the caregiver
experience (69). Giese and Dawes (1999)(33) found poor staff/child ratios resulted in the
‘block treatment’ of children, where interactions between staff and children were very
regulative with communication limited to adult dominated exchanges, made up of short
responses or commands, which lasted an average of three seconds.
Wolff and Fesseha (1998) (83) concluded that it was possible to create satisfactory
humane social environments, for large numbers of children. The success of such efforts is
greatly enhanced, when the social environment is organised to guarantee close and
stable personal relationships between staff members and children, distributed
responsibilities for decisions affecting the children, and a style of child management that
reflects the individuality and autonomy of each child. Studies by Vorria et al. (2003)(71)
and Groark, Muhamadrahimov, Palmov, Nikiforova, and McCall (2005)(85) confirmed the
importance of caregiver sensitivity and individual attention and communication, leading to
better socio emotional and cognitive development in children in residential care. Little et
al. (2005)(37) found that the quality of the relationship with a consistent adult figure, in a
group living care facility, could counteract negative or damaging family relationships, even
when material resources were very limited, and child development experts were in short
supply, promoting development, and emotional well-being.

16
2.2.3.4 Factors protecting against developmental delay in the residential child care facility environment
Protective factors shown to reduce the negative impact of institutional living on
developmental delay included not only a good quality relationship with a consistent
caregiver, but also high IQ and low severity of presenting problems (37). A higher SES
can also be a protective factor, as the impact of residential care was found to be less
when the socioeconomic level of the community the child came from was considered.
The effects of SES per se have been shown to affect child development irrespective of
whether they live in residential care or at home. In a meta-analysis on the IQ of children in
children’s homes, Van IJzendoorn et al. (2008)(75), found those in countries with a low
Human Development Index showed smaller differences in intellectual development
between family and institution reared children, with the three lowest scoring countries
(Eritrea, Ethiopia and Kenya) showing no difference. Whetten, Osterman, Whetten,
Pence. O’Donnell, Messer, and Thielman (2009) (80) confirmed this in a study across the
poorer countries (Cambodia, Ethiopia, India, Kenya and Tanzania), when they assessed
1357 institution-living and 14 community-living orphans aged 6-12. Cognitive functioning,
emotion, behaviour, physical health, and growth were examined using survey analytic
techniques, and found in favour of institution-living. This is because resources in the
institution in terms of food, shelter and schooling were superior compared to the abject
poverty from which these children were removed.
In the occupational performance area of social participation, positive peer relationships
have been identified as a factor which can ameliorate the effects of institutional living
(37,86), and thus, overall, only one third of the 13 children in the ethnographic study by
Emond (2003)(86), appeared to respond negatively to institutional rearing. The children
were between the ages of 12 and 18 years and lived in two small residential child care
facilities in Scotland. In this qualitative study the author lived with the children for at least
six months, during which she observed that the group had their own values and strove for
power or attention from others. The group was a source of external support as they had
familiar shared experiences, which attributed to a ‘sense of collective isolation’ (p. 331),
resulting in the children ‘standing up for each other’ when threatened, and supporting one
another. They felt a ‘sense of belonging’ (p. 335), and relied on one another for ‘support
and advice’ (p. 335), in a way not possible from adults and staff. The age of the children
became important when older children gave advice and support to the younger children,
encouraging them not to make the same ‘mistakes’. Unacceptable behaviours were
challenged by the group. ‘Bullying’, for example was not tolerated and the group would
unite against a perpetrator. Isolation and withdrawal of support was often used as a way

17
of punishing peers. Although this study was small it provides some valuable insights into
the relationship dynamics when many children live together. Roy et al. (2004)(78) had
similar findings. They found that children in institutional care fared better in the area of
relationships and the social environment, relative to their peers in foster care. Both groups
(each comprising 19 children) were admitted before the age of one. Assessments of the
children were comprehensive as multiple assessment methods were used to evaluate the
social environment, including questionnaires for teachers and caregivers, interviews and
classroom observations. This was associated with a fifth of children living in the residential
child care facility showing a marked lack of selective attachment in relationships with their
caregivers, although this was evident only in the boys living in the institution. This may
have been due to a lack of male caregivers.
The National Scientific Council on the Developing Child (2012)(87) state that responsive
relationships in a child’s life are essential for a child’s well-being. These include
relationships within and outside the home, with positive peer relationships being a
protective factor and negative peer relationships characterised by bullying and sexual
abuse, said to be risk factors for some aspects of child development (37,88). Liew, Chen,
and Hughes (2010)(89), confirmed the need for positive relationship outside of the home,
stressing the importance of positive teacher-child relationships at school for the children
who were considered academically ‘at-risk’.
2.2.3.5 Caregiver characteristics
Brown, Dewey and Allen in 1998 outlined major factors that are likely to affect the
caregiver’s ability to provide care. These included:
— Caregiver education, knowledge and beliefs
— workload and time constraints
— health and nutritional status
— mental health, stress and self-confidence
— autonomy, control of resources and intra-household allocation
— social support from family members and community (90, p. 111).
Research has shown that characteristics of a caregiver play an important role in providing
a resourced and supportive home environment (17). Specific characteristics such as the
caregiver’s intelligence, education level (8,51,83), age, education in child rearing (8,51),
emotional state (17) and the way they structure and arrange the child’s experiences (7)
have all been shown to influence development to some degree. In a review published by
18
the World Health Organisation (WHO)(1999)(84, p. 2), they state that ‘Chronic stress,
associated with poverty and other environmental challenges, can also disrupt the capacity
of adults to give loving care.’
Certain factors related to caregiving have however been shown by past research to
mitigate the effects of low SES. These include parental educational level and home
support variables such as literacy resources in the home, and discussion of school
matters, which resulted in better reading achievement in homes with lower SES (15). The
review published by the WHO (1999)(84, p. 3) states that ‘a strong caring relationship can
protect a young child from the effects of deprivation and disadvantage. The caring
relationship is the strongest explanation for why some children who grow up under
wretched conditions nonetheless grow well, are healthy, are able to be productive in
school and work, and have good relationships with other people’.
This is supported by literature, which shows evidence of parental involvement in even low
SES groups, decreasing disparities in development, particularly in the area of literacy. A
study focusing on low income and minority groups, by Chang, Park, Singh, and Sung
(2009)(88), discovered that parents that attended parenting courses and support
meetings, provided more language and mental stimulation at home. An earlier study by
Conners, Edwards, and Grant (2006)(86) found that participants of six week parenting
programmes (Parenting the Strong-Willed Child for ages 2-8) demonstrated a change in
parenting behaviours, with related improvements in their children’s behaviour, as well as
experiencing reduced stress levels.
2.3 Socioeconomic status (SES)
Many researchers have used the terms SES and social class interchangeably, without
explanation, when referring to social and economic characteristics of individuals (92). The
American Psychological Association note that SES is relevant to all realms of behavioural
and social science, including research, practice, education, and advocacy, and that SES
can be explained as the ‘class’ or ‘social standing’, of a group or individual. Financial
status has also been used as a measure of SES (29). However, low income alone is not
sufficient to impact child development, although families with low income tend to live in
lower quality home environments, than families with a higher income (27).
There is currently no standard method of measuring SES (93), although in a meta-analytic
review of research in 2005 it was said to be most often measured by combining education,
income and occupation (92). A later meta-analysis by Letourneau, Duffet- Leger, Levac,
Watson and Young-Morris (2013)(20) extended the factors to be considered when
19
examining SES and child development and used parental education level, parental marital
status, parental employment status, parental occupation prestige, and household income
as defining factors (20). They did not include home resources, a factor that is not used as
often, although researchers have shown that it is a significant indicator in terms of child
development (14).
In Mauritius the average monthly income in 2011 was lower for women than for men, (94).
Statistics for Mauritius show that in 2010 the lowest average wage for non-government
employees was 7436 MUR for those working in the ‘wearing apparel’ sector, servants in
hotels earned 8253 MUR, primary education teachers 22700 MUR and carpenters 14866
MUR. Higher wages were earned by those in the ‘Financial Intermediation’ and in the
‘Transport, storage and Communications’ sectors with the highest wage being 48
194MUR (95, p. 133), with the average wage earned in 2010 being 18 268 MUR and
2011 being 20 050 MUR (96).
2.3.1 Effects of socioeconomic status (SES) on child development
Internationally low SES of individual families is generally accepted as negatively affecting
the development and well-being of children and adolescents (14,20). Community-level
SES must also be considered, due to evidence that the area of residence is associated
with the health, behaviour, and achievement of children in the area, even when individual-
level income and education are accounted for (97). Letourneau et al. (2013)(20)state that
SES can have variable influences on child and adolescent development at different life
stages, and through different routes, some of which include social support, parental
resources, and parental mental health.
Other research has also indicated problems unrelated to relationships, in children who
come from under resourced low SES groups, and low income home environments. They
were found to be more likely to have poor adaptation skills, behaviour problems, higher
school failure rates, anxiety, depression, poor language development as well as cognitive
delay (29).
2.3.2 Effects of socioeconomic status (SES) on childhood nutrition
In addition to the effects of the mother’s health on the development of the child in the post
natal period, the child’s nutrition must become a matter of concern, due to lack of
resources in households in lower SES groups. In the 1990’s in Russian residential child
care facilities, poor nutrition was listed as one of the contributors to later developmental
deficits (73). A Kenyan study published in 2013 used BMI to measure the nutritional status
of three groups of children (n = 1337 in residential care, 1425 in randomly selected

20
households, and 100 street youth), and compared the results to the WHO criteria. The
children living on the street, as well as those in residential child care were found to be less
well nourished than those in the institutions (98).
Body Mass index was used in this study as an indicator of nutritional status. It was used
by Munoz-Hoyos et al (2001)(36) as one of the measures of growth and nutrition in
residential child care facilities when comparing two different facilities. Due to past
research using BMI to measure nutritional status (36, 93,99,100), and the existence of the
WHO growth charts for comparison purposes, it was decided that BMI would be used for
this study to measure nutritional status. BMI was calculated using weight (kg) divided by
height (cm2) and compared to the WHO growth standards (60). Research has found that
SES is the best predictor of body mass index (BMI) followed by physical activity and
dietary habit, in indicating a child’s nutritional status. Studies in developed countries have
shown a consistently strong negative association between SES and BMI, with the
opposite usually being seen in some developing countries (93). However, in their study in
Mauritius investigating the effect of SES on obesity, Fokeena and Jeewon (2012)(93)
showed a significant negative relationship between SES and BMI, in this country with a
medium human development index (HDI) ranking (9). The mean BMI for the low SES
participants was higher than that of those in the high SES group, with the percentage of
underweight, overweight, and obese participants being higher among the low SES group.
They found a significant difference in the mean total dietary guideline scores between the
low and high SES groups. The authors indicated a higher consumption of more refined
grains and added fats in lower SES groups while higher income groups consume whole
grains, lean meats, fish, low-fat dairy products, and fresh fruit and vegetables. Cost was
the reason given as the cost of wholegrain cereals and high fat protein is almost twice that
of refined cereals and low fat protein. Cost per calorie was five times more per weight of
vegetables, compared to fatty and sweetened foods. This ‘calorie-cost relationship’
associated with the cost of food, may account for the high calorie intake by low SES
groups, with more disposable income in emerging countries, than those in under
developed countries. This has resulted in malnutrition related to paediatric obesity
becoming no longer only a problem in developed countries, but is becoming more
prevalent in the urban areas of some developing countries (93).
Of particular relevance to this study is data for Mauritius (n = 840), from 2006, published
in 2012, which indicates the island is currently in a ‘nutritional transition’, with both a high
incidence of overweight and underweight children aged 9–10 years. Of the findings, it was
21
reported that almost 20% of the children were overweight, 5.0% were obese, and 12.7%
of the children were underweight (100).
The impact of nutritional status on motor and mental development was confirmed by
Walker, Wachs, Meeks, Lozoff, Wasserman, Pollitt and Carter (2007)(101) in their
literature review, which reported that randomised trials in which food supplements were
given to improve children’s nutritional status and development resulted in benefits to
motor and mental development, as well as cognitive ability. This is supported by a study
by Alaimo, Olson, and Frongilo (2001)(102, p. 45) on the impact of food insufficiency, on
5349 American school-aged children’s cognitive, academic and psychosocial
development. ‘Food insufficiency’ was defined as ‘an inadequate amount of food intake
due to a lack of money or resources’. They found that children who did not receive an
adequate diet, had significantly lower arithmetic scores, and were more likely to have
repeated a grade, or to have been suspended from school. They were also more likely to
have seen a psychologist and have difficulty getting along with other children,
demonstrating the negative effect of inadequate nutrition linked to SES, on child
development (102).
Wachs and McCabe (2001)(103), in their study conducted in Egypt, investigating children
of school going age, included maternal education into the dynamic. They found that
maternal education level is positively linked with family socioeconomic resources, and
diet, indicating the important interplay of these factors in the child’s environment. The
relationship between maternal education and higher SES was supported by Forns, Julvez,
García-Esteban, Guxens, Ferrer, Grellier, Vrijheid, and Sunyer, (2012)(104), who found a
positive trend between maternal education, and occupational social class.
2.4 Effects of the environmental context and socioeconomic status (SES) on the education occupational performance area
Literacy along with language skills were found in a meta-analysis by Letourneau et al.
(2013)(20), to increase or decrease with the level of family SES, and a low literacy
environment, often associated with low SES, has been shown to negatively impact a
child’s pre-academic skills. The gap between the reading levels of the low and high SES
students, were found to increase with time (13).
Children’s grade, minority status, and school location, were found to be moderators in the
SES and academic achievement relationship (92). The relationship between low and high
SES, and academic achievement, in the occupational performance area of education, has
been shown, with a gradual decrease in academic achievement with age in children from

22
low SES groups. This relationship has been referred to as the socioeconomic gradient or
gap, as it suggests a gap between children from high and low SES families. This has been
shown to have permanent effects, which tend to worsen as children get older (105), with
underachievement perpetuating the low-SES status of the community.
Aikens and Barbarin, (2008)(13) stated that early interventions are therefore required to
assist in reducing poor academic performance, and other risk factors associated with low
SES. This includes addressing the quality of schooling, which has also has been shown to
influence academic outcomes. They also stated that many schools in low-SES
communities are deprived in terms of resources, impacting learner’s academic outcomes.
Morgan, Farkas, Hillemeier, and Maczuga, (2009)(106) point out that other family related
factors, like the mother’s SES, can be related to her child’s inattention, disinterest, and
lack of cooperation in school. Children from lower SES households were found to be
twice as likely as those from high-SES households, to exhibit learning-related behaviour
problems and develop academic skills more slowly. Despite the evidence demonstrating
the negative effect of low SES, family income, education level, or cultural background,
these factors have been shown to be less important than an environment that promotes
learning in influencing achievement at school (107). Family participation in education was
shown to be twice as predictive of academic learning, as family SES. This was true even
in the absence of educational toys and other home resources, such as books and
computers, which promote ongoing cognitive growth (108). Thus, multiple factors related
to SES influence a child’s performance in education, and specific aspects of development
need to be considered by professionals when dealing with children from lower SES
groups who come from poor environments.
Studies have reported an association between problems in all areas of cognition,
impacting a child’s ability to learn, and children living in child care institutions (33,73).
Deprivation in terms of access to material objects and adult relationships, has been shown
to be related to poor stimulation in the environment, and consequent cognitive delay (30).
Taneja et al. (2002)(76), found that a lack of access to toys and play materials was
associated with cognitive delay, due to poor stimulation with Rutter (1998)(40) showing
that prolonged deprivation could result in further deficits in cognitive and perceptual
function. Giagazoglou et al. (2007)(57) assessed children using the Griffiths Test No II
(roman numerals) and attributed the differences they found in fine motor skill performance
between 3 groups of pre-school children, to a lack of access to appropriate play materials
for the training of these skills. Children brought up in residential care, when compared to
those brought up in families, performed more poorly on scales of the Griffiths’ test, with
23
‘‘low’’ scores for group institutional homes, and ‘‘average’’ scores for family type villages.
Family raised children achieved ‘‘high average’’ scores. This study however had a small
sample size (n=96).
In the occupational performance area of education, children in residential care have been
found to have lower performance than children raised in families. Educational problems at
school have been associated with lower intelligence quotients, and with delays in adaptive
cognitive development. It is not clear however if this is the effect of institutionalisation, or
because children in residential care usually come from deprived backgrounds, and
families with problems (109). A possible explanation for difficulties experienced could be
sensory processing problems, which were found by Cermak and Daunhauer (1997) to be
more prevalent amongst Romanian children who had been institutionalised and those who
had not (110).
On the other hand, Ringle, Ingram, and Thompson (2010)(111) showed that the longer
children from deprived home situations were in residential child care, the more likely they
were to complete their schooling. This study was however conducted in the USA in a
relatively well-resourced facility, that implemented a programme based on family-type
living, with a strong emphasis on education, and where staff were specifically geared to
assisting the children. These findings were supported by Little et al. (2005)(37), who found
that once children living in an institution start to attend school less delay is observed, and
Thompson and Smith (1996)(112), who found that the academic achievement of children
living in institutions improved when they participated in a specialised programme.
Occupational therapists involved in education facilitation and remediation, focus on
function at school; and remediation of performance skills that underlie the academic
abilities (113) of reading, writing and mathematics. These skills include motor and sensory
perceptual skills, one of which is visual motor integration (VMI)(112). The greatest benefit
is achieved through the early identification and remediation of problems (62).
2.4.1 The effects of environmental contexts on Visual Motor Integration
The term visual-motor integration is used when referring to the interaction of visual skills,
visual-perceptual skills, and motor skills (5). It represents the ability to combine the visual
image of shapes with the matching motor output, in an activity such as handwriting (6).
Problems with visual motor integration have therefore been associated with poor
academic performance (6) and may be caused by ‘underlying visual-cognitive deficits,
including visual discrimination, poor fine motor ability’, or inability to integrate these
various functions (50, p. 427).
24
Visual-motor integration scores have been shown to relate to a child’s academic
achievement in the early school years (114). This is supported by Kulp (1999)(23) (n =
191) who found a significant relationship between scores of reading, spelling and math,
and Beery VMI scores amongst 5 to 9 year old children. While a small study (n = 37), by
Barnhardt et al. (2005)(115) found VMI impacted spatial organisation of written work in
children in the 8 to 13 year age group. Occupational therapists are often involved in aiding
with handwriting difficulties (116). Thomassen and Teulings (1983) (117) discuss
handwriting as a complex visual-motor task resulting in the development of the skill. It
incorporates a range of coordinated movements with visual monitoring. Tseng
(1991)(118), when investigating the relationship of certain perceptual motor measures to
hand writing legibility in children, found that the Beery VMI was the best predictor of hand
writing, and accounted for a 30% variance on scores for legibility. Daly (2003)(119) came
to a similar conclusion. He found that the ability to copy letters was related to visual-motor
integration abilities. Tseng and Chow’s article, published in 2000 stresses the importance
of proficiency at the complex skill of handwriting for children and adolescents, in order to
meet the requirements of the teacher and the curriculum (118). ‘Since it is a very obvious
area of need to the teacher and is easy to describe, it is listed in about 95% of cases as
the reason for referral. Closer observation of the children who are referred indicates,
however, that they also have difficulty managing scissors, handling a ruler, doing up their
zippers and buttons, and erasing. Most of these children also have trouble participating in
gym class, getting ready for recess, playing games in the schoolyard or participating in
structured and unstructured sports and leisure activities’ (120, p. 1).
The environmental context has been found to influence VMI (113,113,121), and the early
detection of environmental problems affecting VMI, has therefore been suggested, as a
means of improving VMI deficiencies. The results of a study in South Africa by Van
Heerden, De Kock, Larsen, Knopjes, Singh and Franzsen (2011)(43), showed that
children in residential child care facilities of middle SES had significantly higher scores on
the Beery VMI (p<0.05) than those in institutions of low SES. Therefore the SES context
of those in residential child care facilities also appears to be related to the VMI scores.
The lowest scores obtained were for the Visual Perception (VP) supplemental test,
whereas 98% of the participants scored average for the Motor Co-ordination (MC)
supplemental test. This indicates that in South Africa there is little effect of living in a
residential child care facility on fine motor function.
When examining the effects of the environment, the resources within the environment, as
well as the relationships, support and care received, were all influencing factors. Access
25
to training for staff, and availability of resources, such as toys, play space, family and
extended family visits, as well as the availability of extramural and sport facilities, may
also have had an effect on the Beery VMI scores of participants. The researches
remarked that certain types of activities offered to the children, (such as sport, excursions
and holidays) were somewhat dependent on the financial resources of the residential child
care facility, supporting the link between SES and optimal child development (43).
Frey and Pinelli (1991)(122), and Bowman and Wallace (1990)(123) had shown a
correlation between the development of VMI and SES, with children from a higher SES
scoring higher on tests of VMI. Beery and Beery (2006) also indicated in the development
of the Beery VMI test, that there was a statistically significant difference in the scores for
children whose families had annual incomes above and below the poverty line. However
in 1997, only about 3% of score variance could be attributed to income level (51). More
recently, a study in 2011 in Turkey, a country with a similar HDI ranking to Mauritius,
found children with low socio-economic status scored significantly lower on the Beery VMI
test (p<.01) and motor co-ordination (MC) supplemental test (p<.05), but that there was no
significant difference for the scores of the visual perceptual (VP) supplemental test (95).
It is therefore clear that SES and the entire environmental context must be considered
together, when exploring and addressing the influences on child development.
2.5 Summary
The factors affecting child development are numerous and it is therefore often difficult to
ascertain which factor/s is/are resulting in adverse developmental outcomes. This
literature review focuses on environmental factors, including SES, and nutritional status,
which are related to one another, and have all been shown to impact child development.
The impact of institutional living on child development is also addressed, as it has been
shown to impact all developmental domains, including visual-motor integration. Children
who are admitted into residential child care facilities are most often from low income
families, so are therefore subjected to a double burden of low SES and residential care
living. When considering environmental influences, it is as important to consider the
environment of the home or institution, as well as the school and other external
environmental influences, as the quality of schooling can exacerbate or mitigate an
unsupportive home environment. Relationships with peers and teachers have also been
shown to play an important role in helping children cope in difficult circumstances.
When living in a care facility is the only option it is important to consider what factors help
or hinder a child’s growth and development. The quality of care, including; caregiver
26
characteristics, child to caregiver ratio, availability of resources and consistency of
relationships with adults, have been shown to affect the degree to which children are
affected by their circumstances.
As opposed to facilities caring for large numbers of children, family style living has
become more popular in the last century, as it has become evident that children cope
better in environments which are more able to cater for their individual needs. The age of
admission as well as length of stay in the facility have both been shown to influence the
effect the facility has on the child. In some cases children have been seen to benefit from
residential care, although only in more specialist units with focused intervention.
VMI has been associated with academic performance, due to underlying visual-cognitive
deficits, and has been shown to be influenced by the environmental context of a child.
Performance in VMI has therefore been chosen as the measurement of environmental
impact for this study.

27
CHAPTER 3 RESEARCH METHODOLOGY
3.1 Research design
A descriptive quantitative, cross-sectional and correlation research design was used for
each part of this study. A cross sectional study does not require follow up, so there were
no limitations in relation to loss of follow up in this study. The design was useful at
identifying associations, and in this study the correlation between the supportiveness of
the environment, the VMI abilities, and other demographic factors affecting development
in the research groups were established. The descriptive research design was further a
suitable research design, as there was no need for manipulation of the variables and was
used for both parts of the study
Part 1
The cross-sectional design was used to determine the factors associated with
development and to determine the validity of the supportiveness of the environment, and
the visual motor integration (VMI) abilities of children living in the community in Mauritius
The effect of environmental and demographic factors, which could influence
developmental outcomes, was also measured and analysed.
Part 2
The cross-sectional design was used to determine the factors associated with
development and to determine the supportiveness of the environment, and the visual
motor integration (VMI) abilities of children from low socioeconomic circumstances, living
in a residential child care facility in Mauritius. The effect of environmental and
demographic factors, which could influence developmental outcomes, was also measured
and analysed.
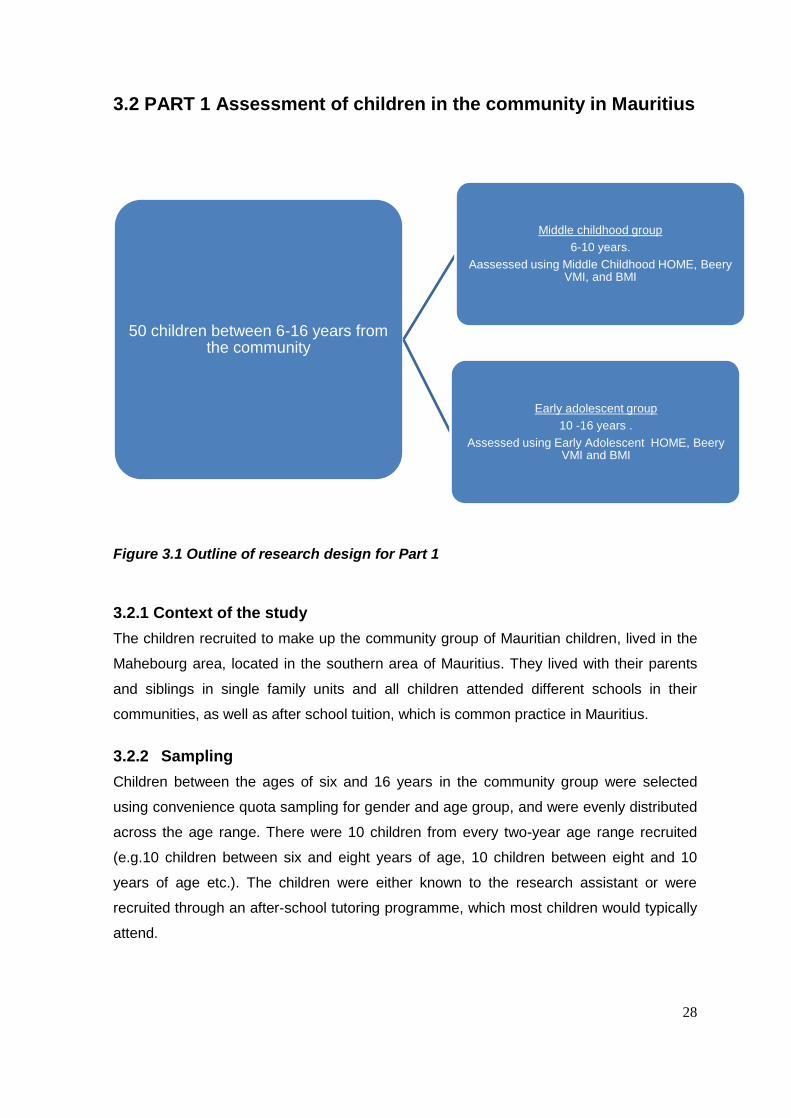
28
3.2 PART 1 Assessment of children in the community in Mauritius
Figure 3.1 Outline of research design for Part 1
3.2.1 Context of the study
The children recruited to make up the community group of Mauritian children, lived in the
Mahebourg area, located in the southern area of Mauritius. They lived with their parents
and siblings in single family units and all children attended different schools in their
communities, as well as after school tuition, which is common practice in Mauritius.
3.2.2 Sampling
Children between the ages of six and 16 years in the community group were selected
using convenience quota sampling for gender and age group, and were evenly distributed
across the age range. There were 10 children from every two-year age range recruited
(e.g.10 children between six and eight years of age, 10 children between eight and 10
years of age etc.). The children were either known to the research assistant or were
recruited through an after-school tutoring programme, which most children would typically
attend.
50 children between 6-16 years from the community
Middle childhood group
6-10 years.
Aassessed using Middle Childhood HOME, Beery VMI, and BMI
Early adolescent group
10 -16 years .
Assessed using Early Adolescent HOME, Beery VMI and BMI
29
3.2.2.1 Inclusion criteria
Any child between the ages of six and 16 years
with no known illness or disability
who was willing to participate
whose parents/legal guardian gave informed consent.
3.2.2.2 Exclusion criteria
The HOME inventory has a separate and different version, designed for children with
disabilities (124). As only the standard HOME inventory was used, children with
disabilities, identified by a medical practitioner, were excluded. Research confirms that
certain conditions may affect development so the following resulted in exclusion:
a sight or hearing impairment (56,61),
severely delayed cognitive development (61),
chronic illness (16),
disability such as cerebral palsy (125),
genetic conditions (e.g. Down’s Syndrome) (56),
illness at the time of the study (16),
3.2.2.3 Sample size
A sample size of 50 children, between the ages of six and 16 years, from the community,
were recruited. At least 50 children were needed to ensure that sampling error is limited to
a probability of 0.05 according to Cochrane’s formula, at the power of 90%.
3.2.2.4 Recruitment of community participants
The participants were recruited by a research assistant who assisted with the data
collection and lived in the community. He telephoned family and friends, and contacted an
after school tutoring centre, who helped to identify children in the six to 16 year age group.
It is quite typical for Mauritian children to attend after school tuition and is not only for
children who are having difficulties (126).
The research procedure was similar for both Part1 and Part 2 of the study and is
described in section 3.4
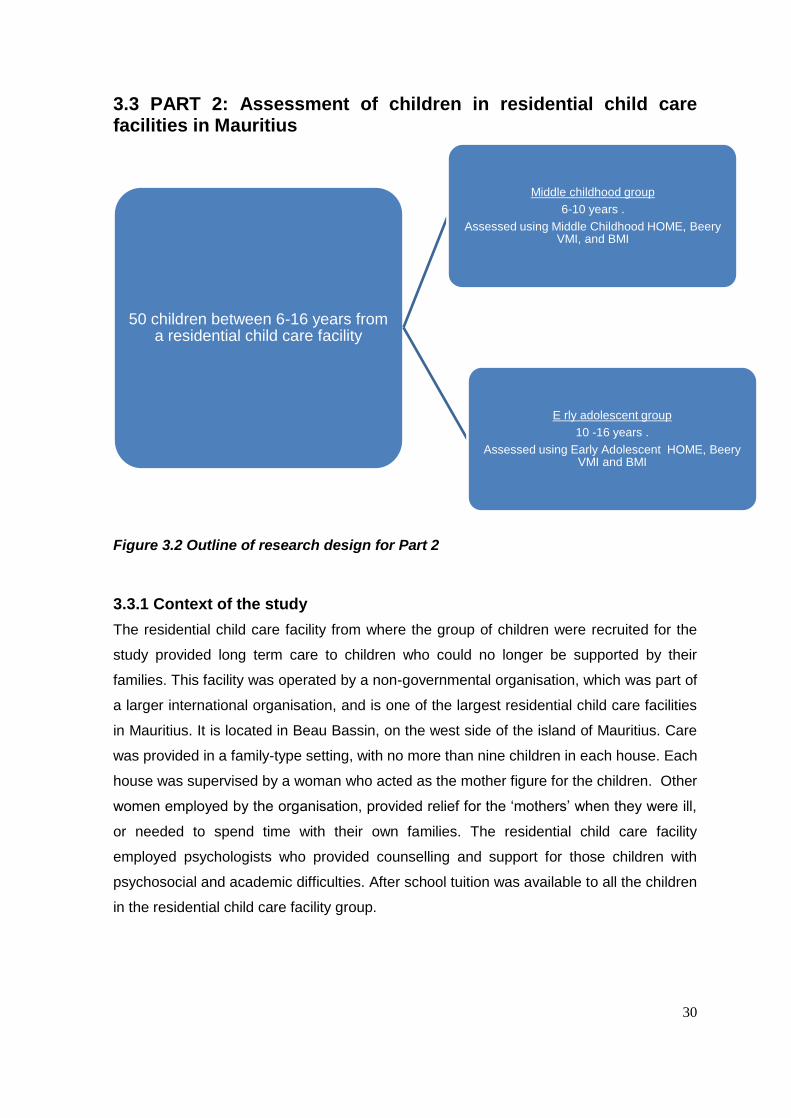
30
3.3 PART 2: Assessment of children in residential child care facilities in Mauritius
Figure 3.2 Outline of research design for Part 2
3.3.1 Context of the study
The residential child care facility from where the group of children were recruited for the
study provided long term care to children who could no longer be supported by their
families. This facility was operated by a non-governmental organisation, which was part of
a larger international organisation, and is one of the largest residential child care facilities
in Mauritius. It is located in Beau Bassin, on the west side of the island of Mauritius. Care
was provided in a family-type setting, with no more than nine children in each house. Each
house was supervised by a woman who acted as the mother figure for the children. Other
women employed by the organisation, provided relief for the ‘mothers’ when they were ill,
or needed to spend time with their own families. The residential child care facility
employed psychologists who provided counselling and support for those children with
psychosocial and academic difficulties. After school tuition was available to all the children
in the residential child care facility group.
50 children between 6-16 years from a residential child care facility
Middle childhood group
6-10 years .
Assessed using Middle Childhood HOME, Beery VMI, and BMI
E rly adolescent group
10 -16 years .
Assessed using Early Adolescent HOME, Beery VMI and BMI
31
3.3.2 Sampling
Children between the ages of six and 16 years were randomly selected, using a web-
based random number generator, from all the children living in the residential child care
facility, in the designated age group. This was done to ensure a good representation of
the residential child care facility population. The children were therefore not evenly
distributed across the age range or gender.
3.3.2.1 Inclusion and exclusion criteria
The criteria for inclusion and exclusion were the same as for the community group.
3.3.2.2 Sample size
A sample size of 50 children was selected to match the number of participants in Part 1 of
the study.
3.3.2.3 Recruitment of participants
The residential child care facility used in the study was selected as it was the largest on
the island. The other facilities were smaller with insufficient numbers in the school-going
age bracket. Permission to involve the specific children in the residential child care facility
was granted by the assistant operations manager of the facility (Appendix A).
Children were randomly selected from those between the ages of six to 16 years, had
been in the facility for more than 12 months and had stayed for a minimum of 12 months.
Each child provided verbal assent (Appendix B) for participation in the study. Information
sheets were given to the caregivers in the residential child care facility for the purposes of
the HOME administration, and signed consent was obtained from each (Appendix C2).
3.4 Research methods
The measurement techniques, research procedure, data management and analysis and
ethical considerations were similar for both Part 1 and part 2 of the study and therefore
are not presented separately.
3.4.1 Measurement techniques
Demographic information concerning the child and parent/caregiver participants was
collected. This included information on the child’s weight and height, so that their BMI
could be determined. The Home Observation for Measurement of the Environment
inventory (HOME) was used to measure the supportiveness of the environment, and the
Beery-Buktenica Developmental Test of Visual-Motor Integration (Beery VMI)(51) was
used to measure VMI, visual perception and motor co-ordination.
32
3.4.1.1 Demographic questionnaire (Appendix D)
Demographic information on the child, required on the Beery VMI and HOME forms was
collected, as well as additional information about the child, caregivers and the institution,
on a questionnaire designed by the researcher. Information obtained about the children
included age and gender as well as family ethnicity, language spoken, and school grade.
Past research has used other indicators of SES including occupation prestige, occupation
status (20) and home resources (14), but without a standard measure of SES (93) and to
eliminate subjectivity and simplify administration, only income and parent/caregiver
education were documented. Additional information collected about the caregivers in Part
2 included education (if any) in child rearing and the SES of the home (16,17,58), which
was determined by caregiver’s education and income. Additional information related to
SES obtained about the children included family composition and child caregiver ratio.
The HOME inventory does address home resources, so this information could contribute
to a measure of SES. Additional information collected on the child participants in Part 2,
included: date of admission to institution and age of admission.
Although it had been planned to include aspects like prior place of residence, medical
history, time spent in hospital (if any), history of therapy received, significant life
experiences, the weight at birth (18,58), and gestational age at birth, this information was
not available for most of the children in the residential child care facility, so was not
included in the data analysis.
3.4.1.2 The Beery-Buktenica Developmental Test of Visual-Motor Integration, 5th Edition (Beery VMI) (Appendix E, E1)
The Beery VMI is a norm-referenced test, which measures an individual’s ability to
integrate their visual and motor abilities. Various publications of the Beery VMI have been
released between 1967 and 2007. It provides a screen for children aged two to 18,
allowing for the early detection of problems of visual-motor integration. The authors state
that the newest (5th) edition is the best visual-motor screening battery available for
preschool to adult ages, due to its low administration cost and high validity (51).
The test includes a short and a full form and takes 10 to 15 minutes to administer. The full
form (used in this study) consists of 30 items and can be used with children from age two
through to 18 years.. In addition there are two standardised supplemental tests: the Beery
VMI Visual Perception test, and the Beery VMI Motor co-ordination test, which use the
same geometric forms as the Beery VMI. The purpose of the additional tests is to provide
33
separate and more specific information about visual and motor performance. The test can
be administered to individual children or as a group (51).
The Beery VMI requires the child to copy a series of geometric forms. Either a “1” or a “0”
are awarded for the forms copied depending on accuracy, and scoring is stopped when
three forms are copied incorrectly. There is a time limit set for the two supplemental tests.
Raw scores are derived from the total number of forms drawn, completed or identified
correctly. Raw scores are converted to standard scores, scaled scores, percentiles, and z
scores.
Norms for the current version of the Beery VMI were derived from a study involving 2512
children in the United States of America (USA), from a range of backgrounds. Information
related to validity and reliability has largely been derived from earlier studies on earlier
versions of the Beery VMI. Internal consistency results were obtained using the 3rd
edition. Despite this, it is felt that these reliability analyses are within an appropriate range.
The overall test-retest reliability is in the mid-to-high 80’s and mean inter-rater reliabilities
range from 0,90 to 0,92 for the VMI and its subtests (51).
The Beery VMI has been used frequently in clinical practice to assess visual analysis and
visual motor integration skills (5,51). It has also been used in research to evaluate the
effectiveness of interventions (127), and to measure the extent to which visual and motor
abilities can be integrated (128). The Beery VMI has been shown to relate to a child’s
academic achievement in the early school years (23). Sanghavi and Kelkar (2005) found
that when comparing raw scores and age equivalents on the Beery VMI of Indian children,
to the scores provided in the Beery VMI manual, Indian children achieved mean raw
scores at a younger age. This was said to indicate that the test needs to be standardized
on a larger Indian population. These results need to be considered when analysing the
results of the Beery VMI (7).
3.4.1.3 Home Observation for Measurement of the Environment inventory (HOME) (Appendix F)
The HOME inventory was used in addition to demographic information to determine the
supportiveness of the environment for child The HOME measures the quality and quantity
of stimulation, as well as the support given to the child in their home environment
(129,130), and has been used in countless studies on child development (130,131), for
more than 30 years (129). The HOME has also been used to measure changes in a
child’s environment, as well as the quality of parenting, as a result of intervention
programmes (129,131). Bryant (1985)(132) felt that the HOME was the most highly
regarded measure of the child’s home environment, and no new assessments for this age
34
group have been developed. Scores from the HOME Inventory, have been shown to be
related to cognitive development (17,73,133) validating that the instrument measures
factors in homes, which promote learning and thinking (129). In addition, HOME scores of
children from low-income families have been shown to be significantly lower than those
from children belonging to higher income families. This confirms the impact of SES, and
illustrates that the HOME is sensitive to SES (129).
The CC-HOME designed to be used in child care facilities is only available from three to
six years (124,130), and therefore the HOME which is designed for use in the home of
children from six to 16 years, was used for both Part 1 and Part 2 of the study.
This was possible as the main difference between the CC-HOME and the HOME is that
the word ‘parent’ has been changed to ‘caregiver’ (124). This was not considered enough
of a change to influence the assessment findings, if the HOME was used in the child care
situation, and so ‘caregiver’ was simply substituted for ‘parent’ at the time of
administration in the residential child care facility.
The Middle Childhood (MC) HOME is designed for use between ages six and 10 years. It
contains 59 items clustered into eight subscales: Parental Responsivity, Physical
Environment, Learning Materials, Active Stimulation, Encouraging Maturity, Emotional
Climate, Parental Involvement, and Family Participation (Appendix F1).
The Early Adolescent (EA) HOME is designed for use from ages 10 to 15 years (129). It
contains 60 items clustered into seven subscales: Physical Environment, Learning
Materials, Modeling, Instructional Activities, Regulatory Activities, Variety of Experience,
and Acceptance & Responsivity (Appendix F2).
Credit for the majority of the items in a subscale usually indicates that the family is
providing an adequate support for development, in that particular area; whereas credit for
only a few items in a subscale, suggests that that aspect of the home environment is not
adequate for development.
The information for this assessment was obtained through interviewing the
parent/caregiver or parent, with the child present. The score distributions on subscales are
skewed to the left, as extremely low scores are not well represented in the standardisation
sample. Thus, when interpreting the scores on the HOME, a subscale score 2-3 points
below the median, should raise concerns. Concerns are also raised if total scores are
more than 7-8 points below the median (124).
The HOME focuses on a particular child and the quality and quantity of environmental
support afforded to him/her, in terms of the influence of objects, events and transactions
35
related to the family child care home setting, and can be administered in a relatively short
visit to the informal care environment. The binary scale used by the HOME limits the
depth of information obtained, e.g. the scale asks if the child eats at least one meal per
day, on most days, with mother and father but does not cover how many times the child
does this in a day. The scale can therefore not be used for making well- informed
judgements or decisions.
The mean, SD and median for each scale are provided in the HOME manual (Appendix
F3, F4)(124), and they were used as a comparison in this study. The total score for the
HOME indicates the quality of the home environment. The higher the total HOME score
the more enriched the home environment is likely to be, and scores in the lower quarter of
the range, indicates a risk to some aspect of the child’s development (131). Data for the
norming of the MC HOME was compiled from 124 HOME assessments conducted in the
USA, between 1982 and 1983whilst data for the norming of the EA HOME was compiled
from 331 HOME assessments, conducted in the USA, between 1995 and 1996 (124).
3.4.1.4 Assessment of nutrition – Body Mass Index (BMI) (Appendix D)
Anthropometric indicators based on body measurements (height or weight related to age
and sex) are often used to measure nutritional status. Weight-for-height (W/H) measures
body weight relative to height and can be used to measure current nutritional status,
aiding in screening for at risk children, as well as measuring short term changes in
nutritional status (134). BMI was calculated using weight (kg) divided by height (m2), and
compared to the WHO growth standards (10). Height was measured with a ruler,
specifically designed for this purpose. The child was asked to remove his/her shoes, or
hair accessories, which would affect the measurement. The length of the ruler was placed
against the wall, and the flat sliding section (90 degrees to the ruler) was placed on top of
the child’s head. Height was recorded in centimetres, to one decimal place. The children
were weighed on a portable digital bathroom scale, after removing their shoes and any
heavy clothing. Weight was recorded in kilograms, to one decimal place.
The BMI was scored according to the WHO growth reference (2007), a reconstruction of
the 1977 National Center for Health Statistics (NCHS)/WHO). This uses the original
NCHS data along with data from the WHO child growth standards for under-fives. The
growth standards are presented as z-scores with ‘cut-offs’ of – 3 standard deviations to
identify children with severe acute malnutrition, and -2 to record stunting(134). Some
reasons given for this cut off were that children below this cut-off have a massively
increased risk of death compared to those who are above, and in a well-nourished
population there are virtually no children below -3 SD (<1%). The growth standards
36
confirm that ethnic differences among groups, as well as genetic differences between
individuals are not considered large enough to invalidate the WHO growth standards
being used as a standard in any population (135).
Body mass index was calculated from the children’s height and weight and standardised
according to WHO growth charts (10,135). As BMI varies with age for children and
teenagers, it was interpreted in relation to BMI-for-age reference charts (Appendix G)(134)
used by Whetten et al, (2009)(80), taking the child’s age and gender into account.
3.4.2 Research procedure
A research assistant recruited through the University of Mauritius, was a qualified
occupational therapist, who was employed by the researcher to assist with recruitment of
the typical children and to administer the assessments. He was not employed elsewhere
at the time. All assessments, as well as data collection, were done by the research
assistant. Ten community children (known to the assistant through family and friend
connections) were assessed using the Beery VMI, to ensure that he was familiar with the
tool. The research assistant also practiced the administration of the HOME Inventories,
prior to using them, although did not receive formal training in HOME administration. The
HOME administration manual provides clear guidelines as to how to administer the tool.
3.4.2.1 Assessments of child participants
The research assistant made the necessary arrangements with the families for all the
assessments, and obtained the necessary consent from the parents, caregivers and
children, prior to beginning the Beery VMI assessments and HOME interviews.
Demographic information was collected on each child, by the research assistant, during
the session when the Beery VMI was conducted (Appendix D).
The Beery VMI assessments were conducted with the children at the residential child care
facility, and the tutoring centre in or at the children’s homes. Where possible the Beery
VMI was administered in groups of up to three children at a time, while the supplemental
tests were administered individually. Testing was done in a separate room, with limited
distractions, with the child using a standard HB pencil and no eraser. The research
assistant assisted the children with understanding the instructions for the Beery VMI, in
the language they were familiar with, if necessary, in Creole or English as required. He
also recorded the height and weight of each child during one of the assessments.
37
3.4.2.2 Assessments with caregivers, parents and child participants
Appointments were made with the caregivers at the residential child care facility, and the
parents or caregivers of the children in the community, prior to the HOME inventory
interview. These interviews were carried out at a time and place convenient to the
caregivers, during a visit to the child care facility, in the home of the child concerned, and
with the parents/caregivers in the community in their own homes. The research assistant
was able to administer these in the language with which the parents and caregivers felt
most comfortable during their interviews, in Creole and English as required, to ensure the
questions were understood. The assessments were not formally translated.
The child participant concerned was present and awake when the caregiver was
interviewed. Interviews took between 45 minutes and an hour, during which time the
parent and child were also observed. The research assistant did his best to ensure that
the process was relaxed and non-threatening, so as to allow for interactions that were as
close to normal as possible, to be observed between parents or caregivers and their
children. In some cases in the community group in Part 1 more than one child participant
was present during the interview.
In Part 2 in the residential child care facility caregiver interviews, a maximum of three child
participants were present within either the Middle Childhood or Early Adolescent age
groups. This was consistent with the administration of the Beery VMI which was
conducted with up to three children at a time’
3.4.2 Data management
The researcher scored all the Beery VMI tests and supplemental tests as well as
calculating the BMI for each child, and interpreting this according to the BMI-for-age
reference charts (134)(Appendix G), and WHO child growth standards (135).
The HOME inventories were also scored by the researcher, for each section, and a total
score determined. All the data was entered into an Excel spreadsheet which was checked
for errors and missing data.
3.4.3 Ethical considerations
Ethical approval was granted by the Ministry of Health and Quality of Life in Mauritius
(Appendix H1), as well as the Human Research Ethics Committee at the University of the
Witwatersrand (Appendix H2). Permission for the study was obtained from the residential
child care facility for the children to be assessed and for the caregivers to participate in the
research (Appendix A).

38
Verbal assent was obtained from the children and was witnessed by a caregiver employed
by the home or the parent (Appendix B). Each parent or caregiver had been given an
information sheet to sign informed consent for their demographic information to be
collected, for the purposes of completing the HOME inventory. Parents and caregivers
gave permission for the other assessments to be completed on the children (Appendix C1,
C2).
It was made clear that a child could be withdrawn at any stage – due to his or her own
wish, or that of a caregiver or parent.
Confidentiality was maintained by using only codes on all data sheets, with the names of
the children and caregivers being available only to the researcher and the occupational
therapist completing the assessments.
At a meeting between the researcher and the manager of the residential child care facility,
he was given the results of the Beery VMI assessments, as well as the HOME inventory.
A discussion was held as to how best to approach the problems found. The residential
child care facility had connections with a centre where the children can receive remedial
input and the residential child care facility also have psychologists who can assist where
appropriate. When problems were identified amongst the children in Part 1 of the study,
the parent was notified in writing (via the research assistant), and names of resources for
assessment and treatment of the child, were compiled and provided by the research
assistant.
A copy of the research findings and recommendations was given to the residential child
care facility.
4.3.4 Data Analysis
Descriptive statistics were used to analyse the demographics of the children and their
parents/caregivers. The scores were divided into Middle Childhood and Early Adolescent
groups, as the HOME inventories are slightly different for the two age groups. The mean
BMI and z scores for the total sample and the Middle Childhood and Early Adolescent
groups, were calculated and compared to the WHO five-19 years Growth Reference.
The total HOME scores and scores for individual categories, were tabulated and
analysed. Scores were also compared to those provided in the HOME inventory
administration manual (Appendix F3, F4). Raw scores for the Beery VMI and the subtests
were converted to standard scores and the total group scores and the Middle Childhood
and Early Adolescent groups’ results were examined to determine if age played a role in
influencing VMI. Standard scores and z scores of the Middle Childhood and Early
Adolescent groups were compared for Part 1 and Part 2 of the study separately.

39
Results were further analysed to determine if a relationship existed between the
demographic factors, the Beery VMI scores and HOME inventory scores for the group as
a whole, as well as for the Middle Childhood and Early Adolescent groups using the
Pearson’s correlation coefficient. Significance was set at p ≤ 0.05.
In Part 2 data gathered regarding the children in the residential child care facility group
(age of admission and length of stay) was examined for the presence of correlations
between Beery VMI scores, HOME scores and the BMI scores. The relative risk for the
experimental residential child care facility group in terms of their delay in VMI was also
established.
40
CHAPTER 4 RESULTS
4.1 Introduction
Fifty children between the ages of six and 16 years, from the community in Mauritius and
50 children in the same age group living in a residential child care facility in Mauritius were
involved in this study. The supportiveness of the environment for child development was
established by interviewing the primary caregivers using the HOME inventory and
analysing demographic information such as BMI scores and parent characteristics for the
community group in Part 1 of the study and the caregiver characteristics for the residential
facility group in Part 2 of the study. The length of stay and age of admission in the case of
the child care participants was also determined in Part 2 of the study.
Developmental status of the community group was determined using the Beery VMI. The
association between the HOME inventory and BMI scores, and the outcome of VMI in
terms of developmental status for this group was established to determine a standard
against which the group living in a residential child care facility could be assessed for
developmental delay, and their risk for developmental delay determined in Part 2 of the
study.
Due to the cross-sectional nature of the study, the children and their caregivers and or
parents were assessed once, often at the same visit, so there was no loss of participants
from the study.
4.2 PART 1: Assessment of children in the community in Mauritius
4.2.1 Factors associated with development in children
Certain demographic information such as family ethnicity, gestational age at birth, weight
at birth and medical history was excluded from the results, as there was either insufficient
information or the data wasn’t available when collected by the research assistant.
4.2.1.1 Demographics of the participants and their parents
The first objective was to determine the factors associated with development in children
living in the community in Mauritius. The factors measured included demographics such
as BMI (as an indication of nutritional status), and caregiver characteristics, as well as
environmental supportiveness, assessed using the HOME inventory.
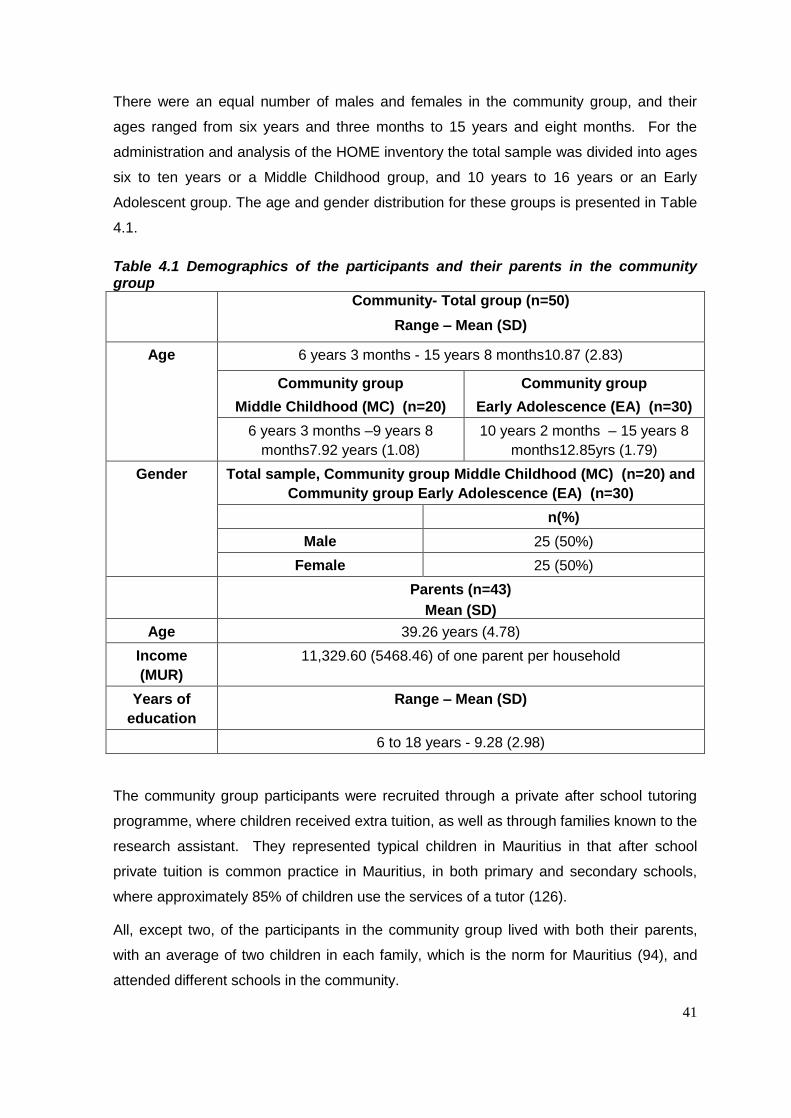
41
There were an equal number of males and females in the community group, and their
ages ranged from six years and three months to 15 years and eight months. For the
administration and analysis of the HOME inventory the total sample was divided into ages
six to ten years or a Middle Childhood group, and 10 years to 16 years or an Early
Adolescent group. The age and gender distribution for these groups is presented in Table
4.1.
Table 4.1 Demographics of the participants and their parents in the community group
Community- Total group (n=50)
Range – Mean (SD)
Age 6 years 3 months - 15 years 8 months10.87 (2.83)
Community group
Middle Childhood (MC) (n=20)
Community group
Early Adolescence (EA) (n=30)
6 years 3 months –9 years 8
months7.92 years (1.08)
10 years 2 months – 15 years 8
months12.85yrs (1.79)
Gender Total sample, Community group Middle Childhood (MC) (n=20) and
Community group Early Adolescence (EA) (n=30)
n(%)
Male 25 (50%)
Female 25 (50%)
Parents (n=43)
Mean (SD)
Age 39.26 years (4.78)
Income
(MUR)
11,329.60 (5468.46) of one parent per household
Years of
education
Range – Mean (SD)
6 to 18 years - 9.28 (2.98)
The community group participants were recruited through a private after school tutoring
programme, where children received extra tuition, as well as through families known to the
research assistant. They represented typical children in Mauritius in that after school
private tuition is common practice in Mauritius, in both primary and secondary schools,
where approximately 85% of children use the services of a tutor (126).
All, except two, of the participants in the community group lived with both their parents,
with an average of two children in each family, which is the norm for Mauritius (94), and
attended different schools in the community.
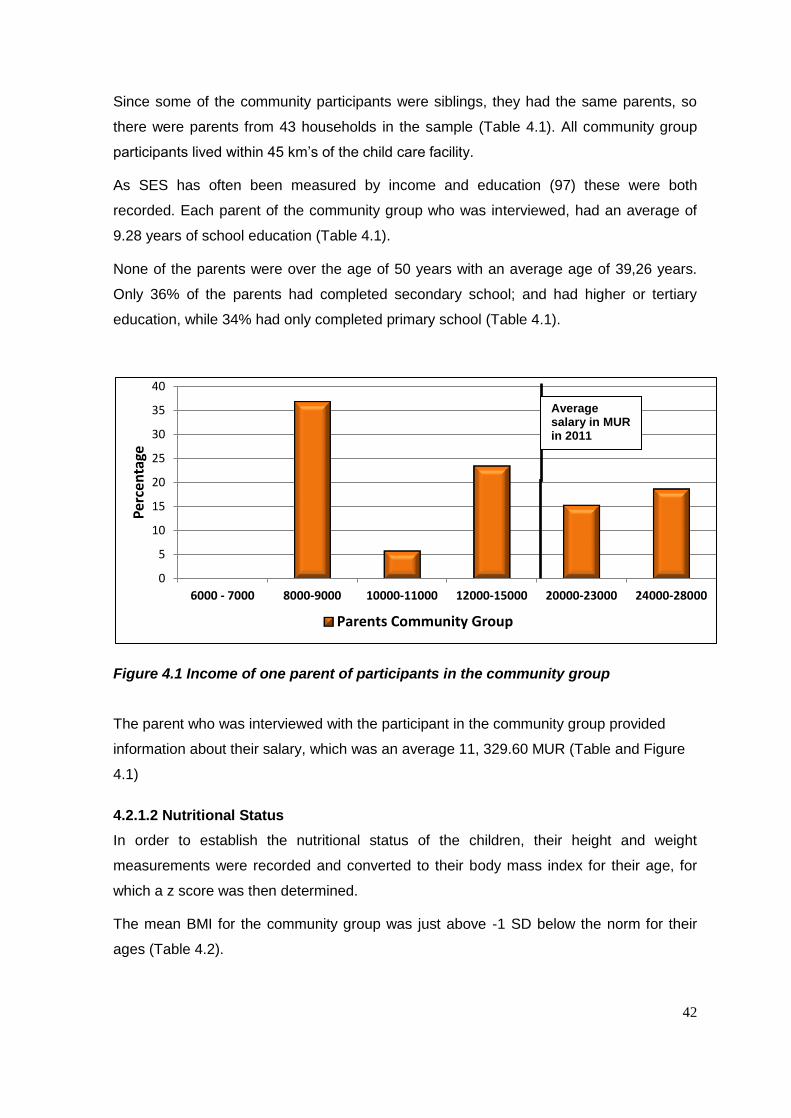
42
Since some of the community participants were siblings, they had the same parents, so
there were parents from 43 households in the sample (Table 4.1). All community group
participants lived within 45 km’s of the child care facility.
As SES has often been measured by income and education (97) these were both
recorded. Each parent of the community group who was interviewed, had an average of
9.28 years of school education (Table 4.1).
None of the parents were over the age of 50 years with an average age of 39,26 years.
Only 36% of the parents had completed secondary school; and had higher or tertiary
education, while 34% had only completed primary school (Table 4.1).
Figure 4.1 Income of one parent of participants in the community group
The parent who was interviewed with the participant in the community group provided
information about their salary, which was an average 11, 329.60 MUR (Table and Figure
4.1)
4.2.1.2 Nutritional Status
In order to establish the nutritional status of the children, their height and weight
measurements were recorded and converted to their body mass index for their age, for
which a z score was then determined.
The mean BMI for the community group was just above -1 SD below the norm for their
ages (Table 4.2).
0
5
10
15
20
25
30
35
40
6000 - 7000 8000-9000 10000-11000 12000-15000 20000-23000 24000-28000
Per
cen
tage
Parents Community Group
Average salary in MUR in 2011
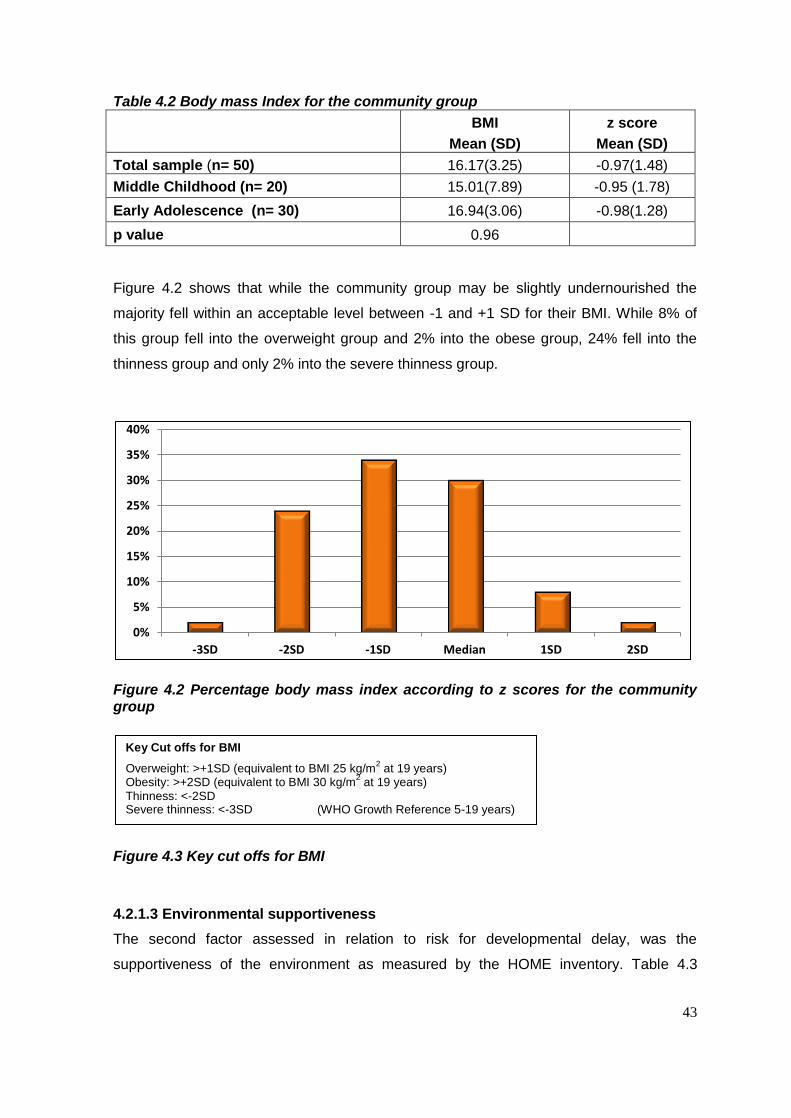
43
Table 4.2 Body mass Index for the community group
BMI
Mean (SD)
z score
Mean (SD)
Total sample (n= 50) 16.17(3.25) -0.97(1.48)
Middle Childhood (n= 20) 15.01(7.89) -0.95 (1.78)
Early Adolescence (n= 30) 16.94(3.06) -0.98(1.28)
p value 0.96
Figure 4.2 shows that while the community group may be slightly undernourished the
majority fell within an acceptable level between -1 and +1 SD for their BMI. While 8% of
this group fell into the overweight group and 2% into the obese group, 24% fell into the
thinness group and only 2% into the severe thinness group.
Figure 4.2 Percentage body mass index according to z scores for the community group
Figure 4.3 Key cut offs for BMI
4.2.1.3 Environmental supportiveness
The second factor assessed in relation to risk for developmental delay, was the
supportiveness of the environment as measured by the HOME inventory. Table 4.3
0%
5%
10%
15%
20%
25%
30%
35%
40%
-3SD -2SD -1SD Median 1SD 2SD
Key Cut offs for BMI
Overweight: >+1SD (equivalent to BMI 25 kg/m2 at 19 years)
Obesity: >+2SD (equivalent to BMI 30 kg/m2 at 19 years)
Thinness: <-2SD Severe thinness: <-3SD (WHO Growth Reference 5-19 years)

44
indicates that children in the community group experienced environments that were
supportive with a median of 56, which is what the HOME inventory is evaluated on.
Table 4.3 Mean Standard Scores on the HOME Inventory for community groups
Home Inventory
Maximum score obtainable (median)
Mean (SD)
Median
Total group (n=50) - 55.26 (4.00)
56
Middle childhood group (n=20)
59 (46) 55.85 (3.49)
57
Early adolescence group (n=30)
60 (44) 54.70 (4.42)
55
p value 0.33
The MC HOME inventory and the EA HOME inventory were completed for the two age
groups in the study. The subscale scores were all within the median for the community
group, and the mean total HOME score was within seven points of the scores provided for
comparison, indicating that the environment was supportive for these participants (Table
4.3). There was no significant difference between the Middle Childhood and Early
Adolescence groups (p=0.33).
Table 4.4 Mean Standard Scores on the components of the HOME Inventory for Middle Childhood community group
The Middle Childhood Maximum score obtainable (median)
Community group
n=20
Mean (SD) Median
Responsivity 10 (9) 9.90 (0.44) 10
Encouragement of maturity 7 (5) 6.70 (0.47) 7
Emotional climate 8 (7) 7.75 (0.63) 8
Learning materials and opportunities
8 (4) 6.35 (1.34) 6.5
Enrichment 8 (6) 7.65 (0.58) 8
Family companionship 6 (5) 5.95 (0.22) 6
Family integration 4 (3) 3.80 (0.61) 4
Physical environment 8 (7) 7.70 (0.92) 8
While none of the subscale scores for the Middle Childhood and Early Adolescence
groups of children living in the community were concerning, falling no less than the seven
points below the scores considered adequate for the HOME (Table 4,4 and 4,5), all the
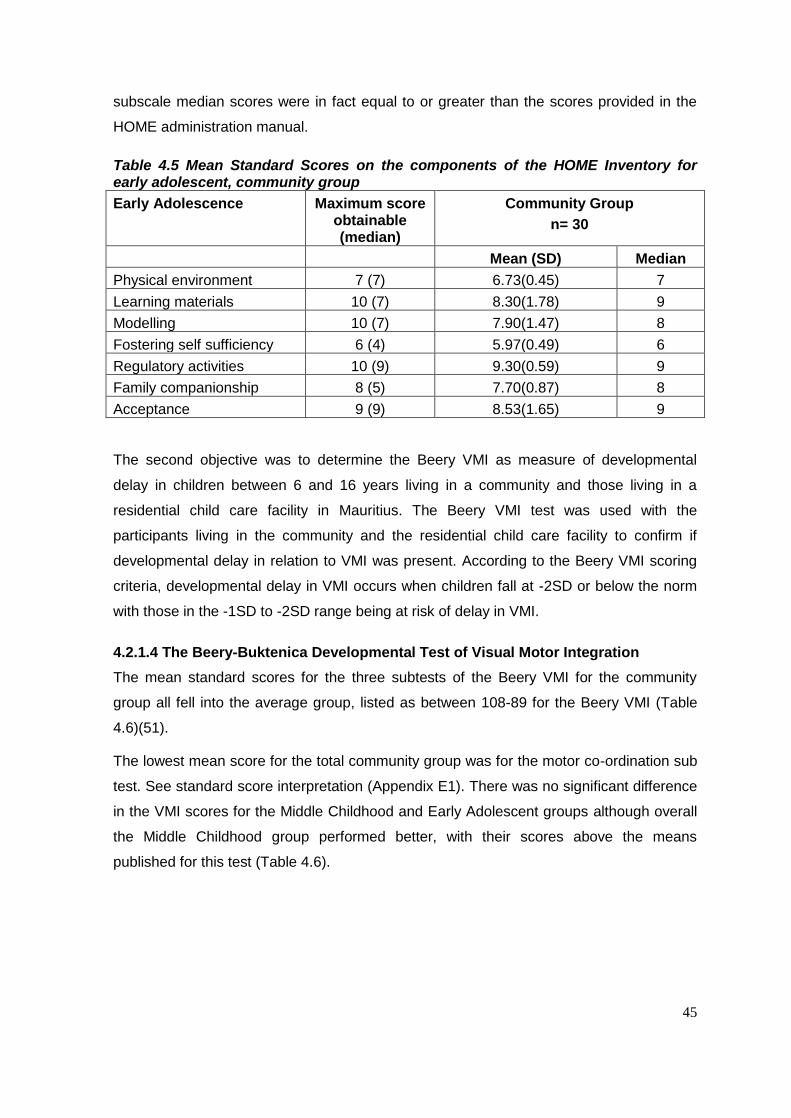
45
subscale median scores were in fact equal to or greater than the scores provided in the
HOME administration manual.
Table 4.5 Mean Standard Scores on the components of the HOME Inventory for early adolescent, community group
Early Adolescence Maximum score obtainable (median)
Community Group
n= 30
Mean (SD) Median
Physical environment 7 (7) 6.73(0.45) 7
Learning materials 10 (7) 8.30(1.78) 9
Modelling 10 (7) 7.90(1.47) 8
Fostering self sufficiency 6 (4) 5.97(0.49) 6
Regulatory activities 10 (9) 9.30(0.59) 9
Family companionship 8 (5) 7.70(0.87) 8
Acceptance 9 (9) 8.53(1.65) 9
The second objective was to determine the Beery VMI as measure of developmental
delay in children between 6 and 16 years living in a community and those living in a
residential child care facility in Mauritius. The Beery VMI test was used with the
participants living in the community and the residential child care facility to confirm if
developmental delay in relation to VMI was present. According to the Beery VMI scoring
criteria, developmental delay in VMI occurs when children fall at -2SD or below the norm
with those in the -1SD to -2SD range being at risk of delay in VMI.
4.2.1.4 The Beery-Buktenica Developmental Test of Visual Motor Integration
The mean standard scores for the three subtests of the Beery VMI for the community
group all fell into the average group, listed as between 108-89 for the Beery VMI (Table
4.6)(51).
The lowest mean score for the total community group was for the motor co-ordination sub
test. See standard score interpretation (Appendix E1). There was no significant difference
in the VMI scores for the Middle Childhood and Early Adolescent groups although overall
the Middle Childhood group performed better, with their scores above the means
published for this test (Table 4.6).
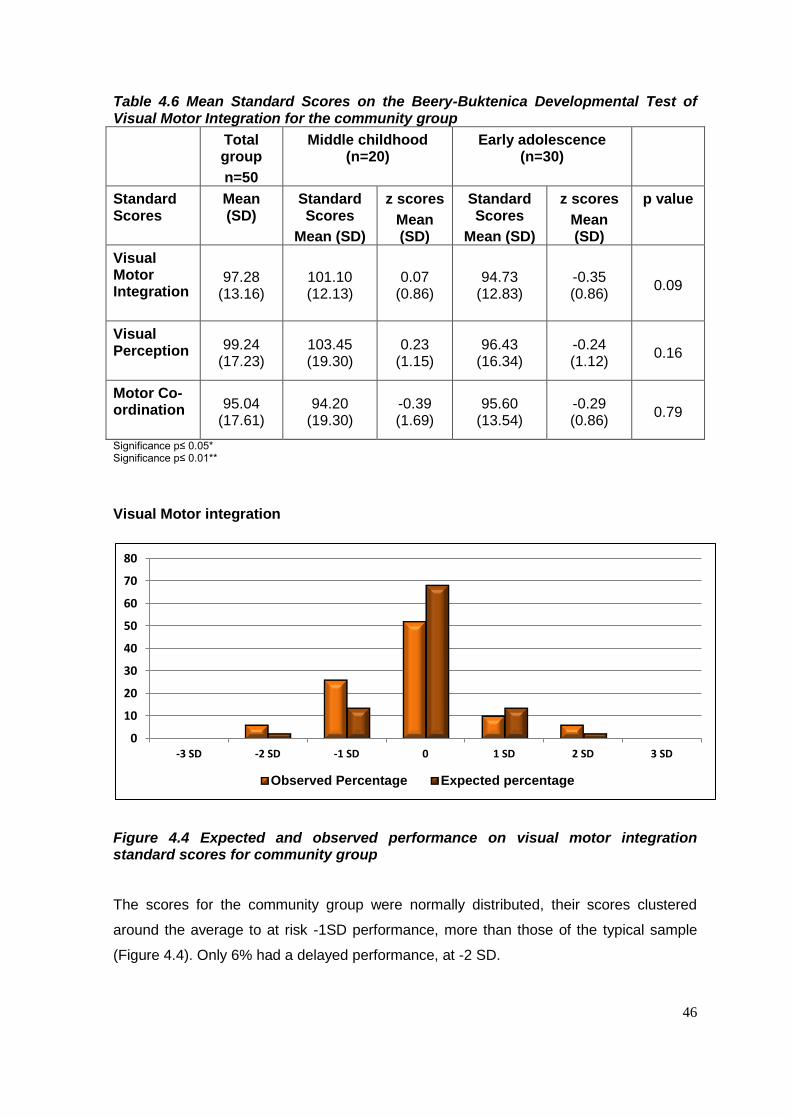
46
Table 4.6 Mean Standard Scores on the Beery-Buktenica Developmental Test of Visual Motor Integration for the community group
Total group
n=50
Middle childhood (n=20)
Early adolescence (n=30)
Standard Scores
Mean (SD)
Standard Scores
Mean (SD)
z scores
Mean (SD)
Standard Scores
Mean (SD)
z scores
Mean (SD)
p value
Visual Motor Integration
97.28 (13.16)
101.10 (12.13)
0.07 (0.86)
94.73 (12.83)
-0.35 (0.86)
0.09
Visual Perception
99.24 (17.23)
103.45 (19.30)
0.23 (1.15)
96.43 (16.34)
-0.24 (1.12)
0.16
Motor Co-ordination
95.04 (17.61)
94.20 (19.30)
-0.39 (1.69)
95.60 (13.54)
-0.29 (0.86)
0.79
Significance p≤ 0.05* Significance p≤ 0.01**
Visual Motor integration
Figure 4.4 Expected and observed performance on visual motor integration standard scores for community group
The scores for the community group were normally distributed, their scores clustered
around the average to at risk -1SD performance, more than those of the typical sample
(Figure 4.4). Only 6% had a delayed performance, at -2 SD.
0
10
20
30
40
50
60
70
80
-3 SD -2 SD -1 SD 0 1 SD 2 SD 3 SD
Observed Percentage Expected percentage

47
Visual Perception
Figure 4.5 Expected and observed performance on visual perceptual standard scores for the community group
As for VMI, the visual perception scores for the community group were normally
distributed, with 8% of the participants falling into the delayed category, at -2 SD and -3
SD (Figure 4.5). Although 20% were at risk of delay, the percentage of participants
scoring 1 SD, 2SD and 3 SD were higher than expected of a typical sample.
Motor Co-ordination
0
10
20
30
40
50
60
70
80
-3 SD -2 SD -1 SD 0 1 SD 2 SD 3 SD
Observed Percentage Expected percentage
0
10
20
30
40
50
60
70
80
-3 SD -2 SD -1 SD 0 1 SD 2 SD 3 SD
Observed Percentage Expected percentage
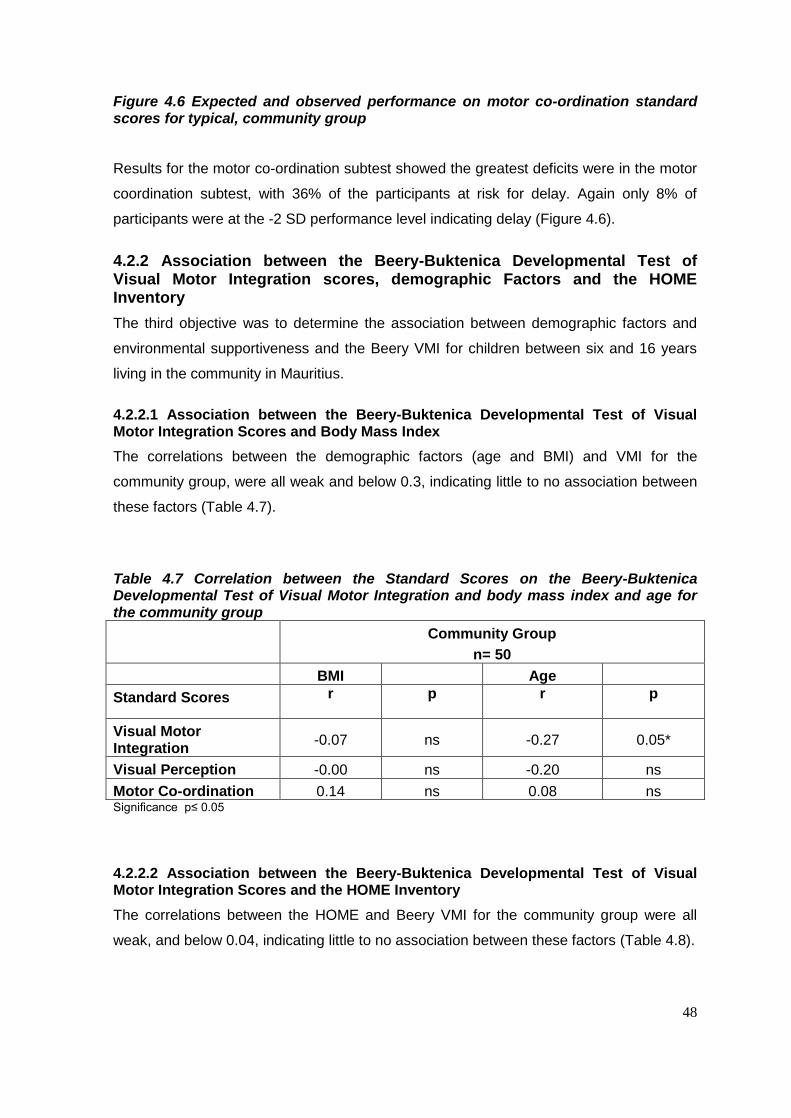
48
Figure 4.6 Expected and observed performance on motor co-ordination standard scores for typical, community group
Results for the motor co-ordination subtest showed the greatest deficits were in the motor
coordination subtest, with 36% of the participants at risk for delay. Again only 8% of
participants were at the -2 SD performance level indicating delay (Figure 4.6).
4.2.2 Association between the Beery-Buktenica Developmental Test of Visual Motor Integration scores, demographic Factors and the HOME Inventory
The third objective was to determine the association between demographic factors and
environmental supportiveness and the Beery VMI for children between six and 16 years
living in the community in Mauritius.
4.2.2.1 Association between the Beery-Buktenica Developmental Test of Visual Motor Integration Scores and Body Mass Index
The correlations between the demographic factors (age and BMI) and VMI for the
community group, were all weak and below 0.3, indicating little to no association between
these factors (Table 4.7).
Table 4.7 Correlation between the Standard Scores on the Beery-Buktenica Developmental Test of Visual Motor Integration and body mass index and age for the community group
Community Group
n= 50
BMI Age
Standard Scores r p r p
Visual Motor Integration
-0.07 ns -0.27 0.05*
Visual Perception -0.00 ns -0.20 ns
Motor Co-ordination 0.14 ns 0.08 ns Significance p≤ 0.05
4.2.2.2 Association between the Beery-Buktenica Developmental Test of Visual Motor Integration Scores and the HOME Inventory
The correlations between the HOME and Beery VMI for the community group were all
weak, and below 0.04, indicating little to no association between these factors (Table 4.8).

49
Table 4.8 Correlation between the HOME Inventory and standard scores on the Beery-Buktenica Developmental Test of Visual Motor Integration for the community group
HOME Inventory
Community Group
Total Group
n= 50
Middle Childhood Group
n= 20
Early Adolescence Group
n= 30
Standard Scores r p r p r p
Visual Motor Integration
0.39 *0.05 0.26 ns 0.26
ns
Visual
Perception 0.13 ns 0.27 ns
0.27 ns
Motor Co-ordination
0.05 ns 0.13 ns 0.13
ns
*Significance set at p≤ 0.05
4.3 PART 2 Assessment of children in a residential child care facility in Mauritius
4.3.1 Factors associated with development
The fourth objective was to determine the factors associated with development in children
living in a child care facility in Mauritius. The demographic factors measured included care
giver characteristics, BMI (as an indication of nutritional status), and environmental
supportiveness, assessed using the HOME inventory. Length of stay in the facility and
age of admission were also recorded for the residential child care group.
4.3.1.1 Demographics of the participants and caregivers
There were slightly more males than females in the child care group, and their ages
ranged from six years to 15 years and 10 months. The greater number of males was in
the Middle Childhood group where there were more younger males in the residential child
care facility than females. The participants in the Early Adolescent group were evenly
distributed for gender (Table 4.9).
There were 14 caregivers in the child care group, who were all female. They each lived in
a house in the residential child care facility, and cared for between six and nine children,
of mixed ages and sex (Table 4.9).
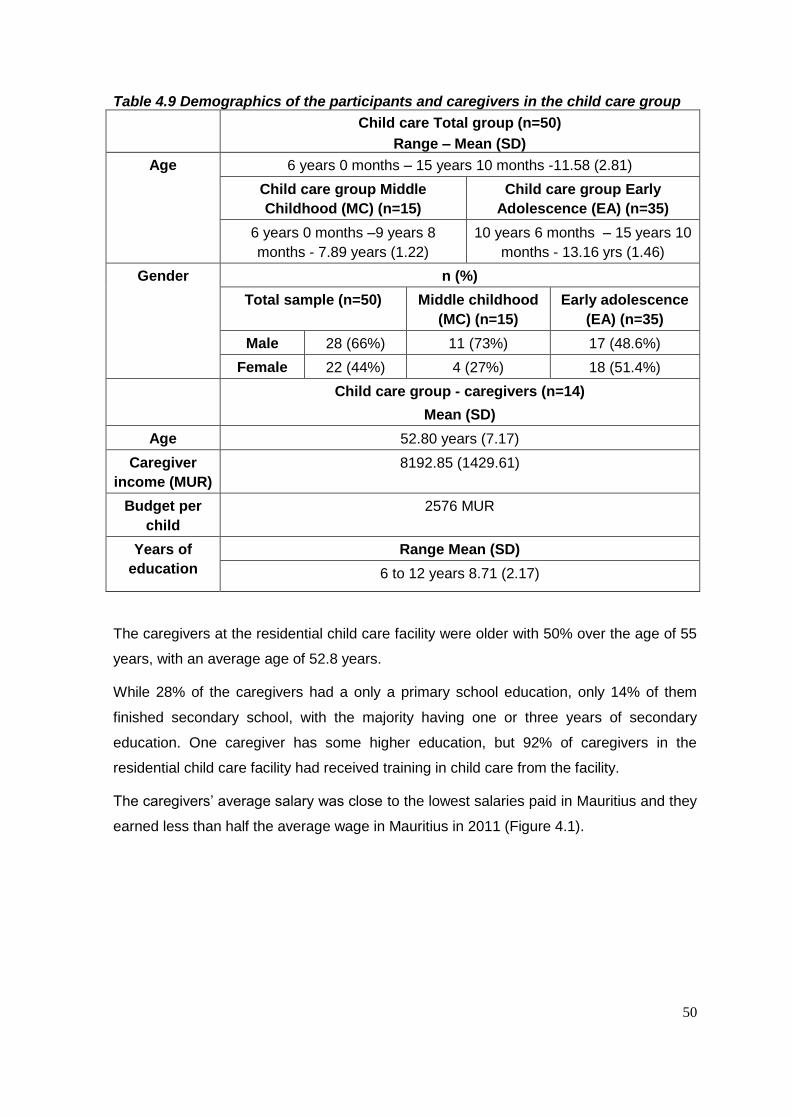
50
Table 4.9 Demographics of the participants and caregivers in the child care group
Child care Total group (n=50)
Range – Mean (SD)
Age 6 years 0 months – 15 years 10 months -11.58 (2.81)
Child care group Middle
Childhood (MC) (n=15)
Child care group Early
Adolescence (EA) (n=35)
6 years 0 months –9 years 8
months - 7.89 years (1.22)
10 years 6 months – 15 years 10
months - 13.16 yrs (1.46)
Gender n (%)
Total sample (n=50) Middle childhood
(MC) (n=15)
Early adolescence
(EA) (n=35)
Male 28 (66%) 11 (73%) 17 (48.6%)
Female 22 (44%) 4 (27%) 18 (51.4%)
Child care group - caregivers (n=14)
Mean (SD)
Age 52.80 years (7.17)
Caregiver
income (MUR)
8192.85 (1429.61)
Budget per
child
2576 MUR
Years of
education
Range Mean (SD)
6 to 12 years 8.71 (2.17)
The caregivers at the residential child care facility were older with 50% over the age of 55
years, with an average age of 52.8 years.
While 28% of the caregivers had a only a primary school education, only 14% of them
finished secondary school, with the majority having one or three years of secondary
education. One caregiver has some higher education, but 92% of caregivers in the
residential child care facility had received training in child care from the facility.
The caregivers’ average salary was close to the lowest salaries paid in Mauritius and they
earned less than half the average wage in Mauritius in 2011 (Figure 4.1).
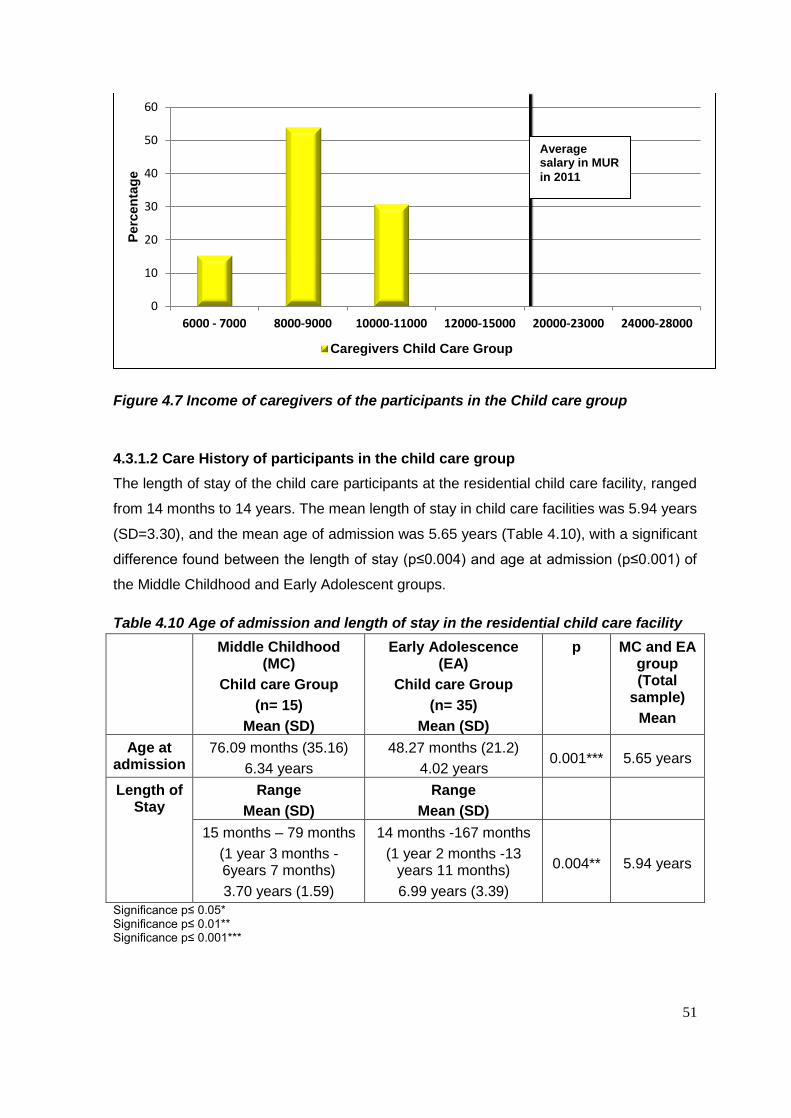
51
Figure 4.7 Income of caregivers of the participants in the Child care group
4.3.1.2 Care History of participants in the child care group
The length of stay of the child care participants at the residential child care facility, ranged
from 14 months to 14 years. The mean length of stay in child care facilities was 5.94 years
(SD=3.30), and the mean age of admission was 5.65 years (Table 4.10), with a significant
difference found between the length of stay (p≤0.004) and age at admission (p≤0.001) of
the Middle Childhood and Early Adolescent groups.
Table 4.10 Age of admission and length of stay in the residential child care facility
Middle Childhood (MC)
Child care Group
(n= 15)
Mean (SD)
Early Adolescence (EA)
Child care Group
(n= 35)
Mean (SD)
p MC and EA group (Total
sample)
Mean
Age at admission
76.09 months (35.16)
6.34 years
48.27 months (21.2)
4.02 years 0.001*** 5.65 years
Length of Stay
Range
Mean (SD)
Range
Mean (SD)
15 months – 79 months
(1 year 3 months - 6years 7 months)
3.70 years (1.59)
14 months -167 months
(1 year 2 months -13 years 11 months)
6.99 years (3.39)
0.004** 5.94 years
Significance p≤ 0.05* Significance p≤ 0.01** Significance p≤ 0.001***
0
10
20
30
40
50
60
6000 - 7000 8000-9000 10000-11000 12000-15000 20000-23000 24000-28000
Perc
en
tag
e
Caregivers Child Care Group
Average salary in MUR
in 2011
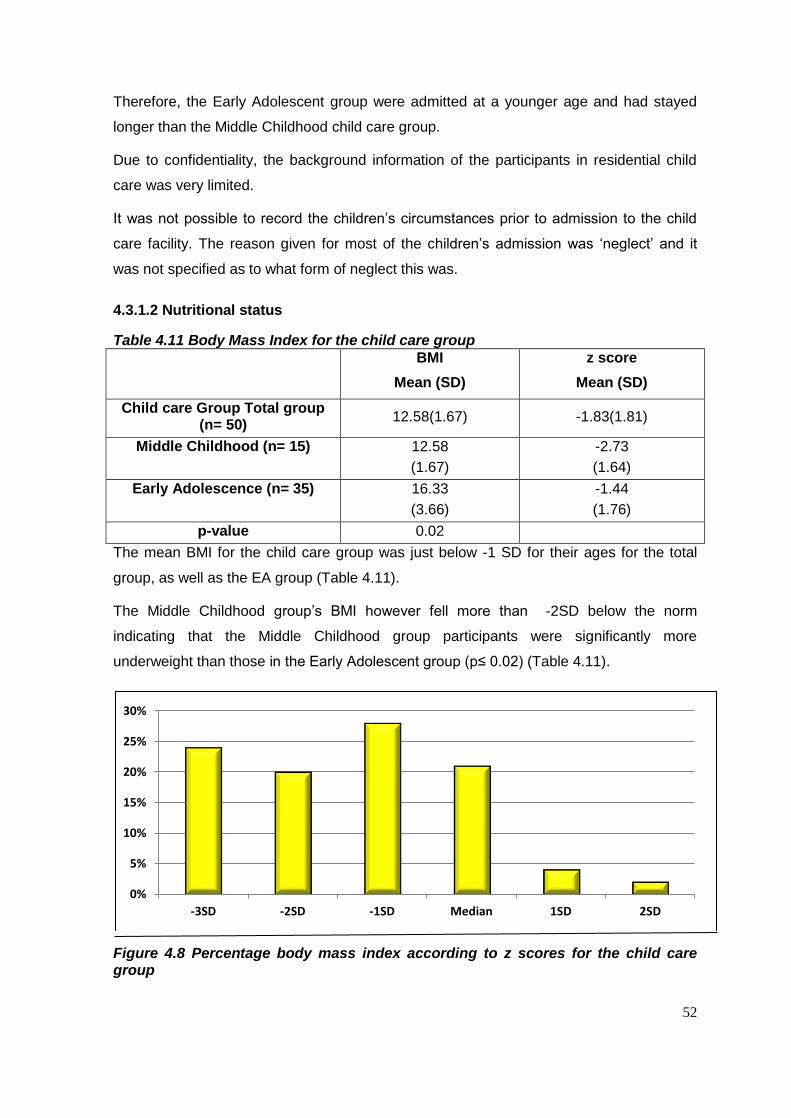
52
Therefore, the Early Adolescent group were admitted at a younger age and had stayed
longer than the Middle Childhood child care group.
Due to confidentiality, the background information of the participants in residential child
care was very limited.
It was not possible to record the children’s circumstances prior to admission to the child
care facility. The reason given for most of the children’s admission was ‘neglect’ and it
was not specified as to what form of neglect this was.
4.3.1.2 Nutritional status
Table 4.11 Body Mass Index for the child care group
BMI
Mean (SD)
z score
Mean (SD)
Child care Group Total group (n= 50)
12.58(1.67) -1.83(1.81)
Middle Childhood (n= 15) 12.58
(1.67)
-2.73
(1.64)
Early Adolescence (n= 35) 16.33
(3.66)
-1.44
(1.76)
p-value 0.02
The mean BMI for the child care group was just below -1 SD for their ages for the total
group, as well as the EA group (Table 4.11).
The Middle Childhood group’s BMI however fell more than -2SD below the norm
indicating that the Middle Childhood group participants were significantly more
underweight than those in the Early Adolescent group (p≤ 0.02) (Table 4.11).
Figure 4.8 Percentage body mass index according to z scores for the child care group
0%
5%
10%
15%
20%
25%
30%
-3SD -2SD -1SD Median 1SD 2SD
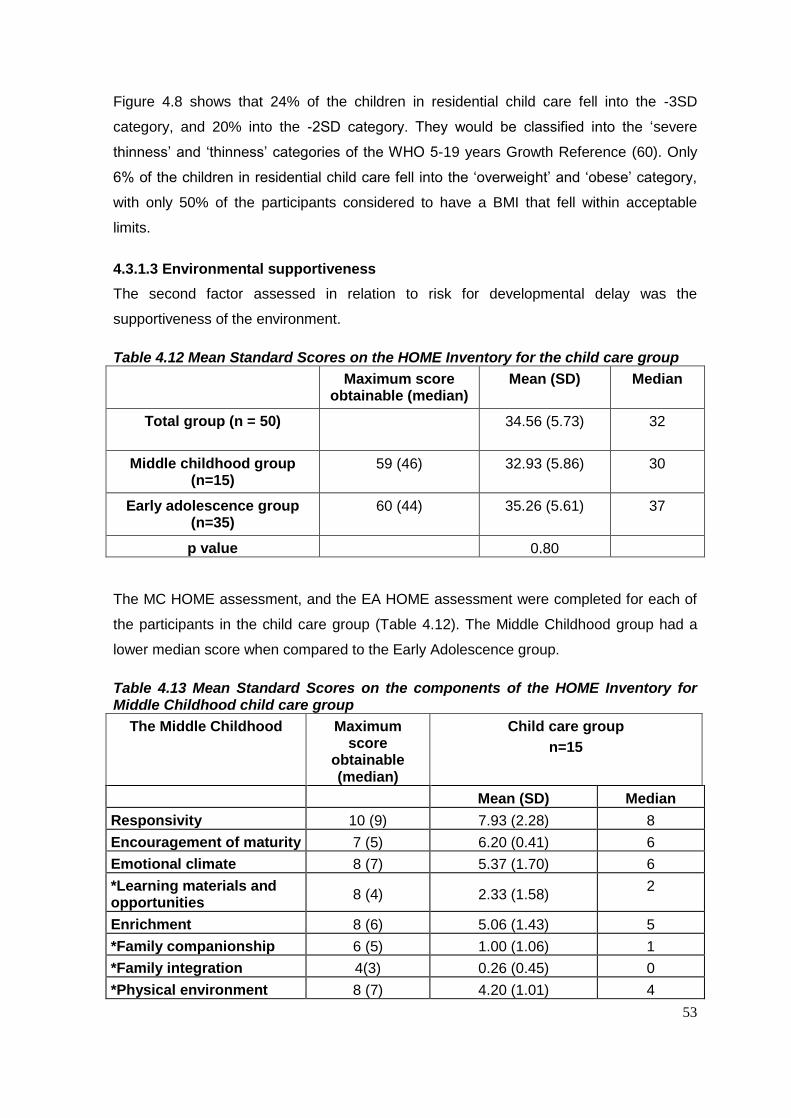
53
Figure 4.8 shows that 24% of the children in residential child care fell into the -3SD
category, and 20% into the -2SD category. They would be classified into the ‘severe
thinness’ and ‘thinness’ categories of the WHO 5-19 years Growth Reference (60). Only
6% of the children in residential child care fell into the ‘overweight’ and ‘obese’ category,
with only 50% of the participants considered to have a BMI that fell within acceptable
limits.
4.3.1.3 Environmental supportiveness
The second factor assessed in relation to risk for developmental delay was the
supportiveness of the environment.
Table 4.12 Mean Standard Scores on the HOME Inventory for the child care group
Maximum score obtainable (median)
Mean (SD)
Median
Total group (n = 50) 34.56 (5.73)
32
Middle childhood group (n=15)
59 (46) 32.93 (5.86)
30
Early adolescence group (n=35)
60 (44) 35.26 (5.61)
37
p value 0.80
The MC HOME assessment, and the EA HOME assessment were completed for each of
the participants in the child care group (Table 4.12). The Middle Childhood group had a
lower median score when compared to the Early Adolescence group.
Table 4.13 Mean Standard Scores on the components of the HOME Inventory for Middle Childhood child care group
The Middle Childhood Maximum score
obtainable (median)
Child care group
n=15
Mean (SD) Median
Responsivity 10 (9) 7.93 (2.28) 8
Encouragement of maturity 7 (5) 6.20 (0.41) 6
Emotional climate 8 (7) 5.37 (1.70) 6
*Learning materials and opportunities
8 (4) 2.33 (1.58) 2
Enrichment 8 (6) 5.06 (1.43) 5
*Family companionship 6 (5) 1.00 (1.06) 1
*Family integration 4(3) 0.26 (0.45) 0
*Physical environment 8 (7) 4.20 (1.01) 4
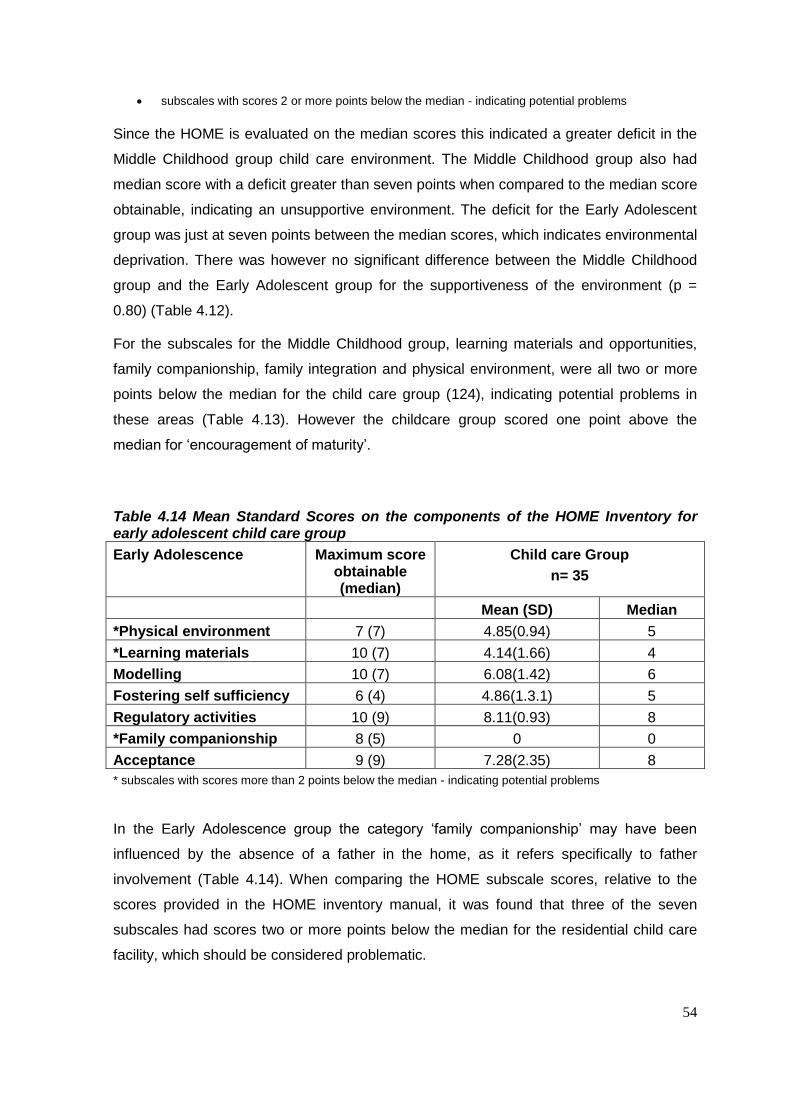
54
subscales with scores 2 or more points below the median - indicating potential problems
Since the HOME is evaluated on the median scores this indicated a greater deficit in the
Middle Childhood group child care environment. The Middle Childhood group also had
median score with a deficit greater than seven points when compared to the median score
obtainable, indicating an unsupportive environment. The deficit for the Early Adolescent
group was just at seven points between the median scores, which indicates environmental
deprivation. There was however no significant difference between the Middle Childhood
group and the Early Adolescent group for the supportiveness of the environment (p =
0.80) (Table 4.12).
For the subscales for the Middle Childhood group, learning materials and opportunities,
family companionship, family integration and physical environment, were all two or more
points below the median for the child care group (124), indicating potential problems in
these areas (Table 4.13). However the childcare group scored one point above the
median for ‘encouragement of maturity’.
Table 4.14 Mean Standard Scores on the components of the HOME Inventory for early adolescent child care group
Early Adolescence Maximum score obtainable (median)
Child care Group
n= 35
Mean (SD) Median
*Physical environment 7 (7) 4.85(0.94) 5
*Learning materials 10 (7) 4.14(1.66) 4
Modelling 10 (7) 6.08(1.42) 6
Fostering self sufficiency 6 (4) 4.86(1.3.1) 5
Regulatory activities 10 (9) 8.11(0.93) 8
*Family companionship 8 (5) 0 0
Acceptance 9 (9) 7.28(2.35) 8
* subscales with scores more than 2 points below the median - indicating potential problems
In the Early Adolescence group the category ‘family companionship’ may have been
influenced by the absence of a father in the home, as it refers specifically to father
involvement (Table 4.14). When comparing the HOME subscale scores, relative to the
scores provided in the HOME inventory manual, it was found that three of the seven
subscales had scores two or more points below the median for the residential child care
facility, which should be considered problematic.
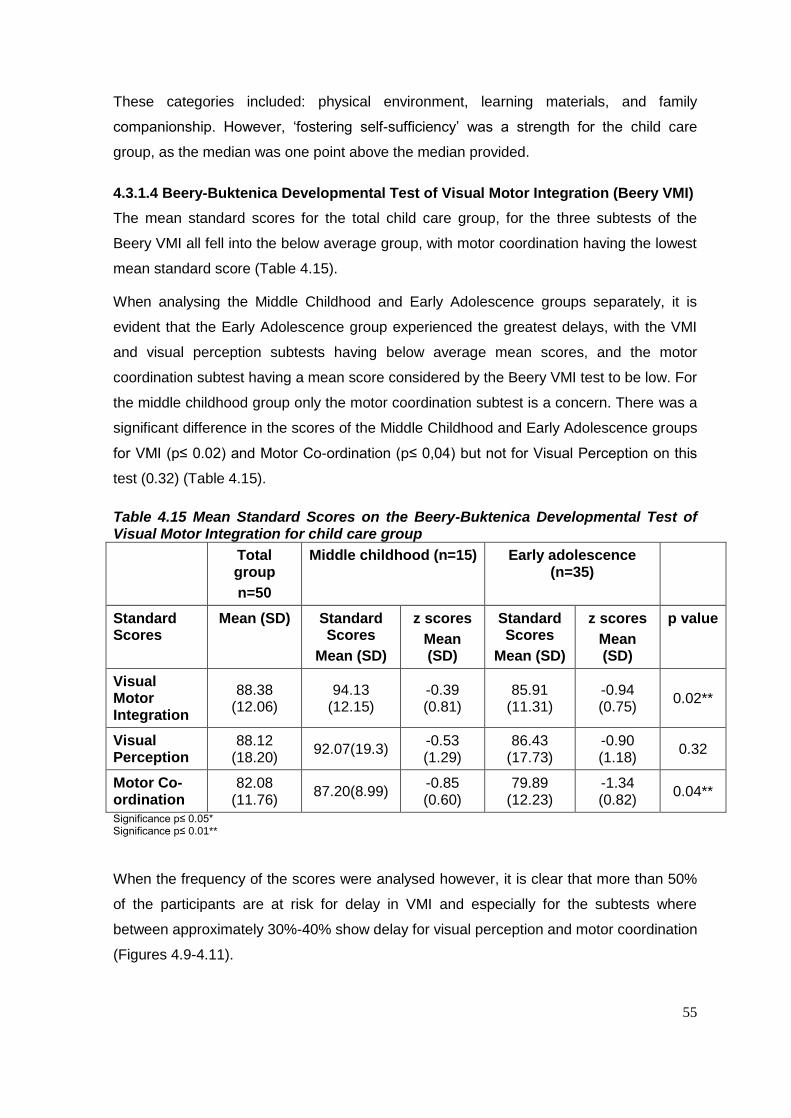
55
These categories included: physical environment, learning materials, and family
companionship. However, ‘fostering self-sufficiency’ was a strength for the child care
group, as the median was one point above the median provided.
4.3.1.4 Beery-Buktenica Developmental Test of Visual Motor Integration (Beery VMI)
The mean standard scores for the total child care group, for the three subtests of the
Beery VMI all fell into the below average group, with motor coordination having the lowest
mean standard score (Table 4.15).
When analysing the Middle Childhood and Early Adolescence groups separately, it is
evident that the Early Adolescence group experienced the greatest delays, with the VMI
and visual perception subtests having below average mean scores, and the motor
coordination subtest having a mean score considered by the Beery VMI test to be low. For
the middle childhood group only the motor coordination subtest is a concern. There was a
significant difference in the scores of the Middle Childhood and Early Adolescence groups
for VMI (p≤ 0.02) and Motor Co-ordination (p≤ 0,04) but not for Visual Perception on this
test (0.32) (Table 4.15).
Table 4.15 Mean Standard Scores on the Beery-Buktenica Developmental Test of Visual Motor Integration for child care group
Total group
n=50
Middle childhood (n=15) Early adolescence (n=35)
Standard Scores
Mean (SD) Standard Scores
Mean (SD)
z scores
Mean (SD)
Standard Scores
Mean (SD)
z scores
Mean (SD)
p value
Visual Motor Integration
88.38 (12.06)
94.13 (12.15)
-0.39 (0.81)
85.91 (11.31)
-0.94 (0.75)
0.02**
Visual Perception
88.12 (18.20)
92.07(19.3) -0.53 (1.29)
86.43 (17.73)
-0.90 (1.18)
0.32
Motor Co-ordination
82.08 (11.76)
87.20(8.99) -0.85 (0.60)
79.89 (12.23)
-1.34 (0.82)
0.04**
Significance p≤ 0.05* Significance p≤ 0.01**
When the frequency of the scores were analysed however, it is clear that more than 50%
of the participants are at risk for delay in VMI and especially for the subtests where
between approximately 30%-40% show delay for visual perception and motor coordination
(Figures 4.9-4.11).
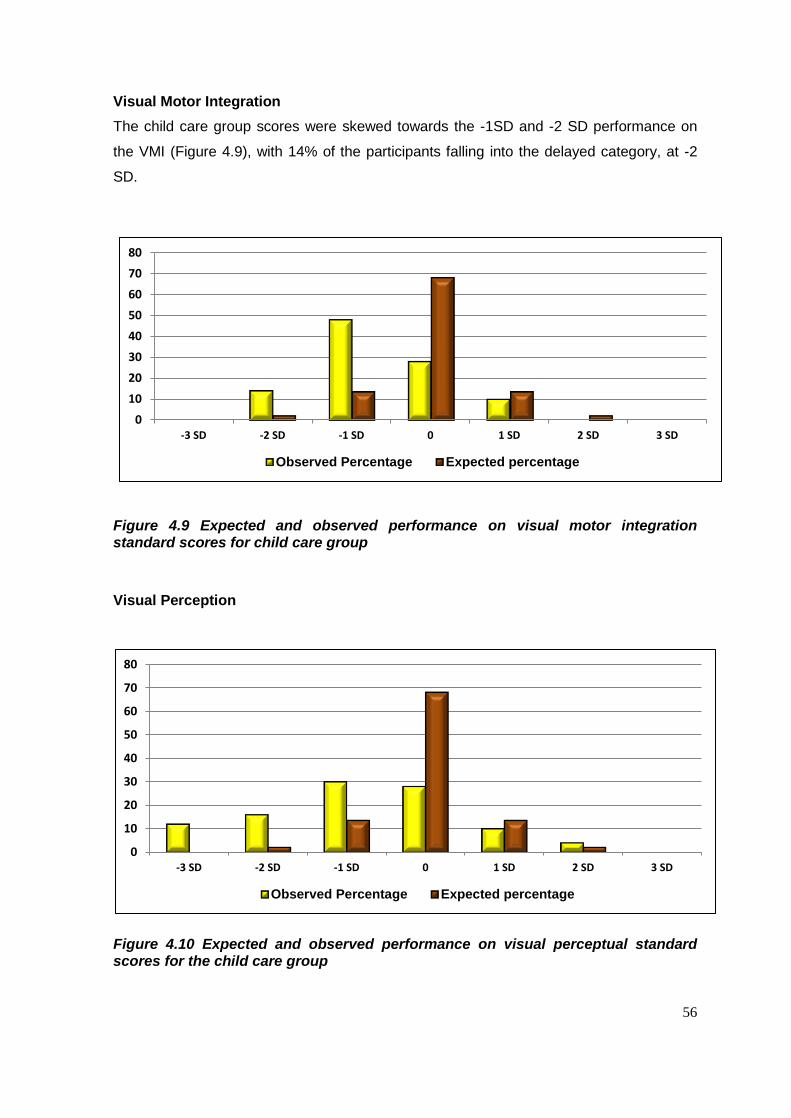
56
Visual Motor Integration
The child care group scores were skewed towards the -1SD and -2 SD performance on
the VMI (Figure 4.9), with 14% of the participants falling into the delayed category, at -2
SD.
Figure 4.9 Expected and observed performance on visual motor integration standard scores for child care group
Visual Perception
Figure 4.10 Expected and observed performance on visual perceptual standard scores for the child care group
0
10
20
30
40
50
60
70
80
-3 SD -2 SD -1 SD 0 1 SD 2 SD 3 SD
Observed Percentage Expected percentage
0
10
20
30
40
50
60
70
80
-3 SD -2 SD -1 SD 0 1 SD 2 SD 3 SD
Observed Percentage Expected percentage
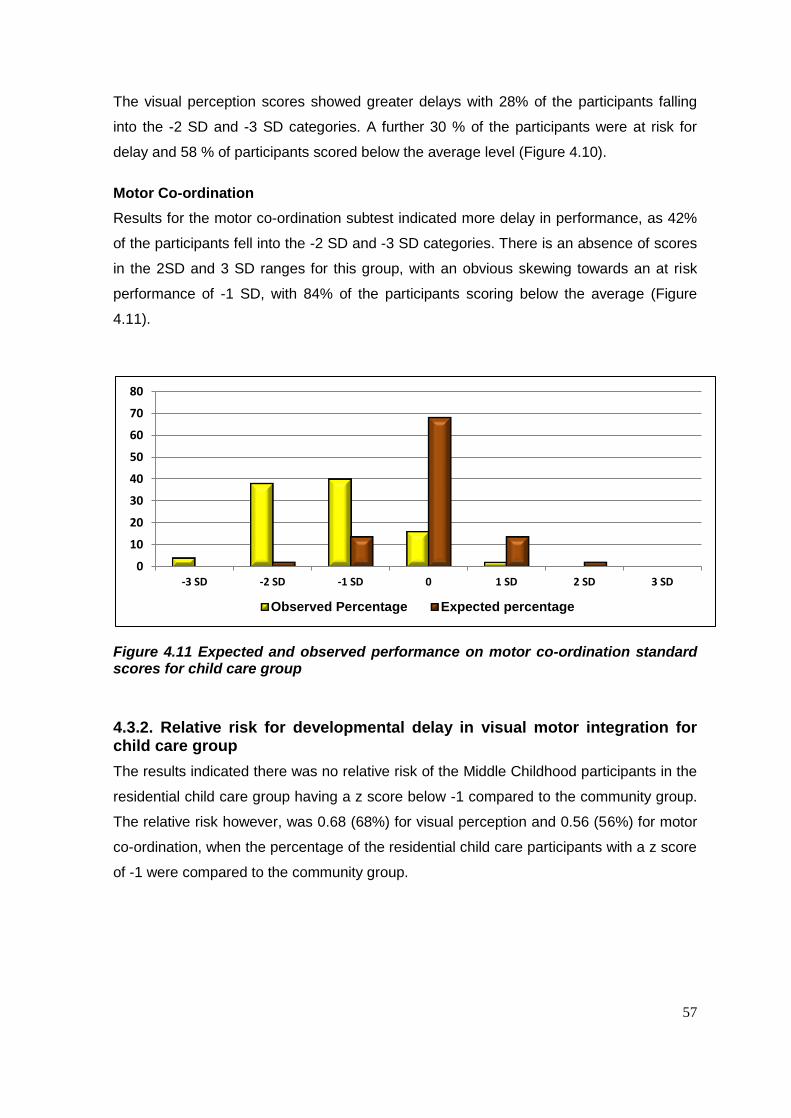
57
The visual perception scores showed greater delays with 28% of the participants falling
into the -2 SD and -3 SD categories. A further 30 % of the participants were at risk for
delay and 58 % of participants scored below the average level (Figure 4.10).
Motor Co-ordination
Results for the motor co-ordination subtest indicated more delay in performance, as 42%
of the participants fell into the -2 SD and -3 SD categories. There is an absence of scores
in the 2SD and 3 SD ranges for this group, with an obvious skewing towards an at risk
performance of -1 SD, with 84% of the participants scoring below the average (Figure
4.11).
Figure 4.11 Expected and observed performance on motor co-ordination standard scores for child care group
4.3.2. Relative risk for developmental delay in visual motor integration for child care group
The results indicated there was no relative risk of the Middle Childhood participants in the
residential child care group having a z score below -1 compared to the community group.
The relative risk however, was 0.68 (68%) for visual perception and 0.56 (56%) for motor
co-ordination, when the percentage of the residential child care participants with a z score
of -1 were compared to the community group.
0
10
20
30
40
50
60
70
80
-3 SD -2 SD -1 SD 0 1 SD 2 SD 3 SD
Observed Percentage Expected percentage
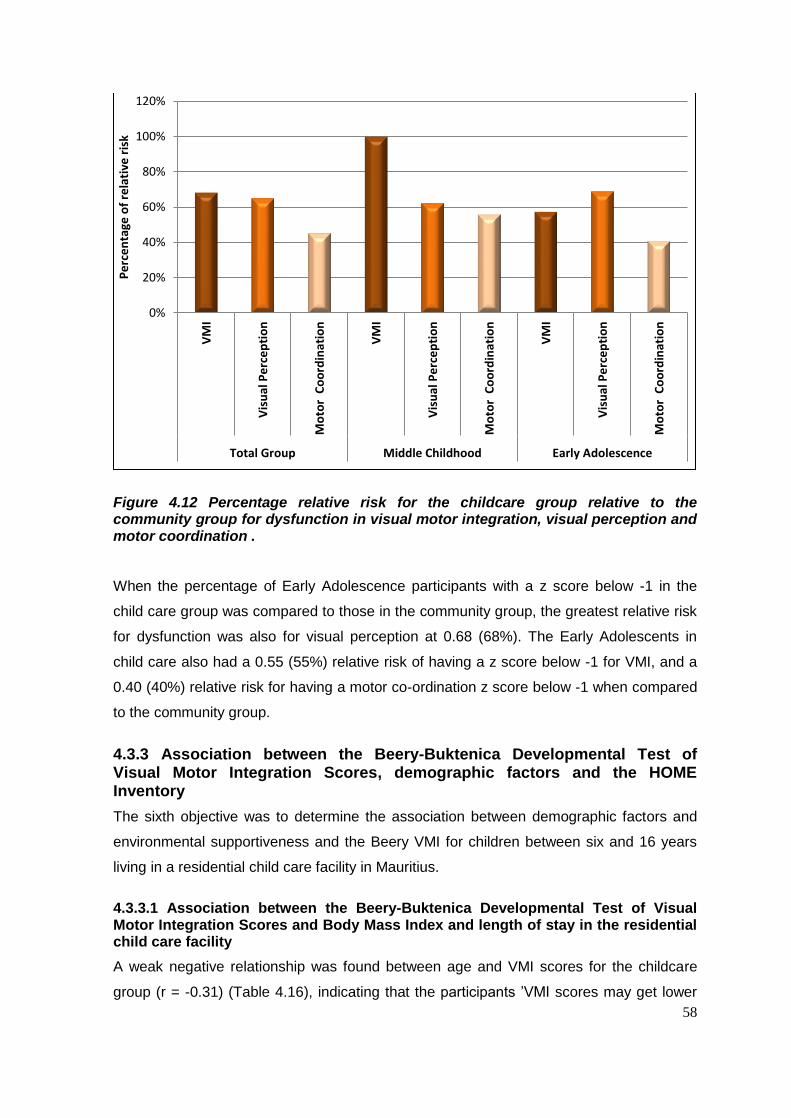
58
Figure 4.12 Percentage relative risk for the childcare group relative to the community group for dysfunction in visual motor integration, visual perception and motor coordination .
When the percentage of Early Adolescence participants with a z score below -1 in the
child care group was compared to those in the community group, the greatest relative risk
for dysfunction was also for visual perception at 0.68 (68%). The Early Adolescents in
child care also had a 0.55 (55%) relative risk of having a z score below -1 for VMI, and a
0.40 (40%) relative risk for having a motor co-ordination z score below -1 when compared
to the community group.
4.3.3 Association between the Beery-Buktenica Developmental Test of Visual Motor Integration Scores, demographic factors and the HOME Inventory
The sixth objective was to determine the association between demographic factors and
environmental supportiveness and the Beery VMI for children between six and 16 years
living in a residential child care facility in Mauritius.
4.3.3.1 Association between the Beery-Buktenica Developmental Test of Visual Motor Integration Scores and Body Mass Index and length of stay in the residential child care facility
A weak negative relationship was found between age and VMI scores for the childcare
group (r = -0.31) (Table 4.16), indicating that the participants ’VMI scores may get lower
0%
20%
40%
60%
80%
100%
120%
VM
I
Vis
ual
Pe
rce
pti
on
Mo
tor
Co
ord
inat
ion
VM
I
Vis
ual
Pe
rce
pti
on
Mo
tor
Co
ord
inat
ion
VM
I
Vis
ual
Pe
rce
pti
on
Mo
tor
Co
ord
inat
ion
Total Group Middle Childhood Early Adolescence
Pe
rce
nta
ge o
f re
lati
ve r
isk
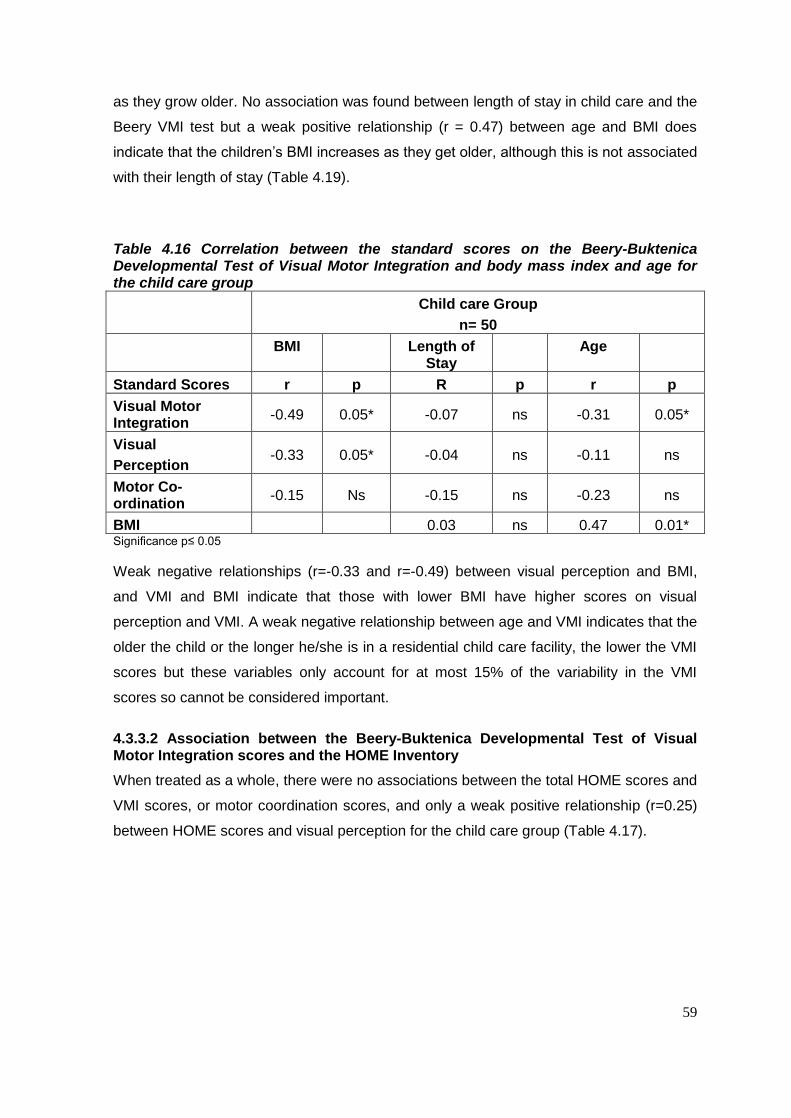
59
as they grow older. No association was found between length of stay in child care and the
Beery VMI test but a weak positive relationship (r = 0.47) between age and BMI does
indicate that the children’s BMI increases as they get older, although this is not associated
with their length of stay (Table 4.19).
Table 4.16 Correlation between the standard scores on the Beery-Buktenica Developmental Test of Visual Motor Integration and body mass index and age for the child care group
Child care Group
n= 50
BMI Length of Stay
Age
Standard Scores r p R p r p
Visual Motor Integration
-0.49 0.05* -0.07 ns -0.31 0.05*
Visual
Perception -0.33 0.05* -0.04 ns -0.11 ns
Motor Co-ordination
-0.15 Ns -0.15 ns -0.23 ns
BMI 0.03 ns 0.47 0.01* Significance p≤ 0.05
Weak negative relationships (r=-0.33 and r=-0.49) between visual perception and BMI,
and VMI and BMI indicate that those with lower BMI have higher scores on visual
perception and VMI. A weak negative relationship between age and VMI indicates that the
older the child or the longer he/she is in a residential child care facility, the lower the VMI
scores but these variables only account for at most 15% of the variability in the VMI
scores so cannot be considered important.
4.3.3.2 Association between the Beery-Buktenica Developmental Test of Visual Motor Integration scores and the HOME Inventory
When treated as a whole, there were no associations between the total HOME scores and
VMI scores, or motor coordination scores, and only a weak positive relationship (r=0.25)
between HOME scores and visual perception for the child care group (Table 4.17).
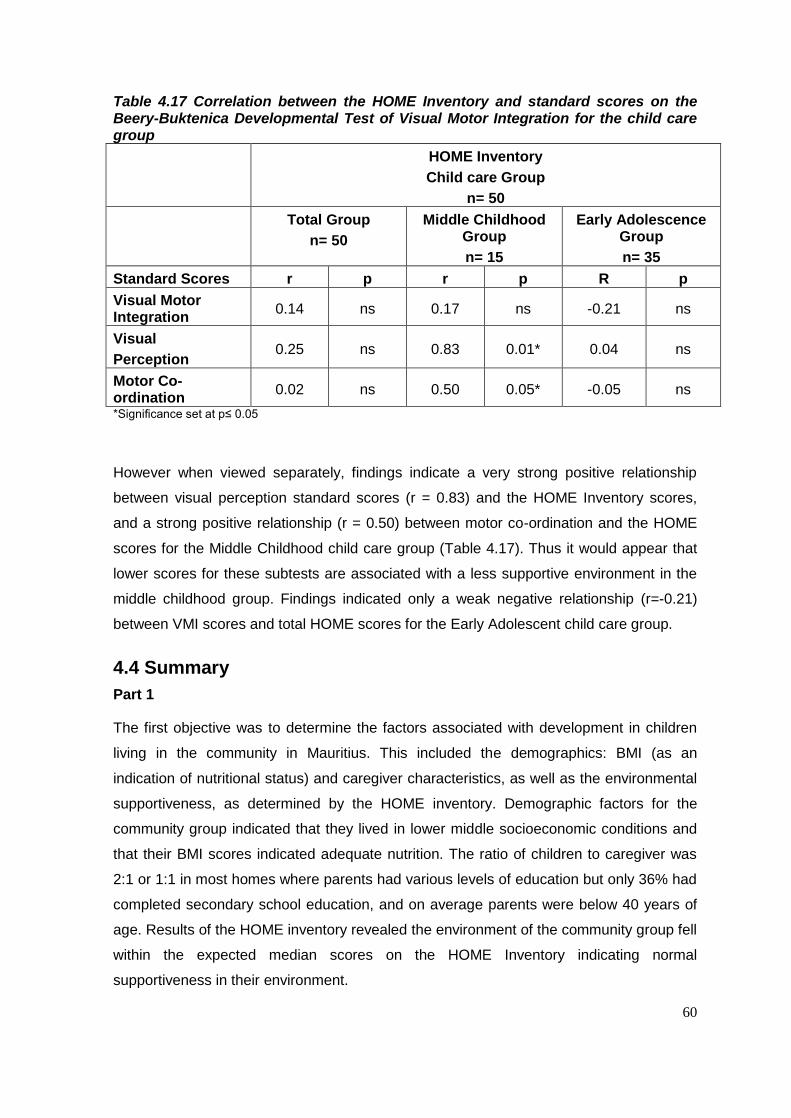
60
Table 4.17 Correlation between the HOME Inventory and standard scores on the Beery-Buktenica Developmental Test of Visual Motor Integration for the child care group
HOME Inventory
Child care Group
n= 50
Total Group
n= 50
Middle Childhood Group
n= 15
Early Adolescence Group
n= 35
Standard Scores r p r p R p
Visual Motor Integration
0.14 ns 0.17 ns -0.21 ns
Visual
Perception 0.25 ns 0.83 0.01* 0.04 ns
Motor Co-ordination
0.02 ns 0.50 0.05* -0.05 ns
*Significance set at p≤ 0.05
However when viewed separately, findings indicate a very strong positive relationship
between visual perception standard scores (r = 0.83) and the HOME Inventory scores,
and a strong positive relationship (r = 0.50) between motor co-ordination and the HOME
scores for the Middle Childhood child care group (Table 4.17). Thus it would appear that
lower scores for these subtests are associated with a less supportive environment in the
middle childhood group. Findings indicated only a weak negative relationship (r=-0.21)
between VMI scores and total HOME scores for the Early Adolescent child care group.
4.4 Summary
Part 1
The first objective was to determine the factors associated with development in children
living in the community in Mauritius. This included the demographics: BMI (as an
indication of nutritional status) and caregiver characteristics, as well as the environmental
supportiveness, as determined by the HOME inventory. Demographic factors for the
community group indicated that they lived in lower middle socioeconomic conditions and
that their BMI scores indicated adequate nutrition. The ratio of children to caregiver was
2:1 or 1:1 in most homes where parents had various levels of education but only 36% had
completed secondary school education, and on average parents were below 40 years of
age. Results of the HOME inventory revealed the environment of the community group fell
within the expected median scores on the HOME Inventory indicating normal
supportiveness in their environment.

61
The second objective was to determine developmental status of the between 6 and 16
years living in a community using the Beery VMI. These children fell within the expected
range although particularly their motor co=ordination was at risk for delay. The results
indicate that as expected only 5-10% of children presented with developmental delay
therefore indicating this is a valid test to determine development in this population. The
Early Adolescence group showed slightly more delay than the Middle Childhood group.
The third objective was to determine the association between the demographic factors.
HOME and VMI for children in the community and weak to no associations were found.
Part 2
The fourth objective was to determine the factors associated with development in children
living in a residential child care facility in Mauritius. The factors measured included the
demographics: age of participants’ care history (age of admission and length of stay), BMI
(as an indication of nutritional status) and caregiver characteristics (age, education level
and income), as well as the environmental supportiveness as determined by the HOME
inventory. For the children living in a residential child care facility, their BMI, particularly for
the Middle Childhood group, placed them at risk for malnutrition as 40% fell into the
extremely thin group. The caregivers in the child care group were also older and had more
children to care for, with a ratio of 6:1 to 9:1. The caregivers had a lower education level
with only 14% having completed secondary school.
The environment of the child care group is less supportive with the median score of 34.56
falling seven points below the accepted median for this group (Table 4.12). Deficits were
found for all the subtests of the residential child care facility groups on the HOME
inventory, except ‘modelling’ in the Early Adolescence group. When HOME scores for the
Middle Childhood child care group were compared to the Early Adolescence child care
group, differences were also seen, indicating the highest percentage of low scoring items
was for the Middle Childhood childcare group. This suggested that the Middle Childhood
child care group in the residential child care facility had the least supportive environment.
The fifth objective was to determine developmental status using the Beery VMI in children
between 6 and 16 years living a residential child care facility in Mauritius.
Delay was found for these participants as14% - 42% of participants scored below -2SD on
the Beery VMI test, particularly for motor co-ordination delay. When the Middle Childhood
and Early Adolescence group were examined separately, it was evident that the greatest
deficits were amongst the Early Adolescent child care population and the Early
Adolescent childcare group were most at risk for delay.
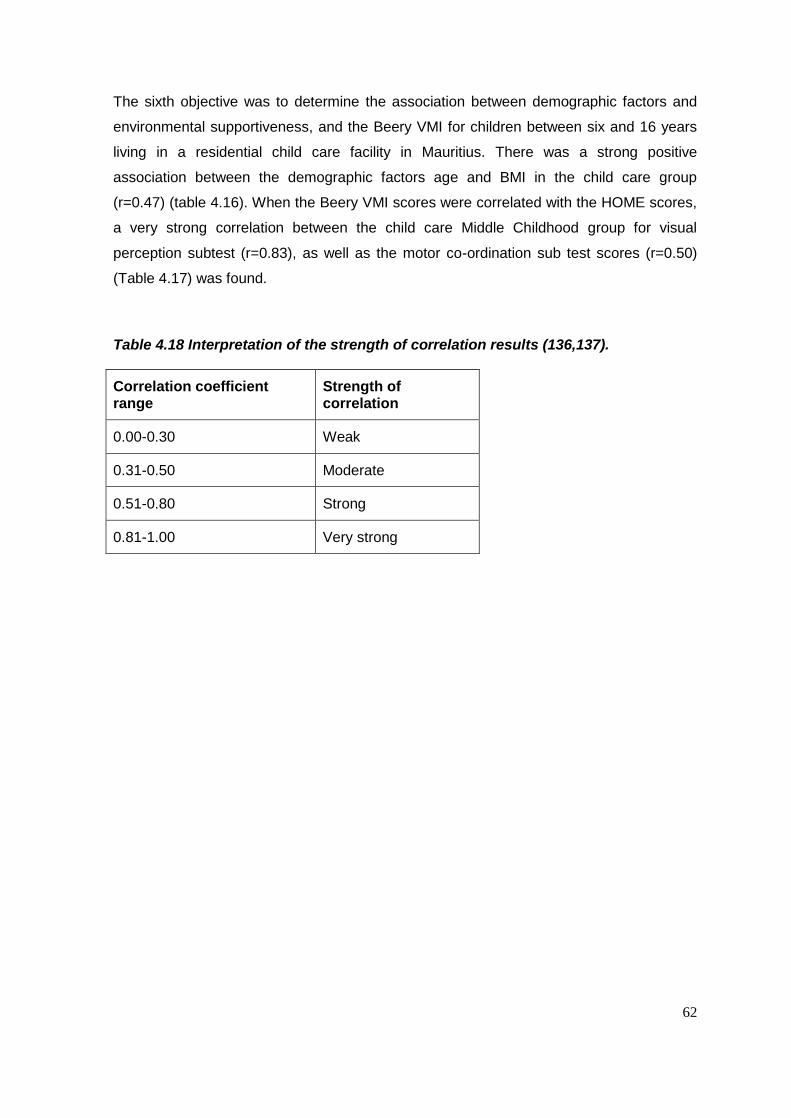
62
The sixth objective was to determine the association between demographic factors and
environmental supportiveness, and the Beery VMI for children between six and 16 years
living in a residential child care facility in Mauritius. There was a strong positive
association between the demographic factors age and BMI in the child care group
(r=0.47) (table 4.16). When the Beery VMI scores were correlated with the HOME scores,
a very strong correlation between the child care Middle Childhood group for visual
perception subtest (r=0.83), as well as the motor co-ordination sub test scores (r=0.50)
(Table 4.17) was found.
Table 4.18 Interpretation of the strength of correlation results (136,137).
Correlation coefficient range
Strength of correlation
0.00-0.30 Weak
0.31-0.50 Moderate
0.51-0.80 Strong
0.81-1.00 Very strong

63
CHAPTER 5 DISCUSSION
5.1 Introduction
This chapter will first briefly discuss the demographics, environmental supportiveness (as
measured by the HOME inventory), associated with development of children living in the
community in Mauritius, as well as their developmental status (as measured by the Beery
VMI). These assessments provide a base line or standard for demographic factors and
validate the use of the HOME and Beery VMI for children in Mauritius, against which the
development of children living in a residential child care facility in the same country can be
evaluated, in terms of their developmental delay.
The first three objectives of the study concerned determining the factors associated with
development in children living in the community in Mauritius. The factors measured
included the demographics: BMI (as an indication of nutritional status) and caregiver
characteristics, as well as the environmental supportiveness as determined by the HOME
inventory. The second objective was similar except that investigated the child care group.
5.2 PART 1: Factors associated with development for children living in the community in Mauritius
5.2.1 Demographic factors
The first objective for Part 1 of the study was to determine the factors associated with
development in children living in the community in Mauritius. The factors measured
included the demographics: (as an indication of nutritional status) and caregiver
characteristics, as well as the environmental supportiveness as determined by the HOME
inventory.
The study involved 50 children living in the community in Mauritius between the ages of
six and 16 years the group was divided into a Middle Childhood group with ages six to 10
years and Early Adolescence with ages 11 to 16 years to accommodate the HOME
assessments.
The demographic information showed the care received by the community indicated that
most children lived with two parents with an average of two children household. Therefore
there was a high caregiver ratio of 1:1 or 1:2. Research shows links between father’s
presence in the home and youth mental health, as well as increasing the family’s ability to
generate income, and that better academic results are achieved when fathers are more
64
involved in their child’s school. In the NICHD (2000) study, they found that fathers and
grandparents were more likely to exhibit more positive care giving than providers. The
parents were at the average age in their late thirties as is expected of parents with young
and teenage children (69).
The parents of the children did, on average have 9.28 years of school education with 34%
having only a primary school education (Table 4.1). This is congruent with the pass rate at
primary school being 70% in Mauritius (94). The education range with some parents
having post school qualification reflects the heterogeneous spread expected in any
community.
The recorded income given in the interview was for the parent being interviewed and at an
average of 11,000 MUR this which was slightly higher than the average monthly income of
women in 2011, at 11000 MUR, but lower than the average salary of 20,050 MUR in
Mauritius and which places the parents in the middle to lower socioeconomic group (94).
In the community the participants’ nutritional status, which was determined by BMI for age
indicates that the group may be considered slightly undernourished (Table 4.2). However,
since the child BMI is not normed on the Mauritian population the results were also
compared to those from a Mauritian study by Caleyachetty, Rudnicka, Echouffo-Tcheu,
Siegel, Richards and Whincup, published in 2012. The incidence of underweight was
higher for the control (26%) and child care (46%) participants, than for the participants of
the previous study, which was 12.7%. The incidence of overweight and obesity is lower for
control (10%) and, child care (6%) participants, when compared to the previous study,
which found a prevalence of 25%. In the previous study the Indian children had a mean
BMI of 16.6 and the Creole children had a mean BMI of 16.8. This is comparable to the
results of the control group in the current study, which had a mean BMI of 16.17 (100).
This highlights the problem in the child care group, which had a mean BMI of 12.58.
5.2.2 The Supportiveness of the Environment
The first objective also considered the supportiveness of the environment for the children
between six and 16 years, in the community in Mauritius using age appropriate HOME
inventories. This assessment was chosen as it provides information about both the
physical and emotional/social environments of the children and adolescents. As
occupational therapists, both these contexts are of concern if the individual is to be viewed
in totality, in relation to their development (138). The median scores for all categories of
the HOME inventory suggest that the community children and adolescents lived in
physical and social environments that were conducive to normal development. No median
65
scores more than 2 points below those recorded as acceptable in the HOME
administration manual were found for this group, indicating their environment was
supportive (Table 4.5). This was true for both the Middle Childhood and Early
Adolescence groups.
The assessment and remediation of client factors and performance skills required for
academic tasks fall into the scope of the occupational therapist and are used to determine
the developmental status of a child in the educational occupational performance area (2).
Thus VMI was assessed in the participants in the community to establish if validity of this
assessment in determining the developmental status of this group of children as there is
no reported studies on the use of this assessment in Mauritius
5.2.3 Visual Motor Integration
The second objective was therefore to determine the VMI of the children between six and
16 years, in the community in Mauritius, using the Beery VMI, and the third objective was
to establish if any association between the supportiveness of the environment,
demographic factors and VMI scores for these participants.
The mean and standard scores on the Beery VMI, as well as the two subtests, fell within
acceptable norms for the community group (Table 4.6), with slightly lower scores for the
motor co-ordination subtest. The results showed an essentially normal distribution with the
incidence of developmental delay below -2 SD being in the accepted range of 5-10%
(Figure 4.4). The slightly lower scores can be attributed to the use of a test normed in the
USA in Mauritius as it is unlikely that the population will represent exactly the same VMI
profile.
The children in the Middle Childhood group had slightly better scores than those in the
Early Adolescence group. This indicates that the VMI ability seems to decline slightly in
this group for children older than 10 years of age except for motor co-ordination. As
explained by Stromswold et al (2012)(113) VMI is strongly related to genetic component
however, because schools explicitly teach copying as children get older, the impact of
environmental factors of instruction at school also affects the level of VMI ability eventually
obtained. Thus for the older participants other environmental factors like the quality of
their schooling, should be researched to account for significantly lower level of their VMI
scores, which did not keep up with their age. An additional explanation could be the lack
of physical activity related to the amount of time children spend in private tuition, which
was highlighted in a government publication in Mauritius in 2011. This limits the time that
children have to engage in physical activities (126).

66
5.2.4 Association between the factors associated with development, the environment and Visual Motor Integration
The finding mentioned above in relation to age and VMI was confirmed by the weak
negative correlations between age and the VMI and visual perceptual Beery VMI scores
(table 4.7). This could be due to increased academic demands, with children spending
more time studying than engaging in physical activity.
A weak correlation between total HOME scores and Beery VMI scores (r = 0.39) for the
community group (Table 4.8) confirms that the supportiveness of the environment (as
measured by the HOME) does have a low association with VMI, and that better resourced
and supportive homes may result in children having higher VMI ability. These only
account for less than 20 % of the variance however, indicating that other factors are more
important in influencing VMI scores for this group. This only supports the research which
shows that HOME scores are related to cognitive development to a small degree (17,73).
Nutritional status was also shown to have little to no impact on Beery VMI scores for the
community group and the scores for both aspects were normally distributed (Table 4.7).
The demographic factors determined for the children living in the community in Mauritius
indicated they came from supportive environments in middle to low socioeconomic
circumstance and that their developmental status as measured on the Beery VMI could be
considered to fall into the mean average range. It was therefore assumed that the same
assessments and determination of demographic factors could be used to ascertain the
developmental status of a group of children living in a residential child care facility in
Mauritius.
5.3 PART 2: Factors associated with development for children living in a residential child care facility in Mauritius
5.3.1 Demographic factors
The fourth objective of the study was to determine the factors associated with
development in children living in a residential child care facility in Mauritius. Due to the
lack of background information on the residential child care facility group, the complexity
of environmental circumstances, and differences between individual children in general,
only a limited number of variables were considered, when exploring the factors influencing
development. The factors measured included the length of stay and age of admission of
the children to the residential facility, as well as their BMI (as an indication of nutritional
status) and caregiver characteristics.

67
This part of the study involved 50 children between the ages of six and 16 years living in a
residential child care facility, providing long term care for children who could no longer be
accommodated in the community. As with the community group the group was divided
into a Middle Childhood group with ages six to 10 years and Early Adolescence with ages
10 to 16 years, to accommodate the HOME assessments.
The early years of the child care facility children’s lives are unaccounted for, due to limited
access to the participants’ records. According to Little et al. (2005)(37) most often children
in residential care in the USA are from low socioeconomic backgrounds, which is quite
likely to be the case in Mauritius, and for this study. Most had been placed in residential
care in early childhood, and not as infants, with reports of family neglect as the reason for
admission, which is internationally associated with poverty and low SES (15). It is possible
that it is these unknown factors that influenced the majority of children who may have
spent their early formative years in adverse environments that were not optimal for their
development, and an assumption that the children were from low socioeconomic
circumstances prior to their admission to the child care facility was made. This means they
were probably exposed to these situations prior to their admission to the residential child
care facility, which may have contributed to developmental delay. The effects of living in
these environments may be reflected in the results for BMI and developmental delay
discussed later.
The age of admission and length of stay in the residential child care facility, were
compared between the Middle Childhood and Early Adolescence groups. The Early
Adolescence group were admitted on average two years younger than those in the Middle
Childhood group, a significantly younger age, and had stayed for a significantly longer
period in the residential child care facility than those in the Middle Childhood group (Table
4.10). The participants had been in the facility between 14 months and 14 years (mean =
5.94 years) where they received care in a family-type setting. Although the residential
child care facility participants were cared for in a family-type environment, which has been
shown by previous research to be less detrimental to development than traditional
institutional care (36,79,82), the demographic information showed that the children were
exposed to factors that have been associated with developmental delay. This includes the
age and number of the caregivers as well as the caregiver’s income and education level
(Table 4.9). It is possible that these factors played a role in influencing the environment
the children lived in.
Child to caregiver ratios at the residential facility ranged from 6:1 and 9:1 which is high
and has been shown by previous research to affect developmental outcomes
68
(19,30,33,76,77,81). This would limit the amount of time the caregivers have to spend with
each child. The residential child care facility caregivers were also older, on average 13.2
years older than parents of children of a similar age living in the community (Table 4.9)
with a mean age of 52.8 years. This has also been shown to impact development (18,58)
as age will no doubt influence the amount of help and attention a caregiver can provide.
An older, single caregiver, will no doubt have less energy and time to fulfil a parenting
role, compared to a younger parent, with a spouse, higher income and fewer children (27).
The caregivers in the residential child care facility were all female which resulted in a lack
of male parent figures in the child care facility. Fathers have been considered very
important for the well-being of children (84). It has been postulated that the lack of male
role models could, later in life, have detrimental effects on male orphans as they seek to
develop healthy cross-gender relationships. The lack of a positive male influence in the
lives of young girls could also be detrimental in their development. To prevent these
problems, it is essential that male role models be introduced into the lives of children
(139).
The average level of education of the caregivers was lower than that for parents in the
community groups (Table 4.9), but the majority of the caregivers had received some form
of training, usually in-house, in child care (Table 4.9). However, the caregivers’ income
indicated that the caregivers received amongst the lowest salaries paid in Mauritius in
2011 (96) placing them in a low SES. While this does not necessarily reflect the SES of
the residential facility, the low salaries may be indicative of limited funding at the facility.
More importantly, children are being cared for by caregivers from a low SES and with
limited education, factors which have been shown to affect optimal development in
children (25,26).
The last demographic factor affecting development that was considered was the
participants’ nutritional status measured by their BMI for age. Research has demonstrated
the impact of nutrition on motor, psychosocial, academic and mental development
(101,102), so when considering developmental delay, nutritional status of the participants
must be considered as a contributing factor.
A comparison of z scores demonstrated that the child care group had a high percentage
(44%) of children who could be considered underweight. The average BMI of 12,58
compared to the average 16,6 reported by Caleyachetty et al for Mauritian children (100),
illustrates that the children in child care are less well nourished than those in the
community.

69
In the case of the child care group, it is possible that preadmission diet (and related BMI)
played a role in their nutritional status at the time of assessment. This is supported by the
finding from this study, that the Middle Childhood participants had the lowest BMI scores,
with an average z score of -2.73SD below the mean for their ages (Table 4.11), placing
them in the ‘thinness’ category of the WHO growth reference (10).
The finding for the Early Adolescence group showed that the same problem did not exist
in relation to their BMI of 16.3 which is close to the norm reported by Caleyachetty et al.
(2012) (100). The moderate association (r =0.47) between age and BMI (Table 4.16), for
this group of participants indicates that the BMI increases as they get older, or the longer
they remain in child care. This suggests that the child care facility supports the
improvement of the children’s nutritional status or that due to their earlier age of admission
they suffered less from the effects of a low SES in the preadmission environment. These
BMI results indicate that the child care environment may not provide an adequate diet.
5.3.2 The Supportiveness of the Environment
The fourth objective also considered the supportiveness of the environment for the
children between six and 16 years, in residential child care facility using the age
appropriate HOME inventories. The HOME allows for an assessment of the physical and
emotional environment which is important in a residential facility where any assessment of
deficits should address all aspects of the environment and not only the physical aspects,
which are often seen in residential care of young children as more important (69).
The difference for the child care participants in the HOME median scores were more than
seven points lower than the median indicating an unsupportive environment (Table 4.12).
The total score for the Middle Childhood group showed a greater deficit than that of the
Early Adolescence group. This shows that the environment of the eight Middle Childhood
homes at the child care facility was less suited to the children’s needs than for the 11
Early Adolescence homes. However, some of the homes housed children from both the
Middle Childhood and Early Adolescence groups. This finding may indicate the need of
the younger children for more support and assistance to develop in their environment.
Thus even if the environments for both groups are similar, the lack of support and
resources may affect the development of the younger children more.
An examination of the HOME subscales, according to the HOME manual scoring, for the
child care Early Adolescence group, shows problems in the following areas: ‘learning
materials’, ‘physical environment’, and ‘family companionship’ (Table 4.14). The problems

70
in the areas of ‘learning materials’ and ‘physical environment’ are possibly linked to the
child care facility being of a lower SES with limited funding.
Research supporting the important role of the physical environment in child development
is prolific (14,17,31,32,69). A closer view of the HOME inventory responses showed that
none of the adolescents had access to a computer, only one house provided access to a
musical instrument, only four houses provided access to materials for arts and crafts
and/or collections, and had board games available, and only two houses had a full shelf of
books visible, although seven of the eleven houses did provide access to at least 20
developmentally appropriate books, and every child had either a library card or their name
on a library list.
In addition, the environment was considered too noisy in ten of the houses. Nine of the
houses didn’t have sufficient suitable pictures, and all the homes had less than 100
square feet of living space. Although the space in the homes of the children in the
residential child care facility was limited, they had additional facilities, such as a large
dining area and communal grounds, which all the participants had access to, which could
be said to make up for the small living space.
An examination of the scores for ‘family companionship’ shows zero for all items. This
implies a general lack of outings, highlights the lack of a father figure, and a lack of visits
from relatives or friends. An examination of the ‘family integration’ category (median = 0)
demonstrates how the absence of a father or father figure, influences family integration,
as all the items refer to time spent with a father (or father substitute), and time spent with
the mother and father together. The role of mother and father is therefore placed on the
shoulders of the caregiver. Ball and Moselle (2007)(84) reviewed the literature on the
effects of absent fathers on child well-being and the positive care that fathers give when
compared to care providers (who were not related) in residential care facilities (69).
Research linking father involvement and child development is limited, although this aspect
should be examined further in relation to residential child care.
An examination of the eight HOME subscales for the child care Middle Childhood group
highlighted problems in more areas (Table 4.13), although those that were problematic
were similar to the Early Adolescence group. These were ‘learning materials and
opportunities’, ‘family companionship’, ‘family integration’ and ‘physical environment’.
None of the caregivers were recorded to buy and read a newspaper on a daily basis. It is
however possible that they stayed informed of current events by listening to the radio, or
from the television. Only one of the houses in the residential child care facility had a
dictionary, only two houses provided free access to tapes, CDs or radio. In terms of
71
access to other resources only one house provided access to a musical instrument and
only two houses provided free access to at least ten appropriate books.
The category ‘family companionship’ was affected by low scores for most items. None of
the houses visited or received visits from friends or relatives at least twice a month, only
one house had a child/ren accompanying the caregiver on a family business venture three
to four times within the past year and only one house had taken a child on a trip more than
50 miles from home. Two of the houses recorded that the children had been visited by a
friend in the past week indicating a possible lack of integration of the participants into the
community in which they live. The lack of visits and visitors could result in the children
feeling isolated from the outside community. It appears that the participants were
dependent on other children in the facility for companionship and friendship.
One caregiver had assisted the children to achieve advanced motor skills, such as bike
riding, skating, ball playing etc. The lack of involvement by the other caregivers in aiding
the children with motor skills is most likely due to a lack of time, and possibly due to their
more advanced age. It is possible that in the context of a residential child care facility such
as this, that the older children (from the Early Adolescence group) would play this role
and/or the management of the facility. This emphasises that even within the family-type
residential child care environment, there are factors related to individual caregivers that
affect the amount of stimulation provided to the children in their care. While this is also
true in any family, caregivers in residential child care facilities need to be aware of the
greater risk of delay in the children they care for, so an effort can be made to address
some aspects like motor skills.
It was found that HOME subscale scores were higher for the categories, ‘encouragement
of maturity’, ‘emotional climate’, and ‘enrichment’, relative to scores for the other
categories for the participants in residential child care, even though they were still
significantly lower than the expected medians for the HOME indicating a support
environment.
The lack of emotion and social supportiveness in residential care is supported by Frank et
al (1996)(74), who stated that children growing up in a child care facility were more likely
to be psychiatrically impaired and Vorria et al (1998)(70) who evaluated only boys, found
that the boys in institutions were more likely to have emotional and behavioural problems
than family reared boys. Sigal, Perry, Rossignol and Ouimet (2003)(32) showed that a
randomly selected group of middle aged people who had been in a residential child care
facility since birth, had higher rates of psychosocial dysfunction and chronic stress-related
illness, compared to matched people in the community. Therefore, when it comes to

72
socio-emotional development (70), the residential child care facility environment is often
described as having a poorer quality, which does not promote development (33,72,73,83).
In this study the social environment was reported as being more adequate than the
physical environment. This is possibly due to the family-style care practiced and access to
psychological counselling. It is clear however that the participants, although they attend
school in the community, are not integrated into the wider community.
Literature has indicated that the lack of a supportive physical environment, linked to low
SES (109), as well as inadequate diet (101,102), as found for the participants in child care
in this study, can be associated with deficits in children’s academic performance. The
assessment and remediation of performance skills required for academic tasks fall into the
scope of the occupational therapist and are used to determine if there is developmental
delay, which may affect the educational occupational performance area (4). Thus VMI was
assessed in these participants to determine the association of this skill with the results
described above relating to objective four.
5.3.3 Visual Motor Integration
The fifth objective was therefore to first compare the VMI of the children between six and
16 years, in the child care group using the Beery VMI, and the sixth objective was to
establish if any association between the supportiveness of the environment, demographic
factors and VMI scores could be demonstrated
The child care group had between 13% to 40% of participants whose scores fell below -
2SD indicating developmental delay in VMI and the two subtests. The mean scores fell
within the ‘below average’ range, with the lowest scores being for the motor co-ordination
subtest (mean standard score 82.08), the VMI mean standard score being 88.38, and the
visual perception being 88.12 (Table 4.15).
This differs from the findings of the South African study by Van Heerden et al (2011)(45)
who investigated the VMI of children in residential care facilities, and found children in
these facilities to have more problems with the visual perception subtest (mean standard
score 84.38) than motor co-ordination (mean standard score 92.78). They however also
found below average standard scores for VMI. However, comparing children between
nations (with multiple environmental and possibly even genetic differences) is less helpful
than comparing results typical children in the same country living in a community which
supports development.
The relative risk for delay in the Beery VMI scores of the participants living in the
residential child care facility was for visual perception at 68%. This Middle Childhood
73
group was more at risk for motor co-ordination delay relative to norms for the Beery VMI
at 56% with the Early Adolescence group only having a 40% risk. The Early Adolescence
group also had a 0,55 (55%) relative risk of having a z score below -1 for VMI. This
indicates a difference between the Middle Childhood group and the Early Adolescence
groups on the VMI scores.
The mean VMI and subtest scores for the Middle Childhood group fell into the – 1SD
range (Table 4.15). There was a significant difference between the VMI scores of the
Middle Childhood participants and the Early Adolescence participants while the mean VMI
and subtest scores for the Early Adolescence group being lower (Table 4.15) indicating
that the VMI deficit becomes bigger, and more of a concern, as children reach 10 years of
age and older. This supports the findings for the community group in relation to genetics
and school experience. Adolescents in the residential facility group however continued to
demonstrate lower motor co-ordination scores. This may be related to the lack of
exposure to physical activity in the facility.
Occupational therapists typically work with younger children when remediating VMI
difficulties (112), due to early intervention being more effective (57,69). This is probably
the area that should be addressed in the child care facility, so that children’s VMI scores
don’t decrease as they grow older. Being aware of the deficits in VMI for the Early
Adolescence group is still important in understanding and supporting them in the
educational occupational performance area.
5.3.4 Association between the factors associated with development, the environment and Visual Motor Integration
The association between age and VMI was further confirmed by the low negative
correlation (-0.31) between age and VMI scores for the child care group (Table 4.16). This
was found in other studies in residential care (45) and may also indicate that the impact of
institutional living on developmental delay will increase, the longer children are in care
(40,42,43), despite no association being found between length of stay and VMI.
Deprivation and living in a child care facility have been shown to have an impact on child
development (14,16,18,21,35,37). It was therefore anticipated that low HOME scores
would be associated with the poor performance on the Beery VMI. However, no
association between total HOME scores and Beery VMI for the Early Adolescence group
in particular, were found (Table 4.17). It appears that the supportiveness of the
74
environment (as measured by the HOME) has little relationship to the Beery VMI scores
for this age group, irrespective of whether they live at home or in a child care facility.
Therefore it appears that the developmental delay for VMI, for the Early Adolescence
group as suggested above, are more related to the quality of their education, and the
effects of a low SES situation before and after being admitted to residential care (15).
However, the results for the Middle Childhood group did show very high and high
associations between the Beery VMI subtest scores and HOME scores for the Middle
Childhood child care group only (Table 4.17), which was the smallest (n=15) of the two
groups. This number is too small to draw conclusions from, but indicates that for this age
group a more supportive living environment may have an effect on the visual perception
and motor co-ordination of the participants.
There was no association found between VMI and other factors assessed in this study
such as length of stay (Table 4.16) even though research has showed that length of stay
in a residential child care facility is associated with developmental delay (78). However, it
is expected that a child staying in an unsupportive environment will suffer increasing
delays as they lag further behind in their development.
Nutritional status was also shown to have little to no impact on Beery VMI scores.
Moderate negative correlations (r = -0.49) were found between the VMI test and BMI, and
the visual perceptual subtest and BMI (r=-0.33) (Table 4.17), indicating that the better
nourished children are, the lower their VP and VMI scores. This unexpected result can be
explained only by the small sample size, as there is no literature that shows that
undernourished children have better developmental outcomes than those who are better
nourished, but countless studies show the opposite (12,38,103,104). With no records of
preadmission environment it is possible that the pre-admission environment also played a
role in influencing BMI and Beery VMI scores obtained (41).
5.4 Limitations of the study
5.4.1 Data collection
A small sample size (n=50 per group) limited the statistics applicable when the group was
divided into Middle Childhood and Early Adolescence groups, as this reduced the sample
size further, with the smallest group having only 15 participants. The parent income
should have included family income in the community group, and not only the income of
the parent interviewed. Household income would have given a clearer idea of the income
available. Income for the community group was within a range and was not specific, as is

75
expected to maintain some confidentiality. In addition the lack of background information
on the children in child care made it impossible to rule out pre-admission circumstances
as possible contributors to the Beery VMI results. When considering income affecting child
development for the child care facility, this was difficult to ascertain. Although the budget
per child was 2576MUR it is not clear how this money is spent and then how this would
compare to what is spent on a child in the community. It is possible that when comparing
community and child care facilities that more is spent on the children in the child care
facilities. The community group income may need to cover items or services which in the
child care facility may fall under the budget of the facility and not the child’s budget.
The community and child care group had unequal sampling ages due to the random
selection used to select participants in the child care facility. Due to the lower number of
younger children more early adolescence participants were selected. This does reflect the
age distribution of children in the child care facility.…
5.4.2 Test administration
5.4.2.1 Administration of the assessments
The administration of both assessment tools was done by the research assistant, who
was a newly qualified occupational therapist, with no post-graduation work experience. .
The services of a research assistant were used to complete the assessments as he was
able to interview the caregivers in their home language. Although the research assistant
practiced the assessments and followed standard administration procedures, he did not
receive formal training in test administration. These factors may have affected his
observation skills and efficiency in test administration, which may have affected the
results. As he conducted 100 Beery VMI assessments and HOME assessments he would
have become more proficient toward the end – possibly jeopardising the scores of the
children and families assessed at the beginning.
5.4.2.2 Beery VMI
When administering the Beery VMI, some of the Beery VMI subtest assessments were
conducted in groups of 2 or 3 children, which resulted in some lack of consistency in
administration.
As Beery VMI assessments were analysed and scored by the researcher (who did not
know the children), and HOME scores were calculated by the researcher. This will have
made up somewhat for the lack of formal training in test administration.
76
5.4.2.3 HOME Inventory
The administration of the HOME requires more skill. The research assistant was required
to complete this assessment as he was able to interview the caregivers in their home
language. He may however not have identified some observable indicators in body
language and the environment as he was inexperienced. For the Middle Childhood and
Early Adolescence assessments, interview information is required for almost two-thirds of
the items. Thus good interviewing techniques are deemed essential for the administration
of the HOME. Of the 59 items contained in the Middle Childhood scale, only 19 are clearly
observation items; with the remaining 40 most often requiring interview. For the EA
HOME approximately one third of the items are scored by observation (126). This brings
to the fore one of the problems of using a self-report assessment tool like the HOME. It is
possible that when interviewed, the caregivers provided more positive answers for certain
aspects of care that could reflect on their competence or caring, and thus gave the answer
they thought was expected of them. For the Middle Childhood HOME, item 3, only three
(of the 11) caregivers said they did not praise the children at least twice during past week
for doing something, and only three caregivers admitted to losing their tempers more than
once during the past week (item 18). Only one caregiver admitted to more than one
incidence of physical punishment during the past month (item 19). These answers may
very well be true, although should also be interpreted with caution.
For the EA HOME caregivers may not have been honest about item 24, which indicates if
a caregiver has lost her temper with the adolescent more than once during the past week,
as it could reflect badly on their caregiving abilities. Only 9 of the 21 HOME assessments
indicated a negative response to this answer.
However, the HOME inventory was administered by the same person for all the
participants, so there was consistency. When administering the HOME inventory to the
child care children, the same caregiver was often responsible for more than one child in
the study. She was therefore interviewed with the children present who fell within the age
group for the HOME inventory being administered. With more than one child being
present this may have affected her responses, which may not have been the same for all
the children, and may therefore not have been entirely reflective of her relationship with
the child/children. With some of the caregivers being interviewed up to three times this
may have resulted in not sure if this would have had any effect.
It is important however to interpret these findings with the knowledge that the HOME
inventory is not designed for assessing children in child care facilities, and that some of
the areas could be altered to better assess the environment in a such a facility.
77
In addition, the median scores provided in the HOME inventory manual, for the Middle
Childhood and Early Adolescence groups was based on small sample sizes. The Middle
Childhood group, used for comparison purposes in the HOME inventory manual was
based on data collected from 124 children in Little Rock, Arkansas, in 1982-1983.
Approximately 50% of the sample was European American, while 50 % were African
American. The data collected for the norming of the EA group was collected in 1995-1996,
in Little Rock, Arkansas, San Antonio, Texas, New York, New York, and Los Angeles,
California. At 331 this sample was larger and more diverse than that of the Middle
Childhood group. Approximately 23% of sample were African American, 30% European
American, 17% Chinese American, 15% Dominican American, and 15% Mexican
American (126). These populations are both very different to the one in Mauritius.
The HOME was administered while the children involved in the study were present, which
in all cases was more than one child. This will have affected items that demanded a
judgement on caregivers interaction to an individual child, and was assumed that the
caregiver responded in a similar way to all the children, for example the item, ‘Parent has
not lost temper with child more than once during previous week’, demands a response
that may be different for all the children (126, p. 60).
The binary scale of the HOME limited the depth of information obtained, and so couldn’t
be used to make well informed judgments or decisions (131).
5.2.4.4. Body Mass Index
BMI was the only measure of nutritional status used, which is not as conclusive as using
multiple methods such as head circumference (134,140) and arm circumference (134).
Bhurosy and Jeewon (2013)(101) also used hip circumference in addition to BMI to
measure nutritional status of women.
5.5 Bias
The results may have been somewhat biased as some of the children in the community
group were friends and family of the research assistant. Other children were from an after
school tutoring programme which was attended mainly by Hindu children. These factors
were not considered when reviewing the results as were thought to play less of a role in
influencing child development than the environment as a whole (as assessed by the
HOME).
5.6 Summary
Part 1
78
The demographic factors assessed for the typical children in the community indicated that
the parent characteristics were congruent with supportive environments which meant on
average the children fell into a normal range for their developmental status. This was
confirmed by the demographics of the parents as well as the physical and emotional
environments found in their homes.
There developmental status was confirmed by the results on the Beery VMI with “average
“ results for both the Middle Childhood and Early Adolescence groups confirming that this
test could be used to assess development of VMI in this sample. There was very little
association between the environmental supportiveness measured by the HOME and the
VMI scores for this group indicating that other factors influenced their development in this
area including genetics and their schooling. A weak negative association between age
and VMI scores was found indicating some decrease in VMI and visual perception in the
Early Adolescence group although this was not true for the motor co-ordination subtest.
Part 2
The children living in the residential child care facility were exposed to a greater number of
demographic factors associated with risk for developmental delay, than typical children in
Mauritius. Factors were related to caregiver and child demographics including inadequate
nutritional status for the Middle Childcare group.
The environmental supportiveness in the facility was found to be deficient in terms of
‘learning materials’, ‘physical environment’, which is related to a lack of physical resources
in the facility and is probably indicative of low socioeconomic circumstances. The ‘family
companionship’ and ‘family integration scores’ indicated a problem with lack of father
figures and integration in the community surrounding the residential facility. Support from
caregivers and other children seem to provide emotional supportiveness with scores for
‘encouragement of maturity’, ‘emotional climate’, and ‘enrichment’, being less deficient.
The environment of the younger children was more deficient probably because they are
more dependent on their home environment than adolescents for stimulation and input to
develop.
In conjunction with exposure to these demographic factors and lack of a supportive
environment delays in VMI and the subtests were found for the participants. However
although a strong association was found for the Middle Childcare group between the
supportiveness of the environment and the Beery VMI scores it must be remembered that
79
a combination of factors can affect development. Further investigation of these factors is
needed, as the Middle Childcare group was a very small sample.
80
CHAPTER 6 CONCLUSION
With occupational therapy being a relatively new profession in Mauritius, and an absence
of published research on the impact of residential child care facilities in Mauritius, the
information needed to guide interventions is limited. This study hoped to highlight the
developmental status and the assessment of this for typical children living in the
community in Mauritius and to determine the effects of living in a residential child care
facility of development in the same country. This would assist to identify areas in need of
attention in terms of development in children living in residential child care facilities in
Mauritius.
The study investigated demographic factors associated with development, environments
and visual motor integration of children in Mauritius, and found:
That for typical children between six and 16 years living in the community
presented with a normal range of development, with little association between
demographic factors associated with development, the supportiveness of their
environments measured by the HOME and their VMI measured using the Beery
VMI.
That children between six and 16 years living in a residential child care facility
presented were exposed to greater numbers of demographic factors associated
with developmental delay and deficits in the supportiveness of their environments.
In conjunction with this they were found to have developmental delay in their VMI
scores. There was a strong association between demographic factors as well as
association between the supportiveness of their environments and their VMI
scores for the younger children, although these need to be interpreted with care.
6.1 Recommendations from the research
Delays in VMI, and inadequate environmental support for development and low BMI were
all factors that were found for the child care participants in this study. Targeting these
areas, as well as those identified through the HOME inventory will provide increased
support for the children in the residential child care facility. Occupational therapy
intervention has been shown to have positive effects on the VMI of pre-school children (8),
as well as the motor and visual performance of children with fine-motor delays (57). This
is supported by certain USA studies which show improvement in self-concept, self-control,
behaviour problems, and psychiatric disorders, showing that if the setting is ‘right’ then

81
placement can be beneficial (39), and Thompson and Smith (1996)(114), who found that
the academic achievement of children living in institutions improved when they
participated in a specialised programme.
Based on this it would be worth examining the services offered to the children in the child
care facility studied, as improvements in their day-to-day programme may help. It may
also be worth examining the prevalence and effectiveness of current child development
programmes in Mauritius, as child development programmes targeting young children, in
low SES groups have been effective in facilitating and promoting childrens’ and
adolescents’ development (22). Walker et al (2007)(103), show strong evidence for early
cognitive stimulation to improve cognitive abilities, therefore the earlier any programme is
implemented the better.
Although this study did not support the link between environmental supportiveness and
VMI, it remains necessary for the environmental inadequacies to be addressed. Research
has shown that an environment can be more stimulating if a home is spacious, well
equipped, has well organised space, and varied materials for children to engage in their
daily occupations (71). With low scores for the HOME categories - physical environment,
learning materials and opportunities, learning materials, family companionship and family
integration, it may be worth targeting these areas, to increase the supportiveness of the
environment for child development. Facilitating visits from children or families from outside
the child care facility, as well as visits to friends, relatives and places of interest can only
be beneficial.
The lack of physical educational resources such as computers needs to be addressed, as
well as the inadequate availability of books. With regards to the level of noise it is possible
that this varies according to the time of day and is no doubt difficult to control. However, if
not already in place, it is recommended that a fixed period of time be allocated to
homework or quiet time, when the child care facility management limits the noise levels,
allowing the children to concentrate on their homework. Increasing the availability of
media, such as CD players and radios may help the children develop an appreciation for
music, current affairs and develop language skills.
Research supports parental involvement in aiding the development of their children
(93,141). Groups for support and obtaining information, within the residential child care
facility or externally, may assist the caregivers in improving the care provided for the
children, through an increased awareness of the difficulties the children face, an ability to
share ideas and gain knowledge, as well as a way for the caregivers to feel valued. With
the caregivers being older and having many children to care for, the careful use of
82
community volunteers could offer a practical solution, especially in the area of the physical
development of the children. Volunteers could help with the more advanced skills, such as
ball skills, skating and bike riding. Literature has however cautioned the use of volunteers,
to ensure that volunteers are committed to remain ‘stable figures’ in children’s lives’ (59, p.
969). However, it can be argued that it would depend on what they are doing. A few visits
from a football professional would not have a negative effect, whilst someone who
engages on a personal level with the children would cause a greater impact when he/she
left. It would be necessary to check references of all volunteers, establish their availability
and skills, and agree on the hours they would be willing to commit.
The development of VMI can be targeted through an increase in physical activities and
sports offered to the children, as well as increased participation in fine motor activities.
The child care facility did not appear to have sporting facilities, so it may be necessary to
use facilities available in the community. The space available however may allow for
sports such as basketball (where a ball, board, hoop and net are the only essentials),
netball (using this same net) and ping pong. There is a large park nearby which the
children could visit, where there are apparatus to climb, as well as space to kick balls and
ride bicycles. There are many games involving jumping and running, which could also be
encouraged if the setting is right. Fine motor activities such as knitting, sewing, arts and
crafts can be facilitated and encouraged.
With a programme targeting the physical development of the participants, improvements
in VMI would be anticipated. The Beery VMI administration, scoring and teaching manual,
suggests their booklets aimed at developing VMI. These however only cover the zero-to-
six age group. Early intervention is best (64), but not possible for most of the participants,
especially the EA group.
It is recommended that the children with ‘low’ and ‘very low’ scores for any of the subtests
receive further assessment and intervention by an occupational therapist. This could be
done through the child care facility or the schools. Whalen (2003)(2, no p.) cites various
research papers which support the role of occupational therapy in schools. This is yet
another route through which the participants could be assisted. The author also supported
consulting and educating the adults in the children’s home and school environment, ‘to
ensure an understanding of and match between the child's skills and abilities and the
expectations placed on them in the school setting’, as well as recommending task
modifications, and assistive devices ‘to optimize the child's performance in the school
setting’.
83
Results indicated that the participants’ BMI improved as they grew older, or the longer
they were in child care, indicating that their nutritional status improved while in care.
However, with the nutritional status of the children in child care still being significantly
lower than the community group, it is worth examining the diets of the participants, as
literature supports the link between child cognitive and general development, and
nutritional status (103). It should also be considered that the Mauritian population may
have a different body build which may impact BMI, although the WHO growth standards
confirm that ethnic differences among groups, as well as genetic differences between
individuals, are not considered large enough to invalidate the WHO growth standards
being used as a standard in any population (137). It would therefore be best to involve a
nutritional expert and keep records of the children’s weight to monitor changes in weight.
5.8 Recommendations for further research
In order to establish if the environment prior to admission to the child care facility played a
role in the Beery VMI scores it would be worth conducting a longitudinal study, comparing
VMI on admission, versus VMI a few years later. Establishing if length of stay impacts VMI
could be done by repeating the Beery VMI assessments, with the same group of
participants. An experimental design could be used to determine the impact of fine and
gross motor activities on the development of VMI, especially amongst older children.
As SES has been shown to impact child development in such a tremendous way, it would
be worth measuring this more accurately to determine the role it plays in the lives of the
children in the residential child care in Mauritius. Research aimed at improving their skill or
home environment would also be beneficial.
As the HOME inventory specifically mentions a ‘father’ or ‘father figure’ it would be worth
examining the impact of a single female caregiver versus a two parent (male and female)
family.
A larger study would allow for a factorial analysis of all HOME subscales relative to Beery VMI.

84
REFERENCES
1. Evans GW. Child Development and the Physical Environment. Annual Review of Psychology [Internet]. 2006 Jan [cited 2013 Oct 23];57(1):423–51. Available from: http://www.annualreviews.org/doi/abs/10.1146/annurev.psych.57.102904.190057
2. S. Sahagian Whalen. Effectiveness of Occupational Therapy In the School Environment - CanChild [Internet]. CanChild, Centre for Childhood Disability Research. 2003 [cited 2014 Feb 24]. Available from: http://www.canchild.ca/en/canchildresources/effectivenessofot.asp
3. Farah MJ, Betancourt L, Shera DM, Savage JH, Giannetta JM, Brodsky N l., et al. Environmental stimulation, parental nurturance and cognitive development in humans. Developmental Science [Internet]. 2008;11(5):793. Available from: http://www.psych.upenn.edu/~mfarah/Development-EnviroStimParentalNurt.pdf
4. Child Development, Definition(s) of [Internet]. Work and Family Researchers Network. 2010 [cited 2014 Feb 27]. Available from: https://workfamily.sas.upenn.edu/glossary/c/child-development-definitions
5. Jane Case-Smith, editor. Development of hand skills. Occupational therapy for children. 5th ed. St. Louis: Elsevier Mosby; 2005. p. 304–55.
6. Dankert HL. Occupational therapy effects on visual-motor skills in preschool children. American Journal of Occupational Therapy. 2003;57(5):542–9.
7. Sanghavi R, Kelkar R. Visual-motor integration and learning disabled children. The indian journal of occupational therapy [Internet]. 2005 [cited 2013 Nov 24];37(2):33–5. Available from: http://medind.nic.in/iba/t05/i2/ibat05i2p33.pdf
8. Ministry of gender equality, child development and family welfare. Child Development Unit [Internet]. [cited 2013 Oct 9]. Available from: http://gender.gov.mu/English/Pages/Units/Child-Development-Unit.aspx
9. World Health Organisation. Country Cooperation Strategy, at a Glance, Mauritius [Internet]. 2009 [cited 2013 Oct 21]. Available from: http://apps.who.int/iris/bitstream/10665/70360/1/WHO_DGR_CCO_09.03_Mauritius_eng.pdf
10. World Health Organisation. Growth reference data for 5-19 years. 2013.
11. Sherr L. Young children and HIV/AIDS: mapping the field. The Hague: Bernard van Leer Foundation; 2005.
12. Morris K. Shedding light on the role of poverty in brain development. The Lancet Neurology [Internet]. 2008;7(8):676–7. Available from: http://0-www.sciencedirect.com.innopac.wits.ac.za/science/article/pii/S1474442208701546
13. Aikens NL, Barbarin O. Socioeconomic differences in reading trajectories: The contribution of family, neighborhood, and school contexts. Journal of Educational Psychology [Internet]. 2008 [cited 2013 Nov 26];100(2):235–51. Available from: http://doi.apa.org/getdoi.cfm?doi=10.1037/0022-0663.100.2.235
14. Hill Z, Kirkwood BR, Edmond K, World Health Organization. Family and community practices that promote child survival, growth, and development: a review of the
85
evidence [Internet]. Geneva: World Health Organization; 2004. Available from: http://www.coregroup.org/storage/documents/CCM/who_keyfamilypracticesevidence.pdf
15. Balbernie R. Circuits and circumstances: The neurobiological consequences of early relationship experiences and how they shape later behaviour. Journal of child psychotherapy [Internet]. 2001 [cited 2013 Nov 24];27(3):237–55. Available from: http://www.tandfonline.com/doi/abs/10.1080/00754170110087531
16. Grantham-McGregor S, Cheung YB, Cueto S, Glewwe P, Richter L, Strupp B. Developmental potential in the first 5 years for children in developing countries. The Lancet [Internet]. 2007 Jun 1;369(9555):60–70. Available from: http://0-www.sciencedirect.com.innopac.wits.ac.za/science/article/pii/S0140673607600324
17. Richter LMG. Home Environment and Cognitive Development of Black Infants in Impoverished South African Families. Infant Mental Health Journal. 1991 Summer91;12(2):88–102.
18. Zhou SJ, Baghurst P, Gibson RA, Makrides M. Home environment, not duration of breast-feeding, predicts intelligence quotient of children at four years. Nutrition [Internet]. 2007 Mar [cited 2013 Nov 24];23(3):236–41. Available from: http://linkinghub.elsevier.com/retrieve/pii/S0899900707000068
19. Barnes J. Using observations to evaluate paid child care settings. In: Petrogiannis K, Melhuish EC, editors. The Pre-school Period: Care - Education - Development: Findings from the International Research [Internet]. Athens: Kastaniotis; 2001 [cited 2013 Nov 24]. p. 395–440. Available from: http://www.familieschildrenchildcare.org/fccc_static_PDFs/researchers_Barnes.pdf
20. Letourneau N, Duffett-Leger L, Levac L, Watson B, Young-Morris C. Socioeconomic Status and Child Development: A Meta-Analysis. Journal of Emotional and Behavioral Disorders [Internet]. 2013 Jul 25;21(3):211. Available from: http://ebx.sagepub.com/content/21/3/211
21. Vorria P, Papaligoura Z, Sarafidou J, Kopakaki M, Dunn J, Van IJzendoorn MH, et al. The development of adopted children after institutional care: a follow-up study. Journal of Child Psychology & Psychiatry. 2006;47(12):1246–53.
22. Evans GW. The Environment of Childhood Poverty. American Psychologist [Internet]. 2004 [cited 2013 Oct 23];59(2):77–92. Available from: http://doi.apa.org/getdoi.cfm?doi=10.1037/0003-066X.59.2.77
23. Marjen Taylor Kulp. Relationship between visual motor integration skill and academic performance in kindergarten through third grade. Optometry & Vision Science [Internet]. 1999 Mar;76(3):159–63. Available from: ftp://ftp.successforall.org/Public/Vision/Kulp%201999.pdf
24. Yeung W-JJ, Pfeiffer KM. The black–white test score gap and early home environment. Social Science Research [Internet]. 2009 Jun [cited 2014 Jan 21];38(2):412–37. Available from: http://linkinghub.elsevier.com/retrieve/pii/S0049089X08001129
86
25. Lee V. The relative importance of home and school in the development of literacy skills for middle-grade students. American Journal of Education [Internet]. 1994 May;102:286–329. Available from: http://www.jstor.org/stable/1085739
26. Ertem IO, Dogan DG, Gok CG, Kizilates SU, Caliskan A, Atay G, et al. A Guide for Monitoring Child Development in Low- and Middle-Income Countries. Pediatrics [Internet]. 2008 Mar;121(3):e581–e589. Available from: http://pediatrics.aappublications.org/content/121/3/e581.abstract
27. Berger, L.M, Paxson, C W J. Income and child development. Children and youth services review. 2009 Sep;31(9):978–89.
28. Mistry RS, Benner AD, Tan CS, Kim SY. Family economic stress and academic well-being among Chinese-American youth: The influence of adolescents’ perceptions of economic strain. Journal of Family Psychology [Internet]. 2009 [cited 2014 Jan 19];23(3):279–90. Available from: http://doi.apa.org/getdoi.cfm?doi=10.1037/a0015403
29. Bradley RH, Corwyn RF. SOCIOECONOMIC STATUS AND CHILD DEVELOPMENT. Annu Rev Psychol [Internet]. 2002 Feb 1 [cited 2013 Oct 7];53(1):371–99. Available from: http://dx.doi.org/10.1146/annurev.psych.53.100901.135233
30. Zeanah CH, Nelson CA, Fox NA, Smyke AT, Marshall P, Parker SW, et al. Designing research to study the effects of institutionalization on brain and behavioural development: The Bucharest early intervention project. Development and Psychopathology [Internet]. 2003;15:885–907. Available from: http://0-proquest.umi.com.innopac.wits.ac.za/pqdweb?did=1409773521&sid=2&Fmt=2&clientId=57035&RQT=309&VName=PQD
31. Kimberly Kopko. The effects of the physical environment on children’s development [Internet]. Cornell University, Department of Human Development; [cited 2013 Oct 20]. Available from: http://www.human.cornell.edu/hd/outreach-extension/upload/evans.pdf
32. Sigal JJ, Perry JC, Rossignol M, Ouimet MC. Unwanted infants: Psychological and physical consequences of inadequate orphanage care 50 years later. American Journal of Orthopsychiatry [Internet]. 2003 [cited 2014 Jan 21];73(1):3–12. Available from: http://doi.apa.org/getdoi.cfm?doi=10.1037/0002-9432.73.1.3
33. Giese S, Dawes A. Child care, developmental delay and institutional practice. SAfrJPsychol. 1999;29(1):17.
34. Browne K, Hamilton-Giachritsis C, Johnson R, Ostergren M. Child health: overuse of institutional care for children in Europe. BMJ [Internet]. 2006 Feb 25;332:485. Available from: http://www.jstor.org/stable/25456232
35. Daphne Programme, World Health Organization, Regional Office for Europe, University of Birmingham, Centre for Forensic and Family Psychology. Mapping the number and characteristics of children under three in institutions across Europe at risk of harm. Birmingham: University of Birmingham, Centre for Forensic and Family Psychology; 2005.

87
36. Munoz-Hoyos A, Augustin-Morales MC, Ruiz-Cosano C, Molina-Carballo A, Fernández-Garcı́a JM, Galdó-Munoz G. Institutional childcare and the affective deficiency syndrome: consequences on growth, nutrition and development. Early human development [Internet]. 2001 [cited 2013 Nov 24];65:S145–S152. Available from: http://www.sciencedirect.com/science/article/pii/S037837820100216X
37. Little M, Kohm A, Thompson R. The impact of residential placement on child development: research and policy implications. International Journal of Social Welfare. 2005;14(3):200–9.
38. Fisher L, Ames EW, Chisholm K, Savoie L. Problems Reported by Parents of Romanian Orphans Adopted to British Columbia. International Journal of Behavioral Development. 1997;20(1):67–82.
39. Maclean K. The impact of institutionalization on child development. Development and Psychopathology [Internet]. 2003 Dec;15(4):853–84. Available from: http://0-proquest.umi.com.innopac.wits.ac.za/pqdweb?did=1409773481&sid=1&Fmt=2&clientId=57035&RQT=309&VName=PQD
40. Rutter M. Developmental catch-up, and deficit, following adoption after severe global early privation. Journal of Child Psychology & Psychiatry & Allied Disciplines. 1998;39(4):465.
41. Flanagan C. Early socialisation sociability and attachment [Internet]. London; New York: Routledge; 1999 [cited 2014 Feb 19]. Available from: http://public.eblib.com/EBLPublic/PublicView.do?ptiID=165570
42. Rens Z. The standardization of the Beery-Buktenica developmental test of visual-motor integration with supplemental developmental test of visual perception and motor coordination (4th edition, revised, 1997) on an Eastern Cape population aged 7 years 0 months to 7 years 3 months. 2009.
43. Van Heerden C, De Kock N, Larsen K, Knopjes M, Singh A, Franzsen D. Visual Motor Integration in Children living in Childcare Institutions in Gauteng. S AFR J OCCUP THER. 2011;41(1):38–43.
44. Mistry RS, Benner AD, Biesanz JC, Clark SL, Howes C. Family and social risk, and parental investments during the early childhood years as predictors of low-income children’s school readiness outcomes. Early Childhood Research Quarterly [Internet]. 2010 Oct [cited 2014 Jan 22];25(4):432–49. Available from: http://linkinghub.elsevier.com/retrieve/pii/S0885200610000074
45. Duncan GJ, Brooks-Gunn J, editors. Consequences of living in poverty for young children’s cognitive and verbal ability and early school achievement. Consequences of growing up poor. New York: Russell Sage Foundation; 1997.
46. Brooks-Gunn J, Duncan GJ. The effects of poverty on children. The future of children [Internet]. 1997 [cited 2014 Jan 14];55–71. Available from: http://www.jstor.org/stable/10.2307/1602387
47. Johnson R. Young Children in Institutional Care at Risk of Harm. Trauma, Violence, & Abuse [Internet]. 2006 Jan 1 [cited 2014 Jan 22];7(1):34–60. Available from: http://tva.sagepub.com/cgi/doi/10.1177/1524838005283696
88
48. Noble KG, Norman MF, Farah MJ. Neurocognitive correlates of socioeconomic status in kindergarten children. Developmental science [Internet]. 2005 [cited 2014 Jan 22];8(1):74–87. Available from: http://onlinelibrary.wiley.com/doi/10.1111/j.1467-7687.2005.00394.x/full
49. Development of Childhood Occupations. Occupational therapy for children. 6th ed. Maryland Heights, Mo: Mosby/Elsevier; 2010.
50. Case-Smith J, editor. Visual Perception. Occupational therapy for children. 5th ed. St. Louis: Elsevier Mosby; 2005. p. 412–46.
51. Beery KE, Beery NA. The Beery-Buktenica Developmental Test of Visual-Motor Integration, Administration and Scoring Manual. 5th ed. Minneapolis: NCS Pearson, Inc.; 2006.
52. Pienaar AE, Barhorst R, Twisk JWR. Relationships between academic performance, SES school type and perceptual-motor skills in first grade South African learners: NW-CHILD study: Academic performance and perceptual-motor development. Child: Care, Health and Development [Internet]. 2013 May [cited 2013 Oct 22];n/a–n/a. Available from: http://doi.wiley.com/10.1111/cch.12059
53. Carlson AG, Rowe E, Curby TW. Disentangling Fine Motor Skills’ Relations to Academic Achievement: The Relative Contributions of Visual-Spatial Integration and Visual-Motor Coordination. The Journal of Genetic Psychology [Internet]. 2013 Sep [cited 2014 Jan 22];174(5):514–33. Available from: http://www.tandfonline.com/doi/abs/10.1080/00221325.2012.717122
54. Ministry of Women’s Rights,, Child Development, Family Welfare, and Consumer Protection. Mauritius National Progress Report of the Special Session of the General Assembly on Children - “A World Fit for Children”. [Internet]. December 2006; [cited 2013 Oct 11] p. 1–55. Available from: http://www.actogether.mu/photo%5Cinfoutiles%5Cpdf%5C90.pdf
55. Case-Smith J. Effects of Occupational Therapy Services on Fine Motor and Functional Performance in Preschool Children. American Journal of Occupational Therapy [Internet]. 2000 Jul 1 [cited 2014 Feb 23];54(4):372–80. Available from: http://ajot.aotapress.net/cgi/doi/10.5014/ajot.54.4.372
56. Kyla Boyse R. Your child. Development and behaviour resources. A guide to information and support for parents. [Internet]. Developmental Delay. 2010 [cited 2013 Dec 13]. Available from: http://www.med.umich.edu/yourchild/topics/devdel.htm
57. Giagazoglou P, Kouliousi C, Sidiropoulou M, Fahantidou A. The effect of institutionalization on psychomotor development of preschool aged children. Research in Developmental Disabilities [Internet]. 2012 May [cited 2013 Oct 22];33(3):964–70. Available from: http://linkinghub.elsevier.com/retrieve/pii/S0891422211004549
58. Morrow-Tlucak M, Haude RH, Ernhart CB. Breastfeeding and cognitive development in the first 2 years of life. SocSciMed [Internet]. 1988;26(6):635–9. Available from: http://0-www.sciencedirect.com.innopac.wits.ac.za/science/article/pii/0277953688900287
89
59. Hediger ML, Overpeck MD, Ruan WJ, Troendle JF. Birthweight and gestational age effects on motor and social development. Paediatric & Perinatal Epidemiology. 2002;16(1):33–46.
60. World Health Organization. World Health Organisation, Growth Reference 5-19 years [Internet]. 2012 [cited 2012 Sep 19]. Available from: http://www.who.int/growthref/who2007_bmi_for_age/en/index.html
61. Serbetcioglu B, Ugurtay O, Kirkim G, Mutlu B. No association between hearing loss due to bilateral otitis media with effusion and Denver-II test results in preschool children. IntJPediatrOtorhinolaryngol [Internet]. 2008;72(2):215–22. Available from: http://0-www.sciencedirect.com.innopac.wits.ac.za/science/article/pii/S0165587607005113
62. Majnemer A. Benefits of early intervention for children with developmental disabilities. Seminars in Pediatric Neurology [Internet]. 1998 Mar [cited 2014 Feb 24];5(1):62–9. Available from: http://www.sciencedirect.com/science/article/pii/S107190919880020X
63. Occupational Therapy’s Perspective on the Use of Environments and Contexts to Support Health and Participation in Occupations. American Journal of Occupational Therapy [Internet]. 2010 Dec 7 [cited 2013 Dec 22];64(6_Supplement):S57–S69. Available from: http://ajot.aotapress.net/cgi/doi/10.5014/ajot.2010.64S57
64. Law, M. 1991Muriel Driver lecture. The Environment: A Focus for Occupational Therapy. Can J Occup Ther [Internet]. 1991 Oct [cited 2013 Dec 13];58(4):171–80. Available from: http://www.caot.ca/cjot_pdfs/cjot58/58.4Law.pdf
65. Wachs TD. Environmental considerations in studies with nonextreme groups. In: T. D. Wachs & R. Plomin, editor. Conceptualization and measurement of Socioeconomic Status and Vocabulary Development. Washington, DC: American Psychological Association; 1991. p. 44–67.
66. The American Psychological Association. Education and Socioeconomic status [Internet]. 2013. Available from: http://www.apa.org/pi/ses/resources/publications/factsheet-education.aspx
67. Ramey SL, Ramey CT. Early experience and early intervention for children “at risk”for developmental delay and mental retardation. Mental Retardation & Developmental Disabilities Research Reviews. 1999;5(1):1–10.
68. Zuleykha Najafova MI. Trialing Gate-Keeping Systems in Azerbaijan [Internet]. Azerbaijan, Guba: United Aid for Azerbaijan; 2007 Feb p. 1–58. Available from: http://www.crin.org/docs/Gatekeeping%20UAFA.pdf
69. National Institute of Child Health and Human Development (NICHD) Early Child Care Research Network. Characteristics and Quality of Child Care for Toddlers and Preschoolers. Applied Developmental Science. 2000;4(3):116.
70. Vorria P, Wolkind S, Rutter M, Pickles A, Hobsbaum A. A comparative study of Greek children in long-term residential group care in two-parent families:I. Social, Emotional, and Behavioural Differences. Journal of Child Psychology & Psychiatry &
Allied Disciplines. 1998;39(2):225.
90
71. Vorria P, Papaligoura Z, Dunn J, Van IJzendoorn MH, Steele H, Kontopoulou A, et al. Early experiences and attachment relationships of Greek infants raised in residential group care. Journal of Child Psychology and Psychiatry [Internet]. 2003 [cited 2013 Nov 24];44(8):1208–20. Available from: http://onlinelibrary.wiley.com/doi/10.1111/1469-7610.00202/full
72. Browne K. The Risk of Harm to Young Children in Institutional Care [Internet]. London: Save the Children, UK and The Better Care Network; 2009. Available from: http://www.nottingham.edu.my/Social-Sciences/documents/TheRiskofHarm.pdf
73. The St. Petersburg–USA Orphanage Research Team. Characteristics of children, caregivers, and orphanages for young children in St. Petersburg, Russian Federation. Journal of Applied Developmental Psychology [Internet]. 2005;26(5):477–506. Available from: http://0-www.sciencedirect.com.innopac.wits.ac.za/science/article/pii/S0193397305000493
74. Frank DA, Klass PE, Earls F, Eisenberg L. Infants and young children in orphanages: One view from pediatrics and child psychiatry. Pediatrics. 1996;97(4):569.
75. Van IJzendoorn MH, Luijk MPCM, Juffer F. IQ of children growing up in children’s homes. A meta-analysis on IQ delays in orphanages. Merrill-Palmer Quarterly. 2008;54(3):341–66.
76. Taneja V, Sriram S, Beri RS, Sreenivas V, Aggarwal R, Kaur R. “Not by bread alone”: impact of a structured 90-minute play session on development of children in an orphanage. Child: care, health and development [Internet]. 2002 [cited 2013 Nov 24];28(1):95–100. Available from: http://onlinelibrary.wiley.com/doi/10.1046/j.1365-2214.2002.00246.x/full
77. Gribble KD. A model for caregiving of adopted children after institutionalization. JChild AdolescPsychiatrNurs. 2007;20(1):14–26.
78. Roy P, Rutter M, Pickles A. Institutional care: associations between overactivity and lack of selectivity in social relationships. Journal of Child Psychology & Psychiatry. 2004;45(4):866–73.
79. Sinclair I, Gibbs I. Children’s Homes: A Study in Diversity [Internet]. Wiley; 1998. Available from: http://books.google.co.za/books?id=a_REAAAAYAAJ
80. Whetten K, Osterman J, Whetten RA, Pence BW, O’Donnell K, Messer LC, et al. A Comparison of the wellbeing of orphans and abandoned children ages 6-12 in institutional and community-based care settings in 5 less wealthy nations. PLoS ONE. 2009 Dec 18;4(12):e8169.
81. Deave T, Heron J, Evans J, Emond A. The impact of maternal depression in pregnancy on early child development. BJOG: An International Journal of Obstetrics & Gynaecology [Internet]. 2008;115(8):1043–51. Available from: http://dx.doi.org/10.1111/j.1471-0528.2008.01752.x
82. Devine, T. A study of ways a residential group care facility can foster resilience in adolescents who have experienced cumulative adversities. Fielding Graduate Institute; 2004.
91
83. Wolff PH and F. The orphans of Eritra: Are orphanages part of the problem or part of the solution. Am J Psychiatry [Internet]. 1998 Oct 1;155(10):1319–24. Available from: http://0-proquest.umi.com.innopac.wits.ac.za/pqdweb?did=35022657&sid=1&Fmt=2&clientId=57035&RQT=309&VName=PQD
84. Jessica Ball, Ken Moselle. Fathers’ Contributions to Children’s Well-being [Internet]. Canada: Public Health Agency of Canada; 2007 [cited 2014 Feb 21] p. 1–12. Available from: http://www.fira.ca/cms/documents/123/PH_FI_Report_brief.pdf
85. Groark CJ, Muhamedrahimov RJ, Palmov OI, Nikiforova NV, McCall RB. Improvements in early care in Russian orphanages and their relationship to observed behaviors. Infant Mental Health Journal [Internet]. 2005 Mar [cited 2013 Nov 25];26(2):96–109. Available from: http://doi.wiley.com/10.1002/imhj.20041
86. Emond R. Putting the Care into Residential Care: The Role of Young People. Journal of Social Work [Internet]. 2003 Dec 1 [cited 2013 Nov 24];3(3):321–37. Available from: http://jsw.sagepub.com/cgi/doi/10.1177/146801730333004
87. National Scientific Council on the Developing Child. The science of neglect: The persistent absence of responsive care disrupts the developing brain: Working paper 12 [Internet]. 2012. Available from: http://www.developingchild.harvard.edu
88. Monks CP, Smith PK, Naylor P, Barter C, Ireland JL, Coyne I. Bullying in different contexts: Commonalities, differences and the role of theory. Aggression and Violent Behavior [Internet]. 2009 Mar [cited 2014 Jan 15];14(2):146–56. Available from: http://linkinghub.elsevier.com/retrieve/pii/S1359178909000172
89. Liew J, Chen Q, Hughes, J.N. Child effortful control, teacher-student relationships, and achievement in academically at-risk children: Additive and interactive effects. Early Childhood Research Quarterly [Internet]. 2010;25:51–64. Available from: http://projectabc.tamu.edu/Articles/Teacher-student%20Relationships%20and%20Achievement.pdf
90. Brown, KH, Allen, L, Dewey, K. Complementary Feeding of Young Children in Developing Countries: a review of current scientific knowledge. [Internet]. Geneva; 1998 p. 1–228. Available from: http://whqlibdoc.who.int/hq/1998/WHO_NUT_98.1.pdf
91. Chang M, Park B, Singh K, Sung YY. Parental Involvement, Parenting Behaviors, and Children’s Cognitive Development in Low-Income and Minority Families. Journal of Research in Childhood Education. 2009 Spring;23(3):309–24.
92. Sirin SR. Socioeconomic status and academic achievement: a meta-analytic review of research. Review of Educational Research. 2005;75(3):417–53.
93. Fokeena, W.B. & Jeewon, R. Is there an association between socioeconomic status and body mass index among adolescents in Mauritius? The Scientific World Journal [Internet]. 2012 Apr 19;1–9. Available from: http://www.hindawi.com/journals/tswj/2012/750659/
94. Ministry of gender equality, child development and family welfare. Statistics in Mauritius, A Gender Approach [Internet]. Republic of Mauritius; 2013 Feb [cited 2014 Jul 20] p. 1–92. Available from:
92
http://gender.gov.mu/English/Documents/Statistics%20in%20Mauritius%20-%20A%20Gender%20Approach%2024.07.13.pdf
95. Central Statitics Office, Republic of Mauritius, Ministry of Finance and Economic Development. Annual Digest of Statistics [Internet]. Republic of Mauritius: Ministry of Finance and Economic Development; 2011 Jul [cited 2014 Jul 20] p. 1–196. Report No.: Vol. 55. Available from: http://statsmauritius.gov.mu/English/Documents/annual.pdf
96. Statistics Mauritius, Ministry of Finance & Economic Development. Republic of Mauritius, Mauritius in Figures, 2011 [Internet]. Mauritius; 2011 [cited 2014 Jul 28] p. 1–46. Available from: http://statsmauritius.gov.mu/English/Publications/Documents/MIF/mif2011.pdf
97. Leventhal T, Brooks-Gunn J. The neighborhoods they live in: The effects of neighborhood residence on child and adolescent outcomes. Psychological Bulletin [Internet]. 2000 [cited 2014 Jan 19];126(2):309–37. Available from: http://doi.apa.org/getdoi.cfm?doi=10.1037/0033-2909.126.2.309
98. Braitstein P, Ayaya S, Nyandiko WM, Kamanda A, Koech J, Gisore P, et al. Nutritional Status of Orphaned and Separated Children and Adolescents Living in Community and Institutional Environments in Uasin Gishu County, Kenya. Chaturvedi S, editor. PLoS ONE [Internet]. 2013 Jul 26 [cited 2014 Sep 5];8(7):e70054. Available from: http://dx.plos.org/10.1371/journal.pone.0070054
99. Bhurosy T, Jeewon R. Food habits, socioeconomic status and body mass index among premenopausal and post-menopausal women in Mauritius. Journal of Human Nutrition and Dietetics [Internet]. 2013;26:114–22. Available from: http://dx.doi.org/10.1111/jhn.12100
100. Caleyachetty R, Rudnicka A. R., Echouffo-Tcheugui J. B., Siegel K. R., Richards N., Whincup P. H. Prevalence of overweight, obesity and thinness in 9-10 year old children inMauritius. Global Health [Internet]. 2012 Jul 23;8(1). Available from: http://www.globalizationandhealth.com/content/8/1/28
101. Walker SP, Wachs TD, Meeks Gardner J, Lozoff B, Wasserman GA, Pollitt E, et al. Child development: risk factors for adverse outcomes in developing countries. The Lancet [Internet]. 2007;369(9556):145–57. Available from: http://0-www.sciencedirect.com.innopac.wits.ac.za/science/article/pii/S0140673607600762
102. Alaimo K, Olson CM, Frongillo EA. Food Insufficiency and American School-Aged Children’s Cognitive, Academic, and Psychosocial Development. Pediatrics [Internet]. 2001 Jul 1;108(1):44–53. Available from: http://pediatrics.aappublications.org/content/108/1/44.abstract
103. Wachs TD, McCabe G. Relation of maternal intelligence and schooling to offspring nutritional intake. International Journal of Behavioral Development. 2001 Jan 7;25(5):444–9.
104. Forns J, Julvez J, García-Esteban R, Guxens M, Ferrer M, Grellier J, et al. Maternal intelligence-mental health and child neuropsychological development at age 14 months. Gaceta Sanitaria [Internet]. 2012 Sep [cited 2013 Nov 24];26(5):397–404. Available from: http://linkinghub.elsevier.com/retrieve/pii/S0213911112000027

93
105. Caro DH. Socio-economic status and academic achievement trajectories from childhood to adolescence. Canadian Journal of Education [Internet]. 2009;32(3):558–90. Available from: http://www.eric.ed.gov/ERICWebPortal/custom/portlets/recordDetails/detailmini.jsp?_nfpb=true&_&ERICExtSearch_SearchValue_0=EJ859263&ERICExtSearch_SearchType_0=no&accno=EJ859263
106. Morgan PL, Farkas G, Hillemeier MM, Maczuga S. Risk Factors for Learning-Related Behavior Problems at 24 Months of Age: Population-Based Estimates. Journal of Abnormal Child Psychology [Internet]. 2009 Apr;37(3):401–13. Available from: http://search.proquest.com/docview/204935545?accountid=15083
107. National Committee for Citizens in Education. A new generation of evidence: the family is critical to student achievement. Columbia, Md.: National Committee for Citizens in Education; 1994. 160 p.
108. Colker LJ. Family Involvement: A Key Ingredient in Children’s Reading Success. 2007.
109. Zeanah CH, Smyke AT, Koga SF, Carlson E. Attachment in institutionalized and community children in Romania. Child development [Internet]. 2005 [cited 2013 Nov 25];76(5):1015–28. Available from: http://onlinelibrary.wiley.com/doi/10.1111/j.1467-8624.2005.00894.x/full
110. Cermak SA, Daunhauer LA. Sensory Processing in the Postinstitutionalized Child. American Journal of Occupational Therapy [Internet]. 1997 Jul 1 [cited 2014 Sep 1];51(7):500–7. Available from: http://ajot.aotapress.net/cgi/doi/10.5014/ajot.51.7.500
111. Ringle JL, Ingram SD, Thompson RW. The association between length of stay in residential care and educational achievement: Results from 5- and 16-year follow-up studies. Children and Youth Services Review [Internet]. 2010;32(7):974–80. Available from: http://0-www.sciencedirect.com.innopac.wits.ac.za/science/article/pii/S0190740910000861
112. Thompson RW, Smith GL. Residential care: A study of short- and long-term educational effects. Children and Youth Services Review [Internet]. 1996;18(3):221–42. Available from: http://0-www.sciencedirect.com.innopac.wits.ac.za/science/article/pii/0190740996000023
113. Stromswold K, Rosenthal M, Patel K, Molnar D. Development of Visual-Motor Integration: The Role of Genetic & Environmental Factors. Journal of Vision [Internet]. 2011 Sep 23 [cited 2014 Feb 22];11(11):462–462. Available from: http://www.journalofvision.org/lookup/doi/10.1167/11.11.462
114. Clark GJ. PREVIEW [Internet]. Iowa State University; 2010 [cited 2013 Nov 24]. Available from: ftp://203.198.129.211/Research%20and%20literature/Handwriting/The%20relationship%20between%20handwriting,%20reading,%20fine%20motor%20and%20visual-motor%20skills%20in%20kindergarteners.pdf
115. Barnhardt CO, Borsting EO, Deland PP, Pham NO, VUI TO. Relationship Between Visual-Motor Integration and Spatial Organization of Written Language and Math, Optometry & Vision Science. 2005 Feb;82(2):138–43.
94
116. Kaiser M-L, Albaret J-M, Doudin P-A. Relationship Between Visual-Motor Integration, Eye-Hand Coordination, and Quality of Handwriting. Journal of Occupational Therapy, Schools, & Early Intervention [Internet]. 2009 May 29 [cited 2014 Sep 23];2(2):87–95. Available from: http://www.tandfonline.com/doi/abs/10.1080/19411240903146228
117. Thomassen, A.J.W.M, Teulings, H.L. The Development of Handwriting. The Psychology of Written Language: Developmental and Educational Perspectives [Internet]. New York: John Wiley & Sons Ltd; 1983 [cited 2014 Sep 8]. p. 179–213. Available from: http://www.neuroscript.net/forum/showthread.php?t=3349&pagenumber=&3349-Thomassen-Teulings-(1983)-The-Development-of-Handwriting=
118. M.H. Tseng, S. Cermark. The evaluation of handwriting in children. Sensory Integration Quarterly. 1991 Dec;19(4):1–6.
119. Christopher J. Daly, Gail T. Kelley, Andrea Krauss. Relationshipbetween visual-motor integration and handwriting skills of children in kindergarten: A modified replication study. The American Journal of Occupational Therapy. 2003 Aug;57(4):459–62.
120. Missiuna, C. Children with Fine Motor Difficulties [Internet]. Keeping Current IN 1999 [cited 2014 Sep 8]. Available from: http://www.canchild.ca/en/ourresearch/finemotor.asp
121. Ercan ZG, Ahmetoglu E, Aral N. Investigating the Visual-Motor Integration Skills of 60-72 Month Children from High and Low Socio- Economic Status As Regard Age Factor. International Education Studies [Internet]. 2011 Jul 31 [cited 2013 Oct 22];4(3). Available from: http://www.ccsenet.org/journal/index.php/ies/article/view/9326
122. Frey PD, Pinelli B. VISUAL DISCRIMINATION AND VISUOMOTOR INTEGRATION AMONG TWO CLASSES OF BRAZILIAN CHILDREN. Perceptual and Motor Skills [Internet]. 1991 Jun [cited 2013 Nov 28];72(3):847–50. Available from: http://www.amsciepub.com/doi/abs/10.2466/pms.1991.72.3.847
123. Bowman OJ, Wallace BA. The effects of socioeconomic status on hand size and strength, vestibular function, visuomotor integration, and praxis in preschool children. The American Journal of Occupational Therapy [Internet]. 1990 [cited 2013 Nov 28];44(7):610–21. Available from: http://ajot.aotapress.net/content/44/7/610.short
124. Bettye M. Caldwell, Robert H. Bradley. Home Inventory Administration Manual. Comprehensive. University of Arkansas for Medical Sciences; 2003. 225 p.
125. Arpita Desai, Pratibha Rege. Correlation between developmental test of visual motor integration (VMI) and handwriting in cerebral palsy children. IJOT [Internet]. 2005 Nov;37(2):27–32. Available from: http://medind.nic.in/iba/t05/i2/ibat05i2p27.pdf
126. Maurice Ile Durable. Consulatative Workshops. 14 June-29 Jul7 2011 [Internet]. 2011 Aug p. 1–110. Report No.: Final. Available from: http://www.gov.mu/portal/sites/mid/file/final-WG5.pdf
127. McGarrigle J, Nelson A. Evaluating a school skills programme for Australian Indigenous children: a pilot study. Occupational Therapy International [Internet].
95
2006 Mar [cited 2013 Nov 24];13(1):1–20. Available from: http://doi.wiley.com/10.1002/oti.10
128. Crawford SG, Kaplan BJ and D. Effects of coexisting disorders on cognition and behaviour in children with ADHD. Journal of Attention Disorders [Internet]. 2006;10(2):192–9. Available from: http://jad.sagepub.com/content/10/2/192
129. Totsika V, Sylva K. The Home Observation for Measurement of the Environment Revisited. Child & Adolescent Mental Health. 2004;9(1):25–35.
130. Bradley RH, Caldwell BM, Corwyn RF. The Child Care HOME Inventories: assessing the quality of family child care homes. Early Childhood Research Quarterly [Internet]. 2003;18(3):294–309. Available from: http://0-www.sciencedirect.com.innopac.wits.ac.za/science/article/pii/S0885200603000413
131. Levin KA. Study design III: Cross-sectional studies. Evidence-Based Dentistry [Internet]. 2006 [cited 2014 Feb 7];7(1):24–5. Available from: http://www.nature.com/doifinder/10.1038/sj.ebd.6400375
132. P Bryant. Parents, Children and Cognitive Development. In: RA Hindle, AN Perrot-Clemont, J Stevenson-Hinde, editors. Social Relationships and Cognitive Development. Oxford, Clarendon; 1985.
133. Robert H. Bradley, Bettye M. Caldwell, Craig T. Ramey, Kathryn E. Barnard, Carol Gray, Mary A. Hammond, et al. Home Environment and Cognitive Development in the First 3 Years of Life: A Collaborative Study Involving Six Sites and Three Ethnic Groups in North America. Developmental Psychology [Internet]. 1989;25(2):217–35. Available from: http://0-psycnet.apa.org.innopac.wits.ac.za/journals/dev/25/2/217.pdf&productCode=pa
134. O’Donnell O, van Doorslaer E, Wagstaff A, Lindelow M. Analyzing Health Equity Using Household Survey Data [Internet]. Washington: The World Bank; 2008. Available from: http://siteresources.worldbank.org/INTPAH/Resources/Publications/459843-1195594469249/HealthEquityFINAL.pdf
135. A joint statement by the World Health Organization and the United Nations Children’s Fund. WHO child growth standards and the identification of severe acute malnutrition in infants and children. 2009. Report No.: 9789241598163.
136. Bower, John A. Statistics for science - vi: correlation and regression (part B). Nutrition and Food Science [Internet]. 2000;30(2):80–5. Available from: http://0-search.proquest.com.innopac.wits.ac.za/docview/217627322?accountid=15083
137. Nangalo, C, Musingwini, C. Empirical correlation of mineral commodity prices with exchange-traded mining stock prices. Journal of the Southern African Institute of Mining and Metallurgy [Internet]. 2011 Jul;111(7):459–68. Available from: http://www.scielo.org.za/pdf/jsaimm/v111n7/a05v111n7.pdf
138. The American Occupational Therapy Association. Occupational Therapy Practice Framework: Domain & Process 2nd Edition. The American Journal of Occupational Therapy [Internet]. 2008 Nov 1;62(6):625–83. Available from: http://ajot.aotapress.net/content/62/6/625.short
96
139. Ruth Armstrong, Matt Dull, Sabrina Milhous, James Verner. Caring for the Needy: A Desirable Paradigm Shift in Honduran Orphan Care [Internet]. no date [cited 2014 Feb 24]. Available from: http://www.docstoc.com/docs/110254831/Caring-for-the-Needy-A-Desirable-Paradigm-Shift-in-Honduran
140. Heinonen K, Raikkonen K, Pesonen A-K, Kajantie E, Andersson S, Eriksson JG, et al. Prenatal and Postnatal Growth and Cognitive Abilities at 56 Months of Age: A Longitudinal Study of Infants Born at Term. PEDIATRICS [Internet]. 2008 May 1 [cited 2013 Nov 24];121(5):e1325–e1333. Available from: http://pediatrics.aappublications.org/cgi/doi/10.1542/peds.2007-1172
141. Conners NA, Edwards MC, Grant AS. An Evaluation of a Parenting Class Curriculum for Parents of Young Children: Parenting the Strong-Willed Child. Journal of Child and Family Studies [Internet]. 2006 Dec 5 [cited 2014 Jan 19];16(3):321–30. Available from: http://link.springer.com/10.1007/s10826-006-9088-z
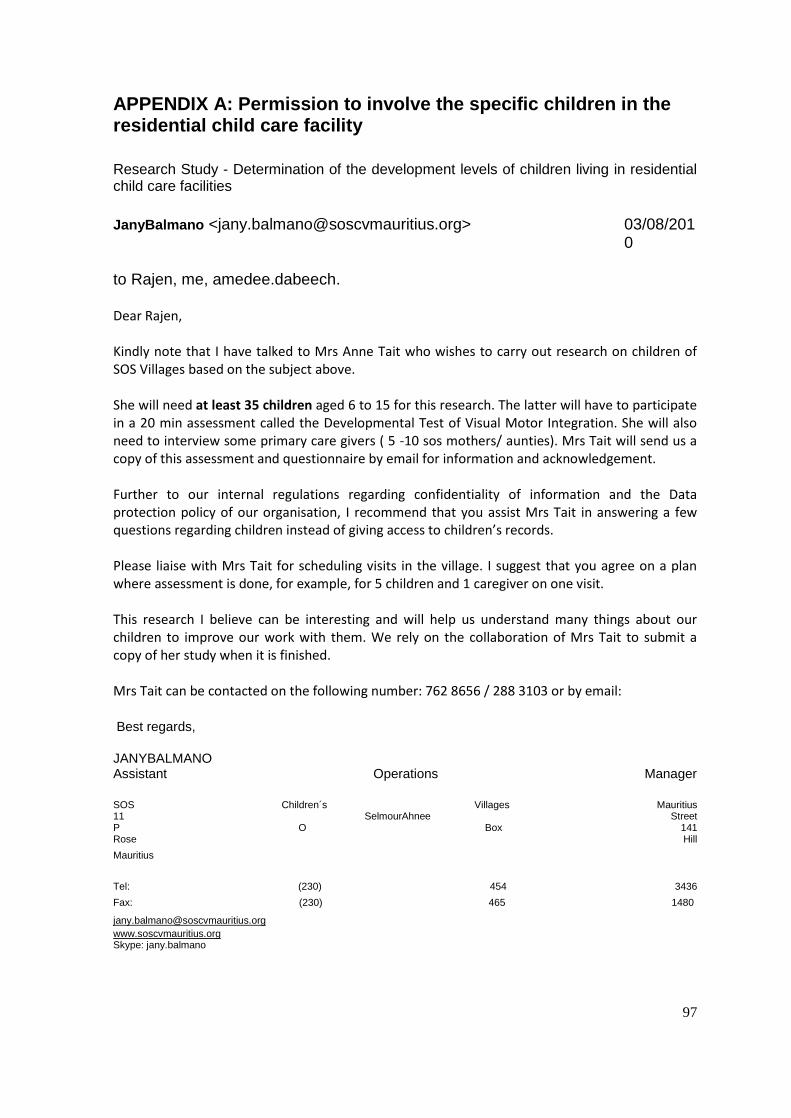
97
APPENDIX A: Permission to involve the specific children in the residential child care facility
Research Study - Determination of the development levels of children living in residential child care facilities
JanyBalmano <[email protected]>
03/08/2010
to Rajen, me, amedee.dabeech.
Dear Rajen, Kindly note that I have talked to Mrs Anne Tait who wishes to carry out research on children of SOS Villages based on the subject above. She will need at least 35 children aged 6 to 15 for this research. The latter will have to participate in a 20 min assessment called the Developmental Test of Visual Motor Integration. She will also need to interview some primary care givers ( 5 -10 sos mothers/ aunties). Mrs Tait will send us a copy of this assessment and questionnaire by email for information and acknowledgement. Further to our internal regulations regarding confidentiality of information and the Data protection policy of our organisation, I recommend that you assist Mrs Tait in answering a few questions regarding children instead of giving access to children’s records. Please liaise with Mrs Tait for scheduling visits in the village. I suggest that you agree on a plan where assessment is done, for example, for 5 children and 1 caregiver on one visit. This research I believe can be interesting and will help us understand many things about our children to improve our work with them. We rely on the collaboration of Mrs Tait to submit a copy of her study when it is finished. Mrs Tait can be contacted on the following number: 762 8656 / 288 3103 or by email: Best regards, JANYBALMANO Assistant Operations Manager SOS Children´s Villages Mauritius 11 SelmourAhnee Street P O Box 141 Rose Hill
Mauritius Tel: (230) 454 3436
Fax: (230) 465 1480 [email protected] www.soscvmauritius.org Skype: jany.balmano

98
APPENDIX B: Verbal assent from child participants
VERBAL ASSENT
Hi, my name is ____________________________. What is your name?
Do you want to come with me to draw some pictures in this (show test booklet) book.
It will be fun and I hope you will enjoy it with me today. If you listen well and do your best,
you can choose a sticker from my sticker box when we are done.
Are you ready to come with me?

99
APPENDIX C: Information letters and consent forms for parents
and caregivers
APPENDIX C1: Information Sheet for Caregivers/Parents of
Community Group
Hi,
I am an occupational therapist studying my Masters degree, and would like to conduct a research study to determine the levels of Visual-Motor Integration of young children living in residential child care facilities in Mauritius.
The aim of the study is to determine the extent of delay in Visual-Motor Integration of children between the ages of six and fifteen years, living in residential child care facilities in Mauritius, compared with their peers, and to note any associations between the different environments, and the levels of Visual-Motor Integration of the children.
I invite you to be part of the control group with whom we will compare the children living in residential child care facilities. Your child will be required to complete a 20 minute assessment involving copying simple geometric forms, and it will also be necessary for my research assistant to interview you (as the primary caregiver) of your child. It is necessary for the interview to be conducted at your home with your child present and awake.
.
The assessment and interview cannot cause harm to your child or to you, and you or your child may choose not to participate, or withdraw from the research at any time, and will not be compromised in any way for doing so.
Confidentiality in terms of yourself and your child will be maintained at all times, with only me, my research assistant (**name**) and my supervisor (Denise Franzsen) having access to the names of the participants. Feedback will be given on request.
Should any problems with your child’s Visual-Motor Integration be found you will be provided with the assessment and the names of occupational therapists, should you wish to follow up on the problem.
If you have any questions, please do not hesitate to contact me.
Anne Tait
762 8656 / 2883103
100
INFORMED CONSENT CAREGIVER/PARENT OF CHILD IN
CONTROL GROUP
I, as caregiver/parent/guardian of ________________________(name of child) hereby give
my permission for him/her to participate in the research study, which will involve identifying
and copying simple geometric forms. In addition, I agree to be interviewed at my home for
the purposes of making associations between home environments and the environment of a
residential child care facility.
_________________ __________________ ________________
Signature (Guardian) Print name Date

101
APPENDIX C2: Information Given and Consent from Residential
Child Care Caregivers
16 Sep. 10
Hi
I am an occupational therapist studying my Masters degree, and would like to conduct a research study to determine the development levels of young children living in residential child care facilities in Mauritius.
The aim of my study is to determine the extent of delay in development in children between the ages of six and 15 years, living in residential child care facilities in Mauritius, compared with their peers, and to note any associations between the different environments, and the developmental levels of the children.
I invite you to participate in the study. The research will involve my research assistant interviewing you using a structured interview format taking 45-90 minutes about the institutions environment.
You may choose not to participate, or withdraw from the research at any time, and you will not be compromised in any way for doing so.
Confidentiality will be maintained at all times, with only me and my supervisor having access to the names and background details of the children. Feedback will be given on request.
If you have any questions, please do not hesitate to contact me.
__________ __________
Anne Tait Denise Franzsen (supervisor)
762 8656 / 2883103
INFORMATION SHEET PRIMARY CARE GIVER
SOS Children’s Village, Beau Bassin
102
INFORMED CONSENT PRIMARY CARE GIVER OF CHILD
SOS Children’s Village, Beau Bassin, Mauritius
I, hereby accept the invitation to participate in the research study investigating the development of children in residential child care facilities.
I understand that the purpose of the research is to determine the development of children and to ascertain if an association exists between the environment and developmental levels. I understand that it will be necessary for me to be interviewed for approximately 45 minutes and that all personal information obtained as a result of the research will be kept confidential.
I understand that I can withdraw from the research at any time, and that it will not compromise me or the children in any way.
____________________ _____________________ _____________________
Name Signature Designation
_____________
Date

103
APPENDIX D: Demographic questionnaire
Code Date Visitor Location ________________ D.O.B: _______ Age Sex
Date of admission to institution ____________ Age at admission____________ Gestational age at birth______ Weight at birth ______ Medical history _______________________________________________________________________ ______________________________________________________________________________________________________________________________________________
Initials of primary caregiver_____________ Socio-economic status (caregiver education and income) ___________
Family composition (persons living in household, including sex and age of children)
Family Language Caregiver Caregiver education ethnicity spoken education ______in child rearing__________ Is child in school? Grade/Class/Standard Current weight (in kg’s)______ Current height (in cm’s)____

104
APPENDIX E: Beery-Buktenika Developmental Test of Visual-Motor Integration
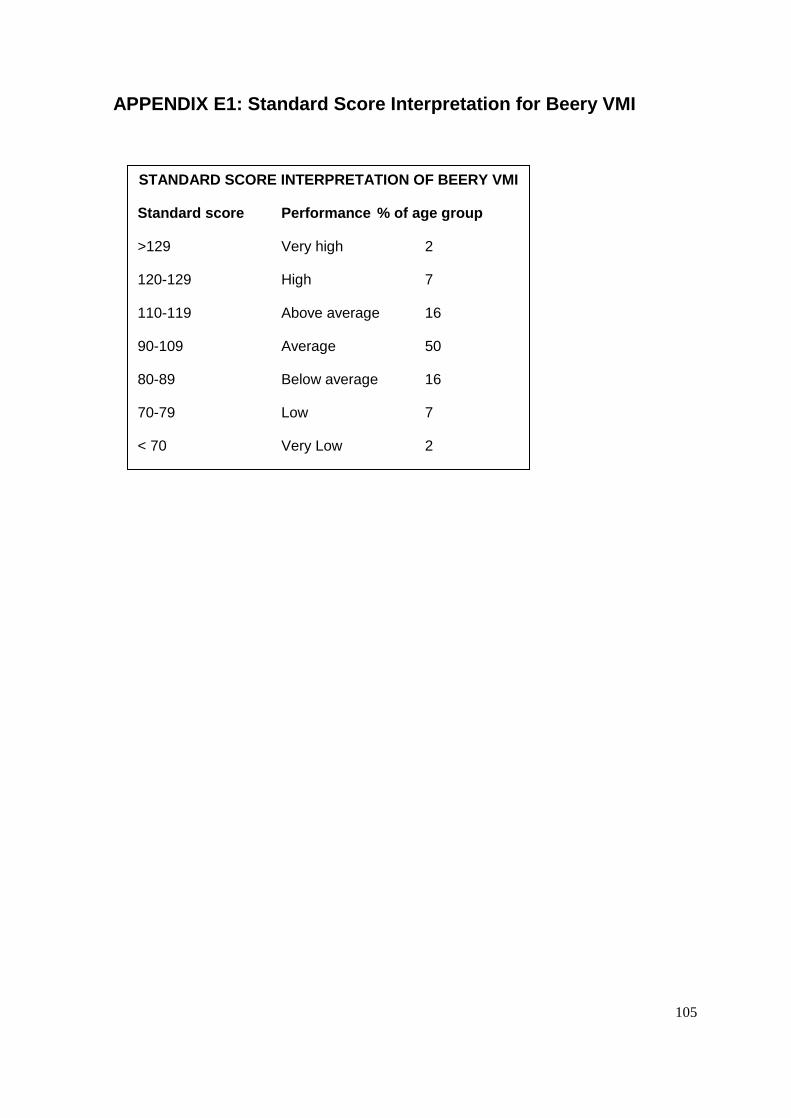
105
APPENDIX E1: Standard Score Interpretation for Beery VMI
STANDARD SCORE INTERPRETATION OF BEERY VMI
Standard score Performance % of age group
>129 Very high 2
120-129 High 7
110-119 Above average 16
90-109 Average 50
80-89 Below average 16
70-79 Low 7
< 70 Very Low 2
70-79 Low 7
<70 Very low 2
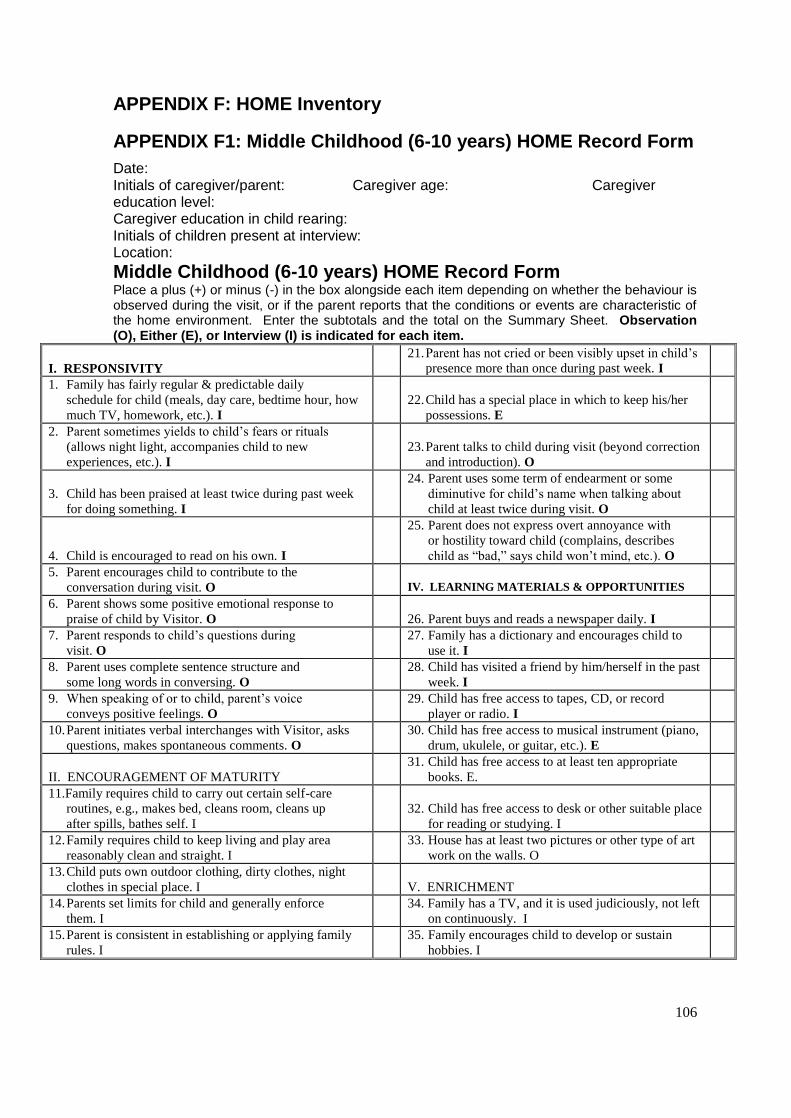
106
APPENDIX F: HOME Inventory
APPENDIX F1: Middle Childhood (6-10 years) HOME Record Form
Date: Initials of caregiver/parent: Caregiver age: Caregiver education level: Caregiver education in child rearing: Initials of children present at interview: Location:
Middle Childhood (6-10 years) HOME Record Form Place a plus (+) or minus (-) in the box alongside each item depending on whether the behaviour is observed during the visit, or if the parent reports that the conditions or events are characteristic of the home environment. Enter the subtotals and the total on the Summary Sheet. Observation (O), Either (E), or Interview (I) is indicated for each item.
I. RESPONSIVITY
21. Parent has not cried or been visibly upset in child’s
presence more than once during past week. I
1. Family has fairly regular & predictable daily
schedule for child (meals, day care, bedtime hour, how
much TV, homework, etc.). I
22. Child has a special place in which to keep his/her
possessions. E
2. Parent sometimes yields to child’s fears or rituals
(allows night light, accompanies child to new
experiences, etc.). I
23. Parent talks to child during visit (beyond correction
and introduction). O
3. Child has been praised at least twice during past week
for doing something. I
24. Parent uses some term of endearment or some
diminutive for child’s name when talking about
child at least twice during visit. O
4. Child is encouraged to read on his own. I
25. Parent does not express overt annoyance with
or hostility toward child (complains, describes
child as “bad,” says child won’t mind, etc.). O
5. Parent encourages child to contribute to the
conversation during visit. O
IV. LEARNING MATERIALS & OPPORTUNITIES
6. Parent shows some positive emotional response to
praise of child by Visitor. O
26. Parent buys and reads a newspaper daily. I
7. Parent responds to child’s questions during
visit. O
27. Family has a dictionary and encourages child to
use it. I
8. Parent uses complete sentence structure and
some long words in conversing. O
28. Child has visited a friend by him/herself in the past
week. I
9. When speaking of or to child, parent’s voice
conveys positive feelings. O
29. Child has free access to tapes, CD, or record
player or radio. I
10. Parent initiates verbal interchanges with Visitor, asks
questions, makes spontaneous comments. O
30. Child has free access to musical instrument (piano,
drum, ukulele, or guitar, etc.). E
II. ENCOURAGEMENT OF MATURITY
31. Child has free access to at least ten appropriate
books. E.
11.Family requires child to carry out certain self-care
routines, e.g., makes bed, cleans room, cleans up
after spills, bathes self. I
32. Child has free access to desk or other suitable place
for reading or studying. I
12. Family requires child to keep living and play area
reasonably clean and straight. I
33. House has at least two pictures or other type of art
work on the walls. O
13. Child puts own outdoor clothing, dirty clothes, night
clothes in special place. I
V. ENRICHMENT
14. Parents set limits for child and generally enforce
them. I
34. Family has a TV, and it is used judiciously, not left
on continuously. I
15. Parent is consistent in establishing or applying family
rules. I
35. Family encourages child to develop or sustain
hobbies. I
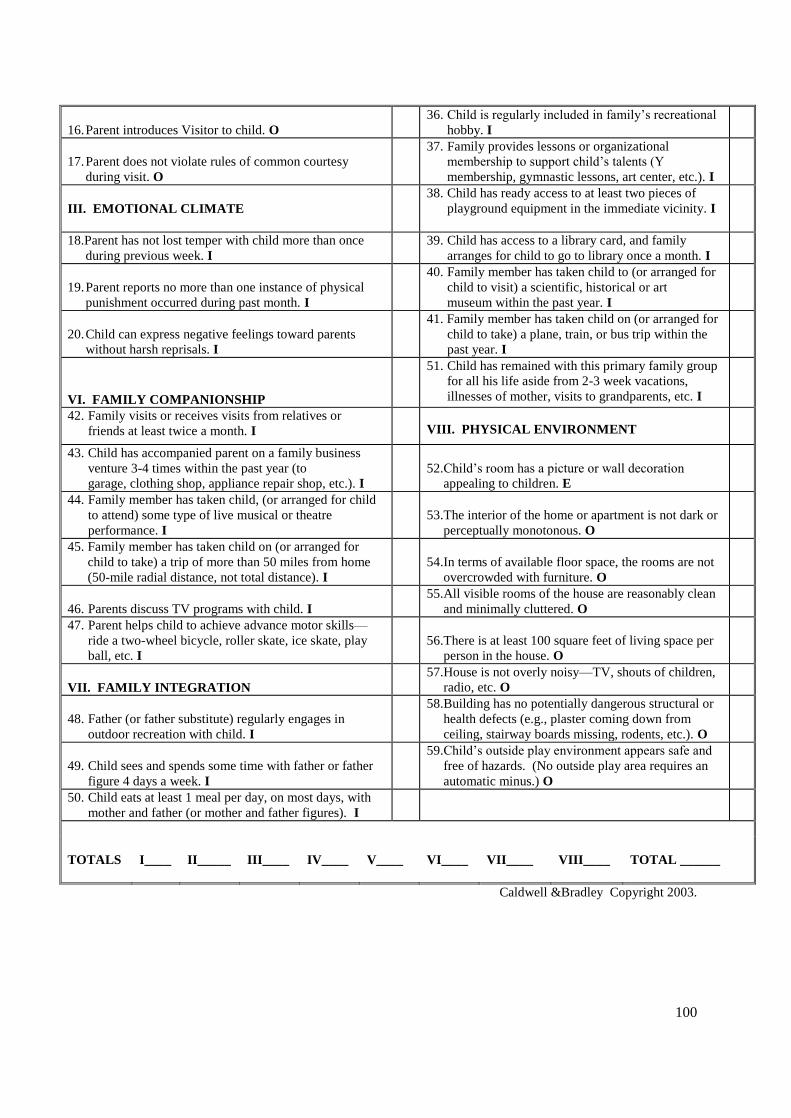
100
16. Parent introduces Visitor to child. O
36. Child is regularly included in family’s recreational
hobby. I
17. Parent does not violate rules of common courtesy
during visit. O
37. Family provides lessons or organizational
membership to support child’s talents (Y
membership, gymnastic lessons, art center, etc.). I
III. EMOTIONAL CLIMATE
38. Child has ready access to at least two pieces of
playground equipment in the immediate vicinity. I
18.Parent has not lost temper with child more than once
during previous week. I
39. Child has access to a library card, and family
arranges for child to go to library once a month. I
19. Parent reports no more than one instance of physical
punishment occurred during past month. I
40. Family member has taken child to (or arranged for
child to visit) a scientific, historical or art
museum within the past year. I
20. Child can express negative feelings toward parents
without harsh reprisals. I
41. Family member has taken child on (or arranged for
child to take) a plane, train, or bus trip within the
past year. I
VI. FAMILY COMPANIONSHIP
51. Child has remained with this primary family group
for all his life aside from 2-3 week vacations,
illnesses of mother, visits to grandparents, etc. I
42. Family visits or receives visits from relatives or
friends at least twice a month. I
VIII. PHYSICAL ENVIRONMENT
43. Child has accompanied parent on a family business
venture 3-4 times within the past year (to
garage, clothing shop, appliance repair shop, etc.). I
52. Child’s room has a picture or wall decoration
appealing to children. E
44. Family member has taken child, (or arranged for child
to attend) some type of live musical or theatre
performance. I
53. The interior of the home or apartment is not dark or
perceptually monotonous. O
45. Family member has taken child on (or arranged for
child to take) a trip of more than 50 miles from home
(50-mile radial distance, not total distance). I
54. In terms of available floor space, the rooms are not
overcrowded with furniture. O
46. Parents discuss TV programs with child. I
55. All visible rooms of the house are reasonably clean
and minimally cluttered. O
47. Parent helps child to achieve advance motor skills—
ride a two-wheel bicycle, roller skate, ice skate, play
ball, etc. I
56. There is at least 100 square feet of living space per
person in the house. O
VII. FAMILY INTEGRATION
57. House is not overly noisy—TV, shouts of children,
radio, etc. O
48. Father (or father substitute) regularly engages in
outdoor recreation with child. I
58. Building has no potentially dangerous structural or
health defects (e.g., plaster coming down from
ceiling, stairway boards missing, rodents, etc.). O
49. Child sees and spends some time with father or father
figure 4 days a week. I
59. Child’s outside play environment appears safe and
free of hazards. (No outside play area requires an
automatic minus.) O
50. Child eats at least 1 meal per day, on most days, with
mother and father (or mother and father figures). I
TOTALS
I____
II_____
III____
IV____
V____
VI____
VII____
VIII____
TOTAL ______
Caldwell &Bradley Copyright 2003.
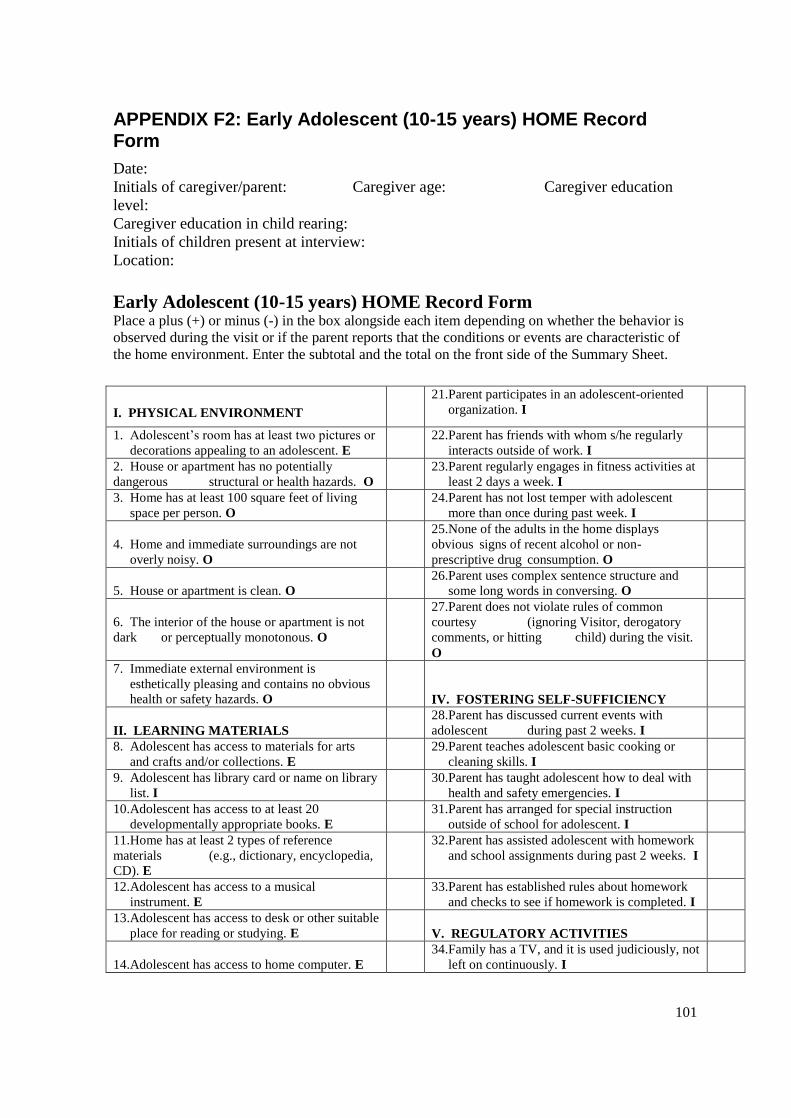
101
APPENDIX F2: Early Adolescent (10-15 years) HOME Record Form
Date:
Initials of caregiver/parent: Caregiver age: Caregiver education
level:
Caregiver education in child rearing:
Initials of children present at interview:
Location:
Early Adolescent (10-15 years) HOME Record Form Place a plus (+) or minus (-) in the box alongside each item depending on whether the behavior is
observed during the visit or if the parent reports that the conditions or events are characteristic of
the home environment. Enter the subtotal and the total on the front side of the Summary Sheet.
I. PHYSICAL ENVIRONMENT
21. Parent participates in an adolescent-oriented
organization. I
1. Adolescent’s room has at least two pictures or
decorations appealing to an adolescent. E
22. Parent has friends with whom s/he regularly
interacts outside of work. I
2. House or apartment has no potentially
dangerous structural or health hazards. O
23. Parent regularly engages in fitness activities at
least 2 days a week. I
3. Home has at least 100 square feet of living
space per person. O
24. Parent has not lost temper with adolescent
more than once during past week. I
4. Home and immediate surroundings are not
overly noisy. O
25. None of the adults in the home displays
obvious signs of recent alcohol or non-
prescriptive drug consumption. O
5. House or apartment is clean. O
26.Parent uses complex sentence structure and
some long words in conversing. O
6. The interior of the house or apartment is not
dark or perceptually monotonous. O
27.Parent does not violate rules of common
courtesy (ignoring Visitor, derogatory
comments, or hitting child) during the visit.
O
7. Immediate external environment is
esthetically pleasing and contains no obvious
health or safety hazards. O
IV. FOSTERING SELF-SUFFICIENCY
II. LEARNING MATERIALS 28. Parent has discussed current events with
adolescent during past 2 weeks. I
8. Adolescent has access to materials for arts
and crafts and/or collections. E
29. Parent teaches adolescent basic cooking or
cleaning skills. I
9. Adolescent has library card or name on library
list. I
30. Parent has taught adolescent how to deal with
health and safety emergencies. I
10. Adolescent has access to at least 20
developmentally appropriate books. E
31. Parent has arranged for special instruction
outside of school for adolescent. I
11. Home has at least 2 types of reference
materials (e.g., dictionary, encyclopedia,
CD). E
32. Parent has assisted adolescent with homework
and school assignments during past 2 weeks. I
12. Adolescent has access to a musical
instrument. E
33. Parent has established rules about homework
and checks to see if homework is completed. I
13. Adolescent has access to desk or other suitable
place for reading or studying. E
V. REGULATORY ACTIVITIES
14. Adolescent has access to home computer. E
34. Family has a TV, and it is used judiciously, not
left on continuously. I
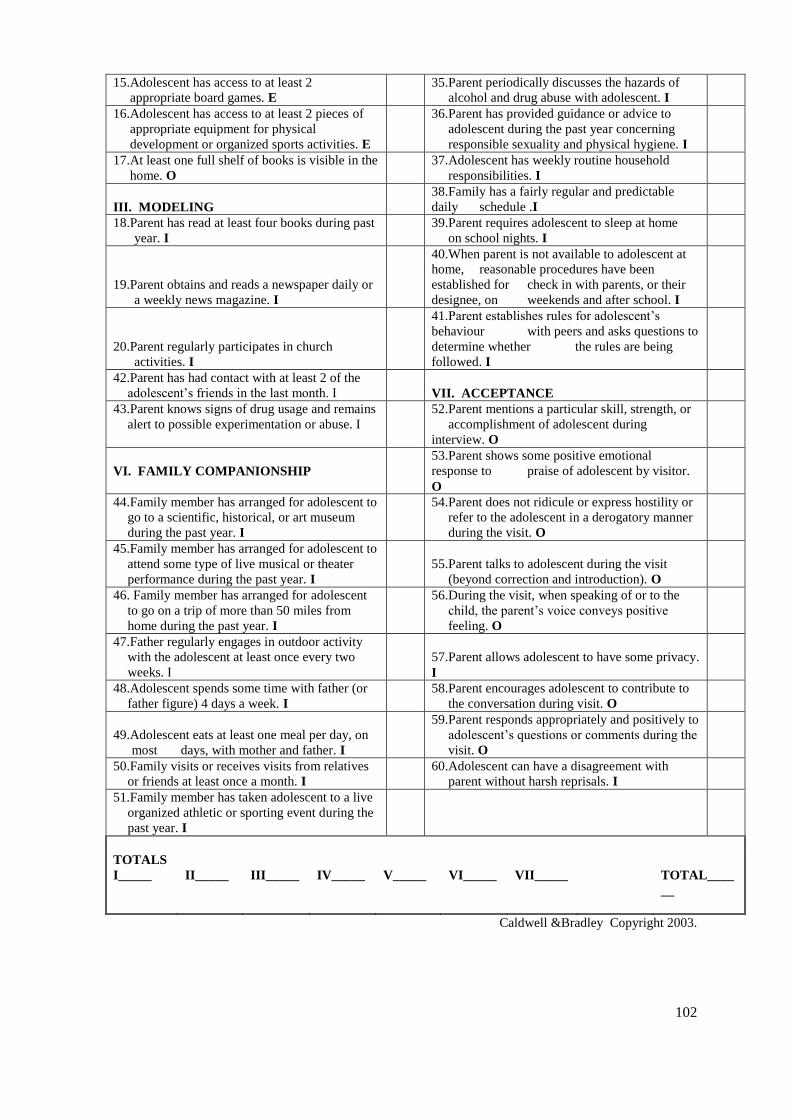
102
15. Adolescent has access to at least 2
appropriate board games. E
35. Parent periodically discusses the hazards of
alcohol and drug abuse with adolescent. I
16. Adolescent has access to at least 2 pieces of
appropriate equipment for physical
development or organized sports activities. E
36. Parent has provided guidance or advice to
adolescent during the past year concerning
responsible sexuality and physical hygiene. I
17. At least one full shelf of books is visible in the
home. O
37. Adolescent has weekly routine household
responsibilities. I
III. MODELING 38. Family has a fairly regular and predictable
daily schedule .I
18.Parent has read at least four books during past
year. I
39. Parent requires adolescent to sleep at home
on school nights. I
19.Parent obtains and reads a newspaper daily or
a weekly news magazine. I
40. When parent is not available to adolescent at
home, reasonable procedures have been
established for check in with parents, or their
designee, on weekends and after school. I
20.Parent regularly participates in church
activities. I
41. Parent establishes rules for adolescent’s
behaviour with peers and asks questions to
determine whether the rules are being
followed. I
42.Parent has had contact with at least 2 of the
adolescent’s friends in the last month. I
VII. ACCEPTANCE
43.Parent knows signs of drug usage and remains
alert to possible experimentation or abuse. I
52. Parent mentions a particular skill, strength, or
accomplishment of adolescent during
interview. O
VI. FAMILY COMPANIONSHIP
53. Parent shows some positive emotional
response to praise of adolescent by visitor.
O
44.Family member has arranged for adolescent to
go to a scientific, historical, or art museum
during the past year. I
54. Parent does not ridicule or express hostility or
refer to the adolescent in a derogatory manner
during the visit. O
45.Family member has arranged for adolescent to
attend some type of live musical or theater
performance during the past year. I
55. Parent talks to adolescent during the visit
(beyond correction and introduction). O
46. Family member has arranged for adolescent
to go on a trip of more than 50 miles from
home during the past year. I
56. During the visit, when speaking of or to the
child, the parent’s voice conveys positive
feeling. O
47.Father regularly engages in outdoor activity
with the adolescent at least once every two
weeks. I
57. Parent allows adolescent to have some privacy.
I
48.Adolescent spends some time with father (or
father figure) 4 days a week. I
58. Parent encourages adolescent to contribute to
the conversation during visit. O
49.Adolescent eats at least one meal per day, on
most days, with mother and father. I
59. Parent responds appropriately and positively to
adolescent’s questions or comments during the
visit. O
50.Family visits or receives visits from relatives
or friends at least once a month. I
60. Adolescent can have a disagreement with
parent without harsh reprisals. I
51.Family member has taken adolescent to a live
organized athletic or sporting event during the
past year. I
TOTALS
I_____ II_____ III_____ IV_____ V_____ VI_____ VII_____ TOTAL____
__
Caldwell &Bradley Copyright 2003.
103
APPENDIX F3: Mean, Standard Deviation and Median for HOME Inventory – Middle Childhood
Middle Childhood HOME
N = 124 Number Scale of Items Mean SD Median
Responsivity 10 8.4 2.3 9 Encouragement of Maturity 7 4.8 1.6 5 Emotional Climate 8 6.0 1.6 7 Learning Materials 8 3.4 2.2 4 & Opportunities Enrichment 8 5.2 2.0 6 Family Companionship 6 4.1 1.4 5 Family Integration 4 2.4 1.2 3 Physical Environment 8 6.8 1.7 7 TOTAL 59 41.6 9.0 46
Data were collected in Little Rock, Arkansas, in 1982-1983. Approximately 50% of sample were African American, 50% European American. Publications using the measure include the following. Bradley, R.H., Caldwell, B.M., Rock, S.L., Hamrick, H.M., & Harris, P. (1988). Home observation for measurement of the environment: Development of a HOME inventory for use with families having children 6 to 10 years old. Contemporary
Educational Psychology, 13, 58-71. Bradley, R.H., Caldwell, B.M., & Rock, S.L. (1988). Home environment and school performance: A ten-year follow-up and examination of three models of environmental action. Child Development, 59, 852-867. Bradley, R.H., Rock, S.L., Caldwell, B.M., Harris, P., & Hamrick, H.M. (1987). Home environment and school performance among black elementary school children. Journal of Negro Education, 56, 499-509.
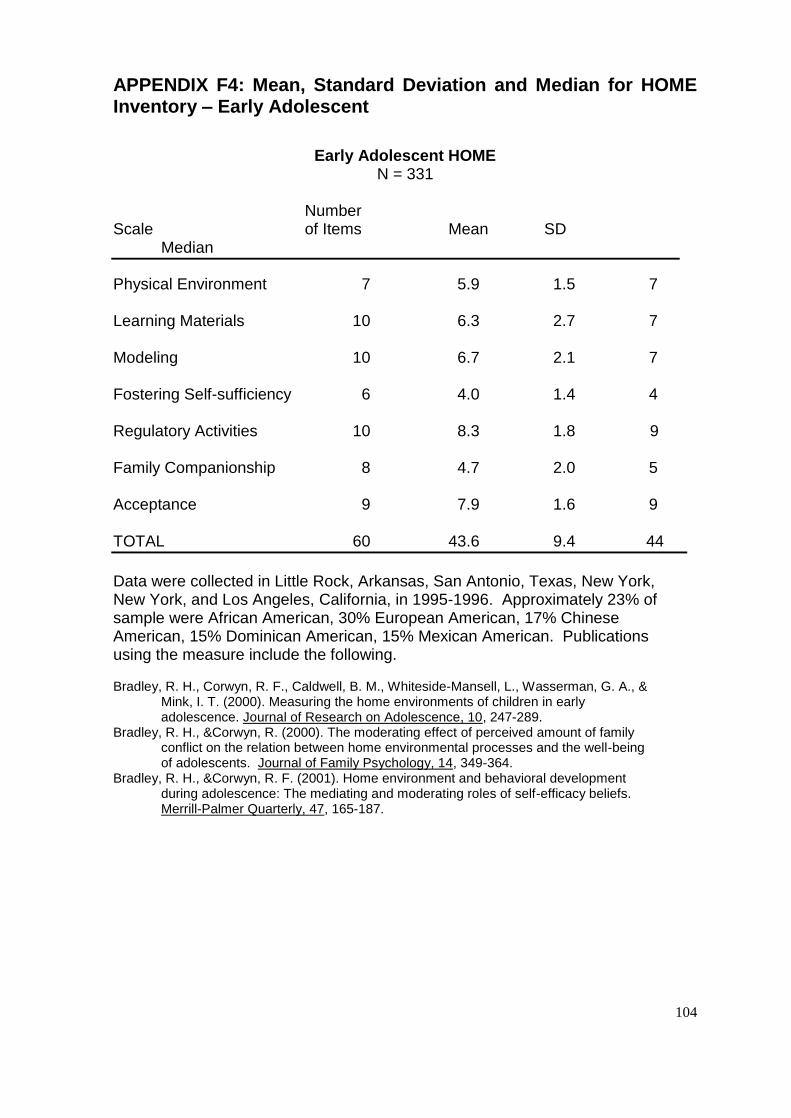
104
APPENDIX F4: Mean, Standard Deviation and Median for HOME Inventory – Early Adolescent
Early Adolescent HOME
N = 331 Number Scale of Items Mean SD Median
Physical Environment 7 5.9 1.5 7 Learning Materials 10 6.3 2.7 7 Modeling 10 6.7 2.1 7 Fostering Self-sufficiency 6 4.0 1.4 4 Regulatory Activities 10 8.3 1.8 9 Family Companionship 8 4.7 2.0 5 Acceptance 9 7.9 1.6 9 TOTAL 60 43.6 9.4 44
Data were collected in Little Rock, Arkansas, San Antonio, Texas, New York, New York, and Los Angeles, California, in 1995-1996. Approximately 23% of sample were African American, 30% European American, 17% Chinese American, 15% Dominican American, 15% Mexican American. Publications using the measure include the following.
Bradley, R. H., Corwyn, R. F., Caldwell, B. M., Whiteside-Mansell, L., Wasserman, G. A., & Mink, I. T. (2000). Measuring the home environments of children in early adolescence. Journal of Research on Adolescence, 10, 247-289. Bradley, R. H., &Corwyn, R. (2000). The moderating effect of perceived amount of family conflict on the relation between home environmental processes and the well-being of adolescents. Journal of Family Psychology, 14, 349-364. Bradley, R. H., &Corwyn, R. F. (2001). Home environment and behavioral development during adolescence: The mediating and moderating roles of self-efficacy beliefs. Merrill-Palmer Quarterly, 47, 165-187.
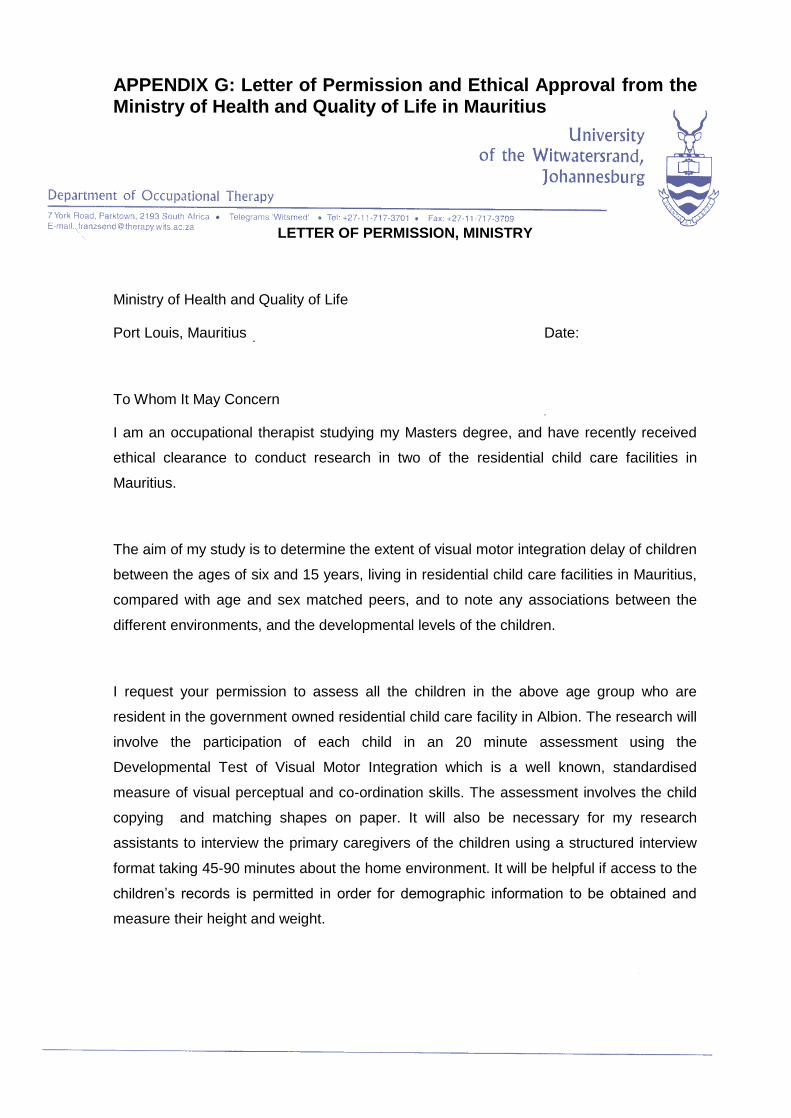
105
APPENDIX G: Letter of Permission and Ethical Approval from the Ministry of Health and Quality of Life in Mauritius
LETTER OF PERMISSION, MINISTRY
Ministry of Health and Quality of Life
Port Louis, Mauritius Date:
To Whom It May Concern
I am an occupational therapist studying my Masters degree, and have recently received
ethical clearance to conduct research in two of the residential child care facilities in
Mauritius.
The aim of my study is to determine the extent of visual motor integration delay of children
between the ages of six and 15 years, living in residential child care facilities in Mauritius,
compared with age and sex matched peers, and to note any associations between the
different environments, and the developmental levels of the children.
I request your permission to assess all the children in the above age group who are
resident in the government owned residential child care facility in Albion. The research will
involve the participation of each child in an 20 minute assessment using the
Developmental Test of Visual Motor Integration which is a well known, standardised
measure of visual perceptual and co-ordination skills. The assessment involves the child
copying and matching shapes on paper. It will also be necessary for my research
assistants to interview the primary caregivers of the children using a structured interview
format taking 45-90 minutes about the home environment. It will be helpful if access to the
children’s records is permitted in order for demographic information to be obtained and
measure their height and weight.
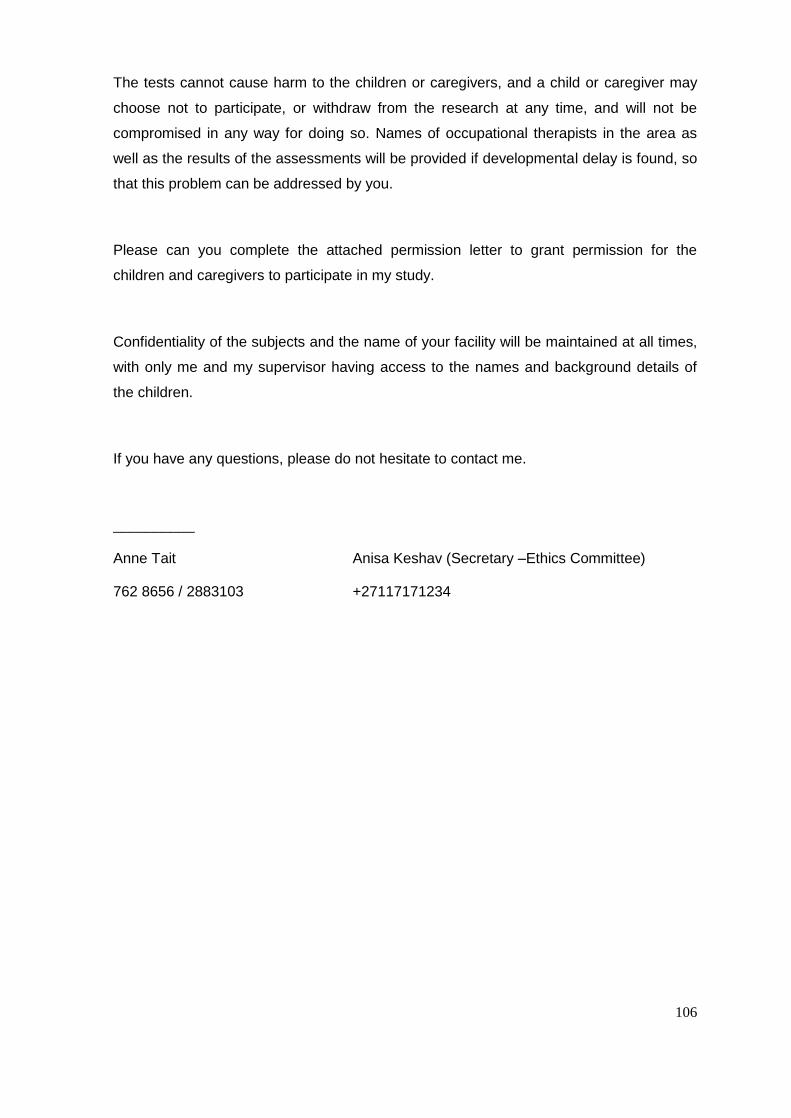
106
The tests cannot cause harm to the children or caregivers, and a child or caregiver may
choose not to participate, or withdraw from the research at any time, and will not be
compromised in any way for doing so. Names of occupational therapists in the area as
well as the results of the assessments will be provided if developmental delay is found, so
that this problem can be addressed by you.
Please can you complete the attached permission letter to grant permission for the
children and caregivers to participate in my study.
Confidentiality of the subjects and the name of your facility will be maintained at all times,
with only me and my supervisor having access to the names and background details of
the children.
If you have any questions, please do not hesitate to contact me.
__________
Anne Tait Anisa Keshav (Secretary –Ethics Committee)
762 8656 / 2883103 +27117171234
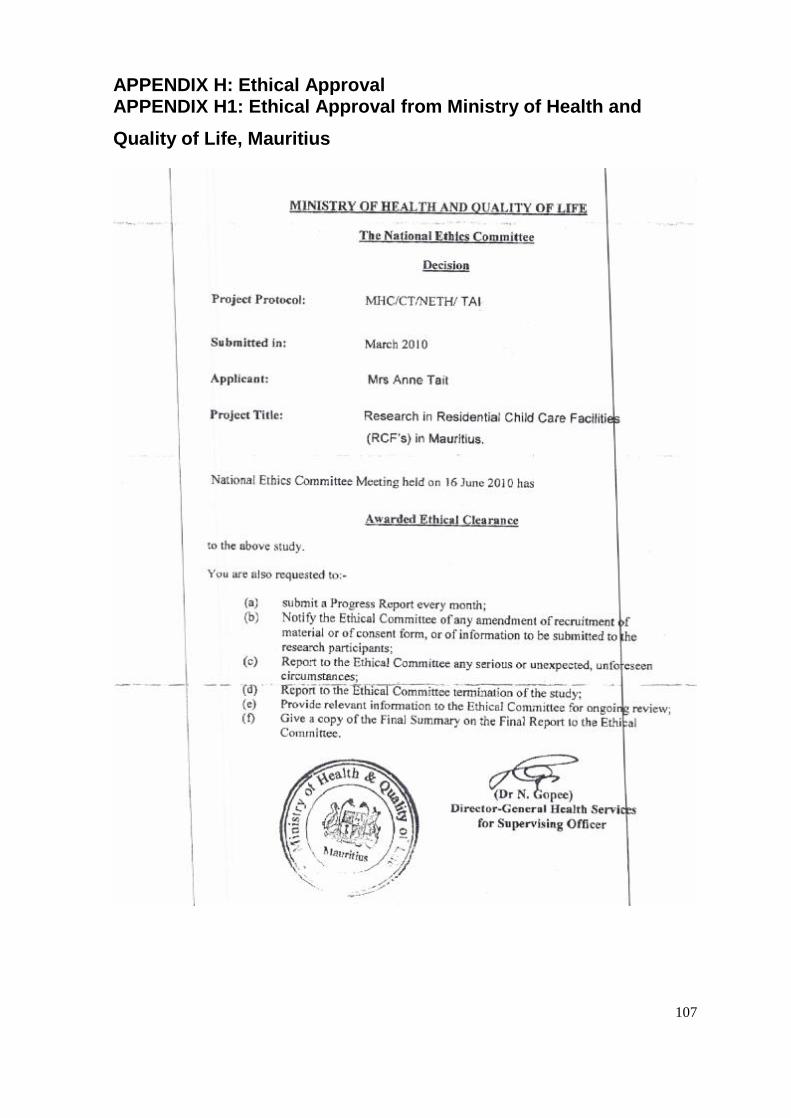
107
APPENDIX H: Ethical Approval APPENDIX H1: Ethical Approval from Ministry of Health and
Quality of Life, Mauritius
108
APPENDIX H2: Ethical Approval from the Human Research Ethics Committee at the University of the Witwatersrand