Embed Size (px)
Citation preview
Institute for Canadian Urban Research Studies
The Prevalence of Crime in
British Columbia - 2014Paul Brantingham
J. Bryan Kinney
Institute for Canadian Urban Research Studies
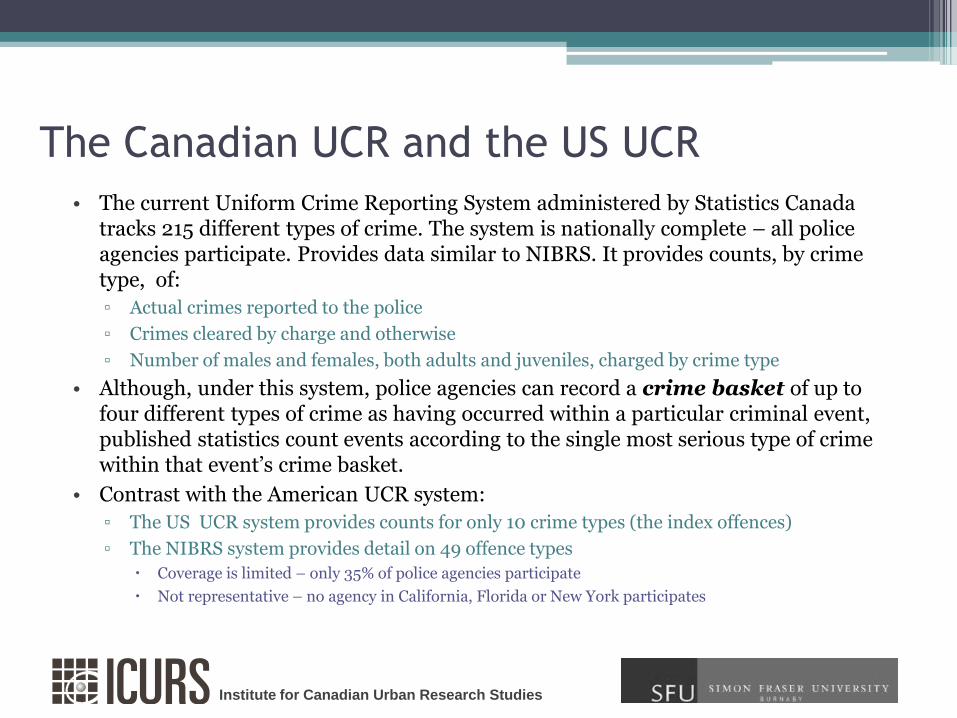
The Canadian UCR and the US UCR
• The current Uniform Crime Reporting System administered by Statistics Canada tracks 215 different types of crime. The system is nationally complete – all police agencies participate. Provides data similar to NIBRS. It provides counts, by crime type, of:
▫ Actual crimes reported to the police
▫ Crimes cleared by charge and otherwise
▫ Number of males and females, both adults and juveniles, charged by crime type
• Although, under this system, police agencies can record a crime basket of up to four different types of crime as having occurred within a particular criminal event, published statistics count events according to the single most serious type of crime within that event’s crime basket.
• Contrast with the American UCR system:
▫ The US UCR system provides counts for only 10 crime types (the index offences)
▫ The NIBRS system provides detail on 49 offence types
Coverage is limited – only 35% of police agencies participate
Not representative – no agency in California, Florida or New York participates
Institute for Canadian Urban Research Studies
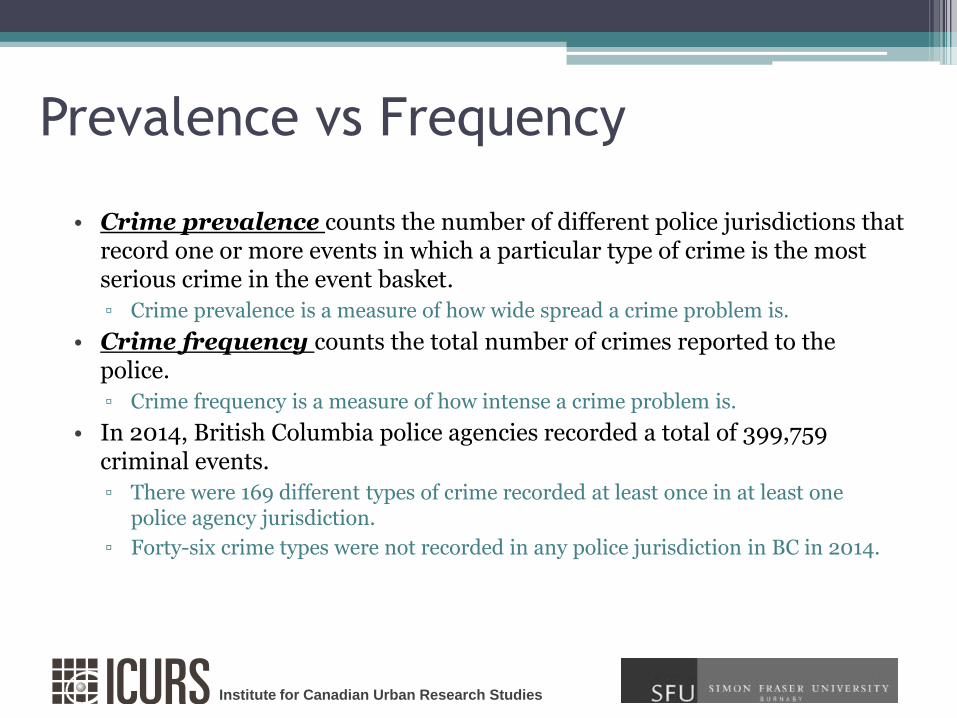
Prevalence vs Frequency
• Crime prevalence counts the number of different police jurisdictions that record one or more events in which a particular type of crime is the most serious crime in the event basket.
▫ Crime prevalence is a measure of how wide spread a crime problem is.
• Crime frequency counts the total number of crimes reported to the police.
▫ Crime frequency is a measure of how intense a crime problem is.
• In 2014, British Columbia police agencies recorded a total of 399,759 criminal events.
▫ There were 169 different types of crime recorded at least once in at least one police agency jurisdiction.
▫ Forty-six crime types were not recorded in any police jurisdiction in BC in 2014.
Institute for Canadian Urban Research Studies
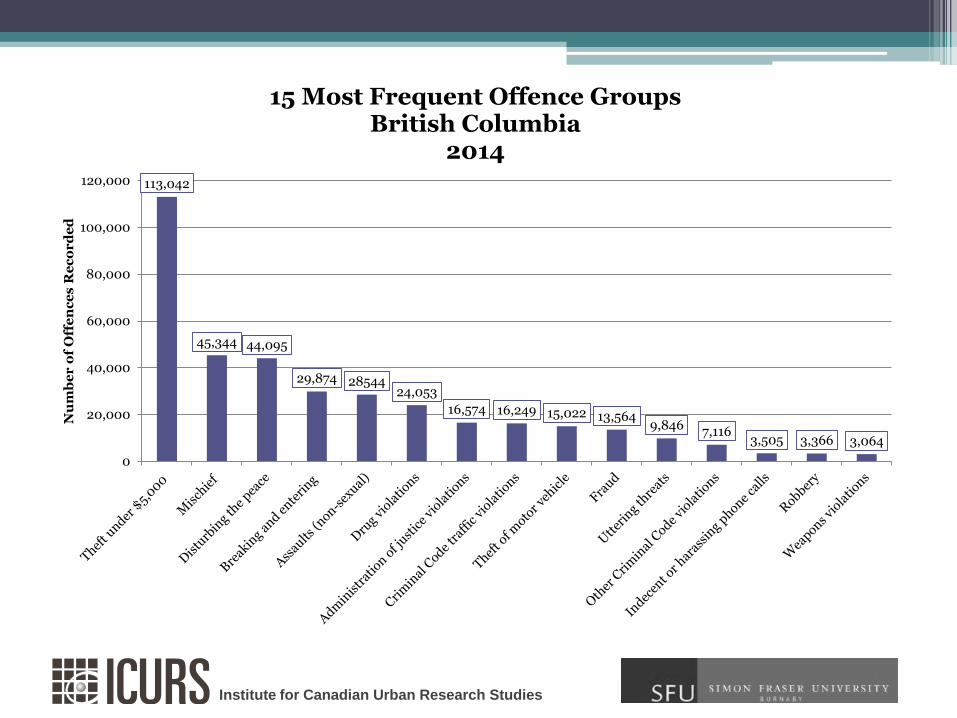
113,042
45,344 44,095
29,874 2854424,053
16,574 16,249 15,022 13,5649,846 7,116
3,505 3,366 3,064
0
20,000
40,000
60,000
80,000
100,000
120,000
Nu
mb
er
of
Off
en
ce
s R
ec
or
de
d
15 Most Frequent Offence GroupsBritish Columbia
2014
Institute for Canadian Urban Research Studies
50
,214
45
,34
3
44
,09
5
42
,73
4
29
,70
9
21,
50
1
20
,09
4
15,0
22
14,6
34
13,5
64
11,2
26
9,8
46
8,7
59
6,6
23
5,0
69
3,5
05
3,4
79
3,3
62
2,8
27
2,6
27
2,3
95
2,2
79
2,2
72
2,2
69
2,1
05
0
10,000
20,000
30,000
40,000
50,000
60,000
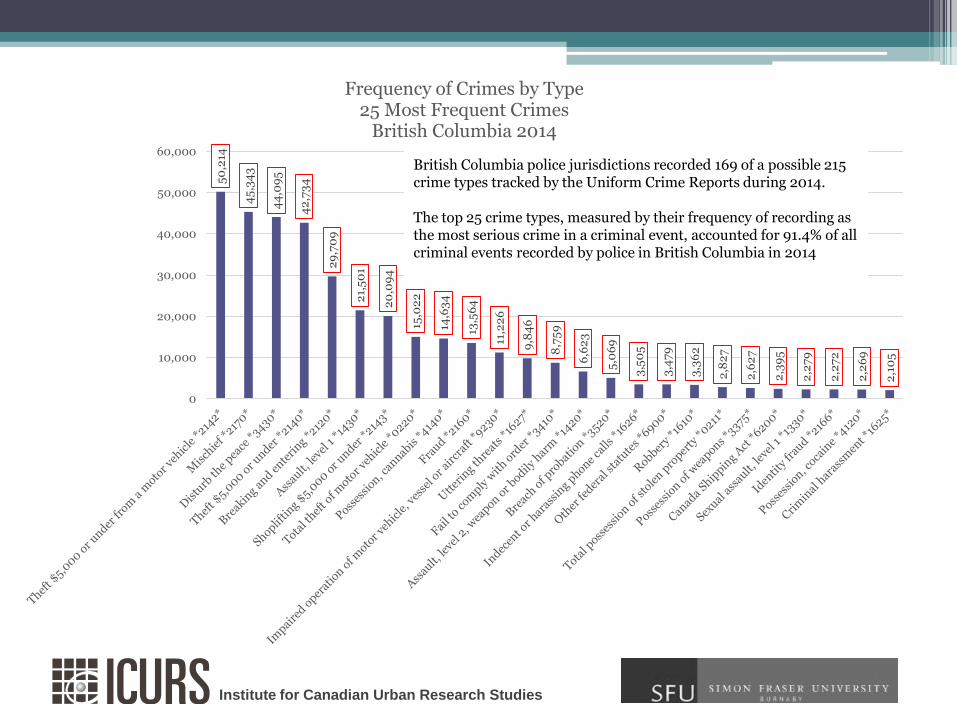
Frequency of Crimes by Type25 Most Frequent Crimes
British Columbia 2014
British Columbia police jurisdictions recorded 169 of a possible 215 crime types tracked by the Uniform Crime Reports during 2014.
The top 25 crime types, measured by their frequency of recording as the most serious crime in a criminal event, accounted for 91.4% of all criminal events recorded by police in British Columbia in 2014
Institute for Canadian Urban Research Studies
The most prevalent crimes in BC in 2014
• This study of prevalence examined the number of different crime types reported by 193 different police agencies in British Columbia in 2014.
▫ These agencies included: the 11 independent municipal police departments,
all RCMP municipal detachments, and
all RCMP Provincial detachments
▫ Some specialty agencies were excluded:
the BC Transit Police,
The RCMP Vancouver Offshore unit,
the CN Railroad Police, and
the CP Railroad Police.
Institute for Canadian Urban Research Studies
The Most Prevalent Crime Types
• Three crimes tied as most prevalent, reported by all 193 police agencies:
▫ Mischief
▫ Theft $5,000 and under
▫ Assault level 1
• The 10 most prevalent offence types accounted for 60% of all criminal events recorded by BC police agencies in 2014.
• The 25 most prevalent crime types together accounted for 90% of all criminal events recorded by all BC police agencies.
• These are the crimes that all police agencies must be prepared to handle.
Institute for Canadian Urban Research Studies
193 193 193 192 192 192 190 187 186 185 185 182 181173 170 166 165
157 157
138 134
118109
89 8680
66 6355
40 38 3528
188
0
50
100
150
200
250
Nu
mb
er o
f p
olic
e ju
risd
icti
on
s re
po
rtin
g at
leas
t o
ne
inci
den
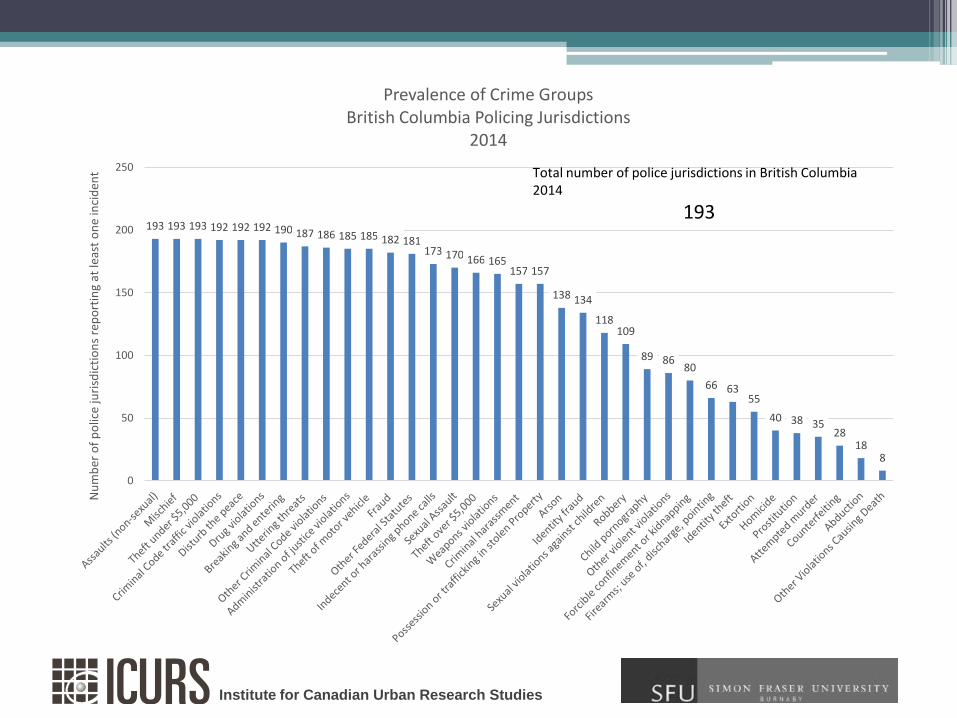
tPrevalence of Crime Groups
British Columbia Policing Jurisdictions2014
Total number of police jurisdictions in British Columbia 2014
193
Institute for Canadian Urban Research Studies
0
2
4
6
8
10
12
14
16
18
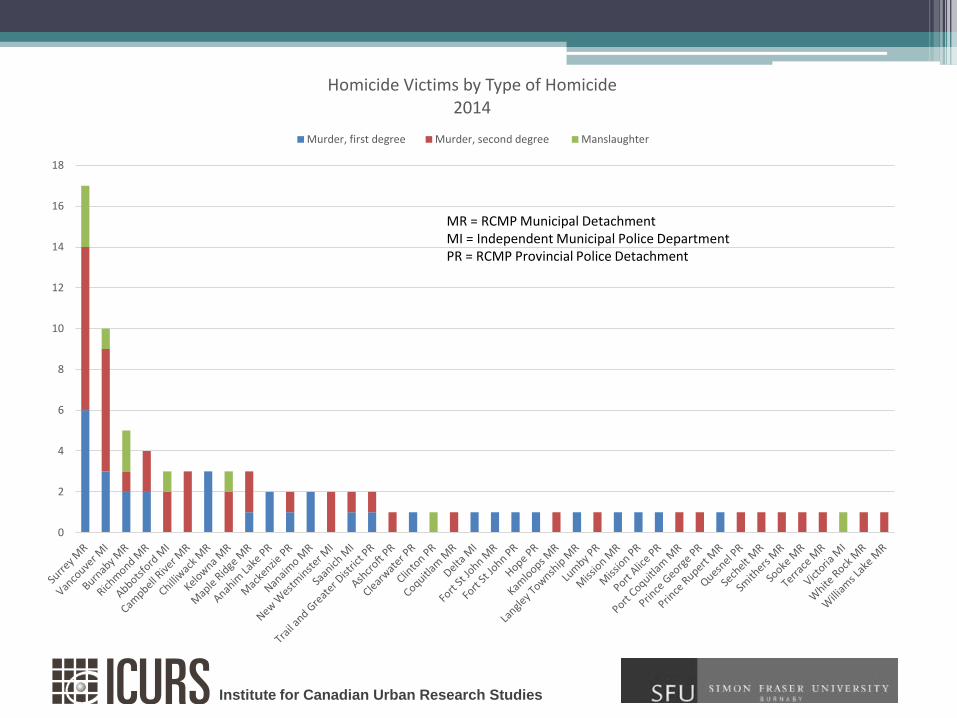
Homicide Victims by Type of Homicide2014
Murder, first degree Murder, second degree Manslaughter
MR = RCMP Municipal DetachmentMI = Independent Municipal Police DepartmentPR = RCMP Provincial Police Detachment
Institute for Canadian Urban Research Studies
Prevalence of the most serious crime types
in BC in 2014
• Statistics Canada has developed a crime severity weight for each UCR crime type to aid in calculation of the Crime Severity Index.
▫ The weights are derived from mean sentence length per offence type
• The most serious crimes identified by the CSI weights are generally rare events:
▫ First degree murder was reported in only 11% of police jurisdictions
▫ Robbery, the most prevalent of the 25 most serious offences was reported in just more than half (56%) of police jurisdictions
▫ Nine of the 25 most serious crime types (35%) did not occur in any BC police jurisdiction in 2014
• This suggests that rare but serious crimes should be investigated by multi-jurisdictional specialty units rather than by individual police agencies.
▫ Only a few very large jurisdictions are likely to see enough of these crime types to make maintaining their own specialty investigative units cost-effective.
Institute for Canadian Urban Research Studies
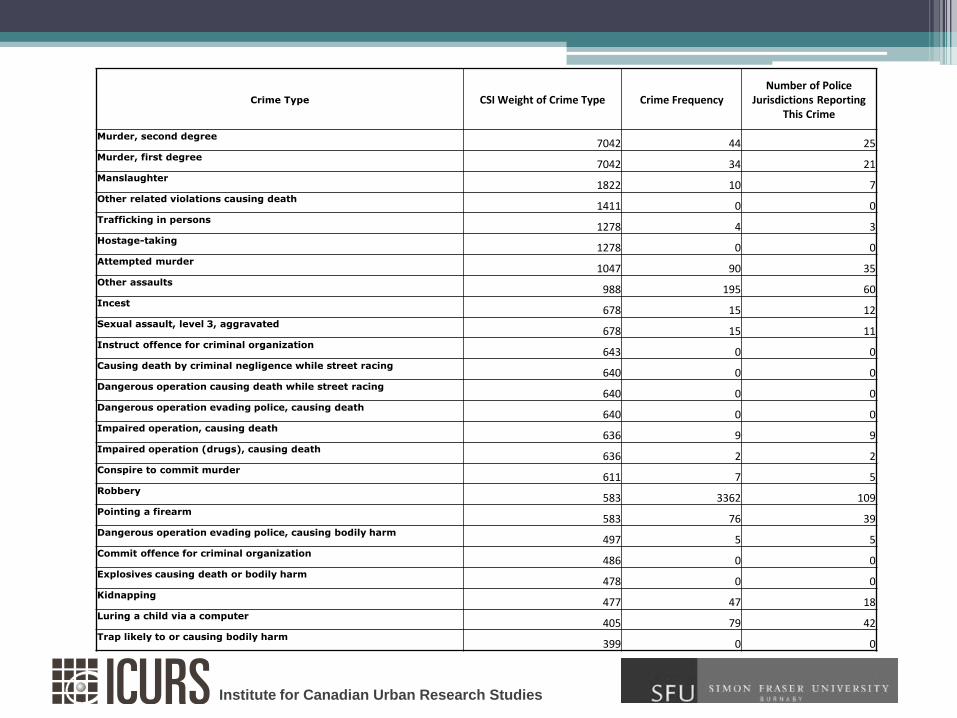
Crime Type CSI Weight of Crime Type Crime FrequencyNumber of Police
Jurisdictions Reporting This Crime
Murder, second degree 7042 44 25
Murder, first degree 7042 34 21
Manslaughter 1822 10 7
Other related violations causing death 1411 0 0
Trafficking in persons 1278 4 3
Hostage-taking 1278 0 0
Attempted murder 1047 90 35
Other assaults988 195 60
Incest 678 15 12
Sexual assault, level 3, aggravated 678 15 11
Instruct offence for criminal organization643 0 0
Causing death by criminal negligence while street racing 640 0 0
Dangerous operation causing death while street racing 640 0 0
Dangerous operation evading police, causing death 640 0 0
Impaired operation, causing death 636 9 9
Impaired operation (drugs), causing death 636 2 2
Conspire to commit murder 611 7 5
Robbery 583 3362 109
Pointing a firearm 583 76 39
Dangerous operation evading police, causing bodily harm 497 5 5
Commit offence for criminal organization 486 0 0
Explosives causing death or bodily harm 478 0 0
Kidnapping 477 47 18
Luring a child via a computer 405 79 42
Trap likely to or causing bodily harm 399 0 0
Institute for Canadian Urban Research Studies
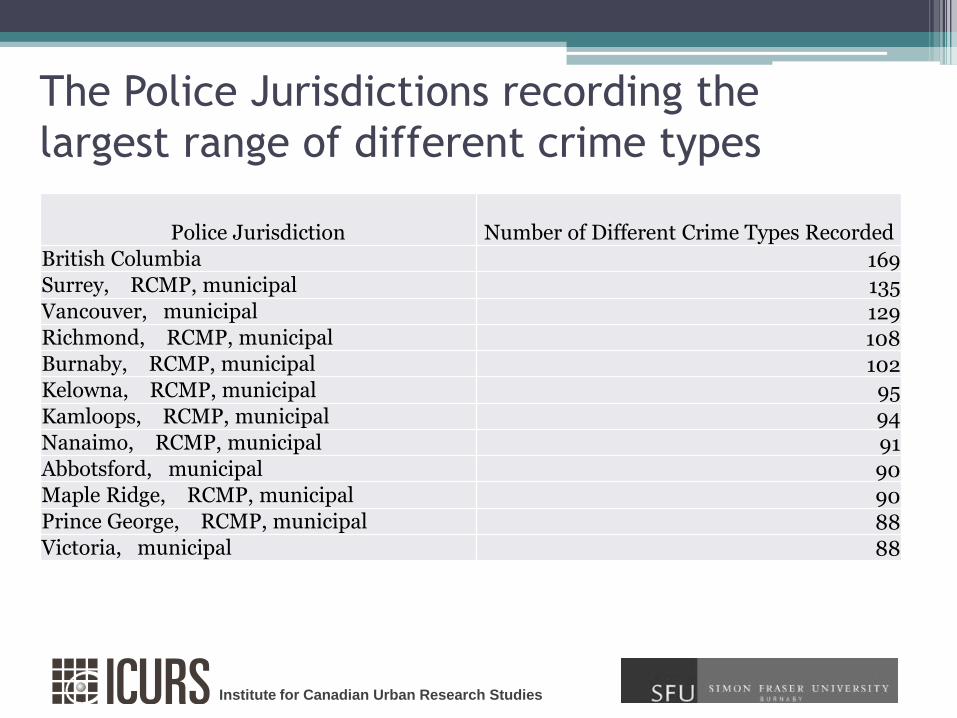
The Police Jurisdictions recording the
largest range of different crime types
Police Jurisdiction Number of Different Crime Types Recorded
British Columbia 169Surrey, RCMP, municipal 135Vancouver, municipal 129Richmond, RCMP, municipal 108Burnaby, RCMP, municipal 102Kelowna, RCMP, municipal 95Kamloops, RCMP, municipal 94Nanaimo, RCMP, municipal 91Abbotsford, municipal 90Maple Ridge, RCMP, municipal 90Prince George, RCMP, municipal 88Victoria, municipal 88
Institute for Canadian Urban Research Studies
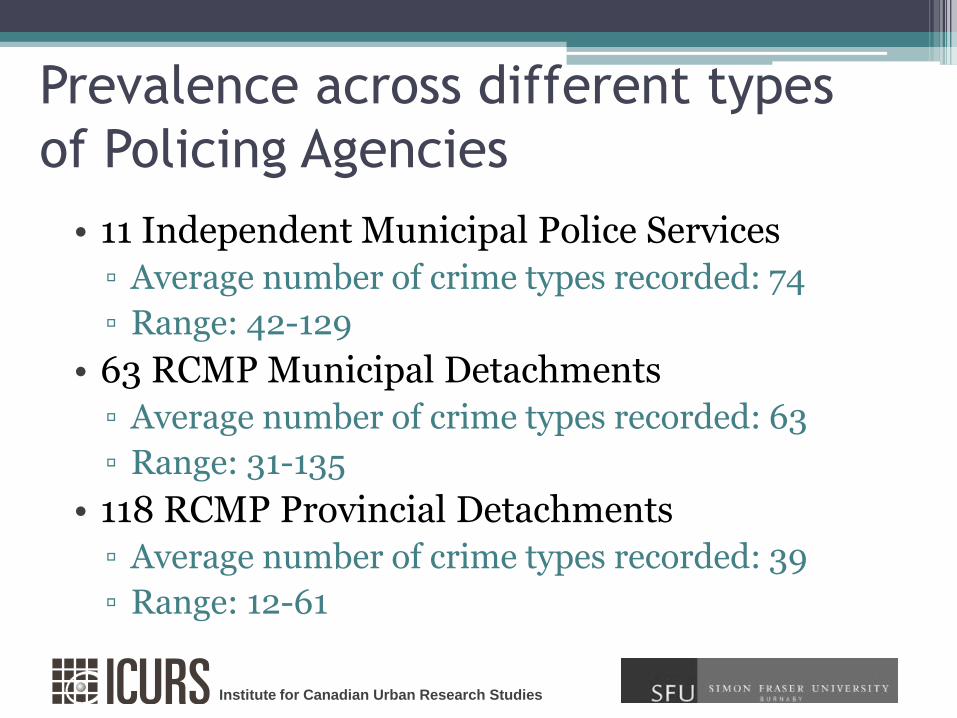
Prevalence across different types
of Policing Agencies
• 11 Independent Municipal Police Services
▫ Average number of crime types recorded: 74
▫ Range: 42-129
• 63 RCMP Municipal Detachments
▫ Average number of crime types recorded: 63
▫ Range: 31-135
• 118 RCMP Provincial Detachments
▫ Average number of crime types recorded: 39
▫ Range: 12-61
Institute for Canadian Urban Research Studies
Crime Location Quotients
• Crime Location Quotients identify jurisdictions which have crime mixtures that are substantially different the overall Provincial pattern
• LQC’s for violence, traffic crimes and drug crimes are dominated by small provincial police force detachments
• LQC’s for property crime are dominated by large, urban police jurisdictions.
Institute for Canadian Urban Research Studies
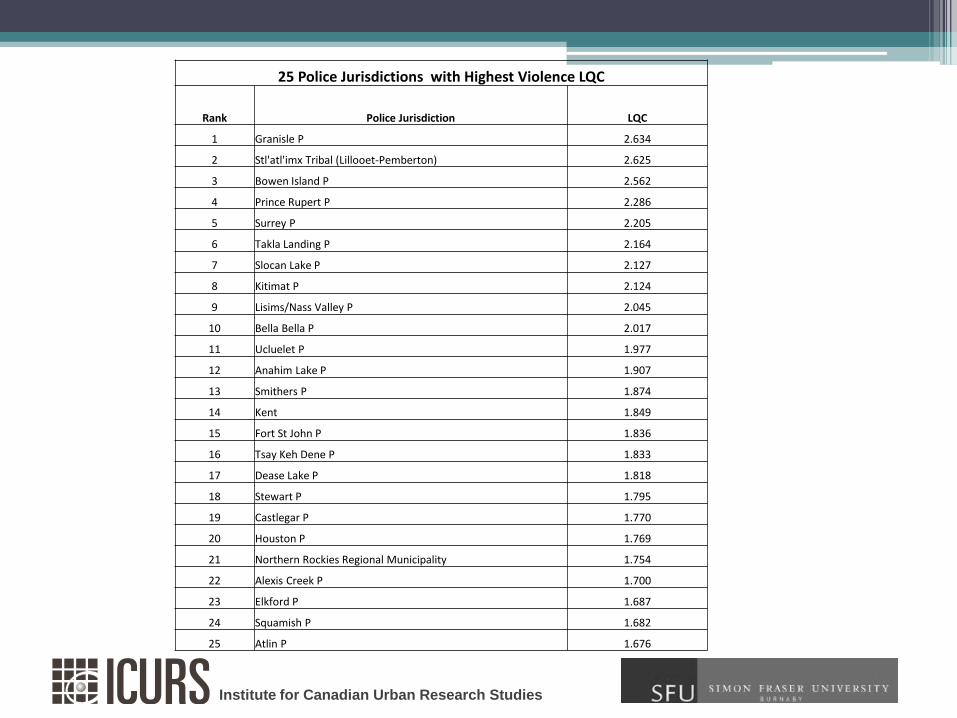
25 Police Jurisdictions with Highest Violence LQC
Rank Police Jurisdiction LQC
1 Granisle P 2.634
2 Stl'atl'imx Tribal (Lillooet-Pemberton) 2.625
3 Bowen Island P 2.562
4 Prince Rupert P 2.286
5 Surrey P 2.205
6 Takla Landing P 2.164
7 Slocan Lake P 2.127
8 Kitimat P 2.124
9 Lisims/Nass Valley P 2.045
10 Bella Bella P 2.017
11 Ucluelet P 1.977
12 Anahim Lake P 1.907
13 Smithers P 1.874
14 Kent 1.849
15 Fort St John P 1.836
16 Tsay Keh Dene P 1.833
17 Dease Lake P 1.818
18 Stewart P 1.795
19 Castlegar P 1.770
20 Houston P 1.769
21 Northern Rockies Regional Municipality 1.754
22 Alexis Creek P 1.700
23 Elkford P 1.687
24 Squamish P 1.682
25 Atlin P 1.676
Institute for Canadian Urban Research Studies
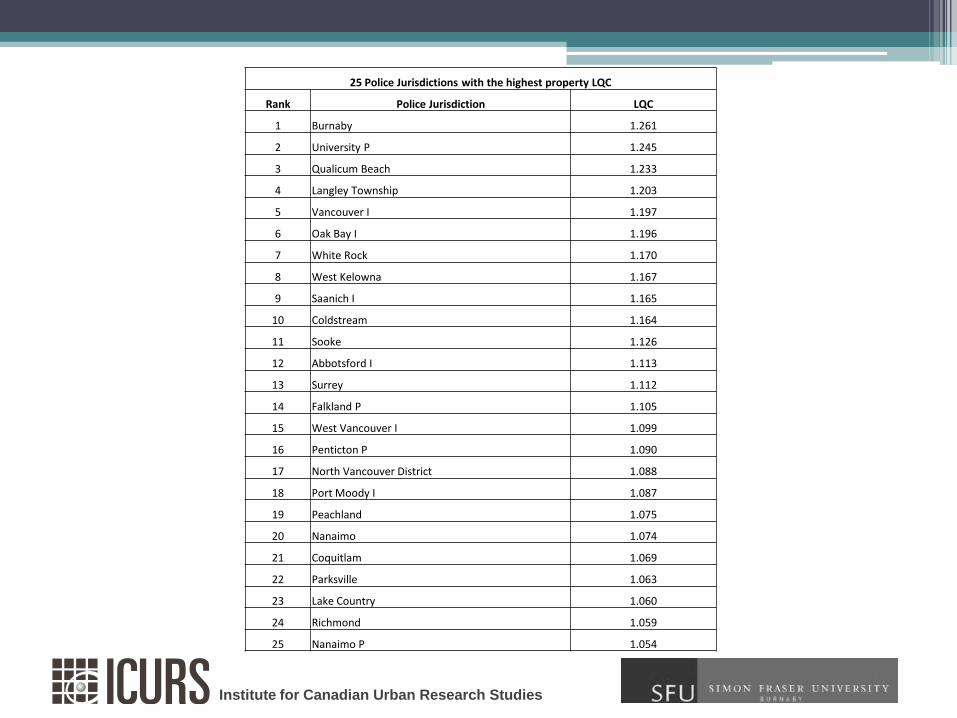
25 Police Jurisdictions with the highest property LQC
Rank Police Jurisdiction LQC
1 Burnaby 1.261
2 University P 1.245
3 Qualicum Beach 1.233
4 Langley Township 1.203
5 Vancouver I 1.197
6 Oak Bay I 1.196
7 White Rock 1.170
8 West Kelowna 1.167
9 Saanich I 1.165
10 Coldstream 1.164
11 Sooke 1.126
12 Abbotsford I 1.113
13 Surrey 1.112
14 Falkland P 1.105
15 West Vancouver I 1.099
16 Penticton P 1.090
17 North Vancouver District 1.088
18 Port Moody I 1.087
19 Peachland 1.075
20 Nanaimo 1.074
21 Coquitlam 1.069
22 Parksville 1.063
23 Lake Country 1.060
24 Richmond 1.059
25 Nanaimo P 1.054
Institute for Canadian Urban Research Studies
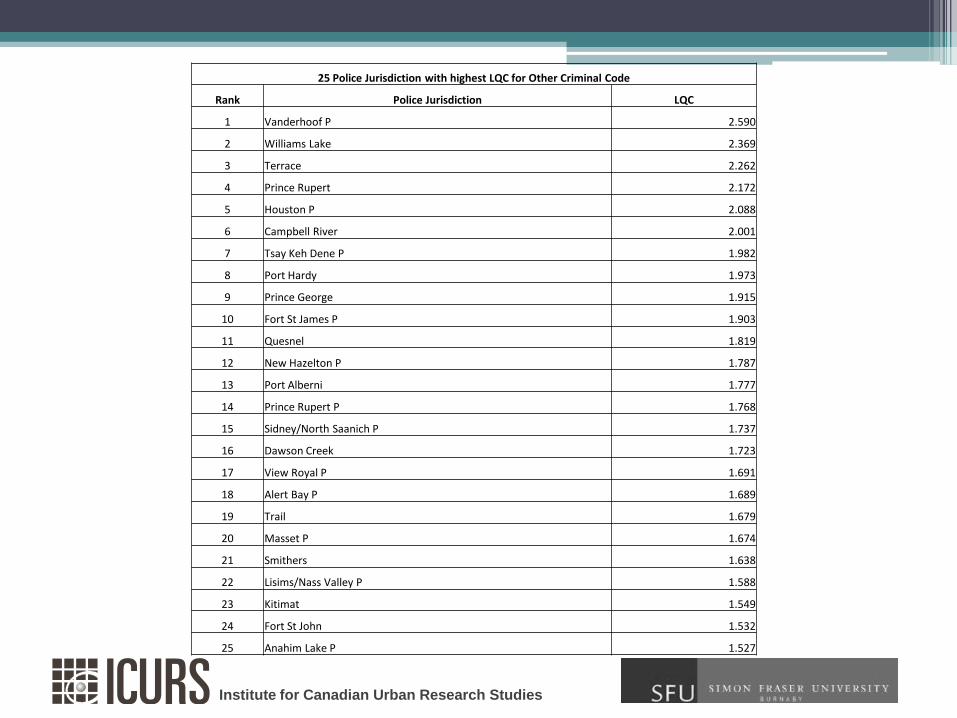
25 Police Jurisdiction with highest LQC for Other Criminal Code
Rank Police Jurisdiction LQC
1 Vanderhoof P 2.590
2 Williams Lake 2.369
3 Terrace 2.262
4 Prince Rupert 2.172
5 Houston P 2.088
6 Campbell River 2.001
7 Tsay Keh Dene P 1.982
8 Port Hardy 1.973
9 Prince George 1.915
10 Fort St James P 1.903
11 Quesnel 1.819
12 New Hazelton P 1.787
13 Port Alberni 1.777
14 Prince Rupert P 1.768
15 Sidney/North Saanich P 1.737
16 Dawson Creek 1.723
17 View Royal P 1.691
18 Alert Bay P 1.689
19 Trail 1.679
20 Masset P 1.674
21 Smithers 1.638
22 Lisims/Nass Valley P 1.588
23 Kitimat 1.549
24 Fort St John 1.532
25 Anahim Lake P 1.527

Institute for Canadian Urban Research Studies
25 Police Jurisdictions with highest LQC for Criminal Code Traffic
Rank Police Jurisdiction LQC
1 Ridge Meadows P 11.765
2 Whistler P 5.774
3 Fraser Lake P 5.480
4 Tsay Keh Dene P 3.817
5 Kimberley P 3.698
6 North Vancouver P 3.612
7 Cranbrook P 3.482
8 Dawson Creek P 3.368
9 Castlegar P 3.299
10 Quesnel P 3.084
11 Chetwynd P 3.073
12 Kimberley 3.057
13 Nelson P 2.988
14 Spallumcheen P 2.951
15 Lumby P 2.845
16 Stewart P 2.765
17 Elkford P 2.761
18 Dawson Creek 2.736
19 Dease Lake P 2.656
20 Fernie P 2.626
21 Golden/Field P 2.570
22 Texada Island P 2.556
23 Stl'atl'imx Tribal (Lillooet-Pemberton) 2.534
24 Kitimat P 2.454
25 Columbia Valley P 2.435
26 Sayward P 2.394
Institute for Canadian Urban Research Studies
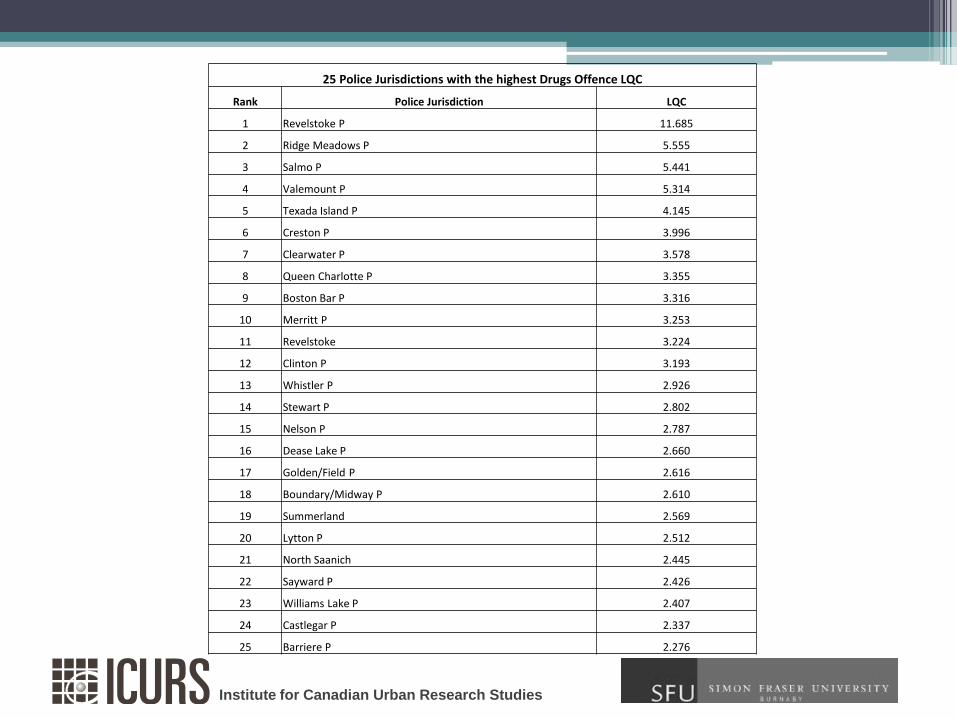
25 Police Jurisdictions with the highest Drugs Offence LQC
Rank Police Jurisdiction LQC
1 Revelstoke P 11.685
2 Ridge Meadows P 5.555
3 Salmo P 5.441
4 Valemount P 5.314
5 Texada Island P 4.145
6 Creston P 3.996
7 Clearwater P 3.578
8 Queen Charlotte P 3.355
9 Boston Bar P 3.316
10 Merritt P 3.253
11 Revelstoke 3.224
12 Clinton P 3.193
13 Whistler P 2.926
14 Stewart P 2.802
15 Nelson P 2.787
16 Dease Lake P 2.660
17 Golden/Field P 2.616
18 Boundary/Midway P 2.610
19 Summerland 2.569
20 Lytton P 2.512
21 North Saanich 2.445
22 Sayward P 2.426
23 Williams Lake P 2.407
24 Castlegar P 2.337
25 Barriere P 2.276