Embed Size (px)
Citation preview
The Pressing Issues for Mobility
Alan E. Pisarski
AMERICAN DREAM COALITION
Orlando 10/11/2010
In the Great Recession-and after
This is a critical time to recognize that trips have economic or social transactions at their end of value to the trip maker and the society
Does America have the mobility it needs to meet its social and economic goals today?
Almost!There are tasks undone and new anti-
mobility policy challenges!
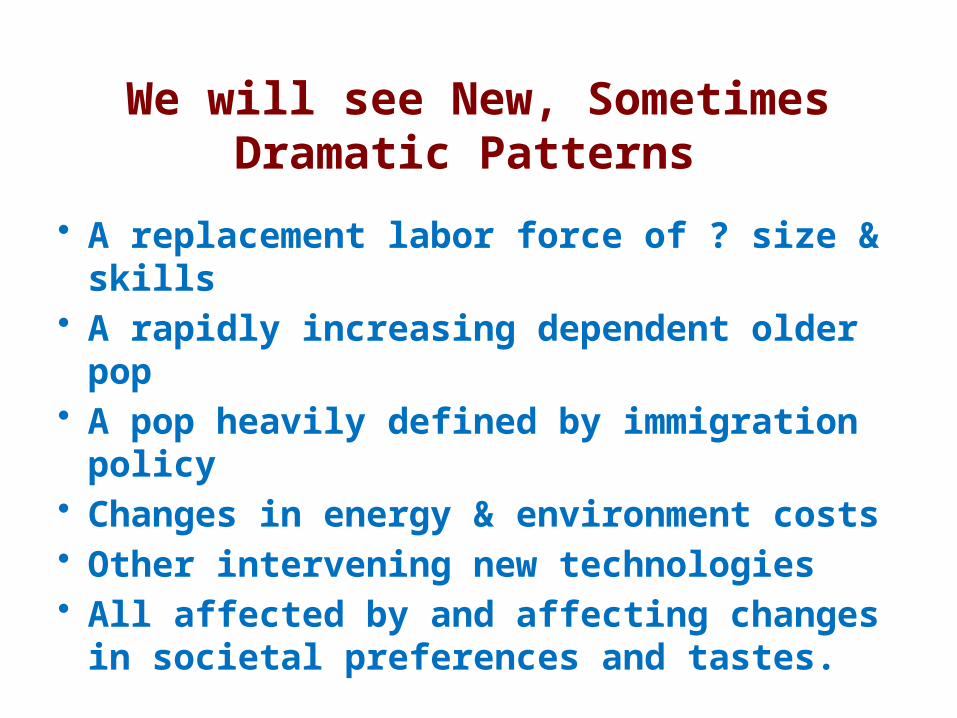
We will see New, Sometimes Dramatic Patterns
• A replacement labor force of ? size & skills• A rapidly increasing dependent older pop• A pop heavily defined by immigration policy• Changes in energy & environment costs• Other intervening new technologies• All affected by and affecting changes in
societal preferences and tastes.
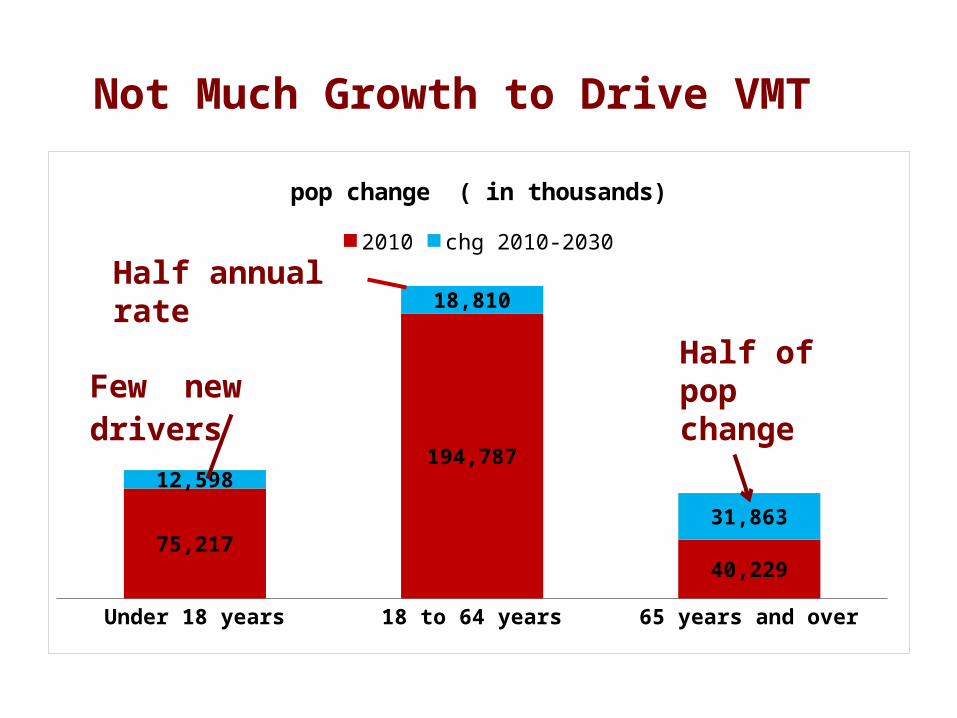
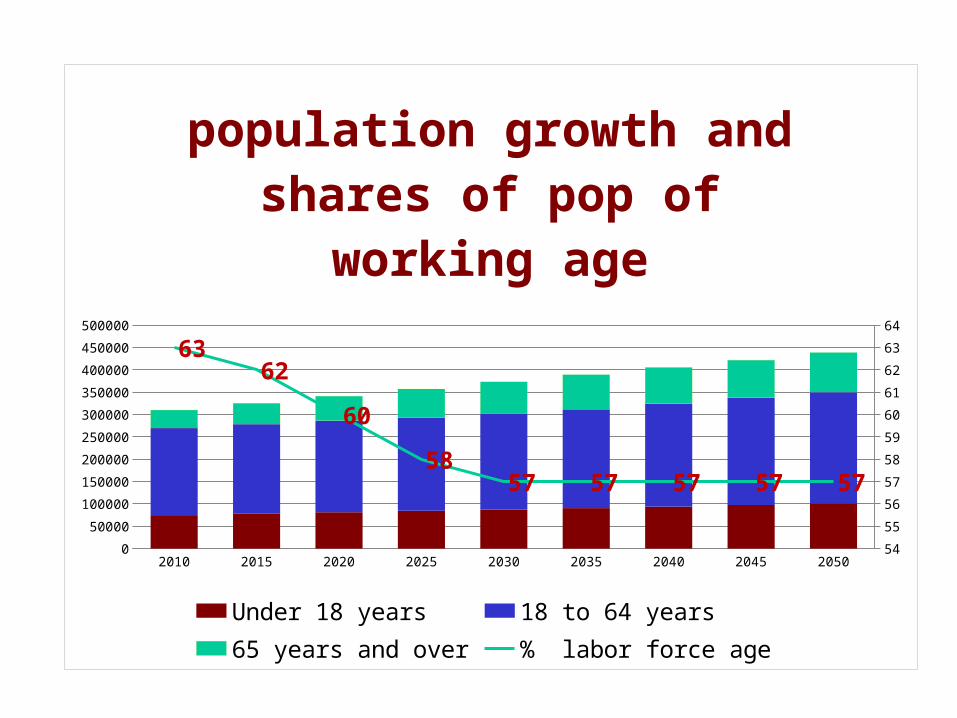
Not Much Growth to Drive VMT
Under 18 years 18 to 64 years 65 years and over
75,217
194,787
40,229
12,598
18,810
31,863
pop change ( in thousands)
2010 chg 2010-2030
Few new drivers Half of pop change
Half annual rate
2010 2015 2020 2025 2030 2035 2040 2045 20500
50000
100000
150000
200000
250000
300000
350000
400000
450000
500000
54
55
56
57
58
59
60
61
62
63
64
6362
60
5857 57 57 57 57
population growth and shares of pop of working age
Under 18 years 18 to 64 years65 years and over % labor force age
The Tools of Travel are Stable Licenses
• Saturation in all ages• Women’s gains• Immigrants
Vehicles• Stability • Aging fleet• Workers = Drivers
IN THIS DECADE: NO GROWTH IN VMT, CONGESTION, WORKERS, OR WORK TRAVEL TIMES
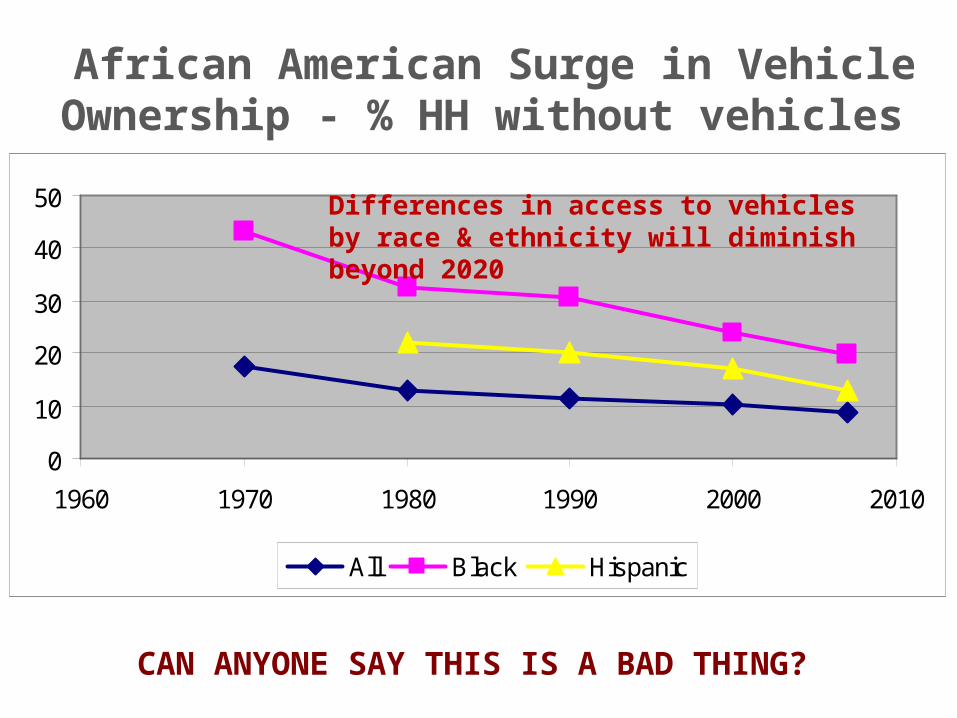
African American Surge in Vehicle Ownership - % HH without vehicles
0
10
20
30
40
50
1960 1970 1980 1990 2000 2010
All Black Hispanic
Differences in access to vehicles by race & ethnicity will diminish beyond 2020
CAN ANYONE SAY THIS IS A BAD THING?
Given all this stability
• Need a focus on current needs not impending growth
• A new context for planning. “Getting the Economy out of the mud!”
• The mobility issues we face are eminently solvable.
Keep asking this question:“IS IT A NEW TREND OR JUST
THE ECONOMY?”
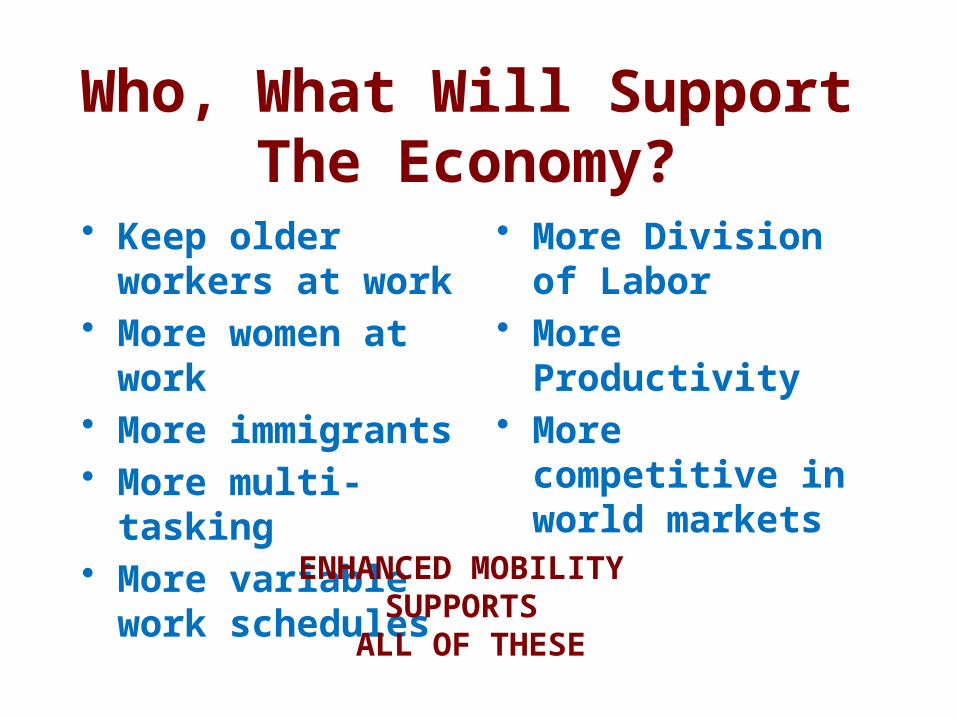
Who, What Will Support The Economy?
• Keep older workers at work
• More women at work • More immigrants • More multi-tasking• More variable work
schedules
• More Division of Labor
• More Productivity• More competitive in
world markets
ENHANCED MOBILITY SUPPORTS
ALL OF THESE
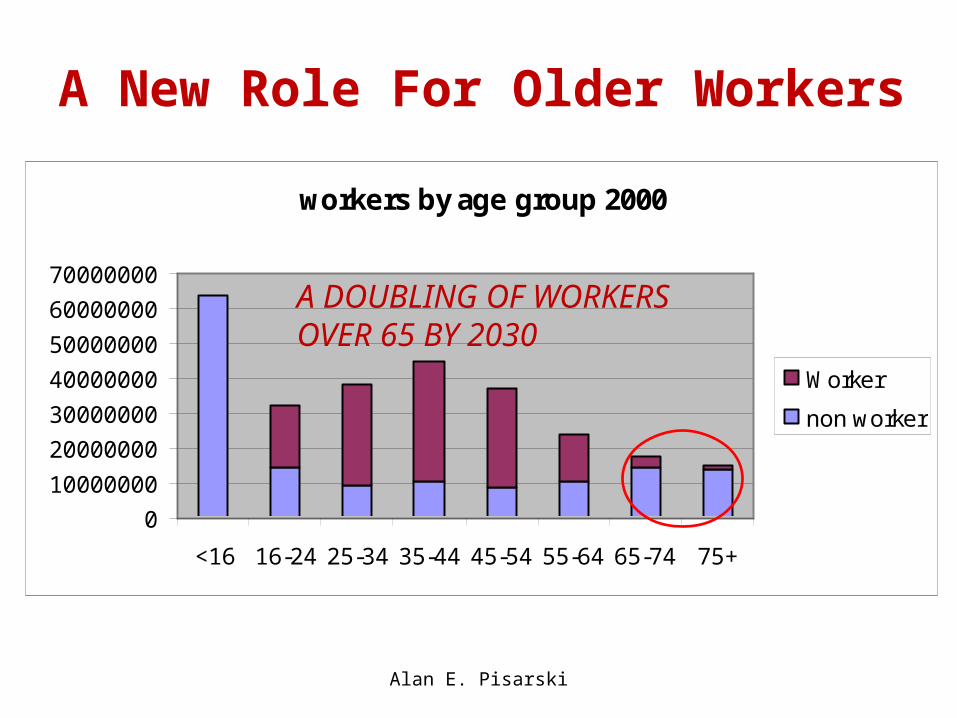
A New Role For Older Workers
workers by age group 2000
0
10000000
20000000
30000000
40000000
50000000
60000000
70000000
<16 16-24 25-34 35-44 45-54 55-64 65-74 75+
Worker
non worker
Alan E. Pisarski
A DOUBLING OF WORKERS OVER 65 BY 2030
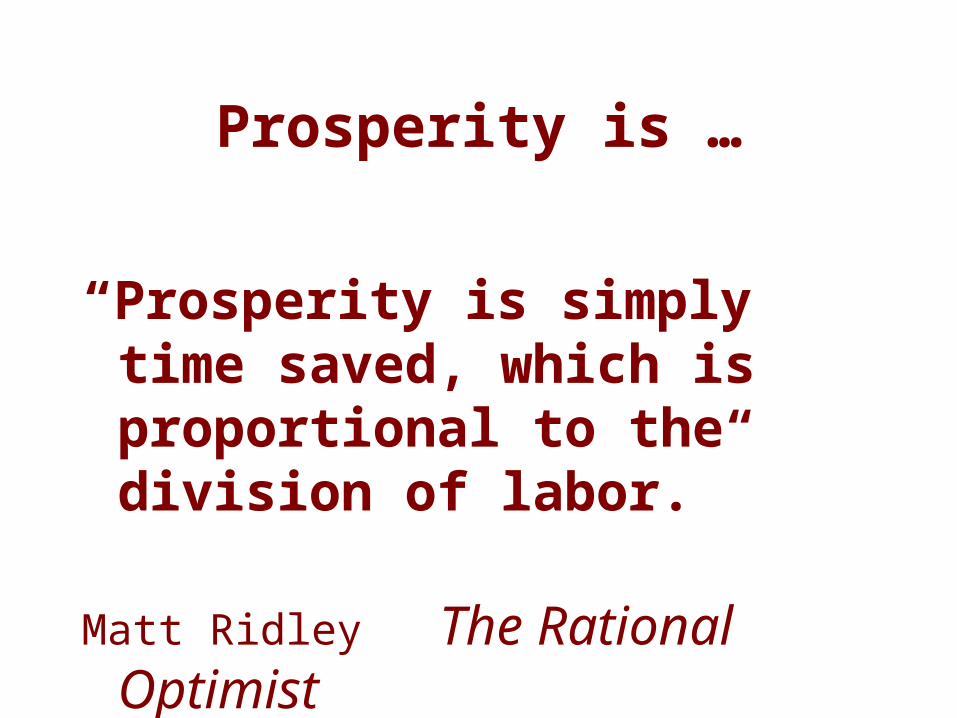
Prosperity is …
“Prosperity is simply time saved, which is proportional to the division of labor.”
Matt Ridley The Rational Optimist
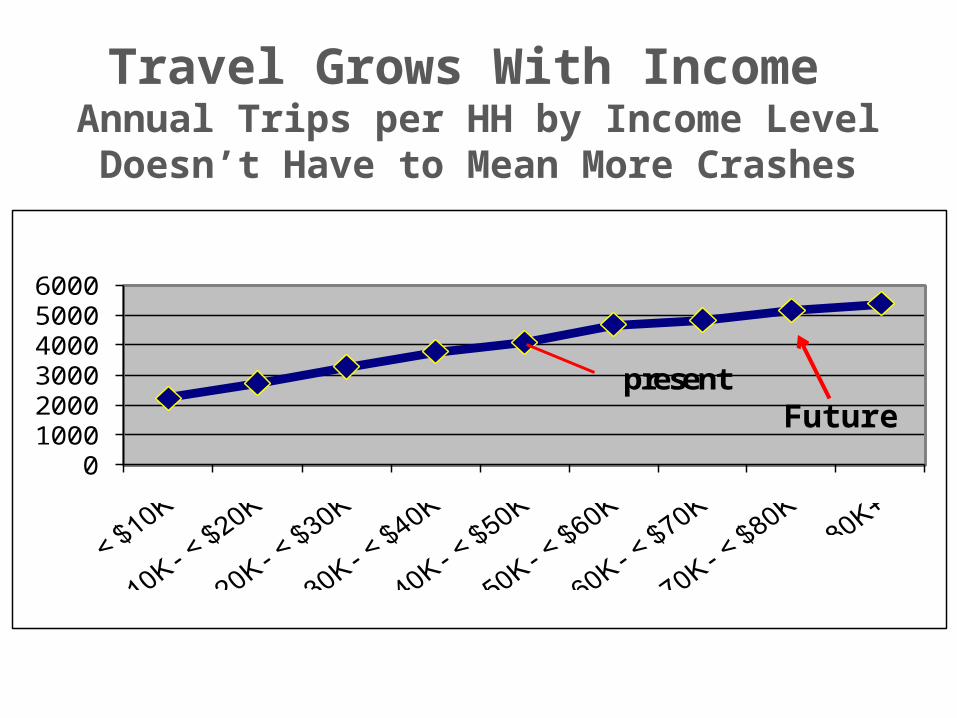
Travel Grows With Income Annual Trips per HH by Income LevelDoesn’t Have to Mean More Crashes
0100020003000400050006000
presentFuture
MOBILITYWE VALUE IT HIGHLY, BUT:
– WE CAN’T DEFINE IT USEFULLY– WE CAN’T QUANTIFY IT EFFECTIVELY
U.S. DOT, FOUNDED ON APRIL FOOLS DAY 1967,
PRODUCES A PRODUCT THAT IT DOESN’T UNDERSTAND AND DOESN’T SEEM TO
MUCH CARE ABOUT!
WHAT ARE ITS ATTRIBUTES?
• Speed• Cost• Convenience• Safety/ Security• Reliability
All The Things That We Measure Badly!
WILL IT STILL MATTER IN THE FUTURE? MORE THAN EVER!
• THE CRITICAL NEED FOR SKILLED WORKERS
• EXPANDING OPPORTUNITY • COMPARATIVE ADVANTAGE IN A
GLOBALIZED ECONOMY • KNITTING TOGETHER SOCIETIES
In a World of Low Job Opportunities, Like Now • Job-hungry, often house-frozen, will expand
the range they will consider to find an acceptable (any?) job
• I am willing to go farther for a job I can:– Get – Do – That is attractive (pay, opportunity, benefits)
• Maybe switch later when market improves
When high opportunity job market returns (2012?)
• Opportunities mainly for those with specialized skills
• Increased specialization means going farther for a job– Fast Food? – down the block– Energy Research? – vast Distances
WE DON’T LIVE OUTSIDE THE FACTORY GATE ANYMORE!
Present “Livability” approach is anti-mobility
• If you really want it; live next to it !• I don’t shop at the corner grocer anymore
– Not lettuce but 16 kinds of lettuce– Not milk but 10 kinds of milk
• I don’t have one Doctor for my family – We probably have a dozen – None selected by the criterion of distance!
The options exist now to achieve “livability” if we choose
TO GO TO THE NEAREST
• JOB • SHOPPING• DOCTORS• HOUSE OF WORSHIP
HOW MANY DO?
TO MOVE SO THAT YOU
• ARE NEARER WORK• ARE NEARER MEDS• ARE NEARER SHOPS• ARE NEARER OTHER
THINGS YOU VALUE
HOW MANY DO?
What’s Freight?
• Freight doesn’t exist in livability world• If it does – its on trains – out of sight• Not seen as related to:
– International competitiveness– Supporting/Enhancing the good life
LIVEABILITY – IT’S THE CITIES’ TURN
• Mayors love it• Direct funding from Washington• Get the states out of the way• Where else will the money come from?•
“Livability” as a funding criterion
• Present emphasis on “Performance Measurement” will become a charade
• “Livability”, like “sprawl”, has no tangible meaning
• A Perfect Federal Funding Tool– No quantitative criteria – Can’t measure success or failure – “Now I can fund my friends!”
Ultimately fed-centric – a smart guy in Washington will
decide.
• “Nationalize” investment decision-making• “Ear-marking” by other means • focus on “jobs” means focus on public sector
jobs – Transit, HSR, • The Highway Trust Fund would be gone • Revenue from highway and aviation taxes• Spending would be “Mode-Neutral”
Next Surface Legislation Pro - or Anti-Mobility?
• A year late already– Lame Duck Session unlikely– At least 6 months away in New Congress
• Outlook – better bill - more bleak• Need 40% increase in revenue – no VMT • Gen Rev input “justifies” use of Trust Fund for
anything –
THREAT IS DISSOLUTION OF HTF CONCEPT
PRESSING ISSUES FOR A PRO-MOBILITY POLICY
1. Understand It And Quantify It2. Transmit That Understanding To
Others 1. Decision-makers 2. The Public
3. Expand The Debate 4. Make The Case For The Value Of
Mobility5. Read “Mobility First”
THANK YOU
Alan E. Pisarski
ALANPISARSKI.COM
THE FUTURE OF MOBILITY – A WORK PROGRAM
• EXTENDING ITS REACH – THE DEMOCRATIZATION OF MOBILITY
• RESPONDING TO RISING DEMAND – THE DILEMMA OF AFFLUENCE
• ENHANCING ITS COMPETITIVE POWER – THE ROUTE TO PRODUCTIVTY
• AMELIORATING ITS NEGATIVE EFFECTS – SAFETY, ENVIRONMENT, RESOURCES
• SUPPORTING ITS VALUE – MAKING THE CASE
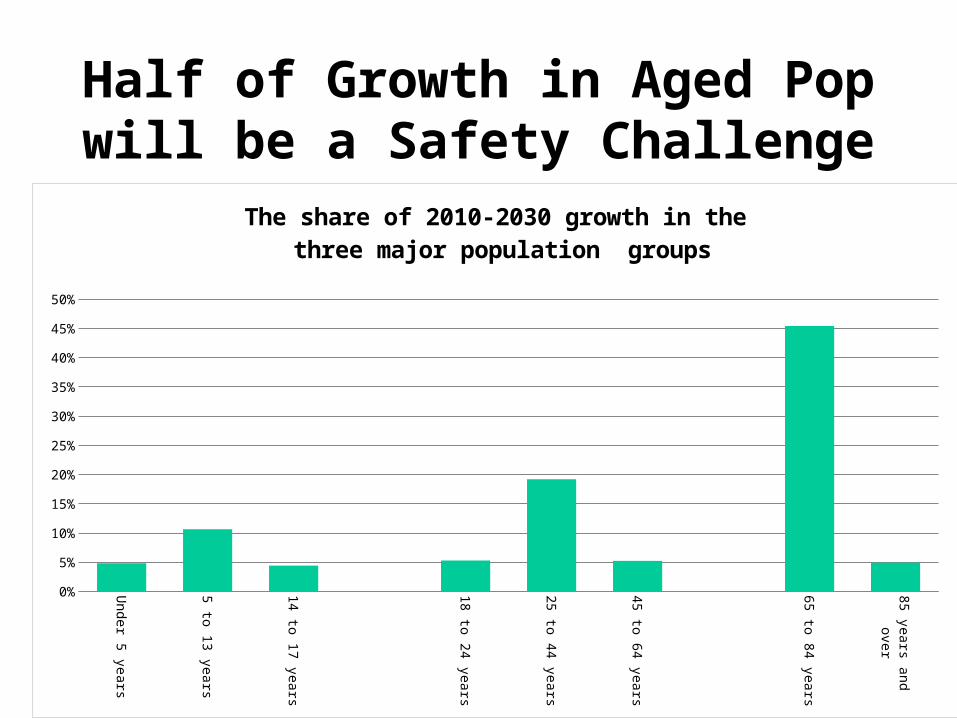
Half of Growth in Aged Pop will be a Safety Challenge
Under 5 years
5 to 13 years
14 to 17 years
18 to 24 years
25 to 44 years
45 to 64 years
65 to 84 years
85 years and over
0%
5%
10%
15%
20%
25%
30%
35%
40%
45%
50%
The share of 2010-2030 growth in the three major population groups
WE HAVE SURVIVED A DIFFICULT PERIOD
• the baby boomers coming of age ---- working age and driving age
• Women joining the labor force in vast numbers
• Extraordinary growth in Just-in-Time Freight
• Extraordinary growth in Foreign Trade
Facets of the same Mobility Concept
• # of suppliers ½ hr of my factory• # of workers ½ hr of my office• #of job opportunities ½ hr of my home• # of customers ½ hr from my store• % pop with major hospital ½ hr away• % pop with major Univ. 1 hour away
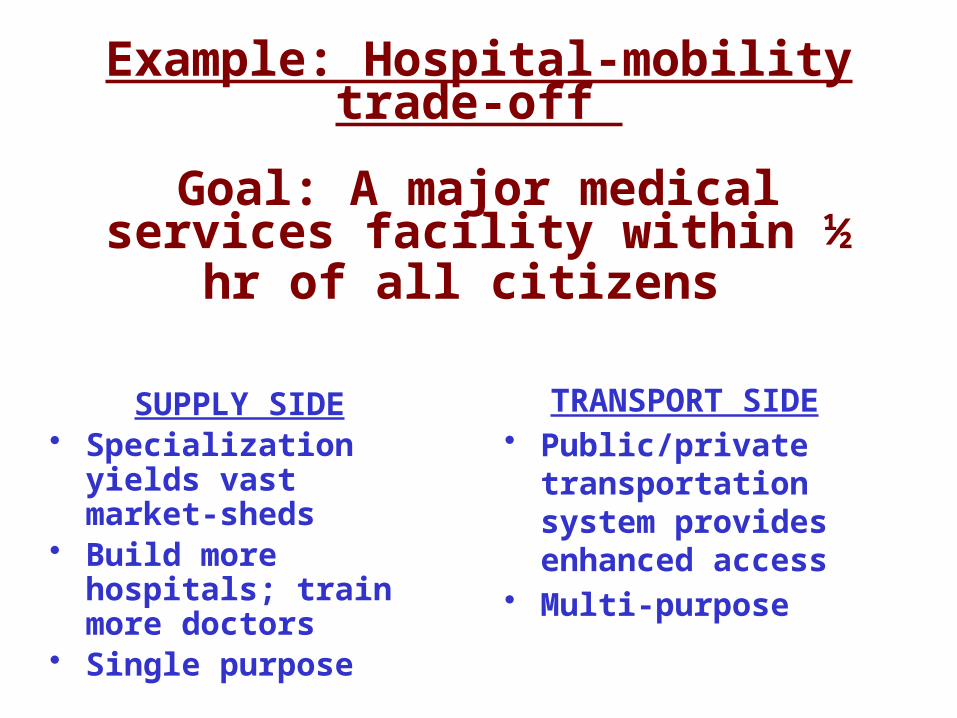
Example: Hospital-mobility trade-off
Goal: A major medical services facility within ½ hr of all citizens
TRANSPORT SIDE • Public/private
transportation system provides enhanced access
• Multi-purpose
SUPPLY SIDE• Specialization yields vast
market-sheds • Build more hospitals;
train more doctors• Single purpose
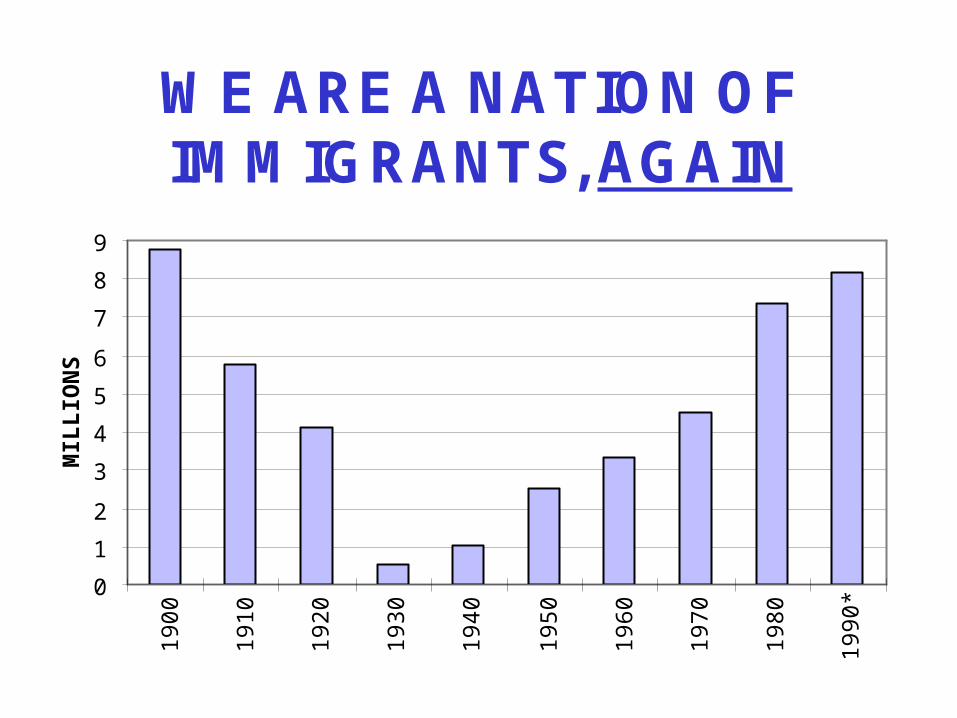
WE ARE A NATION OFIMMIGRANTS, AGAIN
0
1
2
3
4
5
6
7
8
9
19
00
19
10
19
20
19
30
19
40
19
50
19
60
19
70
19
80
19
90
*
MIL
LIO
NS
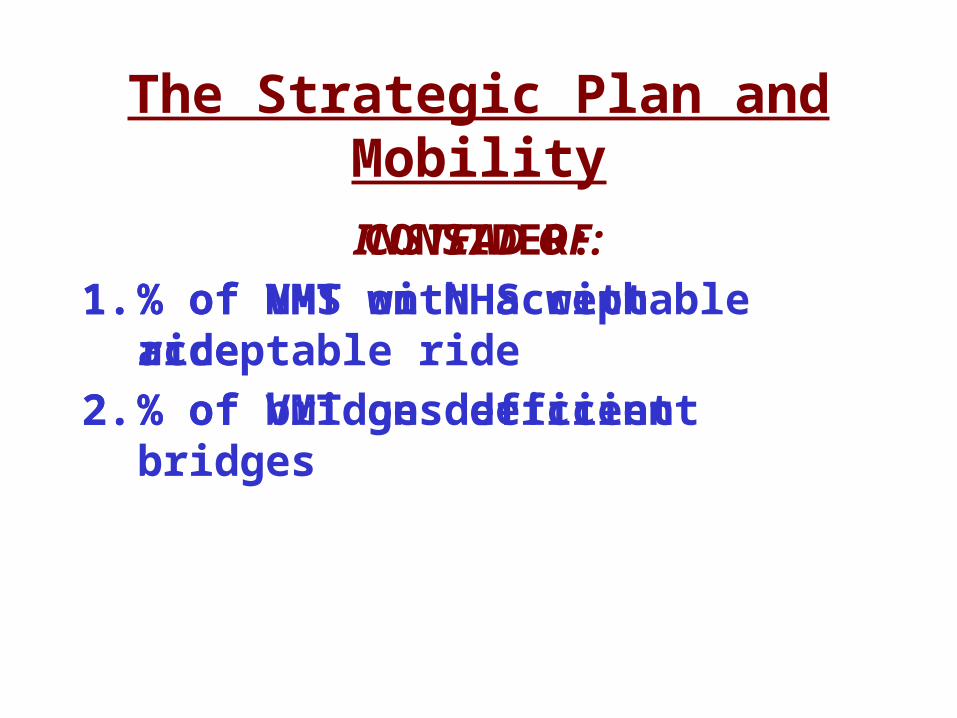
The Strategic Plan and Mobility
INSTEAD OF:
1. % of NHS with acceptable ride
2. % of bridges deficient
CONSIDER:
1. % of VMT on NHS with acceptable ride
2. % of VMT on deficient bridges
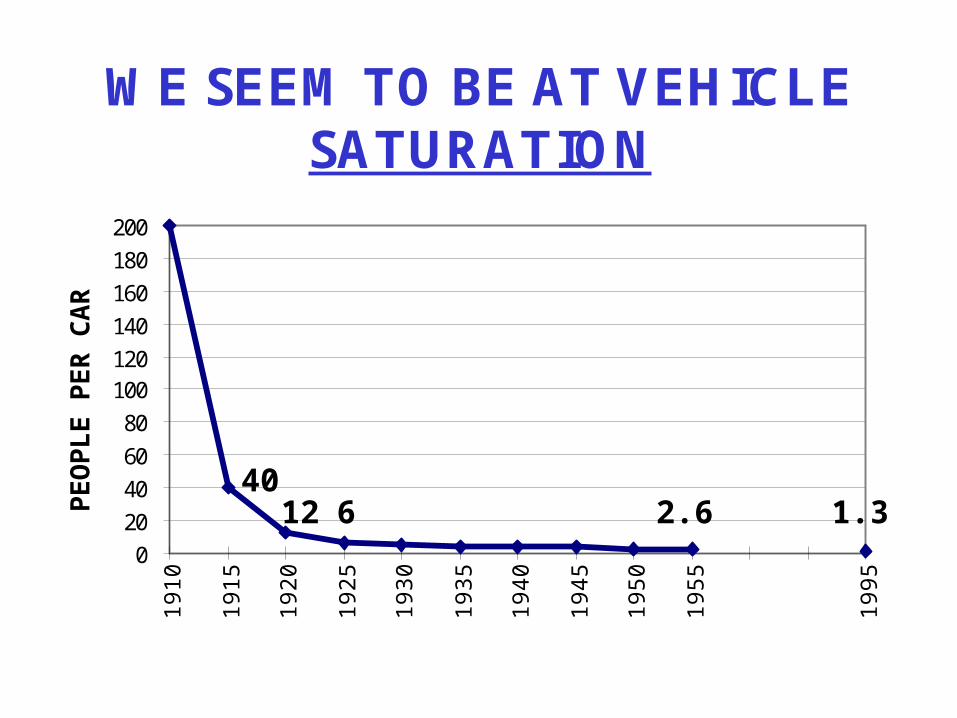
WE SEEM TO BE AT VEHICLESATURATION
0
20
40
60
80
100120
140
160
180
200
1910
1915
1920
1925
1930
1935
1940
1945
1950
1955
1995
PE
OP
LE
PE
R C
AR
2.6 1.340
612
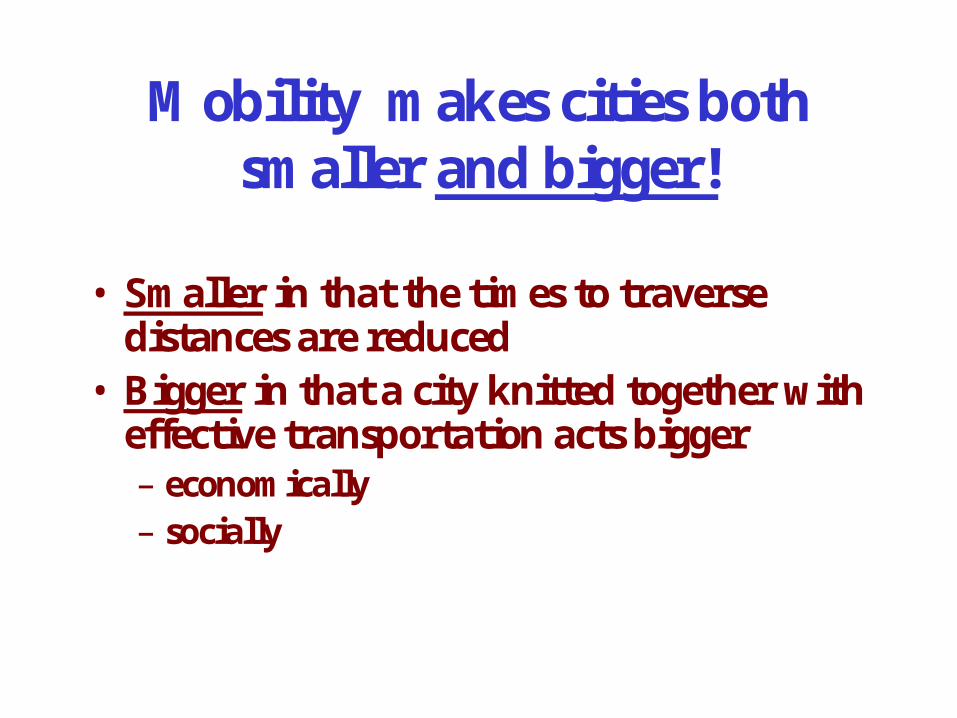
Mobility makes cities both smaller and bigger!
• Smaller in that the times to traverse distances are reduced
• Bigger in that a city knitted together with effective transportation acts bigger– economically – socially
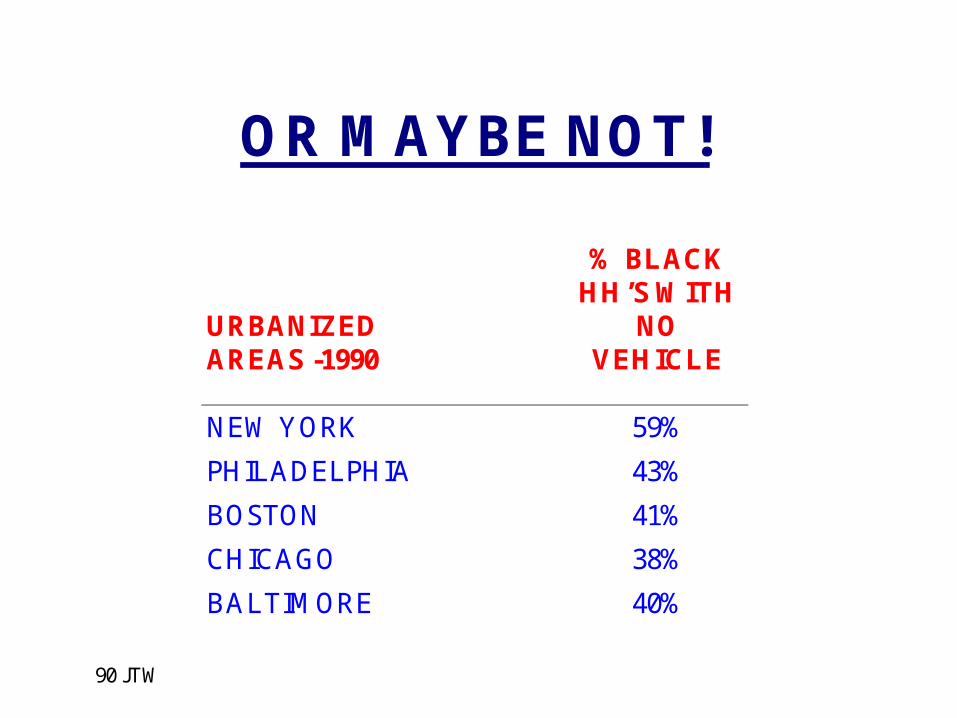
OR MAYBE NOT!
URBANIZED AREAS -1990
% BLACK HH’S WITH
NO VEHICLE
NEW YORK 59%
PHILADELPHIA 43%
BOSTON 41%
CHICAGO 38%
BALTIMORE 40%
90 JTW
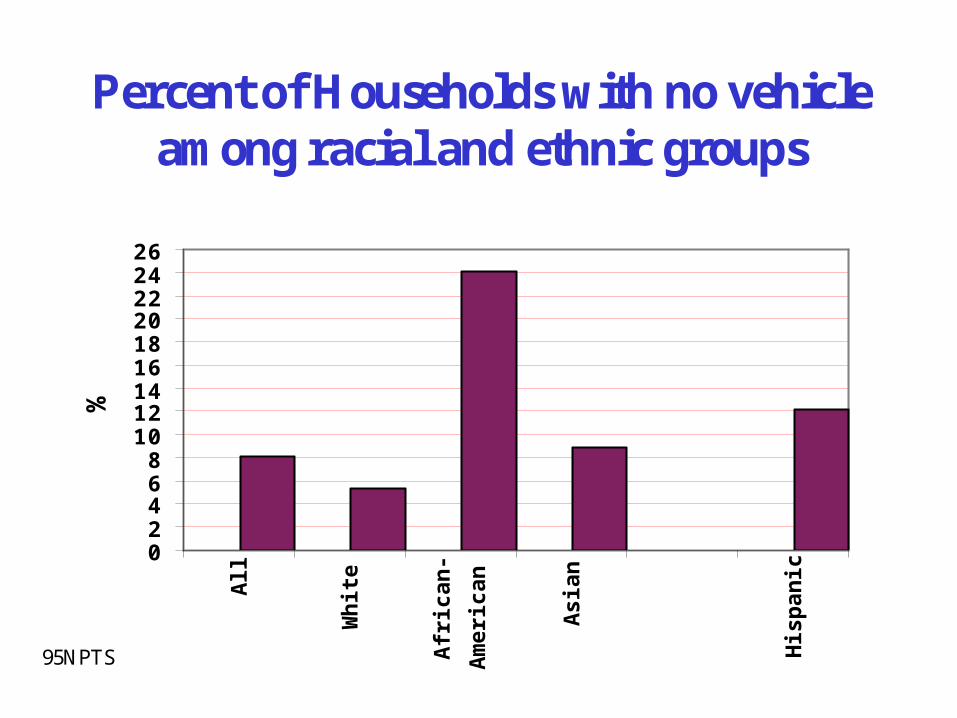
Percent of Households with no vehicleamong racial and ethnic groups
02468
101214161820222426
All
Wh
ite
Afr
ican
-
Am
eric
an
Asi
an
His
pan
ic
%
95NPTS
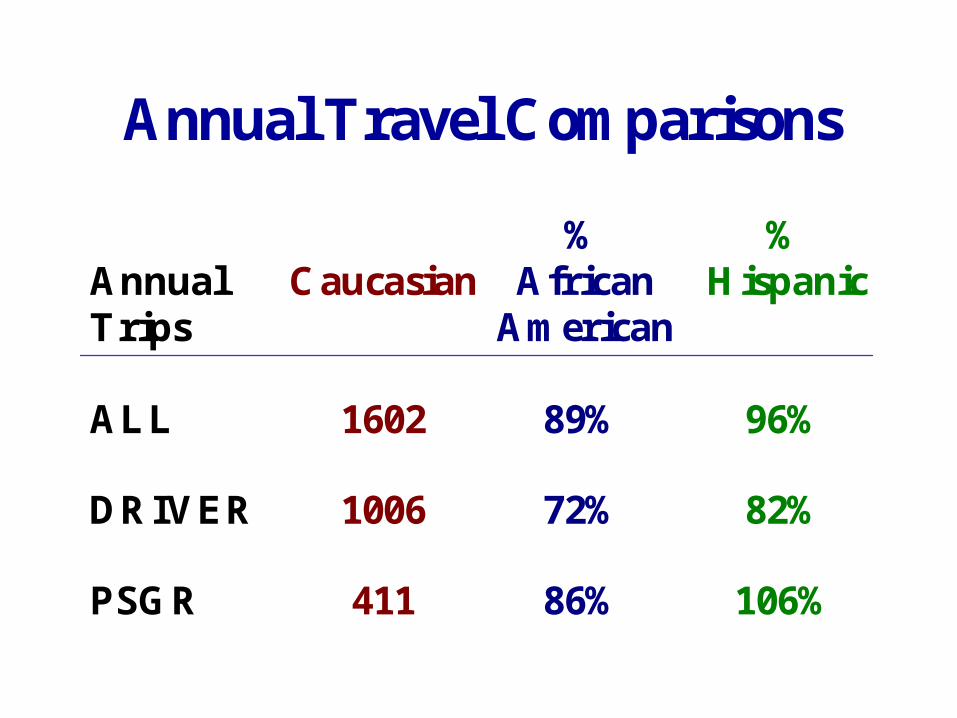
Annual Travel Comparisons
AnnualTrips
Caucasian%
AfricanAmerican
%Hispanic
ALL 1602 89% 96%
DRIVER 1006 72% 82%
PSGR 411 86% 106%
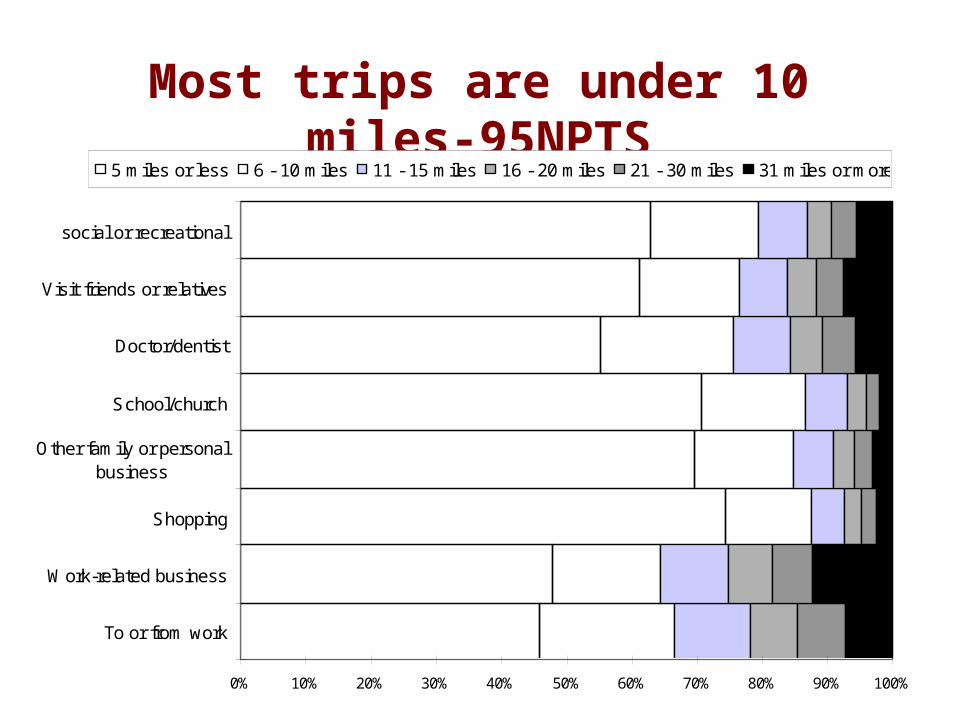
Most trips are under 10 miles-95NPTS
0% 10% 20% 30% 40% 50% 60% 70% 80% 90% 100%
To or from work
Work-related business
Shopping
Other family or personalbusiness
School/church
Doctor/dentist
Visit friends or relatives
social or recreational
5 miles or less 6 - 10 miles 11 - 15 miles 16 - 20 miles 21 - 30 miles 31 miles or more
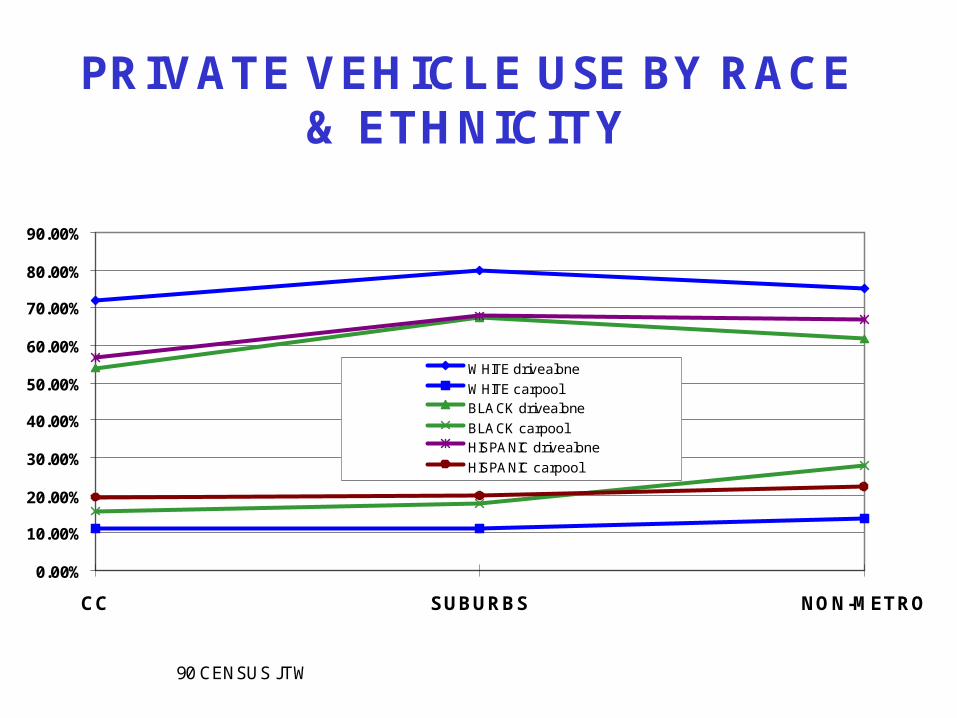
PRIVATE VEHICLE USE BY RACE& ETHNICITY
0.00%
10.00%
20.00%
30.00%
40.00%
50.00%
60.00%
70.00%
80.00%
90.00%
CC SUBURBS NON-METRO
WHITE drivealone
WHITE carpoolBLACK drivealone
BLACK carpoolHISPANIC drivealone
HISPANIC carpool
90 CENSUS JTW
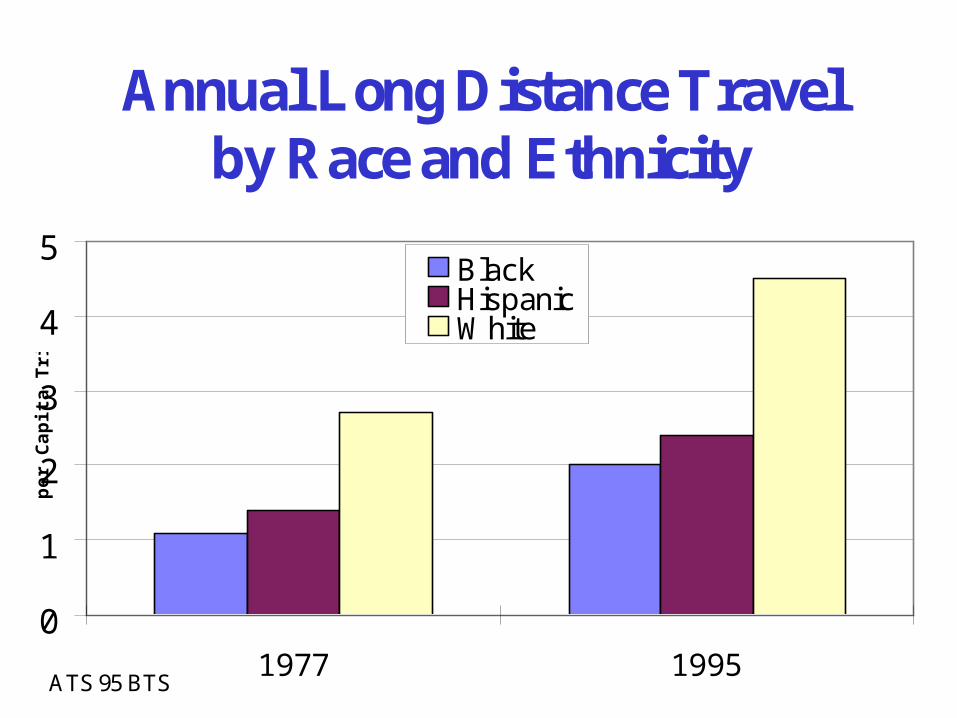
Annual Long Distance Travelby Race and Ethnicity
0
1
2
3
4
5
1977 1995
per
Cap
ita
Trip
s
BlackHispanicWhite
ATS 95 BTS
HELP STAMP OUT AFFLUENCE
We can do it if we work together!
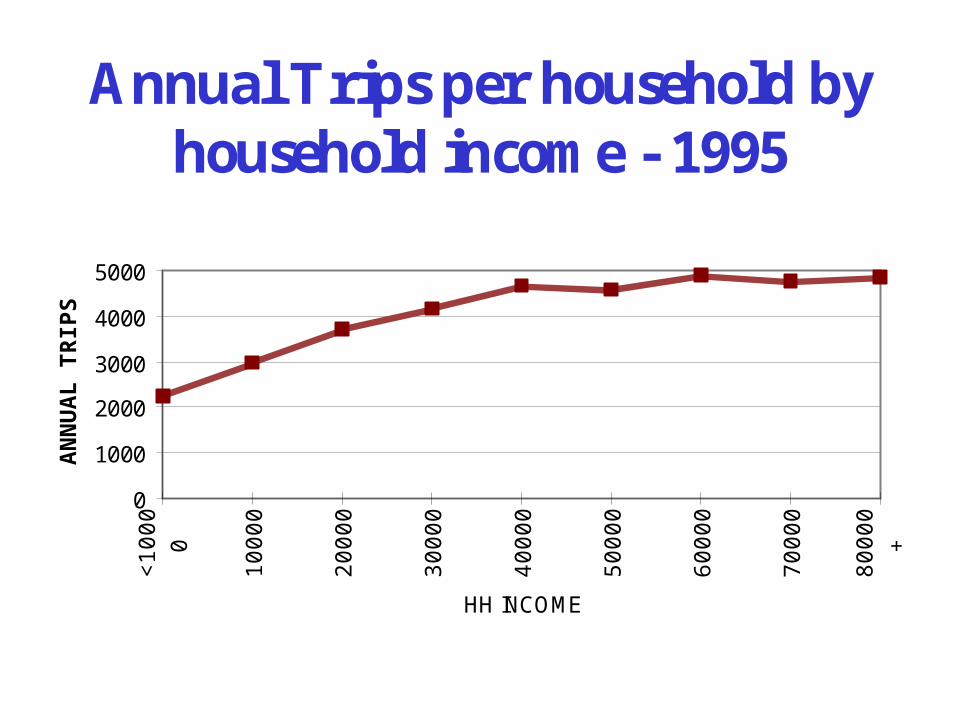
Annual Trips per household byhousehold income - 1995
0
1000
2000
3000
4000
5000
<1
00
0
0
10
00
0
20
00
0
30
00
0
40
00
0
50
00
0
60
00
0
70
00
0
80
00
0
+
HH INCOME
AN
NU
AL
TR
IPS
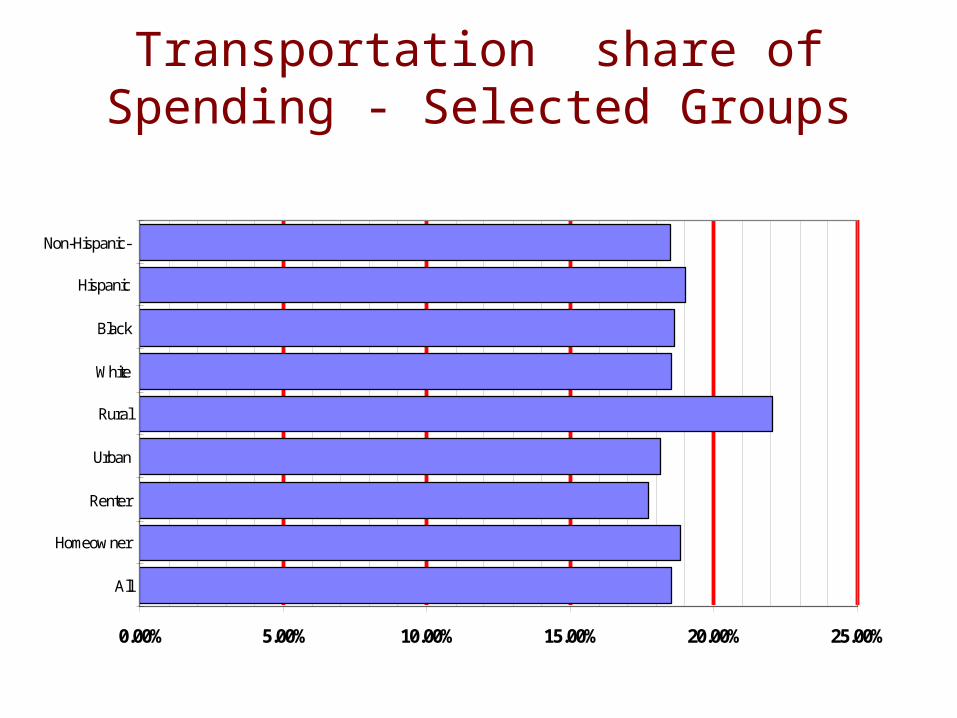
Transportation share of Spending - Selected Groups
0.00% 5.00% 10.00% 15.00% 20.00% 25.00%
All
Homeow ner
Renter
Urban
Rural
White
Black
Hispanic
Non-Hispanic-
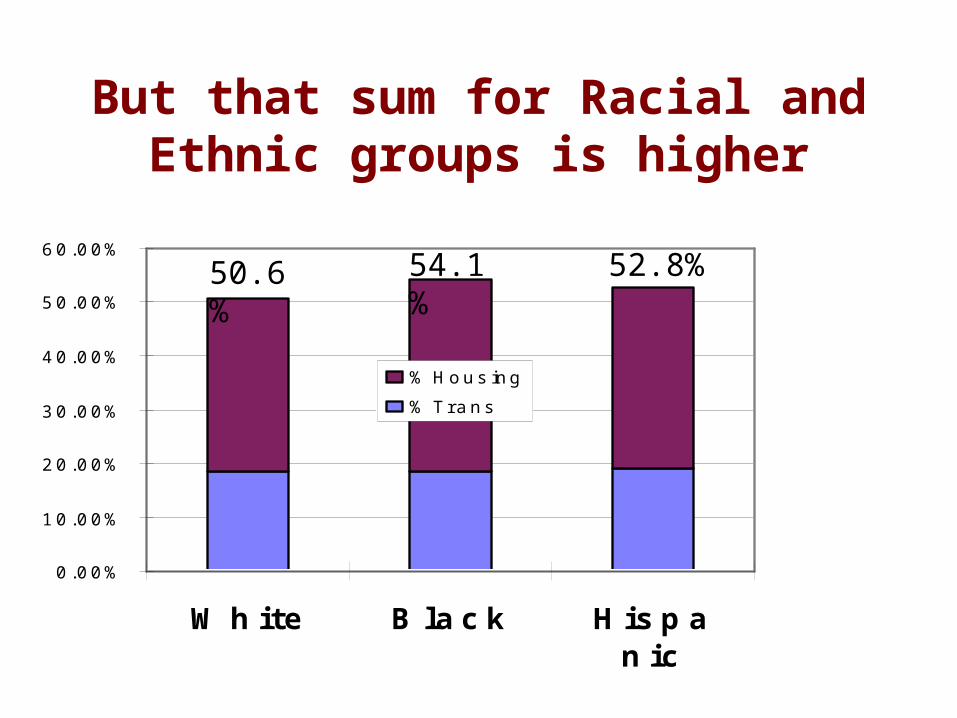
But that sum for Racial and Ethnic groups is higher
0.00%
10.00%
20.00%
30.00%
40.00%
50.00%
60.00%
White Black Hispanic
%Housing
%Trans
50.6% 54.1% 52.8%
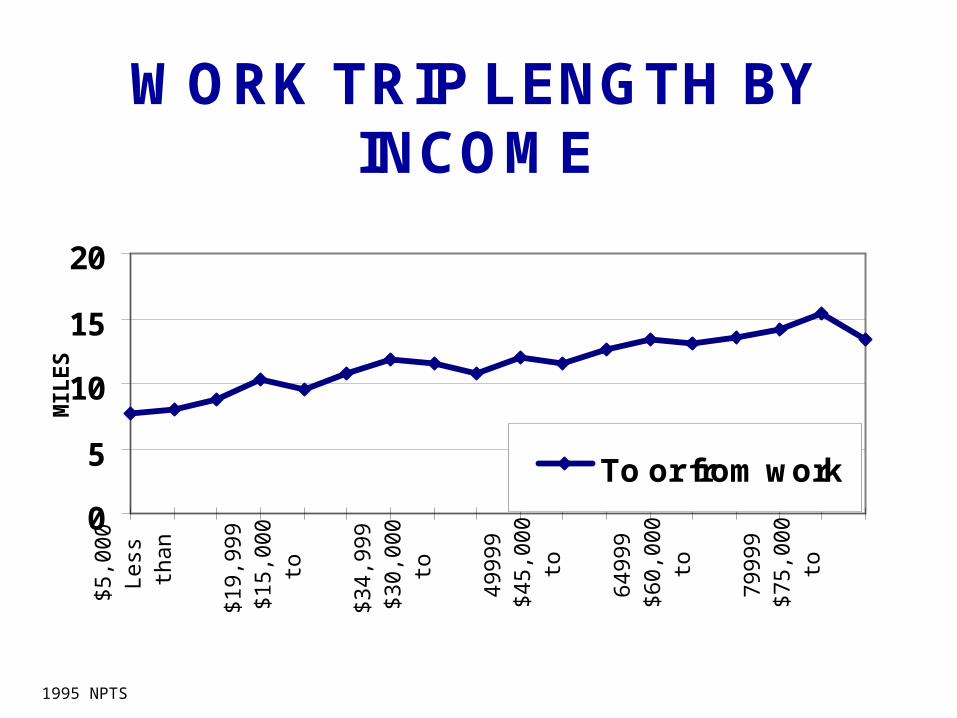
WORK TRIP LENGTH BYINCOME
0
5
10
15
20
$5,0
00
Less
than
$19,
999
$15,
000
to
$34,
999
$30,
000
to
4999
9$4
5,00
0to
6499
9$6
0,00
0to
7999
9$7
5,00
0to
MIL
ES
To or from work
1995 NPTS
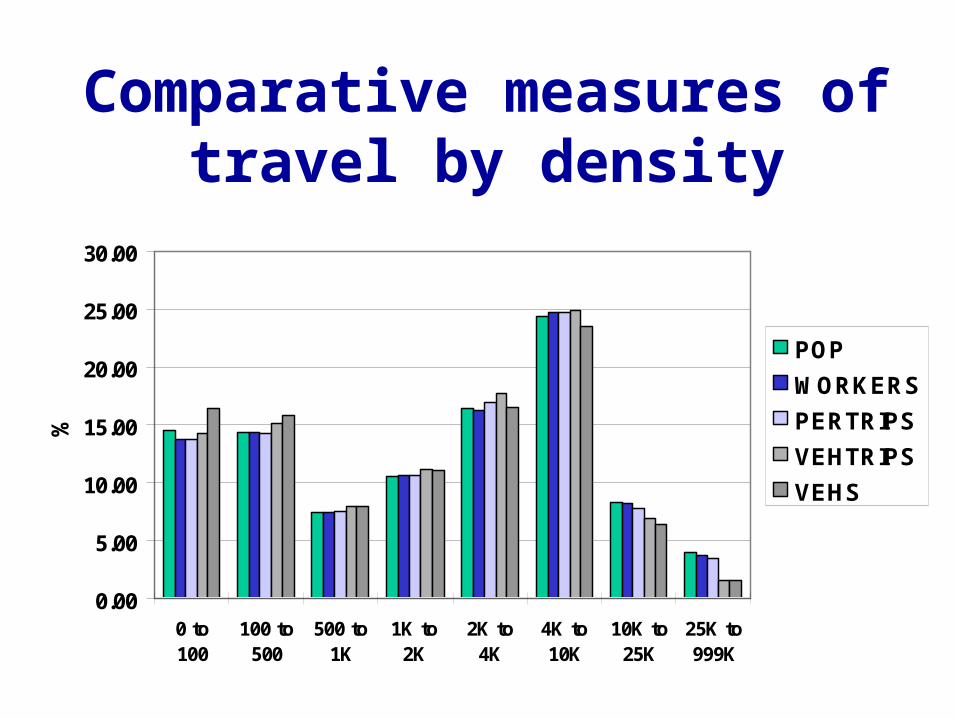
Comparative measures of travel by density
0.00
5.00
10.00
15.00
20.00
25.00
30.00
0 to100
100 to500
500 to1K
1K to2K
2K to4K
4K to10K
10K to25K
25K to999K
%
POP
WORKERS
PERTRIPS
VEHTRIPS
VEHS
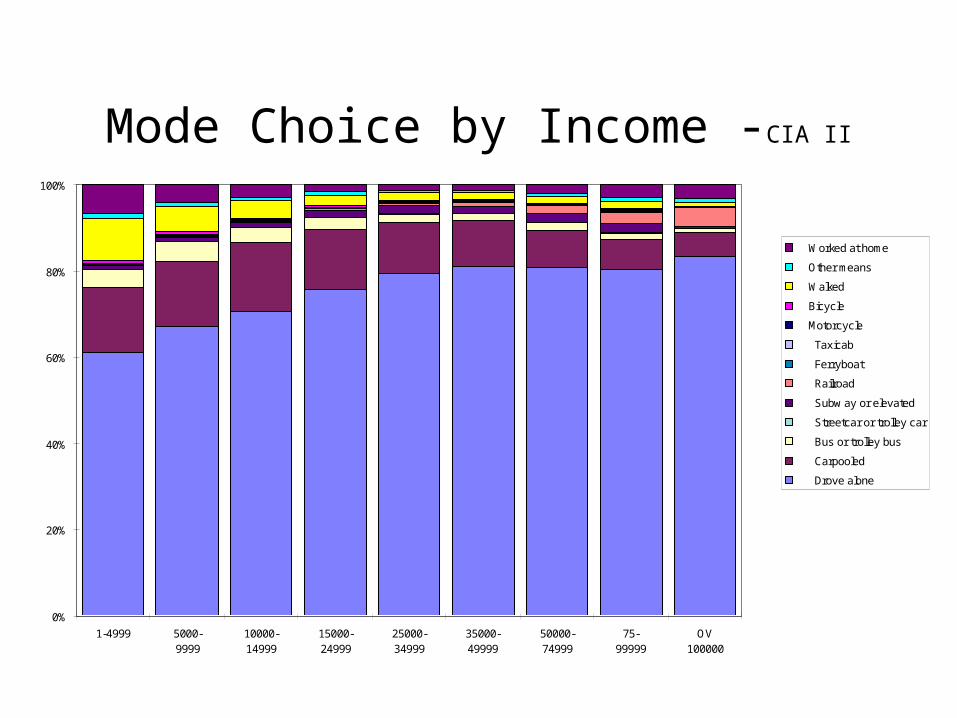
Mode Choice by Income -CIA II
0%
20%
40%
60%
80%
100%
1-4999 5000-9999
10000-14999
15000-24999
25000-34999
35000-49999
50000-74999
75-99999
OV100000
Worked at home
Other means
Walked
Bicycle
Motorcycle
Taxicab
Ferryboat
Railroad
Subw ay or elevated
Streetcar or trolley car
Bus or trolley bus
Carpooled
Drove alone
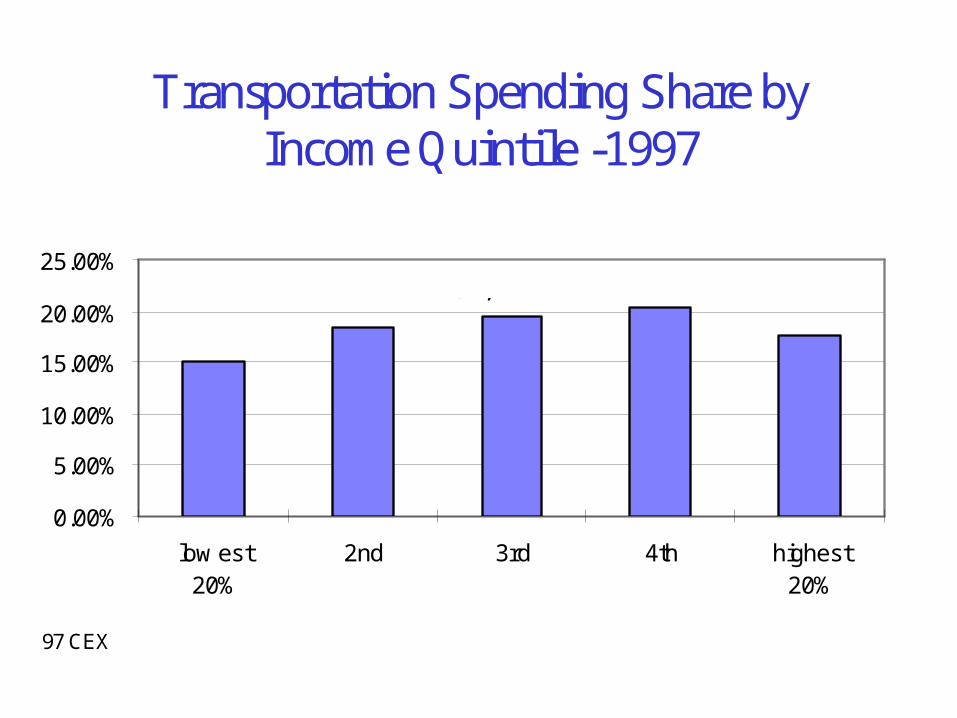
Transportation Spending Share byIncome Quintile -1997
0.00%
5.00%
10.00%
15.00%
20.00%
25.00%
low est20%
2nd 3rd 4th highest20%
$2,400
$4,300 $6,100 $8,700 $11,800
97 CEX
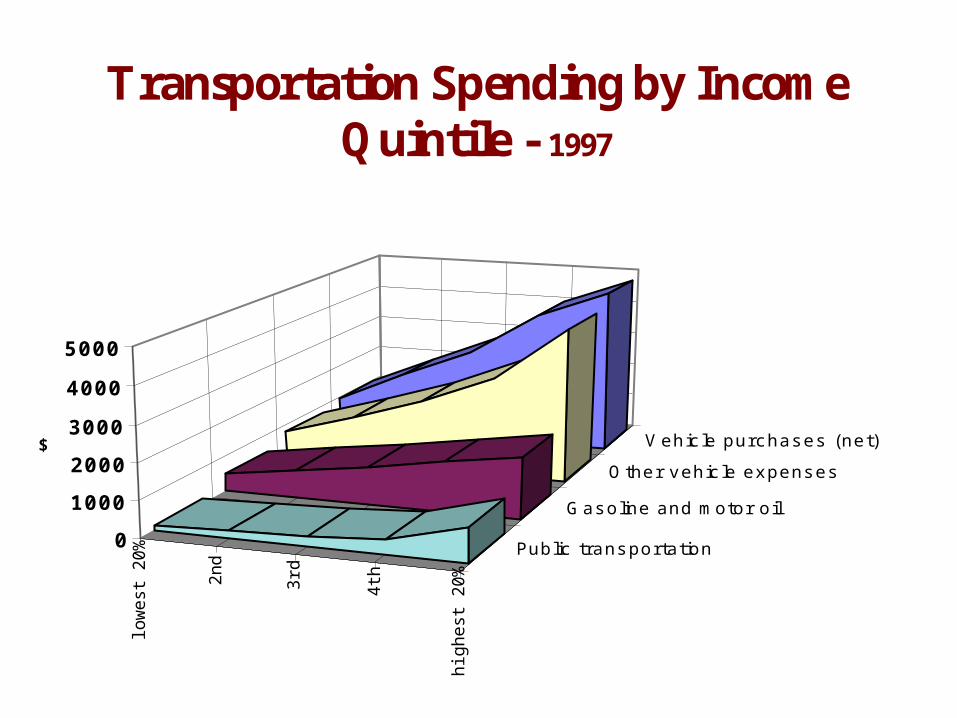
Transportation Spending by IncomeQuintile - 1997
low
est
20
%
2n
d
3rd
4th
hig
he
st 2
0%
Pub lic trans po r ta tion
G as o line and mo to r o il
O the r v eh ic le ex pens es
V eh ic le pu rc has es (ne t)
0
1000
2000
3000
4000
5000
$
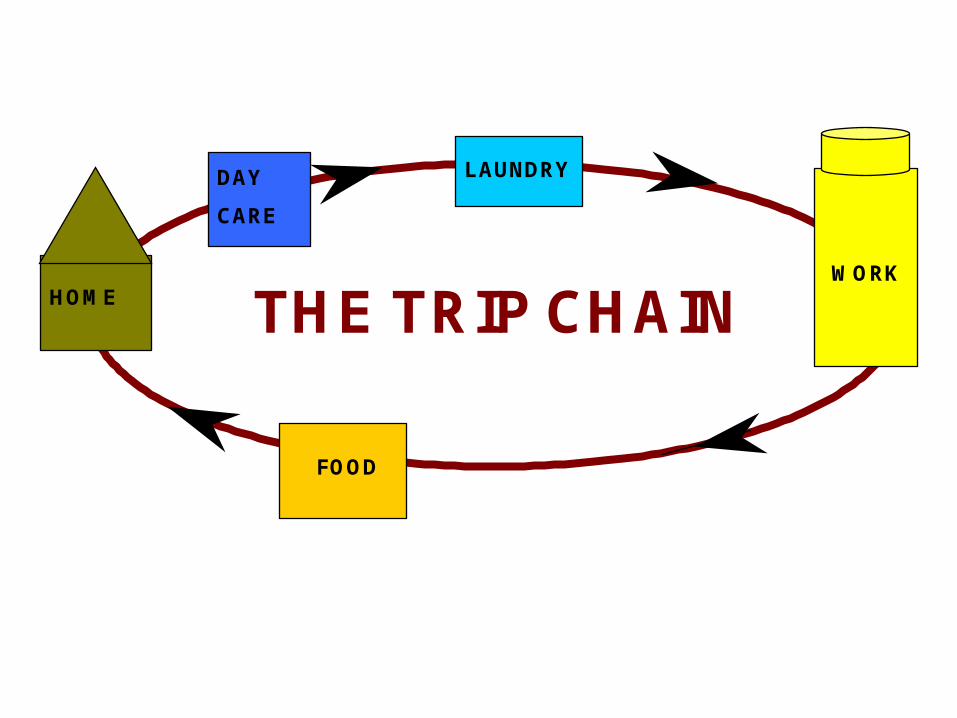
HOME
DAY
CARE
LAUNDRY
WORK
FOOD
THE TRIP CHAIN
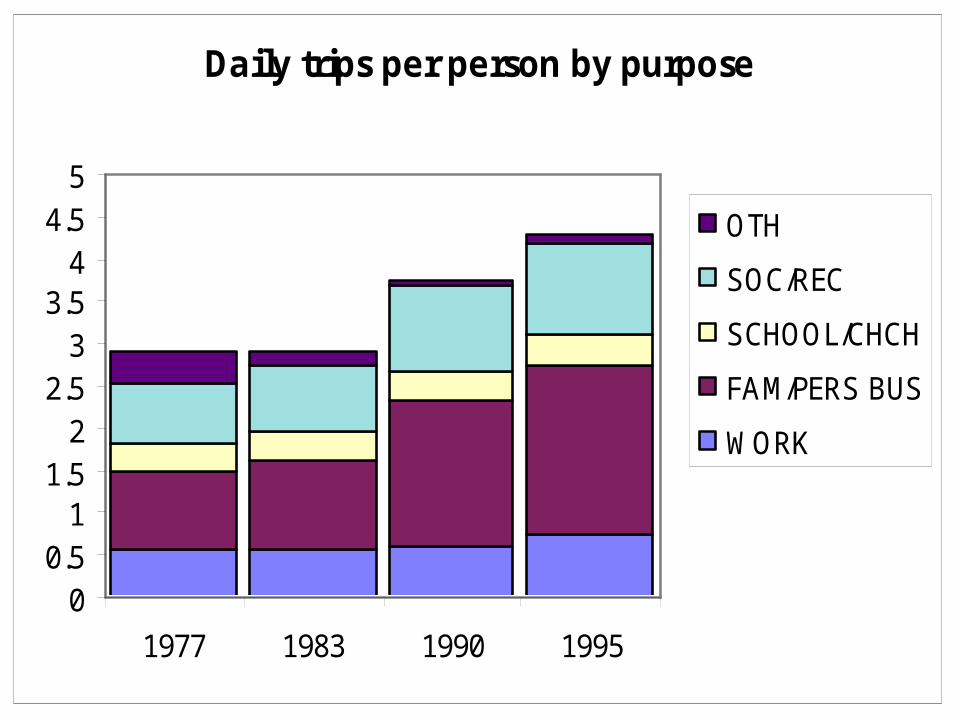
Daily trips per person by purpose
00.5
11.5
22.5
33.5
44.5
5
1977 1983 1990 1995
OTH
SOC/REC
SCHOOL/CHCH
FAM/PERS BUS
WORK
THE BASIS FOR DISCUSSION –THE FORMS OF TRANSPORT
• COMMUTING
• OTHER LOCAL TRAVEL
• TOURISM
• SERVICE VEHICLES
• PUBLIC VEHICLES
• URBAN GOODS MOVEMENT
• THRU PASSENGER TRAVEL
• THRU FREIGHT TRAVEL
TWO ASPECTS
• MOBILITY - An Attribute of People
• ACCESSIBILITY - An Attribute of Places
Measured in opportunities per minute
TRANSPORTATION HAS ALWAYS BEEN ABOUT DISTANCE
AND TIME
TODAY THE PRESSURES OF TIME DOMINATE
WE HAVE DESTROYED DISTANCE, ALMOST
- The Starting Point -
WHAT IS THE GOAL?
My goal for transportation is to reduce the effects of distance as an inhibiting force in our society’s ability to realize its economic and social aspirations.
WHY IS TIME DOMINANT NOW?WHY WILL TIME BE DOMINANT IN
THE FUTURE?
• A HIGH INCOME POPULATION
• A HIGH VALUE OF GOODS
• A MULTI-TASKING SOCIETY
• PRESSURES ON FAMILY
THE C&P AND MOBILITY
• MAX INVEST scenario = $94b yields• -3.2% saving in vehicle op. costs;• -0.9% saving in travel time costs;• -2.3% saving in crash costs.
• What is the impact on the economy of such a change?
• Total user costs declines by 1.8% in MAX. INVEST scenario – IS THAT ALL WE CAN DO?
At the Millennium
American society is highly dependent on mobility for all economic and social interactions. This is:– Negative in that it generates high
interdependence in the society;
– Positive because it generates most of the tremendous economic benefits of our society.
– This is the high wire act of modern societies
-POSITIVE WINS-
BUT NEW MAJOR FORCESOF CHANGE WILL BE
WITH US
DEMOCRATIZATION OF MOBILITY
IMMIGRATION
THAT OLD “VILLAIN” AFFLUENCE
THE FUTURE WILL BE MORESTABLE THAN THE PAST
LOW POPULATION GROWTH
LOW HOUSEHOLD GROWTH
LOW LABOR FORCE GROWTH
SATURATION OF DRIVER’S LICENSES
SATURATION OF CAR OWNERSHIP
LOW DOMESTIC MIGRATION TRENDS
The New Millennium World
• A STABLE “OLD” POP
• A GLOBAL ECONOMY
• “HIGH COST” TRANSPORT OK
• SKILLED WORKERS AT A PREMIUM
• WORKERS CAN LIVE, WORK ANYWHERE
• WHO, WHERE ARE THE IMMIGRANTS
• MAINSTREAMED MINORITIES
A CHALLENGED AFFLUENT SOCIETY
ISSUES OF MEASUREMENT
• OPPORTUNITIES PER MINUTE • SHARES OF POP WITH ACCESS TO NEEDS
BY MINUTES SPENT• TRAVEL TIME MONITORING• TRAVEL TIME DISTRIBUTIONS• EMBEDDED TRANS. COST IN PRODUCTS• MOBILITY/ACCESSIBILITY TRADE-OFFS• THE LINKAGE WITH DENSITY AND ITS
EFFECTS
WHAT THEN IS TRANSPORTATION’S PRODUCT?
• As A Nation We Invest Vast Sums, Both Private And Public, In Transportation Networks, Vehicles And Services.
• The “Product” Of That Investment Is “Mobility.”
• We Obviously Value That Product Highly, But Don’t Seem To Understand It Very Well.
A challenged affluent society
in which
Mobility
is central to meeting our social and economic
goals

The Dependents Dividend is gone
1975 1988 1998 2008 20180
20
40
60
80
100
120
140
Total dependent popu-lationUnder 1616 to 6465 and older
Dependence ratio to labor force