Embed Size (px)
Citation preview
Page 1/18
Biomonitoring of Bromine-Containing Trihalomethanes inthe Pregnant Women: Urinary Levels and Association withLifestyle FactorsBahare Dehdashti
Isfahan University of Medical SciencesAwat Feizi
Isfahan University of Medical SciencesMohammad Mehdi Amin ( [email protected] )
Isfahan University of Medical Sciences https://orcid.org/0000-0001-5758-7277Nasrin Bagheri
Isfahan University of Medical SciencesSeyede Shahrbanoo Daniali
Isfahan University of Medical SciencesRoya Kelishadi
Isfahan University of Medical Sciences
Research Article
Keywords: Br-THMs, DBCM, BDCM, TBM, Pregnancy, Biomonitoring, Urine
Posted Date: August 17th, 2021
DOI: https://doi.org/10.21203/rs.3.rs-773379/v1
License: This work is licensed under a Creative Commons Attribution 4.0 International License. Read FullLicense
Page 2/18
AbstractTrihalomethanes containing bromine (Br-THMs) are compounds formed from the reaction of organic and inorganicsubstances in drinking water with chlorine as a common disinfectant. Epidemiological evidence indicated variousoutcomes as a result of long-term exposure to these compounds.
This study aims to investigate the concentration of urinary Br-THMs in a sample of third-trimester pregnant womenand to determine its correlation with lifestyle factors.
This cross-sectional study was conducted among 118 pregnant women in Isfahan, Iran. The third-trimester urine Br-THMs including dibromochloromethane (DBCM), bromodichloromethane (BDCM), and broomcorn (TBM) weremeasured using solid-phase micro-extraction gas chromatography. The distribution of urinary Br-THMs concentrationwas positively skewed then these variables were subjected to logarithmic transformation. Spearman ranks correlationcoe�cient, and two independent samples t-test were used to assess the association of urinary Br-THMs concentrationwith its demographic and lifestyle determinants.
The �ndings showed that the mean (SD) concentrations of DBCM, BDCM, TBM and brominatede THMs were 14.76(27.17), 10.25 (11.37), 4.96 (3.21) and 30.17 (40.80) ng/L, respectively. In addition, signi�cant inverse correlation wasfound between the use of water storage tanks and Br-THMs (DBCM, BDCM, TBM and brominatede THMs, P-value =0.005, 0.019, >0.001 and 0.007 < 0.05, respectively).
In this study, among the quantitative and qualitative variables, the use of storage tanks had an inverse correlation withBr-THMs. In addition, the status of urinary concentration of Br-THMs in pregnant women was less than in the othercountries in the same area. Improving water quality and using modern methods to eliminate disinfection by-productsas well as improving lifestyle patterns are e�cient methods to reduce exposure to these contaminants.
1. IntroductionPublic health has been enhanced by disinfecting drinking water to prevent waterborne infections. Followed bydisinfection by-products (DBPs) are created from the natural reaction of chlorine as the most popular disinfectant ofdrinking water with organic and inorganic substances in water. So that chlorination processes have produced morethan 700 types of DBPs up to now (Deng et al., 2019).
Among these, 4 groups of trihalomethanes (THMs), haloacetic acids (HAAs), haloketones (HKs), andhalonitromethanes (HNMs) are the main by-products of disinfection(Mosaferi et al., 2020). In drinking water, THMsand HAAs form 66 and 27% of DBPs, respectively. Chloroform (CHCl3: TCM), bromoform (CHBr3: TBM),bromodichloromethane (CHCl2Br: BDCM), and chlorodibromomethane (CHClBr2: DBCM) are chemicals produced fromchlorination of water, refer to THMs. The amount of total THMs (TTHMs), is the sum of TCM, TBM, BDCM, and DBCMthat varies between tens to hundreds µg/L (Batterman et al., 2002). Brominated trihalomethanes are the sum of TBM,BDCM, and DBCM (Chen et al., 2019). Experiments have shown that brominated-DBPs have more carcinogenic effectsthan chlorinated (Liu, 2014).
Water ingestion or other activities such as swimming, showering, and bathing are the routes of exposure to THMs,through ingestion and non-ingestion, respectively (Andra et al., 2015). Also, adult women can be exposed to non-ingestion THMs by cleaning the house, such as washing dishes, cleaning surfaces, and toilets (Andra et al., 2015).Around 60 days accumulation of 100 mg/kg/day TCM, TBM, and BDCM and 400 mg/kg/day for TTHMs in maturerats caused neurotoxicity (Chen et al., 2019). Moreover, reproductive disorders in rodents have also been found based
Page 3/18
on exposure to high levels of DBPs according to toxicological evidence. For example, respiratory and oral exposure toTHMs has resulted in low birth weight infants in rodents (Deng et al., 2019). Also, the carcinogenic and mutageniceffects of Br-THMs have been reported in rodents (Stayner et al., 2014).
Followed by cancer and reproductive implications in humans, including length of pregnancy, sperm quality, menstrualcycle, and pregnancy outcomes such as fetal growth, fetal loss, preterm delivery, and congenital anomaly, onepidemiological evidence, are the consequences of long-term exposure to THMs (Villanueva et al., 2011). How to usewater in bathing, showering, and swimming, also water consumption pattern displays the degree of external exposureto THMs through tap water. Internal exposure to THMs can be assessed by measuring blood and urine biomarkers(Charisiadis et al., 2014). Different routes of exposure to THMs biomarkers are evaluated by measuring it in the urineand using lifestyle questionnaires. The remaining THMs in the kidneys and greater than in the liver are metabolizedthrough the interaction of cytochrome (CY) P450 and the enzymatic system in two phases. The production of reactiveoxygen types in the liver and kidneys by CYP2E1, followed by combination with glutathione in phase II, determines thebiological activation of THMs (Gängler et al., 2018).
Researchers have evaluated the concentration of THMs in tap water in different cities of the world and Iran(Mohammadi et al., 2016). Mohammadi et al. in 2016 measured the concentration of THMs in the drinking waterdistribution network in the 30 points of this study area that the mean (SD) of THMs was 37.98 (2.56) µg/L(Mohammadi et al., 2016, Mosaferi et al., 2020). The use of urinary biomarkers to assess exposure increases thereliability of risk assessment studies by reducing exposure classi�cation errors (Mosaferi et al., 2020).
Therefore, according to the available evidence based on the presence of these contaminants in the drinking waterdistribution system, this study aimed to investigate the concentration of urinary Br-THMs among third-trimesterpregnant women in Isfahan as a sensitive and vulnerable group and their correlation with lifestyles such as how toconsume drinking water and washing and bathing activities.
2. Materials And Methods
2.1. Study populationThis cross-sectional study was conducted to measure the concentration of urinary Br-THMs. The target groupconsisted of 118 pregnant women in the third trimester, who participated in the PERSIAN Birth Cohort and lived indifferent parts of Isfahan city, Iran (Ref: DOI: https://doi.org/10.1332/175795920X16062247639874).
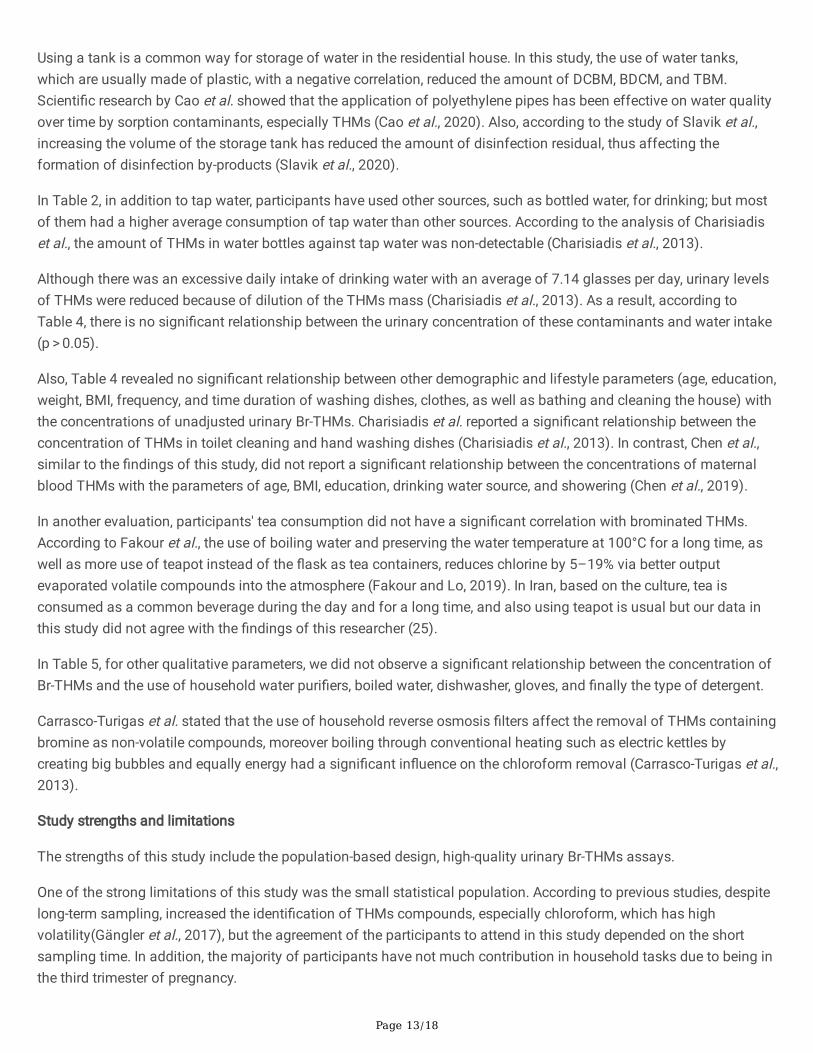
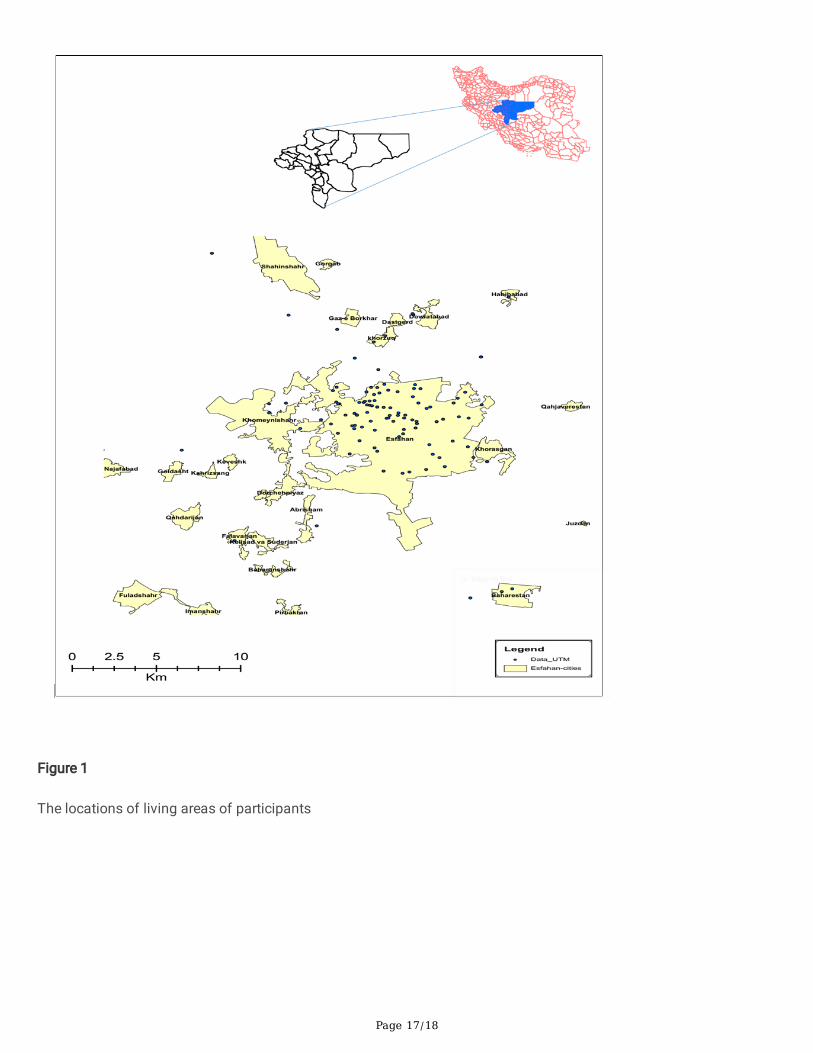
The locations of living areas of participants are given in Fig. 1. The informed consent form was provided toparticipants regarding the type of study, purpose, and method of urine sampling. Also, all stages of this study wereperformed after the approval of the ethics committee of Isfahan University of Medical Sciences. Inclusion criteria inthis study for participants include living in Isfahan for at least one year or more, the third trimester of pregnancy, andno history of chronic diseases. Subsequently, smoking and alcohol consumption were considered exclusion criteria.
2.2. QuestionnaireTo determine the correlation between the concentration of urinary Br-THMs with lifestyle factors and demographiccharacteristics such as age, education, and BMI the prepared questionnaires in the birth cohort were used that itsvalidity and reliability had been con�rmed.
In addition, all the questions of the questionnaire were asked under face-to-face interviews by the trained questioner.Personal information of pregnant women including age and occupation and their physical characteristics such as
Page 4/18
height, the third-trimester weight of each month, and body mass index regularly during prenatal care according toappointments scheduled was requested by a trained health expert and was measured using calibrated instrumentsand recorded electronically. BMI is equivalent to weight divided by height squared. (Kang et al., 2016). Education levelwas also classi�ed into 5 groups: primary school, junior school, high school, and academic. In addition, studyparticipants were selected from different areas of Isfahan. Moreover, information on how to use drinking water daily orweekly or related activities were collected in the form of questions such as drinking water source, amount of waterused per day, consumption of boiled water, use of refrigerator, frequency and duration of washing dishes, clothes andbaths.
2.3. Urine Sampling and AnalysisIn this study, morning spot urine samples of 118 pregnant women in the third trimester were randomly collected in thereferral hospitals of Isfahan University of Medical Sciences, Isfahan, Iran. Urine sampling was performed by sterilepolypropylene containers by the individual and �nally, the samples were transferred to the laboratory of the Healthschool under cold conditions and kept at -20°C until use.
2.3.1. Extraction methodThe solid-phase microextraction method was used to extract species from urine tissue. The used �ber was PDMS-CARwith a thickness of 75 µm. 0.5 mL of the urine sample was poured into a 12 mL glass container with a septum lid. 1.2g of sodium chloride with a magnet was added to the container and the lid was closed and equilibrated at roomtemperature at 1250 rpm. After 5 min of equilibrium time, the �ber was exposed through the septum to the upperspace of the sample and the extraction was performed for 15 min. Decoding was performed at 240°C for 45 sec insidea gas chromatographic injection chamber.
2.3.2. Chromatographic method and device conditionsGas chromatography-mass spectrometer was used to isolate and measure the species. The gas chromatograph usedwas the FISONS-8000 (8060) and the mass spectrometer used was the Hewlett Packard-5972. Supelco column (SLB-5MS) with a length of 30 m and a static phase thickness of 0.25 µm and a diameter of 0.25 mm was used forseparation. Oven temperature programming: 45°C for 5 min – increase the temperature to 100 ° C with a slope of 20 °per minute and stay at 100°C for 1 min. Limit of detection (LOD) for DCBM, CDBM, and TBM was calculated 5, 6, and3 ng/L, respectively. The terms of the mass spectrometer can be seen in Table 1.
Table 1The terms of the mass spectrometer used in this study.
Compound Ions Time (min)
BDCM 83 and 85 ( 200 milliseconds in total) 1.5
CDBM 127 and 129 ( 220 milliseconds in total) 0.4
TBM 171 and 173 ( 240 milliseconds in total) 0.6
2.4. Statistical analysisIn this study, the obtained data were analyzed using SPSS software (SPSS Inc. Released 2007. SPSS for Windows,Version 16.0 Chicago, SPSS Inc.). Quantitative continuous data were reported as mean (SD) or geometric mean and
Page 5/18
minimum and maximum. Qualitative variables were also reported as frequency and percentage. The normality ofurinary Br-THMs concentration was evaluated using the Kolmogorov-Smirnov test and Q-Q plot. The distribution ofurinary Br-THMs concentration was positively skewed. Then these variables were subjected to logarithmictransformation. Person or Spearman ranks correlation coe�cients were used to assess the association of urinary Br-THMs concentration with demographic and lifestyle-related variables of study participants. Two independent samplest-test was used for comparing urinary Br-THMs concentration between categories of qualitative lifestyle-relatedvariables.
3. Results
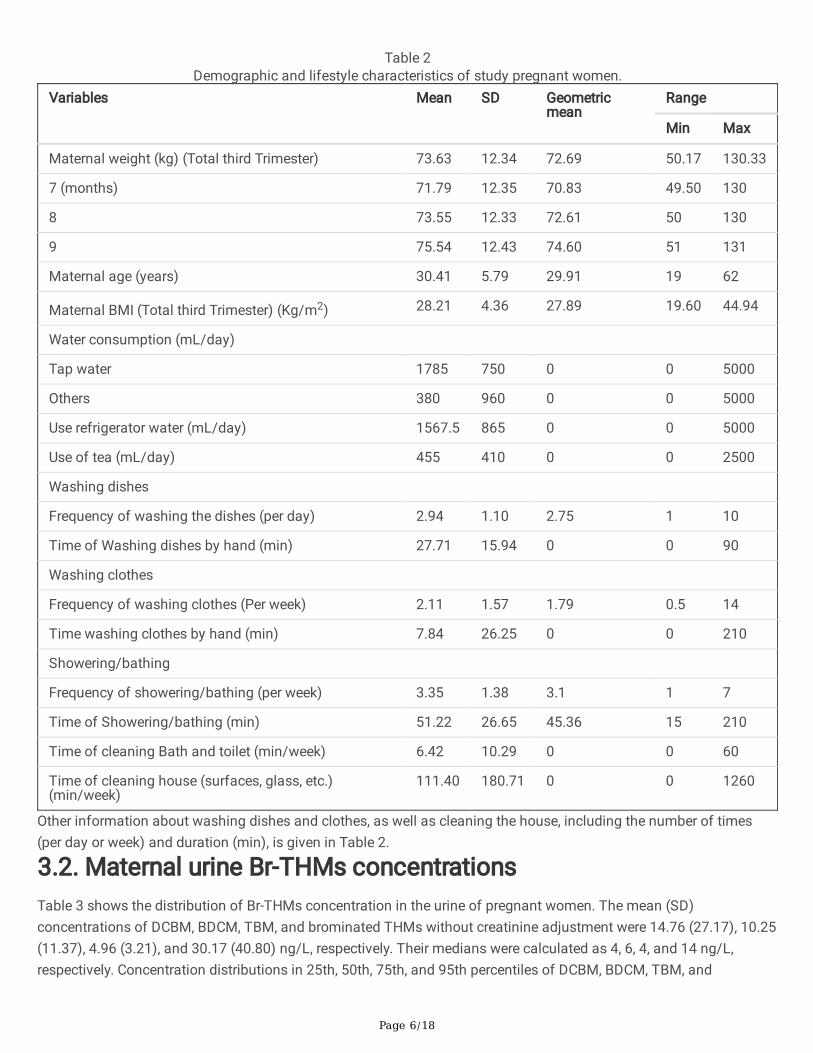
3.1. Characteristics of the study populationThe demographic and lifestyle characteristics of 118 pregnant women in the present study are shown in Table 2.Mean (SD) of maternal age, BMI, and weight in the third trimester of pregnancy was 30.41 (5.79) years old, 28.21(4.36) Kg/m2, and 73.63 (12.34) Kg, respectively. Regarding water use and related activities, the mean consumption oftaping water and other sources were 1785 (750) and 380 (960) mL/day, respectively. Pregnant mothers in this studyused refrigerator water with an average of 1567.5 (865) mL/day. Also, their tea consumption was expressed with amean of 455 (410) mL/day.
Page 6/18
Table 2Demographic and lifestyle characteristics of study pregnant women.
Variables Mean SD Geometricmean
Range
Min Max
Maternal weight (kg) (Total third Trimester) 73.63 12.34 72.69 50.17 130.33
7 (months) 71.79 12.35 70.83 49.50 130
8 73.55 12.33 72.61 50 130
9 75.54 12.43 74.60 51 131
Maternal age (years) 30.41 5.79 29.91 19 62
Maternal BMI (Total third Trimester) (Kg/m2) 28.21 4.36 27.89 19.60 44.94
Water consumption (mL/day)
Tap water 1785 750 0 0 5000
Others 380 960 0 0 5000
Use refrigerator water (mL/day) 1567.5 865 0 0 5000
Use of tea (mL/day) 455 410 0 0 2500
Washing dishes
Frequency of washing the dishes (per day) 2.94 1.10 2.75 1 10
Time of Washing dishes by hand (min) 27.71 15.94 0 0 90
Washing clothes
Frequency of washing clothes (Per week) 2.11 1.57 1.79 0.5 14
Time washing clothes by hand (min) 7.84 26.25 0 0 210
Showering/bathing
Frequency of showering/bathing (per week) 3.35 1.38 3.1 1 7
Time of Showering/bathing (min) 51.22 26.65 45.36 15 210
Time of cleaning Bath and toilet (min/week) 6.42 10.29 0 0 60
Time of cleaning house (surfaces, glass, etc.)(min/week)
111.40 180.71 0 0 1260
Other information about washing dishes and clothes, as well as cleaning the house, including the number of times(per day or week) and duration (min), is given in Table 2.
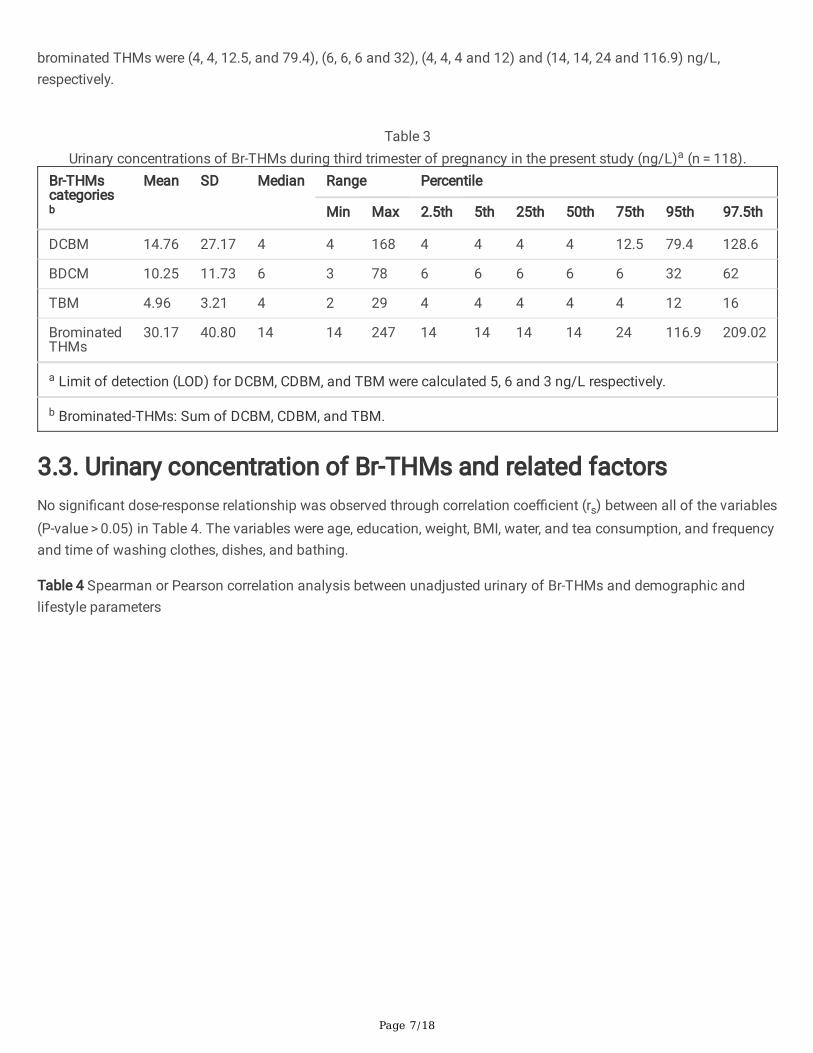
3.2. Maternal urine Br-THMs concentrationsTable 3 shows the distribution of Br-THMs concentration in the urine of pregnant women. The mean (SD)concentrations of DCBM, BDCM, TBM, and brominated THMs without creatinine adjustment were 14.76 (27.17), 10.25(11.37), 4.96 (3.21), and 30.17 (40.80) ng/L, respectively. Their medians were calculated as 4, 6, 4, and 14 ng/L,respectively. Concentration distributions in 25th, 50th, 75th, and 95th percentiles of DCBM, BDCM, TBM, and
Page 7/18
brominated THMs were (4, 4, 12.5, and 79.4), (6, 6, 6 and 32), (4, 4, 4 and 12) and (14, 14, 24 and 116.9) ng/L,respectively.
Table 3
Urinary concentrations of Br-THMs during third trimester of pregnancy in the present study (ng/L)a (n = 118).Br-THMscategoriesb
Mean SD Median Range Percentile
Min Max 2.5th 5th 25th 50th 75th 95th 97.5th
DCBM 14.76 27.17 4 4 168 4 4 4 4 12.5 79.4 128.6
BDCM 10.25 11.73 6 3 78 6 6 6 6 6 32 62
TBM 4.96 3.21 4 2 29 4 4 4 4 4 12 16
BrominatedTHMs
30.17 40.80 14 14 247 14 14 14 14 24 116.9 209.02
a Limit of detection (LOD) for DCBM, CDBM, and TBM were calculated 5, 6 and 3 ng/L respectively.
b Brominated-THMs: Sum of DCBM, CDBM, and TBM.
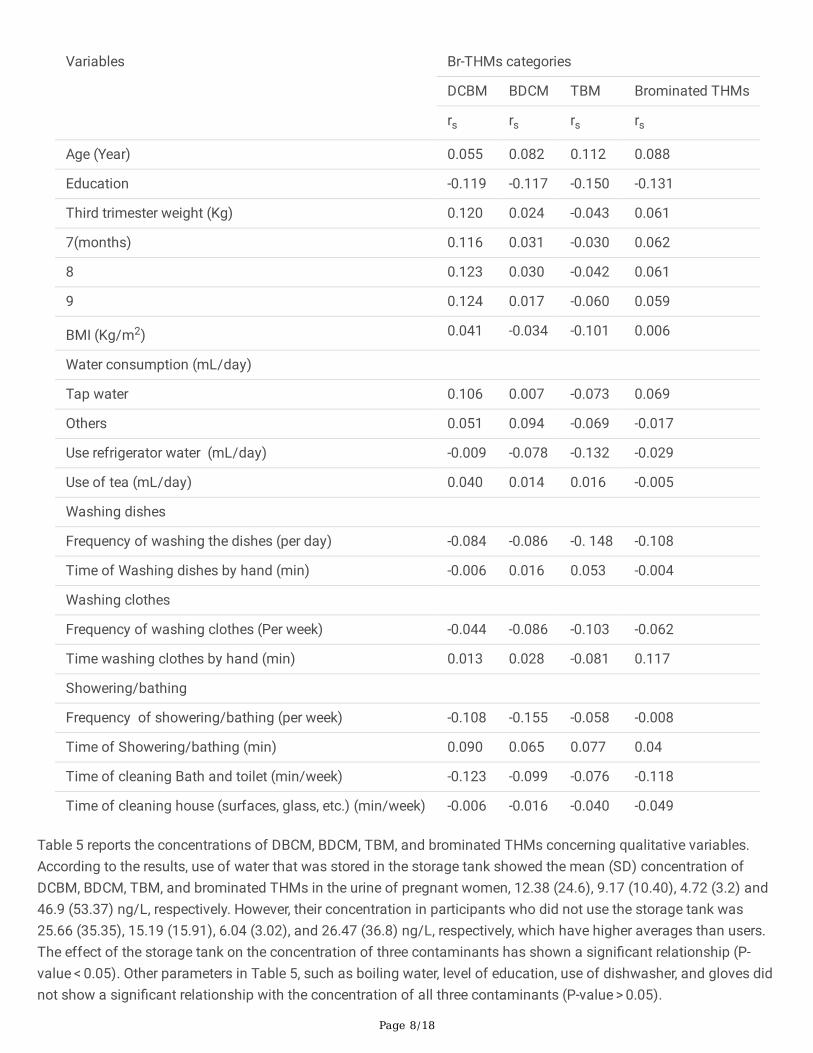
3.3. Urinary concentration of Br-THMs and related factorsNo signi�cant dose-response relationship was observed through correlation coe�cient (rs) between all of the variables(P-value > 0.05) in Table 4. The variables were age, education, weight, BMI, water, and tea consumption, and frequencyand time of washing clothes, dishes, and bathing.
Table 4 Spearman or Pearson correlation analysis between unadjusted urinary of Br-THMs and demographic andlifestyle parameters
Page 8/18
Variables Br-THMs categories
DCBM BDCM TBM Brominated THMs
rs rs rs rs
Age (Year) 0.055 0.082 0.112 0.088
Education -0.119 -0.117 -0.150 -0.131
Third trimester weight (Kg) 0.120 0.024 -0.043 0.061
7(months) 0.116 0.031 -0.030 0.062
8 0.123 0.030 -0.042 0.061
9 0.124 0.017 -0.060 0.059
BMI (Kg/m2) 0.041 -0.034 -0.101 0.006
Water consumption (mL/day)
Tap water 0.106 0.007 -0.073 0.069
Others 0.051 0.094 -0.069 -0.017
Use refrigerator water (mL/day) -0.009 -0.078 -0.132 -0.029
Use of tea (mL/day) 0.040 0.014 0.016 -0.005
Washing dishes
Frequency of washing the dishes (per day) -0.084 -0.086 -0. 148 -0.108
Time of Washing dishes by hand (min) -0.006 0.016 0.053 -0.004
Washing clothes
Frequency of washing clothes (Per week) -0.044 -0.086 -0.103 -0.062
Time washing clothes by hand (min) 0.013 0.028 -0.081 0.117
Showering/bathing
Frequency of showering/bathing (per week) -0.108 -0.155 -0.058 -0.008
Time of Showering/bathing (min) 0.090 0.065 0.077 0.04
Time of cleaning Bath and toilet (min/week) -0.123 -0.099 -0.076 -0.118
Time of cleaning house (surfaces, glass, etc.) (min/week) -0.006 -0.016 -0.040 -0.049
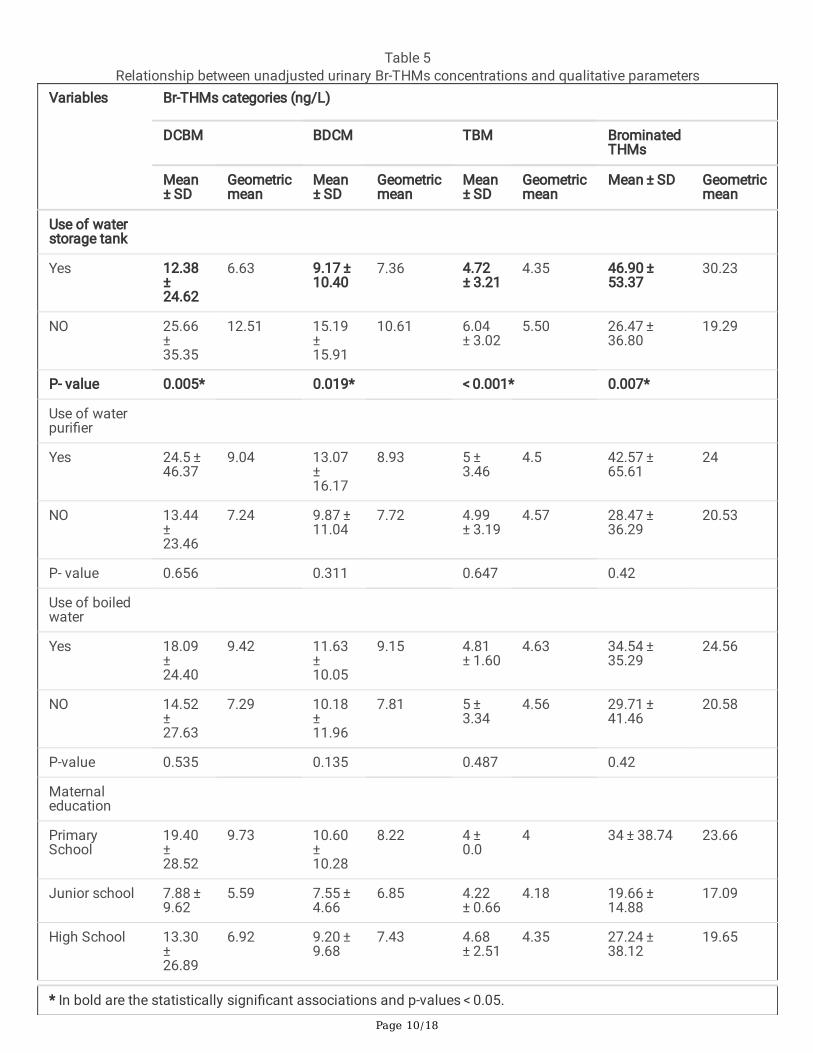
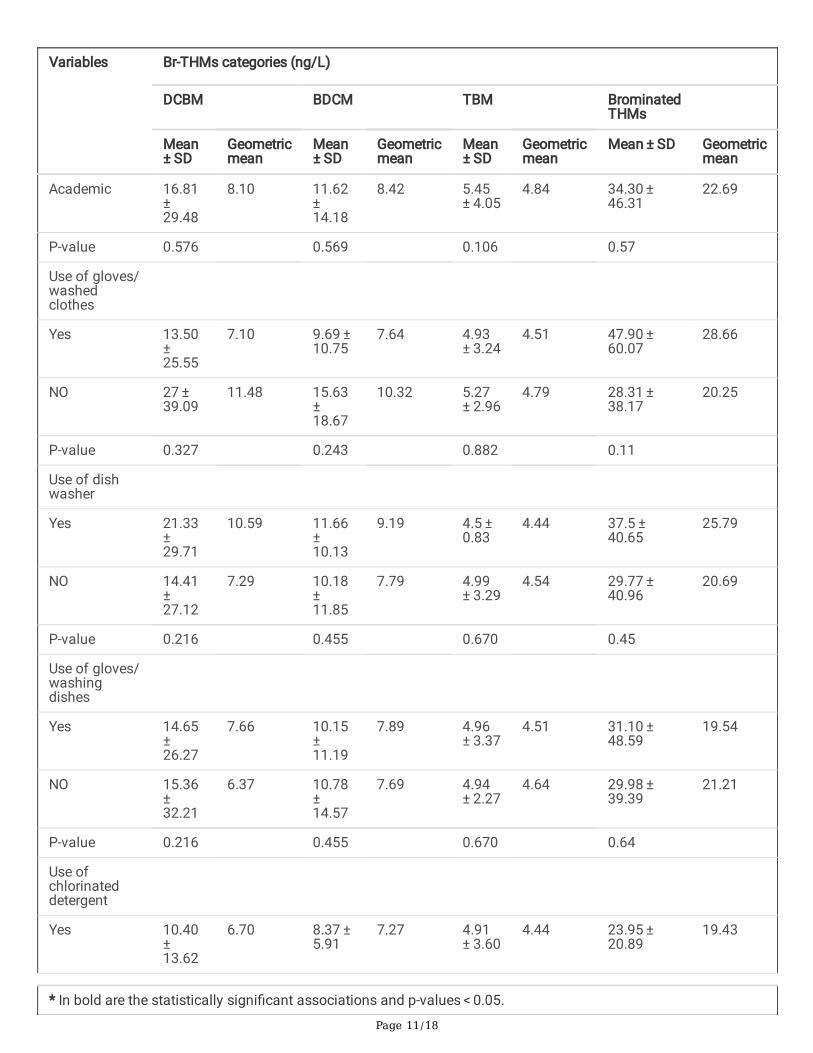
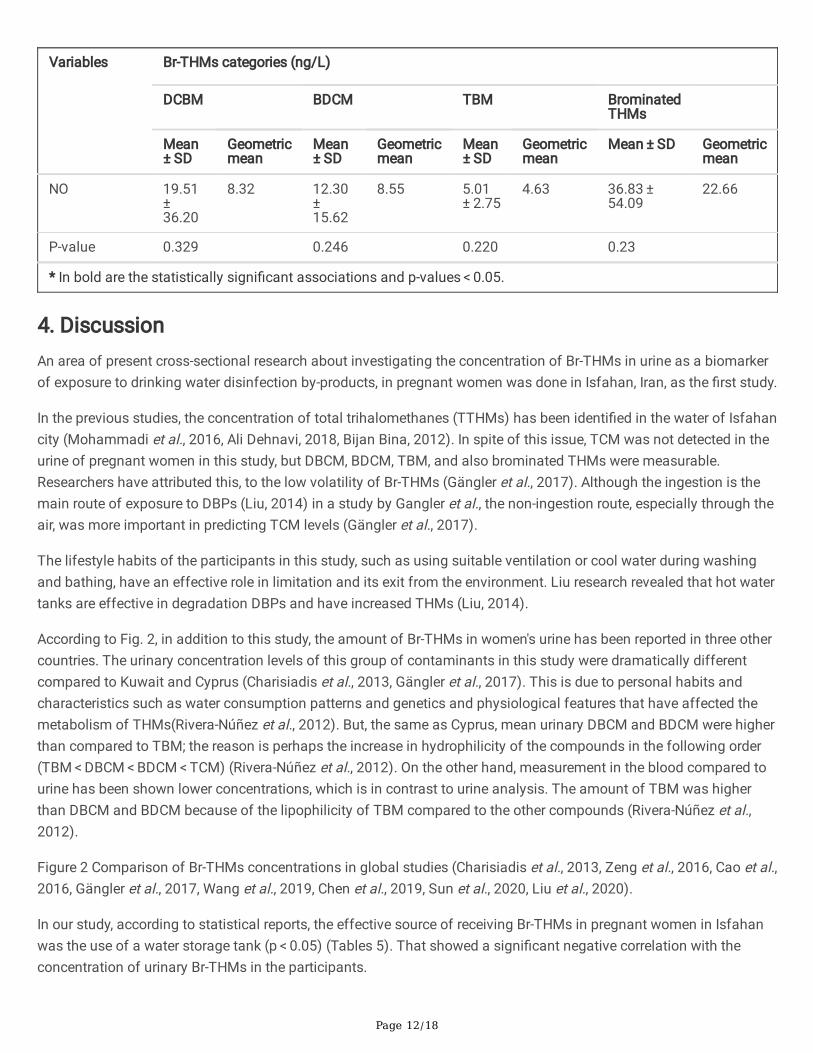
Table 5 reports the concentrations of DBCM, BDCM, TBM, and brominated THMs concerning qualitative variables.According to the results, use of water that was stored in the storage tank showed the mean (SD) concentration ofDCBM, BDCM, TBM, and brominated THMs in the urine of pregnant women, 12.38 (24.6), 9.17 (10.40), 4.72 (3.2) and46.9 (53.37) ng/L, respectively. However, their concentration in participants who did not use the storage tank was25.66 (35.35), 15.19 (15.91), 6.04 (3.02), and 26.47 (36.8) ng/L, respectively, which have higher averages than users.The effect of the storage tank on the concentration of three contaminants has shown a signi�cant relationship (P-value < 0.05). Other parameters in Table 5, such as boiling water, level of education, use of dishwasher, and gloves didnot show a signi�cant relationship with the concentration of all three contaminants (P-value > 0.05).

Page 9/18
Page 10/18
Table 5Relationship between unadjusted urinary Br-THMs concentrations and qualitative parameters
Variables Br-THMs categories (ng/L)
DCBM BDCM TBM BrominatedTHMs
Mean ± SD
Geometricmean
Mean ± SD
Geometricmean
Mean ± SD
Geometricmean
Mean ± SD Geometricmean
Use of waterstorage tank
Yes 12.38 ± 24.62
6.63 9.17 ± 10.40
7.36 4.72 ± 3.21
4.35 46.90 ± 53.37
30.23
NO 25.66 ± 35.35
12.51 15.19 ± 15.91
10.61 6.04 ± 3.02
5.50 26.47 ± 36.80
19.29
P- value 0.005* 0.019* < 0.001* 0.007*
Use of waterpuri�er
Yes 24.5 ± 46.37
9.04 13.07 ± 16.17
8.93 5 ± 3.46
4.5 42.57 ± 65.61
24
NO 13.44 ± 23.46
7.24 9.87 ± 11.04
7.72 4.99 ± 3.19
4.57 28.47 ± 36.29
20.53
P- value 0.656 0.311 0.647 0.42
Use of boiledwater
Yes 18.09 ± 24.40
9.42 11.63 ± 10.05
9.15 4.81 ± 1.60
4.63 34.54 ± 35.29
24.56
NO 14.52 ± 27.63
7.29 10.18 ± 11.96
7.81 5 ± 3.34
4.56 29.71 ± 41.46
20.58
P-value 0.535 0.135 0.487 0.42
Maternaleducation
PrimarySchool
19.40 ± 28.52
9.73 10.60 ± 10.28
8.22 4 ± 0.0
4 34 ± 38.74 23.66
Junior school 7.88 ± 9.62
5.59 7.55 ± 4.66
6.85 4.22 ± 0.66
4.18 19.66 ± 14.88
17.09
High School 13.30 ± 26.89
6.92 9.20 ± 9.68
7.43 4.68 ± 2.51
4.35 27.24 ± 38.12
19.65
* In bold are the statistically signi�cant associations and p-values < 0.05.
Page 11/18
Variables Br-THMs categories (ng/L)
DCBM BDCM TBM BrominatedTHMs
Mean ± SD
Geometricmean
Mean ± SD
Geometricmean
Mean ± SD
Geometricmean
Mean ± SD Geometricmean
Academic 16.81 ± 29.48
8.10 11.62 ± 14.18
8.42 5.45 ± 4.05
4.84 34.30 ± 46.31
22.69
P-value 0.576 0.569 0.106 0.57
Use of gloves/washedclothes
Yes 13.50 ± 25.55
7.10 9.69 ± 10.75
7.64 4.93 ± 3.24
4.51 47.90 ± 60.07
28.66
NO 27 ± 39.09
11.48 15.63 ± 18.67
10.32 5.27 ± 2.96
4.79 28.31 ± 38.17
20.25
P-value 0.327 0.243 0.882 0.11
Use of dishwasher
Yes 21.33 ± 29.71
10.59 11.66 ± 10.13
9.19 4.5 ± 0.83
4.44 37.5 ± 40.65
25.79
NO 14.41 ± 27.12
7.29 10.18 ± 11.85
7.79 4.99 ± 3.29
4.54 29.77 ± 40.96
20.69
P-value 0.216 0.455 0.670 0.45
Use of gloves/washingdishes
Yes 14.65 ± 26.27
7.66 10.15 ± 11.19
7.89 4.96 ± 3.37
4.51 31.10 ± 48.59
19.54
NO 15.36 ± 32.21
6.37 10.78 ± 14.57
7.69 4.94 ± 2.27
4.64 29.98 ± 39.39
21.21
P-value 0.216 0.455 0.670 0.64
Use ofchlorinateddetergent
Yes 10.40 ± 13.62
6.70 8.37 ± 5.91
7.27 4.91 ± 3.60
4.44 23.95 ± 20.89
19.43
* In bold are the statistically signi�cant associations and p-values < 0.05.
Page 12/18
Variables Br-THMs categories (ng/L)
DCBM BDCM TBM BrominatedTHMs
Mean ± SD
Geometricmean
Mean ± SD
Geometricmean
Mean ± SD
Geometricmean
Mean ± SD Geometricmean
NO 19.51 ± 36.20
8.32 12.30 ± 15.62
8.55 5.01 ± 2.75
4.63 36.83 ± 54.09
22.66
P-value 0.329 0.246 0.220 0.23
* In bold are the statistically signi�cant associations and p-values < 0.05.
4. DiscussionAn area of present cross-sectional research about investigating the concentration of Br-THMs in urine as a biomarkerof exposure to drinking water disinfection by-products, in pregnant women was done in Isfahan, Iran, as the �rst study.
In the previous studies, the concentration of total trihalomethanes (TTHMs) has been identi�ed in the water of Isfahancity (Mohammadi et al., 2016, Ali Dehnavi, 2018, Bijan Bina, 2012). In spite of this issue, TCM was not detected in theurine of pregnant women in this study, but DBCM, BDCM, TBM, and also brominated THMs were measurable.Researchers have attributed this, to the low volatility of Br-THMs (Gängler et al., 2017). Although the ingestion is themain route of exposure to DBPs (Liu, 2014) in a study by Gangler et al., the non-ingestion route, especially through theair, was more important in predicting TCM levels (Gängler et al., 2017).
The lifestyle habits of the participants in this study, such as using suitable ventilation or cool water during washingand bathing, have an effective role in limitation and its exit from the environment. Liu research revealed that hot watertanks are effective in degradation DBPs and have increased THMs (Liu, 2014).
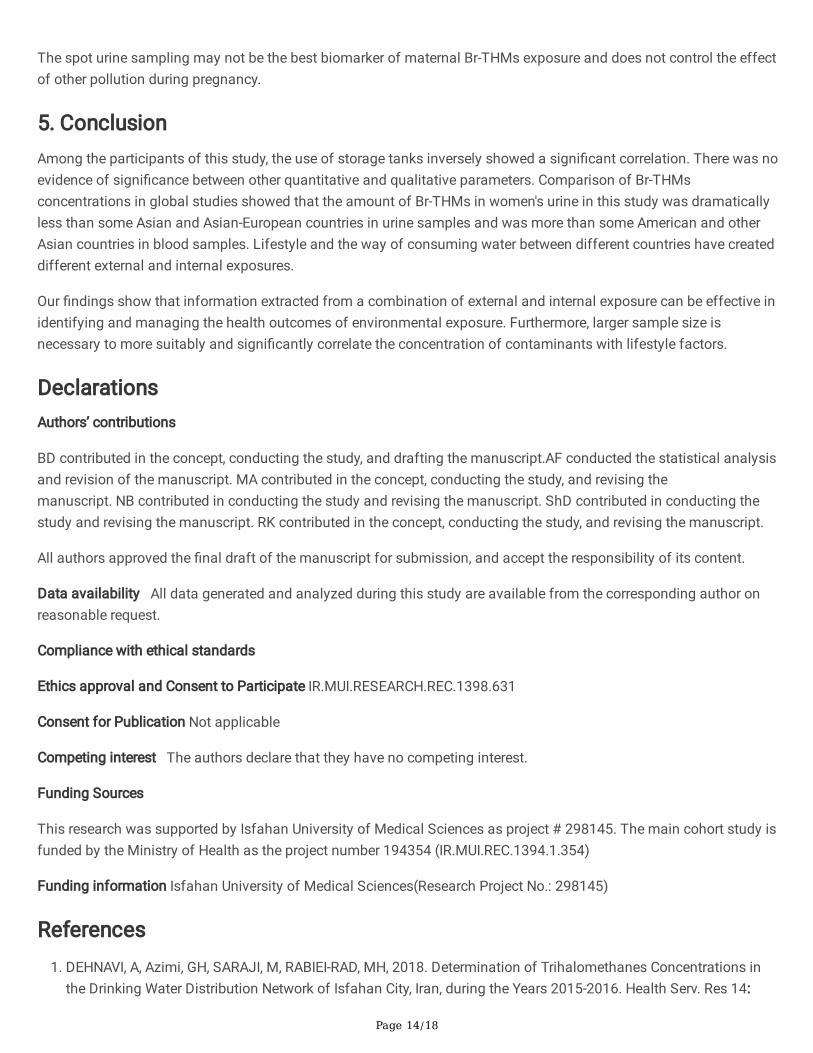
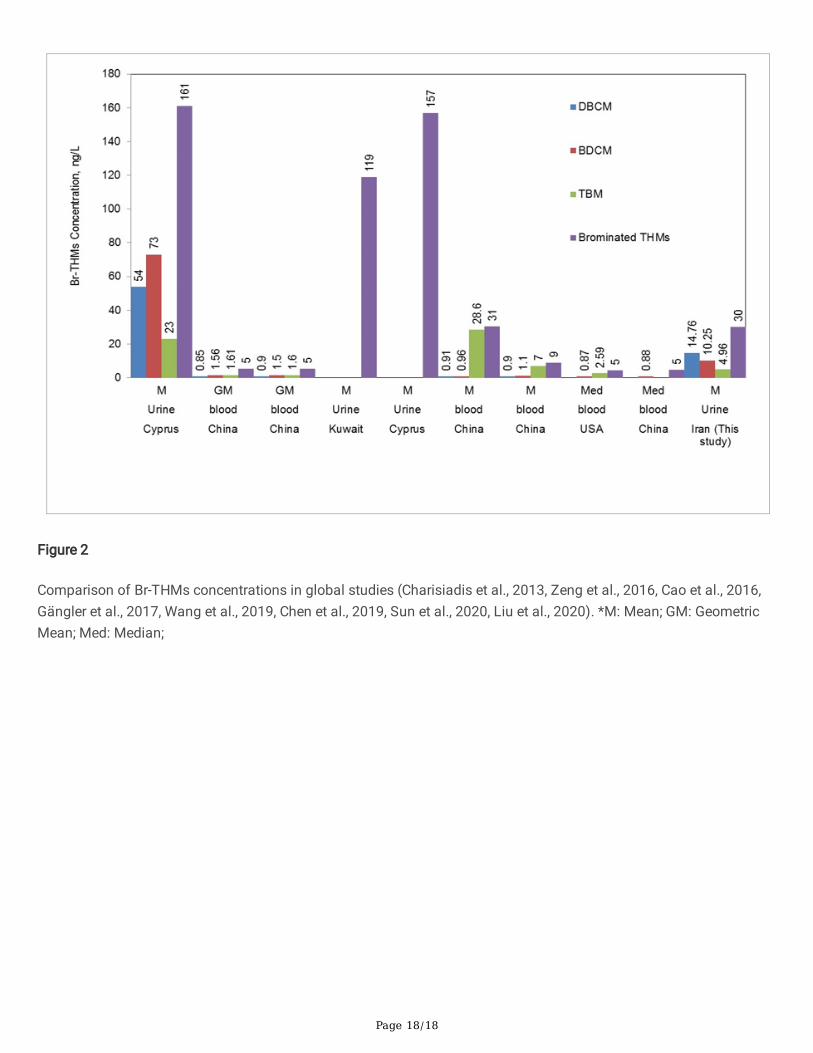
According to Fig. 2, in addition to this study, the amount of Br-THMs in women's urine has been reported in three othercountries. The urinary concentration levels of this group of contaminants in this study were dramatically differentcompared to Kuwait and Cyprus (Charisiadis et al., 2013, Gängler et al., 2017). This is due to personal habits andcharacteristics such as water consumption patterns and genetics and physiological features that have affected themetabolism of THMs(Rivera-Núñez et al., 2012). But, the same as Cyprus, mean urinary DBCM and BDCM were higherthan compared to TBM; the reason is perhaps the increase in hydrophilicity of the compounds in the following order(TBM < DBCM < BDCM < TCM) (Rivera-Núñez et al., 2012). On the other hand, measurement in the blood compared tourine has been shown lower concentrations, which is in contrast to urine analysis. The amount of TBM was higherthan DBCM and BDCM because of the lipophilicity of TBM compared to the other compounds (Rivera-Núñez et al.,2012).
Figure 2 Comparison of Br-THMs concentrations in global studies (Charisiadis et al., 2013, Zeng et al., 2016, Cao et al.,2016, Gängler et al., 2017, Wang et al., 2019, Chen et al., 2019, Sun et al., 2020, Liu et al., 2020).
In our study, according to statistical reports, the effective source of receiving Br-THMs in pregnant women in Isfahanwas the use of a water storage tank (p < 0.05) (Tables 5). That showed a signi�cant negative correlation with theconcentration of urinary Br-THMs in the participants.
Page 13/18
Using a tank is a common way for storage of water in the residential house. In this study, the use of water tanks,which are usually made of plastic, with a negative correlation, reduced the amount of DCBM, BDCM, and TBM.Scienti�c research by Cao et al. showed that the application of polyethylene pipes has been effective on water qualityover time by sorption contaminants, especially THMs (Cao et al., 2020). Also, according to the study of Slavik et al.,increasing the volume of the storage tank has reduced the amount of disinfection residual, thus affecting theformation of disinfection by-products (Slavik et al., 2020).
In Table 2, in addition to tap water, participants have used other sources, such as bottled water, for drinking; but mostof them had a higher average consumption of tap water than other sources. According to the analysis of Charisiadiset al., the amount of THMs in water bottles against tap water was non-detectable (Charisiadis et al., 2013).
Although there was an excessive daily intake of drinking water with an average of 7.14 glasses per day, urinary levelsof THMs were reduced because of dilution of the THMs mass (Charisiadis et al., 2013). As a result, according toTable 4, there is no signi�cant relationship between the urinary concentration of these contaminants and water intake(p > 0.05).
Also, Table 4 revealed no signi�cant relationship between other demographic and lifestyle parameters (age, education,weight, BMI, frequency, and time duration of washing dishes, clothes, as well as bathing and cleaning the house) withthe concentrations of unadjusted urinary Br-THMs. Charisiadis et al. reported a signi�cant relationship between theconcentration of THMs in toilet cleaning and hand washing dishes (Charisiadis et al., 2013). In contrast, Chen et al.,similar to the �ndings of this study, did not report a signi�cant relationship between the concentrations of maternalblood THMs with the parameters of age, BMI, education, drinking water source, and showering (Chen et al., 2019).
In another evaluation, participants' tea consumption did not have a signi�cant correlation with brominated THMs.According to Fakour et al., the use of boiling water and preserving the water temperature at 100°C for a long time, aswell as more use of teapot instead of the �ask as tea containers, reduces chlorine by 5–19% via better outputevaporated volatile compounds into the atmosphere (Fakour and Lo, 2019). In Iran, based on the culture, tea isconsumed as a common beverage during the day and for a long time, and also using teapot is usual but our data inthis study did not agree with the �ndings of this researcher (25).
In Table 5, for other qualitative parameters, we did not observe a signi�cant relationship between the concentration ofBr-THMs and the use of household water puri�ers, boiled water, dishwasher, gloves, and �nally the type of detergent.
Carrasco-Turigas et al. stated that the use of household reverse osmosis �lters affect the removal of THMs containingbromine as non-volatile compounds, moreover boiling through conventional heating such as electric kettles bycreating big bubbles and equally energy had a signi�cant in�uence on the chloroform removal (Carrasco-Turigas et al.,2013).
Study strengths and limitations
The strengths of this study include the population-based design, high-quality urinary Br-THMs assays.
One of the strong limitations of this study was the small statistical population. According to previous studies, despitelong-term sampling, increased the identi�cation of THMs compounds, especially chloroform, which has highvolatility(Gängler et al., 2017), but the agreement of the participants to attend in this study depended on the shortsampling time. In addition, the majority of participants have not much contribution in household tasks due to being inthe third trimester of pregnancy.
Page 14/18
The spot urine sampling may not be the best biomarker of maternal Br-THMs exposure and does not control the effectof other pollution during pregnancy.
5. ConclusionAmong the participants of this study, the use of storage tanks inversely showed a signi�cant correlation. There was noevidence of signi�cance between other quantitative and qualitative parameters. Comparison of Br-THMsconcentrations in global studies showed that the amount of Br-THMs in women's urine in this study was dramaticallyless than some Asian and Asian-European countries in urine samples and was more than some American and otherAsian countries in blood samples. Lifestyle and the way of consuming water between different countries have createddifferent external and internal exposures.
Our �ndings show that information extracted from a combination of external and internal exposure can be effective inidentifying and managing the health outcomes of environmental exposure. Furthermore, larger sample size isnecessary to more suitably and signi�cantly correlate the concentration of contaminants with lifestyle factors.
DeclarationsAuthors’ contributions
BD contributed in the concept, conducting the study, and drafting the manuscript.AF conducted the statistical analysisand revision of the manuscript. MA contributed in the concept, conducting the study, and revising themanuscript. NB contributed in conducting the study and revising the manuscript. ShD contributed in conducting thestudy and revising the manuscript. RK contributed in the concept, conducting the study, and revising the manuscript.
All authors approved the �nal draft of the manuscript for submission, and accept the responsibility of its content.
Data availability All data generated and analyzed during this study are available from the corresponding author onreasonable request.
Compliance with ethical standards
Ethics approval and Consent to Participate IR.MUI.RESEARCH.REC.1398.631
Consent for Publication Not applicable
Competing interest The authors declare that they have no competing interest.
Funding Sources
This research was supported by Isfahan University of Medical Sciences as project # 298145. The main cohort study isfunded by the Ministry of Health as the project number 194354 (IR.MUI.REC.1394.1.354)
Funding information Isfahan University of Medical Sciences(Research Project No.: 298145)
References1. DEHNAVI, A, Azimi, GH, SARAJI, M, RABIEI-RAD, MH, 2018. Determination of Trihalomethanes Concentrations in
the Drinking Water Distribution Network of Isfahan City, Iran, during the Years 2015-2016. Health Serv. Res 14:
Page 15/18
314-320.
2. ANDRA, SS, CHARISIADIS, P, KARAKITSIOS, S, SARIGIANNIS, DA & MAKRIS, KC 2015. Passive exposures ofchildren to volatile trihalomethanes during domestic cleaning activities of their parents. Environ. Res 136: 187-195.
3. BATTERMAN, S, ZHANG, L, WANG, S & FRANZBLAU, A 2002. Partition coe�cients for the trihalomethanes amongblood, urine, water, milk and air. Sci. Total Environ 284: 237-247.
4. BINA, B, Mohammadi, A, EBRAHIMI, A, AMIN, MM, POURZAMANI, HR NEMATI MANSOR, S 2012. Survey ofchloroform concentration in the water distribution system of Isfahan, Iran, and zoning by GIS. Health Serv. Res204-213.
5. CAO, G, HUANG, K, WHELTON, AJ & SHAH, AD 2020. Formation and sorption of trihalomethanes from cross-linkedpolyethylene pipes following chlorinated water exposure. Environmental Science: Water Research & Technology 6:2479-2491.
�. CAO, W-C, ZENG, Q, LUO, Y, CHEN, H-X, MIAO, D-Y, LI, L, CHENG, Y-H, LI, M, WANG, F, YOU, L, WANG, Y.-X, YANG, P &LU, W.-Q 2016. Blood Biomarkers of Late Pregnancy Exposure to Trihalomethanes in Drinking Water and FetalGrowth Measures and Gestational Age in a Chinese Cohort. Environ. Health Perspect 124: 536-541.
7. CARRASCO-TURIGAS, G, VILLANUEVA, C. M, GOñI, F, RANTAKOKKO, P & NIEUWENHUIJSEN, M. J 2013. The effectof different boiling and �ltering devices on the concentration of disinfection by-products in tap water. J EnvironPublic Health 2013.
�. CHARISIADIS, P, ANDRA, S, MAKRIS, K, CHRISTODOULOU, M, CHRISTOPHI, C, KARGAKI, S & STEPHANOU, E 2014.Household cleaning activities as noningestion exposure determinants of urinary trihalomethanes. Environ. Sci.Technol 48: 770-780.
9. CHARISIADIS, P, ANDRA, SS, MAKRIS, KC, CHRISTODOULOU, M, CHRISTOPHI, CA, KARGAKI, S & STEPHANOU, E G2013. Household Cleaning Activities as Noningestion Exposure Determinants of Urinary Trihalomethanes.Environ. Sci. Technol 48: 770-780.
10. CHEN, Y-J, LIU, C, HUANG, L-L, AI, S-H, SUN, L, HUANG, Z, LI, J, LEI, H-S, LIU, J, LIU, Y-A, WANG, X, LIU, X-Y, CHENG,Y-H, WANG, Y-X, PAN, A & LU, W-Q 2019. First-trimester blood concentrations of drinking water trihalomethanesand neonatal neurobehavioral development in a Chinese birth cohort. J. Hazard. Mater 362: 451-457.
11. DENG, Y-L, YANG, P, CAO, W-C, WANG, Y-X, LIU, C, CHEN, Y-J, HUANG, L-L, LU, W-Q, WANG, L-Q & ZENG, Q 2019.Urinary biomarker of late pregnancy exposure to drinking water disinfection by-products and ultrasoundmeasures of fetal growth in Wuhan, China. Environ. Res 170: 128-133.
12. FAKOUR, H & LO, S-L 2019. Formation and risk assessment of trihalomethanes through different tea brewinghabits. Int J Hyg Environ Health 222: 117-124.
13. GäNGLER, S, MAKRIS, KC, BOUHAMRA, W & DOCKERY, DW 2017. Coupling external with internal exposure metricsof trihalomethanes in young females from Kuwait and Cyprus. J Expo Sci Environ Epidemiol 28:140-146.
14. GäNGLER, S, MAKRIS, KC, BOUHAMRA, W & DOCKERY, DW 2018. Coupling external with internal exposure metricsof trihalomethanes in young females from Kuwait and Cyprus. J Expo Sci Environ Epidemiol 28: 140-146.
15. KANG, H-S, KYUNG, M-S, KO, A, PARK, J-H, HWANG, M-S, KWON, J-E, SUH, J-H, LEE, H-S, IM MOON, G & HONG, J-H2016. Urinary concentrations of parabens and their association with demographic factors: A population-basedcross-sectional study. Environ. Res 146:245-251.
1�. LIU, B 2014. Impact of water heating on disinfection byproducts concentration.
17. LIU, C, WANG, Y-X, CHEN, Y-J, SUN, Y, HUANG, L-L, CHENG, Y-H, LIU, E-N, LU, W-Q & MESSERLIAN, C 2020. Bloodand urinary biomarkers of prenatal exposure to disinfection byproducts and oxidative stress: A repeated
Page 16/18
measurement analysis. Environ. Int 137: 105518.
1�. MOHAMMADI, A, MIRI, M, EBRAHIMI, A, KHORSANDI, H & NEMATI, S 2016. Monitoring of THMs concentration inIsfahan water distribution system and zoning by GIS, a case study in the center of Iran. Iranian journal of health,safety and environment 3: 421-427.
19. MOSAFERI, M, ASADI, M, ASLANI, H, MOHAMMADI, A, ABEDI, S, MANSOUR, SN & MALEKI, S 2020.Temporospatial variation and health risk assessment of trihalomethanes (THMs) in drinking water (northwestIran). Environ. Sci. Pollut. Res 1-13.
20. RIVERA-NúñEZ, Z, WRIGHT, JM, BLOUNT, BC, SILVA, LK, JONES, E, CHAN, R L, PEGRAM, R A, SINGER, PC &SAVITZ, DA 2012. Comparison of trihalomethanes in tap water and blood: a case study in the United States.Environ. Health Perspect 120: 661-667.
21. SLAVIK, I, OLIVEIRA, KR, CHEUNG, PB & UHL, W 2020. Water quality aspects related to domestic drinking waterstorage tanks and consideration in current standards and guidelines throughout the world–a review. J WaterHealth 18: 439-463.
22. STAYNER, L T, PEDERSEN, M, PATELAROU, E, DECORDIER, I, VANDE LOOCK, K, CHATZI, L, ESPINOSA, A,FTHENOU, E, NIEUWENHUIJSEN, MJ, GRACIA-LAVEDAN, E, STEPHANOU, EG, KIRSCH-VOLDERS, M & KOGEVINAS,M 2014. Exposure to Brominated Trihalomethanes in Water During Pregnancy and Micronuclei Frequency inMaternal and Cord Blood Lymphocytes. Environ. Health Perspect 122: 100-106.
23. SUN, Y, WANG, Y-X, LIU, C, CHEN, Y-J, LU, W-Q & MESSERLIAN, C 2020. Trimester-Speci�c Blood Trihalomethaneand Urinary Haloacetic Acid Concentrations and Adverse Birth Outcomes: Identifying Windows of Vulnerabilityduring Pregnancy. Environ. Health Perspect 128:107001.
24. VILLANUEVA, CM, GRACIA-LAVEDáN, E, IBARLUZEA, J, SANTA MARINA, L, BALLESTER, F, LLOP, S, TARDóN, A,FERNáNDEZ, M F, FREIRE, C & GOñI, F 2011. Exposure to trihalomethanes through different water uses and birthweight, small for gestational age, and preterm delivery in Spain. Environ. Health Perspect 119: 1824-1830.
25. WANG, Y-X, LIU, C, CHEN, Y-J, DUAN, P, WANG, Q, CHEN, C, SUN, Y, HUANG, L-L, WANG, L & CHEN, C 2019. Pro�les,variability and predictors of concentrations of blood trihalomethanes and urinary haloacetic acids alongpregnancy among 1760 Chinese women. Environ. Res 172: 665-674.
2�. ZENG, Q, CAO, W-C, ZHOU, B, YANG, P, WANG, Y-X, HUANG, Z, LI, J & LU, W-Q 2016. Predictors of Third TrimesterBlood Trihalomethanes and Urinary Trichloroacetic Acid Concentrations among Pregnant Women. Environ. Sci.Technol 50: 5278-5285.
Figures
Page 17/18
Figure 1
The locations of living areas of participants
Page 18/18
Figure 2
Comparison of Br-THMs concentrations in global studies (Charisiadis et al., 2013, Zeng et al., 2016, Cao et al., 2016,Gängler et al., 2017, Wang et al., 2019, Chen et al., 2019, Sun et al., 2020, Liu et al., 2020). *M: Mean; GM: GeometricMean; Med: Median;