Embed Size (px)
Citation preview
FORUM
Effect of epidural bupivacaine on the relationship
between the bispectral index and end-expiratory
concentrations of des¯urane
P. Hans, J. P. Lecoq, J. F. Brichant, P. Y. Dewandre and M. Lamy
University Department of Anaesthesia and Intensive Care Medicine, CHR de la Citadelle, University Hospital,
4000 Liege, Belgium
Summary
We compared the relationship between the bispectral index and end-tidal des¯urane concentrations
in 20 patients undergoing elective surgery. Patients received epidurally either 10 ml saline (group S)
or 10 ml bupivacaine 0.125% with epinephrine 1/800 000 (group B) before induction of
anaesthesia with sufentanil (0.15 mg.kgÿ1) and propofol (2 mg.kgÿ1); muscle relaxation was
obtained with cisatracurium (0.2 mg.kgÿ1). Patients lungs were ventilated to maintain end-tidal
des¯urane at 3% in O2/N2O (50/50) until 5 min after skin incision, followed by two consecutive
10 min periods at end-tidal des¯urane 6% and 9%. bispectral index values were recorded before
induction, at 3% des¯urane before and 5 min after skin incision, and at 6% and 9% end-tidal
des¯urane. Bispectral index decreased with increasing end-tidal des¯urane concentration (ANOVA:
p< 0.05). The decrease in bispectral index was signi®cant between pre-induction, 3% and 6%
des¯urane. No signi®cant difference was observed at 3% des¯urane before and after skin incision,
or between 6 and 9% des¯urane. The relationship between bispectral index and end-tidal
des¯urane concentration was ®tted by a linear regression in each group. No signi®cant difference
in bispectral index was observed between the groups at any time. We conclude that bispectral
index decreases with increasing des¯urane concentration and that this relationship is not affected
by epidural 0.125% bupivacaine.
Keywords Anaesthesia; depth. Monitoring; bispectral index. Anaesthetic, volatile; des¯urane.
Anaesthetic, local; bupivacaine.
......................................................................................
Correspondence to: Professor P. Hans
Accepted: 1 January 1999
Des¯urane is a volatile anaesthetic agent known to pro-
duce electroencephalographic (EEG) changes comparable
with those observed with equipotent levels of iso¯urane
and sevo¯urane [1±3]. Whereas the EEG is not commonly
recorded in routine anaesthetic practice, the use of the
bispectral index derived from the bispectral analysis of the
EEG is gaining increasing popularity. Bispectral index
values are correlated with the hypnotic component of
anaesthesia and bispectral index has been proposed as a
guide to the administration of intravenous and volatile
anaesthetic agents [4±6]. However, the effect of des¯urane
on bispectral index has never been investigated. The present
study was designed ®rst, to examine the relationship
between bispectral index and end-tidal des¯urane concen-
tration, and second, to determine if that relationship was
affected by epidural bupivacaine.
Methods
After receiving their informed consent to this protocol
approved by the hospital ethics committee, 20 ASA I
patients (12 males, 8 females), aged 17±62 years, were
enrolled. All were scheduled to undergo elective lumbar
disc surgery under general anaesthesia combined with
epidural analgesia. They were allocated to one of two
groups of 10 patients according to the solution given
Anaesthesia, 1999, 54, pages 899±908................................................................................................................................................................................................................................................
899Q 1999 Blackwell Science Ltd
epidurally: saline (group S) or bupivacaine (group B).
Random allocations to these groups were made according
to a computer-generated number table.
Premedication consisted of alprazolam 1 mg and atro-
pine 0.5 mg given orally 1 h before surgery. Upon arrival
in the operating room, patients were monitored with ECG,
pulse oximetry and noninvasive blood pressure (Datex
AS-3). EEG electrodes (ZipPrep: Aspect Medical Systems)
were placed on the scalp using the bipolar frontomastoid
montage con®guration. The impedance of each electrode
was > 2 Q. Bispectral index was recorded continuously
using an Aspect A-1000 System.
After intravenous cannulation, an epidural catheter was
inserted at the L1±L2 intervertebral space, with 4 cm left in
the epidural space. After intravenous administration of
500 ml of lactate±Ringer, the study solution was injected
epidurally: 10 ml solution of bupivacaine 0.125%�epinephrine 1/800 000 in group B (12.5 mg bupivacaine),
or 10 ml solution of saline in group S. Patients
were anaesthetised with sufentanil (0.15 mg.kgÿ1) and pro-
pofol (2 mg.kgÿ1), and paralysed with cisatracurium
(0.2 mg.kgÿ1) for intubation. The lungs were ventilated
with 50% nitrous oxide and 3% end-tidal des¯urane in
oxygen. Patients were then placed in the prone position
and surgery started within 15 min of induction of anaes-
thesia. Five minutes after skin incision, the inspired
concentration of des¯urane was increased to achieve a
6% end-tidal concentration for 10 min equilibration and
then 9% for 10 min. Thereafter, the end-tidal des¯urane
concentration was reduced and adjusted to keep an appro-
priate level of anaesthesia. Bispectral index was recorded
before the induction of general anaesthesia (control), at 3%
end-tidal des¯urane concentration before and 5 min after
skin incision, and at the end of each equilibration period of
6% and 9% des¯urane. The level of sensory block of the
epidural analgesia was assessed at awakening in each patient.
Age, weight and height were compared between groups
using an unpaired Student's t-test. The distribution by sex
was analysed using the Chi-squared test. Bispectral index
values were analysed in both groups using ANOVA for
repeated measurements and Turkey±Kramer post test.
The relationship between bispectral index and end-tidal
des¯urane during surgery was tested in each group using
least squares regression. The effect of epidural bupivacaine
was analysed by comparing bispectral index values
between groups at each end-tidal concentration of des-
¯urane with the Student's t test. A level of p< 0.05 was
considered statistically signi®cant.
Results
Demographic data were similar in both groups (Table 1).
At awakening, patients from group B had an upper level
of analgesia ranging between T6 and T10. Bispectral index
values recorded in both groups at each end-tidal des¯urane
concentration are shown in Table 2. Patients from both
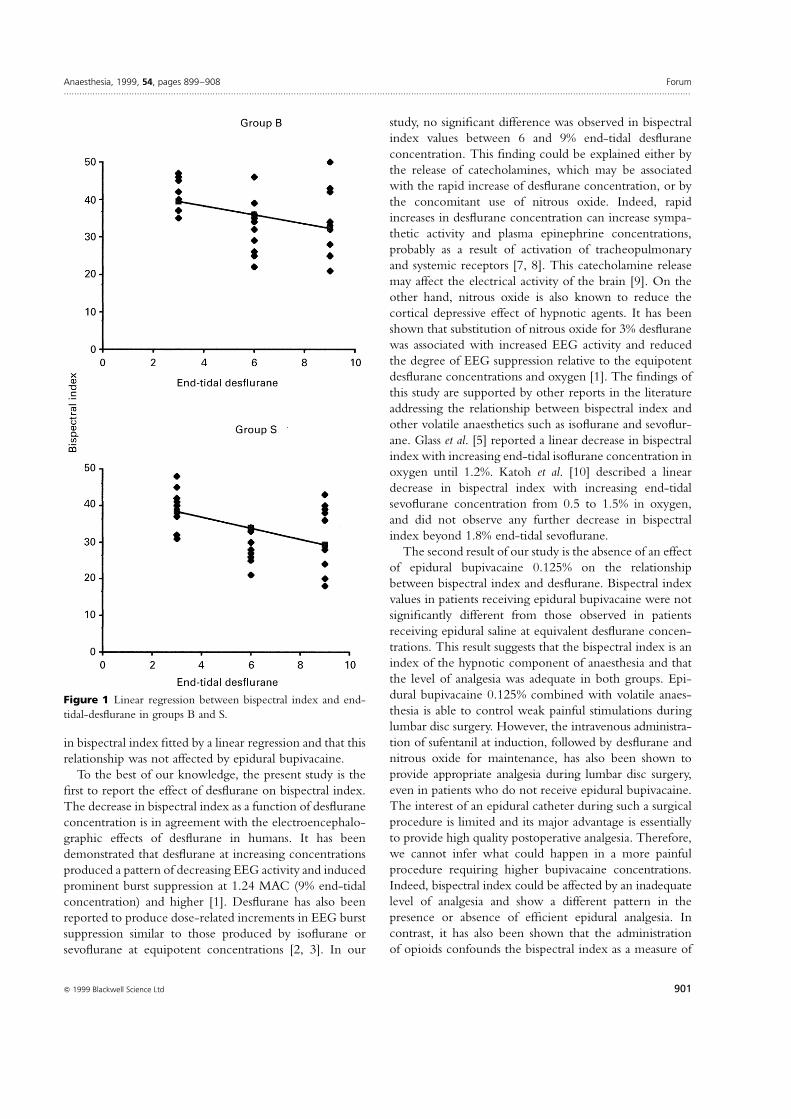
groups showed a decrease in bispectral index with increas-
ing concentrations of des¯urane (Fig. 1). Bispectral index
decreased signi®cantly between pre-induction, 3% and 6%
end-tidal des¯urane concentration. No signi®cant differ-
ence was observed in bispectral index values before and after
skin incision at 3% des¯urane, or between 6% and 9%
des¯urane concentration. Least squares regression analysis
demonstrated a signi®cant linear relationship between
bispectral index and end-tidal concentration of des¯urane
in group S (r�ÿ0.39, p� 0.03) and group B (r�ÿ0.43,
p� 0.01). Comparison of bispectral index values between
the two groups at each end-tidal des¯urane concentration
did not reveal any signi®cant difference.
Discussion
In the present study we found that increasing the end-tidal
des¯urane concentration from 3 to 9% produced a decrease
Forum Anaesthesia, 1999, 54, pages 899±908................................................................................................................................................................................................................................................
900 Q 1999 Blackwell Science Ltd
Surgery
End-tidal Control Pre-incisionDes¯urane 0% 3% 3% 5% 9%
Group B 97.3 (1.9) 41.8 (5.2)* 41 (4.5)* 31 (5.3)*²³ 30.5 (8.8)*²³Group S 95.4 (2.9) 40.2 (10.4)* 41.3 (7.1)* 28.1 (3.8)*²³ 32.2 (8.9)*³
Data are means (SD). * Signi®cantly different from control (0% des¯urane); ² signi®cantlydifferent from 3% des¯urane pre-incision; ³ signi®cantly different from 3% des¯urane afterincision.
Table 2 Bispectral index values in bothgroups
Table 1 Demographic summary of subjects enrolled in the studyprotocol
Group B Group S
n 10 10Male/female 8/4 2/6Age; years 42.2 (12.4) 41.5 (15.0)Weight; kg 76.7 (14.6) 76.6 (14.2)Height; cm 174 (9.3) 170.5 (7.0)
Values are mean (SD). No signi®cant difference between groups.
in bispectral index ®tted by a linear regression and that this
relationship was not affected by epidural bupivacaine.
To the best of our knowledge, the present study is the
®rst to report the effect of des¯urane on bispectral index.
The decrease in bispectral index as a function of des¯urane
concentration is in agreement with the electroencephalo-
graphic effects of des¯urane in humans. It has been
demonstrated that des¯urane at increasing concentrations
produced a pattern of decreasing EEG activity and induced
prominent burst suppression at 1.24 MAC (9% end-tidal
concentration) and higher [1]. Des¯urane has also been
reported to produce dose-related increments in EEG burst
suppression similar to those produced by iso¯urane or
sevo¯urane at equipotent concentrations [2, 3]. In our
study, no signi®cant difference was observed in bispectral
index values between 6 and 9% end-tidal des¯urane
concentration. This ®nding could be explained either by
the release of catecholamines, which may be associated
with the rapid increase of des¯urane concentration, or by
the concomitant use of nitrous oxide. Indeed, rapid
increases in des¯urane concentration can increase sympa-
thetic activity and plasma epinephrine concentrations,
probably as a result of activation of tracheopulmonary
and systemic receptors [7, 8]. This catecholamine release
may affect the electrical activity of the brain [9]. On the
other hand, nitrous oxide is also known to reduce the
cortical depressive effect of hypnotic agents. It has been
shown that substitution of nitrous oxide for 3% des¯urane
was associated with increased EEG activity and reduced
the degree of EEG suppression relative to the equipotent
des¯urane concentrations and oxygen [1]. The ®ndings of
this study are supported by other reports in the literature
addressing the relationship between bispectral index and
other volatile anaesthetics such as iso¯urane and sevo¯ur-
ane. Glass et al. [5] reported a linear decrease in bispectral
index with increasing end-tidal iso¯urane concentration in
oxygen until 1.2%. Katoh et al. [10] described a linear
decrease in bispectral index with increasing end-tidal
sevo¯urane concentration from 0.5 to 1.5% in oxygen,
and did not observe any further decrease in bispectral
index beyond 1.8% end-tidal sevo¯urane.
The second result of our study is the absence of an effect
of epidural bupivacaine 0.125% on the relationship
between bispectral index and des¯urane. Bispectral index
values in patients receiving epidural bupivacaine were not
signi®cantly different from those observed in patients
receiving epidural saline at equivalent des¯urane concen-
trations. This result suggests that the bispectral index is an
index of the hypnotic component of anaesthesia and that
the level of analgesia was adequate in both groups. Epi-
dural bupivacaine 0.125% combined with volatile anaes-
thesia is able to control weak painful stimulations during
lumbar disc surgery. However, the intravenous administra-
tion of sufentanil at induction, followed by des¯urane and
nitrous oxide for maintenance, has also been shown to
provide appropriate analgesia during lumbar disc surgery,
even in patients who do not receive epidural bupivacaine.
The interest of an epidural catheter during such a surgical
procedure is limited and its major advantage is essentially
to provide high quality postoperative analgesia. Therefore,
we cannot infer what could happen in a more painful
procedure requiring higher bupivacaine concentrations.
Indeed, bispectral index could be affected by an inadequate
level of analgesia and show a different pattern in the
presence or absence of ef®cient epidural analgesia. In
contrast, it has also been shown that the administration
of opioids confounds the bispectral index as a measure of
Anaesthesia, 1999, 54, pages 899±908 Forum................................................................................................................................................................................................................................................
901Q 1999 Blackwell Science Ltd
Figure 1 Linear regression between bispectral index and end-
tidal-des¯urane in groups B and S.
anaesthetic adequacy, at least when movement response to
skin incision is taken as the primary endpoint [4]. In this
respect, the absence of modi®cation in bispectral index
values before and after incision in patients receiving
epidural saline also suggests that bispectral index essentially
re¯ects the hypnotic effect of anaesthetic agents, or that
the level of analgesia was appropriate in those patients.
In the conditions in the present study, des¯urane produced
a dose-related decrease in bispectral index ®tted by linear
regression and this relationship was not affected by epidural
bupivacaine. Therefore, bispectral index may be used as a
reliable guide to the depth of des¯urane anaesthesia in
patients who bene®t from epidural analgesia.
References
1 Rampil IJ, Lockhart SH, Eger EI, Yasuda N, Weiskopf RB,
Cahalan MK. The electroencephalographic effects of
des¯urane in humans. Anesthesiology 1991; 74: 434±9.
2 Hoffman WE, Edelman G. Comparison of iso¯urane and
des¯urane anesthetic depth using burst suppression of
electroencephalogram in neurosurgical patients. Anesthesia
and Analgesia 1995; 81: 811±16.
3 Schwender D, Daunderer M, Klasing S, Finsterer U,
Peter K. Power spectral analysis of the
electroencephalogram during increasing end-expiratory
concentration of iso¯urane, des¯urane and sevo¯urane.
Anaesthesia 1998; 58: 335±42.
4 Sebel PS, Lang E, Rampil IJ, et al. A multicenter study of
bispectral electroencephalogram analysis for monitoring
anesthetic effect. Anesthesia and Analgesia 1997; 84: 891±9.
5 Glass PSA, Bloom M, Kearse L, Rosow C, Sebel P,
Manberg P. Bispectral analysis measures sedation and
memory effects of propofol, midazolam, iso¯urane, and
alfentanil in healthy volunteers. Anesthesiology 1997; 86:
836±47.
6 Struys M, Versichelen L, Mortier E, et al. Comparison of
spontaneous frontal EMG, EEG power spectrum and
bispectral index to monitor propofol drug effect
emergence. Acta Anaesthesiologica Scandinavica 1998; 43:
94±102.
7 Weiskopf RB, Eger II EI, Daniel M, Noorani M.
Cardiovascular stimulation induced by rapid increase in
des¯urane concentration in humans results from activation
of tracheopulmonary and systemic receptors. Anesthesiology
1995; 83: 1173±8.
8 Moore MA, Weiskopf RB, Eger II EI, Noorani M,
McKay L, Damask M. Rapid 1% increases of end-tidal
des¯urane concentration to greater than 5% transiently
increase heart rate and blood pressure in humans.
Anesthesiology 1994; 81: 94±8.
9 Kanaya N, Nakayama M, Fujita S, Namiki A.
Haemodynamic and EEG changes during rapid-sequence
induction of anaesthesia. Canadian Journal of Anaesthesia
1994; 41: 699.
10 Katoh T, Suzuki A, Ikeda K. Electroencephalographic
derivatives as a tool for predicting the depth of sedation
and anesthesia induced by sevo¯urane. Anesthesiology 1998;
88: 642±50.
11 Gan TJ, Glass PS, Windsor A, et al. The BIS Utility Study
Group. Bispectral index monitoring allows faster
emergence and improved recovery from propofol,
alfentanil, and nitrous oxide anesthesia. Anesthesiology 1997;
87: 808±15.
FORUM
The effects of ropivacaine hydrochloride on coagulation
and ®brinolysis An assessment using thromboelastography
J. M. Porter,1 J. McGinley,2 B. O'Hare2 and G. D. Shorten1
1 Department of Anaesthesia & Intensive Care Medicine, Cork University Hospital, University College Cork,
Wilton, Cork, Republic of Ireland
2 Department of Anaesthesia & Intensive Care Medicine, Our Lady's Hospital for Sick Children, Crumlin,
Dublin, Republic of Ireland
Summary
Amide local anaesthetics impair coagulation by inhibition of platelet function and enhanced
®brinolysis. The potential therefore exists that the presence of amide local anaesthetics in the
epidural space could contribute to the therapeutic failure of an epidural autologous blood patch.
Ropivacaine is an aminoamide local anaesthetic increasingly used for epidural analgesia and
anaesthesia, particularly in obstetric practice. This study was undertaken to investigate whether
Forum Anaesthesia, 1999, 54, pages 899±908................................................................................................................................................................................................................................................
902 Q 1999 Blackwell Science Ltd
concentrations of ropivacaine in blood, which could occur clinically in the epidural space, alter
coagulation or ®brinolysis. Thromboelastography was used to assess clotting and ®brinolysis of
blood to which ropivacaine had been added. Although modest alterations in maximum amplitude,
coagulation time and alpha angle were observed, the effect of ropivacaine on clotting and
®brinolysis was not clinically signi®cant. We conclude that it is unlikely that the presence of
ropivacaine in the epidural space would reduce the ef®cacy of an early or prophylactic epidural
blood patch.
Keywords Anaesthetics, local; ropivacaine. Anaesthetic techniques, regional; epidural. Blood; coagulation.
......................................................................................
Correspondence to: Dr J. M. Porter
Accepted: 22 January 1999
Epidural autologous blood patch is commonly used in the
treatment of postdural puncture headache. It is thought
that a blood patch works by sealing the dural perforation
and preventing further leakage of cerebrospinal ¯uid.
Although relief of postdural puncture headache by epi-
dural blood patch actually occurs through several mechan-
isms [1, 2], the long-lasting therapeutic effect is dependent
on the ability of the autologous blood to coagulate in the
epidural space [3]. The amide local anaesthetics, bupiva-
caine and lignocaine, both impair clotting by inhibition of
platelet function [4±6] and by enhanced ®brinolysis in the
case of lignocaine [7]. These effects occur at local anaes-
thetic concentrations that could occur in the epidural
space a few hours after an epidural block is established.
Ropivacaine is an aminoamide local anaesthetic, prepared
as a pure S-enantiomer, recently introduced into clinical
practice and increasingly used for epidural analgesia and
anaesthesia in obstetric practice. To date, its effects on
platelet function and whole blood coagulation have not
been studied. Conventional coagulation tests end with the
formation of ®brin strands, whereas thromboelastographic
assessment begins at this point [8]. Thromboelastography
(TEG) is a more sensitive test of ®brinolytic activity than
conventional measurement of ®brin degradation products
[9]. The effects of clinically achievable concentrations of
ropivacaine in blood on clotting and ®brinolysis were
assessed using TEG.
Methods
With institutional ethical approval and having obtained
informed consent from each, 10 ASA grade I volunteers
were selected for study. Individuals with a history of
coagulation abnormalities were excluded as were those
taking medication known to in¯uence platelet function or
coagulation.
An 18 G intravenous cannula was inserted in the non-
dominant forearm. Whole blood was withdrawn using a
two-syringe technique, with the ®rst 2 ml aliquot being
discarded to reduce tissue thromboplastin contamination
from the venepuncture. The whole blood was analysed
within 4 min of collection. Ropivacaine solutions were
prepared from ropivacaine hydrochloride 10 mg.mlÿ1
(NaropinÒ, Astra Pharmaceuticals Ltd, Hertfordshire,
UK) in 0.9% saline to create ®ve serial end concentrations
in blood, ranging from 3.75 mg.mlÿ1 to 0.23 mg.mlÿ1. The
highest ropivacaine concentration was chosen because
it corresponds to that in a 50% admixture of 0.75%
Anaesthesia, 1999, 54, pages 899±908 Forum................................................................................................................................................................................................................................................
903Q 1999 Blackwell Science Ltd
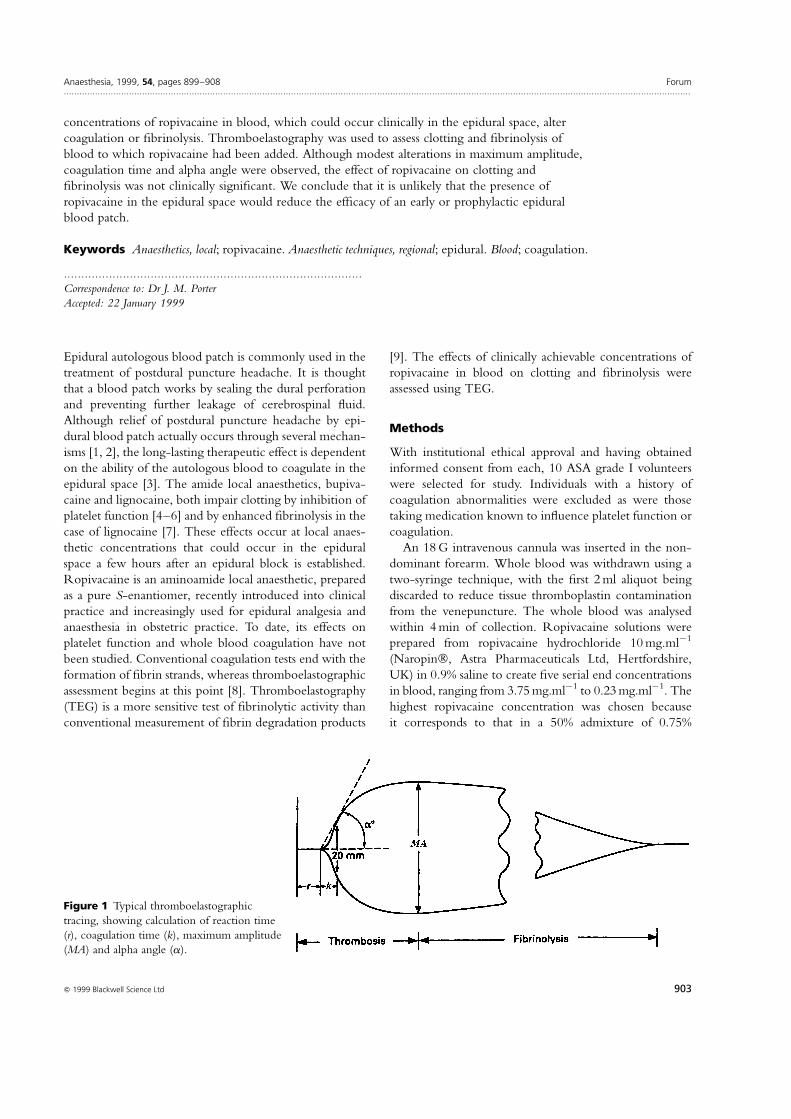
Figure 1 Typical thromboelastographic
tracing, showing calculation of reaction time
(r), coagulation time (k), maximum amplitude
(MA) and alpha angle (a).
ropivacaine in blood, a mixture that might theoretically
occur in the epidural space if an epidural blood patch were
performed immediately after injection of ropivacaine
0.75%. To each of ®ve TEG cuvettes, prepared saline
solutions of ropivacaine (180 ml) and whole blood (180 ml)
were added, forming end concentrations of ropivacaine of
3.75 mg.mlÿ1, 1.88 mg.mlÿ1, 0.94 mg.mlÿ1, 0.47 mg.mlÿ1
and 0.23 mg. mlÿ1 (ropivacaine/blood preparations).
Normal saline (180 ml) was added to 180 ml of whole
blood in a sixth cuvette and this was used as a volumetric
control (saline control). A seventh cuvette contained only
whole blood (360 ml).
Blood coagulation and ®brinolysis was measured by
thromboelastography using a computerised dual channel
TEG (Haemoscope Corporation 1990). The TEG para-
meters measured were as follows (Fig. 1).
Reaction time
Reaction time (r: normal range 10±14 min) is the distance
measured from the beginning of the trace to the point of
2 mm divergence. It corresponds to an early stage in clot
formation and is in¯uenced by coagulation factor activity.
Coagulation time
Coagulation time (k: normal range 3±6 min) is the distance
from the point of 2 mm divergence to a point of 20 mm
divergence and represents the time the forming clot takes
to achieve a ®xed degree of viscoelasticity. The parameter
k is in¯uenced by coagulation factor activity, number and
function of platelets and ®brinogen.
Maximum amplitude
Maximum amplitude (MA: normal range 59±68 mm) is
the width of the curve at its maximal divergence and
represents the strength of the ®brin clot. The MA re¯ects
the structural components of the clot, i.e. platelet number
and function, and ®brinogen. Maximum amplitude is
in¯uenced by platelet count and activity and correlates
with tests of platelet aggregation responses to adenosine
diphosphate (ADP) and collagen [10].
Alpha angle
The alpha angle (a: normal range 54±678) is formed by
the slope of the tracing from the r- to the k-value. Similar
to k, a is an indicator of the rate of solid clot formation and
is dependent on platelet count and ®brinogen.
Clot lysis
Clot lysis can be described in terms of Ly30, de®ned as
clot lysis at 30 min after the maximum amplitude (normal
range < 7.5%) [11].
For each patient, seven preparations were analysed:
360 ml of each of the ®ve ropivacaine/blood preparations
and 360 ml of the two controls (whole blood and saline)
were maintained at 37 8C in prewarmed plastic TEG
cuvettes. The pins of the TEG were raised and lowered
®ve times to ensure adequate mixing of the blood and
saline solutions. The morphology and data for ®ve TEG
parameters (r, k, a, MA and Ly30) were collected and
stored on TEG software. The saline control and the
ropivacaine/blood preparations were subjected to a stan-
dardised dilution (180 ml of blood and 180 ml of saline/
ropivacaine) to minimise volume-related effects.
Forum Anaesthesia, 1999, 54, pages 899±908................................................................................................................................................................................................................................................
904 Q 1999 Blackwell Science Ltd
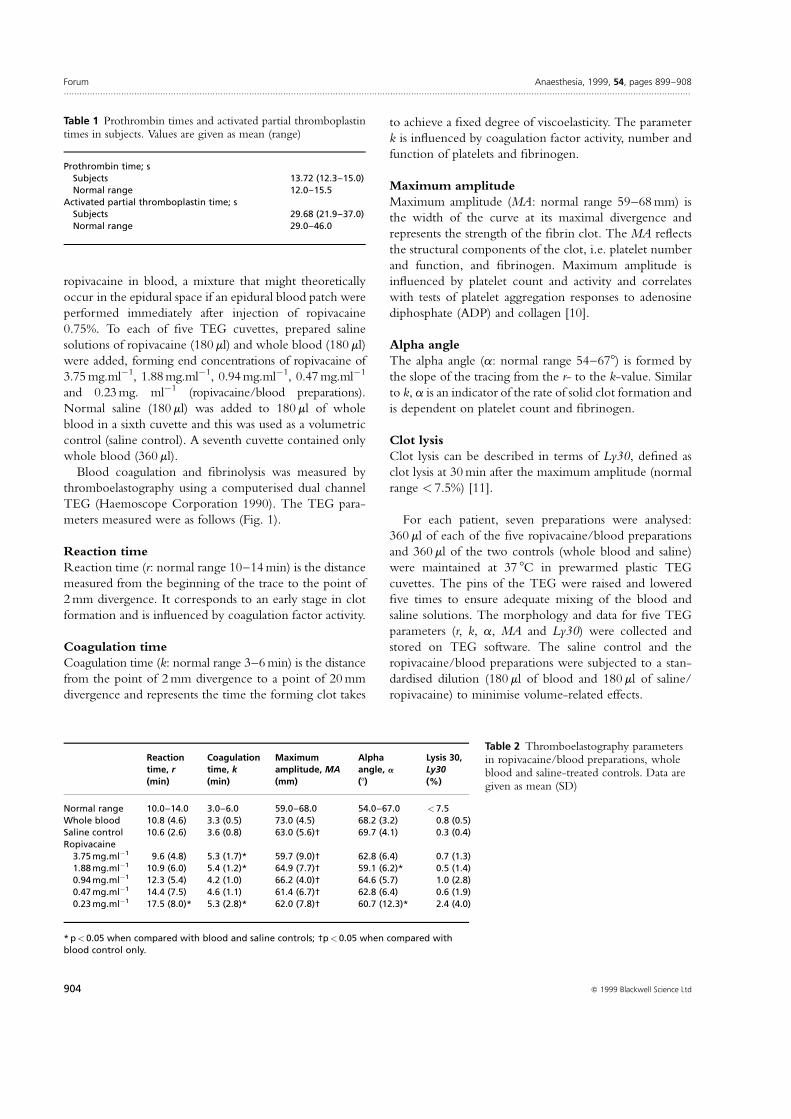
Table 1 Prothrombin times and activated partial thromboplastintimes in subjects. Values are given as mean (range)
Prothrombin time; sSubjects 13.72 (12.3±15.0)Normal range 12.0±15.5
Activated partial thromboplastin time; sSubjects 29.68 (21.9±37.0)Normal range 29.0±46.0
Reaction Coagulation Maximum Alpha Lysis 30,time, r time, k amplitude, MA angle, a Ly30(min) (min) (mm) (8) (%)
Normal range 10.0±14.0 3.0±6.0 59.0±68.0 54.0±67.0 < 7.5Whole blood 10.8 (4.6) 3.3 (0.5) 73.0 (4.5) 68.2 (3.2) 0.8 (0.5)Saline control 10.6 (2.6) 3.6 (0.8) 63.0 (5.6)² 69.7 (4.1) 0.3 (0.4)Ropivacaine
3.75 mg.mlÿ1 9.6 (4.8) 5.3 (1.7)* 59.7 (9.0)² 62.8 (6.4) 0.7 (1.3)1.88 mg.mlÿ1 10.9 (6.0) 5.4 (1.2)* 64.9 (7.7)² 59.1 (6.2)* 0.5 (1.4)0.94 mg.mlÿ1 12.3 (5.4) 4.2 (1.0) 66.2 (4.0)² 64.6 (5.7) 1.0 (2.8)0.47 mg.mlÿ1 14.4 (7.5) 4.6 (1.1) 61.4 (6.7)² 62.8 (6.4) 0.6 (1.9)0.23 mg.mlÿ1 17.5 (8.0)* 5.3 (2.8)* 62.0 (7.8)² 60.7 (12.3)* 2.4 (4.0)
* p< 0.05 when compared with blood and saline controls; ²p< 0.05 when compared withblood control only.
Table 2 Thromboelastography parametersin ropivacaine/blood preparations, wholeblood and saline-treated controls. Data aregiven as mean (SD)
Results of the data were subjected to one-way analysis
of variance for repeated measures. The Bonferroni post hoc
correction was applied. A p-value of < 0.05 was con-
sidered to be statistically signi®cant.
Results
Ten ASA grade I volunteers aged 25±45 years, ®ve males
and ®ve females, were included in the study. Baseline
values for prothrombin time and activated partial throm-
boplastin time are summarised in Table 1.
None of the subjects had measured baseline abnormali-
ties in coagulation variables (TEG parameters, prothrombin
time or activated partial thromboplastin time). When com-
pared with whole blood, ropivacaine solutions in blood
produced effects in the following TEG parameters: k, a and
MA. No signi®cant effects were demonstrated on reaction
time, r (with the exception of the most dilute concentration
of ropivacaine) or Ly30. Of those effects where ropivacaine
produced a difference (i.e. k, a and MA), saline dilution
produced changes similar in nature and degree to ropiva-
caine in MA, indicating an effect attributable to dilution
alone. In contrast, changes in a (a decrease) and in k
(prolongation) induced by ropivacaine in blood were not
reproduced by saline dilution. Group means, standard
deviations and analysis of variance for repeated measures
with post hoc correction are displayed in Table 2.
Discussion
Although statistically signi®cant changes in TEG parameters
(k, a, MA) were observed in the ropivacaine/blood pre-
parations, it is unlikely that these are of clinical importance
in terms of the ef®cacy of an epidural blood patch. With
one exception (ropivacaine 0.23 mg.mlÿ1: r� 17.5 min),
mean TEG parameters for all of the ropivacaine/blood
preparations were within normal limits. This single excep-
tion is likely to have arisen by chance as it occurred at the
lowest concentration of ropivacaine in blood and the value
of r obtained (17.5 min) lay within 2 SD (i.e. 2 ´ 4.6 mm) of
the mean seen in our whole blood control (10.8 mm).
The addition of the local anaesthetic agent to whole
blood altered coagulation as measured by TEG as follows:
changes were noted in k, a and MA but not in lysis or
reaction time. A signi®cant reduction in MA from the
control value was observed in all ®ve ropivacaine/blood
preparations (p< 0.05). However, the effects on MA were
similar in magnitude and direction to those produced by
the saline control, indicating an effect attributable to
dilution. Maximum amplitude re¯ects the structural integ-
rity of the clot (platelets, ®brinogen) and therefore one or
both of these were in¯uenced by dilution with saline with
or without ropivacaine.
Ropivacaine tended to increase coagulation time (k)
and reduce the alpha angle (a). This did not occur with
the saline control. We therefore conclude that the changes
observed were due to the effects of ropivacaine. Both
coagulation time (k) and alpha angle (a) are measures of
clot formation, the former dependent upon the activity of
clotting factors, ®brinogen and platelets, the latter on
®brinogen and platelets. Coagulation time (k) is a measure
of the time taken for a ®xed degree of viscoelasticity to be
achieved by the forming clot as a result of ®brin build up
and cross-linking. The alpha angle (a) denotes the speed at
which the clot forms. Coagulation time (k) was prolonged
in all ®ve ropivacaine/blood preparations, three of which
(3.75 mg.mlÿ1, 1.88 mg.mlÿ1 and 0.23 mg.mlÿ1) reached
statistical signi®cance. The ®ve local anaesthetic concentra-
tions studied signi®cantly prolonged coagulation time (k).
Alpha angle (a) was reduced in all ®ve ropivacaine/blood
preparations, two of which (1.88 mg.mlÿ1, 0.23 mg.mlÿ1)
reached statistical signi®cance. The magnitude of these
effects was small when compared with the normal values
for whole blood or with those produced by lignocaine in a
previous report [7], in which the concentrations studied
were equivalent to those employed in the current study.
All samples in our study (with the exception of the
whole blood control) were subjected to a standard dilution
of 50%. This degree of dilution (50% blood and ropiva-
caine) might occur within the epidural space following
the performance of an epidural blood patch. The effects of
dilution on coagulation have been studied: 50% dilution of
blood with saline produces an increase in coagulability in
vitro (r and k reduced, a increased) [12]. Blood loss of 15%
with crystalloid replacement [13] and 30% haemodilution
with crystalloid have been associated with a similar TEG
pro®le (r and k reduced, a increased) [11, 14]. Sixty
per cent dilution with normal saline produced a reduction
in coagulability (r, k, MA reduced, a increased), possibly
due to a dilution of coagulation factor activity and plate-
lets, but all TEG indices remained within the normal range
[11, 14]. In our study, the 50% dilution of blood with
saline produced a signi®cant reduction only in MA, but
mean MA values remained within normal limits.
Bupivacaine and lignocaine have previously demonstrated
potent inhibition of platelet function in vitro [5]. In vivo
inhibition of platelet aggregation has also been demonstrated
with epidural bupivacaine [6]. An ex vivo study of concen-
trations of bupivacaine similar to serum levels of local
anaesthetic associated with epidurally administered bupiva-
caine failed to alter TEG parameters [15]. The lowest
concentration of ropivacaine in blood chosen in our study
(0.23 mg.mlÿ1) exceeds by 100-fold that which might be
achieved in serum during ropivacaine epidural anaesthesia
(2.5 mg.mlÿ1) [15] but such concentrations could be realised
in the epidural space when a blood patch is performed.
Anaesthesia, 1999, 54, pages 899±908 Forum................................................................................................................................................................................................................................................
905Q 1999 Blackwell Science Ltd
We did not correct for the effect of dilution on calcium
concentration or pH induced by 50% dilution in our
preparations. Other workers have examined the effects
of 30% and 60% dilution of whole blood with saline on
ionised calcium levels and pH and have noted minimal
changes [14].
The concentrations of ropivacaine were chosen to simu-
late the admixtures that might be produced in the epidural
space by starting with an equal volume of ropivacaine
0.75% and autologous blood (3.75 mg.mlÿ1). Prophylactic
epidural blood patch is a recognised technique in which
autologous blood is injected into the epidural space shortly
after a dural tap is recognised. This may result in such an
admixture of blood and local anaesthetic [16]. The mass of
ropivacaine initially placed in the epidural space is known.
However, estimation of its concentration as a function of
time is not easy. If ropivacaine uptake from the epidural
space proceeds more slowly than uptake of its diluent, the
concentration of ropivacaine may increase rather than
decrease with the passage of time. Alternatively, cerebro-
spinal ¯uid from the inadvertent dural puncture may dilute
the epidural ropivacaine. The more dilute solutions of
ropivacaine assessed simulate the situation if an epidural
blood patch is performed following the recent discon-
tinuation of an epidural infusion of, for example, 0.15%
ropivacaine (0.23 mg.mlÿ1).
The results of this study indicate that ropivacaine, in the
concentrations studied, does not produce clinically sig-
ni®cant alterations in clotting or ®brinolysis. The clinical
implication of this is that the presence of ropivacaine in the
epidural space will not reduce the duration of ef®cacy of
an epidural blood patch.
Acknowledgments
We are indebted to Paul Smith, Our Lady's Hospital for
Sick Children, Crumlin, Dublin, who assisted us in running
the TEG analysis and to Kathleen O'Sullivan, University
College Cork, who provided us with statistical advice.
References
1 Di Giovanni AJ, Galbert MW, Wahle WM. Epidural
injection of autologous blood for post lumbar puncture
headache. II. Additional clinical experience and
laboratory investigation. Anesthesia and Analgesia 1972; 51:
226±32.
2 de Abouleish E, la Vega S, Blaudinger I, Tio TO. Long
term follow up of epidural blood patch. Anesthesia and
Analgesia 1975; 54: 459±63.
3 Rosenberg PH, Heavner JE. In vitro study of epidural
blood patch on leakage through a dural puncture.
Anesthesia and Analgesia 1985; 64: 501±4.
4 Feinstein MB, Fiekers J, Fraser C. An analysis of the
mechanisms of local anaesthetic inhibition of platelet
aggregation and secretion. The Journal of Pharmacology
and Experimental Therapeutics 1976; 197: 215±28.
5 Borg T, Modig J. Potential anti-thrombotic effects of
local anaesthetics due to their inhibition of platelet
aggregation. Acta Anaesthesiologica Scandinavia 1985; 29:
739±42.
6 Henny CP, Odoom JA, Ten Cate H, Oosterhof RJF,
Dabhoiwala NF, Sih IL. Effects of extradural bupivacaine
on the haemostatic system. British Journal of Anaesthesia
1986; 58: 301±54.
7 Tobias MD, Pilla MA, Rogers C, Jobes DR. Lidocaine
inhibits blood coagulation: implications for epidural blood
patch. Anesthesia and Analgesia 1996; 82: 766±9.
8 Mallett V, Cox JA. Thromboelastography. British Journal of
Anaesthesia 1992; 69: 307±13.
9 Whitten CW, Latson TW, Gulden RH, Burkhardt D,
Hyndman V. Thromboelastographic ®brinolysis does not
correlate with levels of D-dimers after cardiopulmonary
bypass. Anesthesiology 1991; 75: A432.
10 Tuman KJ, McCarthy RJ, Patel RV, Ivankovich AD.
Comparison of thromboelastography and platelet
aggregometry. Anesthesiology 1991; 75: A433.
11 Egli GA, Zollinger A, Popovich D, Pasch T, Spahn R.
Effect of progressive haemodilution with hydoxyethyl
starch, gelatin and albumin on blood coagulation. British
Journal of Anaesthesia 1997; 78: 684±9.
12 Tobias MD, Pilla MA, Rogers C. Effects of sequential
hemodilution upon TEG assessed coagulation. Anesthesia
and Analgesia 1995; 80: S503.
13 Tuman KJ, Speiss BD, McCarthy RJ, Ivankovich AD.
Effects of progressive blood loss on coagulation as measured
by thrombelastography. Anesthesia and Analgesia 1987; 66:
856±63.
14 Jamnicki M, Zollinger A, Seifert B, Popovic D, Pasch T,
Spahn DR. The effect of potato starch derived and corn
starch derived hydroxyyethyl starch on in vitro blood
coagulation. Anaesthesia 1998; 53: 638±44.
15 Gibbs NM, Sear JW. Effect of ketorolac, bupivacaine and
low-dose heparin on thromboelastographic variables in
vitro. British Journal of Anaesthesia 1995; 75: 27±30.
16 Berger CW, Crosby ET, Grodecki W. North American
survey of the management of dural puncture occurring
during labour epidural analgesia. Canadian Journal of
Anaesthesia 1998; 45: 110±14.
Forum Anaesthesia, 1999, 54, pages 899±908................................................................................................................................................................................................................................................
906 Q 1999 Blackwell Science Ltd
FORUM
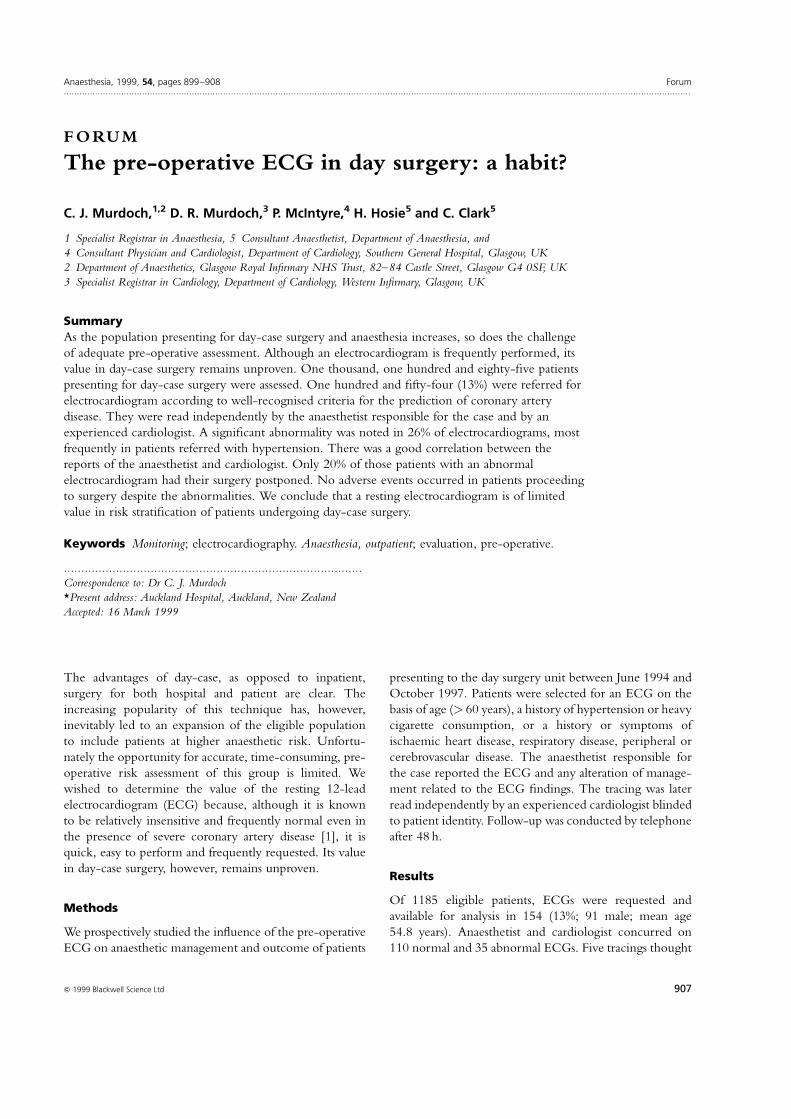
The pre-operative ECG in day surgery: a habit?
C. J. Murdoch,1,2 D. R. Murdoch,3 P. McIntyre,4 H. Hosie5 and C. Clark5
1 Specialist Registrar in Anaesthesia, 5 Consultant Anaesthetist, Department of Anaesthesia, and
4 Consultant Physician and Cardiologist, Department of Cardiology, Southern General Hospital, Glasgow, UK
2 Department of Anaesthetics, Glasgow Royal In®rmary NHS Trust, 82±84 Castle Street, Glasgow G4 0SF, UK
3 Specialist Registrar in Cardiology, Department of Cardiology, Western In®rmary, Glasgow, UK
Summary
As the population presenting for day-case surgery and anaesthesia increases, so does the challenge
of adequate pre-operative assessment. Although an electrocardiogram is frequently performed, its
value in day-case surgery remains unproven. One thousand, one hundred and eighty-®ve patients
presenting for day-case surgery were assessed. One hundred and ®fty-four (13%) were referred for
electrocardiogram according to well-recognised criteria for the prediction of coronary artery
disease. They were read independently by the anaesthetist responsible for the case and by an
experienced cardiologist. A signi®cant abnormality was noted in 26% of electrocardiograms, most
frequently in patients referred with hypertension. There was a good correlation between the
reports of the anaesthetist and cardiologist. Only 20% of those patients with an abnormal
electrocardiogram had their surgery postponed. No adverse events occurred in patients proceeding
to surgery despite the abnormalities. We conclude that a resting electrocardiogram is of limited
value in risk strati®cation of patients undergoing day-case surgery.
Keywords Monitoring; electrocardiography. Anaesthesia, outpatient; evaluation, pre-operative.
......................................................................................
Correspondence to: Dr C. J. Murdoch
*Present address: Auckland Hospital, Auckland, New Zealand
Accepted: 16 March 1999
The advantages of day-case, as opposed to inpatient,
surgery for both hospital and patient are clear. The
increasing popularity of this technique has, however,
inevitably led to an expansion of the eligible population
to include patients at higher anaesthetic risk. Unfortu-
nately the opportunity for accurate, time-consuming, pre-
operative risk assessment of this group is limited. We
wished to determine the value of the resting 12-lead
electrocardiogram (ECG) because, although it is known
to be relatively insensitive and frequently normal even in
the presence of severe coronary artery disease [1], it is
quick, easy to perform and frequently requested. Its value
in day-case surgery, however, remains unproven.
Methods
We prospectively studied the in¯uence of the pre-operative
ECG on anaesthetic management and outcome of patients
presenting to the day surgery unit between June 1994 and
October 1997. Patients were selected for an ECG on the
basis of age (> 60 years), a history of hypertension or heavy
cigarette consumption, or a history or symptoms of
ischaemic heart disease, respiratory disease, peripheral or
cerebrovascular disease. The anaesthetist responsible for
the case reported the ECG and any alteration of manage-
ment related to the ECG ®ndings. The tracing was later
read independently by an experienced cardiologist blinded
to patient identity. Follow-up was conducted by telephone
after 48 h.
Results
Of 1185 eligible patients, ECGs were requested and
available for analysis in 154 (13%; 91 male; mean age
54.8 years). Anaesthetist and cardiologist concurred on
110 normal and 35 abnormal ECGs. Five tracings thought
Anaesthesia, 1999, 54, pages 899±908 Forum................................................................................................................................................................................................................................................
907Q 1999 Blackwell Science Ltd
by the anaesthetist to show nonspeci®c ST changes and
voltage criteria for left ventricular hypertrophy (LVH) were
considered normal by the cardiologist, whereas four
reported normal by the anaesthetist were interpreted by
the cardiologist as unifocal ventricular ectopics, nonspeci®c
ST changes, LVH and myocardial ischaemia, respectively.
The investigators felt that the most signi®cant alteration
in management in a day-case setting was the postponement
of surgery because the patient was un®t to undergo day-case
anaesthesia. The anaesthetist responsible for the case was
also asked to provide further information about changes in
anaesthetic practice based on the ECG appearance.
Eight (20%) of the 40 patients considered to have an
abnormal ECG by the anaesthetist had their surgery
postponed. This ranged from postponing surgery pending
further investigation (six patients), referral for in-patient
surgery (one patient) and admission to the coronary care
unit for treatment of a ventricular arrhythmia (one patient).
The participating anaesthetists did not document other
changes in management.
The ECG abnormalities that were identi®ed but did not
lead to postponement of surgery were LVH (10 patients),
nonspeci®c ST changes (three patients), myocardial
ischaemia (®ve patients), left bundle branch block (one
patient), previous inferior myocardial infarction (three
patients) and previous anteroseptal myocardial infarction
(one patient). None of the patients with ECG evidence
of myocardial infarction gave a positive history. Despite
this, there were no cases of peri-operative cardiovascular
complications or admissions to hospital.
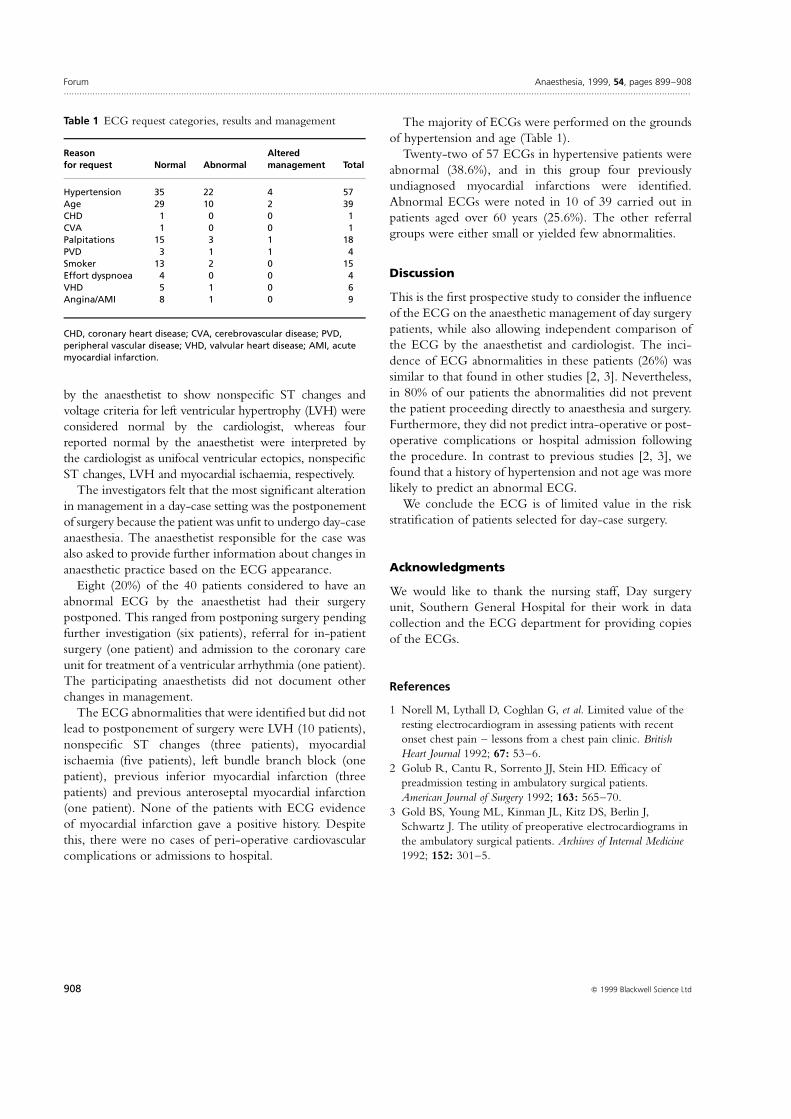
The majority of ECGs were performed on the grounds
of hypertension and age (Table 1).
Twenty-two of 57 ECGs in hypertensive patients were
abnormal (38.6%), and in this group four previously
undiagnosed myocardial infarctions were identi®ed.
Abnormal ECGs were noted in 10 of 39 carried out in
patients aged over 60 years (25.6%). The other referral
groups were either small or yielded few abnormalities.
Discussion
This is the ®rst prospective study to consider the in¯uence
of the ECG on the anaesthetic management of day surgery
patients, while also allowing independent comparison of
the ECG by the anaesthetist and cardiologist. The inci-
dence of ECG abnormalities in these patients (26%) was
similar to that found in other studies [2, 3]. Nevertheless,
in 80% of our patients the abnormalities did not prevent
the patient proceeding directly to anaesthesia and surgery.
Furthermore, they did not predict intra-operative or post-
operative complications or hospital admission following
the procedure. In contrast to previous studies [2, 3], we
found that a history of hypertension and not age was more
likely to predict an abnormal ECG.
We conclude the ECG is of limited value in the risk
strati®cation of patients selected for day-case surgery.
Acknowledgments
We would like to thank the nursing staff, Day surgery
unit, Southern General Hospital for their work in data
collection and the ECG department for providing copies
of the ECGs.
References
1 Norell M, Lythall D, Coghlan G, et al. Limited value of the
resting electrocardiogram in assessing patients with recent
onset chest pain ± lessons from a chest pain clinic. British
Heart Journal 1992; 67: 53±6.
2 Golub R, Cantu R, Sorrento JJ, Stein HD. Ef®cacy of
preadmission testing in ambulatory surgical patients.
American Journal of Surgery 1992; 163: 565±70.
3 Gold BS, Young ML, Kinman JL, Kitz DS, Berlin J,
Schwartz J. The utility of preoperative electrocardiograms in
the ambulatory surgical patients. Archives of Internal Medicine
1992; 152: 301±5.
Forum Anaesthesia, 1999, 54, pages 899±908................................................................................................................................................................................................................................................
908 Q 1999 Blackwell Science Ltd
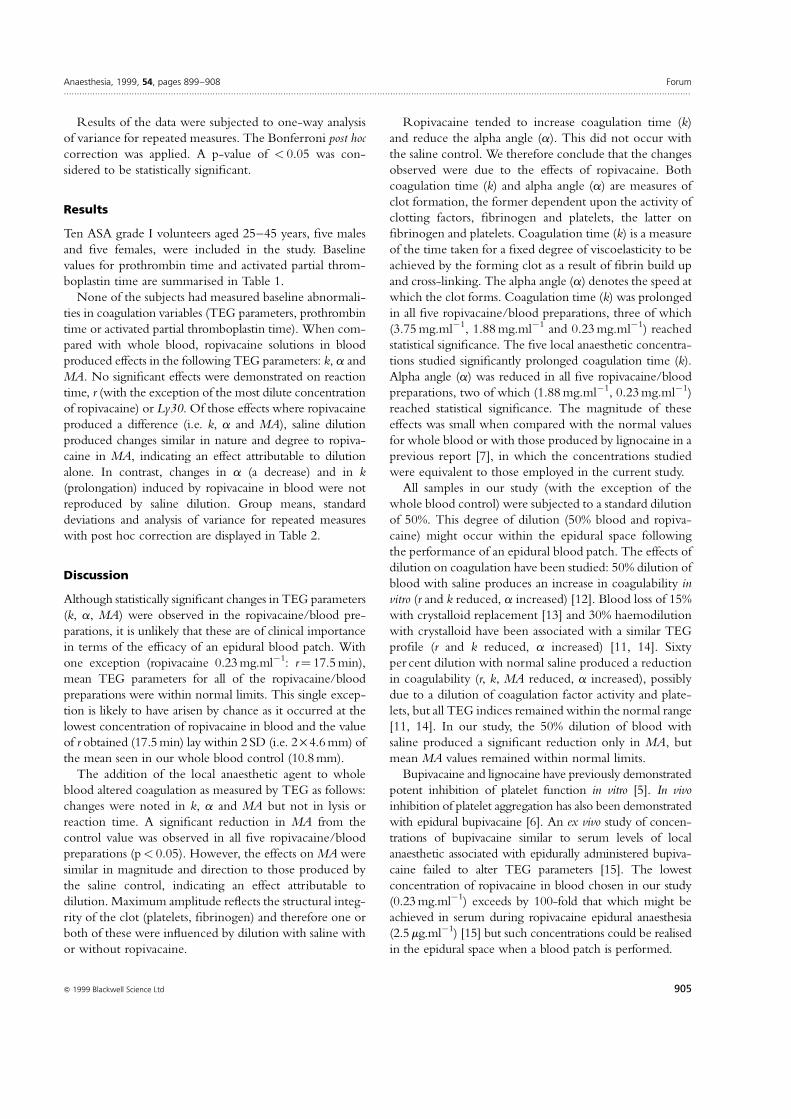
Table 1 ECG request categories, results and management
Reason Alteredfor request Normal Abnormal management Total
Hypertension 35 22 4 57Age 29 10 2 39CHD 1 0 0 1CVA 1 0 0 1Palpitations 15 3 1 18PVD 3 1 1 4Smoker 13 2 0 15Effort dyspnoea 4 0 0 4VHD 5 1 0 6Angina/AMI 8 1 0 9
CHD, coronary heart disease; CVA, cerebrovascular disease; PVD,peripheral vascular disease; VHD, valvular heart disease; AMI, acutemyocardial infarction.