Embed Size (px)
Citation preview

“Infrastructure Development in the North East – Leveraging Opportunities”
1
Ministry of PowerGovernment of India
3rd February, 2014 D. Chaudhry
Additional Secretary, MOP, [email protected]
THE POWER SECTOR

• In 13-14, April – December period, energyavailability is higher by 10.1% and peakavailability by 9.1% vs same period 12-13as more power made available (179 MW).
• The central govt is doing its bit. Thus at1600 MW (52%), the allocation fromcentral stations is 109.3% of thegeneration capacity of combined statesector and private sector in the NER(1464MW). Sikkim :
• Trans TTC: Bihar-Purnea-sharif 400kv linehas increased TTC to 720MW (400MWearlier). Further enhancement to 2100MW by March 14 with commissioning of400kv D/c quad Bongaigaon-Siliguri.
• By 2016-17 it is estimated that the peakload demand would be 3100 MW.
• By 2016-17 availability would be 7515 MWincluding 1967 MW to Assam with aninvestment of about Rs 52,000 crs. TheCGS capacity contribution would be 3990MW
2
Energy shortage and Peak deficit are decreasing in the NER…
12-13 13-14*
Energy Reqmt. BU 11.97 9.9*
Growth % 5.1 8.7*
Availability MU 11.12 9.3*
Av. Growth % 6.6 10.1*
Shortage MU 848 641*
% 7.1 6.4*
Peak demand MW 2093 2254*
Growth % 3.6 7.7*
Peak Met MW 1959 2138*
Growth % 4.4 9.1*
Deficit MW 134 116*
% 6.4 5.1*
*13-14: April to Dec / Also 13-14 comparison 12-13 for period April-Dec wherever.

But the increasing availability of power needs to be put to productive use……
• NER has a low 2.36% (35%) of energy consumed in low-mediumindustrial load (MSME and small business) vs national average of 6.5%(2010-11).
• Given the fact that the agricultural energy is also 0.87% against AI of17.72%, there is a huge gap in raising the productive sources in the stateeconomies
• This is further reflected in the poor per capita consumption of only 292.2kwh vs AI of 883.6kwh (2011-12). Sikkim off course has 880.1 kwh whichis an exception
• SO WHILE WE PLAN FOR INDUSTRIAL GROWTH OF NER, I WOULD LIKE TOSEE WHAT IS THE STRATEGY TO INCREASE INDUSTRIAL POWERCONSUMPTION IN MW TERMS
3
Or else the huge potential would not yield the expected local economic benefits….
Total potential (>25MW)
Under operation
Under development Untapped
Hydro 62,604* 1911 5132 55561
Thermal --- 1832 1366 -
Total 62,604 3743 (6.1%) 6498 (173.6%)/10% 55,561 (15 times)

The lever in NER in power sector is Hydro capacity…
4
State Potential Under operation
Under const. Under Pre- const. stage
Total under devpt.
% Bal. potn.
Sikkim 4,286 669 2322 2474.5 5465.5 100 -
Meghalaya 2,394 282 40 1269 1591 66.5 803Tripura 15 0 0 0 0 0 15Manipur 1,784 105 0 1566 1671 93.7 113Assam 680 375 0 120 495 72.8 185
Nagaland 1,574 75 0 186 261 16.6 1313Ar.P. 50,328 405 2710 41702.5 (84.1%) 44817.5 89.1 5510.5
Mizoram 2,196 0 60 2276 2336 100 -Total 63,257 1911 5132 (2.7 X) 49594 (9.66X UC) 56637 89.5 6620
Investment (Rs. Cr.)
5,08,431 9,555 35,924 3,96,752 66,200
4
MW
SO POWER GENERATION IS A 5 LAC CRORE INVESTMENT OPPORTUNITY

Within NER Leveraging opportunities in Arunachal would be the key going forward…..
5
MW %age
Identified capacity (above 25 MW) 50,064 100
Capacity developed (Ranganadi -NEEPCO) 405 0.80
Capacity under construction* 2710 5.41
Capacity allotted for development 41,702.5 83.30
Capacity yet to be allotted fordevelopment
5246.5 10.48
5
*Lower Subansiri (2000 MW-NHPC) ; Kameng ( 600 MW – NEEPCO) ; Pare (110 MW –NEEPCO)

6
S.N. Category No. of Projects MW
1 CEA concurred DPRs (> Rs.500 Cr. project cost) 15 16536
2 State concurred DPRs (< Rs.500 Cr. project cost) 6 337
3 DPRs under examination in CEA 7 3172
4 DPRs under examination in State(< Rs.500 Cr. project cost) 7 360
5 DPRs returned by CEA for resubmission after additional studies / information 8 3139
6 At Survey and Investigation stage by Developer 51 18158.5
TOTAL 94 41702.5Investment (Rs. Cr.) 3,33,620
6
ADEQUATE CAPACITY ALREADY ALLOTTED……
CII NEEDS TO TALK ABOUT RESOLVING LOWER SUBANSIRI PROJECT AND PUSH OTHER PROJECTS AS PART OF INDUSTRIAL AGENDA

7
The key is Funding: Equity/Debt requirements….
7
Installed capacity
(MW)
Estimatedcost
TentativeEquity
Tentative amount of
State Equity*
Tentative amount of Developer
Equity
Tentative amount of
Debt
33,875 2,51,981.29 52,970.5 15,719.16 37,251.31 1,99,010.8
(Rs. in crore)
*As per information provided by State Government
The Ministry of Power, GoI is taking a number of steps to encourage hydro:• Cost plus tariff extended beyond 2015 to 2022• Merchant power facility of 40% not to be reduced for delays in implementation• Examining HPO • Institutional mechanisms: (i) EGOM on NER under FM (ii) Task force on NER;
(iii) EGOM on Arunachal Pradesh under FM (iv) Empowered Committee underMember (E), Planning Commission (v) COS on NER, (vi) COS and IMG on strategicprojects in Arunachal (vii) Secretary MoEF level committee for Border InfrastructureDevelopment
For 42 large projects

Infrastructure Requirements (Road connectivity: 26 projects) for HE Projects in Ar. Pradesh are being vigorously pursued by MOP….
8
SIANG (6775 MW)1. Akajan- Likabali – Bame – 100 km (BRO)2. Bame-Along – 50 km (PWD)3. Daporijo-Bame – 100 km (PWD)4. Along-Tato-Mechuka-Hirong 180 km (BRO)5. Bogibeel Rail cum road bridge across River Brahmaputra (NEF Railway)6. Upgradation of existing Along airstrip (AAI)DIBANG (8408 MW)1. Tezu-Roingwhich will provide alternate route for projects in Dibang basin via Tezu
(BRO)2. Alubari Bridge (MORTH)3. Dhola – Sadiya Bridge (MORTH)4. NH 37 (from Dibrugarh – Tinsukia – Dhola (PWD)5. Upgradation of Meka –Roing –Anini road (230 km) (BRO)6. 14 bridges to be upgraded to 70 R (BRO)7. Construction of Deopani RCC Bridge (BRO)8. Ipplipani Bridge (5 km from Roing) required to be restored to 70 R (BRO)

Infrastructure Requirements for HE Projects in Ar. Pradesh
9
Lohit (4882 MW)1. Digaru – Tezu – Hawai section (BRO)2. Approach to Digaru bridge – 2.29 km (BRO)3. Stretch Digaru – Tezu – Demwe (BRO)4. Digaru-Tezu-Tohangam-47.1 km (BRO)5. Tohangam-Hayuliang-76 km (BRO)6. Demwe – Brahmakund – Arrowa – Hayuliang; (70 km) (BRO)7. Hayuliang-Changwinti-Hawai -65 km (BRO except last 15km with State PWD)8. Hawai- Walong (50 km) (GoAP)9. Upgradation of existing Tezu airstrip (AAI)
Kameng (1195MW)1. Nechipu to Seppa RD (MORTH)2. Balipara-Charduar-Tawang (317.52 km) (PWD)3. Bridge on Bichom river (PWD)
Rigourous follow up by MOP / PC /PMO / CS• EGoM under FM• Meetings with MoRTh / BRO: EPC, overlap, expediting approvals – 3 already
held in last two months• Now weekly follow up at AS, MOP level: (Every Friday)
MOP IS REALLY ON TO MICRO LEVEL MONITORING

1010
Projects 45MW 38575
DPR completed 22S&I pending 23Concurred 15
TOR Applied 40TOR obtained 31EIA complete 20EIA pending 25EC approved 9EC pending 5
EC not applied 6FC approved 9FC pending 21
FC not applied 15
94% MW CAPACITY FROM 45 PROJECTS OF GREATER THAN 100MW. HENCE NEED TO FOCUS ON THEM FIRST……… (16 ITEMS)
Action Points: 51. MOP: Expedite DPRs2. Developers to expedite:
• Construction where EC/FC cleared:15• S&I Reports for DPR: 23• Filing ToR / EC/FC applications: 5/15• Completing EIA/EMP: 25; Filing EC: 6
3. MoEF to • issue ToR (9)• Approve EC/FC where complete: 5/21• Decide on available basin studies and
expedite pending ones: 4/24. Focus on First User Right projects (6)
Expedite construction and sanction concerning First in Basin projects (6)• Lower Subansiri (UC), Demwe
Lower, DibangMOP / MoEF / State Govt working closely:(i) FC: milestone based timelines; (ii) EAC/FAC overlap removed; (iii) First in basin expedited; (iv) Balance in ArP allotted (Siang-I: 9000MW)

Transmission needs are being taken care of and they themselves provide a great investment opportunity..: Rs 28,000 Crs
Rs. 4201 cr. - Transmission System associated with PallatanaGBPP (726 MW) & Bongaigaon TPS (750 MW)NETCL: 2057 cr.• 400 KV D/C Pallatana-Silchar (492 Ckm) – Commissioned in Aug-12• 400 KV D/C Silchar-Bongaigaon (821 Ckm)
– Silchar-Byrnihat (419 Ckm)& LILO at Byrnihat– Commissioned Feb-13– Bynihat-Azara-Bongaigaon (402 ckm) : ROW and FC issues being resolved.
Anticipated by Mar-14
POWERGRID Rs 2144 cr.Completed: 400/132 KV Silchar Sub-station (2x200 MVA); 400 KV D/C Bongaigaon-Bongaigaon; 400 KV D/C Pallatana-surajmaninagar; 132 KV Silchar-Badarpur; 132 KV Silchar-SrikonaBalance under Progress• 400 KV D/C Silchar-Purbakanchan Bari (256 Ckm): Mar-14• 400 KV D/C Silchar-Imphal (332 Ckm): June, 2014• 400 KV D/C Silchar-Melriat (286 Ckm): December, 2014.
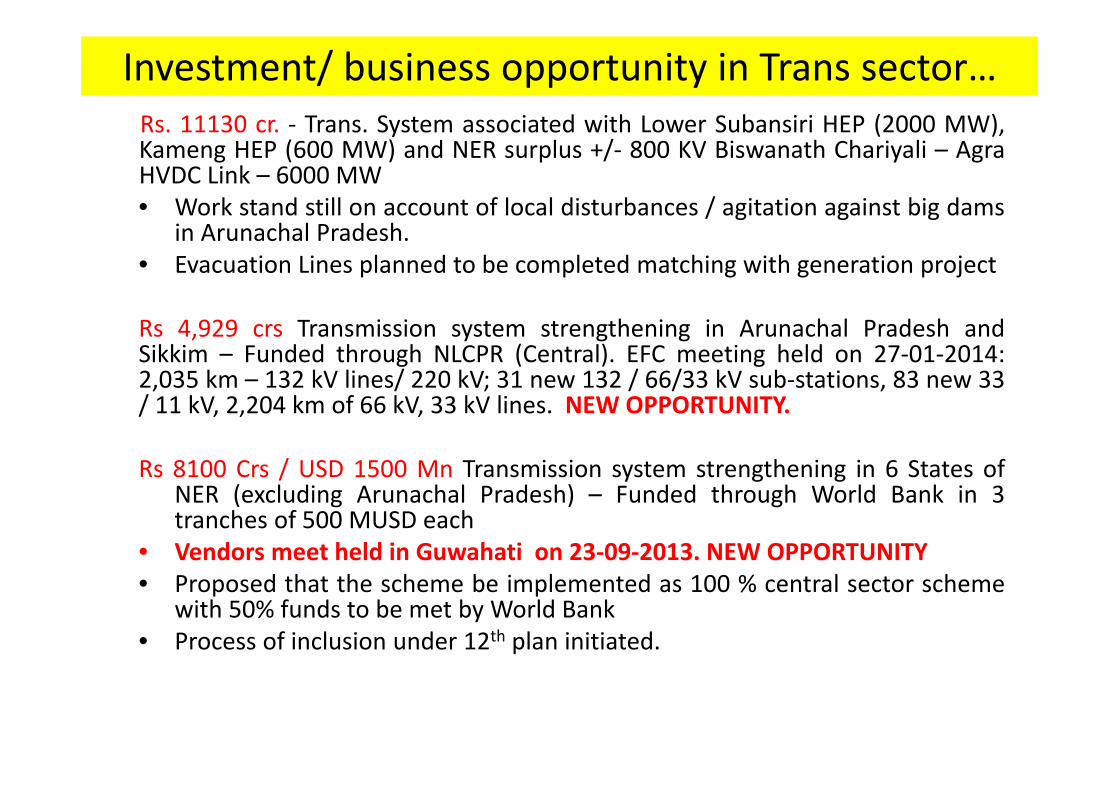
Investment/ business opportunity in Trans sector…Rs. 11130 cr. - Trans. System associated with Lower Subansiri HEP (2000 MW),Kameng HEP (600 MW) and NER surplus +/- 800 KV Biswanath Chariyali – AgraHVDC Link – 6000 MW• Work stand still on account of local disturbances / agitation against big dams
in Arunachal Pradesh.• Evacuation Lines planned to be completed matching with generation project
Rs 4,929 crs Transmission system strengthening in Arunachal Pradesh andSikkim – Funded through NLCPR (Central). EFC meeting held on 27-01-2014:2,035 km – 132 kV lines/ 220 kV; 31 new 132 / 66/33 kV sub-stations, 83 new 33/ 11 kV, 2,204 km of 66 kV, 33 kV lines. NEW OPPORTUNITY.
Rs 8100 Crs / USD 1500 Mn Transmission system strengthening in 6 States ofNER (excluding Arunachal Pradesh) – Funded through World Bank in 3tranches of 500 MUSD each
• Vendors meet held in Guwahati on 23-09-2013. NEW OPPORTUNITY• Proposed that the scheme be implemented as 100 % central sector scheme
with 50% funds to be met by World Bank• Process of inclusion under 12th plan initiated.

NEW TRANSMISSIONPROJECTS ARE ALSO ON WAY….
• Rs. 1900 Cr. Transmission evacuation plan for 7IPPs totalling 2162 MW
• CEA has developed a basin-wise master Plan forevacuation of power from Hydro Projects inArunachal Pradesh.
• Transmission system would be taken up forimplementation after grant of LTA, submissionof requisite Bank Guarantee and dependingupon progress of hydro projects in ArunachalPradesh.

14


16
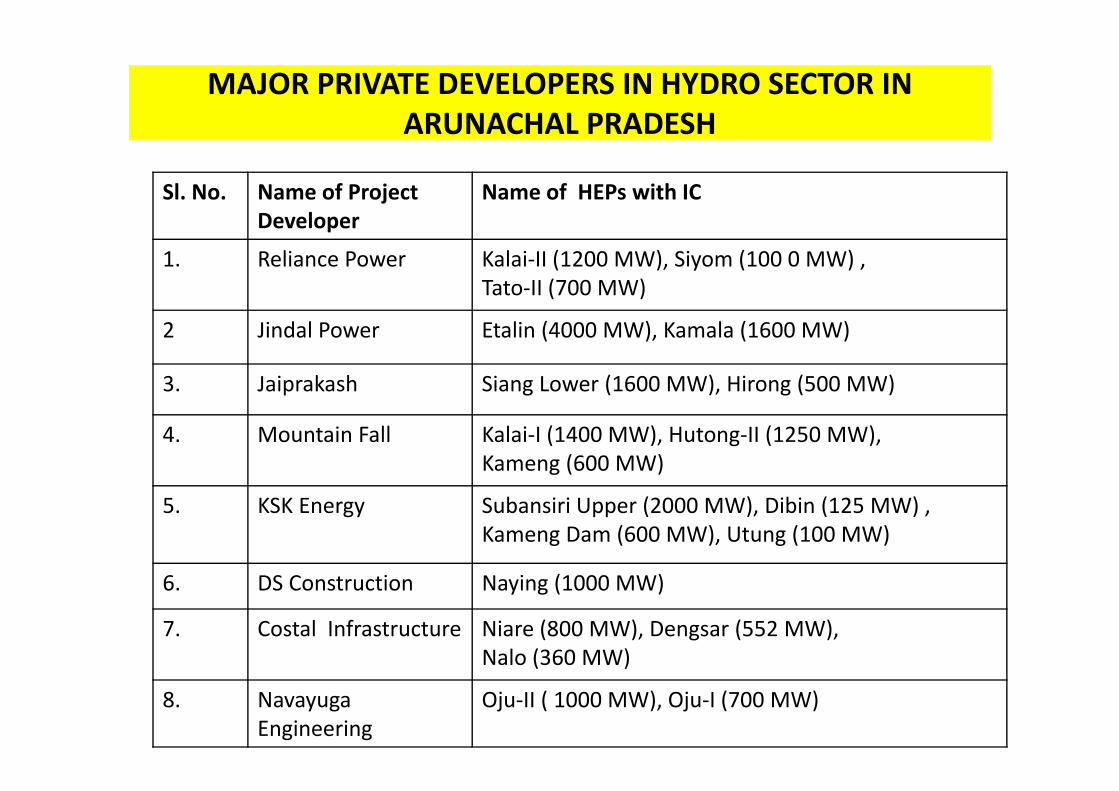
MAJOR PRIVATE DEVELOPERS IN HYDRO SECTOR IN ARUNACHAL PRADESH
Sl. No. Name of Project Developer
Name of HEPs with IC
1. Reliance Power Kalai-II (1200 MW), Siyom (100 0 MW) , Tato-II (700 MW)
2 Jindal Power Etalin (4000 MW), Kamala (1600 MW)
3. Jaiprakash Siang Lower (1600 MW), Hirong (500 MW)
4. Mountain Fall Kalai-I (1400 MW), Hutong-II (1250 MW), Kameng (600 MW)
5. KSK Energy Subansiri Upper (2000 MW), Dibin (125 MW) , Kameng Dam (600 MW), Utung (100 MW)
6. DS Construction Naying (1000 MW)
7. Costal Infrastructure Niare (800 MW), Dengsar (552 MW), Nalo (360 MW)
8. NavayugaEngineering
Oju-II ( 1000 MW), Oju-I (700 MW)

Meanwhile states need to focus on increasing Per-capita consumption and reducing AT&C losses…..
18
State 2010-11 2011-12
Per-capitaconsumption
AT&C losses Per-capitaconsumption
% change
AT&C losses % change
Sikkim 880.11 62.20 886.36 0.1 59.48 -4.4Arunachal Pradesh 582.08 61.45 683.13 17.4 65.55 6.7Assam 222.88 28.71 249.82 12.2 29.47 2.6
Manipur 242.3 40.17 235.86 -2.8 44.80 11.5Meghalaya 654.08 51.63 657.57 0.5 44.85 -13.1
Mizoram 461.69 41.00 506.74 9.8 30.02 -26.8Nagaland 264.81 49.34 257.18 2.6 22.32 -54.8
Tripura 221.8 34.48 253.82 14.5 33.76 -2.1
All India 818.75 26.04 883.63 7.9 27.00 3.7
18
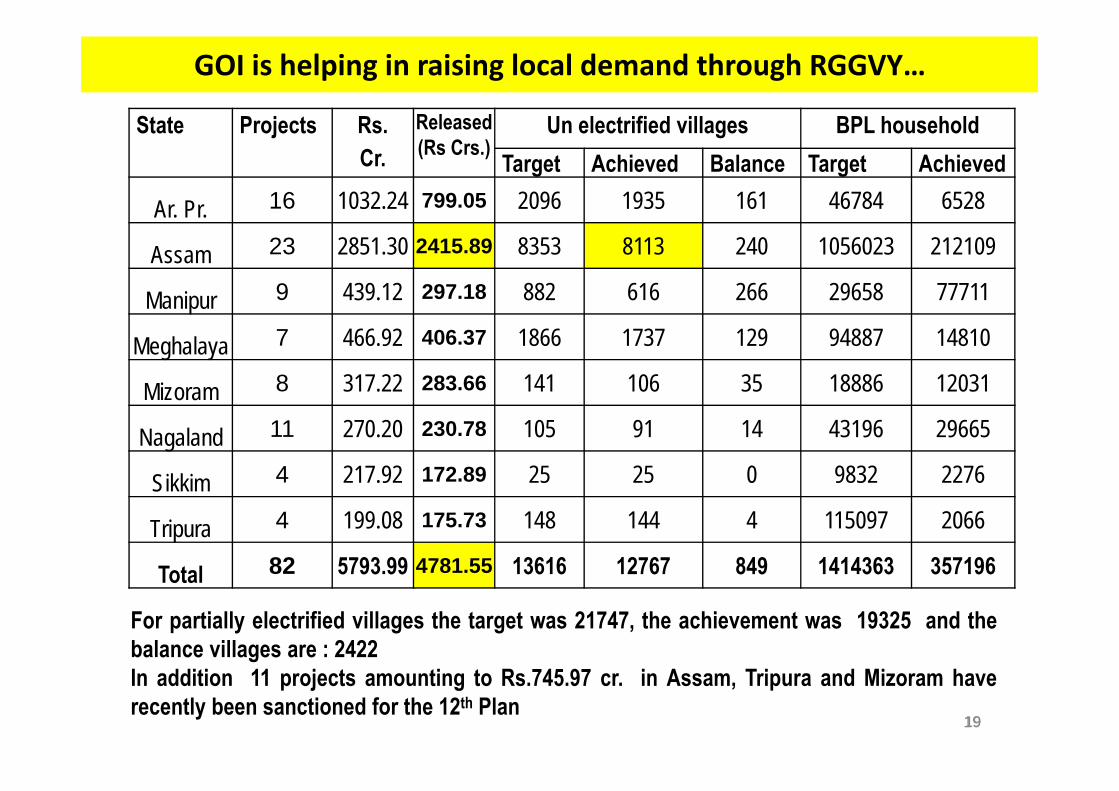
GOI is helping in raising local demand through RGGVY…
19
State Projects Rs.Cr.
Released (Rs Crs.)
Un electrified villages BPL householdTarget Achieved Balance Target Achieved
Ar. Pr. 16 1032.24 799.05 2096 1935 161 46784 6528
Assam 23 2851.30 2415.89 8353 8113 240 1056023 212109
Manipur 9 439.12 297.18 882 616 266 29658 77711
Meghalaya 7 466.92 406.37 1866 1737 129 94887 14810
Mizoram 8 317.22 283.66 141 106 35 18886 12031
Nagaland 11 270.20 230.78 105 91 14 43196 29665
Sikkim 4 217.92 172.89 25 25 0 9832 2276
Tripura 4 199.08 175.73 148 144 4 115097 2066
Total 82 5793.99 4781.55 13616 12767 849 1414363 357196
19
For partially electrified villages the target was 21747, the achievement was 19325 and thebalance villages are : 2422In addition 11 projects amounting to Rs.745.97 cr. in Assam, Tripura and Mizoram haverecently been sanctioned for the 12th Plan

Town areas are also being assisted to through the R-APDRP scheme….
20
Sl State Part-A Part-BDistribution
Strengthening
Total Cost (� Cr.) IT Cost (� Cr.)
Town Town Cost (� Cr.) 1 Arunachal Pradesh 10 37.68 Nil 0.00 37.682 Assam 67 195.60 67 644.05 839.653 Manipur 13 31.55 13 398.87 430.424 Meghalaya 9 33.98 9 159.73 193.715 Mizoram 9 35.12 9 240.41 275.536 Nagaland 9 34.58 Nil 0.00 34.587 Sikkim 2 26.30 2 68.46 94.768 Tripura 16 35.18 16 165.09 200.27
Total NER 135 429.99 116 1676.61 2106.60
20
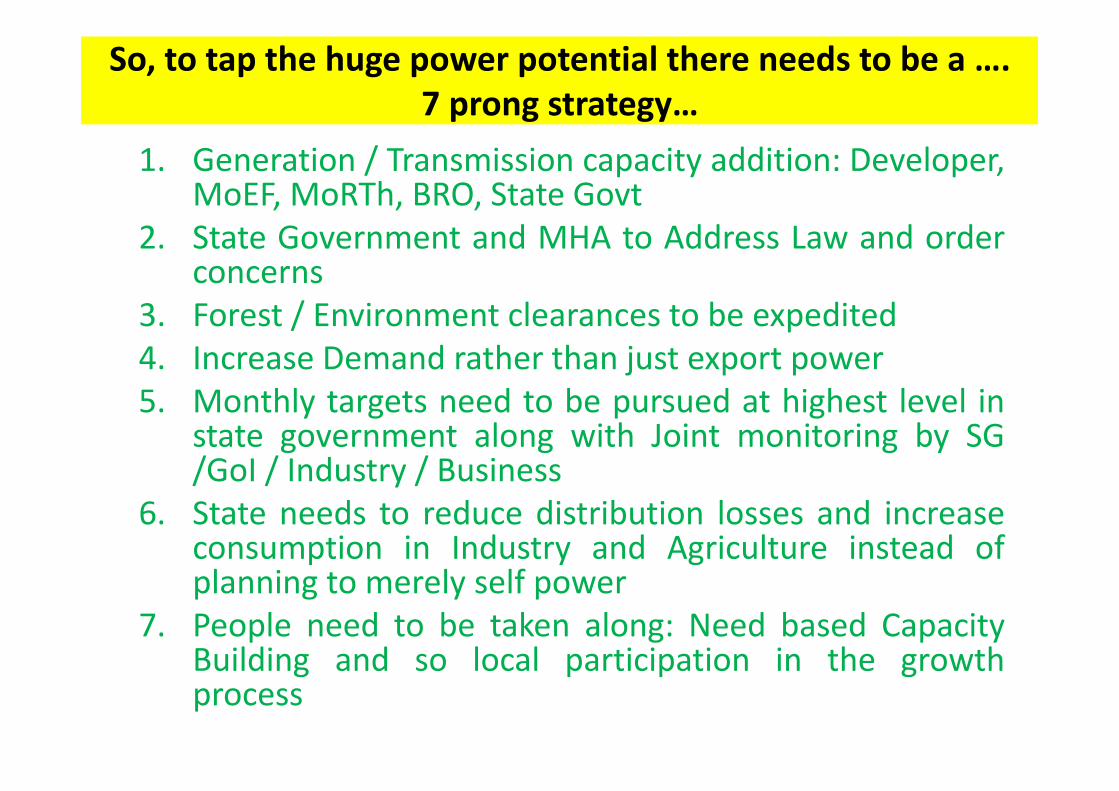
So, to tap the huge power potential there needs to be a ….7 prong strategy…
1. Generation / Transmission capacity addition: Developer,MoEF, MoRTh, BRO, State Govt
2. State Government and MHA to Address Law and orderconcerns
3. Forest / Environment clearances to be expedited4. Increase Demand rather than just export power5. Monthly targets need to be pursued at highest level in
state government along with Joint monitoring by SG/GoI / Industry / Business
6. State needs to reduce distribution losses and increaseconsumption in Industry and Agriculture instead ofplanning to merely self power
7. People need to be taken along: Need based CapacityBuilding and so local participation in the growthprocess

• Or else, little advantage would percolate to localindustry and commerce and or through them to thepeople
• With power export being the only source of revenue– the people would feel deprived of the benefits ofproduction of more local power. Importantly theywould feel little stake-holdership in development ofthe projects
• This should be sine–qua–non of leveraging growthof opportunities in NER through the power sector
22
Therefore key to leveraging is: Increase Local consumption through industry and business by scaling up even today by 4 times to take
advantage of the huge power potential…..
THANK YOU

THANK YOU
2323

Per-capita consumption and AT&C losses
24
State 2011-12 2010-11
Per-capitaconsumption
% change
AT&C losses
% change Per-capitaconsumption
% change
AT&C losses
% change
Sikkim 886.36 0.1 59.48 -4.4 880.11 3.5 62.20 4.9Arunachal Pradesh 683.13 17.4 65.55 6.7 582.08 23.8 61.45 4.5
Assam 249.82 12.2 29.47 2.6 222.88 8.8 28.71 -48.9
Manipur 235.86 -2.8 44.80 11.5 242.3 0.8 40.17 -15.5
Meghalaya 657.57 0.5 44.85 -13.1 654.08 -3.2 51.63 5.9
Mizoram 506.74 9.8 30.02 -26.8 461.69 22.3 41.00 5.3
Nagaland 257.18 2.6 22.32 -54.8 264.81 21.1 49.34 -24.5
Tripura 253.82 14.5 33.76 -2.1 221.8 -34.0 34.48 18.2
All India 883.63 7.9 27.00 3.7 818.75 5.1 26.04 -2.8
24

2525
Basin No. of
Projects
Status of ToR Status of EIA/EMPApplied Obtained Pending Not
appliedCompleted Pending
Tawang 4 4 3 1 0 3 1Kameng 8 8 5 3 0 4 4Subansiri 7 6 4 2 1 0 7
Siang 10 8 8 0 2 8 2Dibang 9 7 6 1 2 2 7Lohit 7 7 5 2 0 3 4Total 45 40 31 9 5 20 25
ENVIRONMENT CLEARANCE ISSUES: Issue of Terms of Reference (ToR) and completion of Environment Impact Assessment (EIA) studies / Environment Management Plan (EMP)
preparation
Action Points:1. ToR application to be made by developer where pending2. MoEF to issue ToR in 9 cases

2626
Basin No. of
Projects
EIA / EMP
Completed
Status of EC Status of FC Stg-IApproved Pending Not
Applied forEC/PH pending
Approved Pending NotApplied
Tawang 4 3 3 0 0 1 2 1Kameng 8 4 3 0 1 3 3 2Subansiri 7 0 0 0 0 0 4 3
Siang 10 8 2 2 4 0 8 2Dibang 9 2 0 1 1 1 2 6Lohit 7 3 1 2 0 4 2 1Total 45 20 9 5 6 9 21 15
STATUS OF ENVIRONMENT CLEARANCE vis-à-vis completion of EIA/EMP and STATUS OF STAGE-I FOREST CLEARANCE
Action Points:1. Developer to expedite construction where EC / FC cleared2. EC / FC application to be made by developer where pending3. MoEF to issue EC / FC where pending4. Focus on First User Right projects (6) : Siang Upper Stage -I and II5. Focus on construction and sanction concerning First in Basin projects (6)
• Lower Subansiri (Under construction), Demwe Lower , Dibang
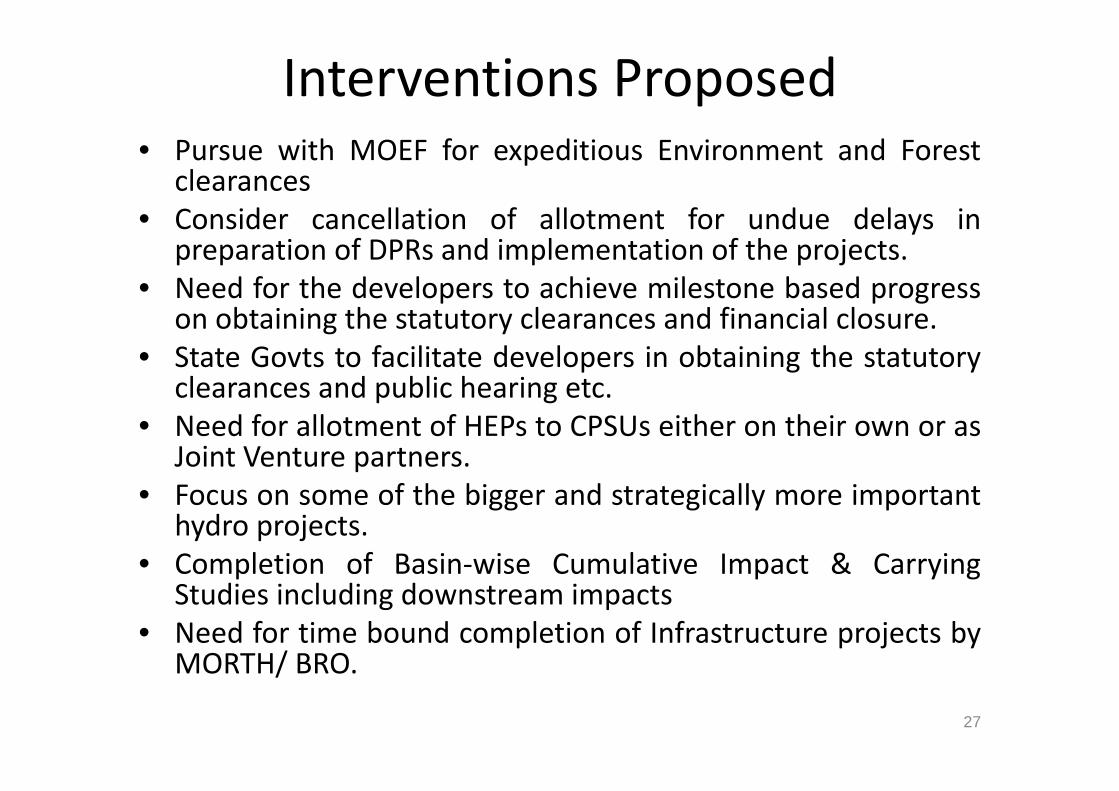
Interventions Proposed• Pursue with MOEF for expeditious Environment and Forest
clearances• Consider cancellation of allotment for undue delays in
preparation of DPRs and implementation of the projects.• Need for the developers to achieve milestone based progress
on obtaining the statutory clearances and financial closure.• State Govts to facilitate developers in obtaining the statutory
clearances and public hearing etc.• Need for allotment of HEPs to CPSUs either on their own or as
Joint Venture partners.• Focus on some of the bigger and strategically more important
hydro projects.• Completion of Basin-wise Cumulative Impact & Carrying
Studies including downstream impacts• Need for time bound completion of Infrastructure projects by
MORTH/ BRO.
27

Targeted Capacity Addition during XIIth Plan… 5596 MW
28
Project 2012-13 2013-14 2014-15 2015-16 2016-17Arunachal Pradesh1710 MW
Pare HEP 110Kameng HEP 600Subansiri HEP 1000
Assam850 MW
Bongaigaon TPS 500 250Namrup CCGT 100
Meghalaya82 MW
New Umtru HEP 40Myntdu St-I HEP addl Unit 42
Mizoram60 MW Tuirial HEP 60
Sikkim2066 MW
Bhasmey HEP 51Jorethang Loop HEP 96
Rangit-IV HEP 120Teesta-VI HEP 500Teesta-III HEP 1200Chujachen HEP 99
Tripura 828 MW
Tripura CCGT 363.3 363.3Monarchak CCGT 101
Total 405 463 1717 1101 1910
28