Embed Size (px)
Citation preview

THESIS FOR THE DEGREE OF DOCTOR OF PHILOSOPHY
The Power Quality of Wind Turbines
ÅKE LARSSON
Department of Electric Power EngineeringCHALMERS UNIVERSITY OF TECHNOLOGY
Göteborg, Sweden 2000

The Power Quality of Wind TurbinesÅKE LARSSONISBN 91-7197-970-0
© ÅKE LARSSON, 2000.
Doktorsavhandlingar vid Chalmers tekniska högskolaNy serie nr 1654ISSN 0346-718x
School of Electrical and Computer EngineeringTechnical Report No. 392
Department of Electric Power EngineeringChalmers University of TechnologySE-412 96 GöteborgSwedenTelephone + 46 (0) 31-772 1000
Chalmers bibliotek, ReproserviceGöteborg, Sweden 2000

The Power Quality of Wind turbinesÅke LarssonDepartment of Electric Power EngineeringChalmers University of Technology
AbstractThe power quality of wind turbines is dealt with in this dissertation. The thesis consists
of four parts. The first part describes the electrical systems used in wind turbines. The
second part presents the results of measurements of different types of wind turbines
connected to different types of grids. The measurements include voltage and frequency
variations, flicker, transients and harmonics. The third part deals with future standards
for measuring and testing wind turbine power quality. In the last part, regulatory
requirements concerning the power quality of wind turbines are discussed. Special
emphasis has been given to flicker and flicker calculations according to new
recommendations for the grid connection of wind turbines.
The operation of wind turbines has an impact on the power quality of the connected grid. Depending on
the grid configuration and the type of wind turbine used, different power quality problems may arise. All
wind turbines have an uneven power production following the natural variations of the wind. If the wind
turbine is operating at fixed-speed, the tower shadow and wind speed gradients will result in fluctuating
power. The power fluctuations caused by the turbine may cause flicker disturbances. In order to evaluate
the significance of flicker, measurements and subsequent flicker calculations must be performed. In the
case of variable-speed wind turbines, one drawback is the injection of harmonic currents into the grid.
Depending on the type of inverter used, different orders of harmonics are produced.
The new recommendations provide tools for predicting the interaction between wind
turbines and the grid. Wind turbines which, in combination with the grid, are likely to
cause power quality problems can at an early stage of planning be rejected and replaced
by a more proper type of wind turbine.
Keywords: Power quality, wind turbines, measurements, flicker, frequency variations

List of Publications
This thesis is based on the work contained in the following journal and conference
papers:
Paper 1A: Å. Larsson, O. Carlson, G. Sidén, ”Electrical Generating Systems in
Wind Turbine Applications”. Stockholm Power Tech, Stockholm,
Sweden, 18-22 June 1995, Proceedings, Vol. Electrical Machines and
Drives, p. 205 - 210.
Paper 1B: Å. Larsson, ”Power Quality of Wind Turbine Generating Systems and
their Interaction with the Grid”, Technical Report No. 4R, Department of
Electric Power Engineering, Chalmers University of Technology,
Göteborg, Sweden, 1997.
Paper 2A: Å. Larsson, T. Thiringer, ”Measurements on and Modelling of Capacitor-
Connecting Transients on a Low-Voltage Grid Equipped with Two Wind
Turbines”. International Conference on Power System Transients (IPST
'95), Lisbon, Portugal, 3-7 September 1995, Proceedings, p. 184 - 188.
Paper 2B: Å. Larsson, ”Voltage and Frequency Variations on Autonomous Grids: A
Comparison of Two Different Wind-Diesel Systems”. European Union
Wind Energy Conference (EUWEC '96), Göteborg, Sweden, 20-24 May
1996, Proceedings, p. 317 - 320.
Paper 2C: Å. Larsson, ”Flicker and Slow Voltage Variations from Wind Turbines”.
International Conference on Harmonics and Quality of Power (ICHQP
'96), Las Vegas, USA, 16 - 18 October 1996, Proceedings, p. 270 - 275.
Paper 2D: Å. Larsson, P Sørensen, F. Santjer, “Grid Impact of Variable-Speed Wind
Turbines”, European Wind Energy Conference (EWEC '99), Nice,
France, 1-5 Mars 1999, Proceedings, p. 786 - 789.
Paper 3A: P Sørensen, G. Gerdes, R. Klosse, F. Santjer, N. Robertson, W. Davy, M.
Koulouvari, E. Morfiadakis, Å. Larsson, “Standards for Measurements

and Testing of Wind Turbine Power Quality”, European Wind Energy
Conference (EWEC '99), Nice, France, 1-5 Mars 1999, Proceedings, p.
721 - 724.
Paper 4A: Å. Larsson, “Guidelines for Grid Connection of Wind Turbines”, 15th
International Conference on Electricity Distribution (CIRED ´99), Nice,
France, 1-4 June, 1999.
Paper 4B: Å. Larsson, “Flicker Emission of Wind Turbines During Continuos
Operations”, submitted to IEEE Transactions on Energy Conversion,
2000.
Paper 4C: Å. Larsson, “Flicker Emission of Wind Turbines Caused by Switching
Operations”, submitted to IEEE Transactions on Energy Conversion,
2000.

Preface
The work involved in this thesis has been carried out at the Department of Electric
Power Engineering of Chalmers University of Technology. The research has been
funded through the EU-Joule II program and by Elforsk AB. The financial support
given is gratefully acknowleged.
I would like to thank Dr Ola Carlson who initiated this research project and my
examiner Professor Jaap Daalder for valuable comments, fruitful discussions and for
persistently revising the manuscript. I also wish to thank Poul Sørensen for his
support and encouraging guidance during my three month guest research-work at
Risø National Laboratory.
The work presented is partly based on field measurements. I would like to thank the
wind turbine manufacturers who have supported me with data; the owners of wind
turbines who have given me the opportunity to perform measurements on their wind
turbines; and Göteborg Energi AB, Varberg Energi AB and Gotland Energi AB for
their cooperation in performing field measurements in their grid.
Finally, I would like to thank all the colleagues at the Department of Electric Power
Engineering for a pleasant working atmosphere.


Contents
Abstract
Preface
1 Introduction 1
2 Wind Turbine Performance and Design 5
2.1 Turbine 5
2.2 Fixed-speed Wind Turbines 7
2.3 Variable-speed Wind Turbines 8
3 Electrical Systems in Wind Turbine Generator Systems 11
3.1 Fixed Speed 11
3.2 Variable Speed 12
3.2.1 Narrow Speed Range 13
3.2.2 Broad Speed Range 14
4 Power Quality of Wind Turbines 17
4.1 Voltage Variations 18
4.2 Flicker 20
4.2.1 Continuous Operation 21
4.2.2 Switching Operations 22
4.3 Harmonics 26
4.4 Transients 28
4.5 Frequency 29
5 Contributions and Conclusions 33
5.1 Short Summaries of Papers which are Part of the Thesis 33
5.2 Conclusions 40
5.3 Future Research 41
References 43


1
1 Introduction
Wind power has developed dramatically. In 1999, more than 10 000 MW of wind
power capacity was installed worldwide, during this year the world has installed more
new wind power capacity than nuclear capacity. The global perspectives for wind power
seem to be quite good. In 1999, the U.S. Department of Energy announced the ”Wind
Powering America” initiative which sets a goal of 80 000 MW of wind power by the
year 2020. Such an amount of wind power corresponds to approximately 5% of the U.S.
electricity consumption. The European Commission’s white paper ”Energy for the
Future - Renewable Energy Sources” presented in late 1997, targets 40 000 MW of
wind power by 2010. At the end of 1999, Germany had almost 4 500 MW of wind
power installed of which 1 500 MW was installed during that year. In Denmark, wind
power is expected to cover 13% of the electricity consumption in 2000 if it turns out to
be an average wind year. A Danish energy plan says that 15 to 16% of the Danish
electricity consumption should come from wind power by the end of 2002. By 2030,
50% of the Danish electricity consumption should come from renewable, in particular,
4 000 MW of offshore wind power.
As a result of the growth of installed capacity, the wind power industry is one of the
fastest expanding industries. New statistics from the Danish Wind Turbine
Manufacturers Association show that production has increased six-fold in the course of
the last five years, corresponding to an annual growth rate of 44% per year. German
wind turbine export has also showed a clearly positive trend in 1999 with a growth rate
of 42% as compared with 1998. Andersen [1] concludes; (i) that wind power over the
last 20 years has become a competitive technology for clean energy production, (ii) that
wind power will provide two digit percentages in many countries’ electricity supply and
(iii) there is no reason why wind power should not become as important to the world’s
future energy supply as nuclear power is today.
The question that needs to be raised is how wind power will affect both the distribution
network and the whole grid. The role of the distribution networks is mainly confined to
the interconnection between generation and transmission systems on one side and load
centers on the other side. Consequently, such networks are described as “passive”

2
networks. However, the integration of wind power into distribution networks will
transform them from being passive to active networks. Various published work is
related to this subject; [2 – 10] have shown that generators embedded into distribution
networks can affect operation in such networks in a number of ways. These studies have
shown that embedded generators; (i) can increase the fault levels to a degree that makes
reinforcement mandatory, (ii) require new protection practices in order to provide
protection to the network against abnormal conditions including faults and islanding
conditions, (iii) affect the losses of distribution networks, (iv) introduce stability
problems and (v) cause power quality problems.
Power quality relates to factors which describe the variability of the voltage level, as
well as the distortion of voltage and current waveforms. The various power quality
parameters fall into different categories, according to the time scale of the phenomena
examined. A great number of works related to power quality have been published. Van
Vyk [11] gives a brief historical introduction of power quality which includes a selected
biography of 300 literature references. When it comes to the power quality of embedded
generators, in general, and wind turbines, in particular, only some specific power
quality problems are relevant. Some examples of published works covering this field
are; the power quality improvements of wind farms [12], power quality improvements
of wind parks using advanced static var compensators [13] and power quality and grid
connection of wind turbines [14]. The power quality of wind turbines can be subdivided
into different phenomena. Examples of published works dealing with different power
quality phenomena are; load flow calculations [15], flicker [16], harmonics [17],
lightning protection and over voltages [18]. There has also been work published
concerning international standards for the power quality of wind turbines [19] and
measurement systems for power quality measurements of wind turbines [20].
This thesis focuses on the power quality of wind turbines. The work has been performed
in two different projects. The first project was financed by the European Union and the
aim of the project, Power Quality of Wind Turbine Generation Systems and Their
Interaction with the Grid, was to increase the general understanding of the interaction
between wind turbines and the grid. The three principal objectives of the project were;

3
(i) the identification of current knowledge and clarification of regulatory requirements,
(ii) the definition of appropriate power quality measures in the context of wind turbines
and the development of related measurement procedures, (iii) the measurement and
analysis of power quality at a limited range of sites of varying grid stiffness. The project
concentrated mainly on steady-state measurements.
The objective of the second project was to study dynamic and transient phenomena of
wind turbines and to contribute to the development of a new Swedish recommendation
for the grid connection of wind turbines. In the project, dynamic and transient
measurements were performed on four different types of wind turbines. The
measurements and subsequent calculations have been used to verify the power quality
caused by the turbines.
This thesis consists of a summarizing part followed by the appended journal and
conference papers which constitute the main part of the thesis. The first summarizing
part contains a short discussion of wind turbine concepts, such as wind turbine
performance, design and electrical systems used in wind turbines operating at fixed-
speed and variable-speed. The first summarizing part also includes a discussion of the
power quality of wind turbines. Comments are made on the included papers and some
conclusions are drawn.
The second part of the report consists of ten papers which are divided into four sections.
The first section is an introduction to electrical systems and the power quality of wind
turbines. The second section presents measurements of different types of wind turbines
connected to different types of grids. The measurements include voltage and frequency
variations, flicker, transients and harmonics. The third section deals with standards for
measuring and testing wind turbine power quality. In the last section, regulatory
requirements concerning the power quality of wind turbines are discussed. Special
emphasis is given to flicker and flicker calculations according to Danish and Swedish
recommendations for the grid connection of wind turbines and the draft of IEC 61400-
21.

4

5
2 Wind Turbine Performance and Design
The wind has been used to power sailing ships for many centuries. On land, wind
turbines date back to the middle of the seventh century A.D. The earliest recorded
English wind turbine dates from A.D. 1191. The first corn-grinding wind turbine was
built in The Netherlands in 1439. Denmark was the first country to use wind turbines
for the generation of electricity. In 1890, a wind turbine with a diameter of 23 meters
was used for that purpose. By 1910, several hundred units with a capacity of 5 to 25 kW
were in operation in Denmark [21].
A strong interest in renewable energy sources started in the mid 1970s when concerns
about the environmental effects of fossil energy sources coincided with the OPEC oil
embargoes. Wind turbine technology has matured during the last 25 years and is today
an accepted technology.
2.1 Turbine
Wind turbines generate power by converting the kinetic energy in the air into rotating
mechanical power. The most common wind turbine is of the horizontal-axis propeller
type with two or three blades mounted on the top of a tower. The number of blades on a
wind turbine is not an easy design choice. Two blades cost less than three blades, but
two-bladed wind turbines must operate at higher rotational speeds than three-bladed
wind turbines. As a result, the individual blades in a two bladed wind turbine need to be
lighter and stiffer and are therefore more expensive [22].
The power of the wind in an area, A, perpendicular to the wind direction is given by the
formula [21]:
3
2
1vAP ⋅⋅⋅= ρ (1)
where P is the power, ρ is the air density and v is the wind speed. The fraction of the
wind captured by a wind turbine is given by a factor, Cp, called the power coefficient.
The value of the power coefficient has a theoretical Betz limit of 59.3%.
The design of wind turbines is governed by the need to withstand mechanical loads.
Most wind power sites experience high wind speeds only during a few hours per year
6
and some form of power regulation is necessary if a design is to be economical. The
aerodynamic design can be regulated either by designing the blades to go into an
aerodynamic stall above a certain wind speed or by designing the blades as feathered in
order to spill the unwanted power. The first method is called stall-regulation; the second
method is called pitch-control. One advantage of stall-regulation is the simplified
mechanical design which allows the blades to be attached rigidly to the hub. In addition,
stall-regulation will not permit power excursions from gusty winds to pass through the
drive train. The disadvantages are the technical difficulties of aerodynamic stall design,
the need for a rotor brake, motor driven start and more aerodynamic noise [23].
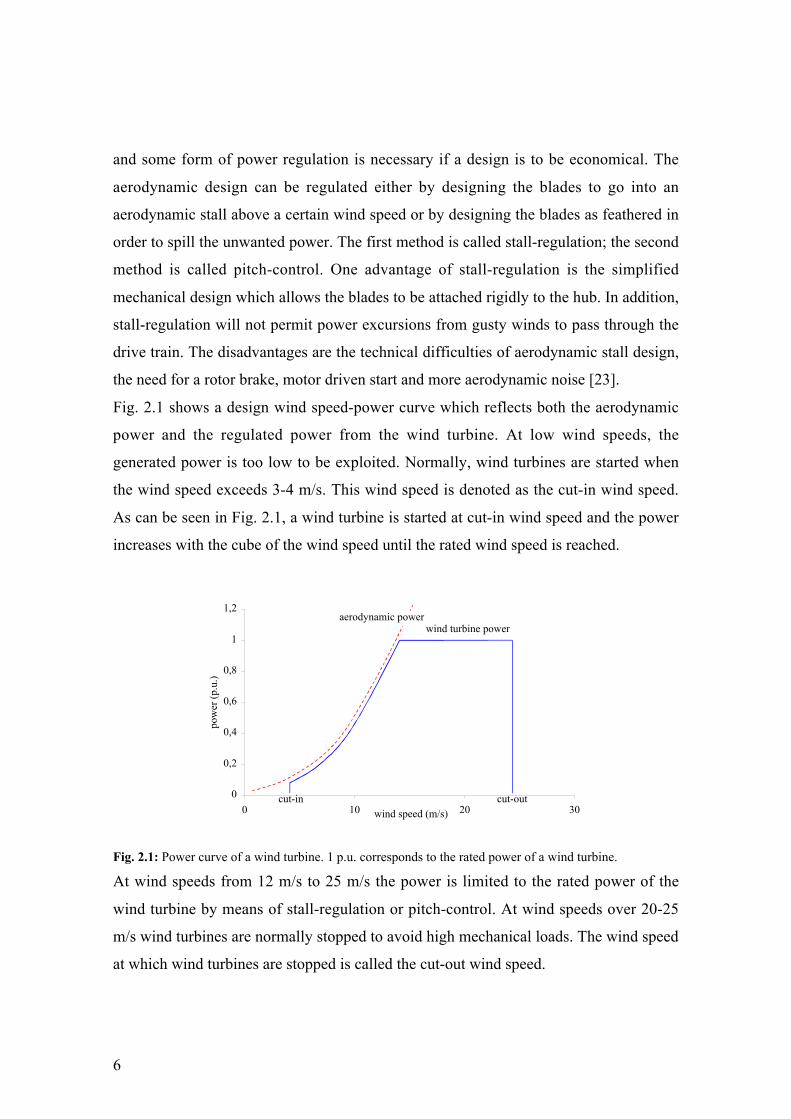
Fig. 2.1 shows a design wind speed-power curve which reflects both the aerodynamic
power and the regulated power from the wind turbine. At low wind speeds, the
generated power is too low to be exploited. Normally, wind turbines are started when
the wind speed exceeds 3-4 m/s. This wind speed is denoted as the cut-in wind speed.
As can be seen in Fig. 2.1, a wind turbine is started at cut-in wind speed and the power
increases with the cube of the wind speed until the rated wind speed is reached.
0
0,2
0,4
0,6
0,8
1
1,2
0 10 20 30wind speed (m/s)
pow
er (
p.u.
)
cut-outcut-in
wind turbine poweraerodynamic power
Fig. 2.1: Power curve of a wind turbine. 1 p.u. corresponds to the rated power of a wind turbine.
At wind speeds from 12 m/s to 25 m/s the power is limited to the rated power of the
wind turbine by means of stall-regulation or pitch-control. At wind speeds over 20-25
m/s wind turbines are normally stopped to avoid high mechanical loads. The wind speed
at which wind turbines are stopped is called the cut-out wind speed.
7
2.2 Fixed-speed Wind Turbines
The generator in fixed-speed wind turbines is of the induction type connected directly to
the grid. Synchronous generators have been used in some early prototypes but the
induction machine has been more widely adopted because of lower cost, improved
environmental durability and a superior mechanical compatibility with rapid wind
variations. The generator together with a gearbox are placed in a nacelle on the top of
the tower. The function of the gearbox is to change the low rotational speed of the
turbine to a high rotational speed on the generator side. The rotational speed of an
induction generator is typically 1000 or 1500 rpm [24]. The turbine speed is dependent
on the rotor diameter, for example a 200 kW turbine has a rotational speed of
approximately 50 rpm, while the rotational speed of a 1 000 kW turbine is
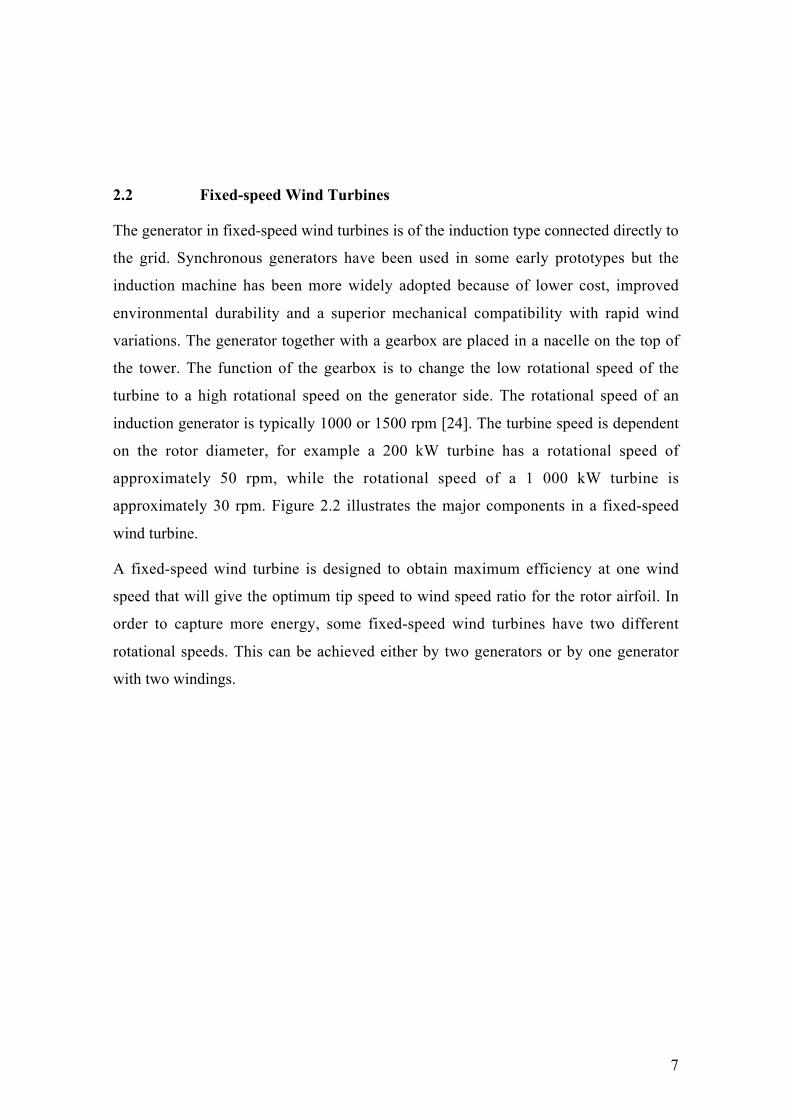
approximately 30 rpm. Figure 2.2 illustrates the major components in a fixed-speed
wind turbine.
A fixed-speed wind turbine is designed to obtain maximum efficiency at one wind
speed that will give the optimum tip speed to wind speed ratio for the rotor airfoil. In
order to capture more energy, some fixed-speed wind turbines have two different
rotational speeds. This can be achieved either by two generators or by one generator
with two windings.
8
tower
generator
gearbox
low speed shaft
high speed shaft
nacelle
hub
turbine blade
Fig. 2.2: Schematic figure of a typical fixed-speed wind turbine illustrating the major components.
2.3 Variable-speed Wind Turbines
The construction and the major components in wind turbines operating within a narrow
variable-speed range are similar to fixed-speed wind turbines. Wind turbines operating
within a narrow speed range normally have a double-fed induction generator with a
converter connected to the rotor circuit. Since the rotational speed of the generator
varies around 1000 or 1500 rpm a gearbox is required.
Wind turbines operating within a broad variable-speed range are equipped with a
frequency converter. The use of a frequency converter makes it possible to use a direct-
driven generator. A direct-driven generator with a large diameter can operate at a very
low speed and does not need a gearbox. The use of a direct-driven generator makes it
possible to simplify the nacelle design. In a conventional fixed-speed wind turbine, the
gear and the generator must be mounted on a stiff bed plate and aligned precisely. A
direct-driven generator can be integrated with the nacelle so that the generator housing
9
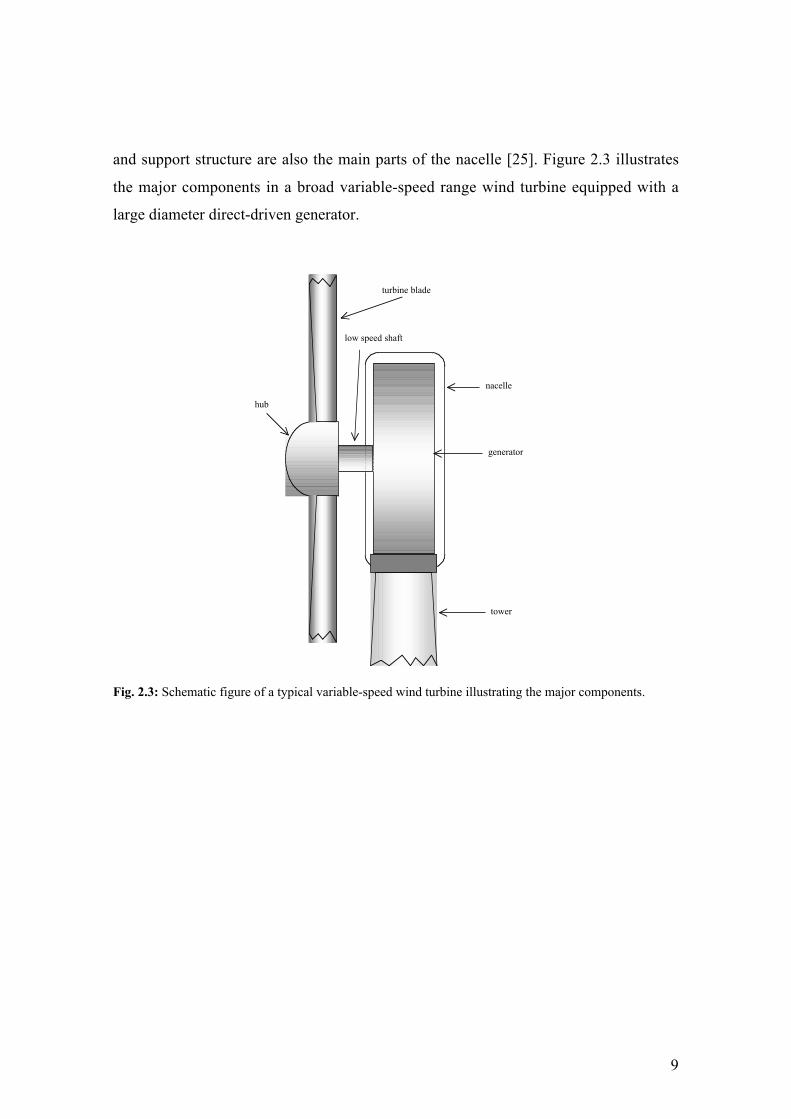
and support structure are also the main parts of the nacelle [25]. Figure 2.3 illustrates
the major components in a broad variable-speed range wind turbine equipped with a
large diameter direct-driven generator.
tower
generator
low speed shaft
nacelle
hub
turbine blade
Fig. 2.3: Schematic figure of a typical variable-speed wind turbine illustrating the major components.

10
11
3 Electrical Systems in Wind Turbine Generator Systems
Electrical systems in wind turbine generator systems can be divided into two main
groups, i.e., fixed speed and variable speed. Fixed-speed wind turbines, equipped with
a generator connected directly to the grid, are the most common type. The major
advantage of the fixed-speed turbine is the simplicity and the low price of the electrical
system used.
Variable-speed wind turbines are today not as common as fixed-speed wind turbines,
although in the future they will most likely be the dominating type. The advantages of
using variable-speed turbines are increased power quality, noise reduction and reduced
mechanical stress on the wind turbine. Variable-speed wind turbines are equipped with
a converter, which allows the generator frequency to differ from the grid frequency.
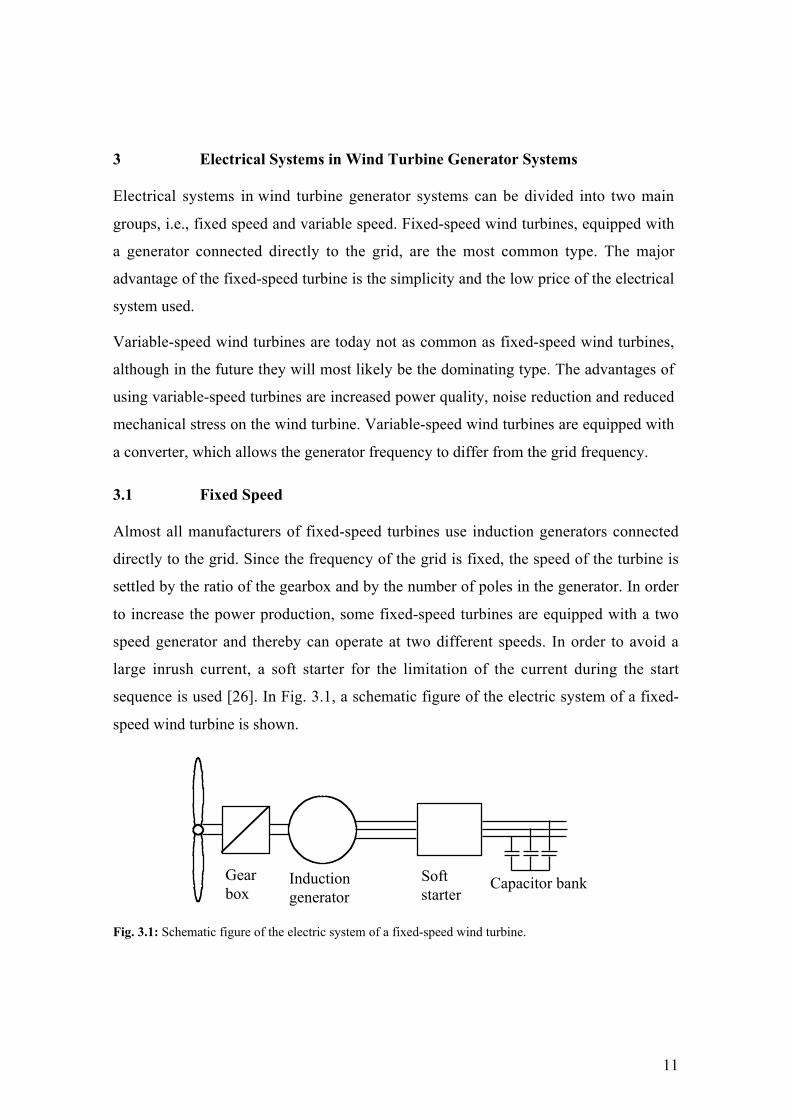
3.1 Fixed Speed
Almost all manufacturers of fixed-speed turbines use induction generators connected
directly to the grid. Since the frequency of the grid is fixed, the speed of the turbine is
settled by the ratio of the gearbox and by the number of poles in the generator. In order
to increase the power production, some fixed-speed turbines are equipped with a two
speed generator and thereby can operate at two different speeds. In order to avoid a
large inrush current, a soft starter for the limitation of the current during the start
sequence is used [26]. In Fig. 3.1, a schematic figure of the electric system of a fixed-
speed wind turbine is shown.
Gearbox
Softstarter
Inductiongenerator
Capacitor bank
Fig. 3.1: Schematic figure of the electric system of a fixed-speed wind turbine.
12
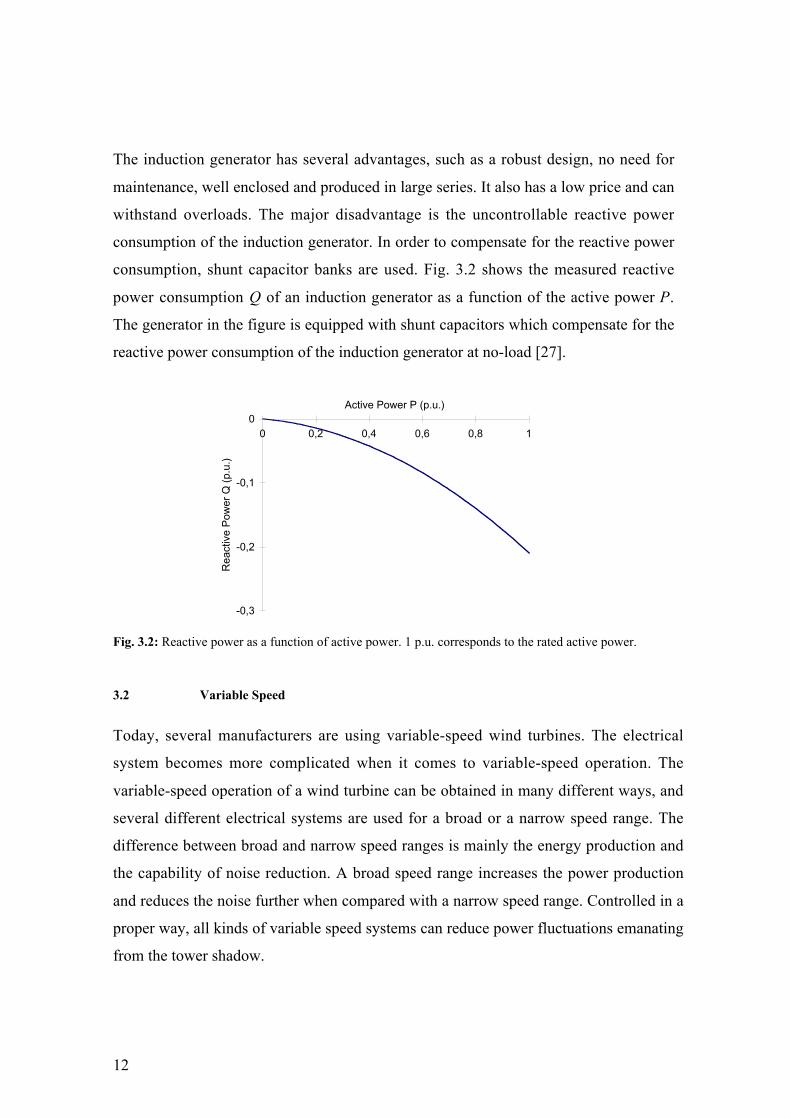
The induction generator has several advantages, such as a robust design, no need for
maintenance, well enclosed and produced in large series. It also has a low price and can
withstand overloads. The major disadvantage is the uncontrollable reactive power
consumption of the induction generator. In order to compensate for the reactive power
consumption, shunt capacitor banks are used. Fig. 3.2 shows the measured reactive
power consumption Q of an induction generator as a function of the active power P.
The generator in the figure is equipped with shunt capacitors which compensate for the
reactive power consumption of the induction generator at no-load [27].
-0,3
-0,2
-0,1
00 0,2 0,4 0,6 0,8 1
Active Power P (p.u.)
Rea
ctiv
e P
ower
Q (
p.u.
)
Fig. 3.2: Reactive power as a function of active power. 1 p.u. corresponds to the rated active power.
3.2 Variable Speed
Today, several manufacturers are using variable-speed wind turbines. The electrical
system becomes more complicated when it comes to variable-speed operation. The
variable-speed operation of a wind turbine can be obtained in many different ways, and
several different electrical systems are used for a broad or a narrow speed range. The
difference between broad and narrow speed ranges is mainly the energy production and
the capability of noise reduction. A broad speed range increases the power production
and reduces the noise further when compared with a narrow speed range. Controlled in a
proper way, all kinds of variable speed systems can reduce power fluctuations emanating
from the tower shadow.
13
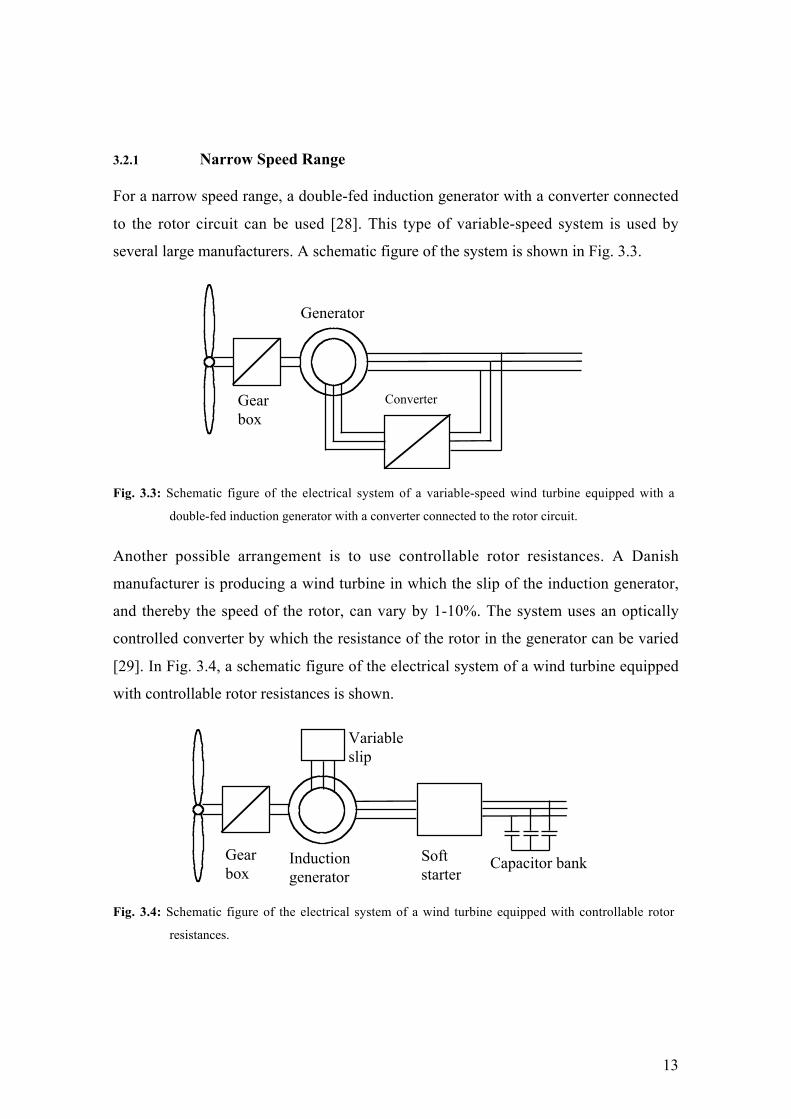
3.2.1 Narrow Speed Range
For a narrow speed range, a double-fed induction generator with a converter connected
to the rotor circuit can be used [28]. This type of variable-speed system is used by
several large manufacturers. A schematic figure of the system is shown in Fig. 3.3.
Gearbox
Inverter
Generator
Fig. 3.3: Schematic figure of the electrical system of a variable-speed wind turbine equipped with a
double-fed induction generator with a converter connected to the rotor circuit.
Another possible arrangement is to use controllable rotor resistances. A Danish
manufacturer is producing a wind turbine in which the slip of the induction generator,
and thereby the speed of the rotor, can vary by 1-10%. The system uses an optically
controlled converter by which the resistance of the rotor in the generator can be varied
[29]. In Fig. 3.4, a schematic figure of the electrical system of a wind turbine equipped
with controllable rotor resistances is shown.
Gearbox
Softstarter
Inductiongenerator
Capacitor bank
Variableslip
Fig. 3.4: Schematic figure of the electrical system of a wind turbine equipped with controllable rotor
resistances.
Converter
14
3.2.2 Broad Speed Range
Broad-range variable-speed systems are equipped with a frequency converter. In such a
system, the alternating current from the generator first needs to be rectified and then
inverted into alternating current before being fed into the grid. The electrical system
must, therefore, consist of three main parts: generator, rectifier and inverter. The choice
of these three main parts can be subdivided into two almost independent choices. The
generator and rectifier must be chosen as a combination and the inverter can be chosen
almost independently of the generator and rectifier used. Some broad-range, variable-
speed systems have no gearbox. Systems without a gearbox normally have a direct-
driven multipole generator with a large diameter. The generator can be an electrically
excited or permanent magnet excited synchronous type. A German manufacturer uses a
large diameter generator that is an electrically excited synchronous type.
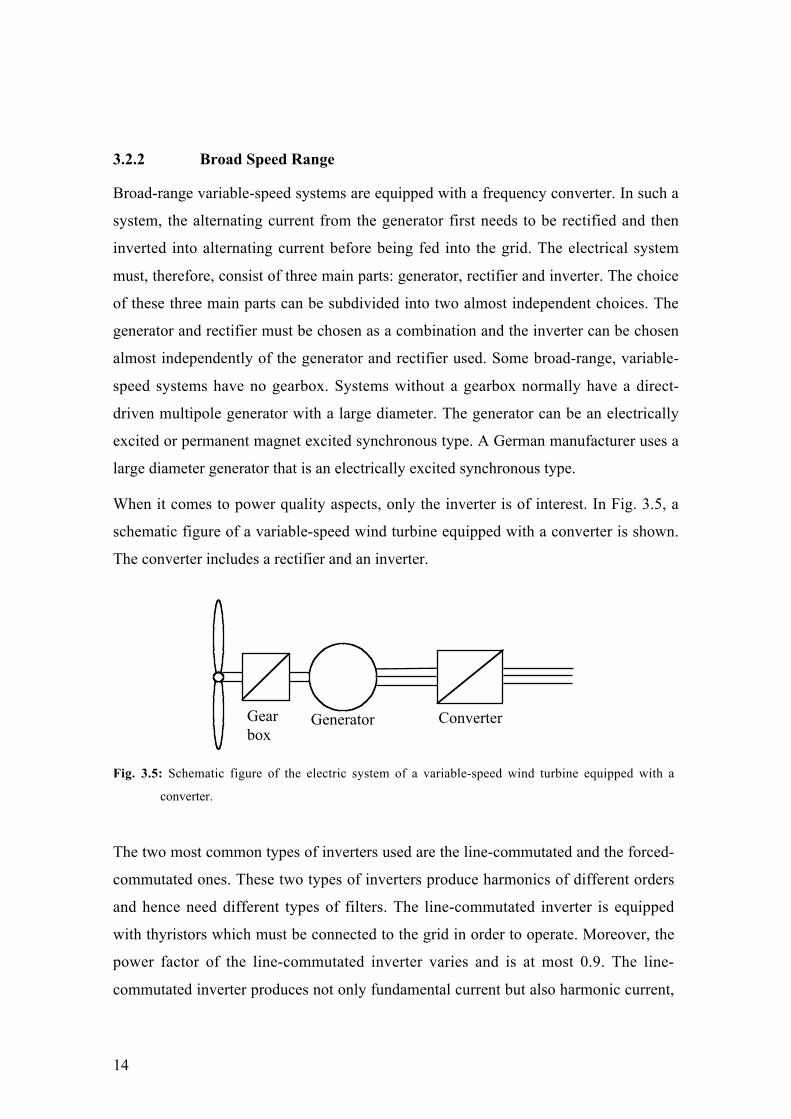
When it comes to power quality aspects, only the inverter is of interest. In Fig. 3.5, a
schematic figure of a variable-speed wind turbine equipped with a converter is shown.
The converter includes a rectifier and an inverter.
Gearbox
ConverterGenerator
Fig. 3.5: Schematic figure of the electric system of a variable-speed wind turbine equipped with a
converter.
The two most common types of inverters used are the line-commutated and the forced-
commutated ones. These two types of inverters produce harmonics of different orders
and hence need different types of filters. The line-commutated inverter is equipped
with thyristors which must be connected to the grid in order to operate. Moreover, the
power factor of the line-commutated inverter varies and is at most 0.9. The line-
commutated inverter produces not only fundamental current but also harmonic current,
15
which will cause voltage harmonics in the grid. A six-pulse line-commutated inverter
produces odd harmonics which are not multiples of 3. If the RMS value of the
fundamental current is I(1)=1 p.u., the relative RMS values of the harmonics become
I(n)=1/n p.u. where n=5, 7, 11, 13, 17, 19, ... [30]. A large grid filter must be used to
eliminate these harmonics. A positive effect of a grid filter is that the filter produces
reactive power. This production of reactive power increases the power factor of the
wind turbine generator system.
In a forced-commutated inverter it is possible to freely choose when to turn on and
when to turn off the valves. This possibility means that the forced-commutated inverter
can create its own three-phase voltage system. If the inverter is connected to the grid,
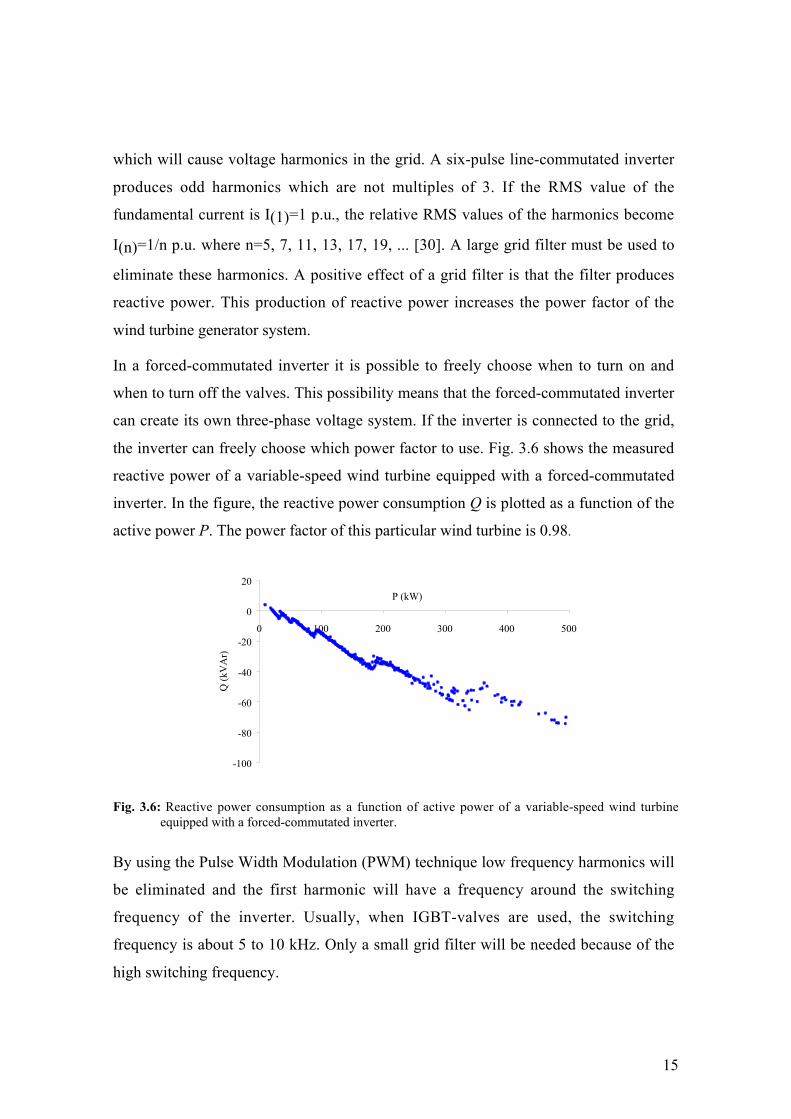
the inverter can freely choose which power factor to use. Fig. 3.6 shows the measured
reactive power of a variable-speed wind turbine equipped with a forced-commutated
inverter. In the figure, the reactive power consumption Q is plotted as a function of the
active power P. The power factor of this particular wind turbine is 0.98.
-100
-80
-60
-40
-20
0
20
0 100 200 300 400 500
P (kW)
Q (
kVA
r)
Fig. 3.6: Reactive power consumption as a function of active power of a variable-speed wind turbineequipped with a forced-commutated inverter.
By using the Pulse Width Modulation (PWM) technique low frequency harmonics will
be eliminated and the first harmonic will have a frequency around the switching
frequency of the inverter. Usually, when IGBT-valves are used, the switching
frequency is about 5 to 10 kHz. Only a small grid filter will be needed because of the
high switching frequency.

16
17
4 Power Quality of Wind Turbines
Perfect power quality means that the voltage is continuous and sinusoidal having a
constant amplitude and frequency. Power quality can be expressed in terms of physical
characteristics and properties of electricity. It is most often described in terms of
voltage, frequency and interruptions. The quality of the voltage must fulfil
requirements stipulated in national and international standards. In these standards,
voltage disturbances are subdivided into voltage variations, flicker, transients and
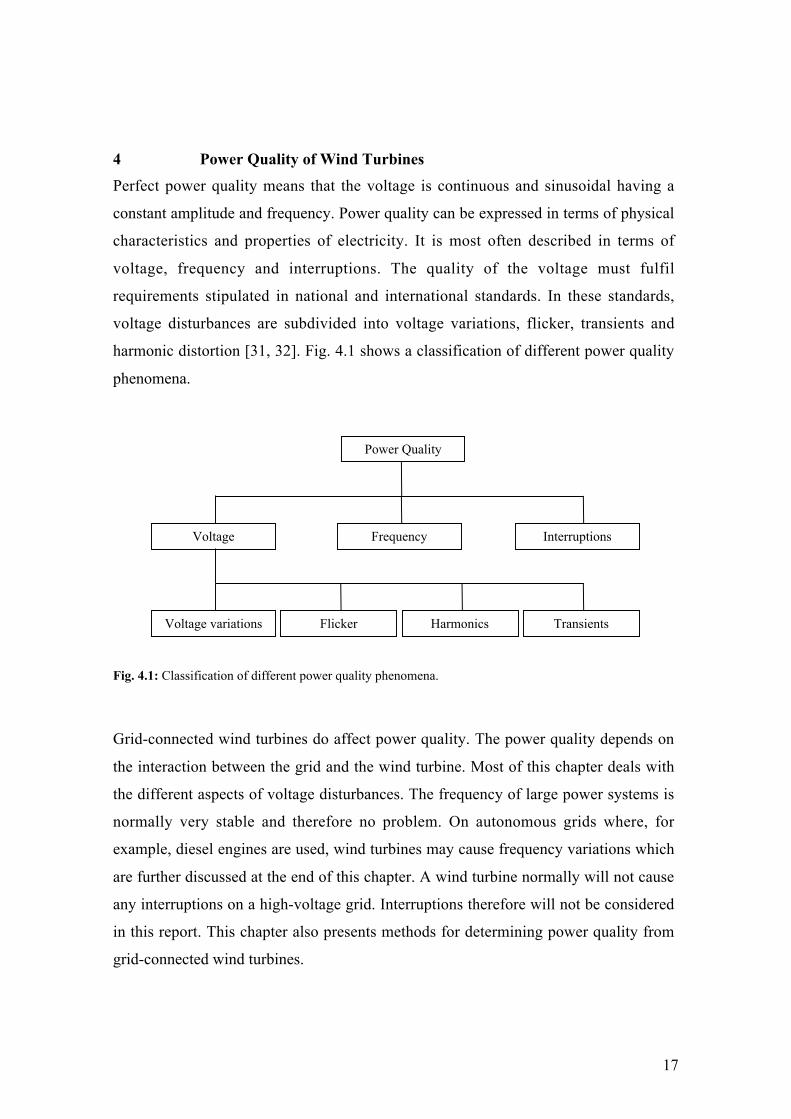
harmonic distortion [31, 32]. Fig. 4.1 shows a classification of different power quality
phenomena.
Power Quality
Voltage Frequency Interruptions
Voltage variations Flicker Harmonics Transients
Fig. 4.1: Classification of different power quality phenomena.
Grid-connected wind turbines do affect power quality. The power quality depends on
the interaction between the grid and the wind turbine. Most of this chapter deals with
the different aspects of voltage disturbances. The frequency of large power systems is
normally very stable and therefore no problem. On autonomous grids where, for
example, diesel engines are used, wind turbines may cause frequency variations which
are further discussed at the end of this chapter. A wind turbine normally will not cause
any interruptions on a high-voltage grid. Interruptions therefore will not be considered
in this report. This chapter also presents methods for determining power quality from
grid-connected wind turbines.
18
4.1 Voltage Variations
Voltage variations can be defined as changes in the RMS value of the voltage occurring
in a time span of minutes or more. National standards often state allowable variations in
nominal voltage over an extended period, for instance 24 hours. IEC Publication 38
recommends 230/400 V as the standard voltage for 50 Hz systems [33]. Under these
conditions, the voltage at the user's terminal must not differ more than ±10% from the
rated voltage.
Voltage variations on the grid are mainly caused by variations in load and power
production units. When wind power is introduced, voltage variations also emanate from
the power produced by the turbine. The power production from wind turbines may vary
widely and not only due to variations in the wind. It may also momentarily go from full
to zero power production in the event of an emergency stop or vice versa at a start under
high wind conditions.
All kinds of wind turbines cause voltage variations. Voltage variations are due to the
variation in the energy content of the wind. Several methods are used to calculate
voltage variations. For example, there are several computer programs for load flow
calculations available on the market. Utility companies use this software for predicting
voltage variations caused by load variations. Load flow calculations can advantageously
be used to calculate variations in the voltage caused by wind turbines. Another
analytical method is simply to calculate the voltage variation caused by the grid
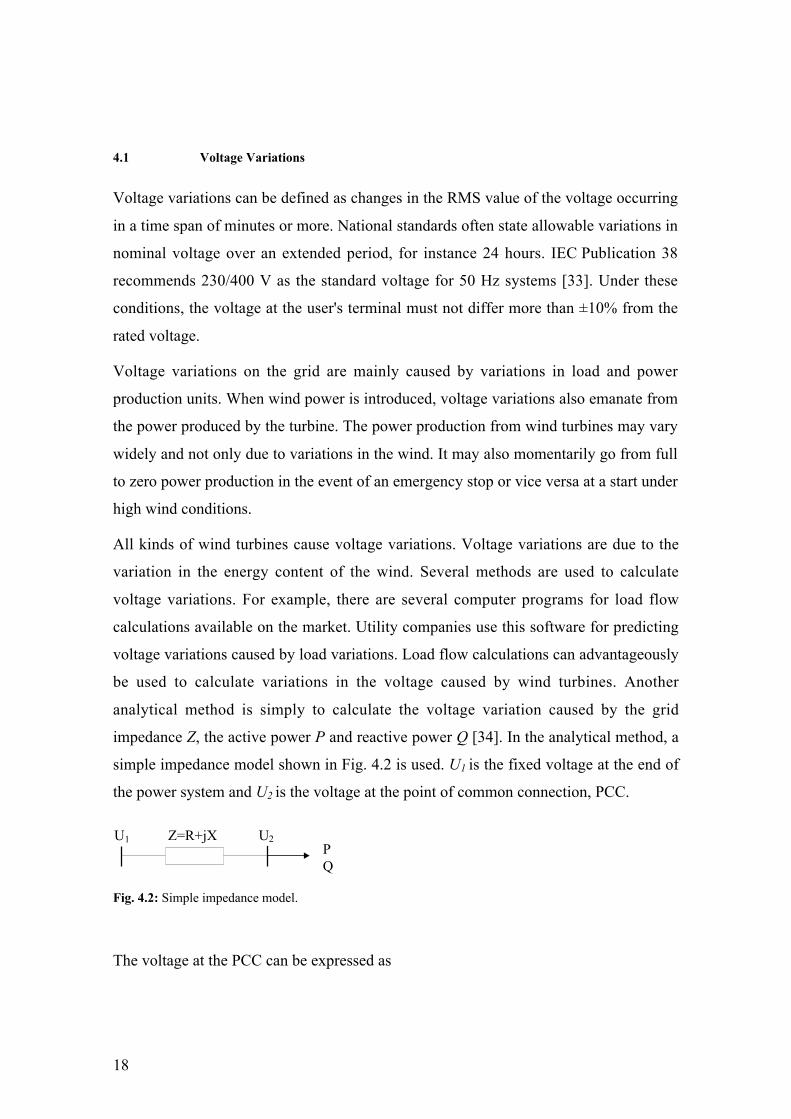
impedance Z, the active power P and reactive power Q [34]. In the analytical method, a
simple impedance model shown in Fig. 4.2 is used. U1 is the fixed voltage at the end of
the power system and U2 is the voltage at the point of common connection, PCC.
Z=R+jX U2U1PQ
Fig. 4.2: Simple impedance model.
The voltage at the PCC can be expressed as
19
U a a b22= + − (2)
where
aU
RP XQ= − +12
2( ) (3)
222 )( ZQPb += (4)
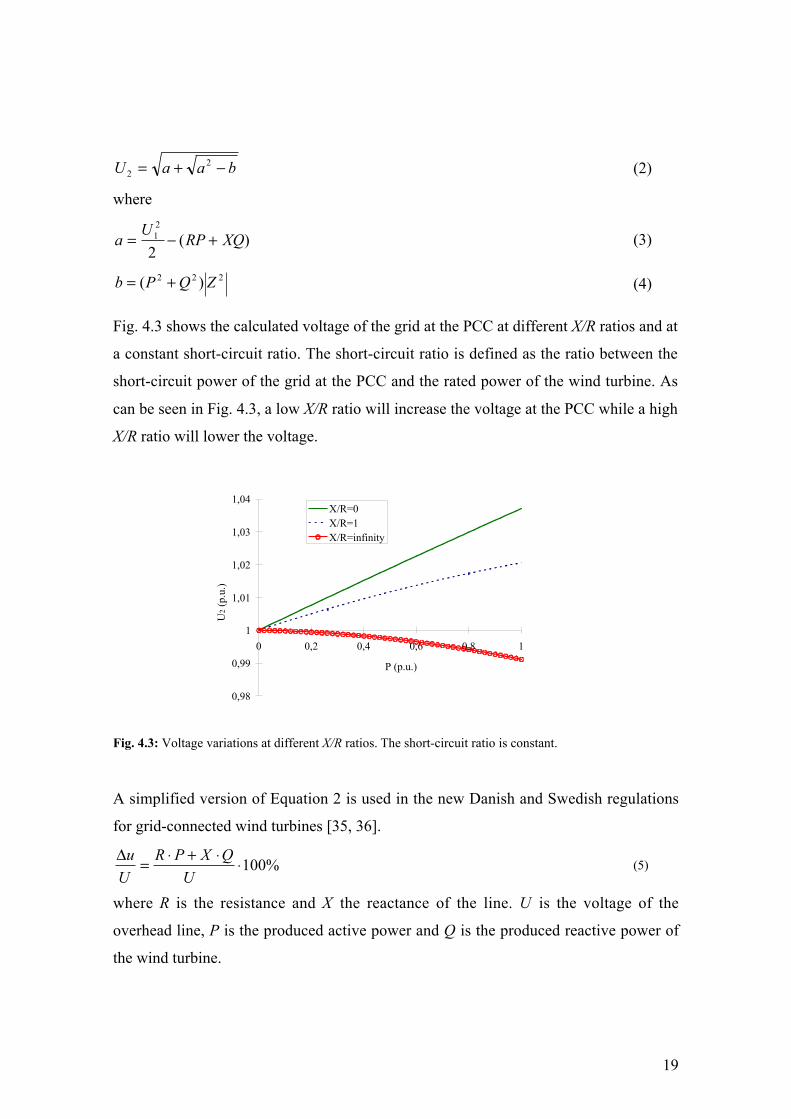
Fig. 4.3 shows the calculated voltage of the grid at the PCC at different X/R ratios and at
a constant short-circuit ratio. The short-circuit ratio is defined as the ratio between the
short-circuit power of the grid at the PCC and the rated power of the wind turbine. As
can be seen in Fig. 4.3, a low X/R ratio will increase the voltage at the PCC while a high
X/R ratio will lower the voltage.
0,98
0,99
1
1,01
1,02
1,03
1,04
0 0,2 0,4 0,6 0,8 1
P (p.u.)
U2
(p.u
.)
X/R=0X/R=1X/R=infinity
Fig. 4.3: Voltage variations at different X/R ratios. The short-circuit ratio is constant.
A simplified version of Equation 2 is used in the new Danish and Swedish regulations
for grid-connected wind turbines [35, 36].
%100⋅⋅+⋅=∆U
QXPR
U
u(5)
where R is the resistance and X the reactance of the line. U is the voltage of the
overhead line, P is the produced active power and Q is the produced reactive power of
the wind turbine.
20
In Denmark and Sweden, voltage variations may not exceed 2,5% for a distribution
feeder. If only wind turbines are connected to a feeder the voltage variation may not
exceed 5%.
4.2 Flicker
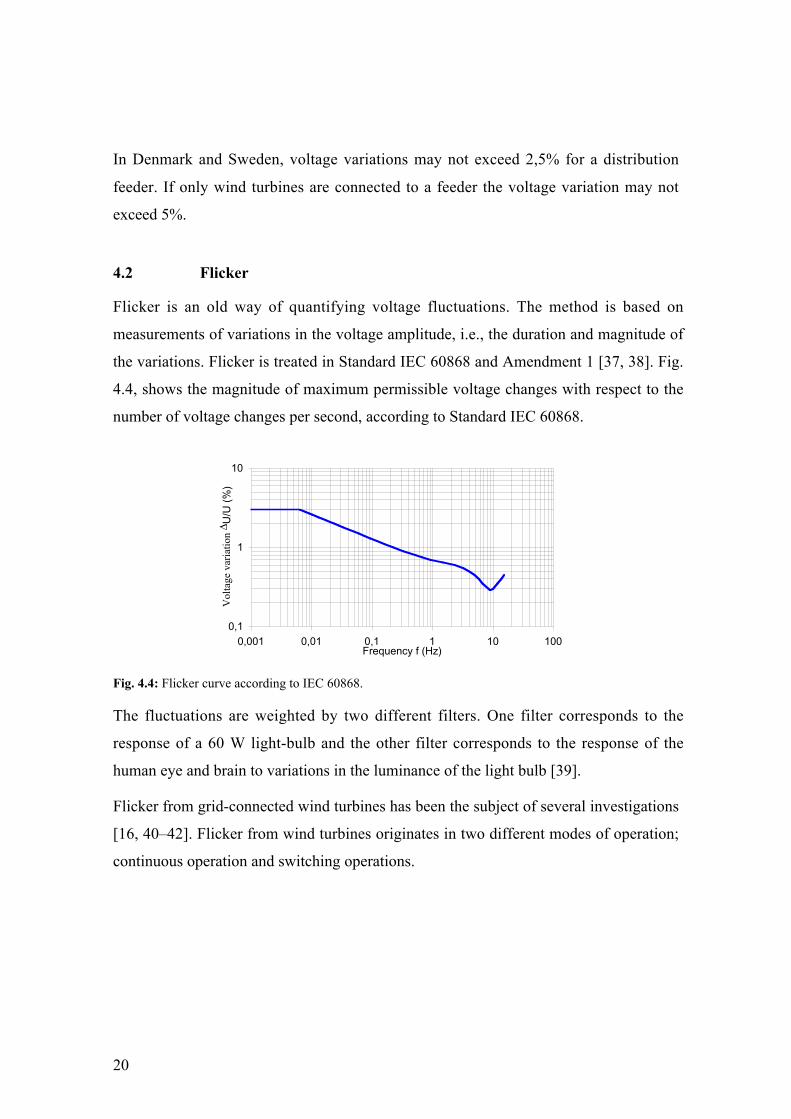
Flicker is an old way of quantifying voltage fluctuations. The method is based on
measurements of variations in the voltage amplitude, i.e., the duration and magnitude of
the variations. Flicker is treated in Standard IEC 60868 and Amendment 1 [37, 38]. Fig.
4.4, shows the magnitude of maximum permissible voltage changes with respect to the
number of voltage changes per second, according to Standard IEC 60868.
0,1
1
10
0,001 0,01 0,1 1 10 100Frequency f (Hz)
Vol
tage
var
iatio
n ∆ U
/U (
%)
Fig. 4.4: Flicker curve according to IEC 60868.
The fluctuations are weighted by two different filters. One filter corresponds to the
response of a 60 W light-bulb and the other filter corresponds to the response of the
human eye and brain to variations in the luminance of the light bulb [39].
Flicker from grid-connected wind turbines has been the subject of several investigations
[16, 40–42]. Flicker from wind turbines originates in two different modes of operation;
continuous operation and switching operations.
21
4.2.1 Continuous Operation
Flicker produced during continuous operation is caused by power fluctuations. Power
fluctuations mainly emanate from variations in the wind speed, the tower shadow effect
and mechanical properties of the wind turbine. Pitch-controlled turbines also have
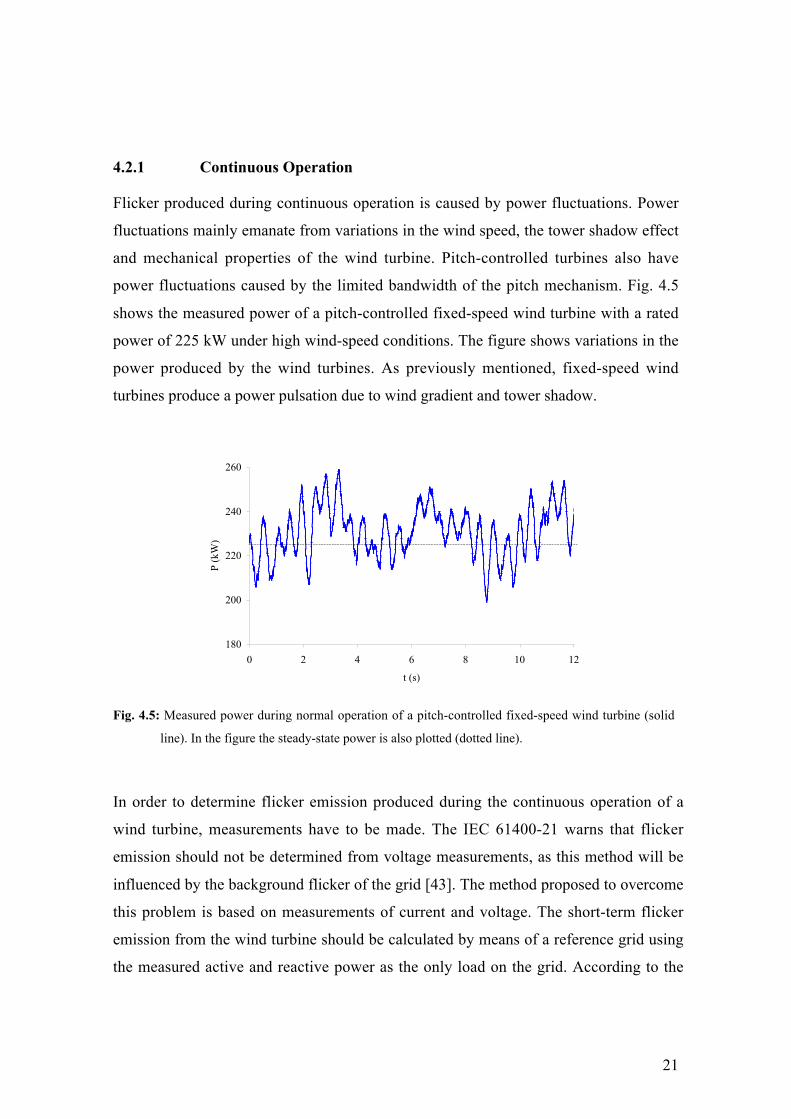
power fluctuations caused by the limited bandwidth of the pitch mechanism. Fig. 4.5
shows the measured power of a pitch-controlled fixed-speed wind turbine with a rated
power of 225 kW under high wind-speed conditions. The figure shows variations in the
power produced by the wind turbines. As previously mentioned, fixed-speed wind
turbines produce a power pulsation due to wind gradient and tower shadow.
180
200
220
240
260
0 2 4 6 8 10 12
t (s)
P (k
W)
Fig. 4.5: Measured power during normal operation of a pitch-controlled fixed-speed wind turbine (solid
line). In the figure the steady-state power is also plotted (dotted line).
In order to determine flicker emission produced during the continuous operation of a
wind turbine, measurements have to be made. The IEC 61400-21 warns that flicker
emission should not be determined from voltage measurements, as this method will be
influenced by the background flicker of the grid [43]. The method proposed to overcome
this problem is based on measurements of current and voltage. The short-term flicker
emission from the wind turbine should be calculated by means of a reference grid using
the measured active and reactive power as the only load on the grid. According to the
22
IEC 61400-21, the flicker coefficient from wind turbines is to be determined by
applying:
( )refS
fickS
ficstPkc,
,=ψ (6)
where c(ψk) is the flicker coefficient and Sref is the rated apparent power of the wind turbine. Pst,fic is the
flicker emission level calculated at the short-circuit power of a fictitious reference grid Sk,fic with grid
angle ψk. The grid angle is defined as:
=
k
kk R
Xarctanψ (7)
where Xk is the reactance and Rk is the resistance of the grid. The flicker emission produced by a wind
turbine connected to a grid with the arbitrary short-circuit power Sk may then be calculated by
( )k
refkst S
ScP ⋅= ψ (8)
According to the IEC 61400-21, the following equation applies when determining the flicker contribution
from several wind turbines connected to a common point:
∑=∑i
istst PP 2, (9)
where Pst,i is the flicker emission from each individual wind turbine.
4.2.2 Switching Operations
Switching operations will also produce flicker. Typical switching operations are the
start and shut down of wind turbines. Start, stop and switching between generators or
generator windings will cause a change in the power production. The change in the
power production will cause voltage changes at the point of common connection, PCC.
These voltage changes will in turn cause flicker. The start sequences of variable-speed
wind turbines as well as stall-regulated and pitch-controlled fixed-speed wind turbines
are all different. Variable-speed wind turbines are normally equipped with pitch-
control. Generally, due to the controllable speed of the turbine and the pitch-control,
23
the starting sequence of variable-speed wind turbines is smoother than for fixed-speed
wind turbines.
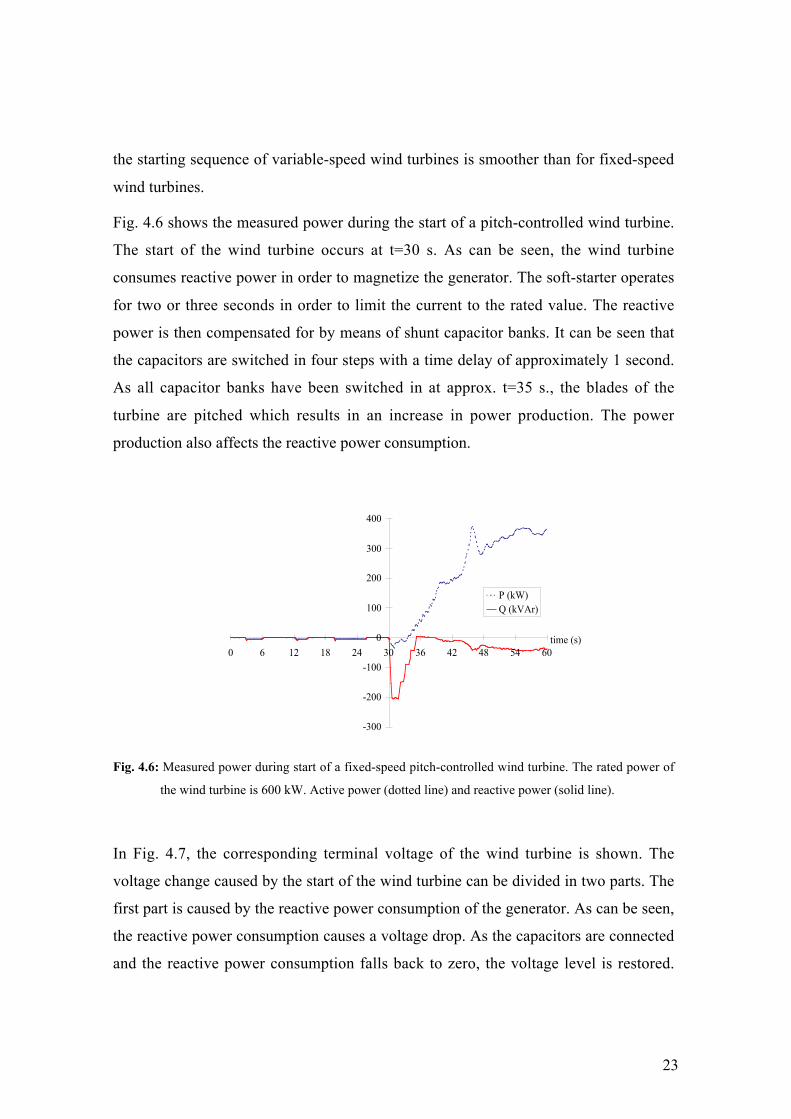
Fig. 4.6 shows the measured power during the start of a pitch-controlled wind turbine.
The start of the wind turbine occurs at t=30 s. As can be seen, the wind turbine
consumes reactive power in order to magnetize the generator. The soft-starter operates
for two or three seconds in order to limit the current to the rated value. The reactive
power is then compensated for by means of shunt capacitor banks. It can be seen that
the capacitors are switched in four steps with a time delay of approximately 1 second.
As all capacitor banks have been switched in at approx. t=35 s., the blades of the
turbine are pitched which results in an increase in power production. The power
production also affects the reactive power consumption.
-300
-200
-100
0
100
200
300
400
0 6 12 18 24 30 36 42 48 54 60
P (kW)Q (kVAr)
time (s)
Fig. 4.6: Measured power during start of a fixed-speed pitch-controlled wind turbine. The rated power of
the wind turbine is 600 kW. Active power (dotted line) and reactive power (solid line).
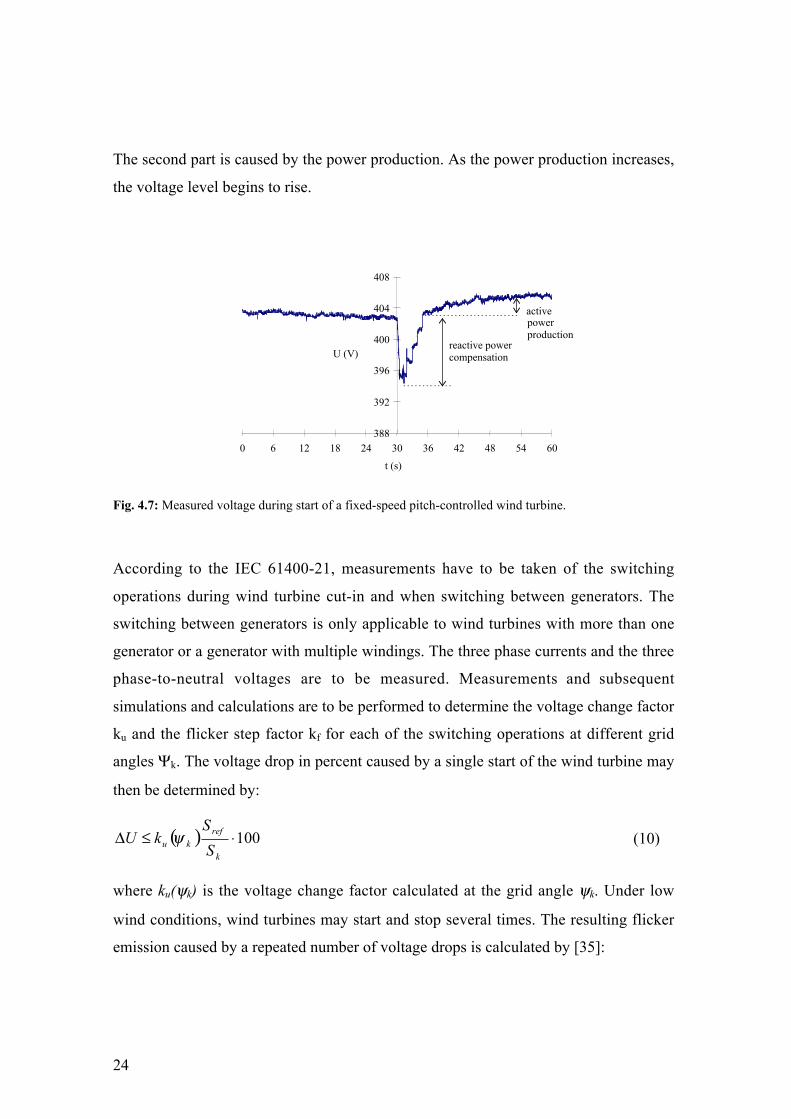
In Fig. 4.7, the corresponding terminal voltage of the wind turbine is shown. The
voltage change caused by the start of the wind turbine can be divided in two parts. The
first part is caused by the reactive power consumption of the generator. As can be seen,
the reactive power consumption causes a voltage drop. As the capacitors are connected
and the reactive power consumption falls back to zero, the voltage level is restored.
24
The second part is caused by the power production. As the power production increases,
the voltage level begins to rise.
388
392
396
400
404
408
0 6 12 18 24 30 36 42 48 54 60
t (s)
U (V)reactive powercompensation
activepowerproduction
Fig. 4.7: Measured voltage during start of a fixed-speed pitch-controlled wind turbine.
According to the IEC 61400-21, measurements have to be taken of the switching
operations during wind turbine cut-in and when switching between generators. The
switching between generators is only applicable to wind turbines with more than one
generator or a generator with multiple windings. The three phase currents and the three
phase-to-neutral voltages are to be measured. Measurements and subsequent
simulations and calculations are to be performed to determine the voltage change factor
ku and the flicker step factor kf for each of the switching operations at different grid
angles Ψk. The voltage drop in percent caused by a single start of the wind turbine may
then be determined by:
( ) 100⋅≤∆k
refku S
SkU ψ (10)
where ku(ψk) is the voltage change factor calculated at the grid angle ψk. Under low
wind conditions, wind turbines may start and stop several times. The resulting flicker
emission caused by a repeated number of voltage drops is calculated by [35]:
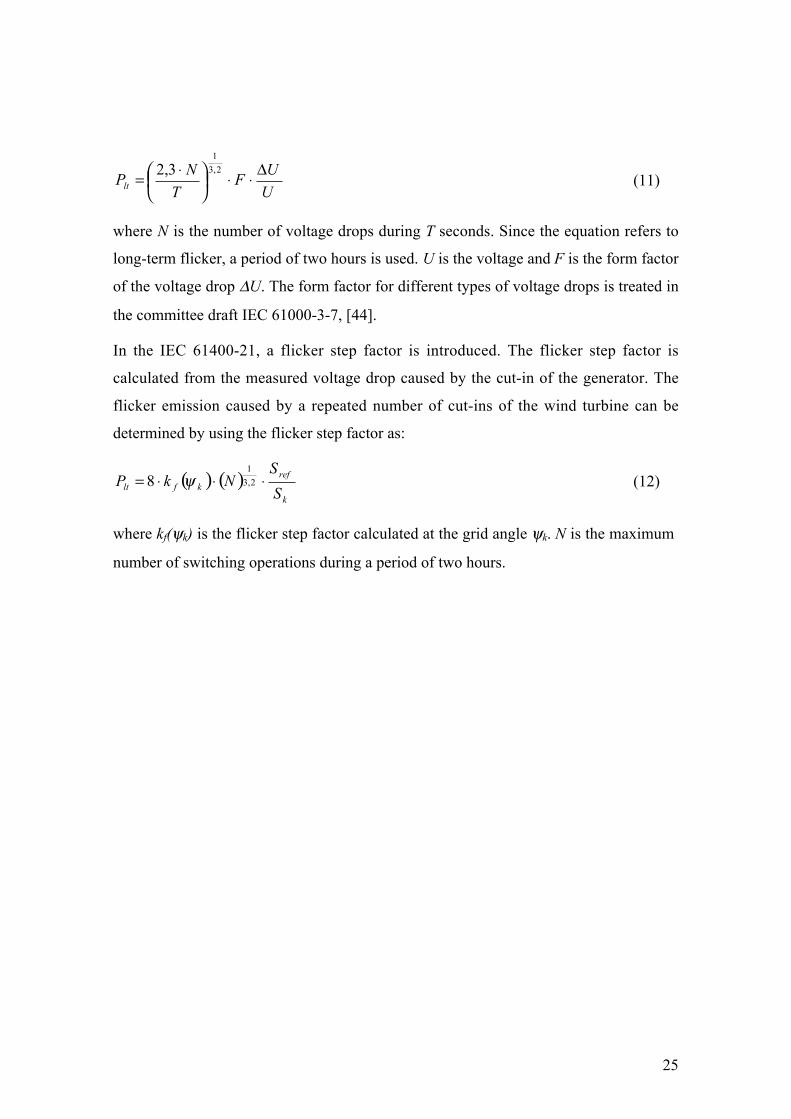
25
U
UF
T
NPlt
∆⋅⋅
⋅=
2,3
1
3,2(11)
where N is the number of voltage drops during T seconds. Since the equation refers to
long-term flicker, a period of two hours is used. U is the voltage and F is the form factor
of the voltage drop ∆U. The form factor for different types of voltage drops is treated in
the committee draft IEC 61000-3-7, [44].
In the IEC 61400-21, a flicker step factor is introduced. The flicker step factor is
calculated from the measured voltage drop caused by the cut-in of the generator. The
flicker emission caused by a repeated number of cut-ins of the wind turbine can be
determined by using the flicker step factor as:
( ) ( )k
refkflt S
SNkP ⋅⋅⋅= 2,3
1
8 ψ (12)
where kf(ψk) is the flicker step factor calculated at the grid angle ψk. N is the maximum
number of switching operations during a period of two hours.
26
4.3 Harmonics
Voltage harmonics are virtually always present on the utility grid. Non-linear loads,
power electronic loads, rectifiers and inverters in motor drives etc., are some sources
which produce harmonics. The effects of the harmonics include overheating and
equipment failure, faulty operation of protective equipment, nuisance tripping of a
sensitive load and interference with communication circuits [45].
Harmonics and inter-harmonics are defined in the IEC 61000-4-7 and Amendment 1 [46,
47]. Harmonics are components with frequencies which are multiples of the supply
frequency, i.e., 100 Hz, 150 Hz, 200 Hz, etc. Inter-harmonics are in a similar way
defined as components having frequencies located between the harmonics of the supply
frequency.
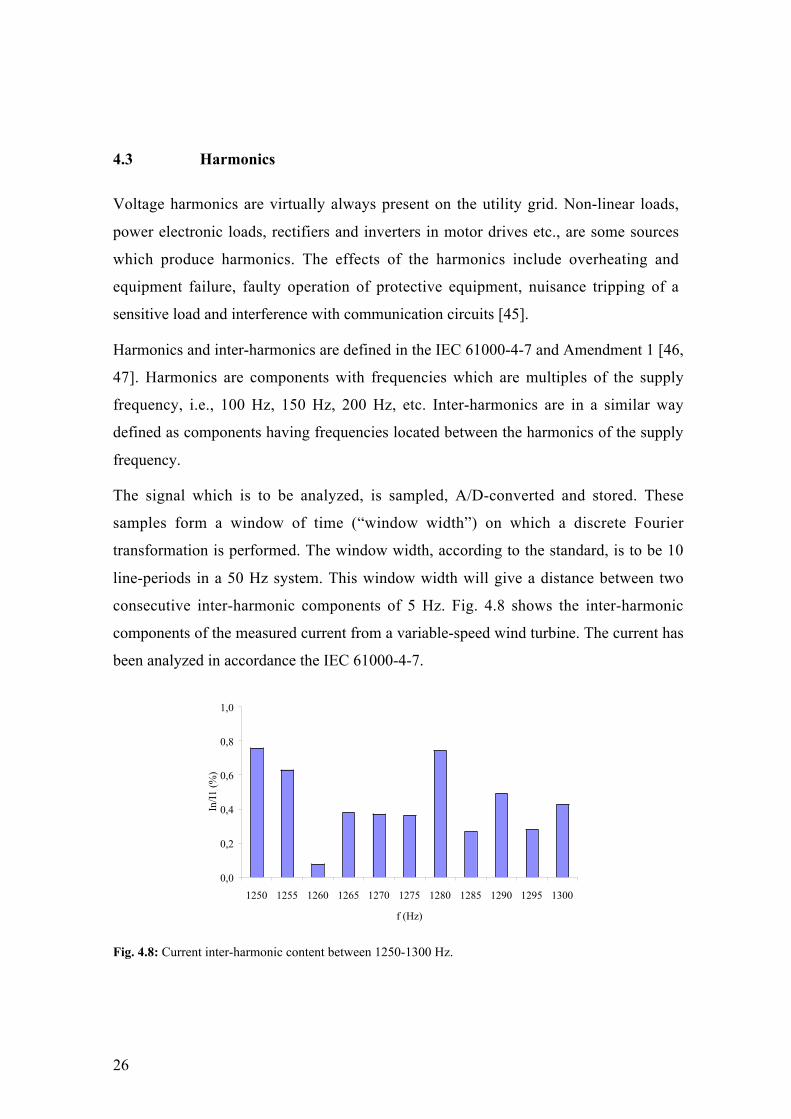
The signal which is to be analyzed, is sampled, A/D-converted and stored. These
samples form a window of time (“window width”) on which a discrete Fourier
transformation is performed. The window width, according to the standard, is to be 10
line-periods in a 50 Hz system. This window width will give a distance between two
consecutive inter-harmonic components of 5 Hz. Fig. 4.8 shows the inter-harmonic
components of the measured current from a variable-speed wind turbine. The current has
been analyzed in accordance the IEC 61000-4-7.
0,0
0,2
0,4
0,6
0,8
1,0
1250 1255 1260 1265 1270 1275 1280 1285 1290 1295 1300
f (Hz)
In/I
1 (%
)
Fig. 4.8: Current inter-harmonic content between 1250-1300 Hz.
27
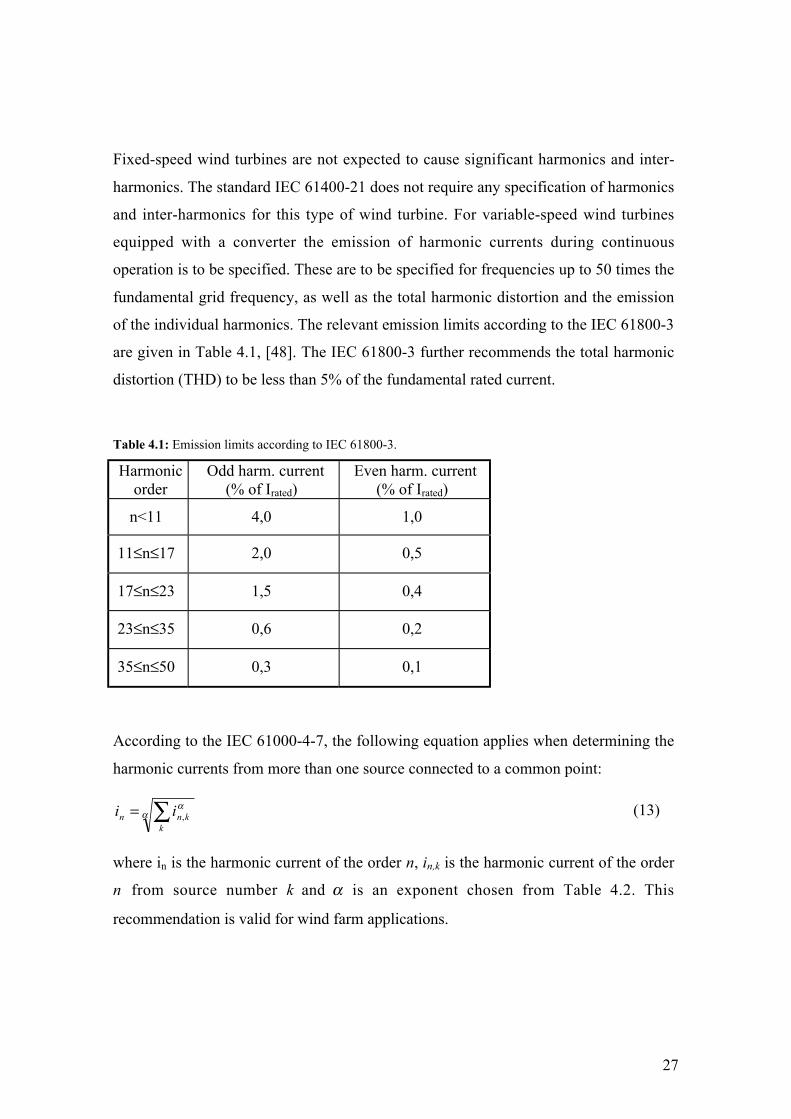
Fixed-speed wind turbines are not expected to cause significant harmonics and inter-
harmonics. The standard IEC 61400-21 does not require any specification of harmonics
and inter-harmonics for this type of wind turbine. For variable-speed wind turbines
equipped with a converter the emission of harmonic currents during continuous
operation is to be specified. These are to be specified for frequencies up to 50 times the
fundamental grid frequency, as well as the total harmonic distortion and the emission
of the individual harmonics. The relevant emission limits according to the IEC 61800-3
are given in Table 4.1, [48]. The IEC 61800-3 further recommends the total harmonic
distortion (THD) to be less than 5% of the fundamental rated current.
Table 4.1: Emission limits according to IEC 61800-3.
Harmonicorder
Odd harm. current(% of Irated)
Even harm. current(% of Irated)
n<11 4,0 1,0
11≤n≤17 2,0 0,5
17≤n≤23 1,5 0,4
23≤n≤35 0,6 0,2
35≤n≤50 0,3 0,1
According to the IEC 61000-4-7, the following equation applies when determining the
harmonic currents from more than one source connected to a common point:
αα∑=
kknn ii , (13)
where in is the harmonic current of the order n, in,k is the harmonic current of the order
n from source number k and α is an exponent chosen from Table 4.2. This
recommendation is valid for wind farm applications.
28
Table 4.2: Exponent for harmonics.
α harmonic numbern
1 n<5
1,4 5≤n≤10
2 n>10
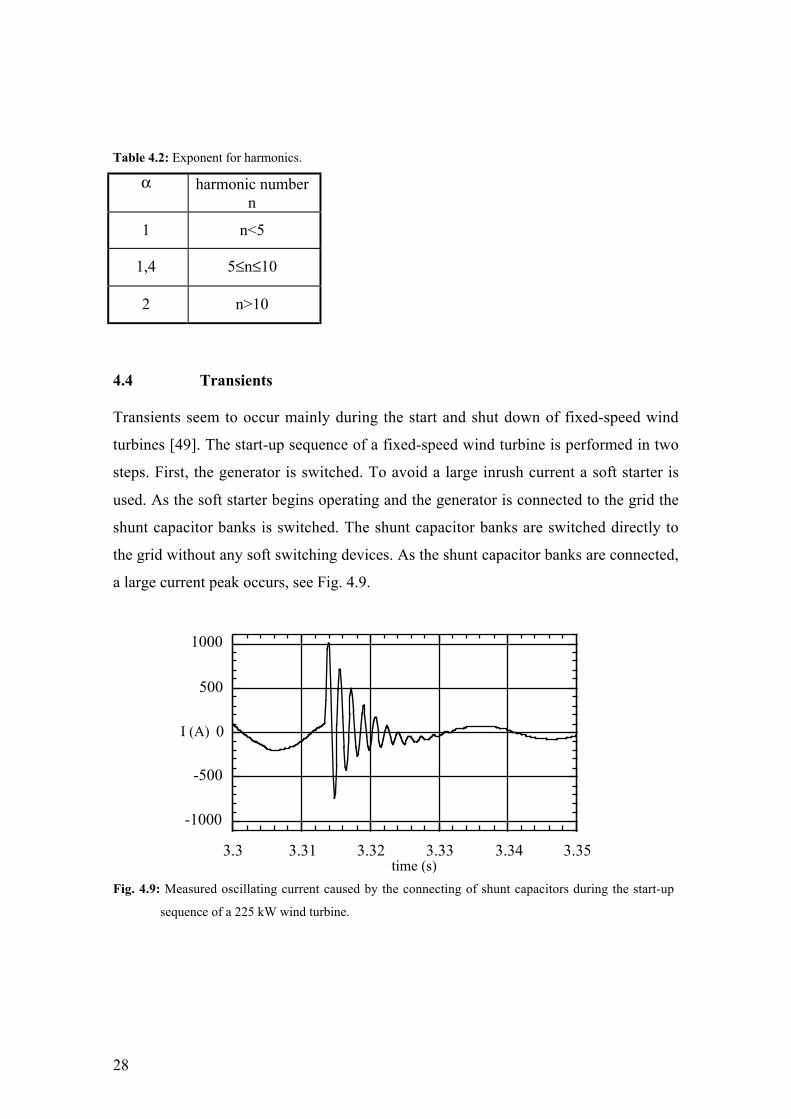
4.4 Transients
Transients seem to occur mainly during the start and shut down of fixed-speed wind
turbines [49]. The start-up sequence of a fixed-speed wind turbine is performed in two
steps. First, the generator is switched. To avoid a large inrush current a soft starter is
used. As the soft starter begins operating and the generator is connected to the grid the
shunt capacitor banks is switched. The shunt capacitor banks are switched directly to
the grid without any soft switching devices. As the shunt capacitor banks are connected,
a large current peak occurs, see Fig. 4.9.
-1000
-500
0
500
1000
3.3 3.31 3.32 3.33 3.34 3.35time (s)
I (A)
Fig. 4.9: Measured oscillating current caused by the connecting of shunt capacitors during the start-up
sequence of a 225 kW wind turbine.
29
This transient sometimes reaches a value of twice the rated wind turbine current and
may substantially affect the voltage of the low-voltage grid. The voltage transient can
disturb sensitive equipment connected to the same part of the grid [26].
The amplitude of the current emanating from the switching of a unloaded capacitor is
determined by the impedance of the grid and the capacitance of the capacitor. The
frequency of the transient can approximately be determined by
fLC
=1
2
1
π (14)
where L is the inductance of the grid and C is the capacitance of the capacitor.
In order to improve the calculations of the connecting current and voltage, a more
detailed model must be used. The use of the Electro Magnetic Transient Program
(EMTP) makes it possible to use frequency-dependent parameters. In [26], calculations
of switching transients on a low-voltage grid equipped with two wind turbines are
presented.
4.5 Frequency
On the one hand, [50] states that the introduction of a relatively small amount of wind
power into the utility grid does not normally present interfacing or operational
problems. The intermittent power production from wind turbines is balanced by other
production units. On the other hand, the effect of wind power is very important in
autonomous power systems. The spinning reserve is small in an autonomous grid
supplied by diesel engines. The small spinning reserve will give rise to frequency
fluctuations in case of a sudden wind rise or wind drop. Hence, in a wind-diesel
system, the voltage and frequency fluctuations will be considerably greater than in an
ordinary utility grid.
In the past decade, different types of wind turbines and wind-diesel systems for
autonomous grids have been tested. The most common are fixed-speed wind turbines
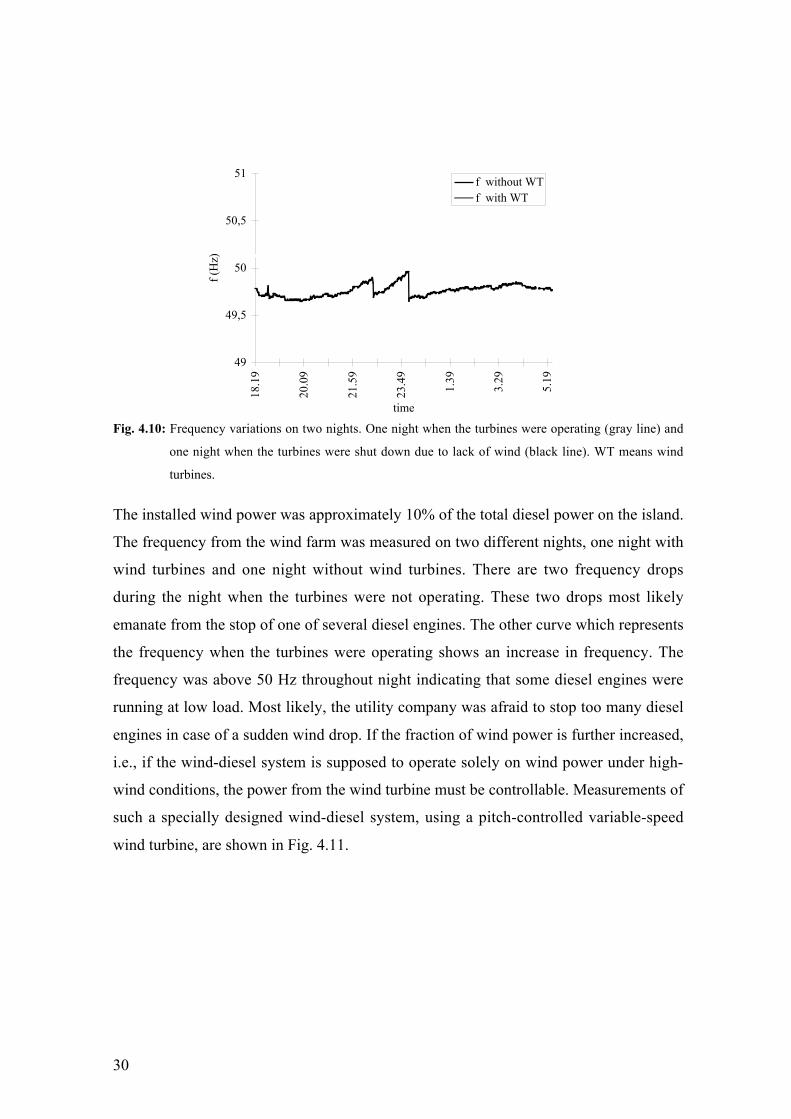
equipped with induction generators. Fig. 4.10 shows measurements taken at a wind-
diesel system with a relatively small amount of wind power on two different nights.
30
49
49,5
50
50,5
51
18.1
9
20.0
9
21.5
9
23.4
9
1.39
3.29
5.19
time
f (H
z)
f without WTf with WT
Fig. 4.10: Frequency variations on two nights. One night when the turbines were operating (gray line) and
one night when the turbines were shut down due to lack of wind (black line). WT means wind
turbines.
The installed wind power was approximately 10% of the total diesel power on the island.
The frequency from the wind farm was measured on two different nights, one night with
wind turbines and one night without wind turbines. There are two frequency drops
during the night when the turbines were not operating. These two drops most likely
emanate from the stop of one of several diesel engines. The other curve which represents
the frequency when the turbines were operating shows an increase in frequency. The
frequency was above 50 Hz throughout night indicating that some diesel engines were
running at low load. Most likely, the utility company was afraid to stop too many diesel
engines in case of a sudden wind drop. If the fraction of wind power is further increased,
i.e., if the wind-diesel system is supposed to operate solely on wind power under high-
wind conditions, the power from the wind turbine must be controllable. Measurements of
such a specially designed wind-diesel system, using a pitch-controlled variable-speed
wind turbine, are shown in Fig. 4.11.
31
46
47
48
49
50
51
21.1
1
23.0
1
0.51
2.41
4.31
time
f (H
z)
0
5
10
15
20
25
P (
kW)
fP from WT
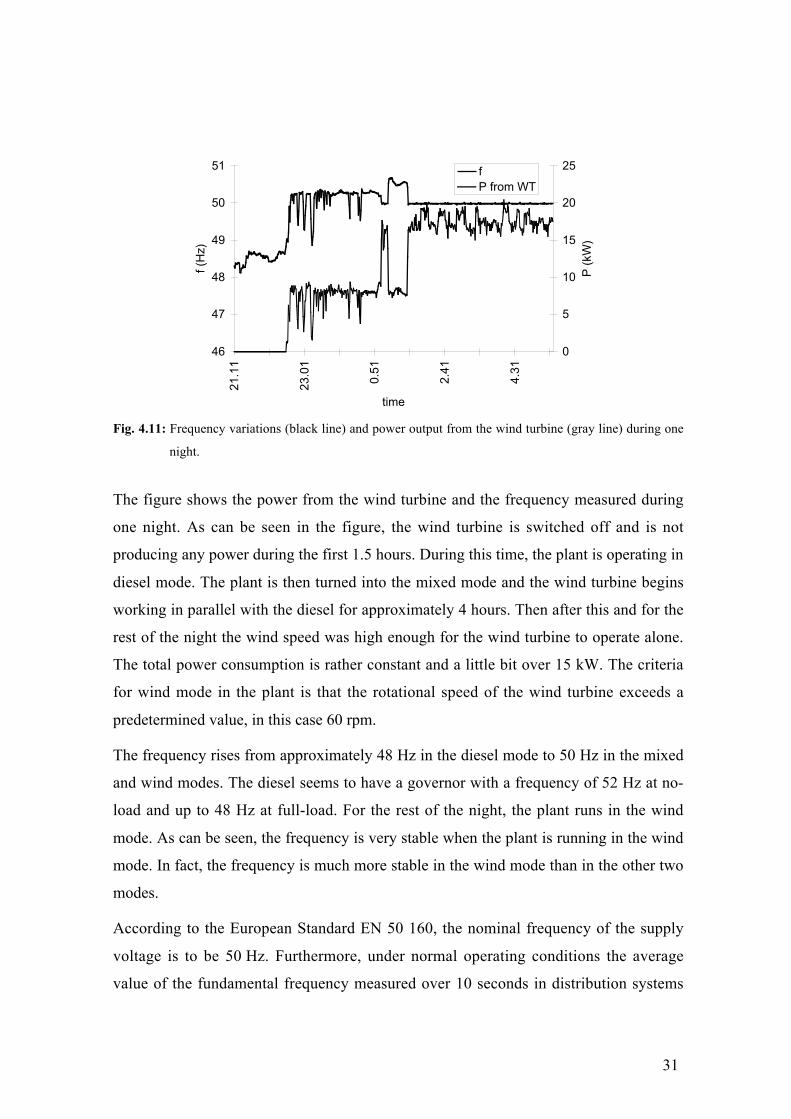
Fig. 4.11: Frequency variations (black line) and power output from the wind turbine (gray line) during one
night.
The figure shows the power from the wind turbine and the frequency measured during
one night. As can be seen in the figure, the wind turbine is switched off and is not
producing any power during the first 1.5 hours. During this time, the plant is operating in
diesel mode. The plant is then turned into the mixed mode and the wind turbine begins
working in parallel with the diesel for approximately 4 hours. Then after this and for the
rest of the night the wind speed was high enough for the wind turbine to operate alone.
The total power consumption is rather constant and a little bit over 15 kW. The criteria
for wind mode in the plant is that the rotational speed of the wind turbine exceeds a
predetermined value, in this case 60 rpm.
The frequency rises from approximately 48 Hz in the diesel mode to 50 Hz in the mixed
and wind modes. The diesel seems to have a governor with a frequency of 52 Hz at no-
load and up to 48 Hz at full-load. For the rest of the night, the plant runs in the wind
mode. As can be seen, the frequency is very stable when the plant is running in the wind
mode. In fact, the frequency is much more stable in the wind mode than in the other two
modes.
According to the European Standard EN 50 160, the nominal frequency of the supply
voltage is to be 50 Hz. Furthermore, under normal operating conditions the average
value of the fundamental frequency measured over 10 seconds in distribution systems

32
with no synchronous connection to an interconnected system is to be within a range of
50 Hz ± 2 % (i.e. 49 Hz to 51 Hz) for 95 % of a week or 50 Hz ± 15 % (i.e., 42.5 Hz to
57.5 Hz) for 100 % of a week.
33
5 Contributions and Conclusions
During the last ten years, the rated power of mass-produced wind turbines has risen
from 200 kW to 2 000 kW. As the rated power of wind turbines increases even the
technology changes. The small 200 kW wind turbines built ten years ago operated at
fixed-speed while the large 2 000 kW wind turbines of today operate at variable-speed.
The increased rated power and the rising numbers of wind turbines contribute to making
the power quality issue more important.
As a result, a lot of effort has been put into measuring and analyzing the power quality
of grid connected wind turbines. During recent years this work has resulted in drafted
versions of new national and international standards. As a consequence, early published
papers have become out-of-date.
5.1 Short Summaries of Papers which are Part of the Thesis
Paper 1A (1995)
The aim of Paper 1A is to present a survey of the various electrical systems used in
wind turbine applications. Synchronous generators and induction generators are
investigated. Line-commutated thyristor converters are compared with force-
commutated transistor converters. System characteristics are investigated regarding
power quality, damping capability, mechanical resonances, losses and costs. Several
recommendations, i.e., IEC/TC 88, TAMP, DAMP regarding wind turbines and grid
connection are discussed.
This paper outlines the most common electrical system which is a turbine- induction
generator combination directly connected to the grid. In the future, variable-speed
operation will be more common. For variable-speed operation the thyristor inverter has
the highest efficiency and the lowest price compared with the IGBT inverter. However,
the IGBT inverter has the capability of providing good power quality to the grid.
34
Paper 1B (1997)
In this report, power quality problems are discussed from a wind power point of view.
Aerodynamic and mechanical principles of wind turbines are explained. The electrical
systems used for fixed-speed and variable-speed operation and the power quality effects
they can cause are described in detail. Moreover, wind power related power quality
aspects are discussed and methods for calculating various voltage disturbances are
derived. Finally, the report discusses the power quality of autonomous wind-diesel grids
and some of the protection devices with which wind turbines are equipped.
In this report, it is affirmed that different kinds of wind turbines are available on the
market. From an electrical point of view, wind turbines may be divided into two main
groups, i.e., fixed-speed and variable-speed operation. Both groups of wind turbines
have advantages and disadvantages in terms of interaction with the grid and power
quality.
Paper 2A (1995)
The purpose of Paper 2A is to study the damping of transients by the skin effect and
proximity effects when the phase-compensating capacitors of wind turbines are
connected to the grid. Transient measurements were performed at a small wind park
consisting of two pitch-regulated wind turbines. When the phase-compensating
capacitors were connected, a large current peak, up to twice the rated current, occurred.
This dynamic event was calculated by means of the Electro Magnetic Transient
Program, EMTP. In order to get a proper result, the skin effect and proximity effects on
the cable and the transformer must be taken into account.
Paper 2B (1996)
The power quality of two different autonomous wind-diesel systems has been
compared. Measurements have been performed at two different sites, one located on an
island in Greece, the other on an island in Sweden. The island in Greece has a
conventional wind-diesel system consisting of a wind farm working in parallel with
35
some diesel generators. The Swedish system is a specially designed wind-diesel system
in which the diesel generator and the wind turbine work in collaboration with each
other. Measurements of the voltage and frequency variations during the operation of the
wind turbines at different wind speeds and different load situations are compared. The
paper shows that using a wind turbine with a controllable power output makes it
possible to have 100 percent wind penetration while maintaining a specified power
quality.
Paper 2C (1996)
Paper 2C deals with flicker and slow voltage variations generated by wind turbines
affecting other consumers connected to the grid. Measurements of power fluctuations
and voltage variations caused by wind turbines are presented. The means by which wind
turbines can produce flicker and the factors which affect its severity are discussed. The
paper also deals with the conditions under which flicker is likely to become a limiting
factor when wind energy becomes an increasing part of the total generation.
It is shown that the short-circuit ratio of the grid affects voltage fluctuations. Moreover,
the ratio between the reactance X and the resistance R of the grid in combination with
the reactive power consumption of the load has a significant impact on voltage
fluctuations.
Paper 2D (1999)
In Paper 2D, the power quality of variable-speed wind turbines equipped with forced-
commutated inverters is investigated. Measurements have been made on the same type
of variable-speed wind turbines located in Germany and in Sweden. The measurements
have been analysed and compared with existing IEC standards. Special attention has
been given to flicker emission and harmonics due to the aggregation of several wind
turbines. This aggregation has been compared with the summation laws used in the
committee draft of the IEC 61400-21 “Power Quality Requirements for Grid Connected
Wind Turbines“.
36
In the paper, it is shown that the methods for calculating flicker proposed by IEC
Standards are reliable. Harmonics and inter-harmonics are treated in the IEC 61000-4-7
and IEC 61000-3-6. The methods for summing harmonics and inter-harmonics as
described in IEC 61000-3-6 are applicable to wind turbines. In order to obtain a correct
magnitude of the frequency components, the use of a well-defined window width is of
great importance.
Paper 3A (1999)
Paper 3A describes the work done in the power quality subtask of the project “European
Wind Turbine Testing Procedure Developments” funded by the EU SMT program. The
objective of the power quality subtask has been to make analyses and new
recommendation(s) for the standardization of the measurement and verification of wind
turbine power quality. The work has been organized as three major activities. (i) The
first activity has been to propose measurement procedures and to verify existing and
new measurement procedures. This activity has also involved a comparison of the
measurements and data processing of the participating partners. (ii) The second activity
has been to investigate the influence of terrain, grid properties and wind farm
summation on the power quality of wind turbines with constant rotor speed. (iii) The
third activity has been to investigate the influence of terrain, grid properties and wind
farm summation on the power quality of wind turbines with variable rotor speed .
The results of comparisons of simultaneous measurements in Hagshaw Hill show good
agreement with the measurements made at Risø, DEWI, NEL and CRES. Moreover, the
comparison of calculation results based on a set of reference measurements have shown
very good agreement with the analysis software at Risø, DEWI and CRES. Measnet and
the IEC define methods for measuring power quality characteristics which aim at being
independent of the grid where the measurements are done. The measured power quality
characteristics can then be applied to calculate the influence on the voltage quality on
another grid characterized by short circuit power and an impedance angle. The present
work has illustrated that the grid properties still have an influence on the specified
power quality characteristics. Another factor, which influences the results, is the terrain.
37
The comparison of measurements in complex terrain and in relatively flat terrain has
shown a significant difference between the measurements of power variability and
flicker at low and medium wind speed, but the designing 99% percentiles were less
sensitive to the terrain.
Paper 4A (1999)
In Paper 4A, the power quality of grid connected wind turbines is investigated. Special
emphasis is on stationary voltages, flicker and harmonics. In addition, the aggregation
of several wind turbines on flicker emission and harmonics is considered. The new
Danish and Swedish guidelines for the grid connection of wind turbines and the
committee draft of the IEC 61400-21 ”Power Quality Requirements for Grid Connected
Wind Turbines” are discussed.
In the committee draft of the IEC 61400-21, a procedure for determining the
characteristics of wind turbine output with respect to its impact on the voltage quality in
a power system is specified. In both Denmark and Sweden, new recommendations
regarding the grid connection of wind turbines have been accepted. The two
recommendations are quite similar and they are both derived from the committee draft
of the IEC 61400-21. The equations in the committee draft have been revised in order to
agree with national standards concerning voltage quality.
In the recommendations, the impact of a wind turbine on the utility grid is determined
by means of a wind turbine power quality test. The test results shall contain information
regarding the power factor, the maximum power, the voltage change factor, the flicker
step factor, the maximum numbers of switching operations for a period of two hours,
the flicker coefficient and the harmonic content of the current.
Paper 4B (2000)
Paper 4B presents the modelling and analysis of the flicker emission of wind turbines,
along with measurements and a comparison with international standards. The paper is
an extension of a part of the work presented in Paper 4A. The paper concentrates on the

38
theoretical aspects of the flicker algorithm, wind turbine characteristics and flicker
during the continuous operation of wind turbines.
Flicker emissions are produced during the continuous operation of wind turbines. The
flicker is caused by power fluctuations which mainly emanate from variations in wind-
speed, the tower shadow effect and mechanical properties of the wind turbine. Pitch-
controlled turbines also have power fluctuations caused by the limited bandwidth of the
pitch mechanism.
Paper 4C (2000)
Paper 4C is a continuation of Paper 4B and presents the modelling and analysis of the
flicker of wind turbines. Special emphasis is on explaining the start-up procedure and
deriving equations for the calculation of flicker produced by switching operations. The
derived equations are compared with international standards. The paper includes
measurements of the start and stop of different types of turbines. Finally, the paper
makes a comparison of flicker limitations at wind parks.
Switching operations will produce flicker. Typical switching operations are the start and
stop of wind turbines. The start and stop of different types of wind turbines are
different. For example, in the case of pitch-controlled fixed-speed wind turbines, the
torque of the turbine can be controlled. Hence, the connection of the generator can be
performed in a smooth and controlled way.
All wind turbines in a wind park are normally connected at the same point of common
connection, PCC. The grid at the PCC, therefore, must be designed to withstand the
total flicker disturbance produced by all the wind turbines in the wind park. Wind
turbines produce flicker under continuous operation, as well as under switching
operations. The required short circuit ratio, SCR, caused by flicker under continuous
operation increases with the square root of the number of wind turbines, whereas the
required SCR caused by switching operations increases with a little more than the cubic
root of the number of wind turbines. Generally, fixed-speed wind turbines need a higher
SCR compared to variable speed wind turbines. If a wind park consists of a small
number of fixed-speed wind turbines then stall-regulated wind turbines, due to

39
uncontrollable torque during start, will produce higher flicker emission. If the number
of fixed-speed wind turbines is high, pitch-controlled wind turbines will produce higher
flicker emissions.

40
41
5.2 Conclusions
In this thesis the power quality of grid-connected wind turbines has been investigated.
Furthermore, electrical systems used for fixed-speed and variable-speed wind turbines
and their characteristics have been focused on.
From an electrical point of view, wind turbines may be divided into two main groups,
i.e., fixed-speed and variable-speed operation. Both groups of wind turbines have
advantages and disadvantages regarding interaction with the grid and power quality.
Wind turbines have an uneven power production following the natural variations in the
wind. Uneven power production is the same for all kinds of wind turbines. Each time a
turbine blade passes the tower, it enters into the tower shadow. If the turbine is
operating at fixed-speed, the tower shadow and wind speed gradients will result in
fluctuating power. Both uneven power production and power fluctuation cause voltage
variations. Load flow calculations can be used to calculate slow variations in the
voltage caused by the uneven power production of wind turbines. The power
fluctuations of the wind turbine may cause flicker disturbances. In order to calculate
the impact on flicker, measurements and subsequent flicker calculations must be
performed.
Apart from possible oscillations between the grid impedance and the shunt capacitor
banks for power factor correction, fixed-speed wind turbines do not produce any
harmonics. When it comes to variable-speed wind turbines, however, the situation is
the opposite. Depending on the type of inverter used, different orders of harmonics are
produced.
Transients seem to occur mainly when wind turbines are started and stopped. A large
inrush current and thereby a voltage dip can be avoided if the wind turbine is equipped
with a soft-starter. As the shunt capacitor bank is switched on, a large current peak
occurs. The current peak may substantially affect the voltage on the low-voltage side of
the transformer.
In an autonomous grid supplied by diesel engines, the spinning reserve is limited and
gives rise to frequency fluctuations when fast load changes occur. Hence, the frequency
42
of an autonomous grid is normally not as stable as that of a large grid. When wind
power is introduced to an autonomous grid, a sudden wind rise or wind drop will affect
the power balance with frequency variations as a result. The use of sophisticated
variable-speed wind turbines can eliminate this problem and actually improve the
frequency balance.
The new committee draft of the IEC 61400-21 and the Swedish regulation AMP
provide tools for predicting the interaction between the wind turbines and the grid.
Wind turbine types, which in combination with the grid are likely to cause power
quality problems, can, at an early stage of planning, be rejected and replaced by a more
suitable type of wind turbine.
5.3 Future Research
This thesis proposes methods for assessing the power quality of wind turbines. It also
shows that these methods are reliable for wind turbines connected to a normal grid
having rotating synchronous generators and passive loads. The control strategy used
today is to disconnect the wind turbines in the event of a grid failure. With a significant
amount of wind power in the grid, disconnecting the wind turbines may result in voltage
instability and voltage collapse. One aspect of this work to be given further study is the
power system stability with a large amount of wind power in the grid.
Another aspect for further study is the electronic stability in grids which use a large
number of wind turbines. The manufacturers of wind turbines use power electronics in
order to achieve the variable speed for their large wind turbines. The main reasons for
using variable speed are the reduction of mechanical loads and the improvement of
power quality. Even the manufacturers of consumer products use power electronics in
their products in order to save energy. Examples of such products are heat pumps,
ventilation systems, drilling machines, vacuum cleaners, computers, televisions, etc. If a
large amount of power is fed to the grid through converters and an increasing part of the
load uses inverters, then electronic instability of the entire network cannot be excluded.
43
References
[1] Andersen, P.D., “Global Perspectives for Wind Power”, Proceedings of the
European Wind Energy Conference (EWEC '99), March 1999, Nice, France, p. 71
- 76.
[2] Jenkins, N., ”Embedded generation”, Power Engineering Journal, June 1995, p.
145 - 150.
[3] Openshaw, D., “Embedded Generation in Distribution Networks: With
Experience of UK Commerce in Electricity”; Wind Engineering, Vol. 22, No. 4,
1998, p. 189 – 196.
[4] Paap, G.D., Teklu, D., Jansen, F., van der Sluis, L., “The Influence Of Large-
Scale Dispersed Co-Generation On Short Circuits In Rural Networks”,
Proceedings of the 15th International Conference on Electricity Distribution
(CIRED ´99), June 1999, Nice, France.
[5] Craig, L.M., Davidson, M., Jenkins, N., Vaudin, A., “Intergration of Wind
Turbines on Weak Rural Networks”, Proceeding of the Opportunities and
Advances in International Power Generation, Conference Publication No. 419,
March 1996, p.164 – 167.
[6] Salman, S.K., Jiang, F., “Impact of Embedded Wind Farms on Voltage Control
and Losses of Distribution Networks”, Proceedings on International Conference
on Electric Power Engineering, Budapest, Hungary, 1999. p. 43.
[7] Jhutty, A.S., “Embedded generation and the Public Electricity System”, IEE
Colloquium on System Implication of Embedded Generation and its Protection
and Control, Birmingham, UK, February 1998, p. 9/1 – 9/14.

44
[8] Mutale, J., Strbac, G., Curcic, S., Jenkins, N., “Allocation of losses in distribution
systems with embedded generation”, IEE Proceedings on Generation,
Transmission and Distribution, Vol. 147, No. 1, January 2000, p. 7 – 14.
[9] Tzschoppe, J., Haubrich, H-J., Bergs, D., Nilges, J., “MV-Network-Connection of
Disperced Generation: Network Reinforcements vs. Optimised Operation”,
Proceedings of the 15th International Conference on Electricity Distribution
(CIRED ´99), June 1999, Nice, France.
[10] Haslam, S.J., Crossley, P.A., Jenkins, N., “Design and field testing of a source
based protection relay for wind farms”, IEEE Transactions on Power Delivery,
Vol. 14, No. 3, July 1999, p. 818 – 823.
[11] van Vyk, J.D., “The Issue of Power Quality”, Proceedings on the European
Conference on Power Electronics and Application (EPE `93), September 1993,
Brighton, UK, p. 17 – 32.
[12] Heier, S., Grid Integration of Wind Energy Conversion Systems, John Wiley &
Sons Ltd, U.K., 1998, 385 p.
[13] Sørbrink, K.H., Stöber, R., Schettler, F., Bergmann, K., Jenkins, N., Ekanayake,
J., Saad-Saoud, Z., Lisboa, M.L., Strbac, G., Pedersen, J.K., Pedersen, K.O.H.,
Power Quality Improvements of Wind Farms, ISBN No. 87-90707-05-2,
Søndergaard Bogtryk og Offset, Fredrica, June 1998.
[14] Jørgensen, P., Tande, J.O. Vikkelsø, A., Nørgård, P., Christensen, J.S., Sørensen,
P., Kledal, J.D., Søndergård, L., “Power Quality and Grid Connection of Wind
Turbines”, Proceedings of the International Conference on Electricity
Distribution (CIRED ´97), IEE Conference Publication No. 438, 1997, p. 2.6.1 –
2.6.6.

45
[15] Jørgensen, P., Tande, J.O., “Probablistic Load Flow Calculation using Monte
Carlo Techniques for Distribution Network with Wind Turbines”, Proceedings of
the 8th International Conference on Harmonics and Quality of Power (ICHQP
'98), Athens, Greece, October 1998, p. 1146 - 1151.
[16] Saad-Saoud, Z., Jenkins, N., “Models for Predicting Flicker Induced by large
Wind Turbines”, IEEE Transactions on Energy Conversion, Vol. 14, No. 3,
September 1999, p. 743 - 748.
[17] Jørgensen; P., Christensen, J. S., Tande, J. O., Vikkelsø, A., Nørgård, P.,
”Elkvalitet ved nettilslutning af vindmøller Del 3: Overtoner og driftforhold ved
invertertilsluttede vindmøller”, Roskilde, Information Service Department, Risø
National Laboratoy, 1996, 95 p. (in Danish)
[18] Hatziargyriou, N.D., Lorentzou, M.I., Cotton, I., Jenkins, N., “Transferred
Overvoltages by Windfarm Grounding Systems”, Proceedings of the 8th
International Conference on Harmonics and Quality of Power (ICHQP '98),
Athens, Greece, October 1998, p. 342 - 347.
[19] Tande, J.O.G., Jenkins, N., “International Standards for Power Quality of
Dispersed Generation” Proceedings of the 15th International Conference on
Electricity Distribution (CIRED ´99), June 1999, Nice, France.
[20] Koulouvari, M., Ladakakos, P., Foussekis, D., Morfiadakis, E., “Measurement
Systems Dedicated to Wind Turbine Power Quality Applications”, Proceedings of
the 8th International Conference on Harmonics and Quality of Power (ICHQP
'98), Athens, Greece, October 1998, p. 911 - 916.
[21] Johnson, G.L., Wind Energy Systems, Prentice Hall International Inc., New Jersey,
USA, 1985, 360 p.

46
[22] Richardson, R. D., McNerney, G. M., ”Wind Energy Systems”, Proceedings of
the IEEE, Vol. 81, No. 3, March 1993, p. 378 - 389.
[23] Freris, L.L. (ed.), Wind Energy Conversion Systems, Prentice Hall International
(UK) Ltd, 1990, 388 p.
[24] Freris, L. L., ”Harnessing the wind”. Power Engineering Journal, September
1992, p. 251 - 260.
[25] Grauers, A., “Direct driven generators – Technology and development trends”,
Proceedings of the Nordic Wind Power Conference 2000 (NWPC 2000),
Trondheim, Norway, Mars 13-14, 2000, p. 127 – 131.
[26] Larsson, Å., Thiringer, T., ”Measurements on and Modelling of Capacitor-
Connecting Transients on a Low-voltage Grid Equipped with Two Wind
Turbines”, Proceedings of the International Conference on Power System
Transients (IPST '95), Lisbon, Portugal, Sept. 1995, p. 184 - 188.
[27] Jenkins, N., “Engineering wind farms”, Power Engineering Journal, April 1993,
p. 53 – 60.
[28] Larsson, Å., Carlson, O., Sidén, G., ”Electrical Generating Systems in Wind
Turbine Applications”, Proceedings of the IEEE/KTH Stockholm Power Tech
Conference, Vol. Electrical Machines and Drives, June 1995, p. 205 - 210.
[29] Vestas, Technical description of the Optislip feature, Item no. 947525, 1995.
[30] Thorborg, K., Power Electronics. Prentice Hall International (UK) Ltd, 1988. 504
p.

47
[31] Svensk Standard, SS 421 18 11, Spänningsgodhet i lågspänningsnät för allmän
distribution, 1989. (in Swedish)
[32] European Committee for Electrotechnical Standardization, CENELEC, EN 50
160, Voltage Characteristics of Electricity Supplied by Public Distribution
Systems, 1994.
[33] International Electrotechnical Commission, IEC Standard, Publication 60038,
Standard voltages, Ed. 6, 1983.
[34] Ballard, L. J., Swansborough, R., H. (ed.), ”Recommended Practices for Wind
Turbine Testing: 7. Quality of Power. Single Grid-Connected WECS”, Roskilde,
Elsgaards bogtrykkeri, Edition 1, 1984.
[35] Tilslutning af vindmøller til lav- og mellemspændingsnet, DEFU Institut for
forskning og udvikling inden for elforsyningsområdet, Komité rapport 111, 1998.
(in Danish)
[36] Anslutning av Mindre Produktionsanläggningar till elnätet (AMP), Sveriges
elleverantörer, 1999. (in Swedish)
[37] International Electrotechnical Commission, IEC Standard, Publication 60868,
Flickermeter – Functional and Design Specifications, 1990.
[38] International Electrotechnical Commission, IEC Standard, Amendment 1 to
Publication 60868, Flickermeter – Functional and Design Specifications, 1990.
[39] Walker, M. K., ”Electric Utility Flicker Limitation”, in Proceeding of the Power
Quality Conference, Long Beach, California, October 1989, p. 602 - 613.

48
[40] Gardner, P., ”Flicker from Wind Farms”. Proceedings of the BWEA/SERC RAL
Workshop on Wind Energy Penetration into Weak Electricity Network,
Rutherford, U.K., June 1993, p. 27 - 37.
[41] Gerdes, G., Santjer, F., ”Power Quality of Wind Turbines and their Interaction
with the Grid”. Proceedings of the European Wind Wnergy Conference (EWEC
‘94), Thessaloniki, Greece, 10-14 October 1994, p. 1112 - 1115.
[42] Sørensen, P., Tande, J.O., Søndergaard, L.M., Kledal, J.D., ”Flicker Emission
Levels from Wind Turbines”, Wind Engineering, Vol. 20, No. 1, 1996, p. 39 - 45.
[43] International Electrotechnical Commission, IEC Standard, Publication 61400-21,
Power Quality Requirements for Grid Connected Wind Turbines, Committee
Draft, 1998.
[44] International Electrotechnical Commission, IEC Standard, Publication
61000-3-7, Electromagnetic compatibility, Limitations of voltage fluctuations
and flicker for equipment connected to medium and high voltage power supply,
Committee draft, 1995.
[45] Reid, E. W., ”Power Quality Issues - Standards and Guidelines”, IEEE
Transactions on Industry Applications, Vol. 32, No. 3, May/June 1996, p. 625 -
632.
[46] International Electrotechnical Commission, IEC Standard, Publication 61000-4-7,
Electromagnetic Compatibility, General Guide on Harmonics and Inter-harmonics
Measurements and Instrumentation, 1991.

49
[47] International Electrotechnical Commission, IEC Standard, Amendment 1 to
Publication 61000-4-7, Electromagnetic Compatibility, General Guide on
Harmonics and Inter-harmonics Measurements and Instrumentation, 1997.
[48] International Electrotechnical Commission, IEC Standard, Publication 61800-3,
Adjustable speed electrical power drive systems, EMC product standard including
specific test methods, 1996.
[49] Demoulias, C. S., Dokopoulos, P., ”Electrical Transients of Wind Turbines in a
Small Power Grid”, IEEE Transactions on Energy Conversion, Vol. 11, No. 3,
September 1996, p. 636 - 642.
[50] Hunter, R., Elliot, G., Wind-Diesel Systems, Cambridge University Press, Great
Britain, 1994, 249 p.

50
Paper 1A
Electrical Generating Systems in Wind Turbine Applications
Å. Larsson
O. Carlson
G. Sidén
Presented at
Stockholm Power Tech
Stockholm, Sweden
June 18-22, 1995
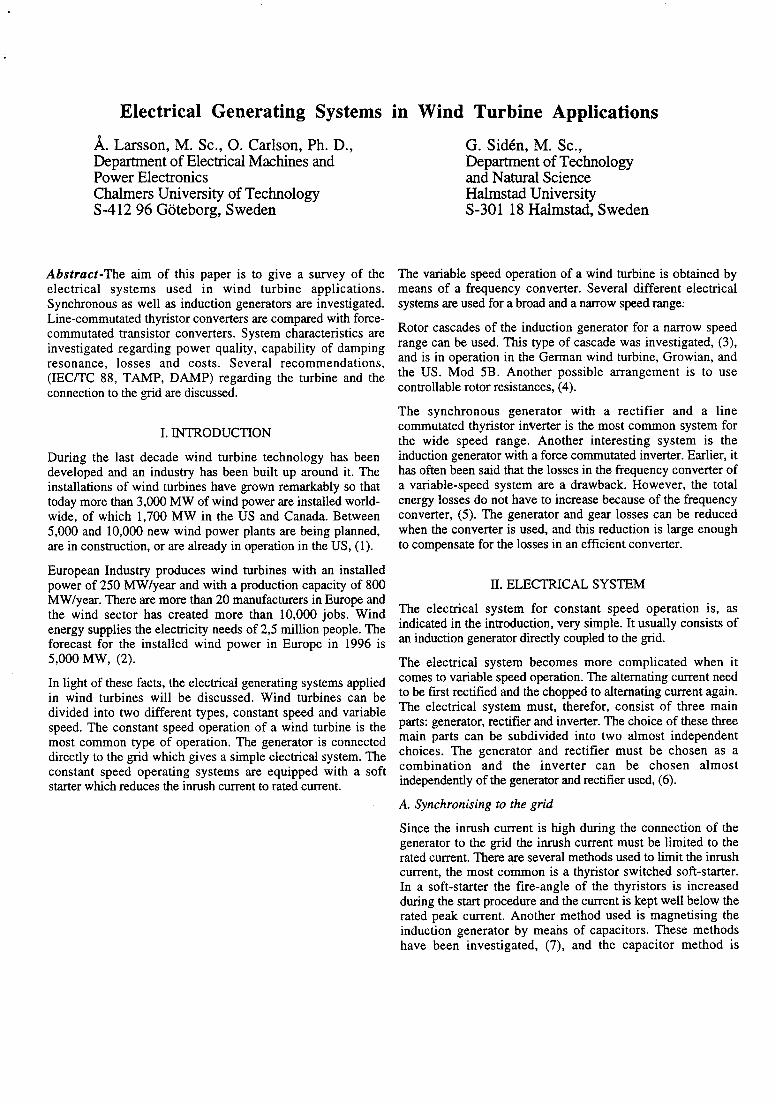
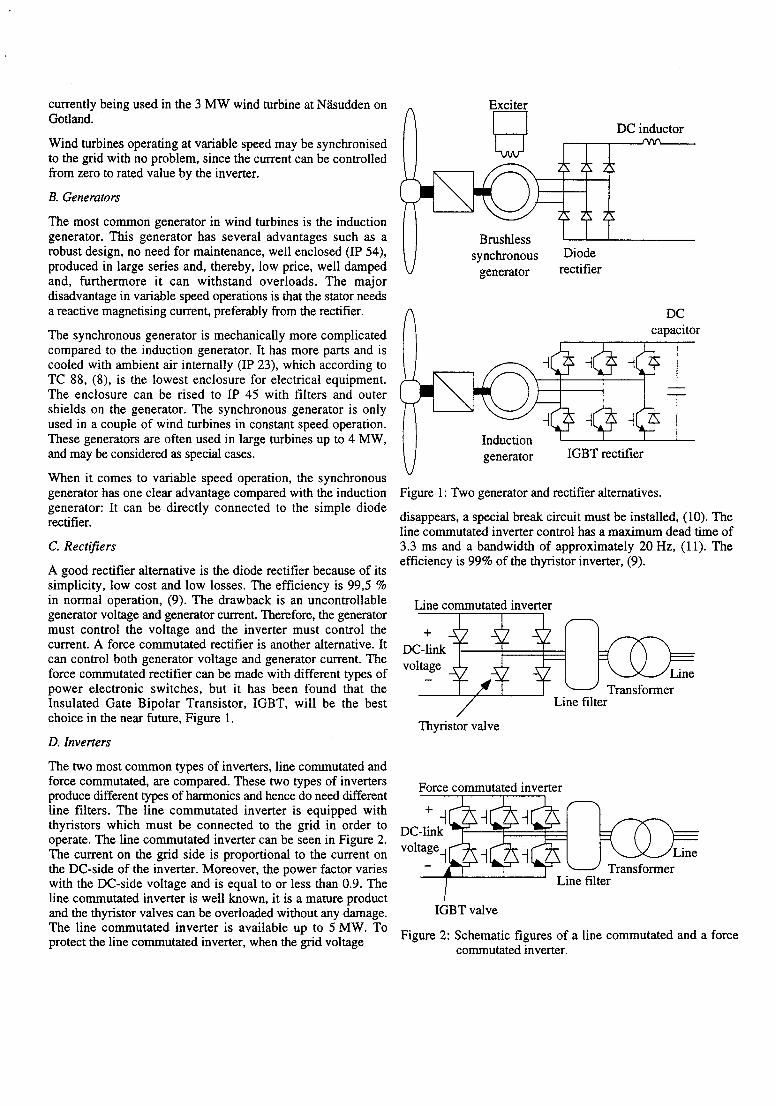


Paper 1B
Power Quality of Wind Turbine Generating Systems
and their Interaction with the Grid
Å. Larsson
Technical Report No. 4R
Department of Electric Power Engineering
Chalmers University of Technology
Göteborg, Sweden, 1997


1
1 Introduction
During the last decade the wind energy technology has advanced and the wind
industry has expanded remarkably. Increased efficiency of the wind turbine
generator system, higher energy prices and environmental aspects are some of the
reasons for the ongoing wind power boom. However, wind turbines are among
utilities considered as potential sources for bad power quality. Uneven power
production, the use of power electronics and in many cases location at the end of a
long feeder line are some of the factors behind the statement.
The difficulty with wind power, seen from an electric point of view, is not only
the uneven power production and the different types of grids used. There are also
different types of wind turbines available on the market. Wind turbines operate
either at fixed speed or variable speed. Variable-speed wind turbines are equipped
with various converter types and use various control methods. Moreover, the turbine
can either be stall- or pitch-regulated. The different types of wind turbines have all
their advantages and disadvantages. They also contribute in some way to the power
quality, either by improving the power quality or by making it worse.
A large number of papers presenting measurement results from various sites has
been written, dealing with a wind turbine connected to some grid [1][2][3].
However, none of the known papers has tried to map out what specific kind of
power quality problem a specific kind of wind turbine actually causes. There are, for
example, software simulations performed, but they only deal with power
fluctuations [4][5]. There are also many papers concerning power quality in general
and the effects of bad power quality on the grid [6][7][8]. Moreover, there is a
survey of wind power which just briefly discusses power quality effects from wind
turbines [9].
In this report, power quality problems are discussed from the wind power point of
view. Aerodynamical and mechanical principles for wind turbines are explained.
The electrical systems used for fixed-speed and variable-speed operation and the

2
power quality effects they will cause are described in detail. Moreover, wind power
related power quality aspects are discussed and calculation methods for various
voltage disturbances are derived. Finally, the report discusses the power quality of
autonomous wind-diesel grids and some of the protection devices with which wind
turbines are equipped.
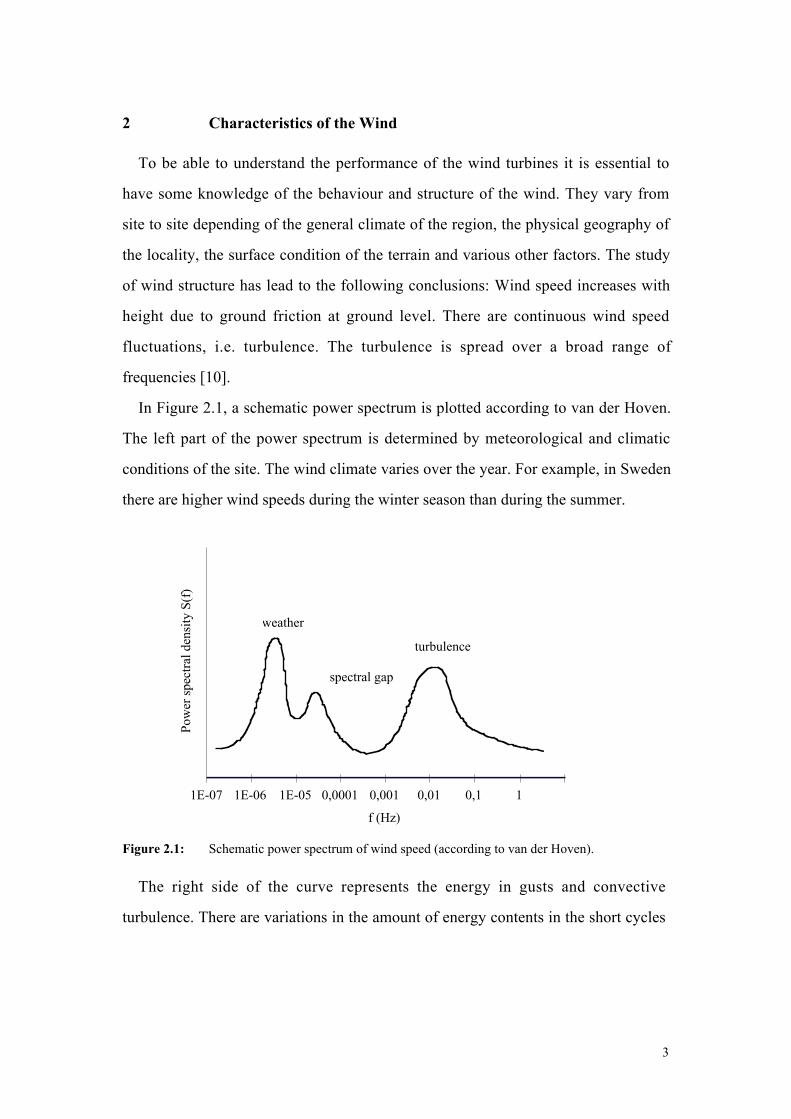
3
2 Characteristics of the Wind
To be able to understand the performance of the wind turbines it is essential to
have some knowledge of the behaviour and structure of the wind. They vary from
site to site depending of the general climate of the region, the physical geography of
the locality, the surface condition of the terrain and various other factors. The study
of wind structure has lead to the following conclusions: Wind speed increases with
height due to ground friction at ground level. There are continuous wind speed
fluctuations, i.e. turbulence. The turbulence is spread over a broad range of
frequencies [10].
In Figure 2.1, a schematic power spectrum is plotted according to van der Hoven.
The left part of the power spectrum is determined by meteorological and climatic
conditions of the site. The wind climate varies over the year. For example, in Sweden
there are higher wind speeds during the winter season than during the summer.
1E-07 1E-06 1E-05 0,0001 0,001 0,01 0,1 1
f (Hz)
Pow
er s
pect
ral d
ensi
ty S
(f)
weather
spectral gap
turbulence
Figure 2.1: Schematic power spectrum of wind speed (according to van der Hoven).
The right side of the curve represents the energy in gusts and convective
turbulence. There are variations in the amount of energy contents in the short cycles
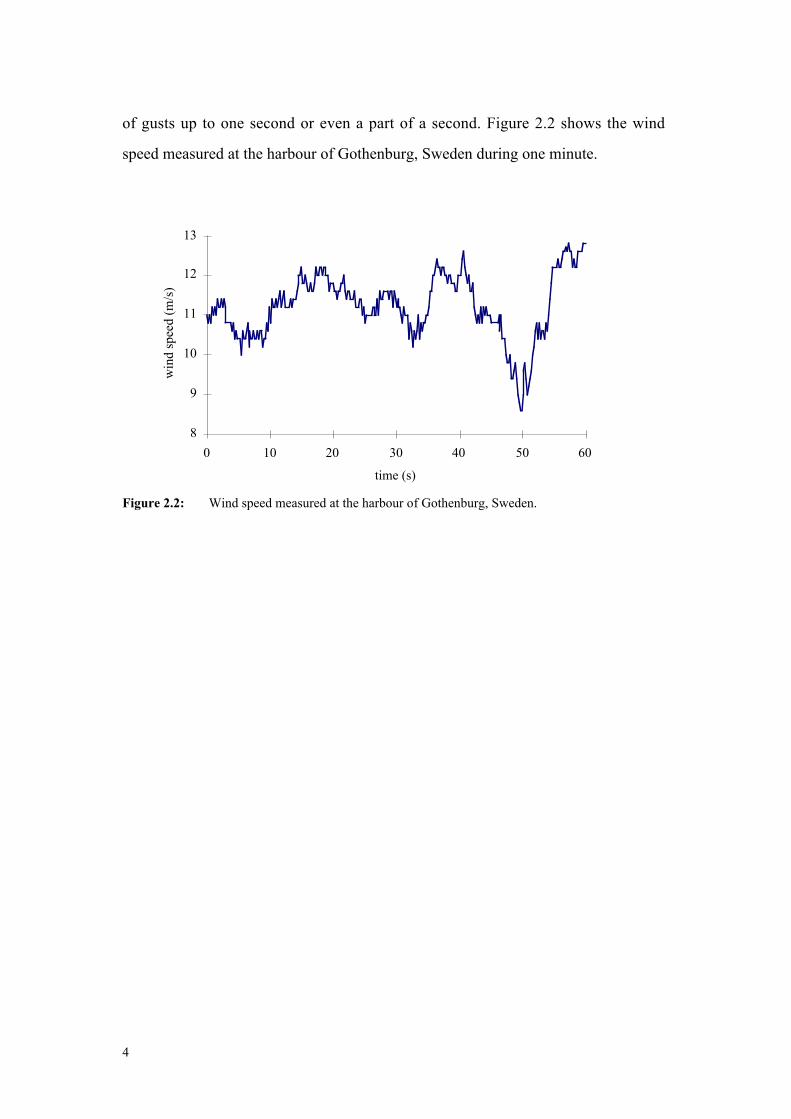
4
of gusts up to one second or even a part of a second. Figure 2.2 shows the wind
speed measured at the harbour of Gothenburg, Sweden during one minute.
8
9
10
11
12
13
0 10 20 30 40 50 60
time (s)
win
d sp
eed
(m/s
)
Figure 2.2: Wind speed measured at the harbour of Gothenburg, Sweden.

5
3 Wind Turbines
The mechanical and electrical principles as well as the aerodynamical behaviour
of wind turbines are important issues. This chapter describes the operational criteria
of wind turbines and the difference between stall- and pitch-regulation. Also the
electrical systems used in fixed- and variable-speed wind turbines are described.
3.1 Operation Criteria for Wind Turbines
The energy available in the wind increases with the cube of the wind speed. Since
the energy content of the wind is low during low wind speed conditions, wind
turbines are cut in at the wind speed of 3-4 m/s. When the wind speed is further
increased, the power output also increases. Depending on the type of wind turbine
used, rated power is reached at a wind speed of 8-14 m/s. At higher wind speeds the
power output is limited to the rated power of the generator. Hence, the power from
the turbine must be limited. This limitation in power from the turbine used to be
achieved in two different ways: either by pitching the turbine blades away from the
wind mechanically (pitch regulation) or by an aerodynamic limitation of the power
(stall regulation) [9]. At high wind conditions, above 25 m/s, wind turbines are shut
down. In Figure 3.1, the available wind power, as well as the power from a stall-
regulated and from a pitch-regulated turbine are shown.
Regardless of regulation principle used (stall or pitch regulation) power
fluctuations will appear. A horizontal axis wind turbine always has some kind of a
tower. The tower always disturbs the wind flow both upstream and downstream
[11]. Each time a turbine blade passes the tower, it gets into the tower shadow with a
power dip as a result. If the turbine has three blades, a power drop will appear three
times per revolution of the turbine.
The left turbine in Figure 3.2 shows the rotor position when one blade passes the
tower. As can be seen, at this moment none of the remaining two blades is at the top
position where the wind speed is the highest. Both the tower shadow effect and the
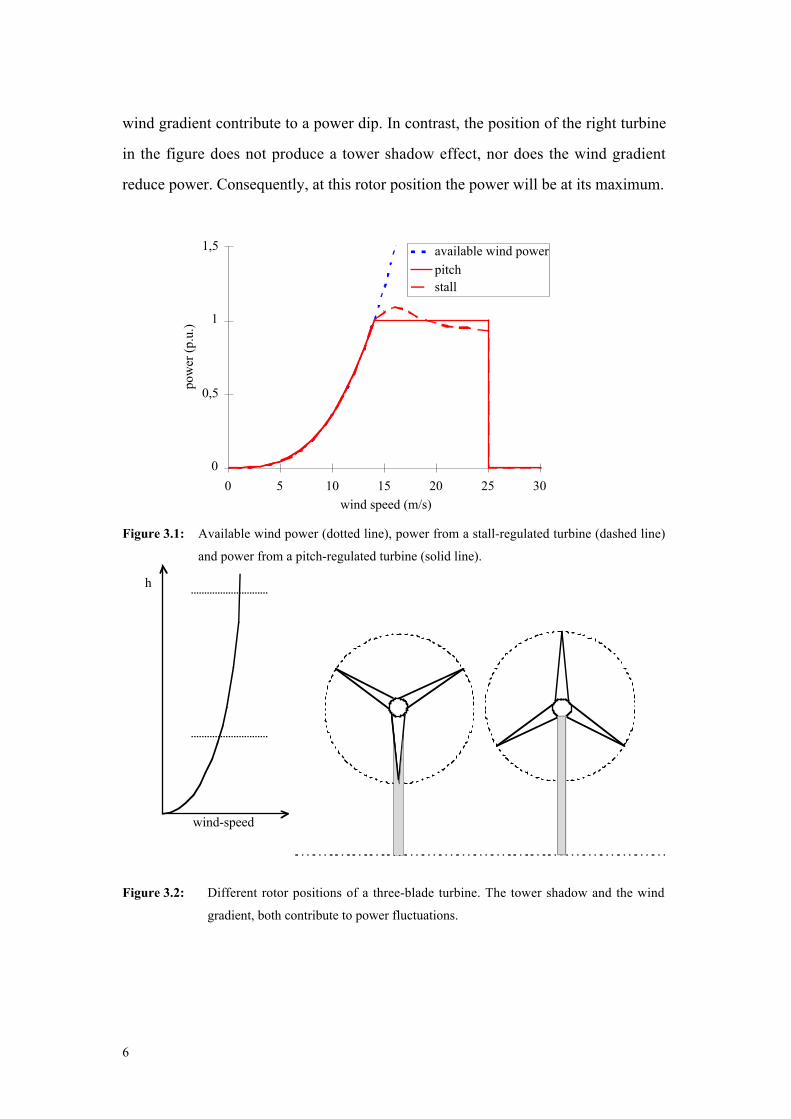
6
wind gradient contribute to a power dip. In contrast, the position of the right turbine
in the figure does not produce a tower shadow effect, nor does the wind gradient
reduce power. Consequently, at this rotor position the power will be at its maximum.
0
0,5
1
1,5
0 5 10 15 20 25 30wind speed (m/s)
pow
er (
p.u.
)
available wind powerpitchstall
Figure 3.1: Available wind power (dotted line), power from a stall-regulated turbine (dashed line)
and power from a pitch-regulated turbine (solid line).
Figure 3.2: Different rotor positions of a three-blade turbine. The tower shadow and the wind
gradient, both contribute to power fluctuations.
h
wind-speed
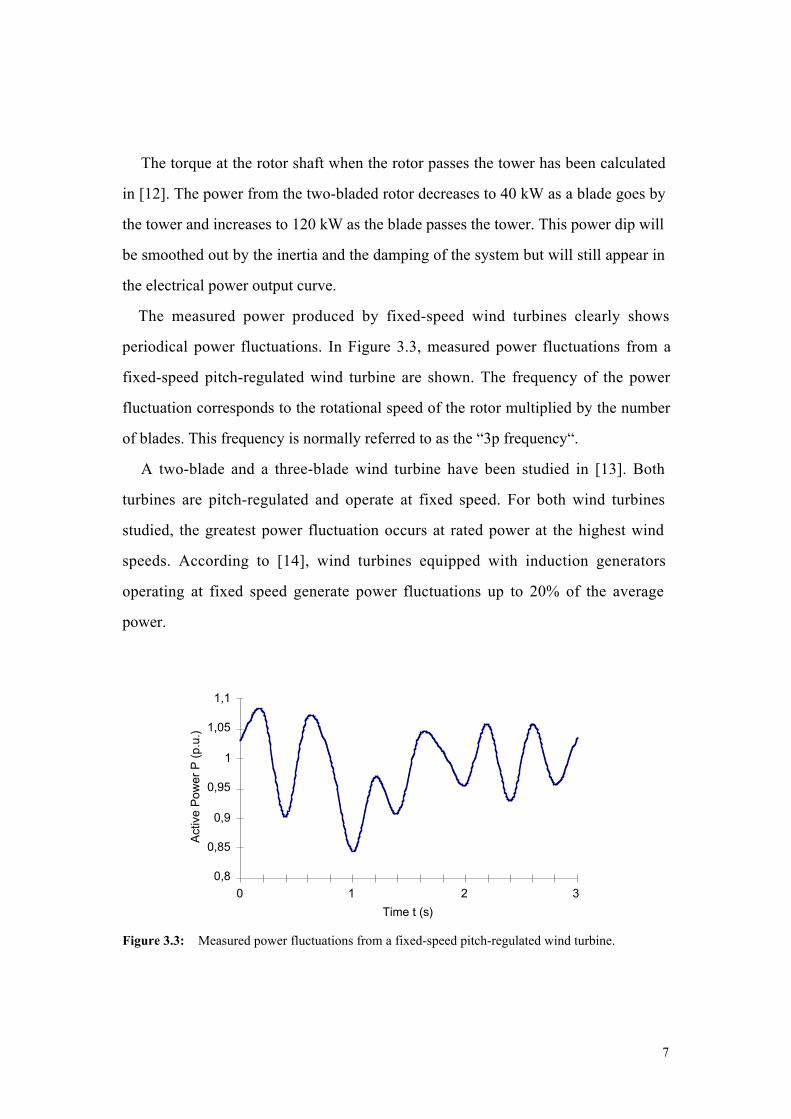
7
The torque at the rotor shaft when the rotor passes the tower has been calculated
in [12]. The power from the two-bladed rotor decreases to 40 kW as a blade goes by
the tower and increases to 120 kW as the blade passes the tower. This power dip will
be smoothed out by the inertia and the damping of the system but will still appear in
the electrical power output curve.
The measured power produced by fixed-speed wind turbines clearly shows
periodical power fluctuations. In Figure 3.3, measured power fluctuations from a
fixed-speed pitch-regulated wind turbine are shown. The frequency of the power
fluctuation corresponds to the rotational speed of the rotor multiplied by the number
of blades. This frequency is normally referred to as the “3p frequency“.
A two-blade and a three-blade wind turbine have been studied in [13]. Both
turbines are pitch-regulated and operate at fixed speed. For both wind turbines
studied, the greatest power fluctuation occurs at rated power at the highest wind
speeds. According to [14], wind turbines equipped with induction generators
operating at fixed speed generate power fluctuations up to 20% of the average
power.
0,8
0,85
0,9
0,95
1
1,05
1,1
0 1 2 3
Time t (s)
Act
ive
Pow
er P
(p.
u.)
Figure 3.3: Measured power fluctuations from a fixed-speed pitch-regulated wind turbine.

8

9
3.1.1 Pitch Regulation
Pitch-regulated wind turbines control the power flow by means of the pitch angle
of the blades. Generally, advantages of this type of regulation are good power
control, flatwise aerodynamical damping, loads reducing with wind speed, assisted
start and built-in braking. Some of the disadvantages are extra complexity, reducing
reliability as well as cost of pitch mechanism and control systems [11].
From an electrical point of view, good power control means that the mean value
of the power output is kept close to the rated power of the generator at wind speeds
from rated wind speed up to the shut-down wind speed. The instantaneous power
will, due to gusts and the speed of the pitch mechanism (i.e. limited band-width),
fluctuate around the rated mean value of the power.
3.1.2 Stall Regulation
Stall regulation is the simplest and cheapest control method. Some of the
disadvantages are loss of energy, high stationary loads and no assisted start [11].
From an electrical point of view, two things are worth pointing out.
Since the power from the turbine is always controlled aerodynamically, stall-
regulated wind turbines do not produce fluctuating power caused by the pitch
mechanism. Unfortunately, stall-regulated wind turbines may have a power output
which sometimes is above the rated one, due to variations in the density of the air
and imperfections in the aerodynamics.
Stall-regulated wind turbines do not have assisted start, which implies that the
power of the turbine cannot be controlled during the connecting sequence. The start
sequence of wind turbines is described in detail in Section 3.2.3.
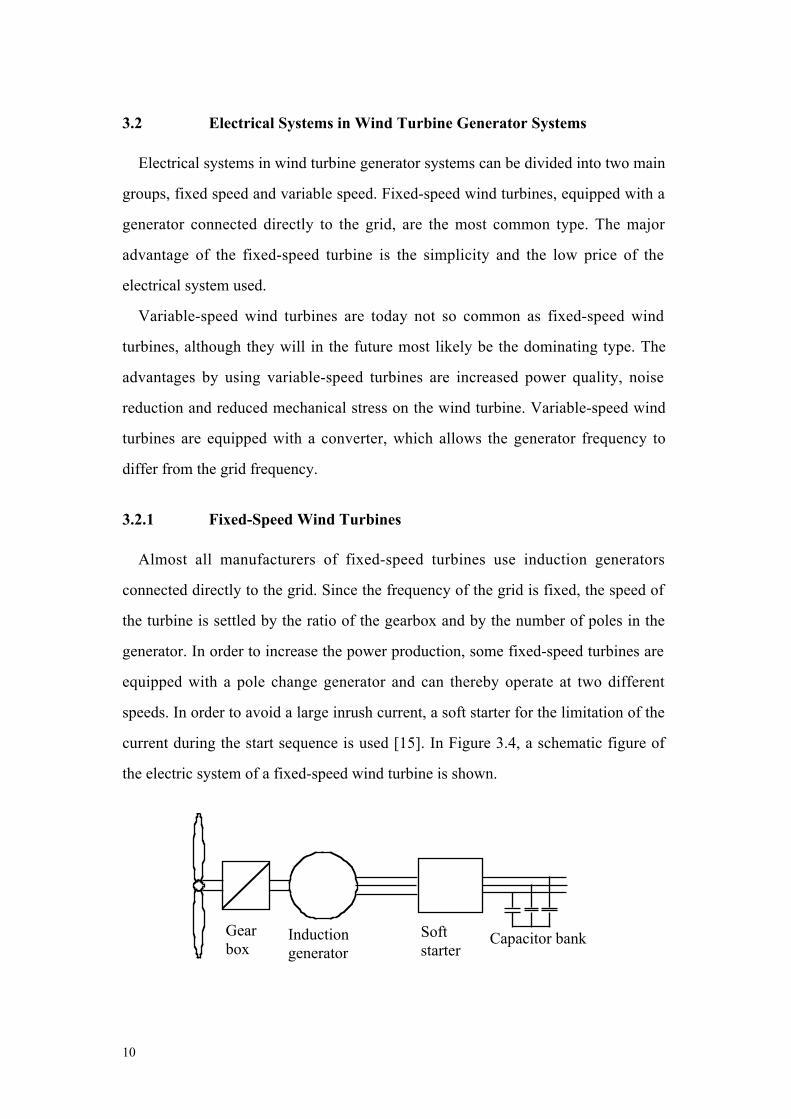
10
3.2 Electrical Systems in Wind Turbine Generator Systems
Electrical systems in wind turbine generator systems can be divided into two main
groups, fixed speed and variable speed. Fixed-speed wind turbines, equipped with a
generator connected directly to the grid, are the most common type. The major
advantage of the fixed-speed turbine is the simplicity and the low price of the
electrical system used.
Variable-speed wind turbines are today not so common as fixed-speed wind
turbines, although they will in the future most likely be the dominating type. The
advantages by using variable-speed turbines are increased power quality, noise
reduction and reduced mechanical stress on the wind turbine. Variable-speed wind
turbines are equipped with a converter, which allows the generator frequency to
differ from the grid frequency.
3.2.1 Fixed-Speed Wind Turbines
Almost all manufacturers of fixed-speed turbines use induction generators
connected directly to the grid. Since the frequency of the grid is fixed, the speed of
the turbine is settled by the ratio of the gearbox and by the number of poles in the
generator. In order to increase the power production, some fixed-speed turbines are
equipped with a pole change generator and can thereby operate at two different
speeds. In order to avoid a large inrush current, a soft starter for the limitation of the
current during the start sequence is used [15]. In Figure 3.4, a schematic figure of
the electric system of a fixed-speed wind turbine is shown.
Gearbox
Softstarter
Inductiongenerator
Capacitor bank
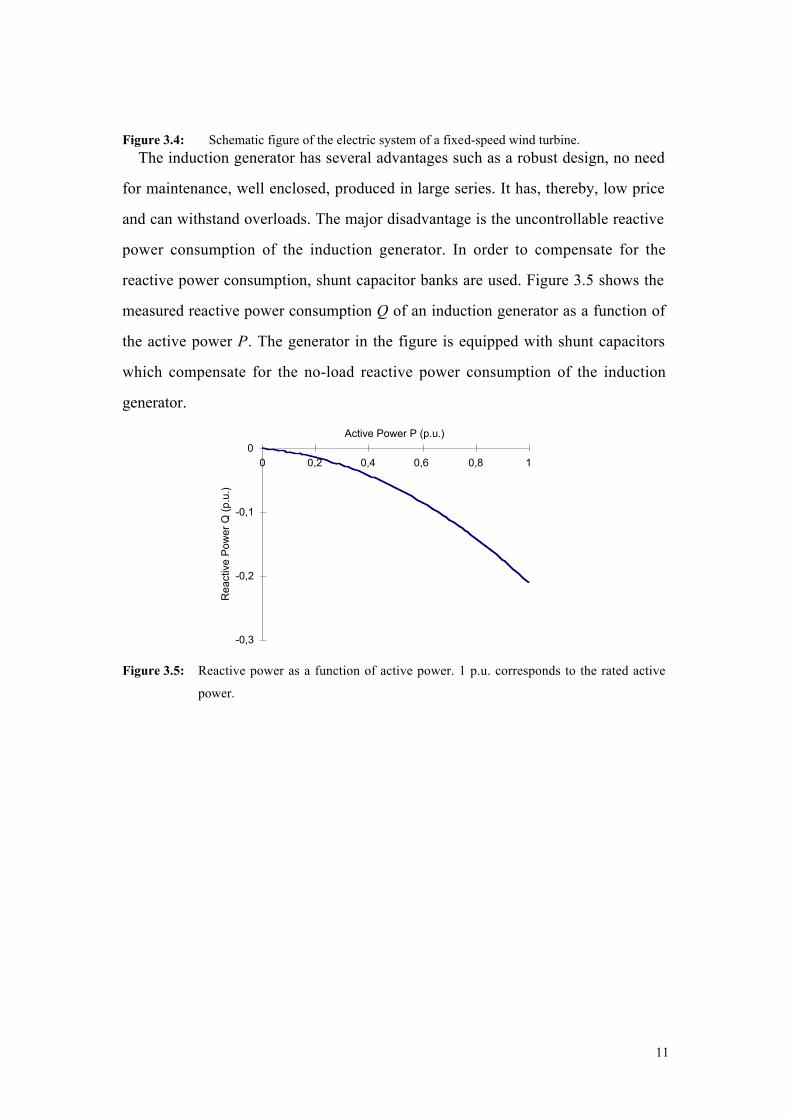
11
Figure 3.4: Schematic figure of the electric system of a fixed-speed wind turbine.The induction generator has several advantages such as a robust design, no need
for maintenance, well enclosed, produced in large series. It has, thereby, low price
and can withstand overloads. The major disadvantage is the uncontrollable reactive
power consumption of the induction generator. In order to compensate for the
reactive power consumption, shunt capacitor banks are used. Figure 3.5 shows the
measured reactive power consumption Q of an induction generator as a function of
the active power P. The generator in the figure is equipped with shunt capacitors
which compensate for the no-load reactive power consumption of the induction
generator.
-0,3
-0,2
-0,1
00 0,2 0,4 0,6 0,8 1
Active Power P (p.u.)
Rea
ctiv
e P
ower
Q (
p.u.
)
Figure 3.5: Reactive power as a function of active power. 1 p.u. corresponds to the rated active
power.
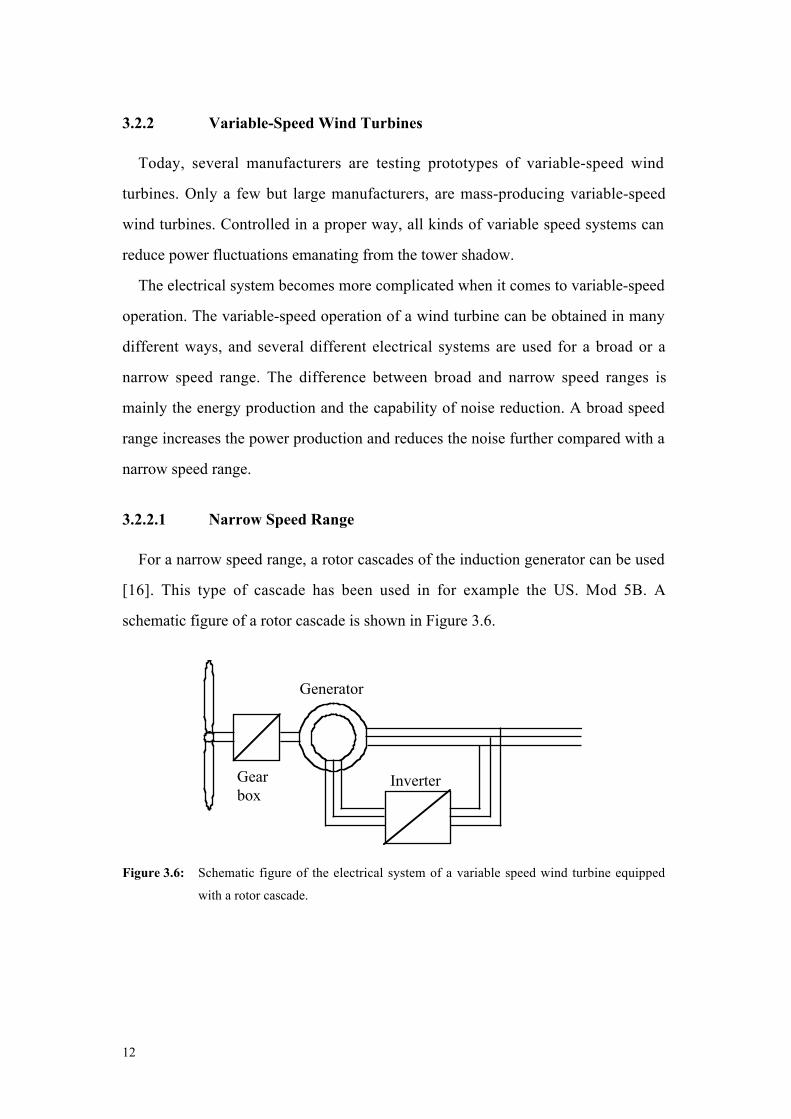
12
3.2.2 Variable-Speed Wind Turbines
Today, several manufacturers are testing prototypes of variable-speed wind
turbines. Only a few but large manufacturers, are mass-producing variable-speed
wind turbines. Controlled in a proper way, all kinds of variable speed systems can
reduce power fluctuations emanating from the tower shadow.
The electrical system becomes more complicated when it comes to variable-speed
operation. The variable-speed operation of a wind turbine can be obtained in many
different ways, and several different electrical systems are used for a broad or a
narrow speed range. The difference between broad and narrow speed ranges is
mainly the energy production and the capability of noise reduction. A broad speed
range increases the power production and reduces the noise further compared with a
narrow speed range.
3.2.2.1 Narrow Speed Range
For a narrow speed range, a rotor cascades of the induction generator can be used
[16]. This type of cascade has been used in for example the US. Mod 5B. A
schematic figure of a rotor cascade is shown in Figure 3.6.
Gearbox
Inverter
Generator
Figure 3.6: Schematic figure of the electrical system of a variable speed wind turbine equipped
with a rotor cascade.
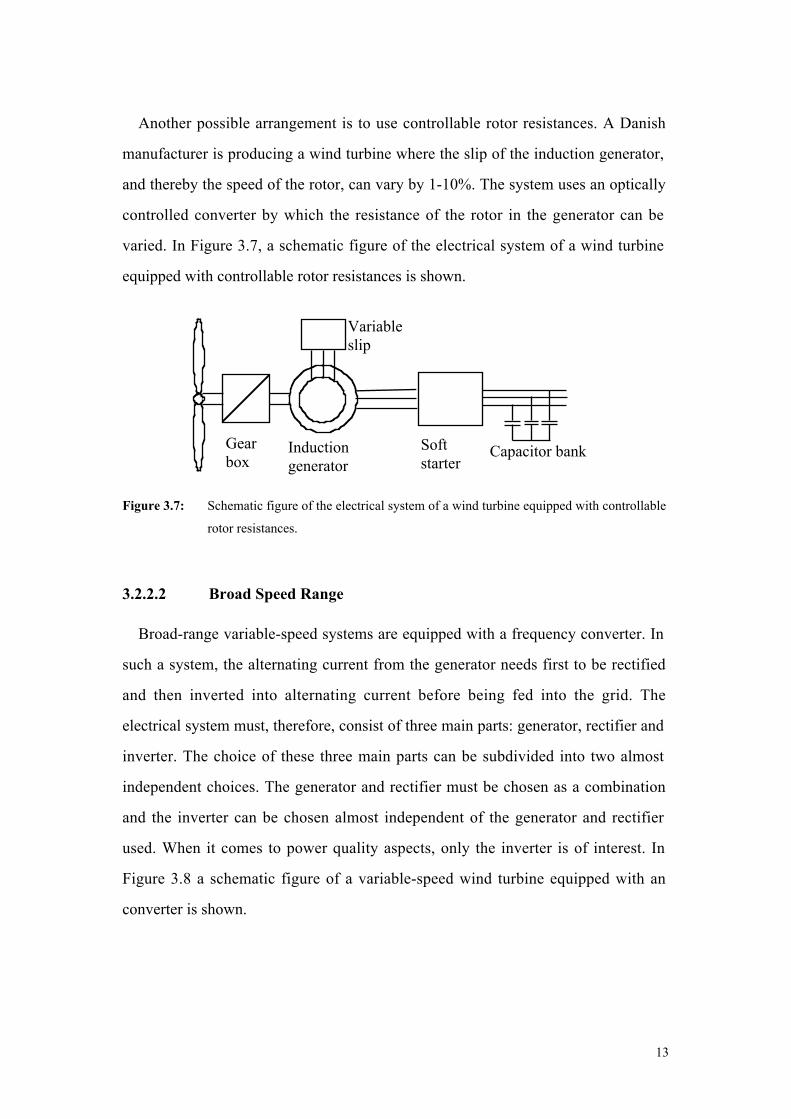
13
Another possible arrangement is to use controllable rotor resistances. A Danish
manufacturer is producing a wind turbine where the slip of the induction generator,
and thereby the speed of the rotor, can vary by 1-10%. The system uses an optically
controlled converter by which the resistance of the rotor in the generator can be
varied. In Figure 3.7, a schematic figure of the electrical system of a wind turbine
equipped with controllable rotor resistances is shown.
Gearbox
Softstarter
Inductiongenerator
Capacitor bank
Variableslip
Figure 3.7: Schematic figure of the electrical system of a wind turbine equipped with controllable
rotor resistances.
3.2.2.2 Broad Speed Range
Broad-range variable-speed systems are equipped with a frequency converter. In
such a system, the alternating current from the generator needs first to be rectified
and then inverted into alternating current before being fed into the grid. The
electrical system must, therefore, consist of three main parts: generator, rectifier and
inverter. The choice of these three main parts can be subdivided into two almost
independent choices. The generator and rectifier must be chosen as a combination
and the inverter can be chosen almost independent of the generator and rectifier
used. When it comes to power quality aspects, only the inverter is of interest. In
Figure 3.8 a schematic figure of a variable-speed wind turbine equipped with an
converter is shown.
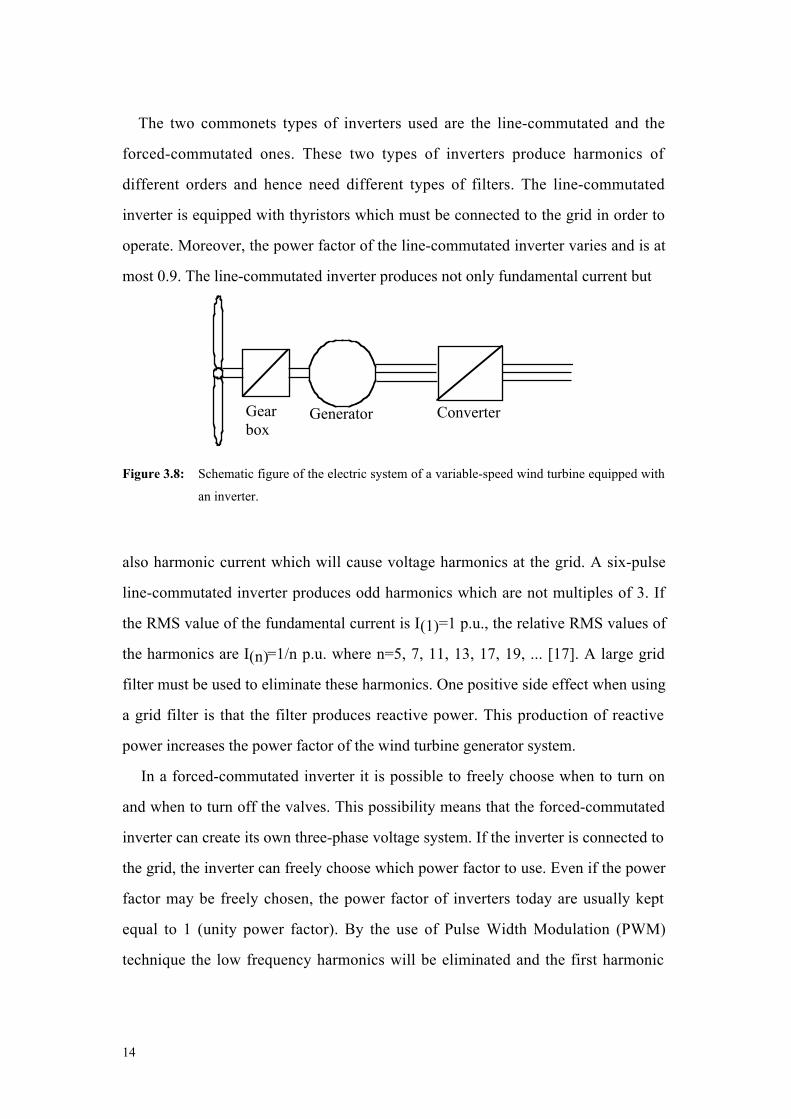
14
The two commonets types of inverters used are the line-commutated and the
forced-commutated ones. These two types of inverters produce harmonics of
different orders and hence need different types of filters. The line-commutated
inverter is equipped with thyristors which must be connected to the grid in order to
operate. Moreover, the power factor of the line-commutated inverter varies and is at
most 0.9. The line-commutated inverter produces not only fundamental current but
Gearbox
ConverterGenerator
Figure 3.8: Schematic figure of the electric system of a variable-speed wind turbine equipped with
an inverter.
also harmonic current which will cause voltage harmonics at the grid. A six-pulse
line-commutated inverter produces odd harmonics which are not multiples of 3. If
the RMS value of the fundamental current is I(1)=1 p.u., the relative RMS values of
the harmonics are I(n)=1/n p.u. where n=5, 7, 11, 13, 17, 19, ... [17]. A large grid
filter must be used to eliminate these harmonics. One positive side effect when using
a grid filter is that the filter produces reactive power. This production of reactive
power increases the power factor of the wind turbine generator system.
In a forced-commutated inverter it is possible to freely choose when to turn on
and when to turn off the valves. This possibility means that the forced-commutated
inverter can create its own three-phase voltage system. If the inverter is connected to
the grid, the inverter can freely choose which power factor to use. Even if the power
factor may be freely chosen, the power factor of inverters today are usually kept
equal to 1 (unity power factor). By the use of Pulse Width Modulation (PWM)
technique the low frequency harmonics will be eliminated and the first harmonic

15
will have a frequency around the switching frequency of the inverter. Usually, when
IGBT-valves are used, the switching frequency is about 5 to 10 kHz. Only a small
grid filter will be needed because of the high switching frequency.
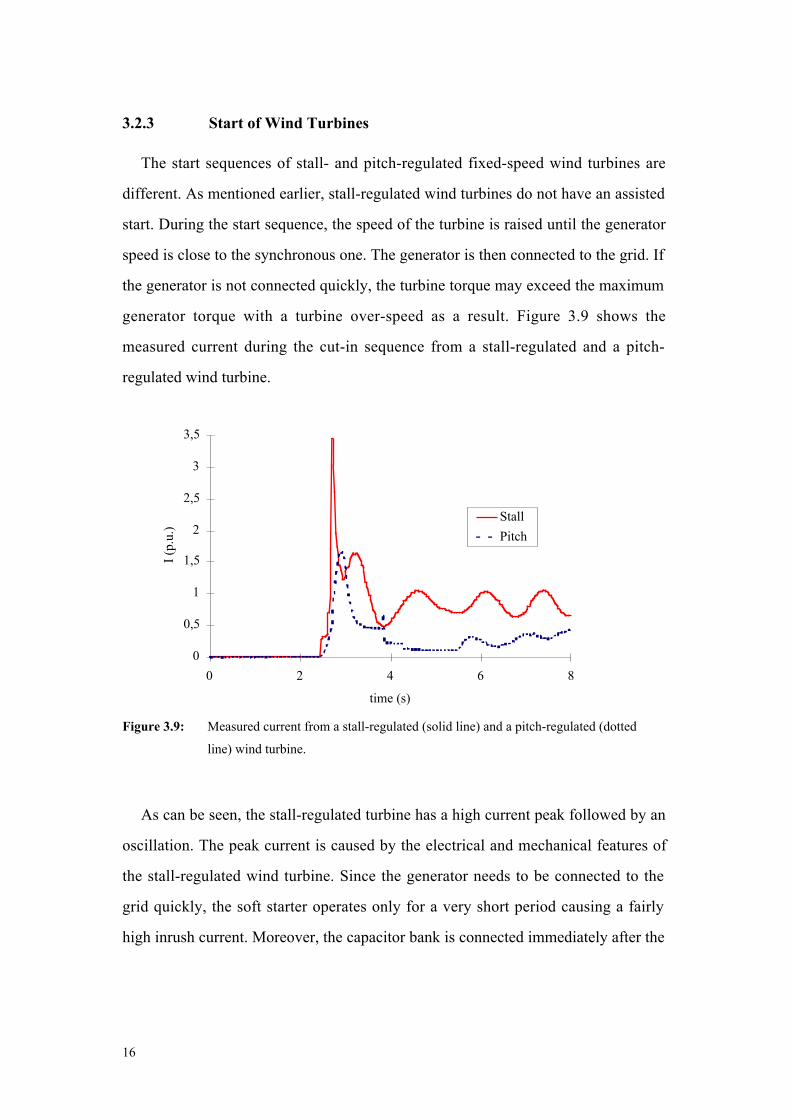
16
3.2.3 Start of Wind Turbines
The start sequences of stall- and pitch-regulated fixed-speed wind turbines are
different. As mentioned earlier, stall-regulated wind turbines do not have an assisted
start. During the start sequence, the speed of the turbine is raised until the generator
speed is close to the synchronous one. The generator is then connected to the grid. If
the generator is not connected quickly, the turbine torque may exceed the maximum
generator torque with a turbine over-speed as a result. Figure 3.9 shows the
measured current during the cut-in sequence from a stall-regulated and a pitch-
regulated wind turbine.
0
0,5
1
1,5
2
2,5
3
3,5
0 2 4 6 8
time (s)
I (p
.u.)
Stall
Pitch
Figure 3.9: Measured current from a stall-regulated (solid line) and a pitch-regulated (dotted
line) wind turbine.
As can be seen, the stall-regulated turbine has a high current peak followed by an
oscillation. The peak current is caused by the electrical and mechanical features of
the stall-regulated wind turbine. Since the generator needs to be connected to the
grid quickly, the soft starter operates only for a very short period causing a fairly
high inrush current. Moreover, the capacitor bank is connected immediately after the

17
generator is connected to the grid. The connection of the capacitor bank also
contributes to the current peak. The mechanical contribution to the peak current is
the torque produced by the wind speed and the inertia of the turbine as it is brought
from a small over-speed to a constant speed. The oscillating current after the
connection is a mechanical oscillation caused by the abrupt generator connection.
In the case of the pitch-regulated turbine, where the start is assisted, the torque
and the speed of the turbine can be controlled. Hence, the cut in of the generator can
be performed in a smoother way. As can be seen, the current is raised slowly and the
speed of the turbine is brought to a constant speed in a more controlled way. The
smooth connection of the generator is a result of a controlled speed and a long
operation time of the soft starter. The switching action of the capacitor banks is also
performed a short time after the soft starter has stopped. The first capacitor
switching is visible at the time just before 4 sec. The second switch is performed just
after 4 sec. In Chapter 4.5, the impact of capacitor switching is described more in
detail. The figure illustrates the difference between assisted and non-assisted starts,
although the wind conditions during the start of the two wind turbines are not
exactly the same.

18
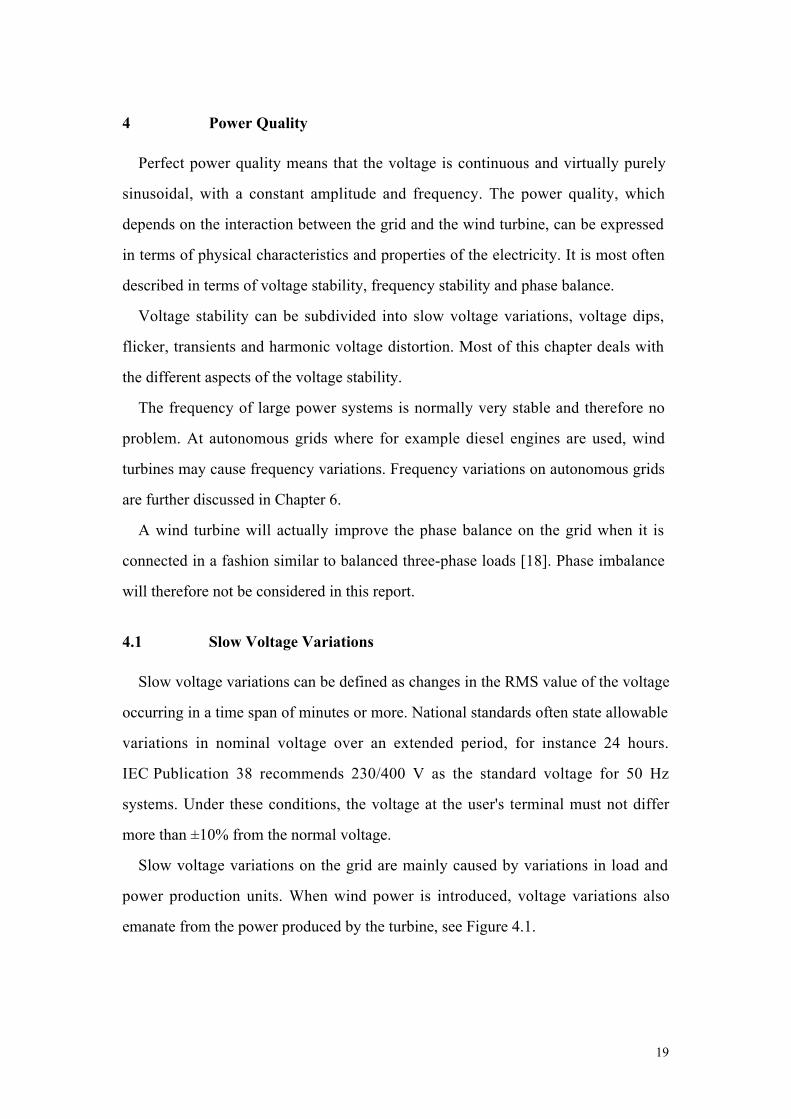
19
4 Power Quality
Perfect power quality means that the voltage is continuous and virtually purely
sinusoidal, with a constant amplitude and frequency. The power quality, which
depends on the interaction between the grid and the wind turbine, can be expressed
in terms of physical characteristics and properties of the electricity. It is most often
described in terms of voltage stability, frequency stability and phase balance.
Voltage stability can be subdivided into slow voltage variations, voltage dips,
flicker, transients and harmonic voltage distortion. Most of this chapter deals with
the different aspects of the voltage stability.
The frequency of large power systems is normally very stable and therefore no
problem. At autonomous grids where for example diesel engines are used, wind
turbines may cause frequency variations. Frequency variations on autonomous grids
are further discussed in Chapter 6.
A wind turbine will actually improve the phase balance on the grid when it is
connected in a fashion similar to balanced three-phase loads [18]. Phase imbalance
will therefore not be considered in this report.
4.1 Slow Voltage Variations
Slow voltage variations can be defined as changes in the RMS value of the voltage
occurring in a time span of minutes or more. National standards often state allowable
variations in nominal voltage over an extended period, for instance 24 hours.
IEC Publication 38 recommends 230/400 V as the standard voltage for 50 Hz
systems. Under these conditions, the voltage at the user's terminal must not differ
more than ±10% from the normal voltage.
Slow voltage variations on the grid are mainly caused by variations in load and
power production units. When wind power is introduced, voltage variations also
emanate from the power produced by the turbine, see Figure 4.1.
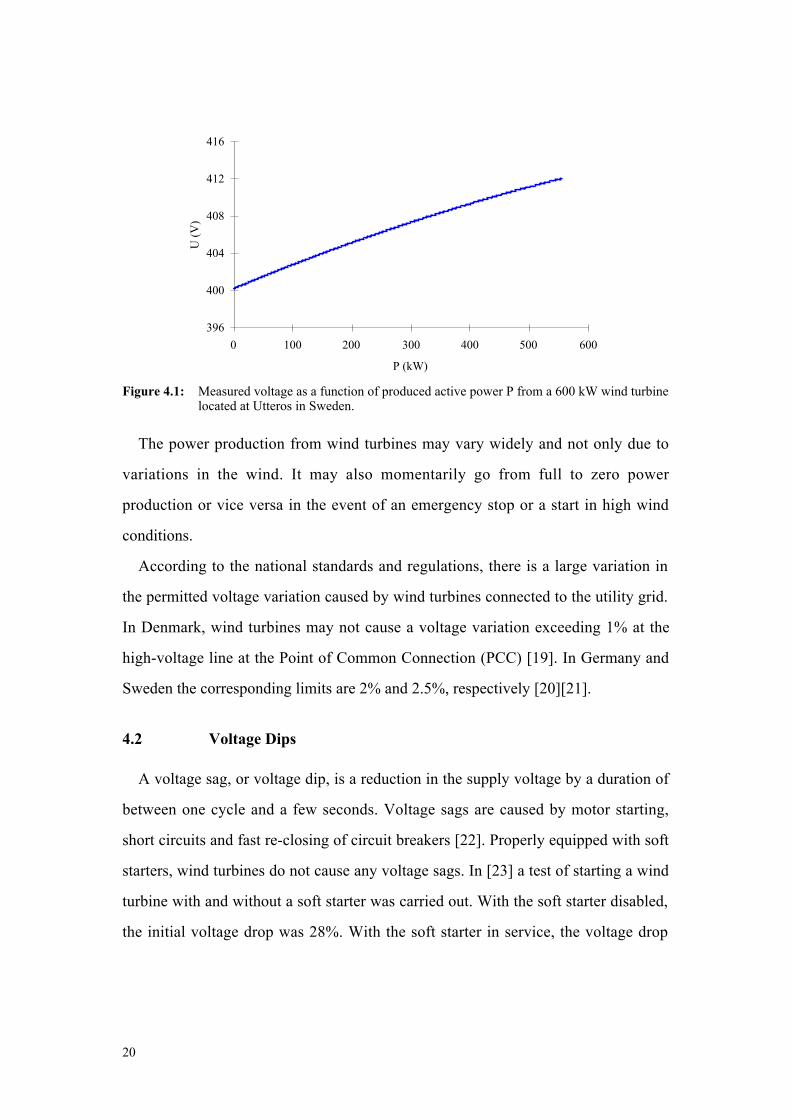
20
396
400
404
408
412
416
0 100 200 300 400 500 600
P (kW)
U (
V)
Figure 4.1: Measured voltage as a function of produced active power P from a 600 kW wind turbinelocated at Utteros in Sweden.
The power production from wind turbines may vary widely and not only due to
variations in the wind. It may also momentarily go from full to zero power
production or vice versa in the event of an emergency stop or a start in high wind
conditions.
According to the national standards and regulations, there is a large variation in
the permitted voltage variation caused by wind turbines connected to the utility grid.
In Denmark, wind turbines may not cause a voltage variation exceeding 1% at the
high-voltage line at the Point of Common Connection (PCC) [19]. In Germany and
Sweden the corresponding limits are 2% and 2.5%, respectively [20][21].
4.2 Voltage Dips
A voltage sag, or voltage dip, is a reduction in the supply voltage by a duration of
between one cycle and a few seconds. Voltage sags are caused by motor starting,
short circuits and fast re-closing of circuit breakers [22]. Properly equipped with soft
starters, wind turbines do not cause any voltage sags. In [23] a test of starting a wind
turbine with and without a soft starter was carried out. With the soft starter disabled,
the initial voltage drop was 28%. With the soft starter in service, the voltage drop
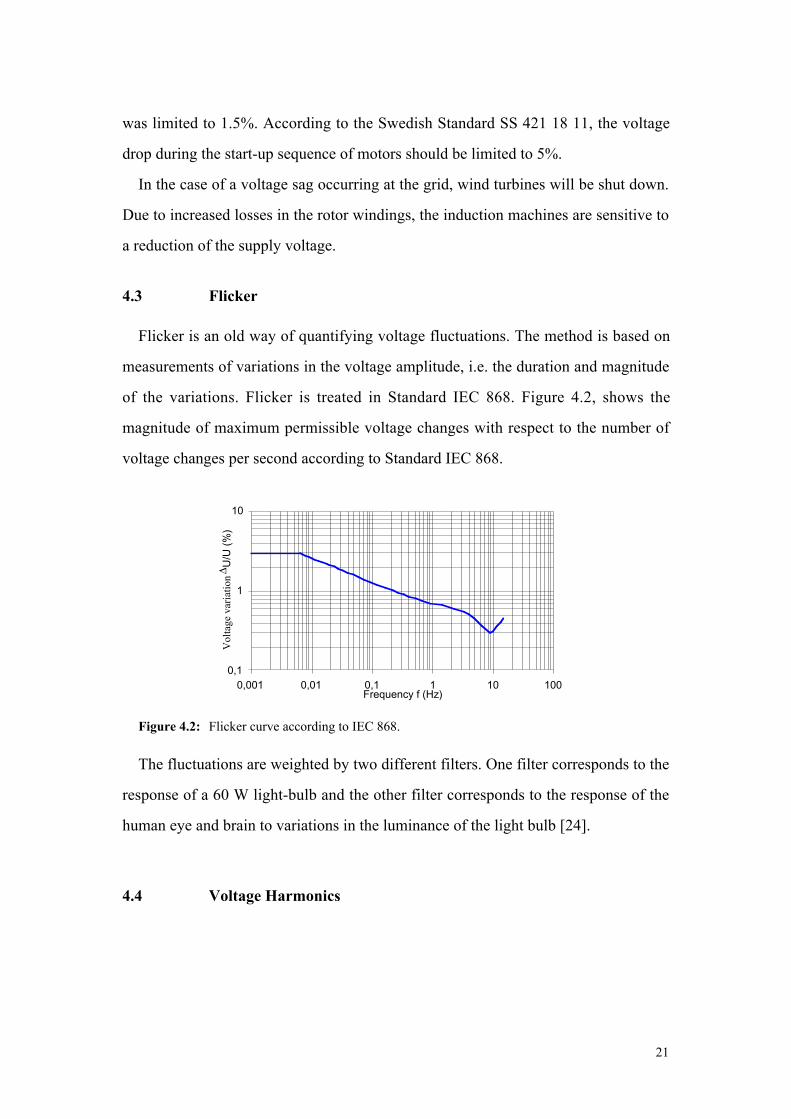
21
was limited to 1.5%. According to the Swedish Standard SS 421 18 11, the voltage
drop during the start-up sequence of motors should be limited to 5%.
In the case of a voltage sag occurring at the grid, wind turbines will be shut down.
Due to increased losses in the rotor windings, the induction machines are sensitive to
a reduction of the supply voltage.
4.3 Flicker
Flicker is an old way of quantifying voltage fluctuations. The method is based on
measurements of variations in the voltage amplitude, i.e. the duration and magnitude
of the variations. Flicker is treated in Standard IEC 868. Figure 4.2, shows the
magnitude of maximum permissible voltage changes with respect to the number of
voltage changes per second according to Standard IEC 868.
0,1
1
10
0,001 0,01 0,1 1 10 100Frequency f (Hz)
Vol
tage
var
iatio
n ∆U
/U (
%)
Figure 4.2: Flicker curve according to IEC 868.
The fluctuations are weighted by two different filters. One filter corresponds to the
response of a 60 W light-bulb and the other filter corresponds to the response of the
human eye and brain to variations in the luminance of the light bulb [24].
4.4 Voltage Harmonics
22
Voltage harmonics are virtually always present on the utility grid. Non-linear
loads, power electronic loads, rectifiers and inverters in motor drives etc. are some
sources which are producing harmonics. The effects of the harmonics include
overheating and failure of equipment, mis-operation of protective equipment,
nuisance tripping of sensitive load and interference with communication circuits [6].
As soon as the shunt capacitor banks are connected to the grid, an oscillating
circuit with the inductance of the grid is created. Since there are always harmonics on
the grid, the oscillating circuit will amplify a single harmonic [25]. Commonest is an
amplification of harmonics of the orders 7 or 11. The size of the capacitance and the
inductance determine which harmonics will be amplified.
Harmonic voltage distortions can be caused by the flow of harmonic currents in
the system. The harmonic distortion can be quantified by several different methods.
One of the most common methods is Total Harmonic Distortion (THD). An other
method for quantifying harmonics is the individual harmonic distortion. In, for
example, Standards IEC 1000-2-2 and CENELEC EN 50160 the maximum THD and
maximum permitted value of an individual component are stated. Today, the national
and international standards do not include harmonics between 2-10 kHz. If forced-
commutated inverters are used, the low-order harmonics will be replaced by higher-
order harmonics. By using PWM the low frequency harmonics are eliminated and
the first harmonic will have a frequency around the switching frequency (5 to 10
kHz) [26].
4.5 Transients
Transients seem to occur mainly when starting and stopping fixed-speed wind
turbines [3]. The wind turbines are connected to the grid when the wind speed
exceeds 3 - 4 m/s. During the connecting sequence, the speed of the turbine is raised
until the generator speed is close to the synchronous one. The generator is then
connected to the grid. In order to avoid a large inrush current, a soft starter is used to
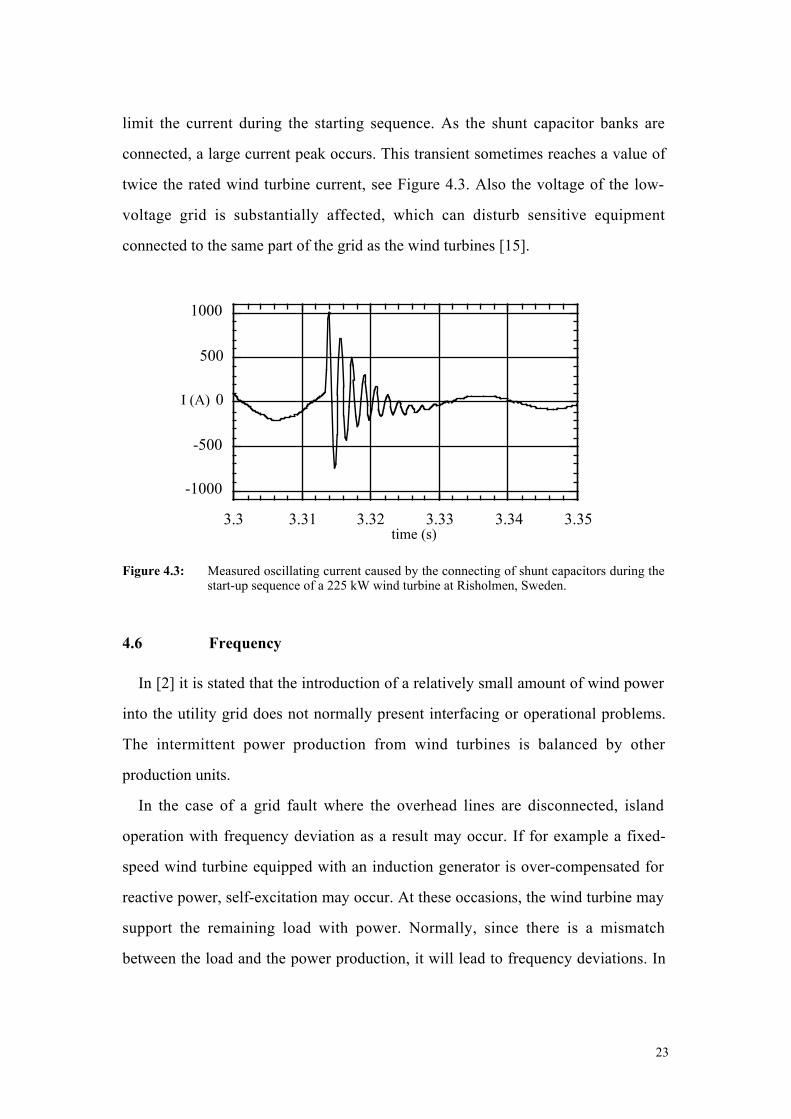
23
limit the current during the starting sequence. As the shunt capacitor banks are
connected, a large current peak occurs. This transient sometimes reaches a value of
twice the rated wind turbine current, see Figure 4.3. Also the voltage of the low-
voltage grid is substantially affected, which can disturb sensitive equipment
connected to the same part of the grid as the wind turbines [15].
-1000
-500
0
500
1000
3.3 3.31 3.32 3.33 3.34 3.35time (s)
I (A)
Figure 4.3: Measured oscillating current caused by the connecting of shunt capacitors during thestart-up sequence of a 225 kW wind turbine at Risholmen, Sweden.
4.6 Frequency
In [2] it is stated that the introduction of a relatively small amount of wind power
into the utility grid does not normally present interfacing or operational problems.
The intermittent power production from wind turbines is balanced by other
production units.
In the case of a grid fault where the overhead lines are disconnected, island
operation with frequency deviation as a result may occur. If for example a fixed-
speed wind turbine equipped with an induction generator is over-compensated for
reactive power, self-excitation may occur. At these occasions, the wind turbine may
support the remaining load with power. Normally, since there is a mismatch
between the load and the power production, it will lead to frequency deviations. In
24
[27] a case where four wind turbines were operating at a self-exciting mode for 15
minutes is documented. In order to avoid self-excitation, reactive power is normally
only compensated for up to the no-load reactive power demand of the induction
generator. Moreover, wind turbines are normally equipped with over voltage, under
voltage and frequency protection relays. In the event of an abnormal operating
condition, the wind turbine is shut down.
According to the European Standard EN 50 160, the nominal frequency of the
supply voltage shall be 50 Hz. Furthermore, under normal operating conditions the
average value of the fundamental frequency measured over 10 seconds in distribution
systems with no synchronous connection to an interconnected system shall be within
a range of 50 Hz ± 2 % (i.e. 49 Hz to 51 Hz) during 95 % of a week or 50 Hz ± 15 %
(i.e. 42.5 Hz to 57.5 Hz) during 100 % of a week.
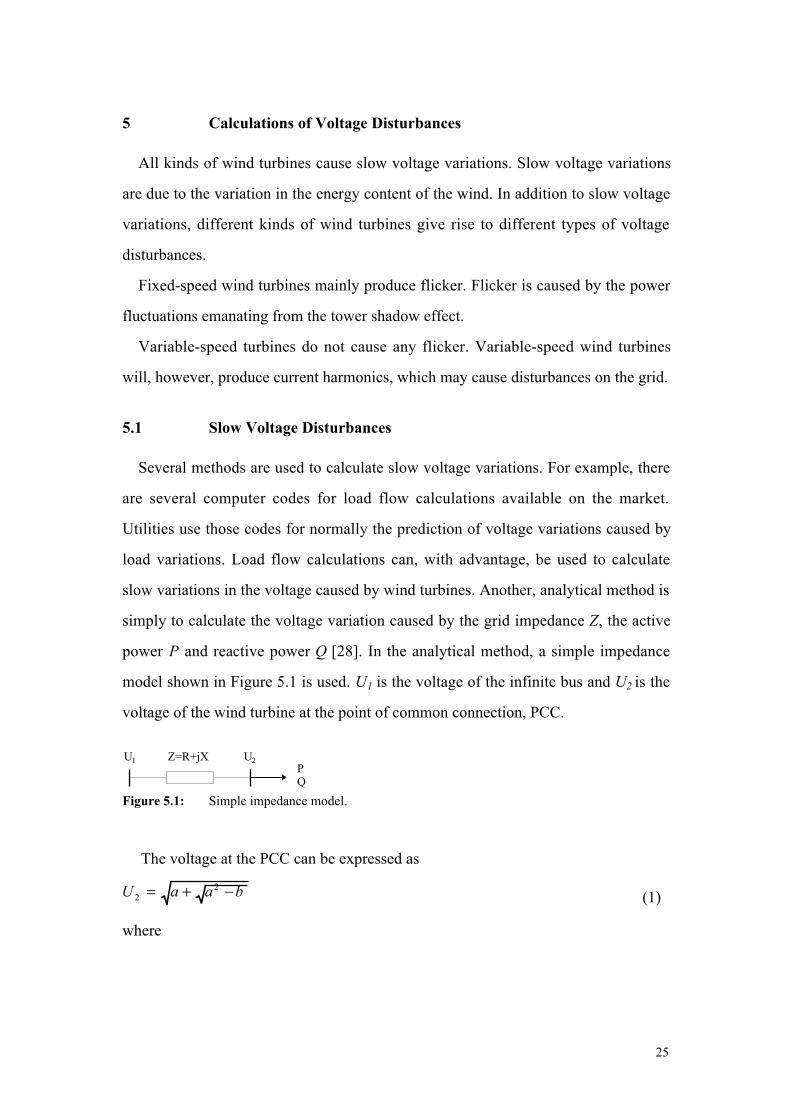
25
5 Calculations of Voltage Disturbances
All kinds of wind turbines cause slow voltage variations. Slow voltage variations
are due to the variation in the energy content of the wind. In addition to slow voltage
variations, different kinds of wind turbines give rise to different types of voltage
disturbances.
Fixed-speed wind turbines mainly produce flicker. Flicker is caused by the power
fluctuations emanating from the tower shadow effect.
Variable-speed turbines do not cause any flicker. Variable-speed wind turbines
will, however, produce current harmonics, which may cause disturbances on the grid.
5.1 Slow Voltage Disturbances
Several methods are used to calculate slow voltage variations. For example, there
are several computer codes for load flow calculations available on the market.
Utilities use those codes for normally the prediction of voltage variations caused by
load variations. Load flow calculations can, with advantage, be used to calculate
slow variations in the voltage caused by wind turbines. Another, analytical method is
simply to calculate the voltage variation caused by the grid impedance Z, the active
power P and reactive power Q [28]. In the analytical method, a simple impedance
model shown in Figure 5.1 is used. U1 is the voltage of the infinite bus and U2 is the
voltage of the wind turbine at the point of common connection, PCC.
Z=R+jX U2U1PQ
Figure 5.1: Simple impedance model.
The voltage at the PCC can be expressed as
U a a b22= + − (1)
where
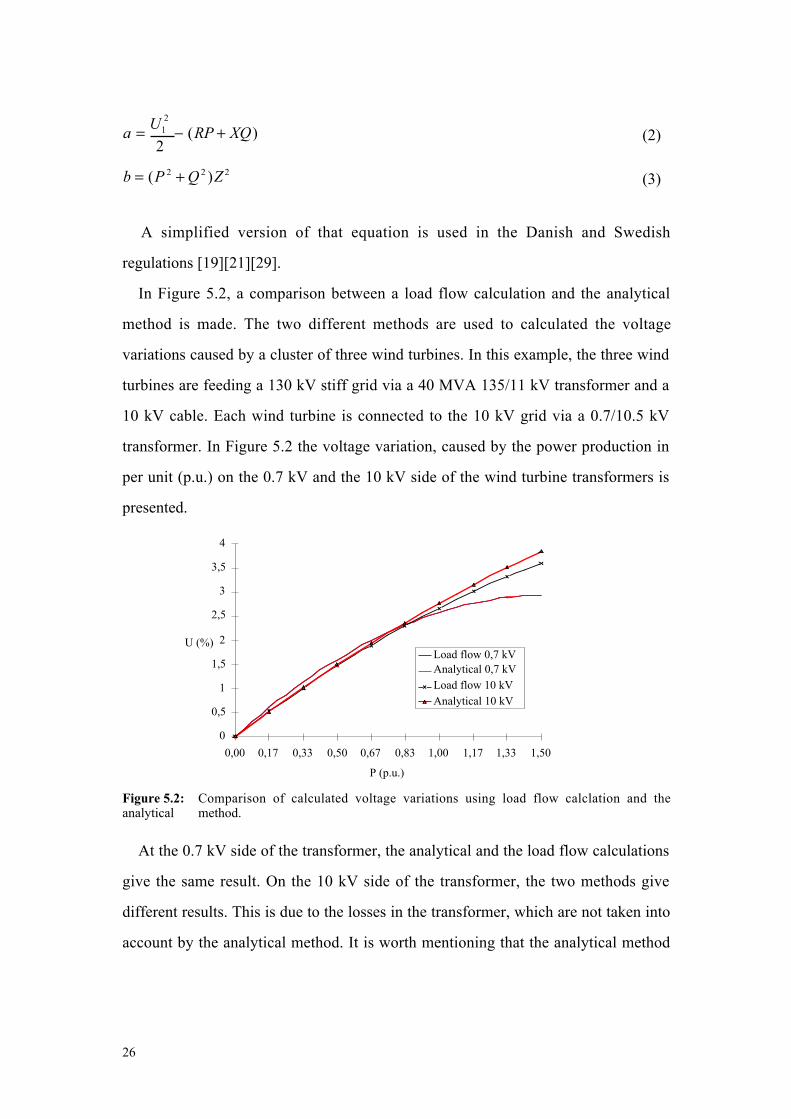
26
aU
RP XQ= − +12
2( ) (2)
b P Q Z= +( )2 2 2 (3)
A simplified version of that equation is used in the Danish and Swedish
regulations [19][21][29].
In Figure 5.2, a comparison between a load flow calculation and the analytical
method is made. The two different methods are used to calculated the voltage
variations caused by a cluster of three wind turbines. In this example, the three wind
turbines are feeding a 130 kV stiff grid via a 40 MVA 135/11 kV transformer and a
10 kV cable. Each wind turbine is connected to the 10 kV grid via a 0.7/10.5 kV
transformer. In Figure 5.2 the voltage variation, caused by the power production in
per unit (p.u.) on the 0.7 kV and the 10 kV side of the wind turbine transformers is
presented.
0
0,5
1
1,5
2
2,5
3
3,5
4
0,00 0,17 0,33 0,50 0,67 0,83 1,00 1,17 1,33 1,50
P (p.u.)
U (%)Load flow 0,7 kVAnalytical 0,7 kVLoad flow 10 kVAnalytical 10 kV
Figure 5.2: Comparison of calculated voltage variations using load flow calclation and theanalytical method.
At the 0.7 kV side of the transformer, the analytical and the load flow calculations
give the same result. On the 10 kV side of the transformer, the two methods give
different results. This is due to the losses in the transformer, which are not taken into
account by the analytical method. It is worth mentioning that the analytical method

27
over-estimates the voltage variation, which makes the method useful as a first
approximation.
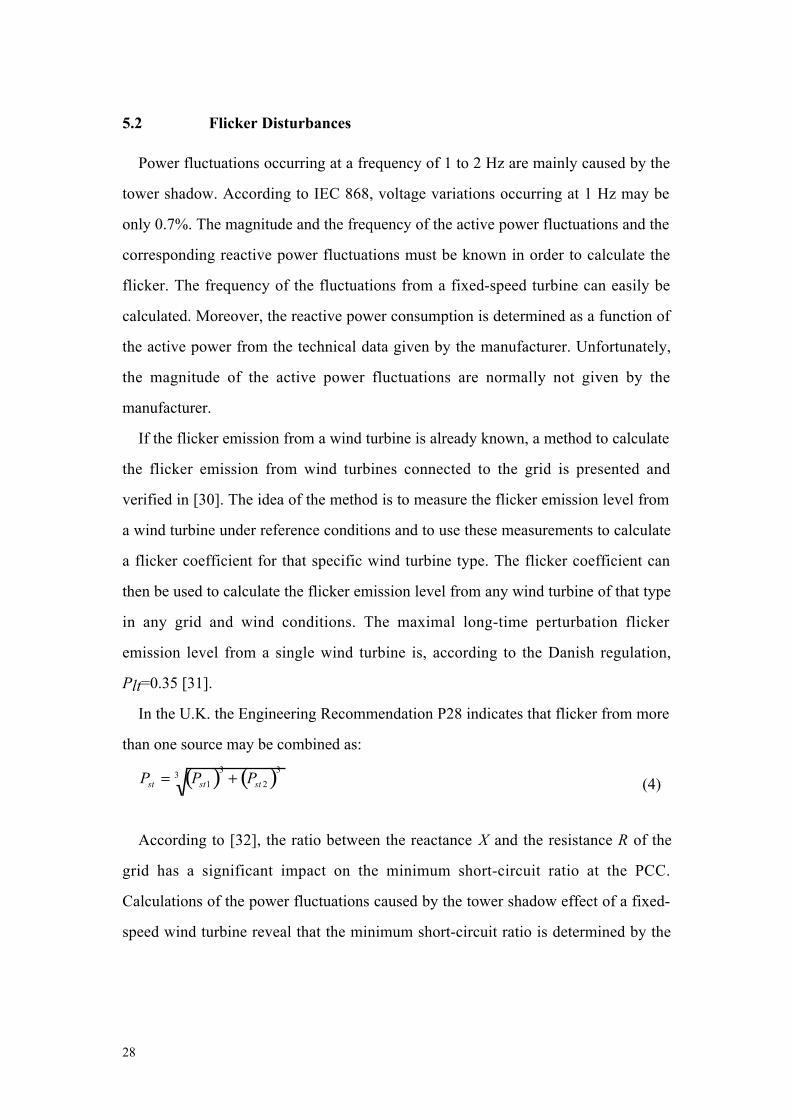
28
5.2 Flicker Disturbances
Power fluctuations occurring at a frequency of 1 to 2 Hz are mainly caused by the
tower shadow. According to IEC 868, voltage variations occurring at 1 Hz may be
only 0.7%. The magnitude and the frequency of the active power fluctuations and the
corresponding reactive power fluctuations must be known in order to calculate the
flicker. The frequency of the fluctuations from a fixed-speed turbine can easily be
calculated. Moreover, the reactive power consumption is determined as a function of
the active power from the technical data given by the manufacturer. Unfortunately,
the magnitude of the active power fluctuations are normally not given by the
manufacturer.
If the flicker emission from a wind turbine is already known, a method to calculate
the flicker emission from wind turbines connected to the grid is presented and
verified in [30]. The idea of the method is to measure the flicker emission level from
a wind turbine under reference conditions and to use these measurements to calculate
a flicker coefficient for that specific wind turbine type. The flicker coefficient can
then be used to calculate the flicker emission level from any wind turbine of that type
in any grid and wind conditions. The maximal long-time perturbation flicker
emission level from a single wind turbine is, according to the Danish regulation,
Plt=0.35 [31].
In the U.K. the Engineering Recommendation P28 indicates that flicker from more
than one source may be combined as:
( ) ( )P P Pst st st= +1
3
2
33
(4)
According to [32], the ratio between the reactance X and the resistance R of the
grid has a significant impact on the minimum short-circuit ratio at the PCC.
Calculations of the power fluctuations caused by the tower shadow effect of a fixed-
speed wind turbine reveal that the minimum short-circuit ratio is determined by the
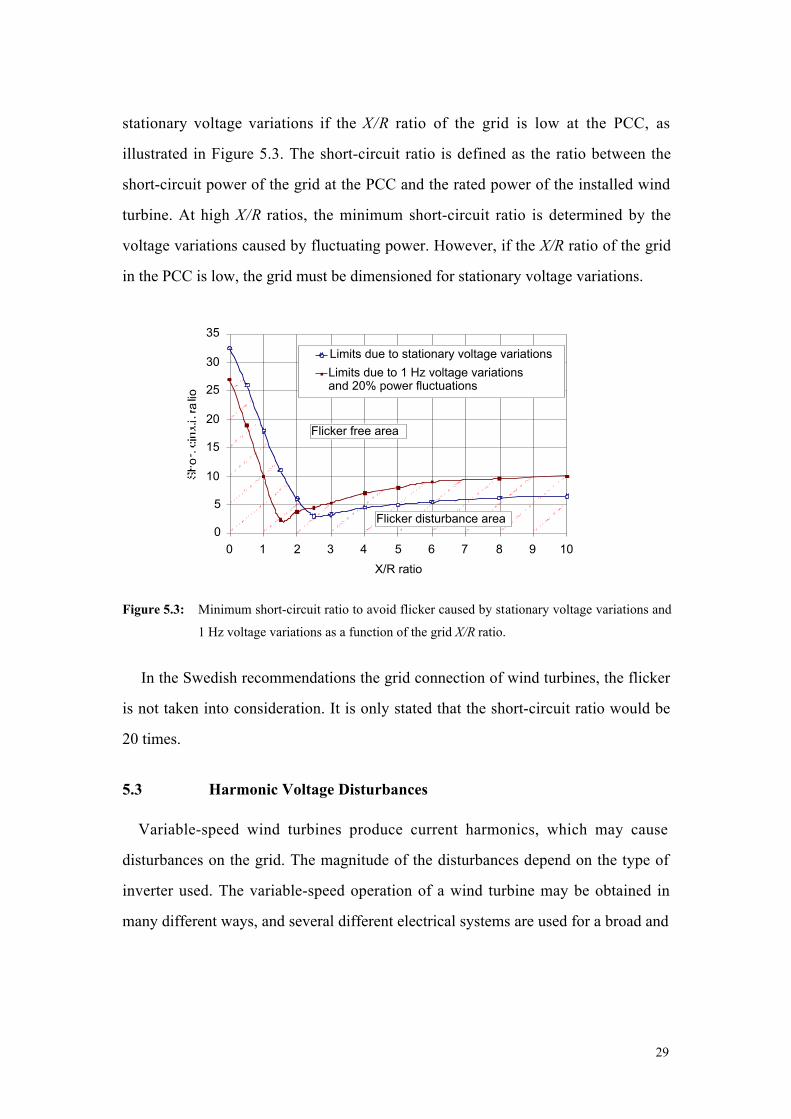
29
stationary voltage variations if the X/R ratio of the grid is low at the PCC, as
illustrated in Figure 5.3. The short-circuit ratio is defined as the ratio between the
short-circuit power of the grid at the PCC and the rated power of the installed wind
turbine. At high X/R ratios, the minimum short-circuit ratio is determined by the
voltage variations caused by fluctuating power. However, if the X/R ratio of the grid
in the PCC is low, the grid must be dimensioned for stationary voltage variations.
0
5
10
15
20
25
30
35
0 1 2 3 4 5 6 7 8 9 10
X/R ratio
Limits due to stationary voltage variations
Limits due to 1 Hz voltage variationsand 20% power fluctuations
Flicker free area
Flicker disturbance area
Figure 5.3: Minimum short-circuit ratio to avoid flicker caused by stationary voltage variations and
1 Hz voltage variations as a function of the grid X/R ratio.
In the Swedish recommendations the grid connection of wind turbines, the flicker
is not taken into consideration. It is only stated that the short-circuit ratio would be
20 times.
5.3 Harmonic Voltage Disturbances
Variable-speed wind turbines produce current harmonics, which may cause
disturbances on the grid. The magnitude of the disturbances depend on the type of
inverter used. The variable-speed operation of a wind turbine may be obtained in
many different ways, and several different electrical systems are used for a broad and
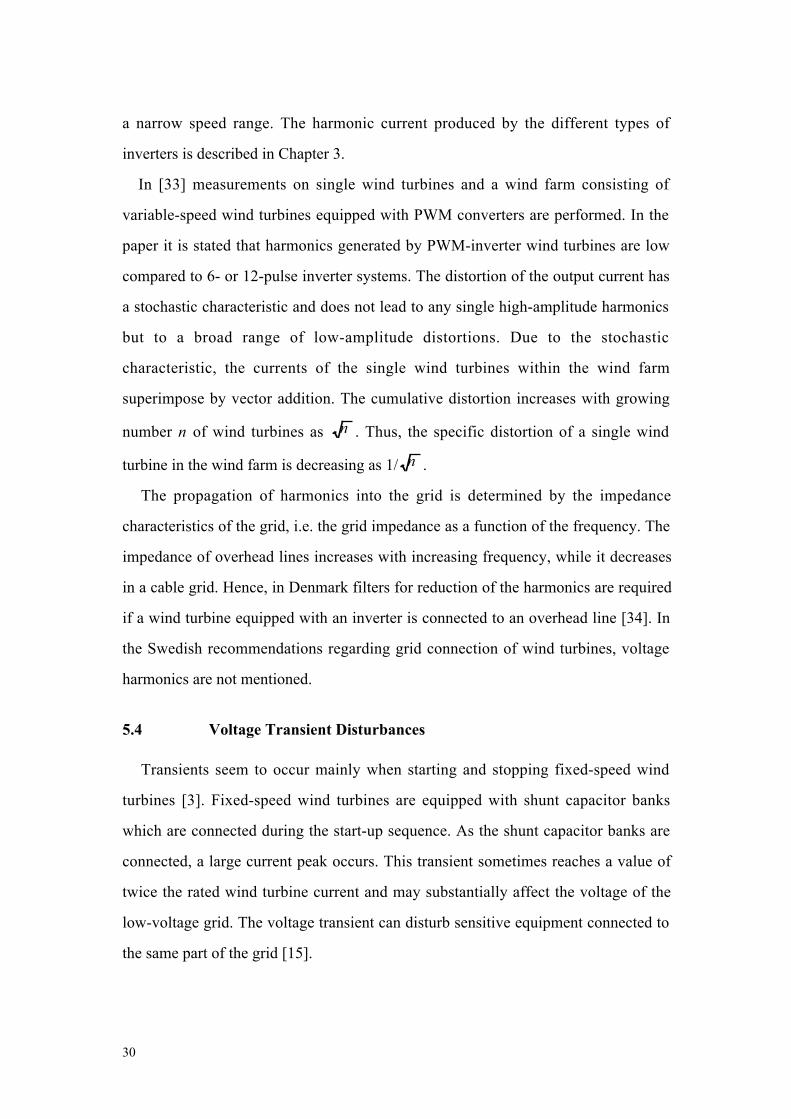
30
a narrow speed range. The harmonic current produced by the different types of
inverters is described in Chapter 3.
In [33] measurements on single wind turbines and a wind farm consisting of
variable-speed wind turbines equipped with PWM converters are performed. In the
paper it is stated that harmonics generated by PWM-inverter wind turbines are low
compared to 6- or 12-pulse inverter systems. The distortion of the output current has
a stochastic characteristic and does not lead to any single high-amplitude harmonics
but to a broad range of low-amplitude distortions. Due to the stochastic
characteristic, the currents of the single wind turbines within the wind farm
superimpose by vector addition. The cumulative distortion increases with growing
number n of wind turbines as n . Thus, the specific distortion of a single wind
turbine in the wind farm is decreasing as 1/ n .
The propagation of harmonics into the grid is determined by the impedance
characteristics of the grid, i.e. the grid impedance as a function of the frequency. The
impedance of overhead lines increases with increasing frequency, while it decreases
in a cable grid. Hence, in Denmark filters for reduction of the harmonics are required
if a wind turbine equipped with an inverter is connected to an overhead line [34]. In
the Swedish recommendations regarding grid connection of wind turbines, voltage
harmonics are not mentioned.
5.4 Voltage Transient Disturbances
Transients seem to occur mainly when starting and stopping fixed-speed wind
turbines [3]. Fixed-speed wind turbines are equipped with shunt capacitor banks
which are connected during the start-up sequence. As the shunt capacitor banks are
connected, a large current peak occurs. This transient sometimes reaches a value of
twice the rated wind turbine current and may substantially affect the voltage of the
low-voltage grid. The voltage transient can disturb sensitive equipment connected to
the same part of the grid [15].
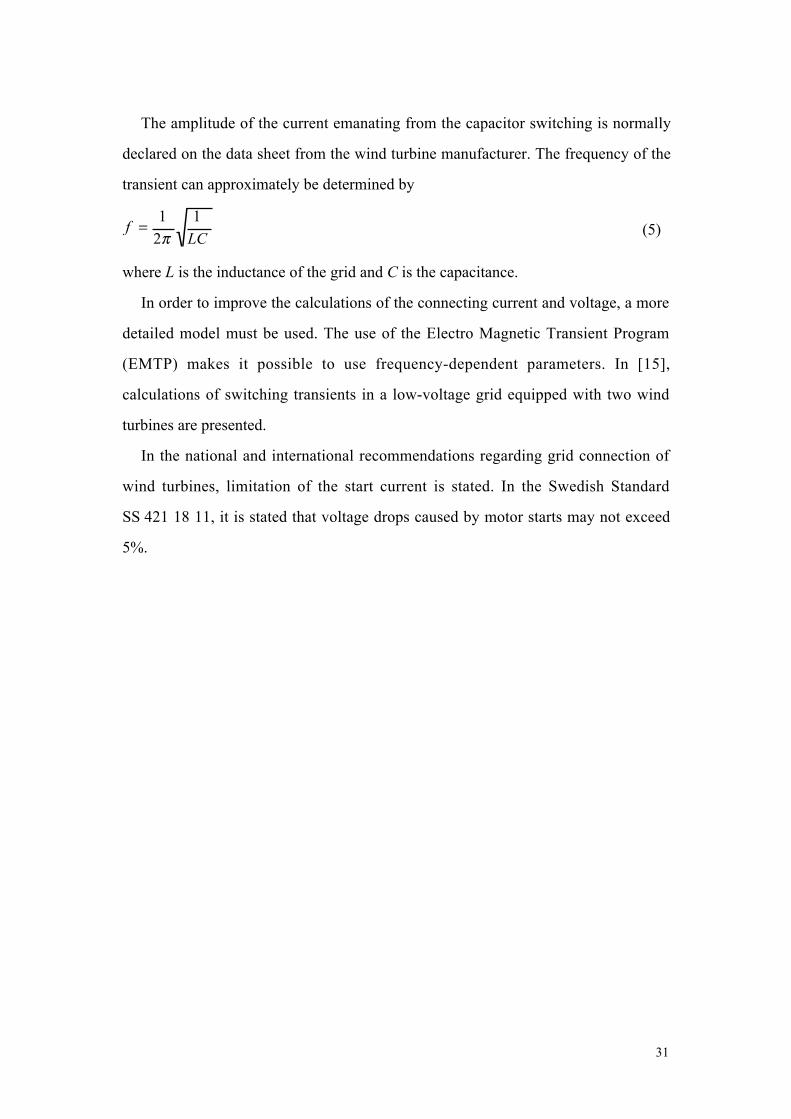
31
The amplitude of the current emanating from the capacitor switching is normally
declared on the data sheet from the wind turbine manufacturer. The frequency of the
transient can approximately be determined by
fLC
=1
2
1
π (5)
where L is the inductance of the grid and C is the capacitance.
In order to improve the calculations of the connecting current and voltage, a more
detailed model must be used. The use of the Electro Magnetic Transient Program
(EMTP) makes it possible to use frequency-dependent parameters. In [15],
calculations of switching transients in a low-voltage grid equipped with two wind
turbines are presented.
In the national and international recommendations regarding grid connection of
wind turbines, limitation of the start current is stated. In the Swedish Standard
SS 421 18 11, it is stated that voltage drops caused by motor starts may not exceed
5%.
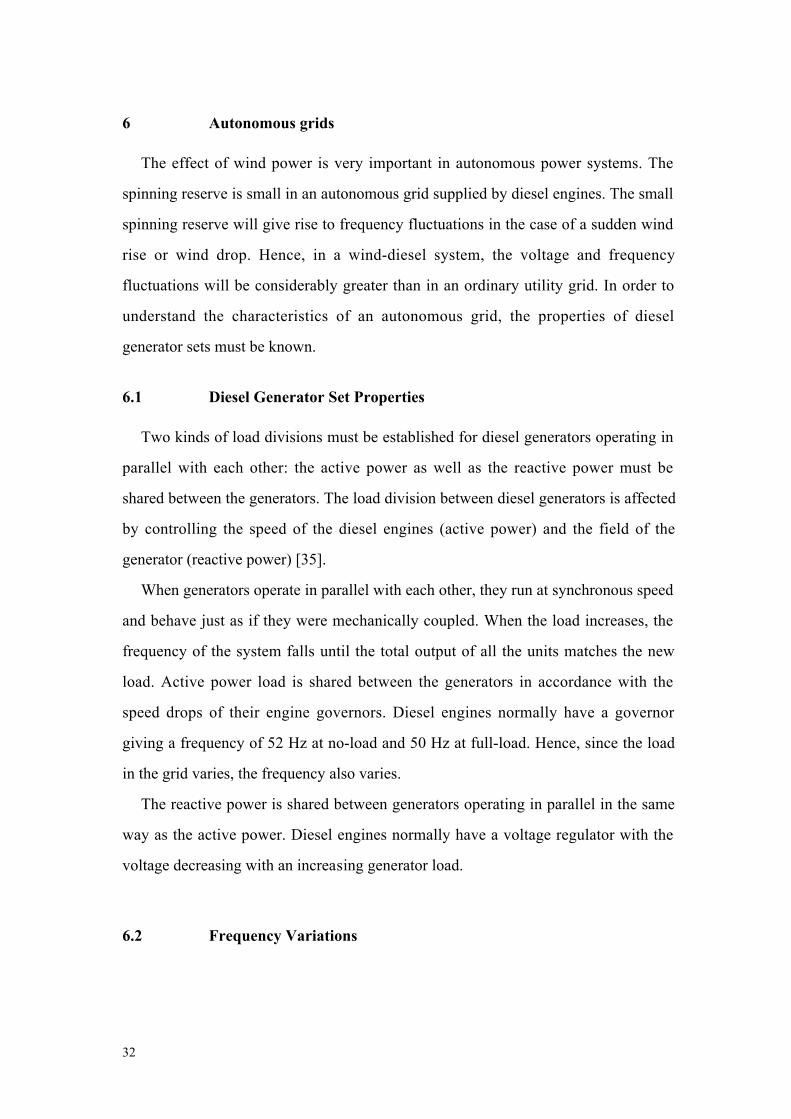
32
6 Autonomous grids
The effect of wind power is very important in autonomous power systems. The
spinning reserve is small in an autonomous grid supplied by diesel engines. The small
spinning reserve will give rise to frequency fluctuations in the case of a sudden wind
rise or wind drop. Hence, in a wind-diesel system, the voltage and frequency
fluctuations will be considerably greater than in an ordinary utility grid. In order to
understand the characteristics of an autonomous grid, the properties of diesel
generator sets must be known.
6.1 Diesel Generator Set Properties
Two kinds of load divisions must be established for diesel generators operating in
parallel with each other: the active power as well as the reactive power must be
shared between the generators. The load division between diesel generators is affected
by controlling the speed of the diesel engines (active power) and the field of the
generator (reactive power) [35].
When generators operate in parallel with each other, they run at synchronous speed
and behave just as if they were mechanically coupled. When the load increases, the
frequency of the system falls until the total output of all the units matches the new
load. Active power load is shared between the generators in accordance with the
speed drops of their engine governors. Diesel engines normally have a governor
giving a frequency of 52 Hz at no-load and 50 Hz at full-load. Hence, since the load
in the grid varies, the frequency also varies.
The reactive power is shared between generators operating in parallel in the same
way as the active power. Diesel engines normally have a voltage regulator with the
voltage decreasing with an increasing generator load.
6.2 Frequency Variations
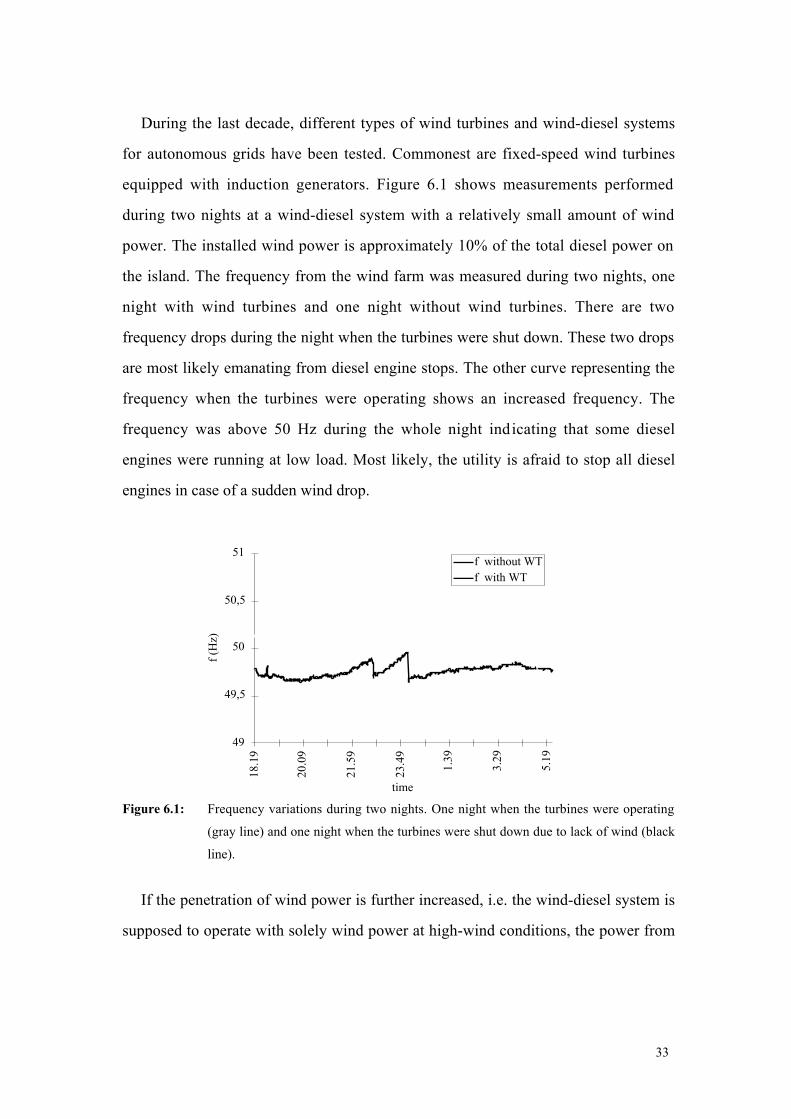
33
During the last decade, different types of wind turbines and wind-diesel systems
for autonomous grids have been tested. Commonest are fixed-speed wind turbines
equipped with induction generators. Figure 6.1 shows measurements performed
during two nights at a wind-diesel system with a relatively small amount of wind
power. The installed wind power is approximately 10% of the total diesel power on
the island. The frequency from the wind farm was measured during two nights, one
night with wind turbines and one night without wind turbines. There are two
frequency drops during the night when the turbines were shut down. These two drops
are most likely emanating from diesel engine stops. The other curve representing the
frequency when the turbines were operating shows an increased frequency. The
frequency was above 50 Hz during the whole night indicating that some diesel
engines were running at low load. Most likely, the utility is afraid to stop all diesel
engines in case of a sudden wind drop.
49
49,5
50
50,5
51
18.1
9
20.0
9
21.5
9
23.4
9
1.39
3.29
5.19
time
f (H
z)
f without WTf with WT
Figure 6.1: Frequency variations during two nights. One night when the turbines were operating
(gray line) and one night when the turbines were shut down due to lack of wind (black
line).
If the penetration of wind power is further increased, i.e. the wind-diesel system is
supposed to operate with solely wind power at high-wind conditions, the power from
34
the wind turbine must be controllable. Measurements on such a specially designed
wind-diesel system, using a pitch-controlled variable-speed wind turbine, are shown
in Figure 6.2.
46
47
48
49
50
5121
.11
23.0
1
0.51
2.41
4.31
time
f (H
z)
0
5
10
15
20
25
P (
kW)
fP from WT
Figure 6.2: Frequency variations (black line) and power output from the wind turbine (gray line)
during one night.
The figure shows the power from the wind turbine and the frequency measured
during one night. As can be seen in the figure, the wind turbine is shut down and the
plant is operating in diesel mode during the first 1.5 hours. The plant is then turned
into the mixed mode and the wind turbine is working in parallel with the diesel for
approximately 4 hours. Finally, for the rest of the night the wind speed was high
enough for the wind turbine to operate alone.
The frequency is raised from approximately 48 Hz in the diesel mode to 50 Hz in
the mixed and wind modes. This diesel seems to have a governor with a frequency of
50 Hz at no-load to 48 Hz at full-load. For the rest of the night, the plant is running in
the wind mode. As can be seen, the frequency is very stable when the plant is running
in the wind mode. In fact, the frequency is much more stable in the wind mode than in
the other two modes.

35
36
7 Wind Turbine Protection
Power quality does not only consider disturbances caused by a device connected to
the grid. Power quality also considers disturbances occurring in the grid. In order to
maintain a high reliability and security in the grid and in the wind turbines, these
must be disconnected from the grid in the event of a malfunction of the grid and vice
versa.
Several national and international recommendations and standards for the
connection of wind turbines to the grid have been written during the last decade. In
almost all national recommendations, the same protection devices are used as in the
IEC-standard TC 88 for wind turbines [20][21][29][36][37]. According to the IEC-
standard, wind turbine protection should provided for under voltage, over voltage
and over current, due to both overload and short-circuits. In addition, protection
should be provided for the loss of phase and phase reversal as well as under
frequency and over frequency. The equipment should also shut down the wind
turbine safely in the event of operating conditions which will not allow safe
operation. For example in Sweden, it is stated that wind turbines shall be equipped
with relays which disconnect the turbine from the grid within 5 seconds in the event
of a voltage level lower than 90% or exceeding 106% of nominal voltage and
frequency deviations from nominal frequency exceeding ±1 Hz. Normally, this
protection device is an integral part of the control system of the wind turbine.

37
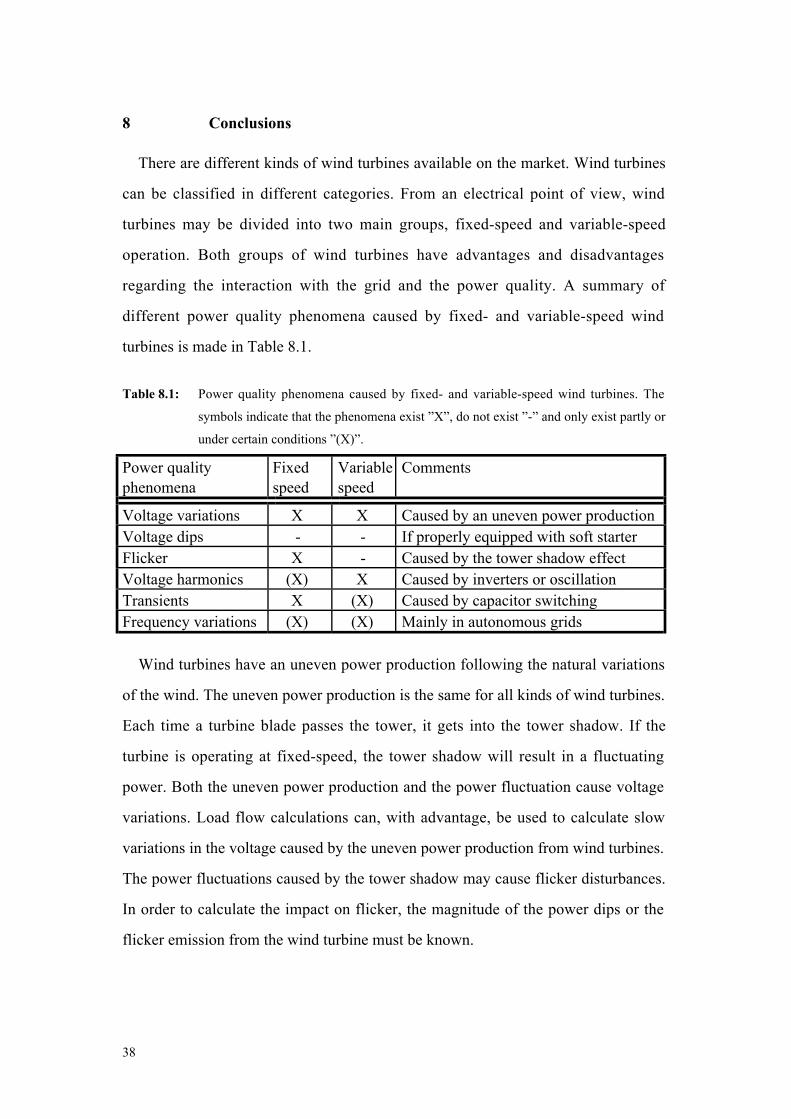
38
8 Conclusions
There are different kinds of wind turbines available on the market. Wind turbines
can be classified in different categories. From an electrical point of view, wind
turbines may be divided into two main groups, fixed-speed and variable-speed
operation. Both groups of wind turbines have advantages and disadvantages
regarding the interaction with the grid and the power quality. A summary of
different power quality phenomena caused by fixed- and variable-speed wind
turbines is made in Table 8.1.
Table 8.1: Power quality phenomena caused by fixed- and variable-speed wind turbines. The
symbols indicate that the phenomena exist ”X”, do not exist ”-” and only exist partly or
under certain conditions ”(X)”.
Power qualityphenomena
Fixedspeed
Variablespeed
Comments
Voltage variations X X Caused by an uneven power productionVoltage dips - - If properly equipped with soft starterFlicker X - Caused by the tower shadow effectVoltage harmonics (X) X Caused by inverters or oscillationTransients X (X) Caused by capacitor switchingFrequency variations (X) (X) Mainly in autonomous grids
Wind turbines have an uneven power production following the natural variations
of the wind. The uneven power production is the same for all kinds of wind turbines.
Each time a turbine blade passes the tower, it gets into the tower shadow. If the
turbine is operating at fixed-speed, the tower shadow will result in a fluctuating
power. Both the uneven power production and the power fluctuation cause voltage
variations. Load flow calculations can, with advantage, be used to calculate slow
variations in the voltage caused by the uneven power production from wind turbines.
The power fluctuations caused by the tower shadow may cause flicker disturbances.
In order to calculate the impact on flicker, the magnitude of the power dips or the
flicker emission from the wind turbine must be known.

39
Apart from oscillation between the grid impedance and the shunt capacitor banks
for power factor correction, which may amplifying a specific harmonic, fixed-speed
wind turbines do not produce any harmonics. When it comes to variable-speed wind
turbines, the situation is the opposite. Depending on the type of inverter used,
different orders of harmonics are produced.
Transients seem to occur mainly when wind turbines are started and stopped.
Properly equipped with a soft-starter, a large inrush current and thereby a voltage
dip can be avoided. As the shunt capacitor bank is switched on, a large current peak
occurs. The current peak may affect the voltage on the low-voltage side of the
transformer substantially. The effect on the voltage emanating from transient
currents and transient switching actions can be calculated by proper computer codes,
for example the Electro Magnetic Transient Program (EMTP).
In an autonomous grid supplied by diesel engines, the spinning reserve is limited.
The limitation in spinning reserve gives rise to frequency fluctuations in the case of
fast load changes. Hence, the frequency of an autonomous grid is normally not as
stable as that of a large grid. When wind power is introduced to an autonomous grid,
a sudden wind rise or wind drop will affect the power balance with frequency
variations as a result. The use of sophisticated variable-speed wind turbines can
eliminate this problem and actually improve the frequency balance.
The standards and regulations used today are insufficient and incomplete. All
different kinds of power quality phenomena are not taken into consideration. The
calculation methods and models used are too simplified.
In order to predict the interaction between the wind turbines and the grid, new and
better models which include all features of wind turbines are needed. These models
could be useful tools in order to predict the power quality from wind turbines. Wind
turbine types which in combination with the grid are likely to cause power quality
problems could at an early stage of planning be rejected and replaced by a more
proper type of wind turbine.

40
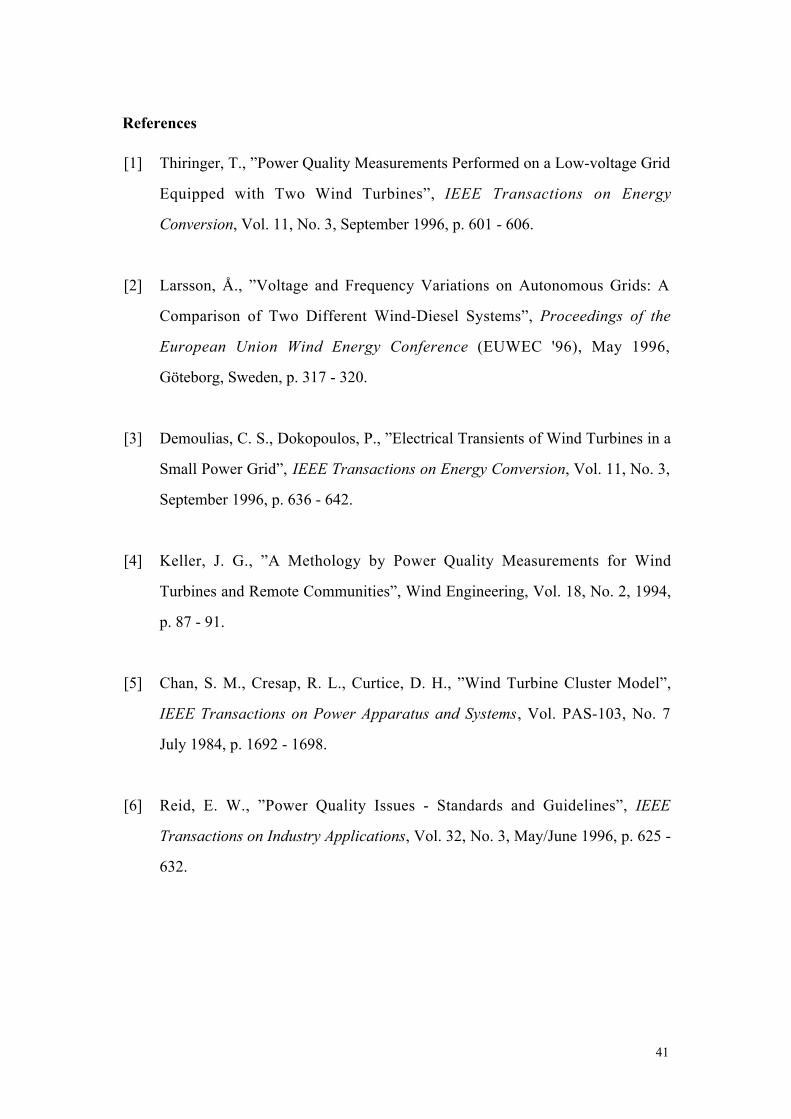
41
References
[1] Thiringer, T., ”Power Quality Measurements Performed on a Low-voltage Grid
Equipped with Two Wind Turbines”, IEEE Transactions on Energy
Conversion, Vol. 11, No. 3, September 1996, p. 601 - 606.
[2] Larsson, Å., ”Voltage and Frequency Variations on Autonomous Grids: A
Comparison of Two Different Wind-Diesel Systems”, Proceedings of the
European Union Wind Energy Conference (EUWEC '96), May 1996,
Göteborg, Sweden, p. 317 - 320.
[3] Demoulias, C. S., Dokopoulos, P., ”Electrical Transients of Wind Turbines in a
Small Power Grid”, IEEE Transactions on Energy Conversion, Vol. 11, No. 3,
September 1996, p. 636 - 642.
[4] Keller, J. G., ”A Methology by Power Quality Measurements for Wind
Turbines and Remote Communities”, Wind Engineering, Vol. 18, No. 2, 1994,
p. 87 - 91.
[5] Chan, S. M., Cresap, R. L., Curtice, D. H., ”Wind Turbine Cluster Model”,
IEEE Transactions on Power Apparatus and Systems, Vol. PAS-103, No. 7
July 1984, p. 1692 - 1698.
[6] Reid, E. W., ”Power Quality Issues - Standards and Guidelines”, IEEE
Transactions on Industry Applications, Vol. 32, No. 3, May/June 1996, p. 625 -
632.

42
[7] Phipps, J. K., Nelson, J. P., Sen, P. K., ”Power Quality and Harmonic
Distortion on Distribution Systems” IEEE Transactions on Industry
Applications, Vol. 30, No. 2, March/April 1994, p. 476 - 478.
[8] Wagner, V. E., et.al., ”Effects of Harmonics on Equipment”, I E E E
Transactions on Power Delivery, Vol. 8, No. 2, April 1993, p. 672 - 680.
[9] Richardson, R. D., McNerney, G. M., ”Wind Energy Systems”, Proceedings of
the IEEE, Vol. 81, No. 3, March 1993, p. 378 - 389.
[10] Freris, L. L., ”Harnessing the wind”. Power Engineering Journal, September
1992, p. 251 - 260.
[11] Freris, L.L. (ed.), Wind Energy Conversion Systems, Prentice Hall International
(UK) Ltd, 1990, 388 p.
[12] Johnson, G.L., Wind Energy Systems, Prentice Hall International Inc., New
Jersey, USA, 1985, 360 p.
[13] Gardner, P., ”Flicker from Wind Farms”. Proceedings of the BWEA/SERC RAL
Workshop on Wind Energy Penetration into Weak Electricity Network,
Rutherford, U.K., June 1993, p. 27 - 37.
[14] Gerdes, G., Santjer, F., ”Power Quality of Wind Turbines and their Interaction
with the Grid”. Proceedings of the European Wind Wnergy Conference (EWEC
‘94), Thessaloniki, Greece, 10-14 October 1994, p. 1112 - 1115.
43
[15] Larsson, Å., Thiringer, T., ”Measurements on and Modelling of Capacitor-
Connecting Transients on a Low-voltage Grid Equipped with Two Wind
Turbines”, Proceedings of the International Conference on Power System
Transients (IPST '95), Lisbon, Portugal, Sept. 1995, p. 184 - 188.
[16] Larsson, Å., Carlson, O., Sidén, G., ”Electrical Generating Systems in Wind
Turbine Applications”, Proceedings of the IEEE/KTH Stockholm Power Tech
Conference, Vol. Electrical Machines and Drives, June 1995, p. 205 - 210.
[17] Thorborg, K., Power Electronics. Prentice Hall International (UK) Ltd, 1988.
504 p.
[18] Jenkins, N., ”Embedded generation Part 2”, Power Engineering Journal,
October 1996, p. 233 - 239.
[19] Jørgensen; P., Christensen, J. S., Tande, J. O., Vikkelsø, A., Nørgård, P.,
”Elkvalitet ved nettilslutning af vindmøller Del 1: Stationære
spændningsforhold”, Roskilde, Information Service Department, Risø National
Laboratoy, 1996, 118 p. (in Danish)
[20] VDEW Publication, ”Technische Richtlinie Parallelbetrieb von
Eigenerzeugungsanlagen mit dem Mittelspannungsnetz des
Elektrizitätsversorgungs-unterhmens (EVU)”, Frankfurt am Main, VWEW-
Verlag, 1994, 48 p. (in German)
[21] Tekniska anvisningar för anslutning av mindre produktionsanläggningar till
distributionsnät (TAMP), Svenska Elverksföreningen, 1992. (in Swedish)

44
[22] Bollen, M. H. J., ”Voltage sags: effects, mitigation and predicts”, Power
Engineering Journal, June 1996, p. 129 - 135.
[23] Craig, L.M., Jenkins, N., ”Performance of Wind Turbine Connected to a Weak
Rural Network”, Wind Engineering, Vol. 19, No. 3, 1995, p. 135 - 145.
[24] Walker, M. K., ”Electric Utility Flicker Limitation”, in Proceeding of the
Power Quality Conference , Long Beach, California, October 1989,
p. 602 - 613.
[25] Girgis, A. A., Fallon, C. M., Rubino, J. C. P., Catoe, R. C., ”Harmonics and
Transient Overvoltage Due to Capacitor Switching”, IEEE Transactions on
Industry Applications, Vol. 29, No. 6 November/December 1993, p. 1184 -
1188.
[26] Bose, B. K., Power Electronics and AC Drives, Prentice Hall, 1986. 402 p.
[27] Zaininger Engineering Company, Inc., ”Electrical Behavior of Wind Power
Stations”, Electric Power Research Institute (EPRI), Project 1996-24, June
1987, p. 4-4 - 4-10.
[28] Ballard, L. J., Swansborough, R., H. (ed.), ”Recommended Practices for Wind
Turbine Testing: 7. Quality of Power. Single Grid-Connected WECS”,
Roskilde, Elsgaards bogtrykkeri, Edition 1, 1984.
[29] Dimensioneringsrekommendationer för anslutning av mindre produktionskällor
till distributionsnät (DAMP), Svenska Elverksföreningen, 1994. (in Swedish)

45
[30] Sørensen, P., Tande, J.O., Søndergaard, L.M., Kledal, J.D., ”Flicker Emission
Levels from Wind Turbines”, Wind Engineering, Vol. 20, No. 1, 1996, p. 39 -
45.
[31] Jørgensen; P., Christensen, J. S., Tande, J. O., Vikkelsø, A., Nørgård, P.,
”Elkvalitet ved nettilslutning af vindmøller Del 2: Flicker”, Roskilde,
Information Service Department, Risø National Laboratoy, 1996, 62 p. (in
Danish)
[32] Larsson, Å, ”Flicker and Slow Voltage Variations from Wind Turbines”,
Proceedings of the 7th International Conference on Harmonics and Quality of
Power (ICHQP '96), Las Vegas, U.S.A. October 1996, p. 270 - 275.
[33] Berding, J., Santier, F., Gerdes, G., ”Netzrückwirkungen von Windenergi-
anlagen in Windparks”, DEWI Magasin Nr. 9, Augusti 1996, p. 30 - 36. (in
German)
[34] Jørgensen; P., Christensen, J. S., Tande, J. O., Vikkelsø, A., Nørgård, P.,
”Elkvalitet ved nettilslutning af vindmøller Del 3: Overtoner og driftforhold
ved invertertilsluttede vindmøller”, Roskilde, Information Service Department,
Risø National Laboratoy, 1996, 95 p. (in Danish)
[35] Mahon, L.L.J., Diesel Generator Handbook, Butterworth-Heinemann Ltd,
1992.
[36] Association of Energy distribution companies in the Netherlands, ”Technical
terms of connection to the public network for local production units”, Arnhem,
EnergieNed, 1994.

46
[37] International Electrotechnical Comission, TC 88, 1994.
Paper 2A
Measurements on and Modelling of Capacitor-Connecting Transients
on a Low-Voltage Grid Equipped with Two Wind Turbines
Å. Larsson
T. Thiringer
Presented at
International Conference on Power System Transients (IPST '95)
Lisbon, Portugal
September 3-7, 1995
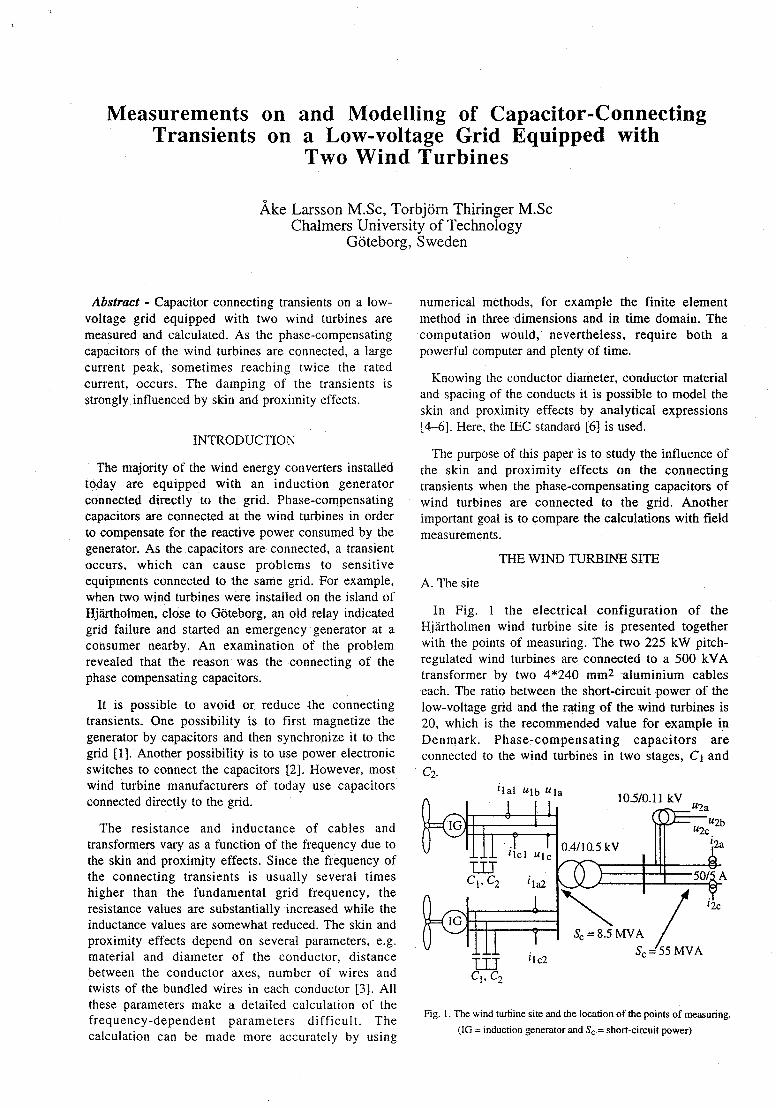
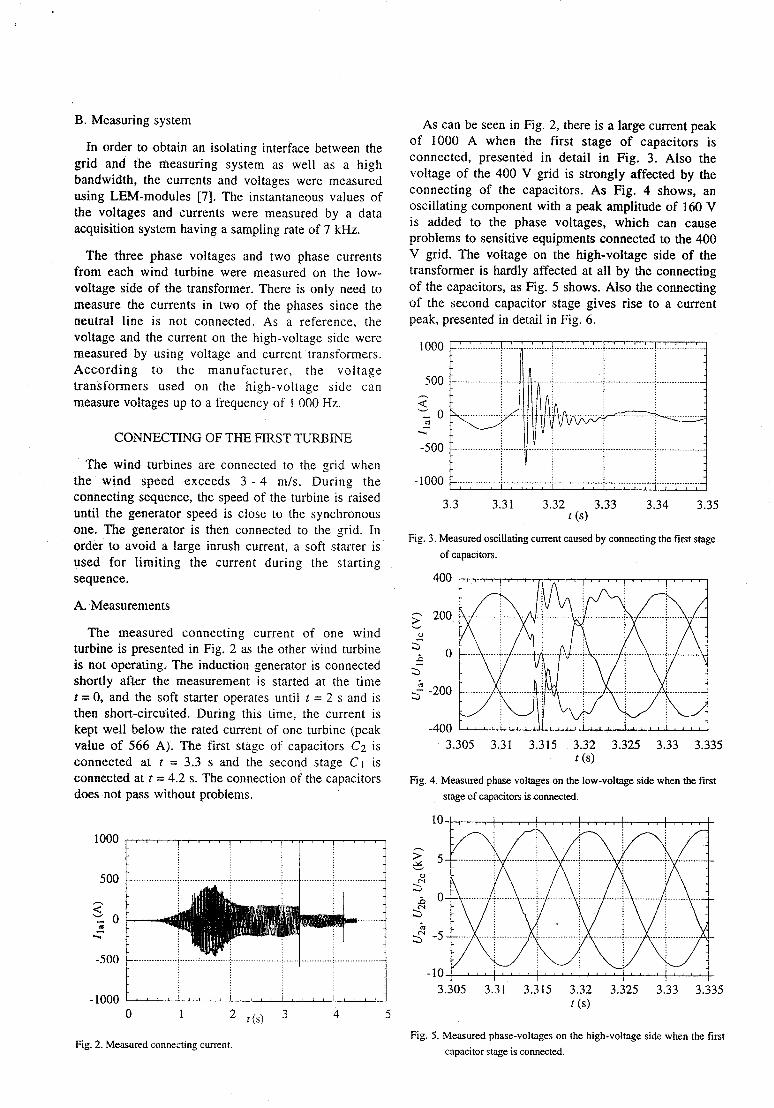
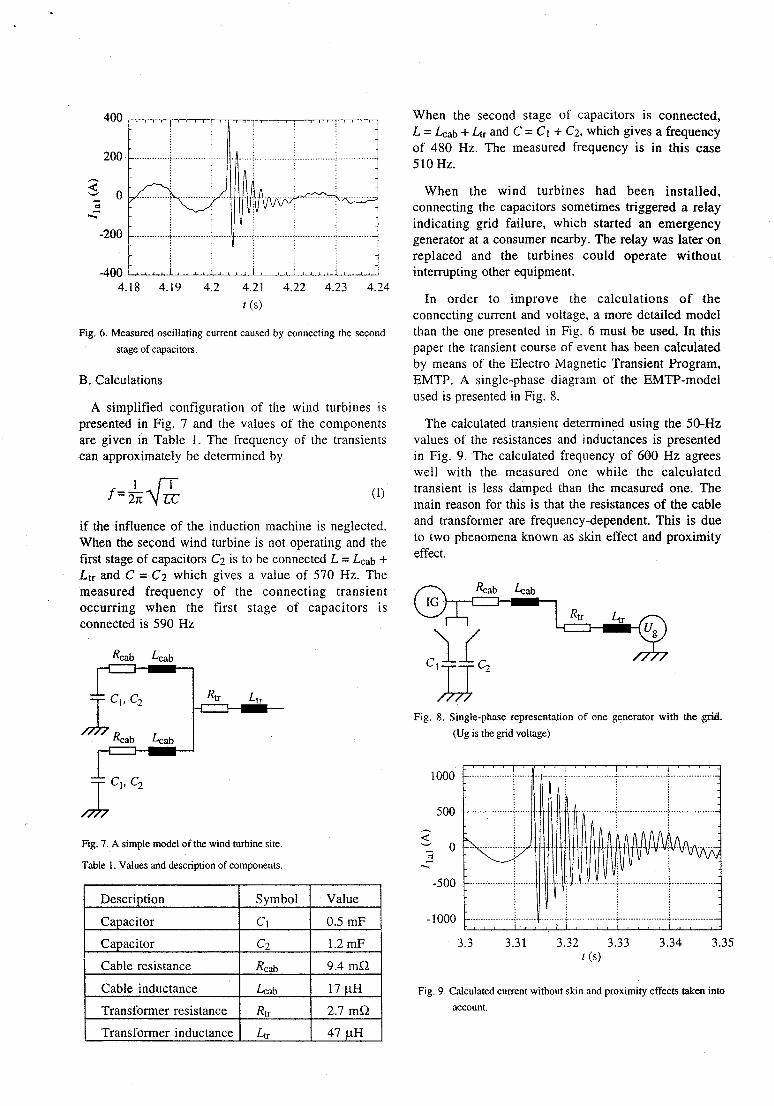
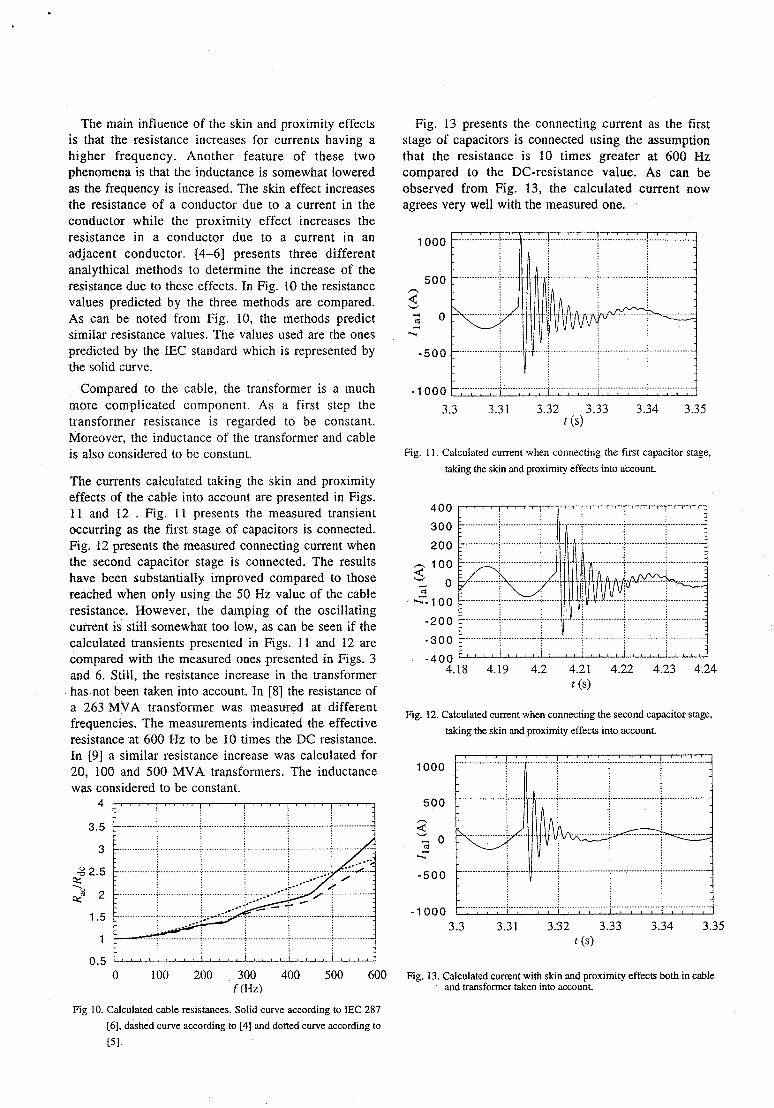
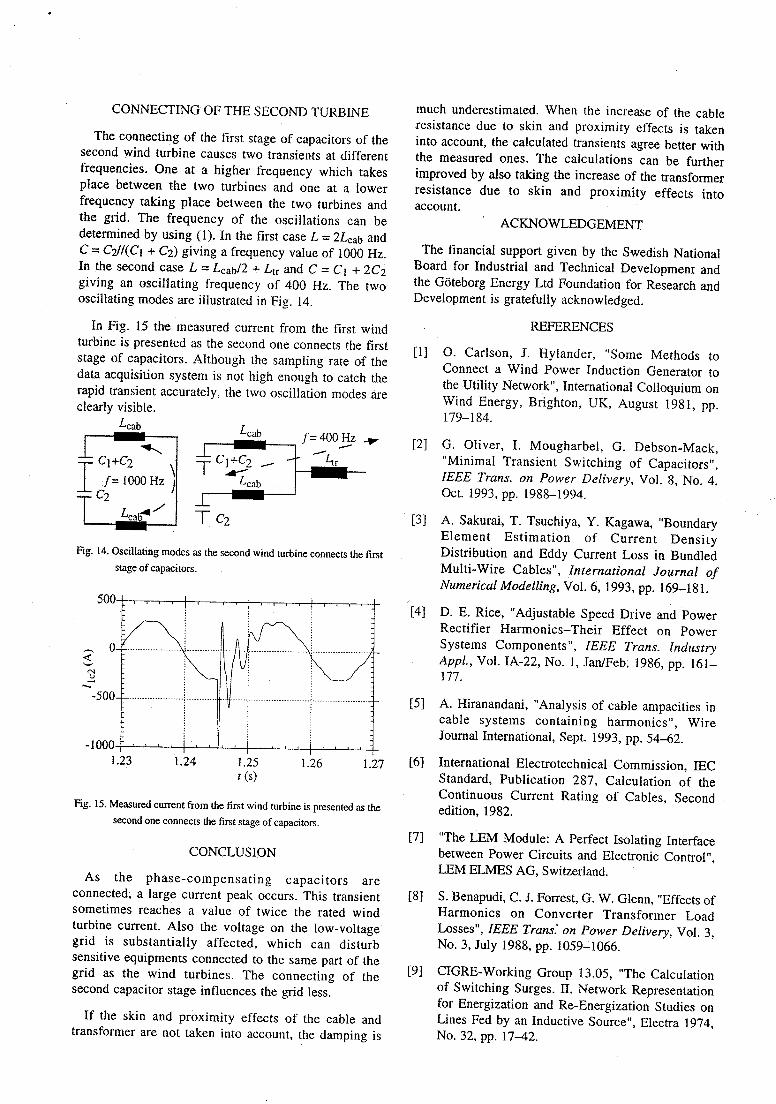

Paper 2B
Voltage and Frequency Variations on Autonomous Grids:
A Comparison of Two Different Wind-Diesel Systems
Å. Larsson
Presented at
European Union Wind Energy Conference (EUWEC '96)
Göteborg, Sweden
May 20-24, 1996
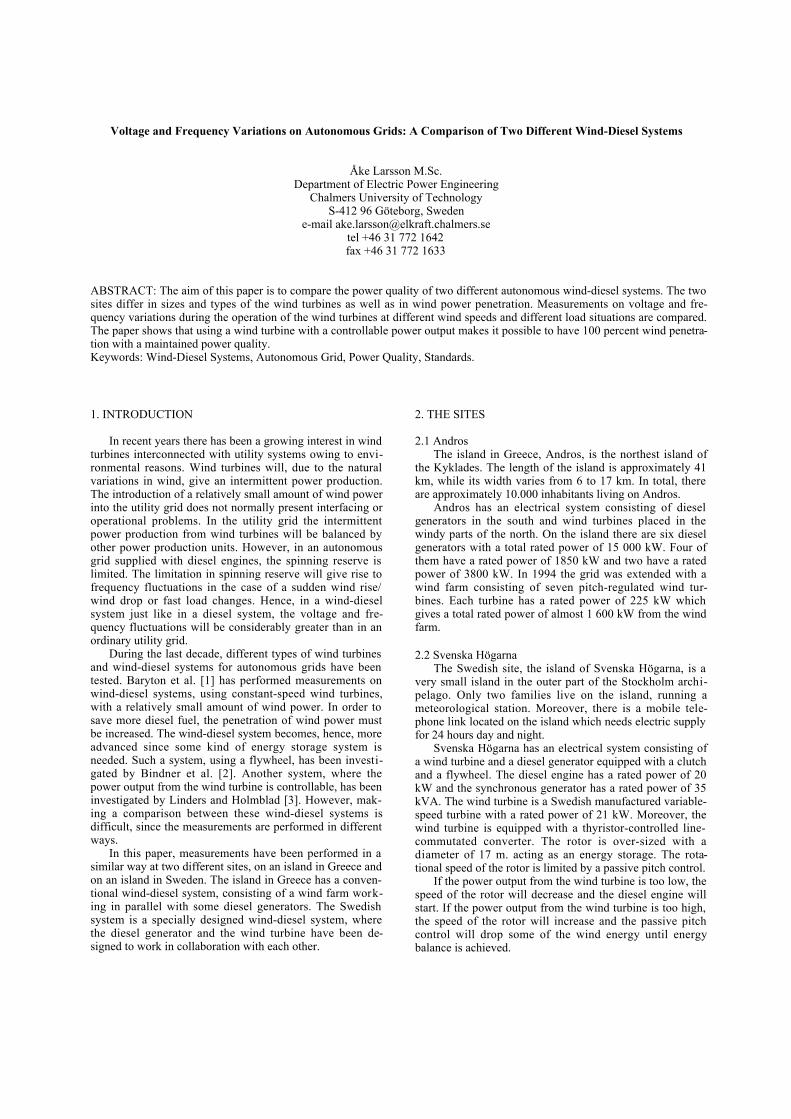
Voltage and Frequency Variations on Autonomous Grids: A Comparison of Two Different Wind-Diesel Systems
Åke Larsson M.Sc.Department of Electric Power Engineering
Chalmers University of TechnologyS-412 96 Göteborg, Sweden
e-mail [email protected] +46 31 772 1642fax +46 31 772 1633
ABSTRACT: The aim of this paper is to compare the power quality of two different autonomous wind-diesel systems. The twosites differ in sizes and types of the wind turbines as well as in wind power penetration. Measurements on voltage and fre-quency variations during the operation of the wind turbines at different wind speeds and different load situations are compared.The paper shows that using a wind turbine with a controllable power output makes it possible to have 100 percent wind penetra-tion with a maintained power quality.Keywords: Wind-Diesel Systems, Autonomous Grid, Power Quality, Standards.
1. INTRODUCTION
In recent years there has been a growing interest in windturbines interconnected with utility systems owing to envi-ronmental reasons. Wind turbines will, due to the naturalvariations in wind, give an intermittent power production.The introduction of a relatively small amount of wind powerinto the utility grid does not normally present interfacing oroperational problems. In the utility grid the intermittentpower production from wind turbines will be balanced byother power production units. However, in an autonomousgrid supplied with diesel engines, the spinning reserve islimited. The limitation in spinning reserve will give rise tofrequency fluctuations in the case of a sudden wind rise/wind drop or fast load changes. Hence, in a wind-dieselsystem just like in a diesel system, the voltage and fre-quency fluctuations will be considerably greater than in anordinary utility grid.
During the last decade, different types of wind turbinesand wind-diesel systems for autonomous grids have beentested. Baryton et al. [1] has performed measurements onwind-diesel systems, using constant-speed wind turbines,with a relatively small amount of wind power. In order tosave more diesel fuel, the penetration of wind power mustbe increased. The wind-diesel system becomes, hence, moreadvanced since some kind of energy storage system isneeded. Such a system, using a flywheel, has been investi-gated by Bindner et al. [2]. Another system, where thepower output from the wind turbine is controllable, has beeninvestigated by Linders and Holmblad [3]. However, mak-ing a comparison between these wind-diesel systems isdifficult, since the measurements are performed in differentways.
In this paper, measurements have been performed in asimilar way at two different sites, on an island in Greece andon an island in Sweden. The island in Greece has a conven-tional wind-diesel system, consisting of a wind farm work-ing in parallel with some diesel generators. The Swedishsystem is a specially designed wind-diesel system, wherethe diesel generator and the wind turbine have been de-signed to work in collaboration with each other.
2. THE SITES
2.1 AndrosThe island in Greece, Andros, is the northest island of
the Kyklades. The length of the island is approximately 41km, while its width varies from 6 to 17 km. In total, thereare approximately 10.000 inhabitants living on Andros.
Andros has an electrical system consisting of dieselgenerators in the south and wind turbines placed in thewindy parts of the north. On the island there are six dieselgenerators with a total rated power of 15 000 kW. Four ofthem have a rated power of 1850 kW and two have a ratedpower of 3800 kW. In 1994 the grid was extended with awind farm consisting of seven pitch-regulated wind tur-bines. Each turbine has a rated power of 225 kW whichgives a total rated power of almost 1 600 kW from the windfarm.
2.2 Svenska HögarnaThe Swedish site, the island of Svenska Högarna, is a
very small island in the outer part of the Stockholm archi-pelago. Only two families live on the island, running ameteorological station. Moreover, there is a mobile tele-phone link located on the island which needs electric supplyfor 24 hours day and night.
Svenska Högarna has an electrical system consisting ofa wind turbine and a diesel generator equipped with a clutchand a flywheel. The diesel engine has a rated power of 20kW and the synchronous generator has a rated power of 35kVA. The wind turbine is a Swedish manufactured variable-speed turbine with a rated power of 21 kW. Moreover, thewind turbine is equipped with a thyristor-controlled line-commutated converter. The rotor is over-sized with adiameter of 17 m. acting as an energy storage. The rota-tional speed of the rotor is limited by a passive pitch control.
If the power output from the wind turbine is too low, thespeed of the rotor will decrease and the diesel engine willstart. If the power output from the wind turbine is too high,the speed of the rotor will increase and the passive pitchcontrol will drop some of the wind energy until energybalance is achieved.
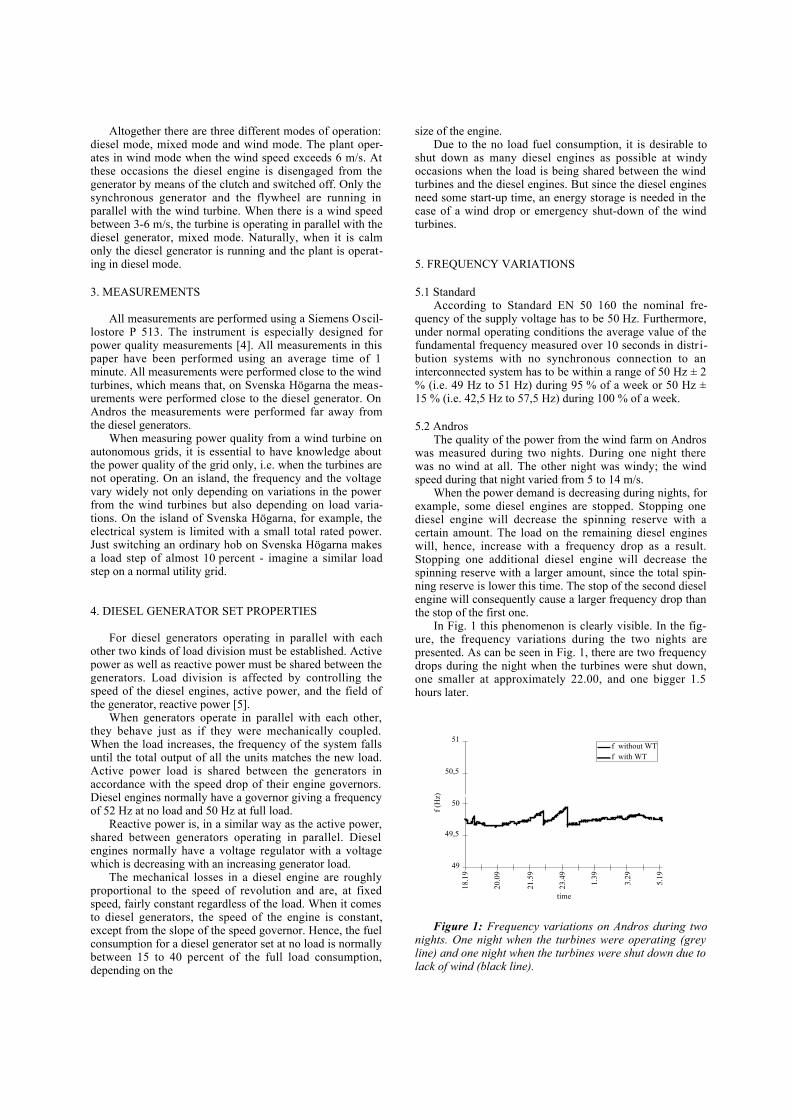
Altogether there are three different modes of operation:diesel mode, mixed mode and wind mode. The plant oper-ates in wind mode when the wind speed exceeds 6 m/s. Atthese occasions the diesel engine is disengaged from thegenerator by means of the clutch and switched off. Only thesynchronous generator and the flywheel are running inparallel with the wind turbine. When there is a wind speedbetween 3-6 m/s, the turbine is operating in parallel with thediesel generator, mixed mode. Naturally, when it is calmonly the diesel generator is running and the plant is operat-ing in diesel mode.
3. MEASUREMENTS
All measurements are performed using a Siemens Oscil-lostore P 513. The instrument is especially designed forpower quality measurements [4]. All measurements in thispaper have been performed using an average time of 1minute. All measurements were performed close to the windturbines, which means that, on Svenska Högarna the meas-urements were performed close to the diesel generator. OnAndros the measurements were performed far away fromthe diesel generators.
When measuring power quality from a wind turbine onautonomous grids, it is essential to have knowledge aboutthe power quality of the grid only, i.e. when the turbines arenot operating. On an island, the frequency and the voltagevary widely not only depending on variations in the powerfrom the wind turbines but also depending on load varia-tions. On the island of Svenska Högarna, for example, theelectrical system is limited with a small total rated power.Just switching an ordinary hob on Svenska Högarna makesa load step of almost 10 percent - imagine a similar loadstep on a normal utility grid.
4. DIESEL GENERATOR SET PROPERTIES
For diesel generators operating in parallel with eachother two kinds of load division must be established. Activepower as well as reactive power must be shared between thegenerators. Load division is affected by controlling thespeed of the diesel engines, active power, and the field ofthe generator, reactive power [5].
When generators operate in parallel with each other,they behave just as if they were mechanically coupled.When the load increases, the frequency of the system fallsuntil the total output of all the units matches the new load.Active power load is shared between the generators inaccordance with the speed drop of their engine governors.Diesel engines normally have a governor giving a frequencyof 52 Hz at no load and 50 Hz at full load.
Reactive power is, in a similar way as the active power,shared between generators operating in parallel. Dieselengines normally have a voltage regulator with a voltagewhich is decreasing with an increasing generator load.
The mechanical losses in a diesel engine are roughlyproportional to the speed of revolution and are, at fixedspeed, fairly constant regardless of the load. When it comesto diesel generators, the speed of the engine is constant,except from the slope of the speed governor. Hence, the fuelconsumption for a diesel generator set at no load is normallybetween 15 to 40 percent of the full load consumption,depending on the
size of the engine.Due to the no load fuel consumption, it is desirable to
shut down as many diesel engines as possible at windyoccasions when the load is being shared between the windturbines and the diesel engines. But since the diesel enginesneed some start-up time, an energy storage is needed in thecase of a wind drop or emergency shut-down of the windturbines.
5. FREQUENCY VARIATIONS
5.1 StandardAccording to Standard EN 50 160 the nominal fre-
quency of the supply voltage has to be 50 Hz. Furthermore,under normal operating conditions the average value of thefundamental frequency measured over 10 seconds in distr i-bution systems with no synchronous connection to aninterconnected system has to be within a range of 50 Hz ± 2% (i.e. 49 Hz to 51 Hz) during 95 % of a week or 50 Hz ±15 % (i.e. 42,5 Hz to 57,5 Hz) during 100 % of a week.
5.2 AndrosThe quality of the power from the wind farm on Andros
was measured during two nights. During one night therewas no wind at all. The other night was windy; the windspeed during that night varied from 5 to 14 m/s.
When the power demand is decreasing during nights, forexample, some diesel engines are stopped. Stopping onediesel engine will decrease the spinning reserve with acertain amount. The load on the remaining diesel engineswill, hence, increase with a frequency drop as a result.Stopping one additional diesel engine will decrease thespinning reserve with a larger amount, since the total spin-ning reserve is lower this time. The stop of the second dieselengine will consequently cause a larger frequency drop thanthe stop of the first one.
In Fig. 1 this phenomenon is clearly visible. In the fig-ure, the frequency variations during the two nights arepresented. As can be seen in Fig. 1, there are two frequencydrops during the night when the turbines were shut down,one smaller at approximately 22.00, and one bigger 1.5hours later.
49
49,5
50
50,5
51
18.1
9
20.0
9
21.5
9
23.4
9
1.39
3.29
5.19
time
f (H
z)
f without WTf with WT
Figure 1: Frequency variations on Andros during twonights. One night when the turbines were operating (greyline) and one night when the turbines were shut down due tolack of wind (black line).
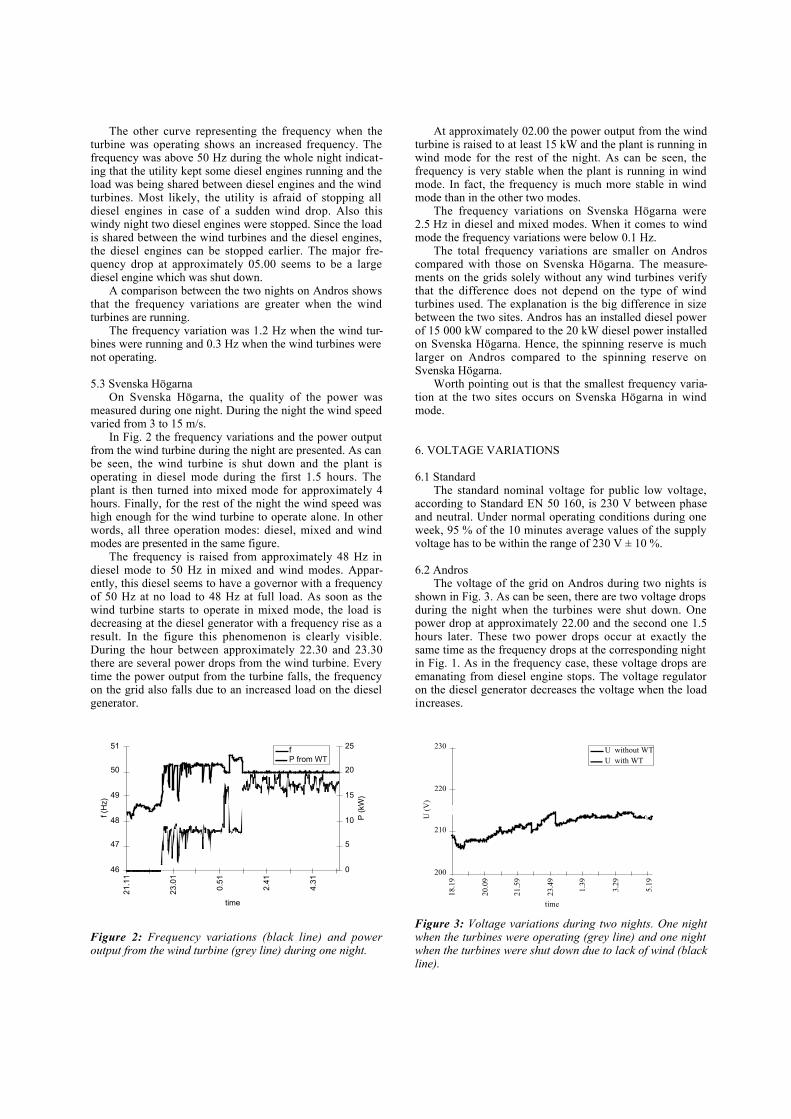
The other curve representing the frequency when theturbine was operating shows an increased frequency. Thefrequency was above 50 Hz during the whole night indicat-ing that the utility kept some diesel engines running and theload was being shared between diesel engines and the windturbines. Most likely, the utility is afraid of stopping alldiesel engines in case of a sudden wind drop. Also thiswindy night two diesel engines were stopped. Since the loadis shared between the wind turbines and the diesel engines,the diesel engines can be stopped earlier. The major fre-quency drop at approximately 05.00 seems to be a largediesel engine which was shut down.
A comparison between the two nights on Andros showsthat the frequency variations are greater when the windturbines are running.
The frequency variation was 1.2 Hz when the wind tur-bines were running and 0.3 Hz when the wind turbines werenot operating.
5.3 Svenska HögarnaOn Svenska Högarna, the quality of the power was
measured during one night. During the night the wind speedvaried from 3 to 15 m/s.
In Fig. 2 the frequency variations and the power outputfrom the wind turbine during the night are presented. As canbe seen, the wind turbine is shut down and the plant isoperating in diesel mode during the first 1.5 hours. Theplant is then turned into mixed mode for approximately 4hours. Finally, for the rest of the night the wind speed washigh enough for the wind turbine to operate alone. In otherwords, all three operation modes: diesel, mixed and windmodes are presented in the same figure.
The frequency is raised from approximately 48 Hz indiesel mode to 50 Hz in mixed and wind modes. Appar-ently, this diesel seems to have a governor with a frequencyof 50 Hz at no load to 48 Hz at full load. As soon as thewind turbine starts to operate in mixed mode, the load isdecreasing at the diesel generator with a frequency rise as aresult. In the figure this phenomenon is clearly visible.During the hour between approximately 22.30 and 23.30there are several power drops from the wind turbine. Everytime the power output from the turbine falls, the frequencyon the grid also falls due to an increased load on the dieselgenerator.
46
47
48
49
50
51
21.1
1
23.0
1
0.51
2.41
4.31
time
f (H
z)
0
5
10
15
20
25
P (
kW)
fP from WT
Figure 2: Frequency variations (black line) and poweroutput from the wind turbine (grey line) during one night.
At approximately 02.00 the power output from the windturbine is raised to at least 15 kW and the plant is running inwind mode for the rest of the night. As can be seen, thefrequency is very stable when the plant is running in windmode. In fact, the frequency is much more stable in windmode than in the other two modes.
The frequency variations on Svenska Högarna were2.5 Hz in diesel and mixed modes. When it comes to windmode the frequency variations were below 0.1 Hz.
The total frequency variations are smaller on Androscompared with those on Svenska Högarna. The measure-ments on the grids solely without any wind turbines verifythat the difference does not depend on the type of windturbines used. The explanation is the big difference in sizebetween the two sites. Andros has an installed diesel powerof 15 000 kW compared to the 20 kW diesel power installedon Svenska Högarna. Hence, the spinning reserve is muchlarger on Andros compared to the spinning reserve onSvenska Högarna.
Worth pointing out is that the smallest frequency varia-tion at the two sites occurs on Svenska Högarna in windmode.
6. VOLTAGE VARIATIONS
6.1 StandardThe standard nominal voltage for public low voltage,
according to Standard EN 50 160, is 230 V between phaseand neutral. Under normal operating conditions during oneweek, 95 % of the 10 minutes average values of the supplyvoltage has to be within the range of 230 V ± 10 %.
6.2 AndrosThe voltage of the grid on Andros during two nights is
shown in Fig. 3. As can be seen, there are two voltage dropsduring the night when the turbines were shut down. Onepower drop at approximately 22.00 and the second one 1.5hours later. These two power drops occur at exactly thesame time as the frequency drops at the corresponding nightin Fig. 1. As in the frequency case, these voltage drops areemanating from diesel engine stops. The voltage regulatoron the diesel generator decreases the voltage when the loadincreases.
200
210
220
230
18.1
9
20.0
9
21.5
9
23.4
9
1.39
3.29
5.19
time
U (
V)
U without WTU with WT
Figure 3: Voltage variations during two nights. One nightwhen the turbines were operating (grey line) and one nightwhen the turbines were shut down due to lack of wind (blackline).
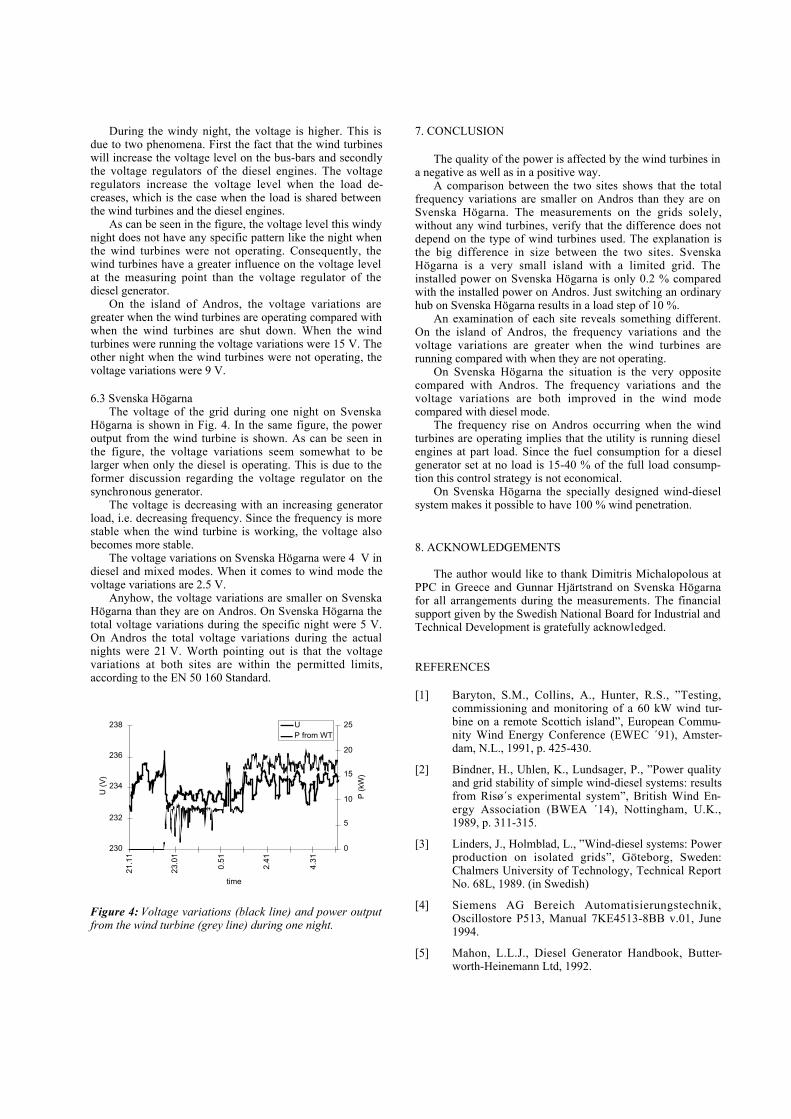
During the windy night, the voltage is higher. This isdue to two phenomena. First the fact that the wind turbineswill increase the voltage level on the bus-bars and secondlythe voltage regulators of the diesel engines. The voltageregulators increase the voltage level when the load de-creases, which is the case when the load is shared betweenthe wind turbines and the diesel engines.
As can be seen in the figure, the voltage level this windynight does not have any specific pattern like the night whenthe wind turbines were not operating. Consequently, thewind turbines have a greater influence on the voltage levelat the measuring point than the voltage regulator of thediesel generator.
On the island of Andros, the voltage variations aregreater when the wind turbines are operating compared withwhen the wind turbines are shut down. When the windturbines were running the voltage variations were 15 V. Theother night when the wind turbines were not operating, thevoltage variations were 9 V.
6.3 Svenska HögarnaThe voltage of the grid during one night on Svenska
Högarna is shown in Fig. 4. In the same figure, the poweroutput from the wind turbine is shown. As can be seen inthe figure, the voltage variations seem somewhat to belarger when only the diesel is operating. This is due to theformer discussion regarding the voltage regulator on thesynchronous generator.
The voltage is decreasing with an increasing generatorload, i.e. decreasing frequency. Since the frequency is morestable when the wind turbine is working, the voltage alsobecomes more stable.
The voltage variations on Svenska Högarna were 4 V indiesel and mixed modes. When it comes to wind mode thevoltage variations are 2.5 V.
Anyhow, the voltage variations are smaller on SvenskaHögarna than they are on Andros. On Svenska Högarna thetotal voltage variations during the specific night were 5 V.On Andros the total voltage variations during the actualnights were 21 V. Worth pointing out is that the voltagevariations at both sites are within the permitted limits,according to the EN 50 160 Standard.
230
232
234
236
238
21.1
1
23.0
1
0.51
2.41
4.31
time
U (
V)
0
5
10
15
20
25
P (
kW)
UP from WT
Figure 4: Voltage variations (black line) and power outputfrom the wind turbine (grey line) during one night.
7. CONCLUSION
The quality of the power is affected by the wind turbines ina negative as well as in a positive way.
A comparison between the two sites shows that the totalfrequency variations are smaller on Andros than they are onSvenska Högarna. The measurements on the grids solely,without any wind turbines, verify that the difference does notdepend on the type of wind turbines used. The explanation isthe big difference in size between the two sites. SvenskaHögarna is a very small island with a limited grid. Theinstalled power on Svenska Högarna is only 0.2 % comparedwith the installed power on Andros. Just switching an ordinaryhub on Svenska Högarna results in a load step of 10 %.
An examination of each site reveals something different.On the island of Andros, the frequency variations and thevoltage variations are greater when the wind turbines arerunning compared with when they are not operating.
On Svenska Högarna the situation is the very oppositecompared with Andros. The frequency variations and thevoltage variations are both improved in the wind modecompared with diesel mode.
The frequency rise on Andros occurring when the windturbines are operating implies that the utility is running dieselengines at part load. Since the fuel consumption for a dieselgenerator set at no load is 15-40 % of the full load consump-tion this control strategy is not economical.
On Svenska Högarna the specially designed wind-dieselsystem makes it possible to have 100 % wind penetration.
8. ACKNOWLEDGEMENTS
The author would like to thank Dimitris Michalopolous atPPC in Greece and Gunnar Hjärtstrand on Svenska Högarnafor all arrangements during the measurements. The financialsupport given by the Swedish National Board for Industrial andTechnical Development is gratefully acknowledged.
REFERENCES
[1] Baryton, S.M., Collins, A., Hunter, R.S., ”Testing,commissioning and monitoring of a 60 kW wind tur-bine on a remote Scottich island”, European Commu-nity Wind Energy Conference (EWEC ´91), Amster-dam, N.L., 1991, p. 425-430.
[2] Bindner, H., Uhlen, K., Lundsager, P., ”Power qualityand grid stability of simple wind-diesel systems: resultsfrom Risø´s experimental system”, British Wind En-ergy Association (BWEA ´14), Nottingham, U.K.,1989, p. 311-315.
[3] Linders, J., Holmblad, L., ”Wind-diesel systems: Powerproduction on isolated grids”, Göteborg, Sweden:Chalmers University of Technology, Technical ReportNo. 68L, 1989. (in Swedish)
[4] Siemens AG Bereich Automatisierungstechnik,Oscillostore P513, Manual 7KE4513-8BB v.01, June1994.
[5] Mahon, L.L.J., Diesel Generator Handbook, Butter-worth-Heinemann Ltd, 1992.
Paper 2C
Flicker and Slow Voltage Variations from Wind Turbines
Å. Larsson
Presented at
International Conference on Harmonics and Quality of Power (ICHQP '96)
Las Vegas, USA
October 16 - 18 1996
Flicker and Slow Voltage Variations from Wind Turbines
Åke Larsson M.Sc.Department of Electric Power Engineering
Chalmers University of TechnologyS-412 96 Göteborg, Sweden
E-mail [email protected] +46 31 772 1642fax +46 31 772 1633
Abstract-The penetration of wind turbines into the grid hasincreased during the last decade, and this development willcontinue in the future. In this situation, the influence of windturbines on the power quality of the grid has become an impor-tant issue. Flicker is one power quality phenomenon which canbe caused by power fluctuations from wind turbines. In thepaper, measurements of power fluctuations and voltage varia-tions caused by wind turbines are presented. The means bywhich wind turbines can produce flicker and the factors whichaffect its severity are discussed. Finally, the paper deals withthe conditions under which flicker is likely to be the limitingfactor when wind energy penetrates into the grid.
I. INTRODUCTION
Anything producing changes in supply voltage can be consid-ered to be a possible source of flicker. To determine whether asource will produce flicker, some fundamental voltage dropconsiderations must be examined: Large loads produce largervoltage fluctuations in comprison with small ones. Loadsconnected to a weak system are more likely to produce no-ticeable amounts of flicker than the same loads connected tostiffer systems.
Wind turbines are often raised in areas where the grid is weak.When wind turbines are connected to a grid two differentphenomena will occur: voltage fluctuations and stationaryvoltage variations emanating from the power produced in theturbine.
Voltage fluctuations are mainly caused by the tower shadoweffect. Due to the wind speed decrease in front or behind thetower, power output is reduced every time a rotor bladepasses the tower. If the turbine has three blades, the powerdrop will appear three times per revolution of the turbine.Normally, this will give rise to power dips with a frequencyof 1-2 Hz and a magnitude of approximately 20% [1].
Nevertheless, the recommendations given by power utilitiesoften have no requirements for power fluctuations. Normally,recommendations regarding the short-circuit ratio between theshort-circuit power of the grid and the rated power of thewind turbine are stated. In Sweden and Finland, for example,only stationary voltage variations are taken into considera-tion, and the utilities recommend a short-circut ratio greaterthan 20.
This paper deals with flicker and stationary voltage varia-tions, by which wind turbines can affect other consumersconnected to the grid. It is shown that not only does theshort-circuit ratio of the grid affect the voltage fluctuationsbut the ratio between the reactance X and the resistance R ofthe grid in combination with the reactive power consumptionof the load also has a significant impact on the voltage fluc-tuations. Depending on the X/R ratio of the grid, the mini-mum short-circuit ratio required for avoiding flicker will notbe determined by stationary voltage variations. If the X/Rratio is high, the 1 Hz voltage variations emanating from thetower shadow effect will determine the minimum short-circuitratio.
II. REACTIVE POWER DEMAND
Wind turbines can be divided into two main groups: con-stant-speed turbines and variable-speed turbines. The con-stant-speed operation of wind turbines is the most commontype of operation. Normally, constant-speed wind turbines areequipped with an induction generator connected directly tothe grid, which results in a simple electrical system. Theinduction generator has several advantages, such as a robustdesign, totally enclosed construction, low price and the abil-ity to withstand overloads. The major disadvantage is that themachine needs reactive power. In order to reduce this reactivepower demand, phase compensating capacitors are used. The

capacitance of the capacitors must be limited due to the riskof the self-magnetization of the generator in case of grid fail-ure. A rule of thumb is to compensate for reactive power upto a third of the nominal apparent power of the inductionmachine.
In Fig. 1 the reactive power from a constant-speed 450 kWwind turbine located at Risholmen in Sweden is shown as afunction of active power. As can be seen in the figure, reac-tive power is compensated for up to the no-load reactivepower demand limit of the generator.
Variable-speed wind turbines are equipped with a frequencyconverter between the grid and the generator. Depending onthe type of inverter used, wind turbines have different reactivepower demands. With a line-commutated inverter, the powerfactor is equal to or less than 0.9, while the power factor canfreely be chosen if a forced-commutated inverter is used.
III. VOLTAGE VARIATIONS AND X/R RATIO OF THEGRID
The short-circuit power of the grid of a specific point can becalculated as
SU
Z
U
R Xsc = =
+
2 2
2 2 (1)
where U refers to the voltage of the grid at the point of com-mon connection (PCC) and Z is the impedance of the grid atthe PCC. R and X refer to the resistance and the reactance ofthe grid in the PCC, respectively.
-0,3
-0,2
-0,1
0
0 0,2 0,4 0,6 0,8 1
Active Power P (p.u.)
Rea
ctiv
e P
ower
Q (
p.u.
)
Fig. 1. Reactive power as a function of active power.
According to (1), the short-circuit power is constant at aconstant voltage provided that the impedance is constant. Itmust, however, be noted that a given value of the impedancecan be obtained at different X/R ratios. The X/R ratio of a gridmay vary widely depending on the voltage level, grid con-figuration, type of lines and line geometry used. A 10 kVcable normally has a lower X/R ratio, varying from below 0.5to over 2, while the X/R ratio may vary from 1 to 5 for anoverhead line at the same voltage level.
A simple impedance model shown in Fig. 2 can be used tocalculate the voltage variations caused by active power P andreactive power Q. U1 is the voltage of the infinite bus and U2
is the voltage of the wind turbine at the PCC. Impedance Zrepresents the grid between the infinite bus and the turbine.
Z=R+jX U2U1PQ
Fig. 2: Simple impedance model.
The voltage at the PCC can be expressed as
U a a b22= + − (2)
where
aU
RP XQ= − +12
2( )
b P Q Z= +( )2 2 2
The measured voltage variation of the wind turbine located atRisholmen is presented in Fig. 3. The calculated voltagevariation obtained by (1) and (2) also is shown. The short-circuit ratio is 26 and the X/R ratio at the PCC is approxi-mately 5.5. As can be seen in Fig. 3, the voltage variationsare within tight limits, at this specific site, due to a high X/Rratio at the PCC.
Figure 4 shows the calculated voltage of the grid at the PCCat different X/R ratios and a constant short-circuit ratio of 26.The short-circuit ratio and the reactive power demand of thewind turbine are equal to the wind turbine site at Risholmen,shown in Fig. 1. As can be seen in Fig. 4, a low X/R ratiowill
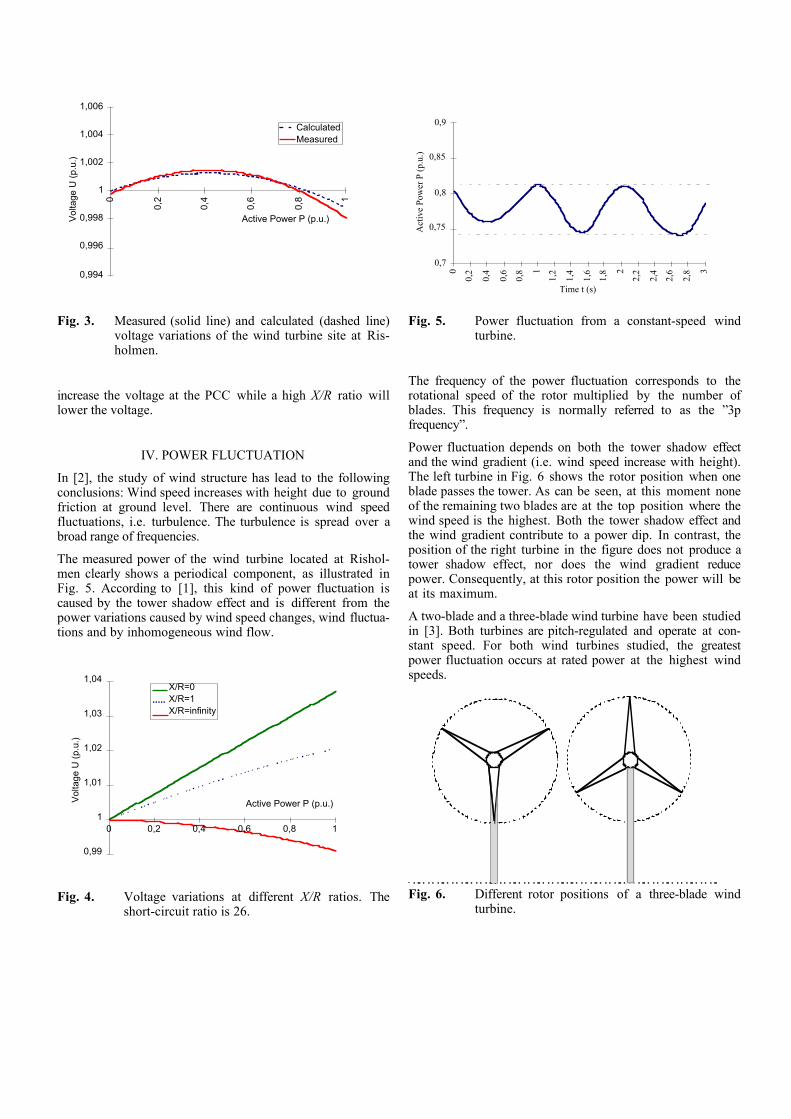
0,994
0,996
0,998
1
1,002
1,004
1,0060
0,2
0,4
0,6
0,8 1
Active Power P (p.u.)Vol
tage
U (
p.u.
)
CalculatedMeasured
Fig. 3. Measured (solid line) and calculated (dashed line)voltage variations of the wind turbine site at Ris-holmen.
increase the voltage at the PCC while a high X/R ratio willlower the voltage.
IV. POWER FLUCTUATION
In [2], the study of wind structure has lead to the followingconclusions: Wind speed increases with height due to groundfriction at ground level. There are continuous wind speedfluctuations, i.e. turbulence. The turbulence is spread over abroad range of frequencies.
The measured power of the wind turbine located at Rishol-men clearly shows a periodical component, as illustrated inFig. 5. According to [1], this kind of power fluctuation iscaused by the tower shadow effect and is different from thepower variations caused by wind speed changes, wind fluctua-tions and by inhomogeneous wind flow.
0,99
1
1,01
1,02
1,03
1,04
0 0,2 0,4 0,6 0,8 1
Active Power P (p.u.)Vol
tage
U (
p.u.
)
X/R=0X/R=1X/R=infinity
Fig. 4. Voltage variations at different X/R ratios. Theshort-circuit ratio is 26.
0,7
0,75
0,8
0,85
0,9
0
0,2
0,4
0,6
0,8 1
1,2
1,4
1,6
1,8 2
2,2
2,4
2,6
2,8 3
Time t (s)
Act
ive
Pow
er P
(p.
u.)
Fig. 5. Power fluctuation from a constant-speed windturbine.
The frequency of the power fluctuation corresponds to therotational speed of the rotor multiplied by the number ofblades. This frequency is normally referred to as the ”3pfrequency”.
Power fluctuation depends on both the tower shadow effectand the wind gradient (i.e. wind speed increase with height).The left turbine in Fig. 6 shows the rotor position when oneblade passes the tower. As can be seen, at this moment noneof the remaining two blades are at the top position where thewind speed is the highest. Both the tower shadow effect andthe wind gradient contribute to a power dip. In contrast, theposition of the right turbine in the figure does not produce atower shadow effect, nor does the wind gradient reducepower. Consequently, at this rotor position the power will beat its maximum.
A two-blade and a three-blade wind turbine have been studiedin [3]. Both turbines are pitch-regulated and operate at con-stant speed. For both wind turbines studied, the greatestpower fluctuation occurs at rated power at the highest windspeeds.
Fig. 6. Different rotor positions of a three-blade windturbine.
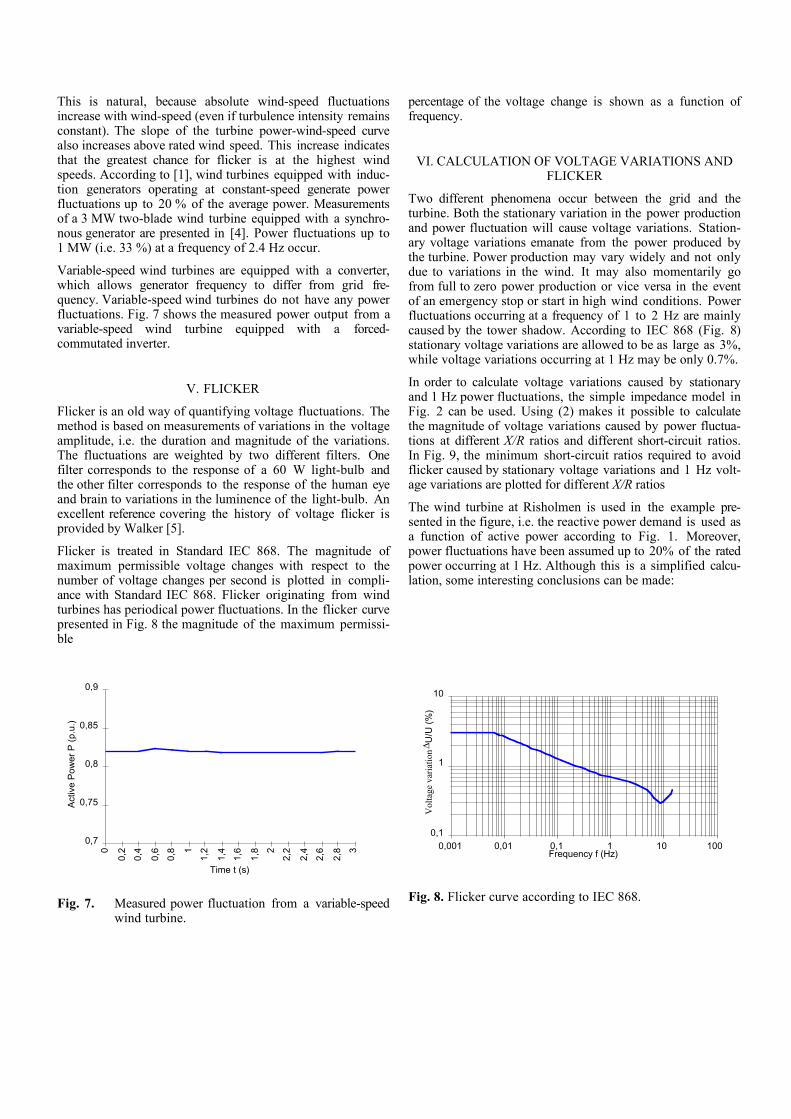
This is natural, because absolute wind-speed fluctuationsincrease with wind-speed (even if turbulence intensity remainsconstant). The slope of the turbine power-wind-speed curvealso increases above rated wind speed. This increase indicatesthat the greatest chance for flicker is at the highest windspeeds. According to [1], wind turbines equipped with induc-tion generators operating at constant-speed generate powerfluctuations up to 20 % of the average power. Measurementsof a 3 MW two-blade wind turbine equipped with a synchro-nous generator are presented in [4]. Power fluctuations up to1 MW (i.e. 33 %) at a frequency of 2.4 Hz occur.
Variable-speed wind turbines are equipped with a converter,which allows generator frequency to differ from grid fre-quency. Variable-speed wind turbines do not have any powerfluctuations. Fig. 7 shows the measured power output from avariable-speed wind turbine equipped with a forced-commutated inverter.
V. FLICKER
Flicker is an old way of quantifying voltage fluctuations. Themethod is based on measurements of variations in the voltageamplitude, i.e. the duration and magnitude of the variations.The fluctuations are weighted by two different filters. Onefilter corresponds to the response of a 60 W light-bulb andthe other filter corresponds to the response of the human eyeand brain to variations in the luminence of the light-bulb. Anexcellent reference covering the history of voltage flicker isprovided by Walker [5].
Flicker is treated in Standard IEC 868. The magnitude ofmaximum permissible voltage changes with respect to thenumber of voltage changes per second is plotted in compli-ance with Standard IEC 868. Flicker originating from windturbines has periodical power fluctuations. In the flicker curvepresented in Fig. 8 the magnitude of the maximum permissi-ble
0,7
0,75
0,8
0,85
0,9
0
0,2
0,4
0,6
0,8 1
1,2
1,4
1,6
1,8 2
2,2
2,4
2,6
2,8 3
Time t (s)
Act
ive
Pow
er P
(p.
u.)
Fig. 7. Measured power fluctuation from a variable-speedwind turbine.
percentage of the voltage change is shown as a function offrequency.
VI. CALCULATION OF VOLTAGE VARIATIONS ANDFLICKER
Two different phenomena occur between the grid and theturbine. Both the stationary variation in the power productionand power fluctuation will cause voltage variations. Station-ary voltage variations emanate from the power produced bythe turbine. Power production may vary widely and not onlydue to variations in the wind. It may also momentarily gofrom full to zero power production or vice versa in the eventof an emergency stop or start in high wind conditions. Powerfluctuations occurring at a frequency of 1 to 2 Hz are mainlycaused by the tower shadow. According to IEC 868 (Fig. 8)stationary voltage variations are allowed to be as large as 3%,while voltage variations occurring at 1 Hz may be only 0.7%.
In order to calculate voltage variations caused by stationaryand 1 Hz power fluctuations, the simple impedance model inFig. 2 can be used. Using (2) makes it possible to calculatethe magnitude of voltage variations caused by power fluctua-tions at different X/R ratios and different short-circuit ratios.In Fig. 9, the minimum short-circuit ratios required to avoidflicker caused by stationary voltage variations and 1 Hz volt-age variations are plotted for different X/R ratios
The wind turbine at Risholmen is used in the example pre-sented in the figure, i.e. the reactive power demand is used asa function of active power according to Fig. 1. Moreover,power fluctuations have been assumed up to 20% of the ratedpower occurring at 1 Hz. Although this is a simplified calcu-lation, some interesting conclusions can be made:
0,1
1
10
0,001 0,01 0,1 1 10 100Frequency f (Hz)
Vol
tage
var
iatio
n ∆U
/U (
%)
Fig. 8. Flicker curve according to IEC 868.
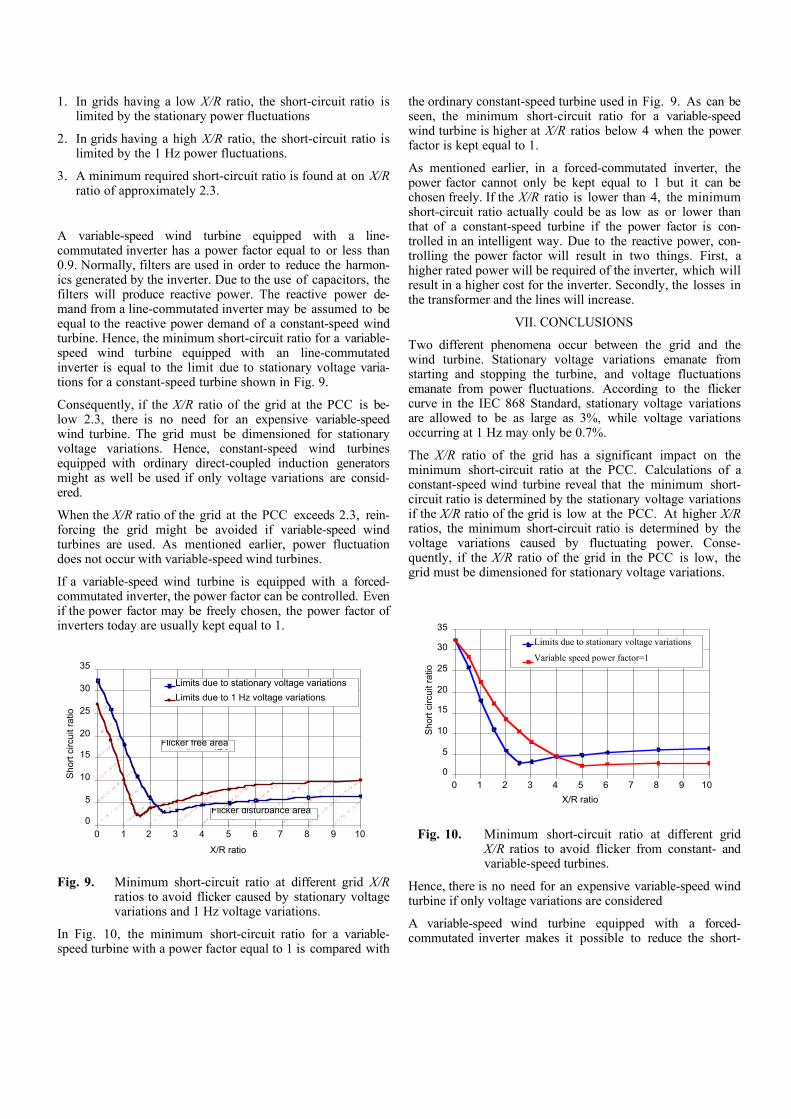
1. In grids having a low X/R ratio, the short-circuit ratio islimited by the stationary power fluctuations
2. In grids having a high X/R ratio, the short-circuit ratio islimited by the 1 Hz power fluctuations.
3. A minimum required short-circuit ratio is found at on X/Rratio of approximately 2.3.
A variable-speed wind turbine equipped with a line-commutated inverter has a power factor equal to or less than0.9. Normally, filters are used in order to reduce the harmon-ics generated by the inverter. Due to the use of capacitors, thefilters will produce reactive power. The reactive power de-mand from a line-commutated inverter may be assumed to beequal to the reactive power demand of a constant-speed windturbine. Hence, the minimum short-circuit ratio for a variable-speed wind turbine equipped with an line-commutatedinverter is equal to the limit due to stationary voltage varia-tions for a constant-speed turbine shown in Fig. 9.
Consequently, if the X/R ratio of the grid at the PCC is be-low 2.3, there is no need for an expensive variable-speedwind turbine. The grid must be dimensioned for stationaryvoltage variations. Hence, constant-speed wind turbinesequipped with ordinary direct-coupled induction generatorsmight as well be used if only voltage variations are consid-ered.
When the X/R ratio of the grid at the PCC exceeds 2.3, rein-forcing the grid might be avoided if variable-speed windturbines are used. As mentioned earlier, power fluctuationdoes not occur with variable-speed wind turbines.
If a variable-speed wind turbine is equipped with a forced-commutated inverter, the power factor can be controlled. Evenif the power factor may be freely chosen, the power factor ofinverters today are usually kept equal to 1.
0
5
10
15
20
25
30
35
0 1 2 3 4 5 6 7 8 9 10
X/R ratio
Sho
rt c
ircui
t ra
tio
Limits due to stationary voltage variations
Limits due to 1 Hz voltage variations
Flicker free areadi t IEC
Flicker disturbance area
Fig. 9. Minimum short-circuit ratio at different grid X/Rratios to avoid flicker caused by stationary voltagevariations and 1 Hz voltage variations.
In Fig. 10, the minimum short-circuit ratio for a variable-speed turbine with a power factor equal to 1 is compared with
the ordinary constant-speed turbine used in Fig. 9. As can beseen, the minimum short-circuit ratio for a variable-speedwind turbine is higher at X/R ratios below 4 when the powerfactor is kept equal to 1.
As mentioned earlier, in a forced-commutated inverter, thepower factor cannot only be kept equal to 1 but it can bechosen freely. If the X/R ratio is lower than 4, the minimumshort-circuit ratio actually could be as low as or lower thanthat of a constant-speed turbine if the power factor is con-trolled in an intelligent way. Due to the reactive power, con-trolling the power factor will result in two things. First, ahigher rated power will be required of the inverter, which willresult in a higher cost for the inverter. Secondly, the losses inthe transformer and the lines will increase.
VII. CONCLUSIONS
Two different phenomena occur between the grid and thewind turbine. Stationary voltage variations emanate fromstarting and stopping the turbine, and voltage fluctuationsemanate from power fluctuations. According to the flickercurve in the IEC 868 Standard, stationary voltage variationsare allowed to be as large as 3%, while voltage variationsoccurring at 1 Hz may only be 0.7%.
The X/R ratio of the grid has a significant impact on theminimum short-circuit ratio at the PCC. Calculations of aconstant-speed wind turbine reveal that the minimum short-circuit ratio is determined by the stationary voltage variationsif the X/R ratio of the grid is low at the PCC. At higher X/Rratios, the minimum short-circuit ratio is determined by thevoltage variations caused by fluctuating power. Conse-quently, if the X/R ratio of the grid in the PCC is low, thegrid must be dimensioned for stationary voltage variations.
0
5
10
15
20
25
30
35
0 1 2 3 4 5 6 7 8 9 10
X/R ratio
Sho
rt c
ircui
t ra
tio
Limits due to stationary voltage variations
Variable speed power factor=1
Fig. 10. Minimum short-circuit ratio at different gridX/R ratios to avoid flicker from constant- andvariable-speed turbines.
Hence, there is no need for an expensive variable-speed windturbine if only voltage variations are considered
A variable-speed wind turbine equipped with a forced-commutated inverter makes it possible to reduce the short-
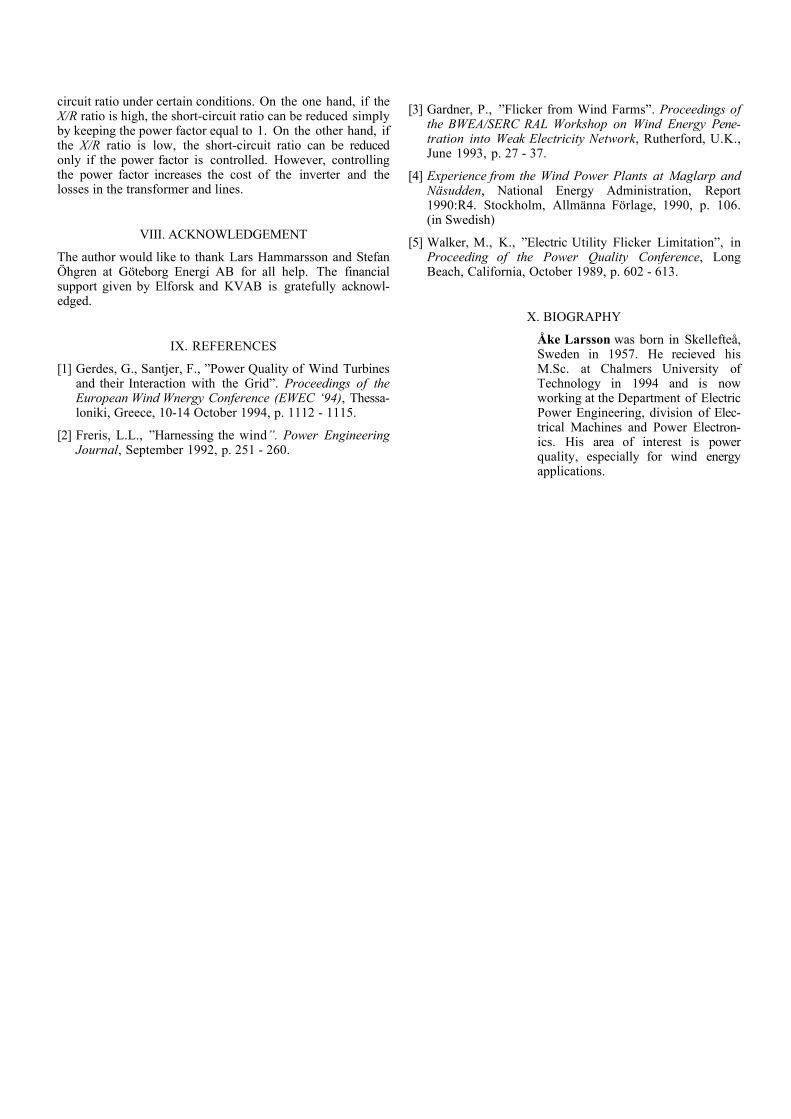
circuit ratio under certain conditions. On the one hand, if theX/R ratio is high, the short-circuit ratio can be reduced simplyby keeping the power factor equal to 1. On the other hand, ifthe X/R ratio is low, the short-circuit ratio can be reducedonly if the power factor is controlled. However, controllingthe power factor increases the cost of the inverter and thelosses in the transformer and lines.
VIII. ACKNOWLEDGEMENT
The author would like to thank Lars Hammarsson and StefanÖhgren at Göteborg Energi AB for all help. The financialsupport given by Elforsk and KVAB is gratefully acknowl-edged.
IX. REFERENCES
[1] Gerdes, G., Santjer, F., ”Power Quality of Wind Turbinesand their Interaction with the Grid”. Proceedings of theEuropean Wind Wnergy Conference (EWEC ‘94), Thessa-loniki, Greece, 10-14 October 1994, p. 1112 - 1115.
[2] Freris, L.L., ”Harnessing the wind”. Power EngineeringJournal, September 1992, p. 251 - 260.
[3] Gardner, P., ”Flicker from Wind Farms”. Proceedings ofthe BWEA/SERC RAL Workshop on Wind Energy Pene-tration into Weak Electricity Network, Rutherford, U.K.,June 1993, p. 27 - 37.
[4] Experience from the Wind Power Plants at Maglarp andNäsudden, National Energy Administration, Report1990:R4. Stockholm, Allmänna Förlage, 1990, p. 106.(in Swedish)
[5] Walker, M., K., ”Electric Utility Flicker Limitation”, inProceeding of the Power Quality Conference, LongBeach, California, October 1989, p. 602 - 613.
X. BIOGRAPHY
Åke Larsson was born in Skellefteå,Sweden in 1957. He recieved hisM.Sc. at Chalmers University ofTechnology in 1994 and is nowworking at the Department of ElectricPower Engineering, division of Elec-trical Machines and Power Electron-ics. His area of interest is powerquality, especially for wind energyapplications.
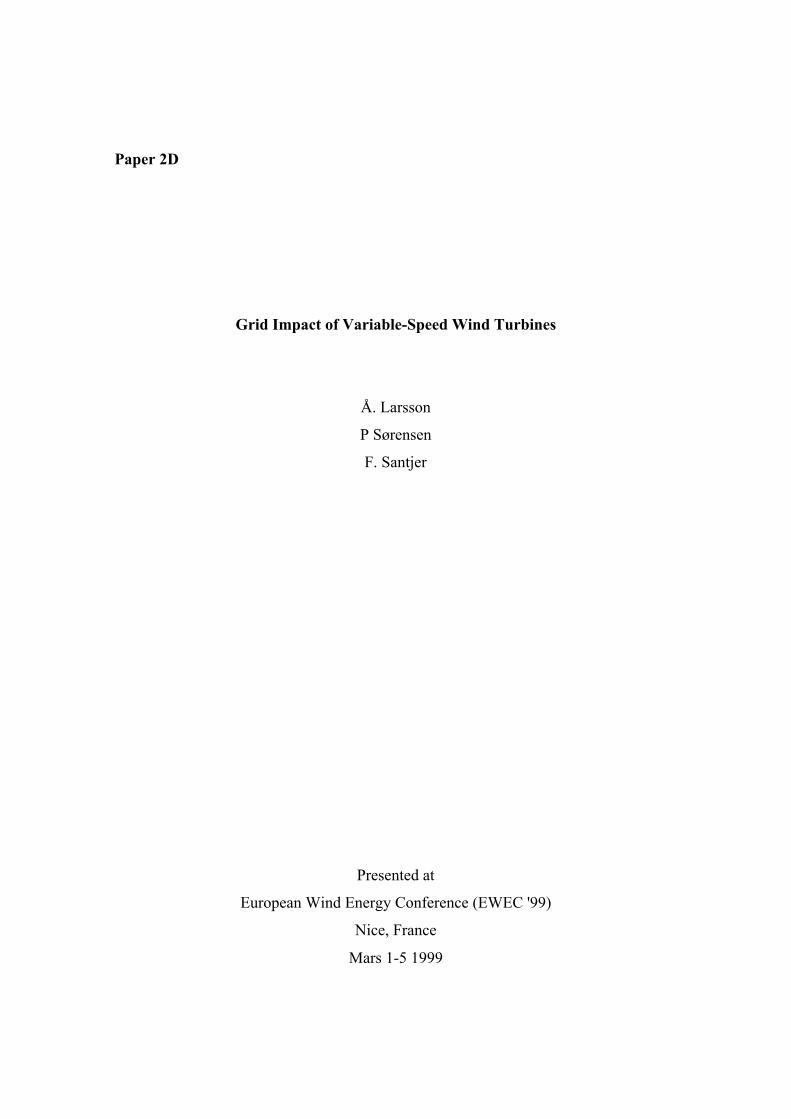
Paper 2D
Grid Impact of Variable-Speed Wind Turbines
Å. Larsson
P Sørensen
F. Santjer
Presented at
European Wind Energy Conference (EWEC '99)
Nice, France
Mars 1-5 1999
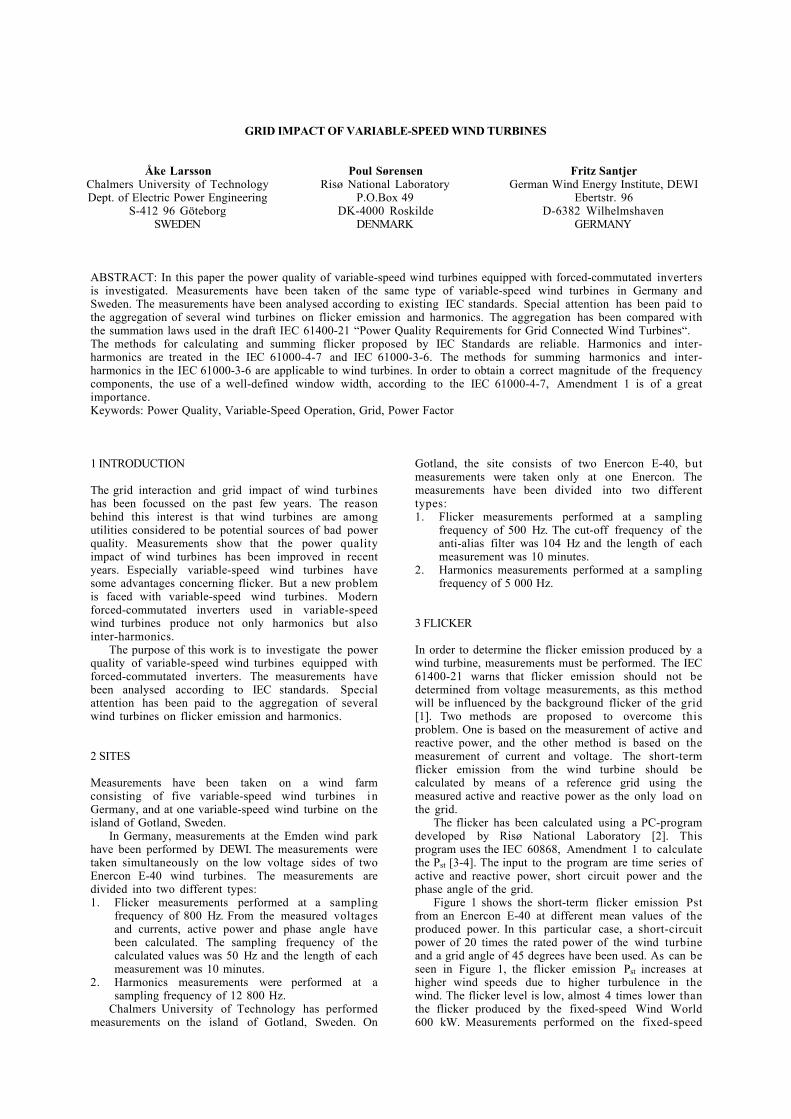
GRID IMPACT OF VARIABLE-SPEED WIND TURBINES
Åke LarssonChalmers University of TechnologyDept. of Electric Power Engineering
S-412 96 GöteborgSWEDEN
Poul SørensenRisø National Laboratory
P.O.Box 49DK-4000 Roskilde
DENMARK
Fritz SantjerGerman Wind Energy Institute, DEWI
Ebertstr. 96D-6382 Wilhelmshaven
GERMANY
ABSTRACT: In this paper the power quality of variable-speed wind turbines equipped with forced-commutated invertersis investigated. Measurements have been taken of the same type of variable-speed wind turbines in Germany andSweden. The measurements have been analysed according to existing IEC standards. Special attention has been paid tothe aggregation of several wind turbines on flicker emission and harmonics. The aggregation has been compared withthe summation laws used in the draft IEC 61400-21 “Power Quality Requirements for Grid Connected Wind Turbines“.The methods for calculating and summing flicker proposed by IEC Standards are reliable. Harmonics and inter-harmonics are treated in the IEC 61000-4-7 and IEC 61000-3-6. The methods for summing harmonics and inter-harmonics in the IEC 61000-3-6 are applicable to wind turbines. In order to obtain a correct magnitude of the frequencycomponents, the use of a well-defined window width, according to the IEC 61000-4-7, Amendment 1 is of a greatimportance.Keywords: Power Quality, Variable-Speed Operation, Grid, Power Factor
1 INTRODUCTION
The grid interaction and grid impact of wind turbineshas been focussed on the past few years. The reasonbehind this interest is that wind turbines are amongutilities considered to be potential sources of bad powerquality. Measurements show that the power qualityimpact of wind turbines has been improved in recentyears. Especially variable-speed wind turbines havesome advantages concerning flicker. But a new problemis faced with variable-speed wind turbines. Modernforced-commutated inverters used in variable-speedwind turbines produce not only harmonics but alsointer-harmonics.
The purpose of this work is to investigate the powerquality of variable-speed wind turbines equipped withforced-commutated inverters. The measurements havebeen analysed according to IEC standards. Specialattention has been paid to the aggregation of severalwind turbines on flicker emission and harmonics.
2 SITES
Measurements have been taken on a wind farmconsisting of five variable-speed wind turbines inGermany, and at one variable-speed wind turbine on theisland of Gotland, Sweden.
In Germany, measurements at the Emden wind parkhave been performed by DEWI. The measurements weretaken simultaneously on the low voltage sides of twoEnercon E-40 wind turbines. The measurements aredivided into two different types:1. Flicker measurements performed at a sampling
frequency of 800 Hz. From the measured voltagesand currents, active power and phase angle havebeen calculated. The sampling frequency of thecalculated values was 50 Hz and the length of eachmeasurement was 10 minutes.
2. Harmonics measurements were performed at asampling frequency of 12 800 Hz.
Chalmers University of Technology has performedmeasurements on the island of Gotland, Sweden. On
Gotland, the site consists of two Enercon E-40, butmeasurements were taken only at one Enercon. Themeasurements have been divided into two differenttypes:1. Flicker measurements performed at a sampling
frequency of 500 Hz. The cut-off frequency of theanti-alias filter was 104 Hz and the length of eachmeasurement was 10 minutes.
2. Harmonics measurements performed at a samplingfrequency of 5 000 Hz.
3 FLICKER
In order to determine the flicker emission produced by awind turbine, measurements must be performed. The IEC61400-21 warns that flicker emission should not bedetermined from voltage measurements, as this methodwill be influenced by the background flicker of the grid[1]. Two methods are proposed to overcome thisproblem. One is based on the measurement of active andreactive power, and the other method is based on themeasurement of current and voltage. The short-termflicker emission from the wind turbine should becalculated by means of a reference grid using themeasured active and reactive power as the only load onthe grid.
The flicker has been calculated using a PC-programdeveloped by Risø National Laboratory [2]. Thisprogram uses the IEC 60868, Amendment 1 to calculatethe Pst [3-4]. The input to the program are time series ofactive and reactive power, short circuit power and thephase angle of the grid.
Figure 1 shows the short-term flicker emission Pstfrom an Enercon E-40 at different mean values of theproduced power. In this particular case, a short-circuitpower of 20 times the rated power of the wind turbineand a grid angle of 45 degrees have been used. As can beseen in Figure 1, the flicker emission Pst increases athigher wind speeds due to higher turbulence in thewind. The flicker level is low, almost 4 times lower thanthe flicker produced by the fixed-speed Wind World600 kW. Measurements performed on the fixed-speed
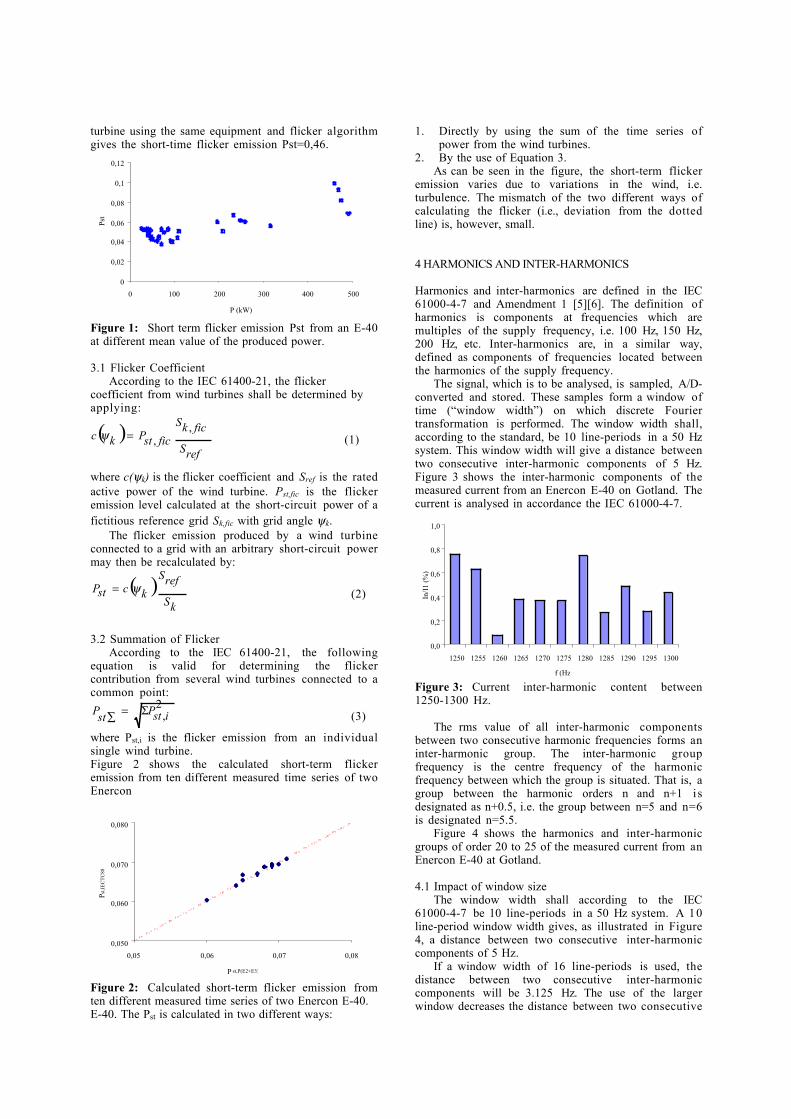
turbine using the same equipment and flicker algorithmgives the short-time flicker emission Pst=0,46.
0
0,02
0,04
0,06
0,08
0,1
0,12
0 100 200 300 400 500
P (kW)
Pst
Figure 1: Short term flicker emission Pst from an E-40at different mean value of the produced power.
3.1 Flicker CoefficientAccording to the IEC 61400-21, the flicker
coefficient from wind turbines shall be determined byapplying:
( )refS
fickS
ficstPkc,
,=ψ (1)
where c(ψk) is the flicker coefficient and Sref is the ratedactive power of the wind turbine. Pst,fic is the flickeremission level calculated at the short-circuit power of afictitious reference grid Sk,fic with grid angle ψk.
The flicker emission produced by a wind turbineconnected to a grid with an arbitrary short-circuit powermay then be recalculated by:
( )kS
refS
kcstP ψ= (2)
3.2 Summation of FlickerAccording to the IEC 61400-21, the following
equation is valid for determining the flickercontribution from several wind turbines connected to acommon point:
2,istPstP Σ=∑ (3)
where Pst,i is the flicker emission from an individualsingle wind turbine.Figure 2 shows the calculated short-term flickeremission from ten different measured time series of twoEnercon
0,050
0,060
0,070
0,080
0,05 0,06 0,07 0,08
P st,P(E2+E3)
Pst,I
EC
TC
88
Figure 2: Calculated short-term flicker emission fromten different measured time series of two Enercon E-40.E-40. The Pst is calculated in two different ways:
1. Directly by using the sum of the time series ofpower from the wind turbines.
2. By the use of Equation 3.As can be seen in the figure, the short-term flicker
emission varies due to variations in the wind, i.e.turbulence. The mismatch of the two different ways ofcalculating the flicker (i.e., deviation from the dottedline) is, however, small.
4 HARMONICS AND INTER-HARMONICS
Harmonics and inter-harmonics are defined in the IEC61000-4-7 and Amendment 1 [5][6]. The definition ofharmonics is components at frequencies which aremultiples of the supply frequency, i.e. 100 Hz, 150 Hz,200 Hz, etc. Inter-harmonics are, in a similar way,defined as components of frequencies located betweenthe harmonics of the supply frequency.
The signal, which is to be analysed, is sampled, A/D-converted and stored. These samples form a window oftime (“window width”) on which discrete Fouriertransformation is performed. The window width shall,according to the standard, be 10 line-periods in a 50 Hzsystem. This window width will give a distance betweentwo consecutive inter-harmonic components of 5 Hz.Figure 3 shows the inter-harmonic components of themeasured current from an Enercon E-40 on Gotland. Thecurrent is analysed in accordance the IEC 61000-4-7.
0,0
0,2
0,4
0,6
0,8
1,0
1250 1255 1260 1265 1270 1275 1280 1285 1290 1295 1300
f (Hz
In/I
1 (%
)
Figure 3: Current inter-harmonic content between1250-1300 Hz.
The rms value of all inter-harmonic componentsbetween two consecutive harmonic frequencies forms aninter-harmonic group. The inter-harmonic groupfrequency is the centre frequency of the harmonicfrequency between which the group is situated. That is, agroup between the harmonic orders n and n+1 i sdesignated as n+0.5, i.e. the group between n=5 and n=6is designated n=5.5.
Figure 4 shows the harmonics and inter-harmonicgroups of order 20 to 25 of the measured current from anEnercon E-40 at Gotland.
4.1 Impact of window sizeThe window width shall according to the IEC
61000-4-7 be 10 line-periods in a 50 Hz system. A 10line-period window width gives, as illustrated in Figure4, a distance between two consecutive inter-harmoniccomponents of 5 Hz.
If a window width of 16 line-periods is used, thedistance between two consecutive inter-harmoniccomponents will be 3.125 Hz. The use of the largerwindow decreases the distance between two consecutive
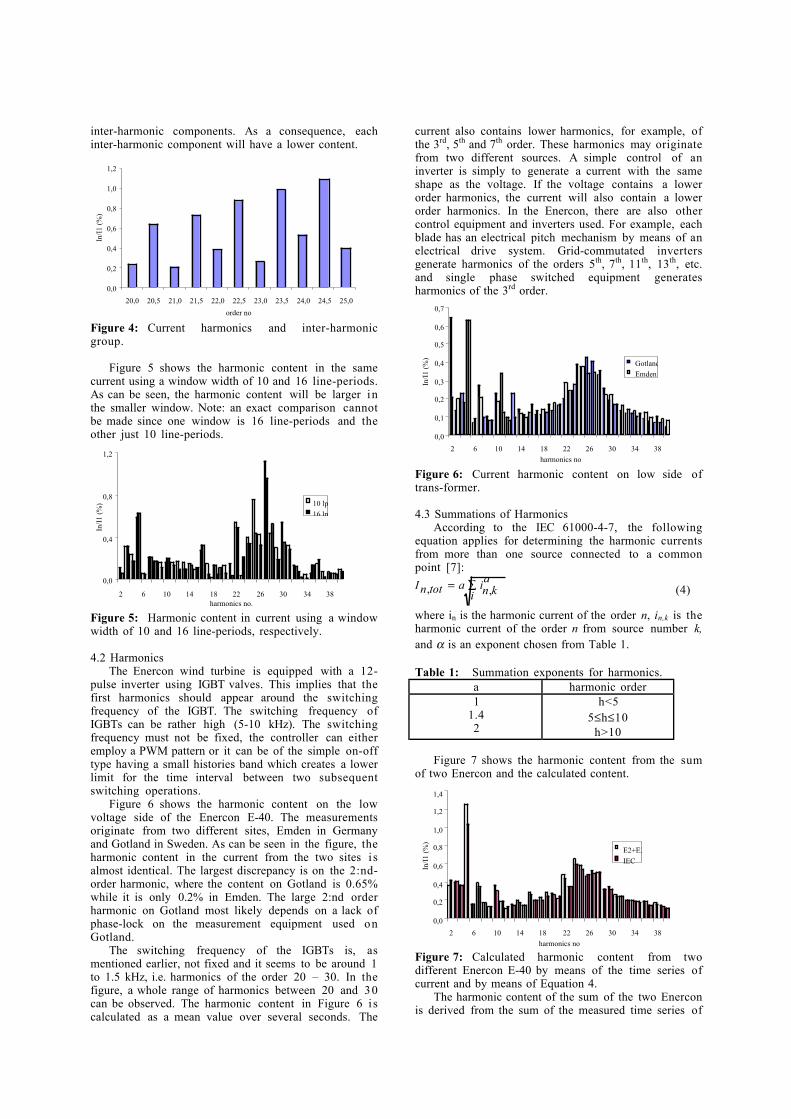
inter-harmonic components. As a consequence, eachinter-harmonic component will have a lower content.
0,0
0,2
0,4
0,6
0,8
1,0
1,2
20,0 20,5 21,0 21,5 22,0 22,5 23,0 23,5 24,0 24,5 25,0
order no.
In/I
1 (%
)
Figure 4: Current harmonics and inter-harmonicgroup.
Figure 5 shows the harmonic content in the samecurrent using a window width of 10 and 16 line-periods.As can be seen, the harmonic content will be larger inthe smaller window. Note: an exact comparison cannotbe made since one window is 16 line-periods and theother just 10 line-periods.
0,0
0,4
0,8
1,2
2 6 10 14 18 22 26 30 34 38harmonics no.
In/I
1 (%
) 10 lp
16 lp
Figure 5: Harmonic content in current using a windowwidth of 10 and 16 line-periods, respectively.
4.2 HarmonicsThe Enercon wind turbine is equipped with a 12-
pulse inverter using IGBT valves. This implies that thefirst harmonics should appear around the switchingfrequency of the IGBT. The switching frequency ofIGBTs can be rather high (5-10 kHz). The switchingfrequency must not be fixed, the controller can eitheremploy a PWM pattern or it can be of the simple on-offtype having a small histories band which creates a lowerlimit for the time interval between two subsequentswitching operations.
Figure 6 shows the harmonic content on the lowvoltage side of the Enercon E-40. The measurementsoriginate from two different sites, Emden in Germanyand Gotland in Sweden. As can be seen in the figure, theharmonic content in the current from the two sites i salmost identical. The largest discrepancy is on the 2:nd-order harmonic, where the content on Gotland is 0.65%while it is only 0.2% in Emden. The large 2:nd orderharmonic on Gotland most likely depends on a lack ofphase-lock on the measurement equipment used onGotland.
The switching frequency of the IGBTs is, asmentioned earlier, not fixed and it seems to be around 1to 1.5 kHz, i.e. harmonics of the order 20 – 30. In thefigure, a whole range of harmonics between 20 and 30can be observed. The harmonic content in Figure 6 i scalculated as a mean value over several seconds. The
current also contains lower harmonics, for example, ofthe 3rd, 5th and 7th order. These harmonics may originatefrom two different sources. A simple control of aninverter is simply to generate a current with the sameshape as the voltage. If the voltage contains a lowerorder harmonics, the current will also contain a lowerorder harmonics. In the Enercon, there are also othercontrol equipment and inverters used. For example, eachblade has an electrical pitch mechanism by means of anelectrical drive system. Grid-commutated invertersgenerate harmonics of the orders 5th, 7th, 11th, 13th, etc.and single phase switched equipment generatesharmonics of the 3rd order.
0,0
0,1
0,2
0,3
0,4
0,5
0,6
0,7
2 6 10 14 18 22 26 30 34 38
harmonics no
In/I
1 (%
)
Gotland
Emden
Figure 6: Current harmonic content on low side oftrans-former.
4.3 Summations of HarmonicsAccording to the IEC 61000-4-7, the following
equation applies for determining the harmonic currentsfrom more than one source connected to a commonpoint [7]:
ai
aknitotnI ∑= ,, (4)
where in is the harmonic current of the order n, in,k is theharmonic current of the order n from source number k,and α is an exponent chosen from Table 1.
Table 1: Summation exponents for harmonics.a harmonic order1
1.42
h<55≤h≤10
h>10
Figure 7 shows the harmonic content from the sumof two Enercon and the calculated content.
0,0
0,2
0,4
0,6
0,8
1,0
1,2
1,4
2 6 10 14 18 22 26 30 34 38
harmonics no
In/I
1 (%
)
E2+E3
IEC
Figure 7: Calculated harmonic content from twodifferent Enercon E-40 by means of the time series ofcurrent and by means of Equation 4.
The harmonic content of the sum of the two Enerconis derived from the sum of the measured time series of
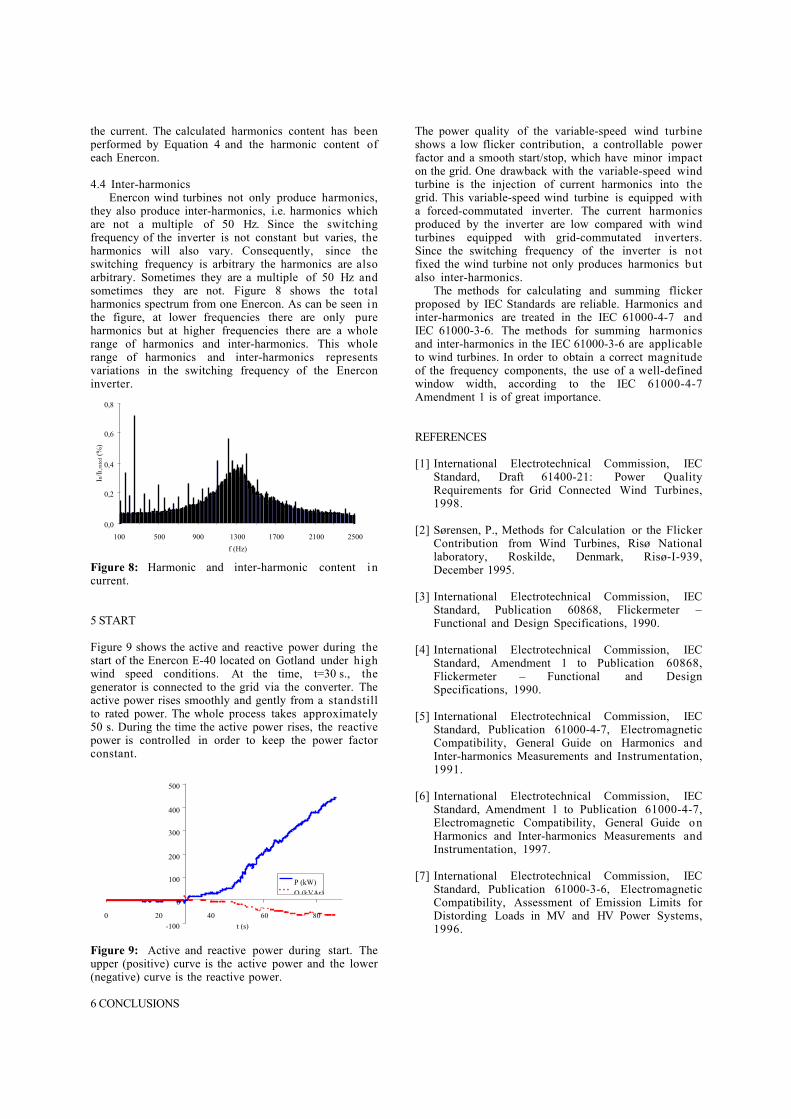
the current. The calculated harmonics content has beenperformed by Equation 4 and the harmonic content ofeach Enercon.
4.4 Inter-harmonicsEnercon wind turbines not only produce harmonics,
they also produce inter-harmonics, i.e. harmonics whichare not a multiple of 50 Hz. Since the switchingfrequency of the inverter is not constant but varies, theharmonics will also vary. Consequently, since theswitching frequency is arbitrary the harmonics are alsoarbitrary. Sometimes they are a multiple of 50 Hz andsometimes they are not. Figure 8 shows the totalharmonics spectrum from one Enercon. As can be seen inthe figure, at lower frequencies there are only pureharmonics but at higher frequencies there are a wholerange of harmonics and inter-harmonics. This wholerange of harmonics and inter-harmonics representsvariations in the switching frequency of the Enerconinverter.
0,0
0,2
0,4
0,6
0,8
100 500 900 1300 1700 2100 2500
f (Hz)
In/I1
,rat
ed (
%)
Figure 8: Harmonic and inter-harmonic content incurrent.
5 START
Figure 9 shows the active and reactive power during thestart of the Enercon E-40 located on Gotland under highwind speed conditions. At the time, t=30 s., thegenerator is connected to the grid via the converter. Theactive power rises smoothly and gently from a standstillto rated power. The whole process takes approximately50 s. During the time the active power rises, the reactivepower is controlled in order to keep the power factorconstant.
-100
0
100
200
300
400
500
0 20 40 60 80
t (s)
P (kW)
Q (kVAr)
Figure 9: Active and reactive power during start. Theupper (positive) curve is the active power and the lower(negative) curve is the reactive power.
6 CONCLUSIONS
The power quality of the variable-speed wind turbineshows a low flicker contribution, a controllable powerfactor and a smooth start/stop, which have minor impacton the grid. One drawback with the variable-speed windturbine is the injection of current harmonics into thegrid. This variable-speed wind turbine is equipped witha forced-commutated inverter. The current harmonicsproduced by the inverter are low compared with windturbines equipped with grid-commutated inverters.Since the switching frequency of the inverter is notfixed the wind turbine not only produces harmonics butalso inter-harmonics.
The methods for calculating and summing flickerproposed by IEC Standards are reliable. Harmonics andinter-harmonics are treated in the IEC 61000-4-7 andIEC 61000-3-6. The methods for summing harmonicsand inter-harmonics in the IEC 61000-3-6 are applicableto wind turbines. In order to obtain a correct magnitudeof the frequency components, the use of a well-definedwindow width, according to the IEC 61000-4-7Amendment 1 is of great importance.
REFERENCES
[1] International Electrotechnical Commission, IECStandard, Draft 61400-21: Power QualityRequirements for Grid Connected Wind Turbines,1998.
[2] Sørensen, P., Methods for Calculation or the FlickerContribution from Wind Turbines, Risø Nationallaboratory, Roskilde, Denmark, Risø-I-939,December 1995.
[3] International Electrotechnical Commission, IECStandard, Publication 60868, Flickermeter –Functional and Design Specifications, 1990.
[4] International Electrotechnical Commission, IECStandard, Amendment 1 to Publication 60868,Flickermeter – Functional and DesignSpecifications, 1990.
[5] International Electrotechnical Commission, IECStandard, Publication 61000-4-7, ElectromagneticCompatibility, General Guide on Harmonics andInter-harmonics Measurements and Instrumentation,1991.
[6] International Electrotechnical Commission, IECStandard, Amendment 1 to Publication 61000-4-7,Electromagnetic Compatibility, General Guide onHarmonics and Inter-harmonics Measurements andInstrumentation, 1997.
[7] International Electrotechnical Commission, IECStandard, Publication 61000-3-6, ElectromagneticCompatibility, Assessment of Emission Limits forDistording Loads in MV and HV Power Systems,1996.

Paper 3A
Standards for Measurements and Testing of Wind Turbine Power Quality
P Sørensen
G. Gerdes
R. Klosse
F. Santjer
N. Robertson
W. Davy
M. Koulouvari
E. Morfiadakis
Å. Larsson
Presented at
European Wind Energy Conference (EWEC '99)
Nice, France
Mars 1-5 1999
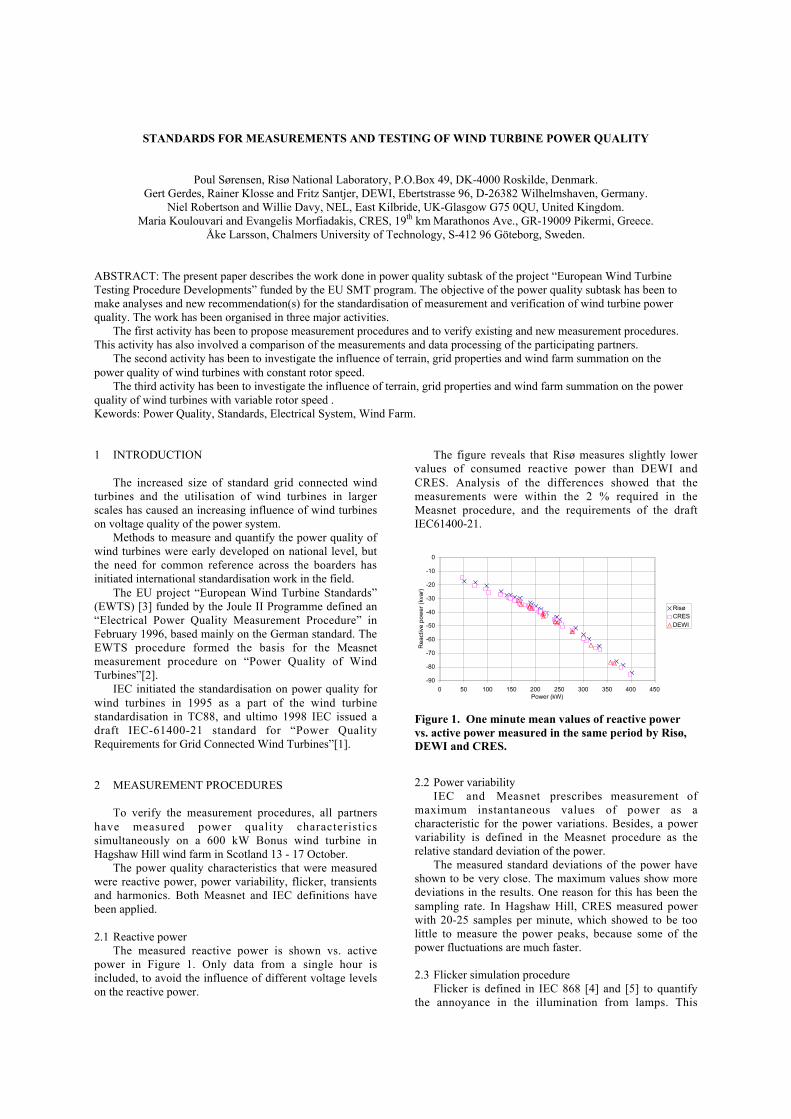
STANDARDS FOR MEASUREMENTS AND TESTING OF WIND TURBINE POWER QUALITY
Poul Sørensen, Risø National Laboratory, P.O.Box 49, DK-4000 Roskilde, Denmark.Gert Gerdes, Rainer Klosse and Fritz Santjer, DEWI, Ebertstrasse 96, D-26382 Wilhelmshaven, Germany.
Niel Robertson and Willie Davy, NEL, East Kilbride, UK-Glasgow G75 0QU, United Kingdom.Maria Koulouvari and Evangelis Morfiadakis, CRES, 19th km Marathonos Ave., GR-19009 Pikermi, Greece.
Åke Larsson, Chalmers University of Technology, S-412 96 Göteborg, Sweden.
ABSTRACT: The present paper describes the work done in power quality subtask of the project “European Wind TurbineTesting Procedure Developments” funded by the EU SMT program. The objective of the power quality subtask has been tomake analyses and new recommendation(s) for the standardisation of measurement and verification of wind turbine powerquality. The work has been organised in three major activities.
The first activity has been to propose measurement procedures and to verify existing and new measurement procedures.This activity has also involved a comparison of the measurements and data processing of the participating partners.
The second activity has been to investigate the influence of terrain, grid properties and wind farm summation on thepower quality of wind turbines with constant rotor speed.
The third activity has been to investigate the influence of terrain, grid properties and wind farm summation on the powerquality of wind turbines with variable rotor speed .Kewords: Power Quality, Standards, Electrical System, Wind Farm.
1 INTRODUCTION
The increased size of standard grid connected windturbines and the utilisation of wind turbines in largerscales has caused an increasing influence of wind turbineson voltage quality of the power system.
Methods to measure and quantify the power quality ofwind turbines were early developed on national level, butthe need for common reference across the boarders hasinitiated international standardisation work in the field.
The EU project “European Wind Turbine Standards”(EWTS) [3] funded by the Joule II Programme defined an“Electrical Power Quality Measurement Procedure” inFebruary 1996, based mainly on the German standard. TheEWTS procedure formed the basis for the Measnetmeasurement procedure on “Power Quality of WindTurbines”[2].
IEC initiated the standardisation on power quality forwind turbines in 1995 as a part of the wind turbinestandardisation in TC88, and ultimo 1998 IEC issued adraft IEC-61400-21 standard for “Power QualityRequirements for Grid Connected Wind Turbines”[1].
2 MEASUREMENT PROCEDURES
To verify the measurement procedures, all partnershave measured power quality characteristicssimultaneously on a 600 kW Bonus wind turbine inHagshaw Hill wind farm in Scotland 13 - 17 October.
The power quality characteristics that were measuredwere reactive power, power variability, flicker, transientsand harmonics. Both Measnet and IEC definitions havebeen applied.
2.1 Reactive powerThe measured reactive power is shown vs. active
power in Figure 1. Only data from a single hour isincluded, to avoid the influence of different voltage levelson the reactive power.
The figure reveals that Risø measures slightly lowervalues of consumed reactive power than DEWI andCRES. Analysis of the differences showed that themeasurements were within the 2 % required in theMeasnet procedure, and the requirements of the draftIEC61400-21.
2.2 Power variabilityIEC and Measnet prescribes measurement of
maximum instantaneous values of power as acharacteristic for the power variations. Besides, a powervariability is defined in the Measnet procedure as therelative standard deviation of the power.
The measured standard deviations of the power haveshown to be very close. The maximum values show moredeviations in the results. One reason for this has been thesampling rate. In Hagshaw Hill, CRES measured powerwith 20-25 samples per minute, which showed to be toolittle to measure the power peaks, because some of thepower fluctuations are much faster.
2.3 Flicker simulation procedureFlicker is defined in IEC 868 [4] and [5] to quantify
the annoyance in the illumination from lamps. This
-90
-80
-70
-60
-50
-40
-30
-20
-10
0
0 50 100 150 200 250 300 350 400 450Power (kW)
Rea
ctiv
e po
wer
(kv
ar)
RisøCRESDEWI
Figure 1. One minute mean values of reactive powervs. active power measured in the same period by Risø,DEWI and CRES.
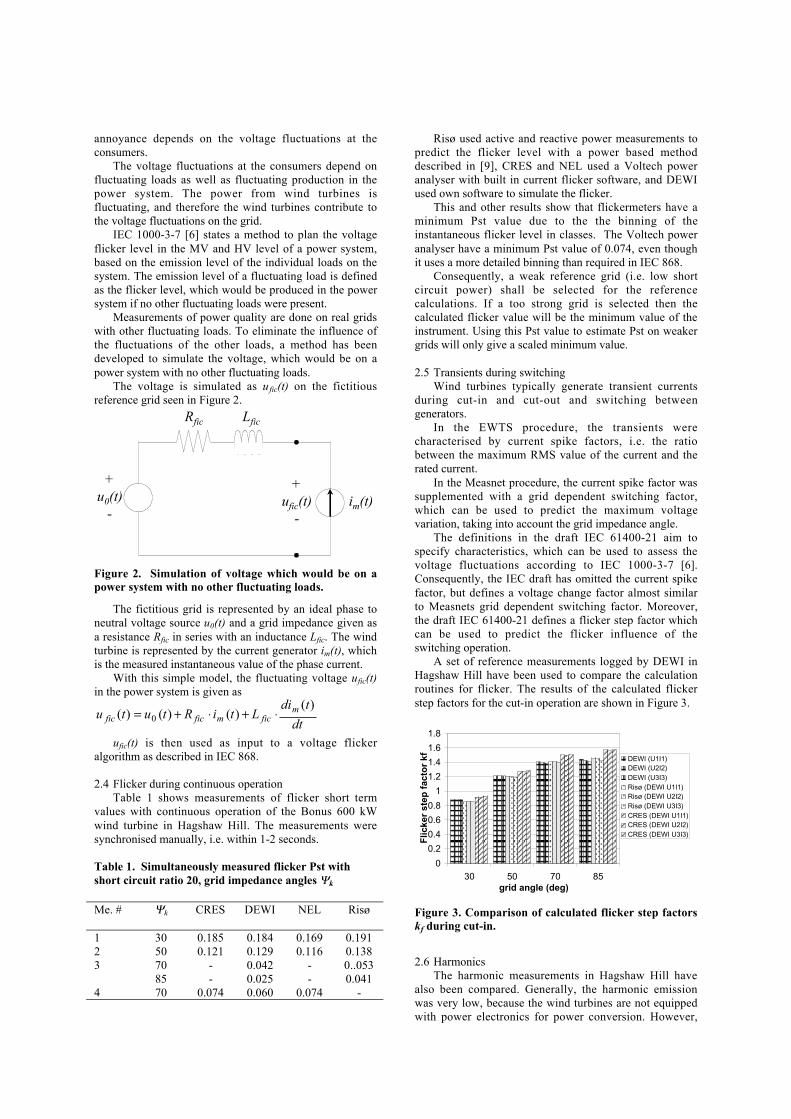
annoyance depends on the voltage fluctuations at theconsumers.
The voltage fluctuations at the consumers depend onfluctuating loads as well as fluctuating production in thepower system. The power from wind turbines isfluctuating, and therefore the wind turbines contribute tothe voltage fluctuations on the grid.
IEC 1000-3-7 [6] states a method to plan the voltageflicker level in the MV and HV level of a power system,based on the emission level of the individual loads on thesystem. The emission level of a fluctuating load is definedas the flicker level, which would be produced in the powersystem if no other fluctuating loads were present.
Measurements of power quality are done on real gridswith other fluctuating loads. To eliminate the influence ofthe fluctuations of the other loads, a method has beendeveloped to simulate the voltage, which would be on apower system with no other fluctuating loads.
The voltage is simulated as ufic(t) on the fictitiousreference grid seen in Figure 2.
The fictitious grid is represented by an ideal phase toneutral voltage source u0(t) and a grid impedance given asa resistance Rfic in series with an inductance Lfic. The windturbine is represented by the current generator im(t), whichis the measured instantaneous value of the phase current.
With this simple model, the fluctuating voltage ufic(t)in the power system is given as
dt
tdiLtiRtutu m
ficmficfic)(
)()()( 0 ⋅+⋅+=
ufic(t) is then used as input to a voltage flickeralgorithm as described in IEC 868.
2.4 Flicker during continuous operationTable 1 shows measurements of flicker short term
values with continuous operation of the Bonus 600 kWwind turbine in Hagshaw Hill. The measurements weresynchronised manually, i.e. within 1-2 seconds.
Risø used active and reactive power measurements topredict the flicker level with a power based methoddescribed in [9], CRES and NEL used a Voltech poweranalyser with built in current flicker software, and DEWIused own software to simulate the flicker.
This and other results show that flickermeters have aminimum Pst value due to the the binning of theinstantaneous flicker level in classes. The Voltech poweranalyser have a minimum Pst value of 0.074, even thoughit uses a more detailed binning than required in IEC 868.
Consequently, a weak reference grid (i.e. low shortcircuit power) shall be selected for the referencecalculations. If a too strong grid is selected then thecalculated flicker value will be the minimum value of theinstrument. Using this Pst value to estimate Pst on weakergrids will only give a scaled minimum value.
2.5 Transients during switchingWind turbines typically generate transient currents
during cut-in and cut-out and switching betweengenerators.
In the EWTS procedure, the transients werecharacterised by current spike factors, i.e. the ratiobetween the maximum RMS value of the current and therated current.
In the Measnet procedure, the current spike factor wassupplemented with a grid dependent switching factor,which can be used to predict the maximum voltagevariation, taking into account the grid impedance angle.
The definitions in the draft IEC 61400-21 aim tospecify characteristics, which can be used to assess thevoltage fluctuations according to IEC 1000-3-7 [6].Consequently, the IEC draft has omitted the current spikefactor, but defines a voltage change factor almost similarto Measnets grid dependent switching factor. Moreover,the draft IEC 61400-21 defines a flicker step factor whichcan be used to predict the flicker influence of theswitching operation.
A set of reference measurements logged by DEWI inHagshaw Hill have been used to compare the calculationroutines for flicker. The results of the calculated flickerstep factors for the cut-in operation are shown in Figure 3.
2.6 HarmonicsThe harmonic measurements in Hagshaw Hill have
also been compared. Generally, the harmonic emissionwas very low, because the wind turbines are not equippedwith power electronics for power conversion. However,
im(t)
Rfic Lfic
+ufic(t)
-
+u0(t)
-
Figure 2. Simulation of voltage which would be on apower system with no other fluctuating loads.
Table 1. Simultaneously measured flicker Pst withshort circuit ratio 20, grid impedance angles Ψk
Me. # Ψk CRES DEWI NEL Risø
1 30 0.185 0.184 0.169 0.1912 50 0.121 0.129 0.116 0.1383 70
85--
0.0420.025
--
0..0530.041
4 70 0.074 0.060 0.074 -
0
0.2
0.4
0.6
0.8
1
1.2
1.4
1.6
1.8
30 50 70 85grid angle (deg)
Flic
ker
step
fac
tor
kf DEWI (U1I1)DEWI (U2I2)DEWI (U3I3)Risø (DEWI U1I1)Risø (DEWI U2I2)Risø (DEWI U3I3)CRES (DEWI U1I1)CRES (DEWI U2I2)CRES (DEWI U3I3)
Figure 3. Comparison of calculated flicker step factorskf during cut-in.
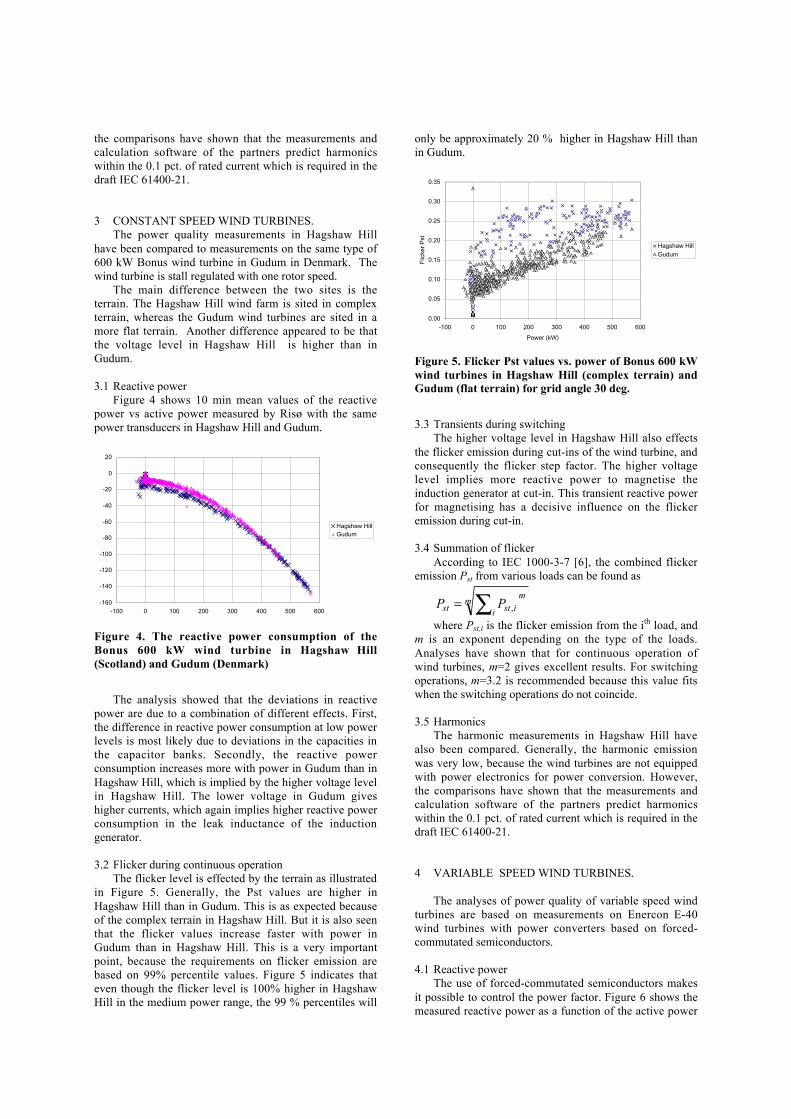
the comparisons have shown that the measurements andcalculation software of the partners predict harmonicswithin the 0.1 pct. of rated current which is required in thedraft IEC 61400-21.
3 CONSTANT SPEED WIND TURBINES.The power quality measurements in Hagshaw Hill
have been compared to measurements on the same type of600 kW Bonus wind turbine in Gudum in Denmark. Thewind turbine is stall regulated with one rotor speed.
The main difference between the two sites is theterrain. The Hagshaw Hill wind farm is sited in complexterrain, whereas the Gudum wind turbines are sited in amore flat terrain. Another difference appeared to be thatthe voltage level in Hagshaw Hill is higher than inGudum.
3.1 Reactive powerFigure 4 shows 10 min mean values of the reactive
power vs active power measured by Risø with the samepower transducers in Hagshaw Hill and Gudum.
The analysis showed that the deviations in reactivepower are due to a combination of different effects. First,the difference in reactive power consumption at low powerlevels is most likely due to deviations in the capacities inthe capacitor banks. Secondly, the reactive powerconsumption increases more with power in Gudum than inHagshaw Hill, which is implied by the higher voltage levelin Hagshaw Hill. The lower voltage in Gudum giveshigher currents, which again implies higher reactive powerconsumption in the leak inductance of the inductiongenerator.
3.2 Flicker during continuous operationThe flicker level is effected by the terrain as illustrated
in Figure 5. Generally, the Pst values are higher inHagshaw Hill than in Gudum. This is as expected becauseof the complex terrain in Hagshaw Hill. But it is also seenthat the flicker values increase faster with power inGudum than in Hagshaw Hill. This is a very importantpoint, because the requirements on flicker emission arebased on 99% percentile values. Figure 5 indicates thateven though the flicker level is 100% higher in HagshawHill in the medium power range, the 99 % percentiles will
only be approximately 20 % higher in Hagshaw Hill thanin Gudum.
3.3 Transients during switchingThe higher voltage level in Hagshaw Hill also effects
the flicker emission during cut-ins of the wind turbine, andconsequently the flicker step factor. The higher voltagelevel implies more reactive power to magnetise theinduction generator at cut-in. This transient reactive powerfor magnetising has a decisive influence on the flickeremission during cut-in.
3.4 Summation of flickerAccording to IEC 1000-3-7 [6], the combined flicker
emission Pst from various loads can be found as
mm
i istst PP ∑= ,
where Pst,i is the flicker emission from the ith load, andm is an exponent depending on the type of the loads.Analyses have shown that for continuous operation ofwind turbines, m=2 gives excellent results. For switchingoperations, m=3.2 is recommended because this value fitswhen the switching operations do not coincide.
3.5 HarmonicsThe harmonic measurements in Hagshaw Hill have
also been compared. Generally, the harmonic emissionwas very low, because the wind turbines are not equippedwith power electronics for power conversion. However,the comparisons have shown that the measurements andcalculation software of the partners predict harmonicswithin the 0.1 pct. of rated current which is required in thedraft IEC 61400-21.
4 VARIABLE SPEED WIND TURBINES.
The analyses of power quality of variable speed windturbines are based on measurements on Enercon E-40wind turbines with power converters based on forced-commutated semiconductors.
4.1 Reactive powerThe use of forced-commutated semiconductors makes
it possible to control the power factor. Figure 6 shows themeasured reactive power as a function of the active power
-160
-140
-120
-100
-80
-60
-40
-20
0
20
-100 0 100 200 300 400 500 600
Hagshaw HillGudum
Figure 4. The reactive power consumption of theBonus 600 kW wind turbine in Hagshaw Hill(Scotland) and Gudum (Denmark)
0.00
0.05
0.10
0.15
0.20
0.25
0.30
0.35
-100 0 100 200 300 400 500 600
Power (kW)
Flic
ker
Pst
Hagshaw HillGudum
Figure 5. Flicker Pst values vs. power of Bonus 600 kWwind turbines in Hagshaw Hill (complex terrain) andGudum (flat terrain) for grid angle 30 deg.
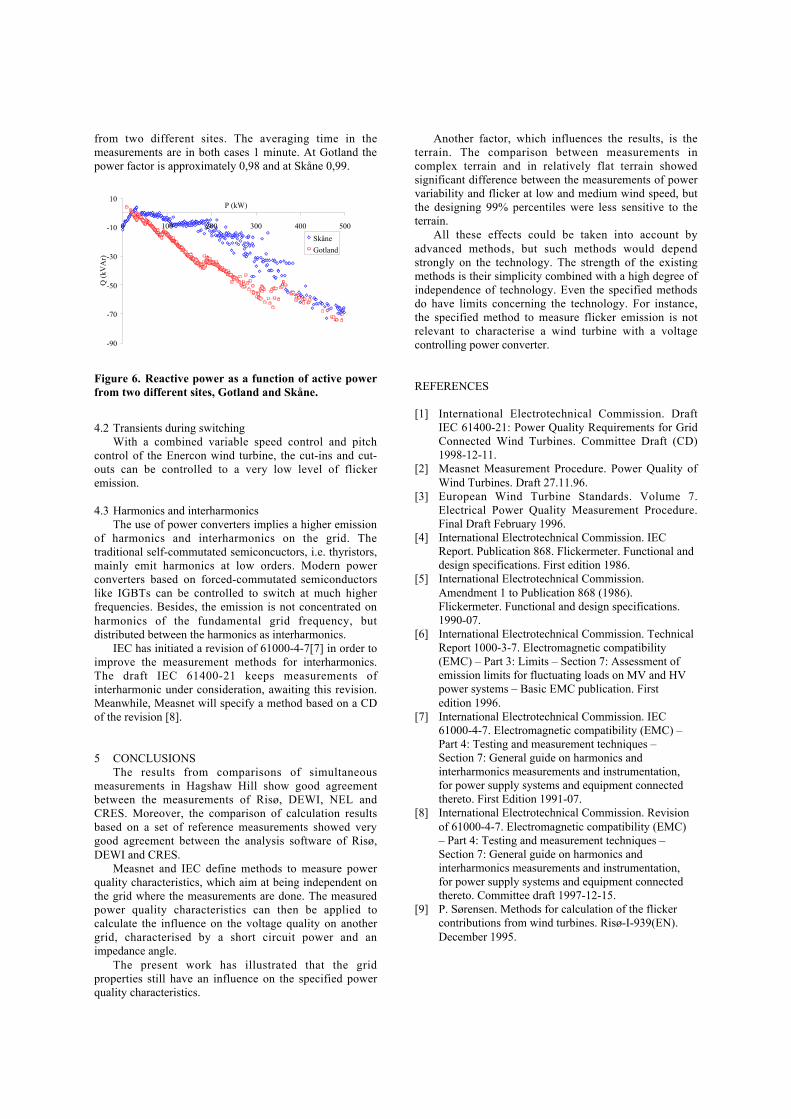
from two different sites. The averaging time in themeasurements are in both cases 1 minute. At Gotland thepower factor is approximately 0,98 and at Skåne 0,99.
4.2 Transients during switchingWith a combined variable speed control and pitch
control of the Enercon wind turbine, the cut-ins and cut-outs can be controlled to a very low level of flickeremission.
4.3 Harmonics and interharmonicsThe use of power converters implies a higher emission
of harmonics and interharmonics on the grid. Thetraditional self-commutated semiconcuctors, i.e. thyristors,mainly emit harmonics at low orders. Modern powerconverters based on forced-commutated semiconductorslike IGBTs can be controlled to switch at much higherfrequencies. Besides, the emission is not concentrated onharmonics of the fundamental grid frequency, butdistributed between the harmonics as interharmonics.
IEC has initiated a revision of 61000-4-7[7] in order toimprove the measurement methods for interharmonics.The draft IEC 61400-21 keeps measurements ofinterharmonic under consideration, awaiting this revision.Meanwhile, Measnet will specify a method based on a CDof the revision [8].
5 CONCLUSIONSThe results from comparisons of simultaneous
measurements in Hagshaw Hill show good agreementbetween the measurements of Risø, DEWI, NEL andCRES. Moreover, the comparison of calculation resultsbased on a set of reference measurements showed verygood agreement between the analysis software of Risø,DEWI and CRES.
Measnet and IEC define methods to measure powerquality characteristics, which aim at being independent onthe grid where the measurements are done. The measuredpower quality characteristics can then be applied tocalculate the influence on the voltage quality on anothergrid, characterised by a short circuit power and animpedance angle.
The present work has illustrated that the gridproperties still have an influence on the specified powerquality characteristics.
Another factor, which influences the results, is theterrain. The comparison between measurements incomplex terrain and in relatively flat terrain showedsignificant difference between the measurements of powervariability and flicker at low and medium wind speed, butthe designing 99% percentiles were less sensitive to theterrain.
All these effects could be taken into account byadvanced methods, but such methods would dependstrongly on the technology. The strength of the existingmethods is their simplicity combined with a high degree ofindependence of technology. Even the specified methodsdo have limits concerning the technology. For instance,the specified method to measure flicker emission is notrelevant to characterise a wind turbine with a voltagecontrolling power converter.
REFERENCES
[1] International Electrotechnical Commission. DraftIEC 61400-21: Power Quality Requirements for GridConnected Wind Turbines. Committee Draft (CD)1998-12-11.
[2] Measnet Measurement Procedure. Power Quality ofWind Turbines. Draft 27.11.96.
[3] European Wind Turbine Standards. Volume 7.Electrical Power Quality Measurement Procedure.Final Draft February 1996.
[4] International Electrotechnical Commission. IECReport. Publication 868. Flickermeter. Functional anddesign specifications. First edition 1986.
[5] International Electrotechnical Commission.Amendment 1 to Publication 868 (1986).Flickermeter. Functional and design specifications.1990-07.
[6] International Electrotechnical Commission. TechnicalReport 1000-3-7. Electromagnetic compatibility(EMC) – Part 3: Limits – Section 7: Assessment ofemission limits for fluctuating loads on MV and HVpower systems – Basic EMC publication. Firstedition 1996.
[7] International Electrotechnical Commission. IEC61000-4-7. Electromagnetic compatibility (EMC) –Part 4: Testing and measurement techniques –Section 7: General guide on harmonics andinterharmonics measurements and instrumentation,for power supply systems and equipment connectedthereto. First Edition 1991-07.
[8] International Electrotechnical Commission. Revisionof 61000-4-7. Electromagnetic compatibility (EMC)– Part 4: Testing and measurement techniques –Section 7: General guide on harmonics andinterharmonics measurements and instrumentation,for power supply systems and equipment connectedthereto. Committee draft 1997-12-15.
[9] P. Sørensen. Methods for calculation of the flickercontributions from wind turbines. Risø-I-939(EN).December 1995.
-90
-70
-50
-30
-10
10
0 100 200 300 400 500
P (kW)
Q (
kVA
r)
Skåne
Gotland
Figure 6. Reactive power as a function of active powerfrom two different sites, Gotland and Skåne.
Paper 4A
Guidelines for Grid Connection of Wind Turbines
Å. Larsson
Presented at
15th International Conference on Electricity Distribution (CIRED ´99)
Nice, France
June 1-4, 1999
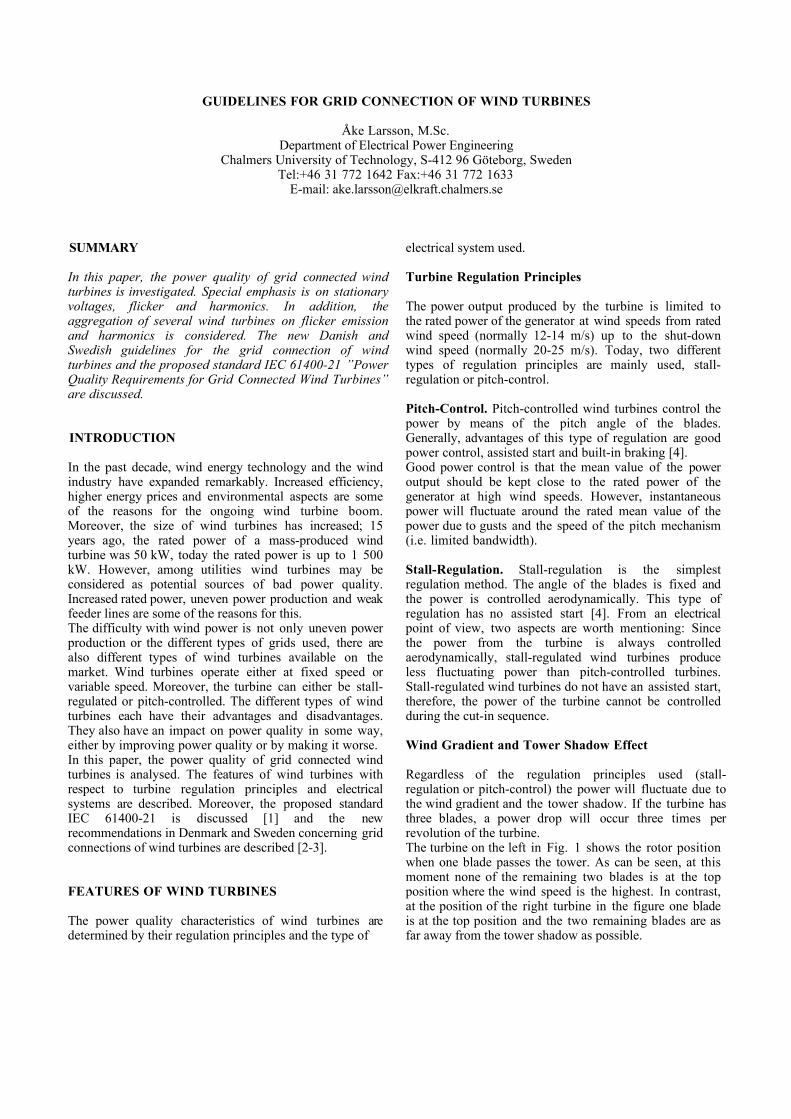
GUIDELINES FOR GRID CONNECTION OF WIND TURBINES
Åke Larsson, M.Sc.Department of Electrical Power Engineering
Chalmers University of Technology, S-412 96 Göteborg, SwedenTel:+46 31 772 1642 Fax:+46 31 772 1633
E-mail: [email protected]
SUMMARY
In this paper, the power quality of grid connected windturbines is investigated. Special emphasis is on stationaryvoltages, flicker and harmonics. In addition, theaggregation of several wind turbines on flicker emissionand harmonics is considered. The new Danish andSwedish guidelines for the grid connection of windturbines and the proposed standard IEC 61400-21 ”PowerQuality Requirements for Grid Connected Wind Turbines”are discussed.
INTRODUCTION
In the past decade, wind energy technology and the windindustry have expanded remarkably. Increased efficiency,higher energy prices and environmental aspects are someof the reasons for the ongoing wind turbine boom.Moreover, the size of wind turbines has increased; 15years ago, the rated power of a mass-produced windturbine was 50 kW, today the rated power is up to 1 500kW. However, among utilities wind turbines may beconsidered as potential sources of bad power quality.Increased rated power, uneven power production and weakfeeder lines are some of the reasons for this.The difficulty with wind power is not only uneven powerproduction or the different types of grids used, there arealso different types of wind turbines available on themarket. Wind turbines operate either at fixed speed orvariable speed. Moreover, the turbine can either be stall-regulated or pitch-controlled. The different types of windturbines each have their advantages and disadvantages.They also have an impact on power quality in some way,either by improving power quality or by making it worse.In this paper, the power quality of grid connected windturbines is analysed. The features of wind turbines withrespect to turbine regulation principles and electricalsystems are described. Moreover, the proposed standardIEC 61400-21 is discussed [1] and the newrecommendations in Denmark and Sweden concerning gridconnections of wind turbines are described [2-3].
FEATURES OF WIND TURBINES
The power quality characteristics of wind turbines aredetermined by their regulation principles and the type of
electrical system used.
Turbine Regulation Principles
The power output produced by the turbine is limited tothe rated power of the generator at wind speeds from ratedwind speed (normally 12-14 m/s) up to the shut-downwind speed (normally 20-25 m/s). Today, two differenttypes of regulation principles are mainly used, stall-regulation or pitch-control.
Pitch-Control. Pitch-controlled wind turbines control thepower by means of the pitch angle of the blades.Generally, advantages of this type of regulation are goodpower control, assisted start and built-in braking [4].Good power control is that the mean value of the poweroutput should be kept close to the rated power of thegenerator at high wind speeds. However, instantaneouspower will fluctuate around the rated mean value of thepower due to gusts and the speed of the pitch mechanism(i.e. limited bandwidth).
Stall-Regulation. Stall-regulation is the simplestregulation method. The angle of the blades is fixed andthe power is controlled aerodynamically. This type ofregulation has no assisted start [4]. From an electricalpoint of view, two aspects are worth mentioning: Sincethe power from the turbine is always controlledaerodynamically, stall-regulated wind turbines produceless fluctuating power than pitch-controlled turbines.Stall-regulated wind turbines do not have an assisted start,therefore, the power of the turbine cannot be controlledduring the cut-in sequence.
Wind Gradient and Tower Shadow Effect
Regardless of the regulation principles used (stall-regulation or pitch-control) the power will fluctuate due tothe wind gradient and the tower shadow. If the turbine hasthree blades, a power drop will occur three times perrevolution of the turbine.The turbine on the left in Fig. 1 shows the rotor positionwhen one blade passes the tower. As can be seen, at thismoment none of the remaining two blades is at the topposition where the wind speed is the highest. In contrast,at the position of the right turbine in the figure one bladeis at the top position and the two remaining blades are asfar away from the tower shadow as possible.
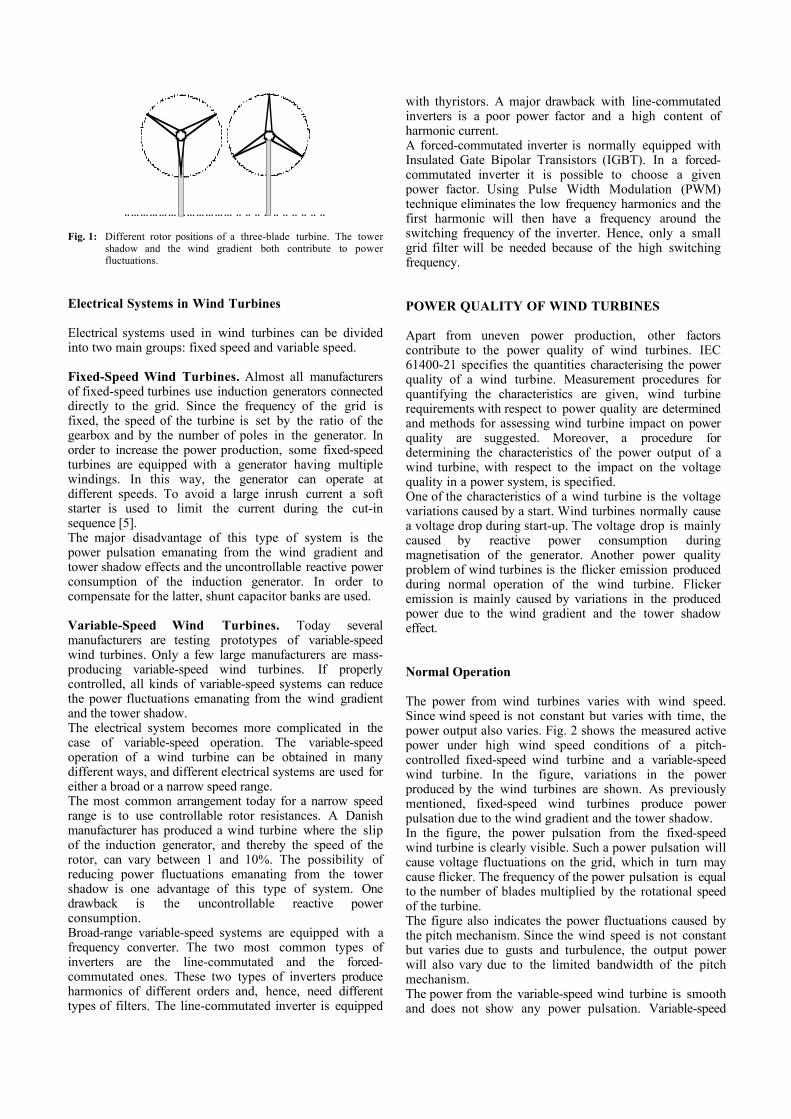
Fig. 1: Different rotor positions of a three-blade turbine. The towershadow and the wind gradient both contribute to powerfluctuations.
Electrical Systems in Wind Turbines
Electrical systems used in wind turbines can be dividedinto two main groups: fixed speed and variable speed.
Fixed-Speed Wind Turbines. Almost all manufacturersof fixed-speed turbines use induction generators connecteddirectly to the grid. Since the frequency of the grid isfixed, the speed of the turbine is set by the ratio of thegearbox and by the number of poles in the generator. Inorder to increase the power production, some fixed-speedturbines are equipped with a generator having multiplewindings. In this way, the generator can operate atdifferent speeds. To avoid a large inrush current a softstarter is used to limit the current during the cut-insequence [5].The major disadvantage of this type of system is thepower pulsation emanating from the wind gradient andtower shadow effects and the uncontrollable reactive powerconsumption of the induction generator. In order tocompensate for the latter, shunt capacitor banks are used.
Variable-Speed Wind Turbines. Today severalmanufacturers are testing prototypes of variable-speedwind turbines. Only a few large manufacturers are mass-producing variable-speed wind turbines. If properlycontrolled, all kinds of variable-speed systems can reducethe power fluctuations emanating from the wind gradientand the tower shadow.The electrical system becomes more complicated in thecase of variable-speed operation. The variable-speedoperation of a wind turbine can be obtained in manydifferent ways, and different electrical systems are used foreither a broad or a narrow speed range.The most common arrangement today for a narrow speedrange is to use controllable rotor resistances. A Danishmanufacturer has produced a wind turbine where the slipof the induction generator, and thereby the speed of therotor, can vary between 1 and 10%. The possibility ofreducing power fluctuations emanating from the towershadow is one advantage of this type of system. Onedrawback is the uncontrollable reactive powerconsumption.Broad-range variable-speed systems are equipped with afrequency converter. The two most common types ofinverters are the line-commutated and the forced-commutated ones. These two types of inverters produceharmonics of different orders and, hence, need differenttypes of filters. The line-commutated inverter is equipped
with thyristors. A major drawback with line-commutatedinverters is a poor power factor and a high content ofharmonic current.A forced-commutated inverter is normally equipped withInsulated Gate Bipolar Transistors (IGBT). In a forced-commutated inverter it is possible to choose a givenpower factor. Using Pulse Width Modulation (PWM)technique eliminates the low frequency harmonics and thefirst harmonic will then have a frequency around theswitching frequency of the inverter. Hence, only a smallgrid filter will be needed because of the high switchingfrequency.
POWER QUALITY OF WIND TURBINES
Apart from uneven power production, other factorscontribute to the power quality of wind turbines. IEC61400-21 specifies the quantities characterising the powerquality of a wind turbine. Measurement procedures forquantifying the characteristics are given, wind turbinerequirements with respect to power quality are determinedand methods for assessing wind turbine impact on powerquality are suggested. Moreover, a procedure fordetermining the characteristics of the power output of awind turbine, with respect to the impact on the voltagequality in a power system, is specified.One of the characteristics of a wind turbine is the voltagevariations caused by a start. Wind turbines normally causea voltage drop during start-up. The voltage drop is mainlycaused by reactive power consumption duringmagnetisation of the generator. Another power qualityproblem of wind turbines is the flicker emission producedduring normal operation of the wind turbine. Flickeremission is mainly caused by variations in the producedpower due to the wind gradient and the tower shadoweffect.
Normal Operation
The power from wind turbines varies with wind speed.Since wind speed is not constant but varies with time, thepower output also varies. Fig. 2 shows the measured activepower under high wind speed conditions of a pitch-controlled fixed-speed wind turbine and a variable-speedwind turbine. In the figure, variations in the powerproduced by the wind turbines are shown. As previouslymentioned, fixed-speed wind turbines produce powerpulsation due to the wind gradient and the tower shadow.In the figure, the power pulsation from the fixed-speedwind turbine is clearly visible. Such a power pulsation willcause voltage fluctuations on the grid, which in turn maycause flicker. The frequency of the power pulsation is equalto the number of blades multiplied by the rotational speedof the turbine.The figure also indicates the power fluctuations caused bythe pitch mechanism. Since the wind speed is not constantbut varies due to gusts and turbulence, the output powerwill also vary due to the limited bandwidth of the pitchmechanism.The power from the variable-speed wind turbine is smoothand does not show any power pulsation. Variable-speed
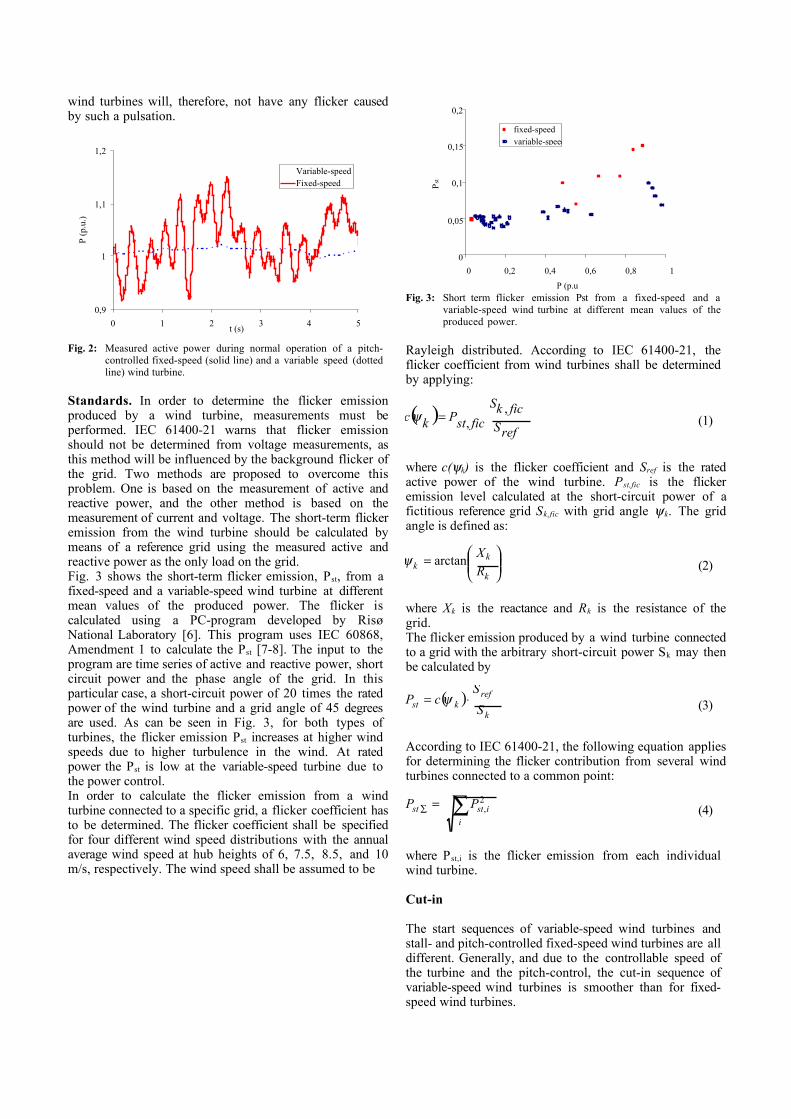
wind turbines will, therefore, not have any flicker causedby such a pulsation.
0,9
1
1,1
1,2
0 1 2 3 4 5t (s)
P (p
.u.)
Variable-speedFixed-speed
Fig. 2: Measured active power during normal operation of a pitch-controlled fixed-speed (solid line) and a variable speed (dottedline) wind turbine.
Standards. In order to determine the flicker emissionproduced by a wind turbine, measurements must beperformed. IEC 61400-21 warns that flicker emissionshould not be determined from voltage measurements, asthis method will be influenced by the background flicker ofthe grid. Two methods are proposed to overcome thisproblem. One is based on the measurement of active andreactive power, and the other method is based on themeasurement of current and voltage. The short-term flickeremission from the wind turbine should be calculated bymeans of a reference grid using the measured active andreactive power as the only load on the grid.Fig. 3 shows the short-term flicker emission, Pst, from afixed-speed and a variable-speed wind turbine at differentmean values of the produced power. The flicker iscalculated using a PC-program developed by RisøNational Laboratory [6]. This program uses IEC 60868,Amendment 1 to calculate the Pst [7-8]. The input to theprogram are time series of active and reactive power, shortcircuit power and the phase angle of the grid. In thisparticular case, a short-circuit power of 20 times the ratedpower of the wind turbine and a grid angle of 45 degreesare used. As can be seen in Fig. 3, for both types ofturbines, the flicker emission Pst increases at higher windspeeds due to higher turbulence in the wind. At ratedpower the Pst is low at the variable-speed turbine due tothe power control.In order to calculate the flicker emission from a windturbine connected to a specific grid, a flicker coefficient hasto be determined. The flicker coefficient shall be specifiedfor four different wind speed distributions with the annualaverage wind speed at hub heights of 6, 7.5, 8.5, and 10m/s, respectively. The wind speed shall be assumed to be
0
0,05
0,1
0,15
0,2
0 0,2 0,4 0,6 0,8 1
P (p.u
Pst
fixed-speedvariable-speed
Fig. 3: Short term flicker emission Pst from a fixed-speed and avariable-speed wind turbine at different mean values of theproduced power.
Rayleigh distributed. According to IEC 61400-21, theflicker coefficient from wind turbines shall be determinedby applying:
( )refS
fickS
ficstPkc,
,=ψ (1)
where c(ψk) is the flicker coefficient and Sref is the ratedactive power of the wind turbine. Pst,fic is the flickeremission level calculated at the short-circuit power of afictitious reference grid Sk,fic with grid angle ψk. The gridangle is defined as:
=k
kk R
Xarctanψ (2)
where Xk is the reactance and Rk is the resistance of thegrid.The flicker emission produced by a wind turbine connectedto a grid with the arbitrary short-circuit power Sk may thenbe calculated by
( )k
refkst S
ScP ⋅= ψ (3)
According to IEC 61400-21, the following equation appliesfor determining the flicker contribution from several windturbines connected to a common point:
∑=∑i
istst PP 2, (4)
where Pst,i is the flicker emission from each individualwind turbine.
Cut-in
The start sequences of variable-speed wind turbines andstall- and pitch-controlled fixed-speed wind turbines are alldifferent. Generally, and due to the controllable speed ofthe turbine and the pitch-control, the cut-in sequence ofvariable-speed wind turbines is smoother than for fixed-speed wind turbines.

In fixed-speed wind turbines, the speed of the turbineincreases during the starting sequence until the generatorspeed is close to the synchronous speed. The generator is,then, connected to the grid. As mentioned earlier, stall-regulated fixed-speed wind turbines do not have anassisted start. If the generator is not connected quickly, theturbine torque may exceed the maximum generator torque,thus, resulting in a turbine over-speed. Hence, the soft-starter on stall-regulated fixed-speed wind turbinesnormally operates during 10 line-periods which leads to arelatively high inrush-current.In the case of pitch-controlled fixed-speed wind turbines,where the start is assisted, the torque of the turbine can becontrolled. Hence, the cut-in of the generator can beperformed in a smoother and more controlled way. Thesoft-starter in pitch-controlled turbines normally operatesfor two or three seconds, which gives a lower inrushcurrent in comparison with a stall-regulated turbine.Variable-speed wind turbines are normally equipped withpitch-control. Both the pitch-control and the speed controlcontribute to a smooth start. Fig. 4 shows the measuredpower during the cut-in of a pitch-controlled wind turbinewith a controllable-slip.
-300
-200
-100
0
100
200
300
400
0 6 12 18 24 30 36 42 48 54 60
P (kW)Q (kVAr)
time (s)
Fig. 4: Measured power during cut-in of a pitch-controlled windturbine with controllable-slip. The rated power of the windturbine is 600 kW. Active power (dotted line) and reactivepower (solid line).
The wind turbine is cut-in at t=30 seconds. As can beseen, the wind turbine starts to consume reactive power inorder to magnetise the generator. The soft-starter limits thereactive power for two or three seconds. The reactivepower is, then, compensated by means of shunt capacitorbanks. As can be observed, the capacitors are switched infour steps with a time delay of approximately 1 second.In Fig. 5, the voltage of the wind turbine is shown for thesame time period. The reactive power consumption causesa voltage drop. Once the capacitors are connected, thevoltage increases.
Standards. According to the IEC 61400-21,measurements have to be performed for switchingoperations during wind turbine cut-in and when switching
388
392
396
400
404
408
0 6 12 18 24 30 36 42 48 54 60
time (s)
U (V)
Fig. 5: Measured voltage during cut-in of a pitch-controlled windturbine with controllable-slip.
between generators. The switching between generators isonly applicable to wind turbines with more than onegenerator or a generator with multiple windings. The threephase currents and the three phase-to-neutral voltages shallbe measured. Measurements and subsequent simulationsand calculations shall be performed to determine thevoltage change factor ku and the flicker step factor kf foreach of the switching operations at different grid anglesΨk. The voltage drop in percent caused by a single start ofthe wind turbine may, then, be determined by:
( ) 100⋅≤∆k
refku S
SkU ψ (5)
where ku(ψk) is the voltage change factor calculated at thegrid angle ψk.Under low wind conditions, wind turbines may start andstop several times. The resulting flicker emission caused byrepeated numbers of voltage drops is calculated by [2]:
UU
FT
NPlt
∆⋅⋅
⋅= 2,3
1
3,2(6)
where N is the number of voltage drops during T seconds.Since the equation refers to the long-term flicker a period oftwo hours is used. U is the voltage and F is the form factorof the voltage drop ∆U. The form factor for different typesof voltage drops is treated in IEC 61000-3-7, [9].In the IEC 61400-21, a flicker step factor is introduced.The flicker step factor is calculated from the measuredvoltage drop caused by the cut-in of the generator. Theflicker emission caused by a repeated number of cut-ins ofthe wind turbine can be determined by using the flickerstep factor as:
( ) ( )k
refkflt S
SNkP ⋅⋅⋅= 2,3
18 ψ (7)
where kf(ψk) is the flicker step factor calculated at the gridangle ψk, N is the maximum number of switchingoperations during a period of two hours.Harmonics and Interharmonics
Fixed-speed wind turbines are not expected to causesignificant harmonics and interharmonics. The standardIEC 61400-21 does not require specification of harmonicsand interharmonics for this type of wind turbine.For variable-speed wind turbines equipped with aconverter the emission of harmonic currents duringcontinuous operation shall be specified. These shall bespecified for frequencies up to 50 times the fundamentalgrid frequency, as well as the total harmonic distortionand the emission of the individual harmonics.The relevant emission limits according to the IEC 61800-3 is given in Table 1, [10]. The IEC 61800-3 furtherrecommends the total harmonic distortion (THD) to beless than 5% of the fundamental rated current.
Table 1: Emission limits according to IEC 61800-3.
Harmonicorder
Odd harm. current(% of Irated)
Even harm. current(% of Irated)
n<11 4,0 1,011≤n≤17 2,0 0,517≤n≤23 1,5 0,423≤n≤35 0,6 0,235≤n≤50 0,3 0,1
According to the IEC 61000-4-7, the following equationapplies for determining the harmonic currents from morethan one source connected to a common point [11]
αα∑=
k
knn ii , (8)
where in is the harmonic current of the order n, in,k is theharmonic current of the order n from source number k andα is an exponent chosen from Table 2. Thisrecommendation is valid for wind farm applications.
Table 2: Exponent for harmonics.
α harmonic number n1 n<5
1,4 5≤n≤102 h>10
RECOMMENDATIONS IN DENMARK ANDSWEDEN
In both Denmark and Sweden, new recommendationsregarding the grid connection of wind turbines have beenaccepted [2-3]. The two recommendations are quite similarand they are both derived from the proposed standard IEC61400-21. The equations in the proposed standard havebeen revised in order to agree with the national standardsconcerning voltage quality.In the recommendations, the impact from a wind turbine onthe utility grid is determined from test results of a windturbine power quality test. The test results shall containinformation regarding the power factor, the maximumpower, the voltage change factor, the flicker step factor, themaximum number of switching operations for a period oftwo hours, the flicker coefficient and the harmonic contentof the current. The test shall be performed in accordancewith the proposed standard IEC 61400-21.
Steady-state Voltage
The steady-state voltage will vary in a grid from node tonode depending on the connected loads and the production.In general, connecting loads to a grid will reduce thevoltage, whereas connecting power producing units willincrease the voltage. The following approximate relationcan be used to calculate the percentage voltage drop:
1002
⋅⋅+⋅=∆U
QXPRU (9)
where R is the resistance and X the reactance of the line. Uis the voltage of the overhead line, P is the produced activepower and Q is the produced reactive power of the windturbine.In Denmark and Sweden, voltage variation may not exceed2,5% for a distribution feeder. If only wind turbines areconnected to a feeder the voltage variation may not exceedmore than 5%. In both cases the deadband of the voltageregulator of the transformer shall be taken into account.
Cut-in
According to Swedish Standard SS 421 18 11, themaximum voltage variation caused by a single motor startshall not exceed 4% [12]. This maximum voltage variationis directly applicable to wind turbines. Hence, the voltagestep factor must be less than:
( )ref
kku S
Sk ⋅≤
1004ψ (10)
At low wind conditions, wind turbines may start and stopseveral times during a period of two hours. The long-termflicker emission, Plt, produced by a repeated number ofstarts of a wind turbine is derived in Equation 7. The long-term flicker level from a single source in a medium-voltagedistribution feeder may, according to the IEC 61000-3-7,not exceed Plt=0,25 [9]. The required short-circuit power atthe point of common connection must therefore, accordingto Equation 7, exceed
( ) refkfk SkNS ⋅⋅⋅≥ ψ2,3
1
32 (11)
In Denmark and Sweden, the acceptable long-term flickerlevel is Plt=0,5 if wind turbines are connected to their ownfeeder. The required short-circuit power at the point ofcommon connection must, therefore, exceed
( ) refkfk SkNS ⋅⋅⋅≥ ψ2,3
1
16 (12)
in the case of a feeder line to which only wind turbines areconnected.
Normal Operation
The contribution to flicker from a wind turbine duringnormal operation was derived in Equation 3. Using the
earlier mentioned emission levels for the long-term flicker,Plt, the required short-circuit level at the point of commonconnection must exceed
( ) refkk ScS ⋅⋅≥ ψ4 (13)
in the case of a distribution feeder and
( ) refkk ScS ⋅⋅≥ ψ2 (14)
in the case of a feeder line to which only wind turbines areconnected.
CONCLUSIONS
Different types of wind turbines are available on themarket. The different types of wind turbines each have theiradvantages and disadvantages.Fixed-speed wind turbine normally cause a voltage dropduring start-up. The voltage drop is mainly caused byreactive power consumption during magnetisation of thegenerator. Another power quality problem of fixed-speedwind turbines is the flicker emission produced duringnormal operation of the wind turbine. Flicker emission ismainly caused by variations in the produced power due tothe wind gradient and the tower shadow effect. Variable-speed wind turbines can reduce these power pulsation andwill, therefore, not have any flicker caused by such apulsation. A drawback with variable-speed wind turbines isthe harmonic currents produced by the inverter.Consequently, in standards and recommendationsconcerning the grid connection of wind turbines, oneshould consider the type of wind turbine used.In the IEC 61400-21, a procedure for determining thecharacteristics of the wind turbine output with respect to itsimpact on the voltage quality in a power system isspecified. In both Denmark and Sweden, newrecommendations regarding the grid connection of windturbines have been accepted. The two recommendations arequite similar and they are both derived from the proposedstandard IEC 61400-21. The equations in the proposedstandard have been revised in order to agree with nationalstandards concerning voltage quality.In the recommendations, the impact from a wind turbine onthe utility grid is determined from a wind turbine powerquality test. The test results shall contain informationregarding the power factor, the maximum power, thevoltage change factor, the flicker step factor, the maximumnumbers of switching operations for a period of two hours,the flicker coefficient and the harmonic content of thecurrent.
ACKNOWLEDGEMENTS
The author gratefully acknowledges the financial supportobtained from ELFORSK AB.
REFERENCES
[1] International Electrotechnical Commission, IECStandard, Publication: 61400-21, Power QualityRequirements for Grid Connected Wind Turbines,Committee Draft, 1998.
[2] Tilslutning af vindmøller til lav- ogmellemspændingsnet, DEFU, Komité rapport 111,1998. (in Danish)
[3] Anslutning av mindre produktionsanläggningar tillelnätet (AMP), Sveriges elleverantörer, 1999. (inSwedish)
[4] Freris, L.L. (ed.), Wind Energy Conversion Systems,Prentice Hall International (UK) Ltd, 1990, 388 p.
[5] Larsson, Å., Thiringer, T., ”Measurements on andModelling of Capacitor-Connecting Transients on aLow-voltage Grid Equipped with Two WindTurbines”, Proceedings of the InternationalConference on Power System Transients (IPST '95),Lisbon, Portugal, Sept. 1995, p. 184 - 188.
[6] Sørensen, P., Methods for Calculation or the FlickerContribution from Wind Turbines, Risø Nationallaboratory, Roskilde, Denmark, Risø-I-939,December 1995.
[7] International Electrotechnical Commission, IECStandard, Publication 60868, 1990.
[8] International Electrotechnical Commission, IECStandard, Amendment 1 to Publication 60868, 1990.
[9] International Electrotechnical Commission, IECStandard, Publication 61000-3-7, 1995.
[10] International Electrotechnical Commission, IECStandard, Publication 61800-3, 1996.
[11] International Electrotechnical Commission, IECStandard, Publication 61000-4-7, 1991.
[12] Svensk Standard, SS 421 18 11, Spänningsgodhet ilågspänningsnät för allmän distribution, 1992. (inSwedish).
Paper 4B
Flicker Emission of Wind Turbines During Continuos Operations
Å. Larsson
Submitted for publication in
IEEE Transactions on Energy Conversion
August 2000
FLICKER EMISSION OF WIND TURBINESDURING CONTINUOUS OPERATION
Åke Larsson, M.Sc.Department of Electrical Power Engineering
Chalmers University of TechnologyGöteborg, Sweden
Abstract: This paper presents an analysis and the modelling ofthe flicker emission of wind turbines. Measurements comparedwith international standards are discussed. The paperconcentrates on the theoretical aspects of the flicker algorithm,wind turbine characteristics and the generation of flickerduring continuous operation of wind turbines.
Keywords: Flicker, Wind turbine, Power fluctuations.
I. INTRODUCTION
Among utilities wind power is sometimes considered tobe a potential source for bad power quality. Uneven powerproduction and weak connections due to long feeder lines aresome of the factors behind this opinion. Not only theuneven power production but also other factors contribute tothe power quality of wind turbines. One of these factors isflicker. Electrical flicker is a measure of the voltage variationwhich may cause disturbance for the consumer. Flickeremissions are not only produced during start-up, but alsoduring the continuous operation of the wind turbine. Theflicker emission produced during normal operation is mainlycaused by variations in the produced power due to wind-speed variations, the wind gradient and the tower shadoweffect. In areas where wind power is an emergingtechnology, some actions have been taken. One example isGermany, where power quality standards for grid connectedwind turbines have been in use for some years. The Germanstandard for grid connected wind turbines includes rules onpower fluctuations and flicker.
The International Electrotechnical Commission, IEC, iscurrently working on power quality requirements for gridconnected wind turbines. The work has resulted in acommittee draft designated IEC 61400-21 [1]. This draftincludes quantities to be specified for characterising thepower quality of wind turbines and measurement procedures
for quantifying the characteristics. Also wind turbinerequirements with respect to power quality are given andmethods for assessing wind turbine impact on power qualityare suggested. The proposed standard pays particularattention to flicker. In addition to generic standards, flickermay become a serious limitation to wind power, at least incase of weak grids.
Flicker from wind turbines has become an importantissue. A study of different types of wind turbines concludedthat flicker emission in certain cases exceeds limits whichare expected to be normative in the future [2]. In order topredict flicker produced by a wind turbine at the designstage, software tools are being developed [3][4]. For suchsoftware the physical dynamics of the turbine, the windturbulence and the electrical dynamics of the generator andthe network itself need to be modelled. The purpose of thispaper is to provide a concise review of the analysis andmodelling of the flicker emission of wind turbines, alongwith measurements and a comparison with internationalstandards. This paper concentrates on the theoretical aspectsof the flicker algorithm, wind turbine characteristics andflicker during continuous operation.
Section II in this paper provides a brief review of theflicker meter according to IEC Standard and the flickeralgorithm. Section III presents the characteristics of theturbine. Finally, flicker during continuous operation isdescribed in Section IV.
II. DESCRIPTION OF THE FLICKER METER
The level of flicker is quantified by the short-term flickerseverity value Pst. The calculation of flicker severity takesinto account the response of the light emission fromincandescent lights to voltage variations and also theresponse of the human eye and brain in perceiving variationsin illumination. The function and design of the flicker meterare specified in the Standard IEC Publication 868 [5]. Theblock diagram shown in Figure 1 describes the flicker meterarchitecture. Although the block diagram consists of fiveblocks, the flicker meter can be divided into two main parts,each performing one of the following tasks: (1) a simulationof the response of the lamp-eye-brain chain; and (2) an on-line statistical analysis of the flicker signal and presentationof the results. Blocks 2, 3 and 4 perform the first task whilethe second task is accomplished by block 5.
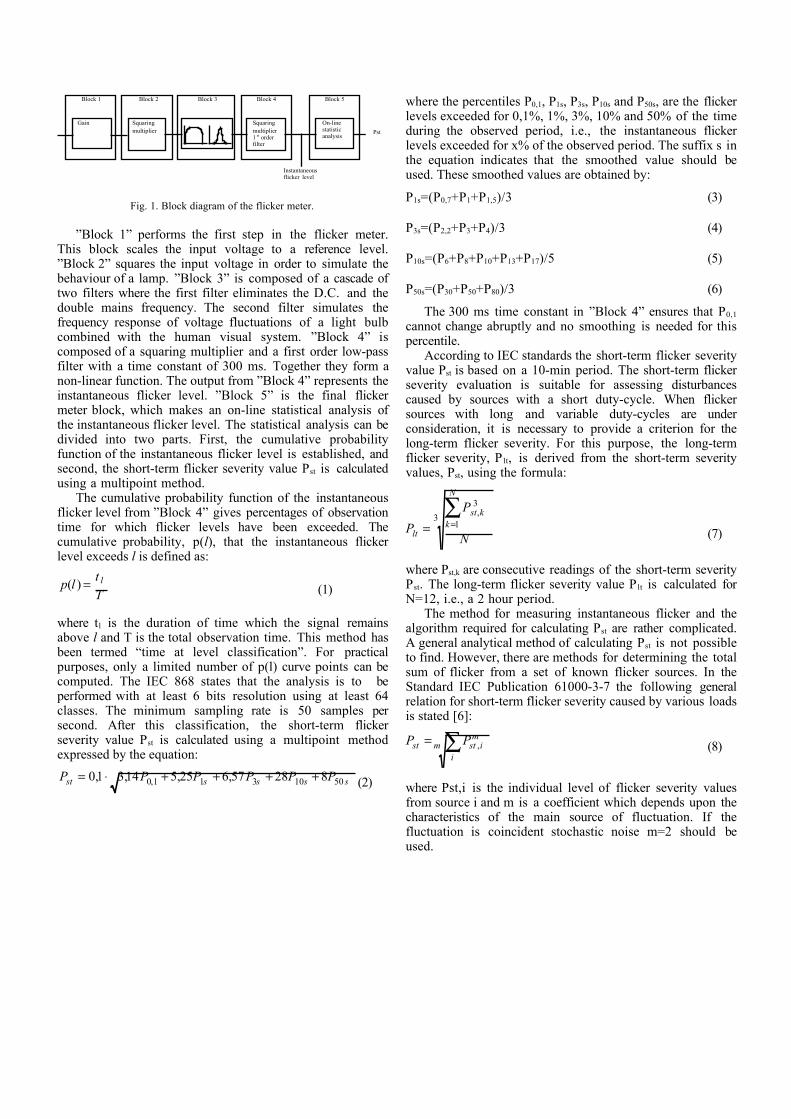
Block 3Block 2
Squaringmultiplier
Block 1
Gain
Block 4
Squaringmultiplier1 st orderfilter
Block 5
On-linestatisticanalysis
Instantaneousflicker level
Pst
Fig. 1. Block diagram of the flicker meter.
”Block 1” performs the first step in the flicker meter.This block scales the input voltage to a reference level.”Block 2” squares the input voltage in order to simulate thebehaviour of a lamp. ”Block 3” is composed of a cascade oftwo filters where the first filter eliminates the D.C. and thedouble mains frequency. The second filter simulates thefrequency response of voltage fluctuations of a light bulbcombined with the human visual system. ”Block 4” iscomposed of a squaring multiplier and a first order low-passfilter with a time constant of 300 ms. Together they form anon-linear function. The output from ”Block 4” represents theinstantaneous flicker level. ”Block 5” is the final flickermeter block, which makes an on-line statistical analysis ofthe instantaneous flicker level. The statistical analysis can bedivided into two parts. First, the cumulative probabilityfunction of the instantaneous flicker level is established, andsecond, the short-term flicker severity value Pst is calculatedusing a multipoint method.
The cumulative probability function of the instantaneousflicker level from ”Block 4” gives percentages of observationtime for which flicker levels have been exceeded. Thecumulative probability, p(l), that the instantaneous flickerlevel exceeds l is defined as:
Tt
lp l=)( (1)
where tl is the duration of time which the signal remainsabove l and T is the total observation time. This method hasbeen termed “time at level classification”. For practicalpurposes, only a limited number of p(l) curve points can becomputed. The IEC 868 states that the analysis is to beperformed with at least 6 bits resolution using at least 64classes. The minimum sampling rate is 50 samples persecond. After this classification, the short-term flickerseverity value Pst is calculated using a multipoint methodexpressed by the equation:
ssssst PPPPPP 5010311,0 82857,625,514,31,0 ++++⋅= (2)
where the percentiles P0,1, P1s, P3s, P10s and P50s, are the flickerlevels exceeded for 0,1%, 1%, 3%, 10% and 50% of the timeduring the observed period, i.e., the instantaneous flickerlevels exceeded for x% of the observed period. The suffix s inthe equation indicates that the smoothed value should beused. These smoothed values are obtained by:
P1s=(P0,7+P1+P1,5)/3 (3)
P3s=(P2,2+P3+P4)/3 (4)
P10s=(P6+P8+P10+P13+P17)/5 (5)
P50s=(P30+P50+P80)/3 (6)
The 300 ms time constant in ”Block 4” ensures that P0,1
cannot change abruptly and no smoothing is needed for thispercentile.
According to IEC standards the short-term flicker severityvalue Pst is based on a 10-min period. The short-term flickerseverity evaluation is suitable for assessing disturbancescaused by sources with a short duty-cycle. When flickersources with long and variable duty-cycles are underconsideration, it is necessary to provide a criterion for thelong-term flicker severity. For this purpose, the long-termflicker severity, Plt, is derived from the short-term severityvalues, Pst, using the formula:
31
3,
N
P
P
N
kkst
lt
∑== (7)
where Pst,k are consecutive readings of the short-term severityPst. The long-term flicker severity value Plt is calculated forN=12, i.e., a 2 hour period.
The method for measuring instantaneous flicker and thealgorithm required for calculating Pst are rather complicated.A general analytical method of calculating Pst is not possibleto find. However, there are methods for determining the totalsum of flicker from a set of known flicker sources. In theStandard IEC Publication 61000-3-7 the following generalrelation for short-term flicker severity caused by various loadsis stated [6]:
mi
mistst PP ∑= , (8)
where Pst,i is the individual level of flicker severity valuesfrom source i and m is a coefficient which depends upon thecharacteristics of the main source of fluctuation. If thefluctuation is coincident stochastic noise m=2 should beused.
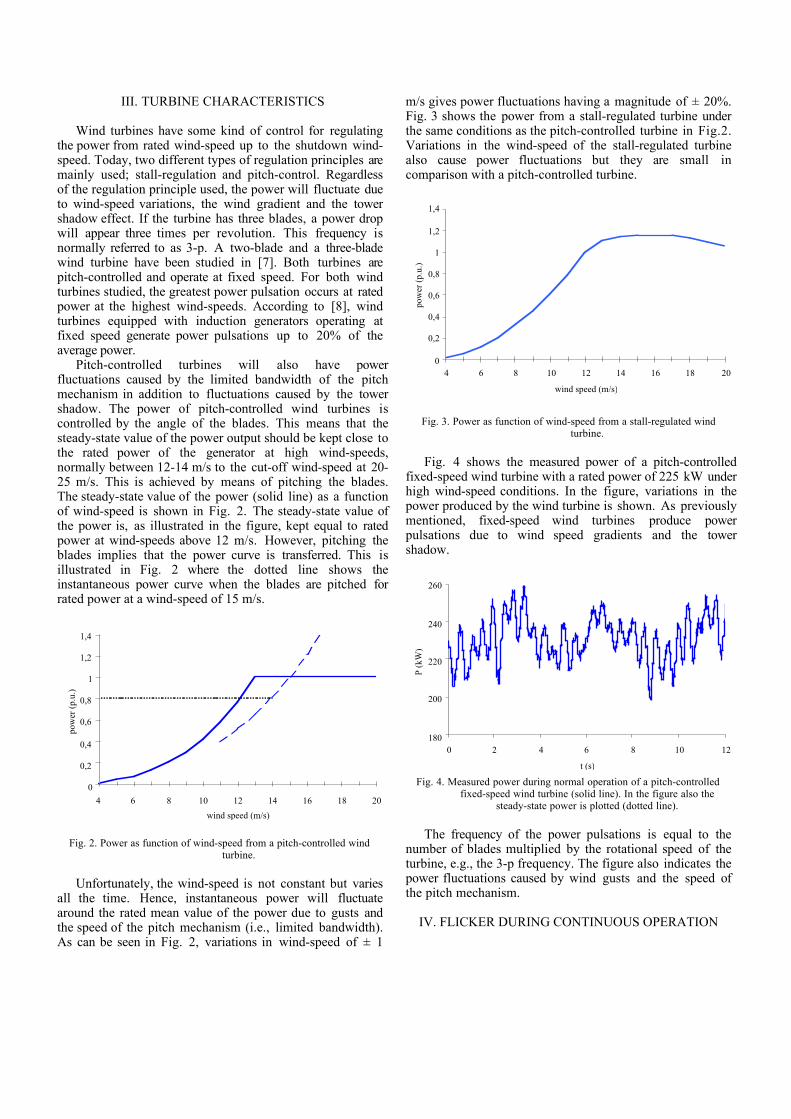
III. TURBINE CHARACTERISTICS
Wind turbines have some kind of control for regulatingthe power from rated wind-speed up to the shutdown wind-speed. Today, two different types of regulation principles aremainly used; stall-regulation and pitch-control. Regardlessof the regulation principle used, the power will fluctuate dueto wind-speed variations, the wind gradient and the towershadow effect. If the turbine has three blades, a power dropwill appear three times per revolution. This frequency isnormally referred to as 3-p. A two-blade and a three-bladewind turbine have been studied in [7]. Both turbines arepitch-controlled and operate at fixed speed. For both windturbines studied, the greatest power pulsation occurs at ratedpower at the highest wind-speeds. According to [8], windturbines equipped with induction generators operating atfixed speed generate power pulsations up to 20% of theaverage power.
Pitch-controlled turbines will also have powerfluctuations caused by the limited bandwidth of the pitchmechanism in addition to fluctuations caused by the towershadow. The power of pitch-controlled wind turbines iscontrolled by the angle of the blades. This means that thesteady-state value of the power output should be kept close tothe rated power of the generator at high wind-speeds,normally between 12-14 m/s to the cut-off wind-speed at 20-25 m/s. This is achieved by means of pitching the blades.The steady-state value of the power (solid line) as a functionof wind-speed is shown in Fig. 2. The steady-state value ofthe power is, as illustrated in the figure, kept equal to ratedpower at wind-speeds above 12 m/s. However, pitching theblades implies that the power curve is transferred. This isillustrated in Fig. 2 where the dotted line shows theinstantaneous power curve when the blades are pitched forrated power at a wind-speed of 15 m/s.
0
0,2
0,4
0,6
0,8
1
1,2
1,4
4 6 8 10 12 14 16 18 20
wind speed (m/s)
pow
er (
p.u.
)
Fig. 2. Power as function of wind-speed from a pitch-controlled windturbine.
Unfortunately, the wind-speed is not constant but variesall the time. Hence, instantaneous power will fluctuatearound the rated mean value of the power due to gusts andthe speed of the pitch mechanism (i.e., limited bandwidth).As can be seen in Fig. 2, variations in wind-speed of ± 1
m/s gives power fluctuations having a magnitude of ± 20%.Fig. 3 shows the power from a stall-regulated turbine underthe same conditions as the pitch-controlled turbine in Fig.2.Variations in the wind-speed of the stall-regulated turbinealso cause power fluctuations but they are small incomparison with a pitch-controlled turbine.
0
0,2
0,4
0,6
0,8
1
1,2
1,4
4 6 8 10 12 14 16 18 20
wind speed (m/s)
pow
er (
p.u.
)Fig. 3. Power as function of wind-speed from a stall-regulated wind
turbine.
Fig. 4 shows the measured power of a pitch-controlledfixed-speed wind turbine with a rated power of 225 kW underhigh wind-speed conditions. In the figure, variations in thepower produced by the wind turbine is shown. As previouslymentioned, fixed-speed wind turbines produce powerpulsations due to wind speed gradients and the towershadow.
180
200
220
240
260
0 2 4 6 8 10 12
t (s)
P (k
W)
Fig. 4. Measured power during normal operation of a pitch-controlledfixed-speed wind turbine (solid line). In the figure also the
steady-state power is plotted (dotted line).
The frequency of the power pulsations is equal to thenumber of blades multiplied by the rotational speed of theturbine, e.g., the 3-p frequency. The figure also indicates thepower fluctuations caused by wind gusts and the speed ofthe pitch mechanism.
IV. FLICKER DURING CONTINUOUS OPERATION
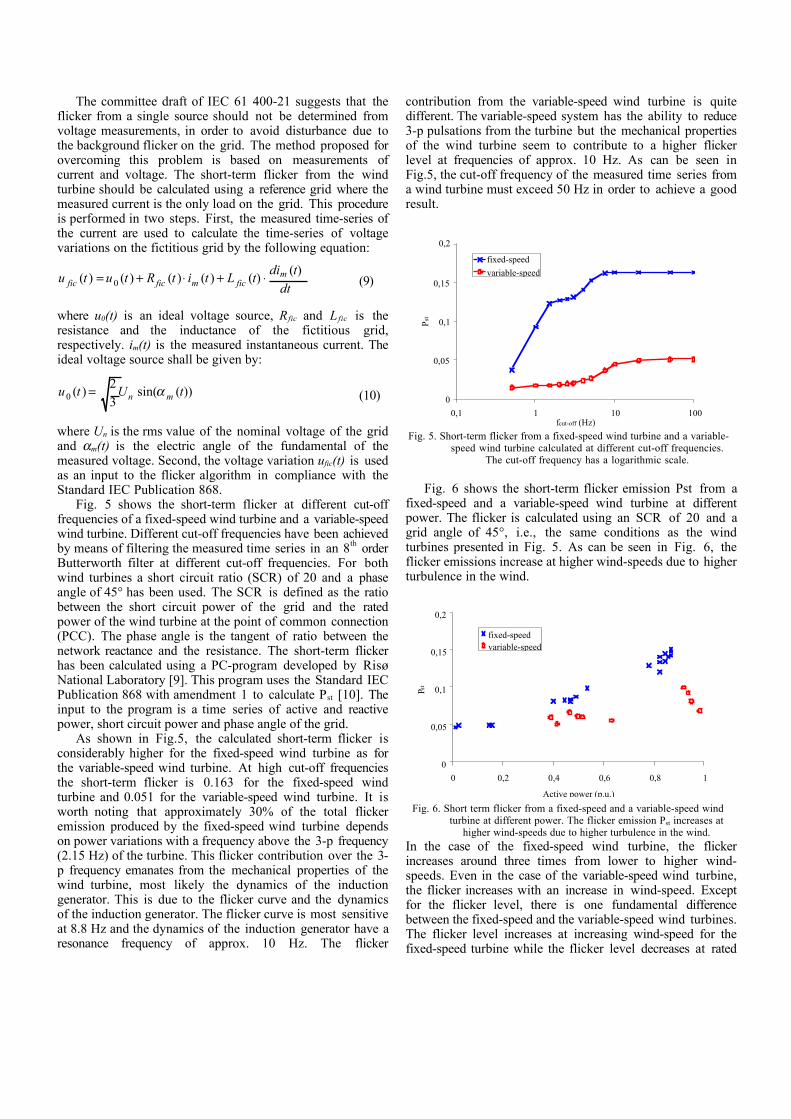
The committee draft of IEC 61 400-21 suggests that theflicker from a single source should not be determined fromvoltage measurements, in order to avoid disturbance due tothe background flicker on the grid. The method proposed forovercoming this problem is based on measurements ofcurrent and voltage. The short-term flicker from the windturbine should be calculated using a reference grid where themeasured current is the only load on the grid. This procedureis performed in two steps. First, the measured time-series ofthe current are used to calculate the time-series of voltagevariations on the fictitious grid by the following equation:
dttdi
tLtitRtutu mficmficfic
)()()()()()( 0 ⋅+⋅+= (9)
where u0(t) is an ideal voltage source, Rfic and Lfic is theresistance and the inductance of the fictitious grid,respectively. im(t) is the measured instantaneous current. Theideal voltage source shall be given by:
))(sin(32
)(0 tUtu mn α= (10)
where Un is the rms value of the nominal voltage of the gridand αm(t) is the electric angle of the fundamental of themeasured voltage. Second, the voltage variation ufic(t) is usedas an input to the flicker algorithm in compliance with theStandard IEC Publication 868.
Fig. 5 shows the short-term flicker at different cut-offfrequencies of a fixed-speed wind turbine and a variable-speedwind turbine. Different cut-off frequencies have been achievedby means of filtering the measured time series in an 8th orderButterworth filter at different cut-off frequencies. For bothwind turbines a short circuit ratio (SCR) of 20 and a phaseangle of 45° has been used. The SCR is defined as the ratiobetween the short circuit power of the grid and the ratedpower of the wind turbine at the point of common connection(PCC). The phase angle is the tangent of ratio between thenetwork reactance and the resistance. The short-term flickerhas been calculated using a PC-program developed by RisøNational Laboratory [9]. This program uses the Standard IECPublication 868 with amendment 1 to calculate Pst [10]. Theinput to the program is a time series of active and reactivepower, short circuit power and phase angle of the grid.
As shown in Fig.5, the calculated short-term flicker isconsiderably higher for the fixed-speed wind turbine as forthe variable-speed wind turbine. At high cut-off frequenciesthe short-term flicker is 0.163 for the fixed-speed windturbine and 0.051 for the variable-speed wind turbine. It isworth noting that approximately 30% of the total flickeremission produced by the fixed-speed wind turbine dependson power variations with a frequency above the 3-p frequency(2.15 Hz) of the turbine. This flicker contribution over the 3-p frequency emanates from the mechanical properties of thewind turbine, most likely the dynamics of the inductiongenerator. This is due to the flicker curve and the dynamicsof the induction generator. The flicker curve is most sensitiveat 8.8 Hz and the dynamics of the induction generator have aresonance frequency of approx. 10 Hz. The flicker
contribution from the variable-speed wind turbine is quitedifferent. The variable-speed system has the ability to reduce3-p pulsations from the turbine but the mechanical propertiesof the wind turbine seem to contribute to a higher flickerlevel at frequencies of approx. 10 Hz. As can be seen inFig.5, the cut-off frequency of the measured time series froma wind turbine must exceed 50 Hz in order to achieve a goodresult.
0
0,05
0,1
0,15
0,2
0,1 1 10 100fcut-off (Hz)
Pst
fixed-speed
variable-speed
Fig. 5. Short-term flicker from a fixed-speed wind turbine and a variable-speed wind turbine calculated at different cut-off frequencies.
The cut-off frequency has a logarithmic scale.
Fig. 6 shows the short-term flicker emission Pst from afixed-speed and a variable-speed wind turbine at differentpower. The flicker is calculated using an SCR of 20 and agrid angle of 45°, i.e., the same conditions as the windturbines presented in Fig. 5. As can be seen in Fig. 6, theflicker emissions increase at higher wind-speeds due to higherturbulence in the wind.
0
0,05
0,1
0,15
0,2
0 0,2 0,4 0,6 0,8 1
Active power (p.u.)
Pst
fixed-speedvariable-speed
Fig. 6. Short term flicker from a fixed-speed and a variable-speed windturbine at different power. The flicker emission Pst increases at
higher wind-speeds due to higher turbulence in the wind.In the case of the fixed-speed wind turbine, the flickerincreases around three times from lower to higher wind-speeds. Even in the case of the variable-speed wind turbine,the flicker increases with an increase in wind-speed. Exceptfor the flicker level, there is one fundamental differencebetween the fixed-speed and the variable-speed wind turbines.The flicker level increases at increasing wind-speed for thefixed-speed turbine while the flicker level decreases at rated
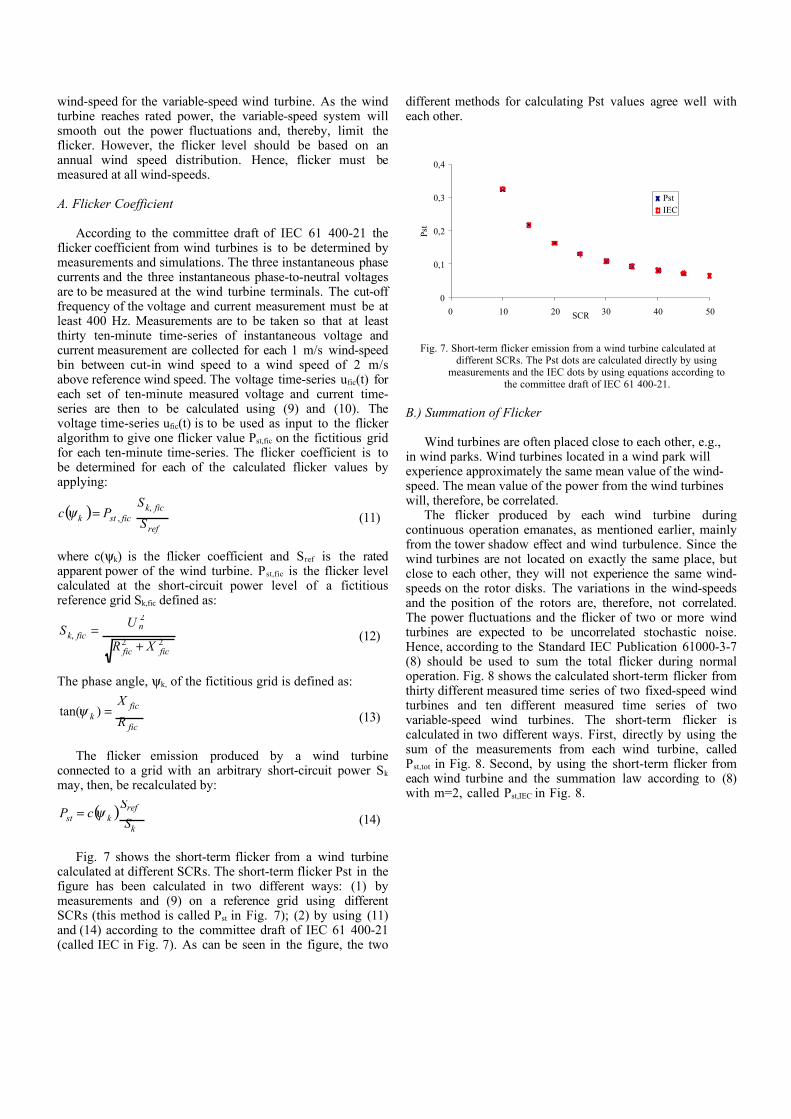
wind-speed for the variable-speed wind turbine. As the windturbine reaches rated power, the variable-speed system willsmooth out the power fluctuations and, thereby, limit theflicker. However, the flicker level should be based on anannual wind speed distribution. Hence, flicker must bemeasured at all wind-speeds.
A. Flicker Coefficient
According to the committee draft of IEC 61 400-21 theflicker coefficient from wind turbines is to be determined bymeasurements and simulations. The three instantaneous phasecurrents and the three instantaneous phase-to-neutral voltagesare to be measured at the wind turbine terminals. The cut-offfrequency of the voltage and current measurement must be atleast 400 Hz. Measurements are to be taken so that at leastthirty ten-minute time-series of instantaneous voltage andcurrent measurement are collected for each 1 m/s wind-speedbin between cut-in wind speed to a wind speed of 2 m/sabove reference wind speed. The voltage time-series ufic(t) foreach set of ten-minute measured voltage and current time-series are then to be calculated using (9) and (10). Thevoltage time-series ufic(t) is to be used as input to the flickeralgorithm to give one flicker value Pst,fic on the fictitious gridfor each ten-minute time-series. The flicker coefficient is tobe determined for each of the calculated flicker values byapplying:
( )ref
fickficstk S
SPc ,
,=ψ (11)
where c(ψk) is the flicker coefficient and Sref is the ratedapparent power of the wind turbine. Pst,fic is the flicker levelcalculated at the short-circuit power level of a fictitiousreference grid Sk,fic defined as:
22
2
,
ficfic
nfick
XR
US
+= (12)
The phase angle, ψk, of the fictitious grid is defined as:
fic
fick R
X=)tan(ψ (13)
The flicker emission produced by a wind turbineconnected to a grid with an arbitrary short-circuit power Sk
may, then, be recalculated by:
( )k
refkst S
ScP ψ= (14)
Fig. 7 shows the short-term flicker from a wind turbinecalculated at different SCRs. The short-term flicker Pst in thefigure has been calculated in two different ways: (1) bymeasurements and (9) on a reference grid using differentSCRs (this method is called Pst in Fig. 7); (2) by using (11)and (14) according to the committee draft of IEC 61 400-21(called IEC in Fig. 7). As can be seen in the figure, the two
different methods for calculating Pst values agree well witheach other.
0
0,1
0,2
0,3
0,4
0 10 20 30 40 50SCR
Pst
PstIEC
Fig. 7. Short-term flicker emission from a wind turbine calculated atdifferent SCRs. The Pst dots are calculated directly by using
measurements and the IEC dots by using equations according tothe committee draft of IEC 61 400-21.
B.) Summation of Flicker
Wind turbines are often placed close to each other, e.g.,in wind parks. Wind turbines located in a wind park willexperience approximately the same mean value of the wind-speed. The mean value of the power from the wind turbineswill, therefore, be correlated.
The flicker produced by each wind turbine duringcontinuous operation emanates, as mentioned earlier, mainlyfrom the tower shadow effect and wind turbulence. Since thewind turbines are not located on exactly the same place, butclose to each other, they will not experience the same wind-speeds on the rotor disks. The variations in the wind-speedsand the position of the rotors are, therefore, not correlated.The power fluctuations and the flicker of two or more windturbines are expected to be uncorrelated stochastic noise.Hence, according to the Standard IEC Publication 61000-3-7(8) should be used to sum the total flicker during normaloperation. Fig. 8 shows the calculated short-term flicker fromthirty different measured time series of two fixed-speed windturbines and ten different measured time series of twovariable-speed wind turbines. The short-term flicker iscalculated in two different ways. First, directly by using thesum of the measurements from each wind turbine, calledPst,tot in Fig. 8. Second, by using the short-term flicker fromeach wind turbine and the summation law according to (8)with m=2, called Pst,IEC in Fig. 8.
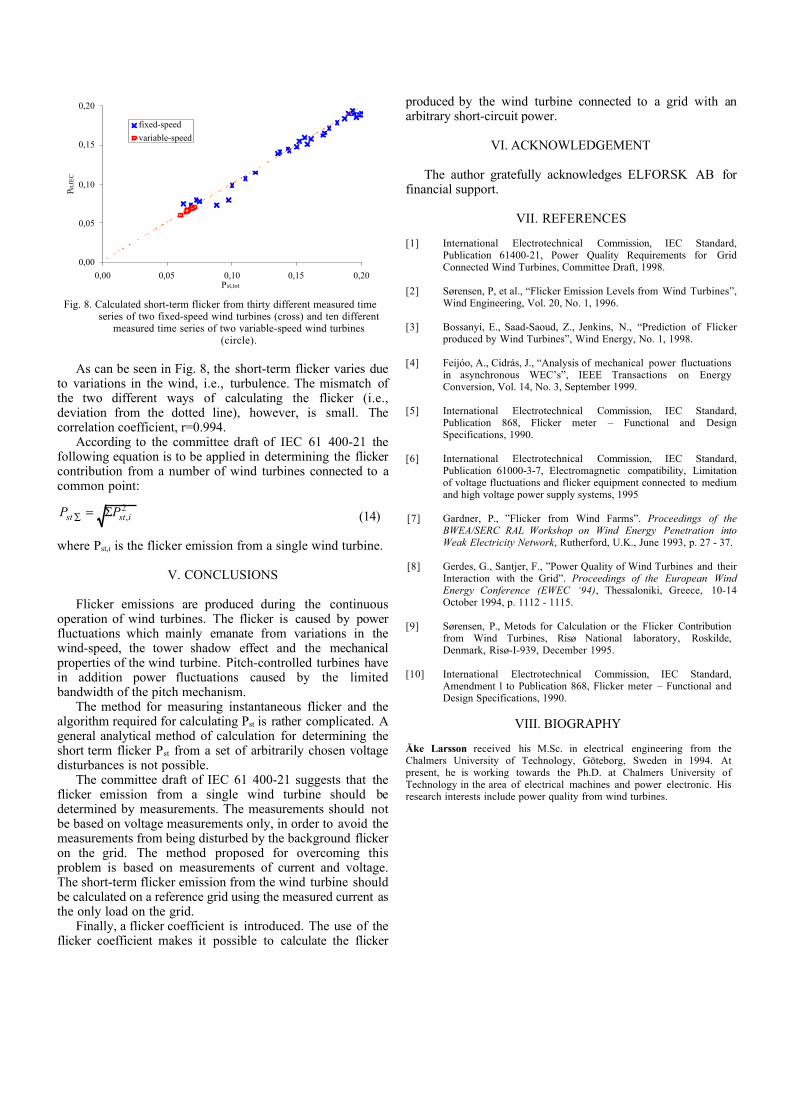
0,00
0,05
0,10
0,15
0,20
0,00 0,05 0,10 0,15 0,20Pst,tot
Pst,I
EC
fixed-speed
variable-speed
Fig. 8. Calculated short-term flicker from thirty different measured timeseries of two fixed-speed wind turbines (cross) and ten different
measured time series of two variable-speed wind turbines(circle).
As can be seen in Fig. 8, the short-term flicker varies dueto variations in the wind, i.e., turbulence. The mismatch ofthe two different ways of calculating the flicker (i.e.,deviation from the dotted line), however, is small. Thecorrelation coefficient, r=0.994.
According to the committee draft of IEC 61 400-21 thefollowing equation is to be applied in determining the flickercontribution from a number of wind turbines connected to acommon point:
2,istst PP Σ=∑ (14)
where Pst,i is the flicker emission from a single wind turbine.
V. CONCLUSIONS
Flicker emissions are produced during the continuousoperation of wind turbines. The flicker is caused by powerfluctuations which mainly emanate from variations in thewind-speed, the tower shadow effect and the mechanicalproperties of the wind turbine. Pitch-controlled turbines havein addition power fluctuations caused by the limitedbandwidth of the pitch mechanism.
The method for measuring instantaneous flicker and thealgorithm required for calculating Pst is rather complicated. Ageneral analytical method of calculation for determining theshort term flicker Pst from a set of arbitrarily chosen voltagedisturbances is not possible.
The committee draft of IEC 61 400-21 suggests that theflicker emission from a single wind turbine should bedetermined by measurements. The measurements should notbe based on voltage measurements only, in order to avoid themeasurements from being disturbed by the background flickeron the grid. The method proposed for overcoming thisproblem is based on measurements of current and voltage.The short-term flicker emission from the wind turbine shouldbe calculated on a reference grid using the measured current asthe only load on the grid.
Finally, a flicker coefficient is introduced. The use of theflicker coefficient makes it possible to calculate the flicker
produced by the wind turbine connected to a grid with anarbitrary short-circuit power.
VI. ACKNOWLEDGEMENT
The author gratefully acknowledges ELFORSK AB forfinancial support.
VII. REFERENCES
[1] International Electrotechnical Commission, IEC Standard,Publication 61400-21, Power Quality Requirements for GridConnected Wind Turbines, Committee Draft, 1998.
[2] Sørensen, P, et al., “Flicker Emission Levels from Wind Turbines”,Wind Engineering, Vol. 20, No. 1, 1996.
[3] Bossanyi, E., Saad-Saoud, Z., Jenkins, N., “Prediction of Flickerproduced by Wind Turbines”, Wind Energy, No. 1, 1998.
[4] Feijóo, A., Cidrás, J., “Analysis of mechanical power fluctuationsin asynchronous WEC’s”, IEEE Transactions on EnergyConversion, Vol. 14, No. 3, September 1999.
[5] International Electrotechnical Commission, IEC Standard,Publication 868, Flicker meter – Functional and DesignSpecifications, 1990.
[6] International Electrotechnical Commission, IEC Standard,Publication 61000-3-7, Electromagnetic compatibility, Limitationof voltage fluctuations and flicker equipment connected to mediumand high voltage power supply systems, 1995
[7] Gardner, P., ”Flicker from Wind Farms”. Proceedings of theBWEA/SERC RAL Workshop on Wind Energy Penetration intoWeak Electricity Network, Rutherford, U.K., June 1993, p. 27 - 37.
[8] Gerdes, G., Santjer, F., ”Power Quality of Wind Turbines and theirInteraction with the Grid”. Proceedings of the European WindEnergy Conference (EWEC ‘94), Thessaloniki, Greece, 10-14October 1994, p. 1112 - 1115.
[9] Sørensen, P., Metods for Calculation or the Flicker Contributionfrom Wind Turbines, Risø National laboratory, Roskilde,Denmark, Risø-I-939, December 1995.
[10] International Electrotechnical Commission, IEC Standard,Amendment 1 to Publication 868, Flicker meter – Functional andDesign Specifications, 1990.
VIII. BIOGRAPHY
Åke Larsson received his M.Sc. in electrical engineering from theChalmers University of Technology, Göteborg, Sweden in 1994. Atpresent, he is working towards the Ph.D. at Chalmers University ofTechnology in the area of electrical machines and power electronic. Hisresearch interests include power quality from wind turbines.

Paper 4C
Flicker Emission of Wind Turbines Caused by Switching Operations
Å. Larsson
Submitted for publication in
IEEE Transactions on Energy Conversion
September 2000
FLICKER EMISSION OF WIND TURBINESCAUSED BY SWITCHING OPERATIONS
Åke Larsson, M.Sc.Department of Electrical Power Engineering
Chalmers University of TechnologyGöteborg, Sweden
Abstract: This paper presents the modelling and analysis ofthe flicker of wind turbines. Special emphasis is on explainingthe start-up procedure and deriving equations for thecalculation of flicker produced by switching operations. Thederived equations are compared with international standards.The paper includes measurements of the start and stop ofdifferent types of turbines. Finally the paper makes acomparison of flicker limitations at wind parks.
Keywords: Flicker, Wind Turbine, Start, Stop.
I. INTRODUCTION
Wind power is among the utilities considered to bepotential sources for bad power quality. Uneven powerproduction and, often, connections at the end of long feederlines are some of the factors behind the statement. Not onlythe uneven power production from wind turbines but alsoother factors contribute to the power quality of windturbines. One such factor is flicker. Electrical flicker is ameasure of voltage variations which may cause disturbancesto consumers. Flicker is outlined in Standard IECPublication 868 [1].
Flicker from grid connected wind turbines has been thesubject of several investigations. Most of theseinvestigations have focused on flicker during the continuousoperation of wind turbines. For example, different types ofcomputer models for predicting flicker during continuousoperation have been developed [2][3]. Published workpresenting results from the IEC also only deal with flickerdue to continuous operation [4]. Flicker produced duringcontinuous operation is caused by power fluctuations. Powerfluctuations mainly emanate from variations in wind-speed,the tower shadow effect and mechanical properties of thewind turbine. Pitch-controlled turbines also have powerfluctuations caused by the limited bandwidth of the pitchmechanism.
In addition, switching operations will produce flicker,except in continuous operation. Typical switching operationsare the start and stop of wind turbines.
This paper describes the start of wind turbines, the flickerproduced during start and a comparison of flicker limitationsat wind parks. Measurements of the start and stop of windturbines are presented in Section II of the paper. This sectionalso describes the different methods used at start and stop bystall-regulated and pitch-control, fixed-speed as well asvariable-speed wind turbines. Section III presents equationsfor flicker caused by switching operations. Finally, SectionIV presents an investigation of flicker limitation at windparks. In this investigation flicker produced duringcontinuous operation is compared to flicker caused byswitching operations. The investigation covers stall-regulatedand pitch-control, fixed-speed as well as variable-speed windturbines.
II. FLICKER DURING SWITCHING OPERATIONS
Switching operations will produce flicker. Typicalswitching operations are the start and stop of wind turbines.Start, stop and switching between generators or generatorwindings will cause a change in the power production. Thechange in the power production will cause voltage changes atthe point of common connection, PCC. These voltagechanges will, in turn, cause flicker. Hence, even switchingoperations must be considered in wind turbine grid design.
A. Starting sequence
The starting sequences of variable-speed and fixed-speedwind turbines are different. Variable-speed wind turbines arenormally equipped with pitch-control. Generally, due to thecontrollable speed of the turbine and the pitch-control, thestarting sequence of variable-speed wind turbines issmoother than for fixed-speed wind turbines.
1) Fixed-speed
With fixed-speed wind turbines, the speed of the turbineis raised during the starting sequence until the generatorspeed is close to the synchronous one. The generator is thenconnected to the grid. In the case of a stall-regulated turbinethe generator must be connected quickly. If the generator isnot connected quickly, the turbine torque may exceed themaximum generator torque resulting in a turbine over-speed.Hence, the soft-starter on stall-regulated turbines normally
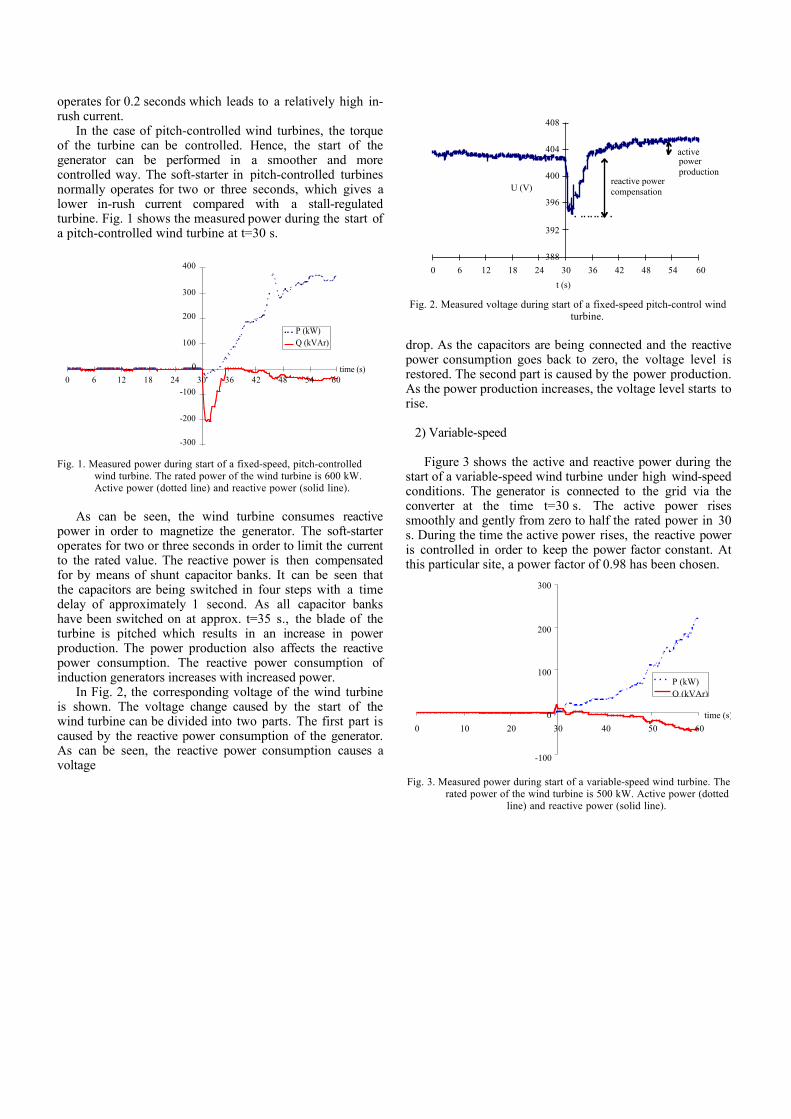
operates for 0.2 seconds which leads to a relatively high in-rush current.
In the case of pitch-controlled wind turbines, the torqueof the turbine can be controlled. Hence, the start of thegenerator can be performed in a smoother and morecontrolled way. The soft-starter in pitch-controlled turbinesnormally operates for two or three seconds, which gives alower in-rush current compared with a stall-regulatedturbine. Fig. 1 shows the measured power during the start ofa pitch-controlled wind turbine at t=30 s.
-300
-200
-100
0
100
200
300
400
0 6 12 18 24 30 36 42 48 54 60
P (kW)Q (kVAr)
time (s)
Fig. 1. Measured power during start of a fixed-speed, pitch-controlledwind turbine. The rated power of the wind turbine is 600 kW.Active power (dotted line) and reactive power (solid line).
As can be seen, the wind turbine consumes reactivepower in order to magnetize the generator. The soft-starteroperates for two or three seconds in order to limit the currentto the rated value. The reactive power is then compensatedfor by means of shunt capacitor banks. It can be seen thatthe capacitors are being switched in four steps with a timedelay of approximately 1 second. As all capacitor bankshave been switched on at approx. t=35 s., the blade of theturbine is pitched which results in an increase in powerproduction. The power production also affects the reactivepower consumption. The reactive power consumption ofinduction generators increases with increased power.
In Fig. 2, the corresponding voltage of the wind turbineis shown. The voltage change caused by the start of thewind turbine can be divided into two parts. The first part iscaused by the reactive power consumption of the generator.As can be seen, the reactive power consumption causes avoltage
388
392
396
400
404
408
0 6 12 18 24 30 36 42 48 54 60
t (s)
U (V)reactive powercompensation
activepowerproduction
Fig. 2. Measured voltage during start of a fixed-speed pitch-control windturbine.
drop. As the capacitors are being connected and the reactivepower consumption goes back to zero, the voltage level isrestored. The second part is caused by the power production.As the power production increases, the voltage level starts torise.
2) Variable-speed
Figure 3 shows the active and reactive power during thestart of a variable-speed wind turbine under high wind-speedconditions. The generator is connected to the grid via theconverter at the time t=30 s. The active power risessmoothly and gently from zero to half the rated power in 30s. During the time the active power rises, the reactive poweris controlled in order to keep the power factor constant. Atthis particular site, a power factor of 0.98 has been chosen.
-100
0
100
200
300
0 10 20 30 40 50 60
time (s)
P (kW)Q (kVAr)
Fig. 3. Measured power during start of a variable-speed wind turbine. Therated power of the wind turbine is 500 kW. Active power (dotted
line) and reactive power (solid line).
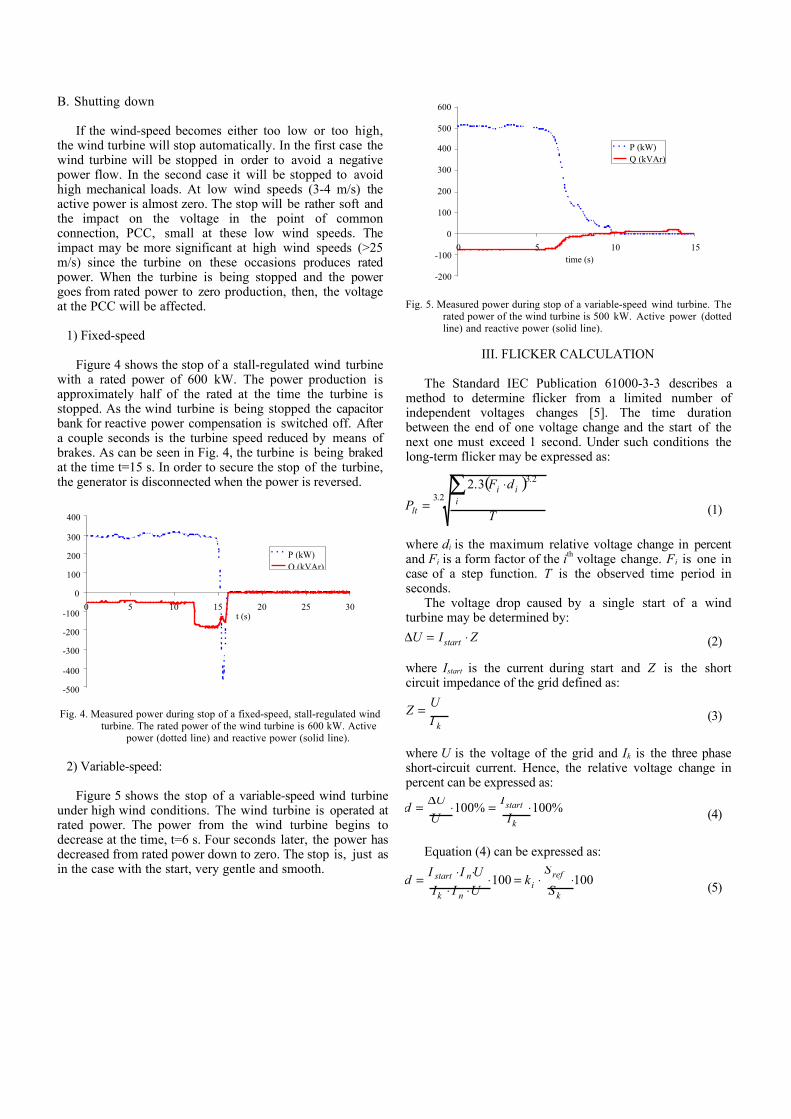
B. Shutting down
If the wind-speed becomes either too low or too high,the wind turbine will stop automatically. In the first case thewind turbine will be stopped in order to avoid a negativepower flow. In the second case it will be stopped to avoidhigh mechanical loads. At low wind speeds (3-4 m/s) theactive power is almost zero. The stop will be rather soft andthe impact on the voltage in the point of commonconnection, PCC, small at these low wind speeds. Theimpact may be more significant at high wind speeds (>25m/s) since the turbine on these occasions produces ratedpower. When the turbine is being stopped and the powergoes from rated power to zero production, then, the voltageat the PCC will be affected.
1) Fixed-speed
Figure 4 shows the stop of a stall-regulated wind turbinewith a rated power of 600 kW. The power production isapproximately half of the rated at the time the turbine isstopped. As the wind turbine is being stopped the capacitorbank for reactive power compensation is switched off. Aftera couple seconds is the turbine speed reduced by means ofbrakes. As can be seen in Fig. 4, the turbine is being brakedat the time t=15 s. In order to secure the stop of the turbine,the generator is disconnected when the power is reversed.
-500
-400
-300
-200
-100
0
100
200
300
400
0 5 10 15 20 25 30t (s)
P (kW)Q (kVAr)
Fig. 4. Measured power during stop of a fixed-speed, stall-regulated windturbine. The rated power of the wind turbine is 600 kW. Active
power (dotted line) and reactive power (solid line).
2) Variable-speed:
Figure 5 shows the stop of a variable-speed wind turbineunder high wind conditions. The wind turbine is operated atrated power. The power from the wind turbine begins todecrease at the time, t=6 s. Four seconds later, the power hasdecreased from rated power down to zero. The stop is, just asin the case with the start, very gentle and smooth.
-200
-100
0
100
200
300
400
500
600
0 5 10 15time (s)
P (kW)Q (kVAr)
Fig. 5. Measured power during stop of a variable-speed wind turbine. Therated power of the wind turbine is 500 kW. Active power (dottedline) and reactive power (solid line).
III. FLICKER CALCULATION
The Standard IEC Publication 61000-3-3 describes amethod to determine flicker from a limited number ofindependent voltages changes [5]. The time durationbetween the end of one voltage change and the start of thenext one must exceed 1 second. Under such conditions thelong-term flicker may be expressed as:
( )2.3
2.33.2
T
dF
P iii
lt
∑ ⋅= (1)
where di is the maximum relative voltage change in percentand Fi is a form factor of the ith voltage change. Fi is one incase of a step function. T is the observed time period inseconds.
The voltage drop caused by a single start of a windturbine may be determined by:
ZIU start ⋅=∆ (2)
where Istart is the current during start and Z is the shortcircuit impedance of the grid defined as:
kIU
Z = (3)
where U is the voltage of the grid and Ik is the three phaseshort-circuit current. Hence, the relative voltage change inpercent can be expressed as:
%100%100 ⋅=⋅∆=k
start
II
UU
d (4)
Equation (4) can be expressed as:
100100 ⋅⋅=⋅⋅⋅⋅⋅=
k
refi
nk
nstart
S
Sk
UIIUII
d (5)
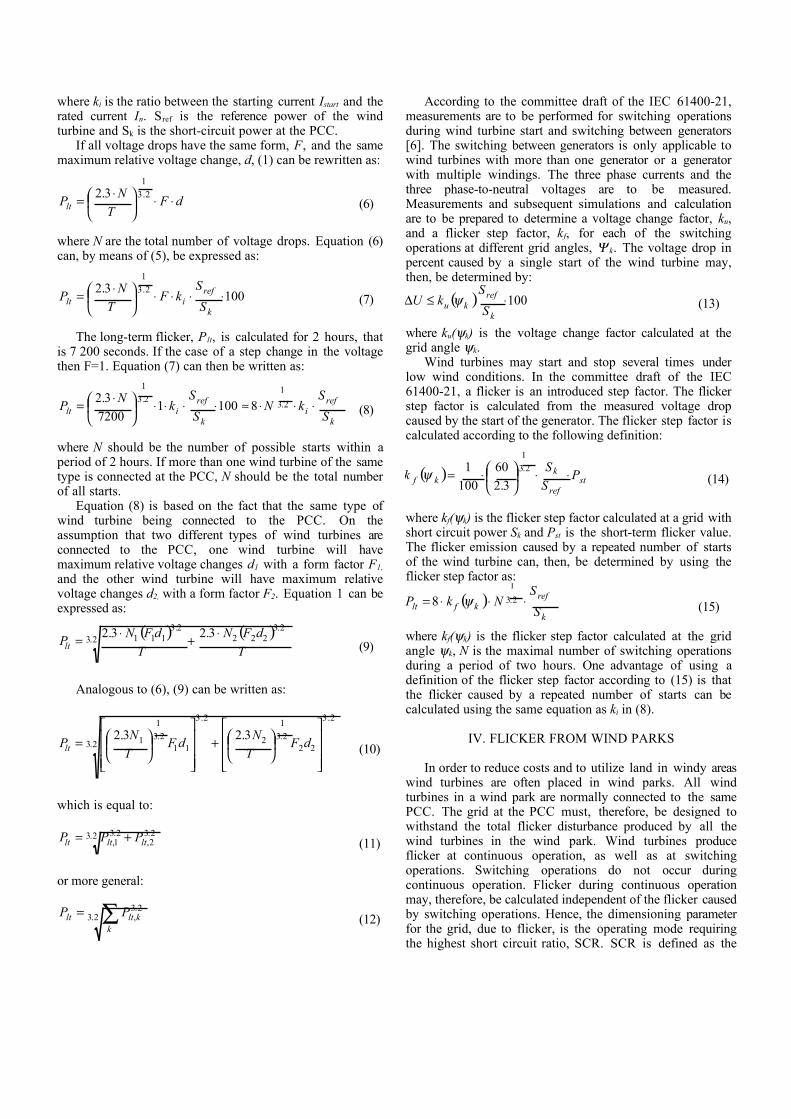
where ki is the ratio between the starting current Istart and therated current In. Sref is the reference power of the windturbine and Sk is the short-circuit power at the PCC.
If all voltage drops have the same form, F, and the samemaximum relative voltage change, d, (1) can be rewritten as:
dFTN
Plt ⋅⋅
⋅= 2.3
1
3.2(6)
where N are the total number of voltage drops. Equation (6)can, by means of (5), be expressed as:
1003.2 2.3
1
⋅⋅⋅⋅
⋅=
k
refilt S
SkF
TN
P (7)
The long-term flicker, Plt, is calculated for 2 hours, thatis 7 200 seconds. If the case of a step change in the voltagethen F=1. Equation (7) can then be written as:
k
refi
k
refilt S
SkN
S
Sk
NP ⋅⋅⋅≈⋅⋅⋅⋅
⋅= 2.3
12.3
1
810017200
3.2(8)
where N should be the number of possible starts within aperiod of 2 hours. If more than one wind turbine of the sametype is connected at the PCC, N should be the total numberof all starts.
Equation (8) is based on the fact that the same type ofwind turbine being connected to the PCC. On theassumption that two different types of wind turbines areconnected to the PCC, one wind turbine will havemaximum relative voltage changes d1 with a form factor F1,and the other wind turbine will have maximum relativevoltage changes d2, with a form factor F2. Equation 1 can beexpressed as:
( ) ( )2.3
2.3222
2.3111 3.23.2
TdFN
TdFN
Plt⋅+⋅= (9)
Analogous to (6), (9) can be written as:
2.3
2.3
222.3
1
2
2.3
112.3
1
1 3.23.2
+
= dF
TN
dFTN
Plt (10)
which is equal to:
2.3 2.32,
2.31, ltltlt PPP += (11)
or more general:
2.32.3
,∑=k
kltlt PP (12)
According to the committee draft of the IEC 61400-21,measurements are to be performed for switching operationsduring wind turbine start and switching between generators[6]. The switching between generators is only applicable towind turbines with more than one generator or a generatorwith multiple windings. The three phase currents and thethree phase-to-neutral voltages are to be measured.Measurements and subsequent simulations and calculationare to be prepared to determine a voltage change factor, ku,and a flicker step factor, kf, for each of the switchingoperations at different grid angles, Ψ k. The voltage drop inpercent caused by a single start of the wind turbine may,then, be determined by:
( ) 100⋅≤∆k
refku S
SkU ψ (13)
where ku(ψk) is the voltage change factor calculated at thegrid angle ψk.
Wind turbines may start and stop several times underlow wind conditions. In the committee draft of the IEC61400-21, a flicker is an introduced step factor. The flickerstep factor is calculated from the measured voltage dropcaused by the start of the generator. The flicker step factor iscalculated according to the following definition:
( ) stref
kkf P
SS
k ⋅⋅
⋅= 2.3
1
3.260
1001ψ (14)
where kf(ψk) is the flicker step factor calculated at a grid withshort circuit power Sk and Pst is the short-term flicker value.The flicker emission caused by a repeated number of startsof the wind turbine can, then, be determined by using theflicker step factor as:
( )k
refkflt S
SNkP ⋅⋅⋅= 2.3
1
8 ψ (15)
where kf(ψk) is the flicker step factor calculated at the gridangle ψk, N is the maximal number of switching operationsduring a period of two hours. One advantage of using adefinition of the flicker step factor according to (15) is thatthe flicker caused by a repeated number of starts can becalculated using the same equation as ki in (8).
IV. FLICKER FROM WIND PARKS
In order to reduce costs and to utilize land in windy areaswind turbines are often placed in wind parks. All windturbines in a wind park are normally connected to the samePCC. The grid at the PCC must, therefore, be designed towithstand the total flicker disturbance produced by all thewind turbines in the wind park. Wind turbines produceflicker at continuous operation, as well as at switchingoperations. Switching operations do not occur duringcontinuous operation. Flicker during continuous operationmay, therefore, be calculated independent of the flicker causedby switching operations. Hence, the dimensioning parameterfor the grid, due to flicker, is the operating mode requiringthe highest short circuit ratio, SCR. SCR is defined as the
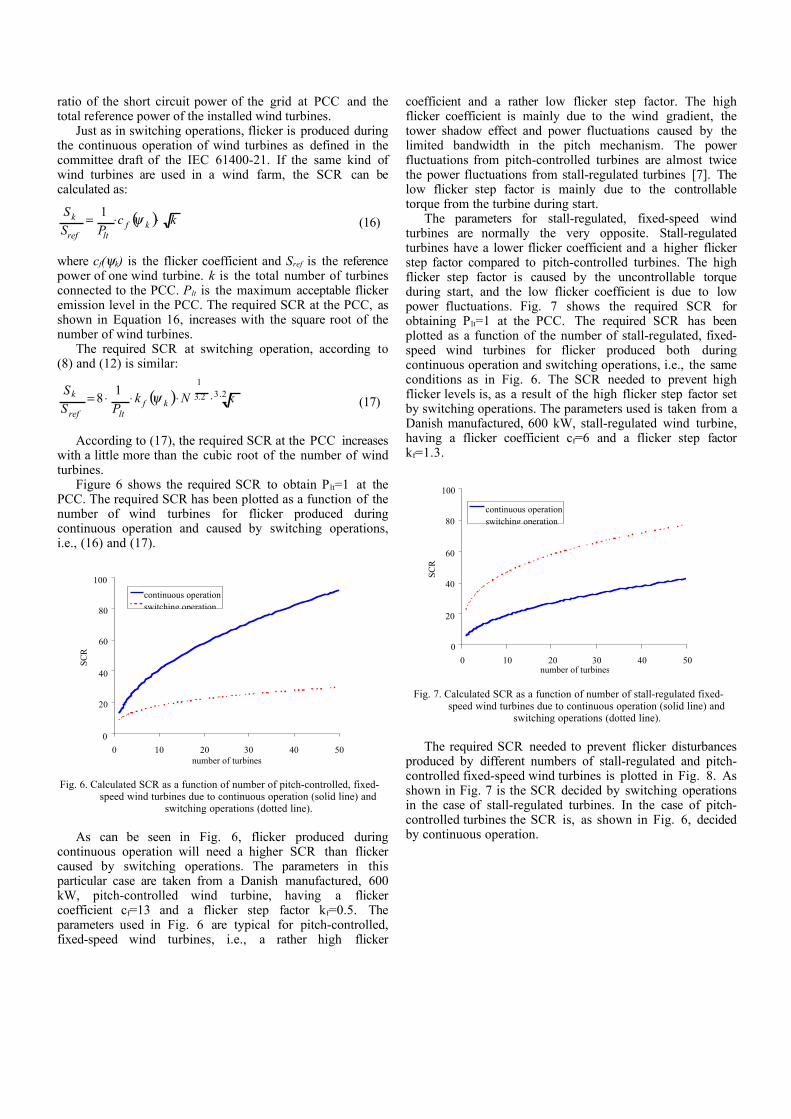
ratio of the short circuit power of the grid at PCC and thetotal reference power of the installed wind turbines.
Just as in switching operations, flicker is produced duringthe continuous operation of wind turbines as defined in thecommittee draft of the IEC 61400-21. If the same kind ofwind turbines are used in a wind farm, the SCR can becalculated as:
( ) kcPS
Skf
ltref
k ⋅⋅= ψ1(16)
where cf(ψk) is the flicker coefficient and Sref is the referencepower of one wind turbine. k is the total number of turbinesconnected to the PCC. Plt is the maximum acceptable flickeremission level in the PCC. The required SCR at the PCC, asshown in Equation 16, increases with the square root of thenumber of wind turbines.
The required SCR at switching operation, according to(8) and (12) is similar:
( ) 2.32.3
11
8 kNkPS
Skf
ltref
k ⋅⋅⋅⋅= ψ (17)
According to (17), the required SCR at the PCC increaseswith a little more than the cubic root of the number of windturbines.
Figure 6 shows the required SCR to obtain Plt=1 at thePCC. The required SCR has been plotted as a function of thenumber of wind turbines for flicker produced duringcontinuous operation and caused by switching operations,i.e., (16) and (17).
0
20
40
60
80
100
0 10 20 30 40 50number of turbines
SCR
continuous operationswitching operation
Fig. 6. Calculated SCR as a function of number of pitch-controlled, fixed-speed wind turbines due to continuous operation (solid line) and
switching operations (dotted line).
As can be seen in Fig. 6, flicker produced duringcontinuous operation will need a higher SCR than flickercaused by switching operations. The parameters in thisparticular case are taken from a Danish manufactured, 600kW, pitch-controlled wind turbine, having a flickercoefficient cf=13 and a flicker step factor kf=0.5. Theparameters used in Fig. 6 are typical for pitch-controlled,fixed-speed wind turbines, i.e., a rather high flicker
coefficient and a rather low flicker step factor. The highflicker coefficient is mainly due to the wind gradient, thetower shadow effect and power fluctuations caused by thelimited bandwidth in the pitch mechanism. The powerfluctuations from pitch-controlled turbines are almost twicethe power fluctuations from stall-regulated turbines [7]. Thelow flicker step factor is mainly due to the controllabletorque from the turbine during start.
The parameters for stall-regulated, fixed-speed windturbines are normally the very opposite. Stall-regulatedturbines have a lower flicker coefficient and a higher flickerstep factor compared to pitch-controlled turbines. The highflicker step factor is caused by the uncontrollable torqueduring start, and the low flicker coefficient is due to lowpower fluctuations. Fig. 7 shows the required SCR forobtaining Plt=1 at the PCC. The required SCR has beenplotted as a function of the number of stall-regulated, fixed-speed wind turbines for flicker produced both duringcontinuous operation and switching operations, i.e., the sameconditions as in Fig. 6. The SCR needed to prevent highflicker levels is, as a result of the high flicker step factor setby switching operations. The parameters used is taken from aDanish manufactured, 600 kW, stall-regulated wind turbine,having a flicker coefficient cf=6 and a flicker step factorkf=1.3.
0
20
40
60
80
100
0 10 20 30 40 50number of turbines
SCR
continuous operationswitching operation
Fig. 7. Calculated SCR as a function of number of stall-regulated fixed-speed wind turbines due to continuous operation (solid line) and
switching operations (dotted line).
The required SCR needed to prevent flicker disturbancesproduced by different numbers of stall-regulated and pitch-controlled fixed-speed wind turbines is plotted in Fig. 8. Asshown in Fig. 7 is the SCR decided by switching operationsin the case of stall-regulated turbines. In the case of pitch-controlled turbines the SCR is, as shown in Fig. 6, decidedby continuous operation.
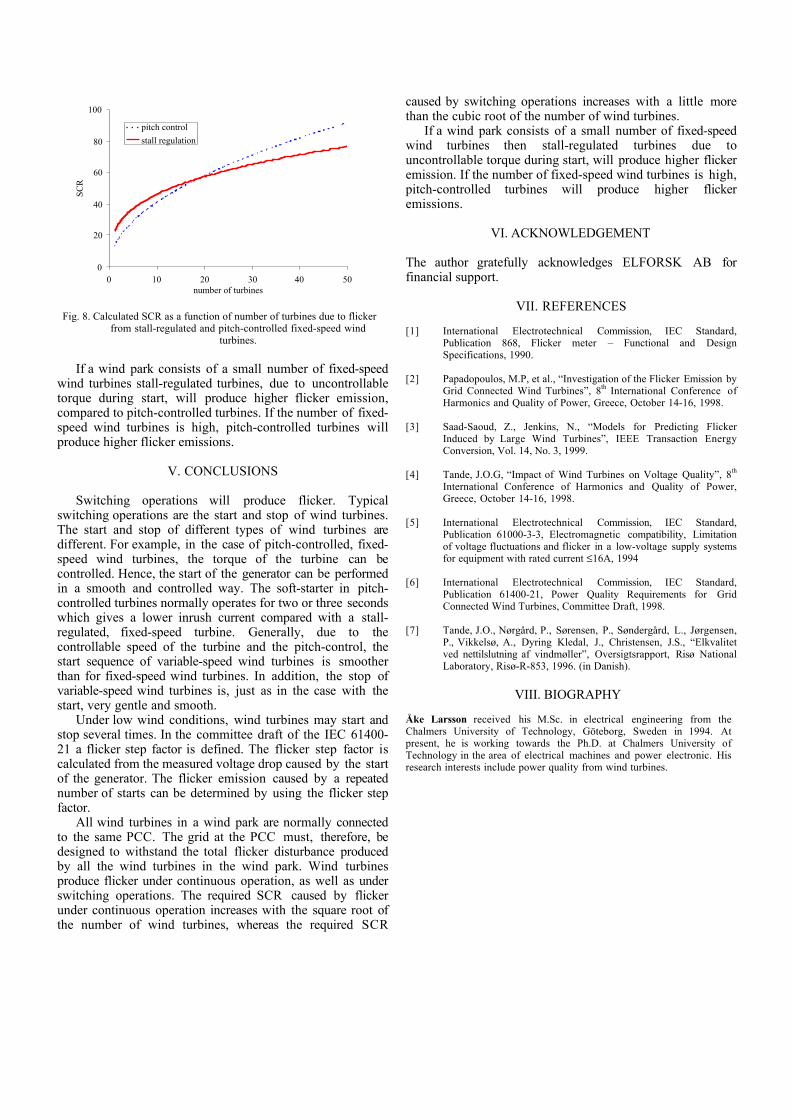
0
20
40
60
80
100
0 10 20 30 40 50number of turbines
SCR
pitch control
stall regulation
Fig. 8. Calculated SCR as a function of number of turbines due to flickerfrom stall-regulated and pitch-controlled fixed-speed wind
turbines.
If a wind park consists of a small number of fixed-speedwind turbines stall-regulated turbines, due to uncontrollabletorque during start, will produce higher flicker emission,compared to pitch-controlled turbines. If the number of fixed-speed wind turbines is high, pitch-controlled turbines willproduce higher flicker emissions.
V. CONCLUSIONS
Switching operations will produce flicker. Typicalswitching operations are the start and stop of wind turbines.The start and stop of different types of wind turbines aredifferent. For example, in the case of pitch-controlled, fixed-speed wind turbines, the torque of the turbine can becontrolled. Hence, the start of the generator can be performedin a smooth and controlled way. The soft-starter in pitch-controlled turbines normally operates for two or three secondswhich gives a lower inrush current compared with a stall-regulated, fixed-speed turbine. Generally, due to thecontrollable speed of the turbine and the pitch-control, thestart sequence of variable-speed wind turbines is smootherthan for fixed-speed wind turbines. In addition, the stop ofvariable-speed wind turbines is, just as in the case with thestart, very gentle and smooth.
Under low wind conditions, wind turbines may start andstop several times. In the committee draft of the IEC 61400-21 a flicker step factor is defined. The flicker step factor iscalculated from the measured voltage drop caused by the startof the generator. The flicker emission caused by a repeatednumber of starts can be determined by using the flicker stepfactor.
All wind turbines in a wind park are normally connectedto the same PCC. The grid at the PCC must, therefore, bedesigned to withstand the total flicker disturbance producedby all the wind turbines in the wind park. Wind turbinesproduce flicker under continuous operation, as well as underswitching operations. The required SCR caused by flickerunder continuous operation increases with the square root ofthe number of wind turbines, whereas the required SCR
caused by switching operations increases with a little morethan the cubic root of the number of wind turbines.
If a wind park consists of a small number of fixed-speedwind turbines then stall-regulated turbines due touncontrollable torque during start, will produce higher flickeremission. If the number of fixed-speed wind turbines is high,pitch-controlled turbines will produce higher flickeremissions.
VI. ACKNOWLEDGEMENT
The author gratefully acknowledges ELFORSK AB forfinancial support.
VII. REFERENCES
[1] International Electrotechnical Commission, IEC Standard,Publication 868, Flicker meter – Functional and DesignSpecifications, 1990.
[2] Papadopoulos, M.P, et al., “Investigation of the Flicker Emission byGrid Connected Wind Turbines”, 8th International Conference ofHarmonics and Quality of Power, Greece, October 14-16, 1998.
[3] Saad-Saoud, Z., Jenkins, N., “Models for Predicting FlickerInduced by Large Wind Turbines”, IEEE Transaction EnergyConversion, Vol. 14, No. 3, 1999.
[4] Tande, J.O.G, “Impact of Wind Turbines on Voltage Quality”, 8th
International Conference of Harmonics and Quality of Power,Greece, October 14-16, 1998.
[5] International Electrotechnical Commission, IEC Standard,Publication 61000-3-3, Electromagnetic compatibility, Limitationof voltage fluctuations and flicker in a low-voltage supply systemsfor equipment with rated current ≤16A, 1994
[6] International Electrotechnical Commission, IEC Standard,Publication 61400-21, Power Quality Requirements for GridConnected Wind Turbines, Committee Draft, 1998.
[7] Tande, J.O., Nørgård, P., Sørensen, P., Søndergård, L., Jørgensen,P., Vikkelsø, A., Dyring Kledal, J., Christensen, J.S., “Elkvalitetved nettilslutning af vindmøller”, Oversigtsrapport, Risø NationalLaboratory, Risø-R-853, 1996. (in Danish).
VIII. BIOGRAPHY
Åke Larsson received his M.Sc. in electrical engineering from theChalmers University of Technology, Göteborg, Sweden in 1994. Atpresent, he is working towards the Ph.D. at Chalmers University ofTechnology in the area of electrical machines and power electronic. Hisresearch interests include power quality from wind turbines.