Embed Size (px)
Citation preview

The Power of Maps:
A Study of an exhibition at Cooper-Hewitt, National Museum of Design
INSTITUTIONAL STUDIES
Smithsonian Institution

The Power of Maps:
A Study of an exhibition at Cooper-Hewitt, National Museum of Design
Zahava D. Doering Audrey E. Kindlon
Adam Bickford
September 1993
This report was published as: Doering, 2. D., Bickford, A,, Karns, D. A., & Kindlon, A. E. (1999).
Communication and persuasion in a didactic exhibition: The Power of Maps study. Curator: The Museum Journal 42(2), 88-107.
INSTITUTIONAL STUDIES Smithsonian Institution
900 Jefferson Drive, S.W. Washington, D.C. 20560
(202) 786-2289 Report 93-5

This report presents the results from a study conducted by the Institutional Studies Office of The Power of Maps exhibition at Cooper-Hewitt National Museum of Design. The exhibition sought to demonstrate, through the use of panels and text labels, that "all maps -- whether rare or familiar, new or old, Western or non-Western -- are more than simply guides to help you find your way. Like advertisements and other forms of graphic design, maps express particular viewpoints in support of specific interests. Depending on their function and purpose, all maps present information selectively, shaping our view of the world and our place in it."* The study's key objective was to assess the extent to which visitors understood the exhibition's point of view and the extent to which they agreed with it.
This study reflects the enthusiasm, efforts and cooperation of several people in a number of organizations. The authors welcome the opportunity to acknowledge their contributions. At Cooper-Hewitt, Andrew Pekarik, then Assistant Director for Programs, Lucy Fellowes, The Power of Maps co-curator, and Susan Yelavich and Dorothy Dunn, Education Department, deserve special mention. In addition to assisting with the overall design and questionnaire development they provided valuable background information for the analysis and comments on the report. Lisa Podos supervised the data collection at Cooper-Hewitt and reviewed questionnaires. Ten interviewers, both paid and volunteers, conducted the interviews in New York and Washington, D.C. The high cooperation rates with the study reflect their work and dedication. Denis Wood, Professor of Design, North Carolina State University and The Power of Maps co-curator, provided a critical review of the analysis and made many helpful suggestions about data presentation.
Part of the study included interviewing visitors to the National Portrait Gallery (NPG). We appreciate the co-operation received from Alan Fern, Director and Carolyn Carr, Deputy Director. Beverly J. Cox, Curator of Exhibitions, at NPG graciously provided us with postcards for visitors as a token of appreciation.
In the Institutional Studies Office, several staff members participated. Ann R. Ziebarth aided in questionnaire development, developed procedures for questionnaire review, and coordinated our work with Cooper-Hewitt. Elizabeth K. Ziebarth, assisted by Lassa Skinner, supervised the work at the National Portrait Gallery. In addition, Robert D. Manning and Elizabeth reviewed the report and made many helpful suggestions. Michelle Ruddick, an intern from the University of Virginia, assumed editorial responsibility.
The study could not have been conducted without the cooperation of 1,034 Cooper-Hewitt and National Portrait Gallery visitors. Their participation in the survey and useful comments are appreciated. Errors in interpretation are, of course, the responsibility of the authors.
* See Appendix A, Press Release, page 38.
- i i i -

Summary
Between October 6,1992 and March 7,1993, The Power of Maps exhibition was on view at Cooper-Hewitt National Museum of Design in New York City. The exhibition sought to demonstrate, through the use of panels and text labels, that "all maps -- whether rare or familiar, new or old, Western or non-Western -- are more than simply guides to help you find your way. Like advertisements and other forms of graphic design, maps express particular viewpoints in support of specific interests. Depending on their function and purpose, all maps present information selectively, shaping our view of the world and our place in it."* The study's key objective was to assess the extent to which visitors understood the exhibition's point of view and the extent to which they agreed with it and were influenced by it.
Representative samples of visitors were interviewed as they entered (Entrance Survey) and exited the Cooper-Hewitt Museum (Exit Survey) for a period of 18 days. In addition, a companion survey about maps was conducted at the National Portrait Gallery (NPG) in Washington, D.C. Data from the NPG survey was used as a benchmark for comparing the results from the New York interviews, as visitors in Washington, D.C. had neither viewed nor heard about the exhibition. Visitor cooperation with the survey was high (at Cooper-Hewitt, 84.4% of intercepted visitors completed interviews; at NPG, 92.6%). Overall, 1,034 visitors were interviewed.
In this summary, we present the highlights from the report.
Who Came to the Exhibition?
Approximately equal numbers of men and women came to Cooper-Hewitt; the majority, 90.3%, are adults over the age of 25.
About four-fifths of the visits were made by one or two adults (38.5 and 42.6 percent, respectively) and an additional 9.2% by several adults. Adults with children comprised 6.9% of the visits.
Over four-fifths of visitors have at least a Bachelor's degree (82.4%). Of those 25 years old or older, 87.3% have at least a Bachelor's degree, and 95.6% some college or more. Consistent with their high educational attainment, the majority of visitors report professional occupations.
Visitors were predominately Caucasians (93.0%); Asians were 3.8% of the group, and the remaining 3.2% were comprised of African Americans, Hispanics, and Native Americans.
Residents of New York City constituted just over half (52.1 Yo) of the total number of visitors, while residents from the New York, New Jersey, and Connecticut suburbs were an additional 16.0%.
-- Individuals from other parts of the United States made 23.3% of the visits, while 8.2% were from foreign locations.
* See Appendix A, Press Release, page 38.
-iv-

The Context of the Visit to The Power of Maps
o Half of the visitors had been to Cooper-Hewitt previously and half were visiting for the first time.
-- About one-quarter (26.0%) of the total had been to the museum within the last year.
-- About two-thirds (62.0%) of those from New York City and the suburbs were repeat visitors. Among the non-local visitors, 25.2% were repeat visitors.
o Almost two-thirds (63.2Oh) of all visitors came to Cooper-Hewitt specifically to see The Power of Maps exhibition.
-- Just over one-quarter (26.6%) were making a general visit to the museum.
-- Newspapers (31 .O%) and magazines (1 6.1 Yo), friends or family (24.4%) and the Fifth Avenue sign (14.9%) were the primary sources of information about the exhibition.
o Among all those interviewed, 5.3% are Cooper-Hewitt Membership Program members and 19.5% are members of the Smithsonian.
-- Almost four-fifths (79.5%) of Cooper-Hewitt members visiting stated that they came to see The Power of Maps exhibition.
The Effectiveness of The Power of Maps in Communicating its Messages and Changing the Perspective of Visitors
o In an effort to empirically assess the extent to which the curatorial perspective on maps as interpretive objects was communicated and perspectives changed, survey respondents were asked whether they agreed with a set of nine statements about the nature of maps or that compared maps to other commonplace objects. The resultant scores have a possible range from zero (indicating that the respondent did not receive, or believe, any of the exhibition's messages) to nine points (indicating that the respondent is in agreement with all of the exhibition's messages).
-- Those people with the least exposure to the Power of Maps exhibit had the lowest scores (NPG).
-- People who had decided to view the exhibition had higher scores (Entrance Survey), indicating some appreciation for the exhibition themes, or at least some thought about the issues that the exhibition raised through media reviews or discussions with friends and family.
-- On average, people who had seen the exhibition had the highest scores, suggesting that they were persuaded by the exhibition's presentation (Exit Survey). In other words, the exhibition's message had been effectively communicated and was persuasive.
-V-

o We also find significant differences between each location for eight out of the nine individual items in the scale. The results clearly show an increase in the percent giving a Correct or Partially Correct response between the NPG location, the Cooper-Hewitt Entrance Survey and the Cooper-Hewitt Exit Survey.
o The results show that differences in scores are no t due to the different demographic characteristics of respondents.
-- A respondent's score was best predicted by three factors: the respondent's occupation ("artistic occupations"), the visitor's experience in the exhibition itself (seeing the exhibition), and the number of information sources from which the respondent had heard about the exhibition. The results support the proposition that exposure to the exhibition materials, including publications, press materials, etc., influenced visitor opinion in the ways hoped for by the exhibition designers.
o We see progress in the results from NPG visitors to the Cooper-Hewitt Exit Survey respondents -- from minimal differentiation of maps as objective and interpretive objects to a clear differentiation between the objective and interpretive nature of maps; visitors interviewed in the Cooper-Hewitt Entrance Survey are intermediate in the perception of these distinctions.
-- The Cooper-Hewitt Entrance Survey respondents had apparently considered the issues addressed by the exhibition, but were either not convinced of the divergent roles of maps or had mixed feelings because of their backgrounds or materials they had read.
-- Those visitors interviewed after seeing the exhibition made a clear differentiation between the objective and interpretive nature of maps -- one of the exhibition's central messages.
o In their hypothetical recommendations to friends, 43.8% mentioned specific sections, with almost a fourth (or 12.2% of the total) mentioning the North Carolina room**** ; an additional 10.9% enthusiastically indicated that everything was worth seeing, while a small group (4.9%) indicated they would not identify anything special to a friend and the remainder did not mention a section.
-- We also find that the small group of respondents who named North Carolina (12.2%) had the highest mean scores on the scale, suggesting that this room was most effective in communicating the curatorial message.
o When specific maps or objects were mentioned, they tended to be primarily historic maps of Western origins (28.1% of the total), followed by world maps and globes (1 6.1 Yo). Here we find that about one-fourth (21.3%) of visitors do not mention a specific object or map.
If we combine the findings from the various analyses we must conclude that the presentation of The Power of Maps exhibition was successful in communicating its central message and changing the perspective of visitors.
** See Appendix A, p 41, Section 5.
-vi-

Table of Contents
Preface .................................................................................................................. iii Summary ............................................................................................................... iv
List of Tables and Figures ....................................................................................... viii
Section
I . Background ........................................................................................................
Introduction ........................................................................................................ Study Design .................................................................................................... Survey Design .................................................................................................. Analysis Framework ......................................................................................... Report Contents ...............................................................................................
II . Visitors to the Cooper-Hewitt Museum: A Demographic Profile ........................
I nt roduct ion ........................................................................................................ Demographic Characteristics ............................................................................ Summary ..........................................................................................................
Ill . The Context of the Visit to The Power of Maps ................................................
Introduction ...................................................................................................... First Visit to Cooper-Hewitt .............................................................................. Reasons for Visiting Cooper-Hewitt ................................................................. Sources of Information about The Power of Maps Exhibition .......................... Summary ..........................................................................................................
IV . The Effectiveness of The Power of Maps in Communicating its Messages ......
I nt roduct ion .......................................................................................................
1
1 2 4 5 6
7
7 7
14
15
15 15 16 18 19
20
20 Maps Message Scale ....................................................................................... 20 The Configuration of Maps Message Scale Score Values ............................... 26 Exhibition-Specific Questions ........................................................................... 27 Summary .......................................................................................................... 30 Technical Note . Cluster Analysis: The Configuration of Maps Message
Scale Score Values .................................................................................... 32
Appendices
A . Descriptive Materials: The Power of Maps Exhibition ................................. 38
C . Questionnaires and Survey Schedules D . Supplementary Tables ................................................................................. 62
B . Design and Implementation of The Power of Maps Survey ........................ 42 ....................................................... 57
E . Comparison of Visitors to the National Portrait Gallery with Visitors to the Cooper-Hewitt Museum ............................................................... 68
F . Regression Models: Maps Message Scale Scores ...................................... 75
-vii-

List of Tables
4.1 4.2
4.3 4.4 4.5
B . 1
D.l D.2
D.3
D.4
D.5
E . 1
2.1 2.2 2.3
2.4 2.5 2.6
2.7
3.1 3.2 3.3 3.4 3.5
4.1 4.2
4.3
Items and Desired Responses for Power of Maps Message Scale ............ 21 Percent of Respondents Giving a Correct or Partially Correct
............................................................... 24 Final Regression Model for Power of Maps Message Scale ...................... 26 Sections in the Exhibition or Objects Recommended by Respondents ...... 28 Responses to Open-Ended Question about the Central Message of
The Power of Maps ............................................................................... 29
Response to Power of Maps Message Scale and Percentage Increase. by Item and Survey Location
Logistic Regression Analysis of Refusing to Participate in The Power of Maps Survey at Cooper-Hewitt ............................................................. 56
Composition and Sample Disposition: The Power of Maps Surveys .......... 62 Comparison of Survey Participants and Non-Participants: Cooper-
Hewitt and NPG Surveys ....................................................................... 63 Selected Characteristics of Survey Participants and Non-
Participants ............................................................................................ 64 Selected Characteristics of Survey Respondents: Cooper.Hewitt. NPG
and N PG/N MAA Surveys ........................................................................ 66 Percent of Respondents Giving Correct or Partially Correct Responses
to Power of Maps Message Scale. by Item and Survey Location ........... 67 Chi-square Values: Comparison of NPG and Cooper-Hewitt Visitors ......... 73
List of Fiaures
Age Distribution of Visitors. Cooper-Hewitt Museum .................................. 8 Geographic Origins of Cooper-Hewitt Visitors ............................................ 9 Residence Locations of New York Metropolitan Area Visitors to
the Cooper-Hewitt Museum .................................................................... 10 RaciaVEthnic Composition of Cooper Hewitt Museum Visitors .................. 11 Social Composition of Visitors to the Cooper-Hewitt Museum ................... 12 Educational Attainment of Cooper-Hewitt Visitors. Total and
Adults over 25 Years Old ...................................................................... 13 ................................... 13 Occupational Distribution of Cooper-Hewitt Visitors
Time of Last Visit to Cooper-Hewitt ............................................................ 15 First and Repeat Visit: Local and Non-Local Visitors ................................. 16 Reason for Visit: All Visitors ........................................................................ 17 Reason for Visit: Local and Non-Local Visitors .......................................... 18 Where did you first hear about The Power of Maps exhibition? ................ 18
Distribution of Maps Message Score. Total and by Location ....................... 22 Percent of Respondents Giving a Correct or Partially Correct Response
to PoweroiMaps Message Scale. by Item and Survey Location ........ 24 Clustering Diagram for Maps Message Scale Items. All Respondents ...... 33
4.3A ............... 34 4.4 Clustering Diagram for Maps Message Score Items. NPG Respondents ... 33 4.4A MDS Solution for Maps Message Scale Items. NPG Respondents ........... 34 4.5 Clustering Diagram for Maps Message Scale Items. Cooper-Hewitt
Entrance Respondents .......................................................................... 35
-viii-
MDS Solution for Maps Message Scale Items. All Respondents

4.5A 4.6
4.6A
MDS Solution for Maps Message Scale Items. Cooper-Hewitt Entrance .... 36
MDS Solution for Maps Message Scale Items. Cooper-Hewitt Exit
Clustering Diagram for Maps Message Scale Items. Cooper-Hewitt Exit Respondents ......................................................................................... 36
........... 37
E.l Age Distribution of Visitors at NPG ............................................................. 69 E.2 Geographic Origins of Visitors at NPG ....................................................... 69 E.3 Educational Attainment of Visitors at NPG ................................................. 71 E.4 Occupational Distribution of Visitors at NPG .............................................. 72
-ix-

1. Backaround
I ntroduct ion
The Director's Statement by Dianne H. Pilgrim, Director, Cooper-Hewitt, National Museum of Design begins with the following paragraphs:
Cooper-Hewitt, National Museum of Design is dedicated to exploring how design has an impact on every aspect of our daily lives.
A goal of Cooper-Hewitt, National Museum of Design is to encourage people to think in new ways about ordinary objects, buildings, transportation systems, urban and regional plans -- those things we often take for granted. We hope to remind people that our world -- from objects to political systems -- is in the hands of a variety of designers and that their decisions have a major impact on all our lives. From the moment we awake, and in the course of the routine of our daily lives, design affects us personally. The Museum operates with the belief that with greater understanding, people will come to recognize themselves as designers in, their own right, become better consumers, and feel empowered to express their views and be more involved with the world around them.1
Part of the museum's efforts to restructure itself entail organizing exhibitions on design issues that affect everyone. Not limiting itself to its New York location, Cooper- Hewitt is planning to expand its reach through traveling exhibitions, focusing first on Washington, D.C. Another component will include establishing National Design Awards whose purpose will be to educate the public on the importance of design in every aspect of their daily lives. Other elements include an ambitious educational program, targeting inner city students in Manhattan and other parts of New York City, as well as continuing the graduate degree program in the History of Decorative Arts offered jointly with the Parsons School of Design.
In addition, the museum has embarked on a program to understand its various constituencies -- members of the Cooper-Hewitt Membership Programs, visitors to its exhibitions, and participants in its educational activities. The program has two key components: formal research studies undertaken in collaboration with the Institutional Studies Office (ISO) and training Cooper-Hewitt staff to undertake informal assessments and field testing of exhibition components as part of their activities. To date, the formal research has included a series of studies of the Summer Concert Series, a study of the Cooper-Hewitt Membership Program, this study of The Power of Maps exhibition, and a recently completed study of the Czech Cubism exhibition. The purpose of the concert studies was to assess the effectiveness of the series in attracting racially and ethnically diverse, non-traditional audiences to the museum in a celebration of their traditions, as well as to gauge the overall audience response to a cultural, as opposed to object- based, approach to design.* The membership study sought to provide information to
See Dianne H. Pilgrim, Director's Statement, Cooper-Hewitt, National Museum of Design, 1993.
See Z. D. Doering with the assistance of K. M. Lubell, Nueva York Tropical: Caribbean Design and Music. A Study of a Lecture and Concert Series at the Cooper-Hewitt Museum. Report 91-4. (Washington, D.C.: Smithsonian Institution, 1991); Z. D. Doering with the assistance of Adam Bickford, Ritual and Celebration: African Cultures in the New World. A Study of a Lecture and Concert Series at the Cooper-Hewitt Museum. Report 92-7. (Washington, D.C.: Smithsonian Institution, 1992); and A. Bickford and Z. D. Doering, De Generacidn A Generacidn: Mexico's Living
-1 -

senior management of the museum, especially its Membership Department, as it plans to expand its membership and to assess the programs, benefits and services it offers to its members in appreciation of their support of Cooper-Hewitt, National Museum of Design (C-H) and the Smithsonian Institution (SI)?
This study is quite different in nature. While still including an emphasis on the demographic and social characteristics of visitors to the Power of Maps exhibition, our goals were more ambitious: the primary focus was on the experience of visitors in the exhibition. The exhibition sought to demonstrate, through the use of panels and text labels, that "all maps -- whether rare or familiar, new or old, Western or non-western -- are more than simply guides to help you find your way. Like advertisements and other forms of graphic design, maps express particular viewpoints in support of specific interests. Depending on their function and purpose, all maps present information selectively, shaping our view of the world and our place in it."4 The study's key objective was to assess the extent to which visitors understood the exhibition's point of view and the extent to which they agreed with it.
The Study Desian
The study was designed to incorporate a general framework of how individuals make decisions to visit cultural institutions and specific exhibitions within them. As David R. Prince recently summarized audience selection,
In making a decision to visit, or not to visit, a museum, it is clear that at some point a choice between potential activities is made and acted upon by the individual concerned. This choice is made on the basis both of the information available and on how the person, broadly speaking, feels about the nature of the place as the focus of the proposed visit. Constantly at work in the activation of the choice process are two fundamental psychological elements that are individually more significant in their cumulative effect on behavior than either the purely physical constraints of mobility or access or the financial consideration of discretionary-spent income: a cognitive (knowledge, comprehensional) element of what the place/visit is, and an effective component that assigns a value to the understanding of the place/visit. These combine to produce an attitude towards the place/visit that may (or may not) motivate action to make a visit depending upon the specifics of the attitude thus synthesized. The resulting selection- attitude is by definition dynamic since a change in either of the base components will necessarily cause a revision. When a positive (in the sense used here, pro- visit) selection-attitude is strong enough to stimulate action, a visit to the institution is (along the lines of this theory) occasioned.5
Traditions. A Study of a 1992 Lecture and Concert Series at the Cooper-Hewitt Museum. Report 92- 10. (Washington, D.C.: Smithsonian Institution, 1992).
2. D. Doering and Adam Bickford, with the assistance of S. Smith and E. K. Ziebarth, A Description of Cooper-Hewitt Members. A Report based on the 1992 Cooper-Hewitt, National Museum of Design, Membership Survey. Report 93-3. (Washington, D. C.: Smithsonian Institution, 1992).
See Appendix A, Press Release, page 38.
David R. Prince, "Factors Influencing Museum Visits," Museum Management and Curatorship (1 990), 9, pages 149-168.
3
-2-

Prince goes on to argue that information is a core element in the attitude devel- opment process and that information itself is value-bound, since it is derived and assimilated from a wide range of sources each of which is assigned a value by the individual. For example, information and recommendations from family and friends are more likely to be positively viewed than information from media.
The individual's past experience with cultural institutions, or the subjects of specific exhibitions within them, clearly plays a crucial role in the decision making process. The role of past experience in both forming and directing new perceptions has also been studied in a variety of contexts. "One of the main outcomes as far as the current discussion is concerned is that the perceptual process, as driven by past experience, will tend towards consistency in behavior, particularly where the exercise of choice exists in the determination of that experience."6 This certainly suggests that leisure destinations are selected on the basis of psychological comfort, interest, and m ai nt ai n i ng behavioral con si ste ncy .
Certainly, structural (non-psychological) influences have a role in the decision to visit a specific museum or an exhibition. The location of a museum, cost of admission, museum hours, etc. all enter into the decision. In theory, certainly in the case of publicly supported cultural institutions, the potential visitorship is the entire population; yet, there is overwhelming evidence that actual visitors to museums are not representative of the population, since members of the middle class (however defined) constitute the majority of visitors.
In sum, a study to assess the extent to which visitors comprehended the message of The Power of Maps needed to consider their demographic and social characteristics, their prior experience with Cooper-Hewitt, and for those that made a decision to visit the exhibition (rather than the museum more generally) their sources of information and orientation to the general topic. A possible design for the study would have been to interview visitors after they viewed the exhibition (Exit Survey). Most objective information (e.g., background) does not change as a result of a visit. However, other objective and subjective information -- precisely what we want to measure if there is a cognitive or affective impact -- cannot accurately be collected "after the fact.'' Individuals' ability to accurately report retrospect ivelv about what they knew, thought or felt both before and afterviewing the exhibition leads us into the complexities of human behavior well beyond a short interview. A more credible design is to interview visitors both before and after viewing the exhibition. To avoid experimental effects, and since we are interested in aggregate rather than individual results, interviews can be conducted with different individuals at the two time points.
We decided to interview representative samples of visitors as they entered (Entrance Survey) and exited the museum (Exit Survey). Interviews conducted at the door to the museum, rather than at the exhibition entrance and exit would enable us to collect data from a representative sample of visitors to Cooper-Hewitt and further enable us to see if, among all visitors, some specific subset elected not to visit the exhibition at all. This design still needed to address, however, several additional concerns; i.e., the extent to which visitors to the exhibition were self-selected on the basis of topical interest in maps or had prior information about the exhibition's approach. In the extreme, a result which shows no difference in responses to exhibition-related questions between the Entrance and Exit surveys could be interpreted in one of two ways: that
6 David R. Prince, up cit., page 151.
-3-

visitors could have been "untouched" by the exhibition's messages or that the only visitors who came were those who had "accepted" the exhibition's messages before coming! Thus, in addition to conducting surveys at Cooper-Hewitt, we conducted a survey at the National Portrait Gallery (NPG Maps Survey) in Washington, D.C.
Based on prior research, we felt that visitors to NPG were likely to come from a population quite similar to that which visits Cooper-Hewitt and one which is likely to visit The Power of Maps in a Washington, D.C. venue. Given that discussions were underway to bring the exhibition to Washington, we interviewed at NPG using a questionnaire as similar as possible to the one used in New York.7
The Survev Desian8
We conducted surveys of visitors to Cooper-Hewitt between Wednesday, October 27 and Tuesday, November 17, 1992 and at the National Portrait Gallery between November 2 and November 14, 1992. The exhibition was at Cooper-Hewitt between October 6, 1992 and March 7, 1993. By scheduling the New York data collection for late October-early November, we hoped to approximate a "normal" visiting population. These dates were selected in order to exclude visitors who may have been specifically motivated by the initial press coverage, the holiday season or the realization that this exhibition was about to close. The NPG dates were selected for convenience, although they coincided with the opening of an NPG exhibition, In Pursuit of Fame: Rembrandt Peale 1 778- 1860.
Data collection took the form of personal interviews, conducted by trained museum staff, Institutional Studies Office staff, and paid interviewers, at three locations within the two museums. In New York, "entrance" interviews were conducted at the main entrance, at the top of the staircase; i.e., just after admission tickets are given to security personnel. Exit interviews were conducted between the present Museum Shop and the staircase leading to the second floor. This location ensured that we would intercept individuals who had seen the exhibition. In Washington, D.C., interviewing was conducted in the hall of the recent acquisitions area.
At Cooper-Hewitt, interviewing was conducted for six days of the week over a three-week period using three specific 90-minute time blocks each day. (The museum is closed on Mondays). We assumed that visitors to the museum during the periods in which interviewing was not conducted would be similar in their demographic characteristics to those of visitors in the building during interviewing hours. Two additional sessions were conducted on Tuesday nights when the museum is open past five o'clock and when admission is free. Data collected on Tuesday nights would allow us to determine if there were differences in the characteristics of those who came when there was no admission being charged and those who paid an admission fee.9 Interviewing sessions were staggered so that it was almost impossible for a person to be intercepted both at the entrance and the exit interviewing points within the museum.
7 Both questionnaires, Le., the combined entrance/exit version administered in New York and the NPG version, are in Appendix C.
A more complete description of the survey design is in Appendix B.
Individuals who are members of the Cooper-Hewitt Membership Program or the Smithsonian Associates (formerly the Smithsonian National Associate Program) have as one of their benefits free admission to the Cooper-Hewitt.
8
-4-

The NPG schedule was somewhat simpler, with three interviewing sessions being conducted over seven consecutive days?
Using a sampling method developed for a large-scale survey, interviewers intercepted individuals, administered the questionnaire, and thanked the participants with a booklet on the collection (Cooper-Hewitt) or special postcard (NPG). If the intercepted person turned out to be an employee, an interview was not conducted. If it was a child too young to be interviewed, the accompanying adult was asked to provide selected demographic information for the child. Completely excluded from our study were visits to the museums on the part of school groups. However, individuals who may have wandered away from the school group could have been intercepted.
The initial portion of the questionnaire, as reproduced in Appendix C, was de- signed to collect general information about the visit. Interviewers asked about the frequency of visits to the museums, the main reason for the visit that day, and who was with the respondent in the museum. We also wanted to understand the visitor's main sources of information about the exhibition. After establishing some rapport with the visitor, a series of questions about maps and, in New York, about the exhibition itself, were asked. The interview ended with a set of questions requesting standard demo- graphic characteristics, as asked in IS0 studies over the past several years: age, resi- dence, educational attainment, cultural/racial/ethnic identity, and gender. The final two questions dealt with financial support for exhibitions.
Overall, the data collection met our expectations. During the 18 survey days in New York, we estimate that approximately 4,482 individuals passed our survey locations during interviewing hours. From these, 91 5 individuals were selected for the survey or 900 excluding Smithsonian staff, contractors, or those who had professional appointments (about 1.0 percent of the intercepts). Overall, a response rate of 84.4 percent was achieved. In Washington, D.C., a total of 1,166 people passed the survey location during interviewing hours. From these, 31 4 individuals were selected for the survey; 296 excluding employees. Here, 92.6 percent completed interviews. As discussed in Appendix B, an analysis of the characteristics of respondents and non- respondents showed that the overall impact of response bias is minimal.
Analvsis Framework
The exhibition, The Power of Maps, aimed to change the way visitors think about one of the most common phenomenon of their culture. It is commonly assumed by most Americans that maps are objective, scientific documents that provide reliable information about place. Further, to most map users the particular information that is included on a map and the manner in which it is presented are no more than the natural outcome of the map's function or purpose. The Power of Maps set out to directly challenge this position. The exhibition has a stark message: "Maps are useful, but never neutral." And the exhibition team had an intention: to change visitors' attitudes about maps. The response to the exhibit would be something like, "I never thought about maps that way before, and I'll never think of them the same way again."
Although the exhibition contains maps in many media from a wide range of historical periods and cultures, its aim is quite different from most previous surveys of the subject. It is not a history of maps, nor simply an engaging display of interesting, unusual maps. It is fundamentally an act of communication and persuasion. As such, it
A schedule for each location is in Appendix C. -5-

openly states its point of view and invites visitors to challenge it and to disagree, if they wish. It says, "Here is what we think and why. How do you feel about it?"
Since the message and its persuasiveness are heavily dependent upon text in the exhibition itself, the exhibition team realized that many visitors would miss the mes- sage, and even many of those who got it would not be convinced. In order to maximize the communication, the exhibition was constructed to present and demonstrate the message repeatedly in different ways, using a range of techniques and language. The fundamental structure consists of a narrative-like sequence that leads visitors through the argument in stages, each presented in a separate space. But within individual spaces the basic point was repeated both literally, on the room's central information text, and metaphorically through labeling, grouping, and methods of comparison.
Problems of evaluation were considered from a relatively early stage in the development process. It was recognized that the exhibition's success needed to be measured in two respects: what proportion of visitors got the message, and how many changed their view of maps as a result of the exhibition.
Addressing the evaluation problem had several unintended benefits for the exhibition team. As one person wrote:
Most of all it [evaluation planning] required the exhibition team to state the exhibition's essential message in a simple, direct, unequivocal form. Secondly, it required an articulation of precisely what perceptions or ideas were expected to change for visitors. Thirdly, it kept the exhibition team focused on the effectiveness of communication as the central goal. Without the measurable goals provided by evaluation, exhibition aims would probably have been so vague and numerous that no particular idea would have stood out in the experience of most visitors.
Looking at The Power of Maps as an act of communication, initiated by the exhibition team and enjoyed by visitors, implies that the evaluation task has to focus on the effectiveness with which the basic message was (or was not) communicated to the public and the extent to which visitors reacted in the manner desired by the team. As already noted, this meant measuring what proportion of visitors got the message, and how many changed their view of maps as a result of the exhibition.
Report Contents
In addition to this Introduction, the report includes three sections. The next section describes the individuals who visited Cooper-Hewitt and compares the results to studies of other Smithsonian museums. This is followed by a discussion of individuals' experiences with Cooper-Hewitt, their reasons for visitation, and how they heard about the exhibition, as a context for analyzing The Power of Maps experience. The fourth section includes analyses of visitor perceptions and attitudes about maps, comparing data from the Entrance and Exit Cooper-Hewitt surveys and data collected at NPG. Supplementary technical materials, as well as a summary of the characteristics of visitors to NPG, are in appendices.
-6-

II. Visitors to the Cooper-Hewitt Museum: A Demoaraphic Profile
I nt roduct ion
Are certain age groups attracted to the Cooper-Hewitt Museum? Is the audience predominantly American or do many foreigners visit as well? Do more men visit than women? What are the occupations of visitors? In this section, we profile the visitors to Cooper-Hewitt and try to provide a context for our subsequent analysis of their reaction to the exhibition. We collected basic information from nearly all visitors; that is, everyone we approached and asked to participate, whether or not they finally were willing and able to spend time answering all our questions and those who saw the exhibition as well as those who did not. What follows then, is a profile of Cooper-Hewitt visitorship in the Fall of 1992.1
Demoaraphic Characteristics
Gender and Aae. During The Power of Maps exhibition women represented a majority (52.9%) of the population surveyed. This is consistent with a recent study completed at the Hirshhorn Museum and Sculpture Garden (HMSG). In that study women were also a majority of those surveyed (53.4?L0).~ Traditionally the ratio of men to women in Institutional Studies Office (BO) studies is approximately one to one. One such example is a study of the National Museum of American Art and the National Portrait Gallery where the gender composition was found to be 52.3% men and 47.7% women.3 Another example is the study conducted at the National Museum of Natural History where we found 50.8% of the visits were made by men, and 49.2% by women.4
On the next page, in Figure 2.1, is the age distribution of visitors to Cooper- Hewitt. Please keep in mind that the ages of young children were ascertained from their parents and that school groups were excluded from the study; thus, the age distribution underrepresents school age children. The number of young children, those 11 and younger, accounted for only 2.6% of the total. Those 65 years and older accounted for 8.5% of the total. The two largest age groups were those between the ages of 25 and 34 and those between the ages of 45 and 54, each of which comprised 24.9% of the total.
Table 0.2 , Appendix D shows the overall characteristics of the entire sample, including respondents and non-respondents. With the exception of educational attainment and occupation, the other demographic characteristics are available for both respondents and non-respondents. The data reported here represent results from both the Entrance Survey and the Exit Survey, as it is statistically appropriate to "pool" the data given our sample design.
See E.K. Ziebarth, Z.D. Doering, and A. Bickford, Appreciating Art: - A Study of Comparisons: An Exercise In Looking at the Hirshhorn Museum and Sculpture Garden. Report 92-2. (Washington, D.C.: Smithsonian Institution, 1992) p 4.
See E.K. Ziebarth and Z.D. Doering, Museum Images: a Study of the National Museum of American Art and the National Portrait Gallery. Report 91-1. (Washington, D.C.: Smithsonian Institution, 1991) P 5.
See C. L. Fronville, and Z.D. Doering, lnside Active Volcanoes: Kilauea and Mount Saint Helens. Report 90-2. (Washington, D.C.: Smithsonian Institution, 1990). Also, J.D. Pawlukiewicz, Z.D. Doering, and K. Paasch, Views from the Audience: Planning a New Exhibition on Human Evolution. Report 90-3. (Washington, D.C.: Smithsonian Institution, 1990).
-7-

Figure 2.1
Aae Distribution of Visitors. COOD . er-Hewitt Museu m
35-44 21.3%
25-34 24.9%
Visitors to Cooper Hewitt during The Power of Maps exhibition survey were somewhat older compared to those interviewed in other IS0 studies. Just over one third (34.8%) of the total audience was under the age of thirty-five. In the study conducted at the Hirshhorn over one-half of the audience was under the age of thirty five (53.0%).5 There was also a greater proportion of older visitors at Cooper-Hewitt. Almost twenty percent (19.2%) were over the age of 55. At the Hirshhorn the over 55 group comprised 15.2% of the total population.6 It may be that Cooper-Hewitt attracts an "older" audience that is more specialized in its interests as mirrored in the age distribution of the membership.7
Geoaraphic Oriains of Visits. During the study people from 35 states and seven foreign countries were interviewed. Further analysis, using Census defined classifications for the United States visitors, shows that over three-quarters (77.9%) are from the Northeast region of the United States (includes Mid Atlantic and New England
5 See E.K. Ziebarth, Z.D. Doering, and A. Bickford, Appreciating A&- A Study of Comparisons; An Exercise In Looking at the Hirshhorn Museum and Sculpture Garden. Report 92-2. (Washington, DC.: Smithsonian Institution, 1992) p 4.
See E.K. Ziebarth, Z.D. Doering, and A. Bickford, Appreciating Art - A Study of Comparisons: An Exercise In Looking at the Hirshhorn Museum and Sculpfure Garden. Report 92-2. (Washington, DC.: Smithsonian Institution, 1992) p 4.
Overall, 40.6 percent of Cooper-Hewitt members are male and 59.4 percent are female. The median age of Cooper-Hewitt members is between 51 and 60 years old; 24.4 percent are between 51 -60 and 40.4 percent are 61 years old or older. See Z. D. Doering and Adam Bickford, with the assistance of S. Smith and E. K. Ziebarth, A Description of Cooper-Hewitf Members. A Report based on the 1992 Cooper-Hewitt, National Museum of Design, Membership Survey. Report 93-3. (Washington, D. C.: Smithsonian Institution, 1992).
6
7
-8-

Regions) . Less than ten percent were from the West or Midwest (8.2%). Visitors from the South and foreign countries made up the rest, 5.7% and 8.2% respectively.
For purposes of this study it is useful to think of visitors as 'local' and 'non-local.' 'Local visitors' are defined as people from New York City and the surrounding New York, New Jersey, and Connecticut suburbs. 'Non-local visitors' are from all other states in the United States outside the New York Metropolitan area, including the parts of New York, New Jersey, and Connecticut that are not contiguous to New York City, and all foreign countries. Local visitors were 68.5% of the total sample and non-locals from other U.S. locations were 23.3% of the total, with the remaining 8.2% from foreign countries. Figure 2.2 shows the detailed geographic origins of visitors.
Figure 2.2
Geoa raphic Oriains of COOP . er-Hewitt Visitors
NYC
* Does not include New York City or its suburbs
This geographic makeup is very different from that of the Smithsonian museums located on the National Mall in Washington, D.C. If we think only of comparing 'local' vs. 'non-local' visitors, we find that the Smithsonian museums in Washington attract a much larger 'non-local' group of visitors, although admittedly the New York Metropolitan Area includes a substantially larger potential visitor population. At the recent Hirshhorn study, local visitors were 25.9% of the total sample compared to 65.9% at Cooper-Hewitt.8 The study conducted at NMANNPG found that approximately one-third (32.5%) of the visitors were from the local area.9
The smaller percentages of 'local' visitors at the Smithsonian Washington museums is most likely to be the result of the Smithsonian's position as a national and international destination of tourists. Located downtown between the Capitol and the Washington Monument, with other major attractions nearby, it attracts millions of people
8 See E.K. Ziebarth, Z.D. Doering, and A. Bickford, Appreciating Art - A Study of Comparisons: An Exercise In Looking at the Hirshhorn Museum and Sculpture Garden. Report 92-2. (Washington, D.C.: Smithsonian Institution, 1992) p 5.
9 See E.K. Ziebarth and Z.D. Doering, Museum Images: a Study of the National Museum of American Art and the National Portrait Gallery. Report 91 -1. (Washington, D.C.: Smithsonian Institution, 1991) P 6.
-9-

annually. Cooper-Hewitt, located on East 91st Street near Central Park, is not easily encountered by visitors. The closest attractions to Cooper-Hewitt are the Guggenheim Museum and the Metropolitan Museum, both much larger museums with more general reputations. In contrast, Cooper-Hewitt's reputation is more specialized, and therefore is known mostly by people closer by. Indeed the largest segment of the population surveyed are those who live in Midtown Manhattan (34th to 96th Sts.), where Cooper- Hewitt is located. Almost one-fourth (22.4%) of the total sample were from Midtown Manhattan.
Figure 2.3 shows a breakdown of those who live in the New York Metropolitan Area. Over one-half (58.2%) of local visitors live on the Island of Manhattan (Lower Manhattan (33rd to Battery), Midtown, and Above 96th St.). New York City residents make up slightly less than half (48.8%) of all visitors. One-quarter of local visitors are from the suburbs; visitors from the suburbs account for eighteen percent of all visitors (combining local and non-local). Less than twenty percent of local visitors are from other parts of New York City, Le. Brooklyn, Queens, Bronx, Staten Island and NYC unspecified.
Figure 2.3
Residence Locations of New York Metrooolitan Area Visitors to Cooo . er-Hewiu
, Staten Island=l . I%
\ / NYC(unspecified)=l .O% I B ronx=2.2% Queens=4.0%
Aidtown=34 .O%
Lower Manhattan=l4.1%
NYSICTINJ Su burbs=27.0%
Cultural. Racial. and Ethnic Identification. Although the Smithsonian Institution has made a concerted effort to design exhibitions and programs that appeal to a more culturally diverse audience, the visitors to most of the museums are still predominantly Caucasian. At Cooper-Hewitt, 93.1 Yo of the total sample surveyed were Caucasian, 3.8% of the visitors identified themselves as Asian, 0.9% as African Americans, 0.1% as Native Americans, and the remaining 2.2% as Hispanics (See Figure 2.4).
-1 0-

Figure 2.4
RaciaVEthnic ComDosition of CooDe r Hewitt Museu m Visitor3
Asian=3.8% Other Minorities=3.2%
Caucasian=93.1%
Social Composition. The social composition of a visiting group may influence the interaction between the individuals and the museum exhibition. An individual visiting an exhibition alone, for whatever reason, may relate to the environment around him or her quite differently than an individual who comes with small children or another adult companion. The social composition can also provide clues into the perceived 'appropriateness' of art museums as places to visit. For example parents may not feel it appropriate to bring small children to an art museum compared to the National Air and Space Museum.
Figure 2.5, on the next page, shows the social composition of the visitors to the Cooper-Hewitt Museum during our survey. Approximately four-fifths of the audience at Cooper-Hewitt was adult; 81 .I Yo of the visits were made by only one or two adults. The total of adults increases to ninety percent (90.3%) when the category of several adultdfriends is included. Only 6.9% of the visitors to Cooper-Hewitt brought children and 2.8% came with organized groups. (Recall, however, that organized school groups were excluded from the survey.)
The group composition at Cooper-Hewitt was somewhat similar to that of the HMSG, although the latter was more multi-generational. During the HMSG survey period, two thirds (65.8%) of the visits were made by one or two adults with an additional 13.3% from the several adults category? In contrast with the Cooper-Hewitt audience, 16.4% of visitors to HMSG brought children. The audience at the HMSG seems to more closely resemble the audience at the NMANNPG in a survey done one year previously. During that survey period approximately three quarters (78.0%) of the visits were made by one or two adults and 14.5% were among the several adults or friends category. The audience at the NMANNPG was also similar to Cooper-Hewitt in that only 4.9% of visitors brought children.
10 See Comparisons p 8.
-1 1-

Figure 2.5
Social Composition of Visitors to the Coope r-Hewitt Museum.
Percent
40 35 30 25 20 15 10 5 0
Alone Several Children School Adults/ & Adults Groups & Friends Tours*
Two Adults
*Visitors who came with groups but were seeing the museum on their own.
Educational Attainment. Data on educational attainment, as an indirect measure of socio-economic status, can be easily collected in a museum setting. Education can also provide some indication of the probability of exposure to the arts. Figure 2.6 on the next page shows the educational attainment of Cooper-Hewitt visitors. Overall, four- fifths (82.4%) of the visits to the museum were made by people with at least a Bachelor's degree. One half (49.8%) had advanced degrees or some graduate education. When we examine the educational attainment of those 25 and over, i.e. those who can be assumed to have completed their formal education, 87.3% have at least a Bachelor's degree. When 'some college' is added, the proportion for those 25 and over increases to ninety five percent (95.6%).
The Smithsonian tends to draw a well educated audience as evidenced by various studies conducted by the ISO. In the previously mentioned study at NMWNPG, almost three fourths (73.2%) of visits were made by persons with at least a Bachelor's degree, and among those 25 and over the proportion of those with BNBS degrees increases.11 Similarly, in the HMSG study, 67% of visitors had at least a Bachelor's degree and among those twenty five and over 82.3% had at least a Bachelor's degree. This educational attainment is extremely high when compared to the educational attainment of the rest of the nation. The United States Census Bureau reports that only 20.3% of the adult population over the age Of twenty five has a bachelor's degree or more.12 However, this is consistent with data for arts audiences in the nation as a whole.13
11 See Z.D. Doering, E.K. Ziebarth, Museum Images, p. 9.
12 U.S. Bureau of the Census, Current Population Reports, Series p-20, No. 415 Educational Attainment in the United States: March 1984 to 1987, U.S. Government Printing Office, Washington, D.C., 1989.
l3 Data reported in John Robinson, et. al. 1987. Survev of Public Participation in the Arts: 1985 Volume 1, Project Report indicates that about 43 percent of visitors to art museums have at least a bachelor's degree.
-1 2-

Figure 2.6
Educational Attainment of Cooper-Hewitt Visitors, Total and Adults over 25 Years Old
Percent 50
40
30
20
10
0 HS Grad or Some BNBS SomeGrad MNMS/
Less College PhD/Prof
Occupation. Consistent with their high educational attainment, the majority of visitors are professionals in one capacity or another.14 Over one quarter (27.1 Yo) of our respondents were non-science professionals, i.e. attorneys, brokers, accountants, etc. Another 12.0% were professionals in the sciences, i.e., doctors or scientists. Approximately one-fifth (20.2%) identified themselves as professionals in the design or art world, and eleven percent (1 1.3%) said they were teachers at all levels, elementary through college. They remainder of the population were either in clerical occupations, writers, students, or not currently in the workforce (Figure 2.7).
Figure 2.7
Occupational Distribution of Cooper-Hewitt Visitors Percent 30 T 27.1
25
20
15
10
5
0 Prof: Prof: Prof: Teacher Prof: Clerical Student Not Writer Non- Science Art Design Working
Science
14 Retirees were asked what their previous professional or occupation had been and were classified accordingly. For example, a retired doctor was included in the science professional category.
-1 3-

Summary
Visitors, in approximately equal numbers of men and women, came to Cooper- Hewitt during The Power of Maps exhibition. The majority, 90.3%, were adults over the age of 25. About four-fifths of the visits were made by one or two adults (38.5 and 42.6%, respectively) and an additional 9.2% by several adults. Adults with children comprised 6.9% of the visits. The visiting public is extremely well educated: over four- fifths (82.4%) have at least a Bachelor's degree. Of those 25 years old or older, 87.3% have at least a Bachelor's degree, and 95.6% reported some college or more. Consistent with their high educational attainment, the majority of visitors report professional occupations. Visitors were predominately Caucasians (93.0%); Asians were 3.8% of the group, and the remaining 3.2% were comprised of African Americans, Hispanics, and Native Americans.
Residents of New York City constituted just over half (52.1 "/.) of the total number of visitors, while residents from the New York, New Jersey, and Connecticut suburbs were an additional sixteen percent; individuals from other parts of the country made 23.3% of the visits, while 8.2% were from foreign locations.
-1 4-

Ill. The Context of the Visit to The Power of Maps
I nt roduct ion 1
How many visitors were newcomers to the Cooper-Hewitt Museum? Why did people come to the museum? How did they hear about the exhibition? Did people visit as a result of an advertisement or newspaper review or did they come to see the museum in general? These and other features mold the social context of the museum visit. In this section, we discuss individuals' experiences with Cooper-Hewitt, their reasons for coming, and how they heard about The Power of Maps exhibition. We will also distinguish between local and non-local visitors to Cooper-Hewitt.
First Visit to Coo0 . er-Hewig
One of the initial questions we asked of respondents is whether or not they had previously visited Cooper-Hewitt. There was virtually no difference between those who had been to Cooper-Hewitt and those who had not (49.4% for those who had versus 50.6% for those who had not). This is comparable with data found at the Hirshhorn Museum and Sculpture Garden. In that study about half (49.8%) of the visitors surveyed were new to HMSG.2
Figure 3.1 below divides the visitorship into those who had never been to Cooper-Hewitt and, for those who had (repeat visitors), the time of last visit. A distinction is made in the figure between those who had been to the museum since The Power of Maps exhibition opened and those who had visited prior to that time but within
Figure 3.1
Time of Last Visit to Coo0 . er-Hewiu
4+ years= 6.7% 2-4 Yrs ago= 6.9%
1-2 Yrs ago= 9.8%
Since 10/8/92= 6.8%
Data in this section are based on completed interviews in both Entrance and Exit Surveys. Given the nature of the data and the sample design, it is appropriate to "pool" the data.
See E. K. Ziebarth, 2. D. Doering, and A. Bickford Appreciating Art, p. 12.
-1 5-

the last year. The exhibition opened October 8, 1992, and 6.8% visited Cooper-Hewitt again while the exhibition was on view. Since interviewing took place in late October- early November, the data suggest that a small portion of visitors were either very interested in viewing the exhibition again or come to the museum quite frequently.
Below (Figure 3.2) we show the difference between local and non-local visitors making a first or repeat visit to Cooper-Hewitt. As defined previously, 'local' includes New York City and the surrounding suburbs in Connecticut, New Jersey, and New York State. As can be seen, about one-third (38.0%) of local visitors were making a first visit and almost two-thirds were repeat visitors (62.0%). Among the non-local visitors nearly three-quarters (74.8%) were making their first visit to Cooper-Hewitt and the remainder were repeat visitors (25.2%).
Figure 3.2
First and Reeeat Visit: Local and Non-Local Visitor3
Percent 80.0 T 74.8
70.0
60.0
50.0
40.0
30.0
20.0
10.0
0.0
E3 Local
I Non-Local
First Time Repeat Visit
These data further reinforce our interpretation that Cooper-Hewitt is a museum that attracts a local dedicated visitor. [In the previous section we found that two thirds (68.5%) of all visitors to Cooper-Hewitt were from the New York Metropolitan Area. Indeed, within the New York area we find that one third of New York visitors are from Midtown Manhattan, where Cooper-Hewitt is located. In addition, over half of New York City visitors to Cooper-Hewitt are from the island of Manhattan (including Midtown, Lower Manhattan, and those above 96th street).]
Reaso n for Visitina Coope r-Hewiu
Visitors were also asked the primary reason for their visit. As we see from Figure 3.3 on the following page, almost two-thirds (63.2% ) of all visitors came to Cooper- Hewitt specifically to see The Power of Maps exhibition. Just over one-quarter (26.6%) of the visitors were making a general visit to the museum. The remaining individuals were at Cooper-Hewitt either to visit the museum shop (4.2%), for a building specific reason (4.0%), because of the free admission (0.7%) or because of a Guggenheim
-1 6-

related reason (1.2%), i.e. either they were in the area and it is near by or it was closed and they still wanted to visit a museum.3
Figure 3.3
Reason for Visit: All Visitors
The
General Visit
Power of Maps
26.6
0.0 10.0 20.0 30.0 40.0 50.0 60.0 70.0
As shown in Figure 3.4, local visitors were somewhat more likely to give "Seeing The Power of Maps exhibition" as the primary reason for their visit; nearly seven out of ten (67.8%) local visitors compared with half of the non-local visitors (49.0%). Understandably, non-local visitors were also more likely to be making a general visit than the local New York area visitors (38.0% vs. 21 .I Yo).
The data also contain some evidence that free admission on Tuesday nights may not be the primary draw for those who come in the evening. Among people intercepted during the two evening interviewing shifts on Tuesday nights, only seven percent stated their main reason for being at Cooper-Hewitt was the free admission. It may be because Tuesday evening is the only night of the week Cooper-Hewitt is open past five o'clock, people who work in Manhattan and live elsewhere find it a convenient time to visit.
Another characteristic which defines the visitorship, and which shows differences in reasons for visiting, is the relationship to the Smithsonian generally and Cooper- Hewitt specifically. Among all those interviewed, 5.3% are members of Cooper-Hewitt and 19.5% are members of the Smith~onian.~ In other words, one-fourth (24.8%) have a formal affiliation with the museum, directly or indirectly. Almost four-fifths (79.5%) of Cooper-Hewitt members visiting stated that they came to see The Power of Maps exhibition, compared to 62.8% of Smithsonian members and 62.3% of those who are not formally affiliated with either.
The Cooper-Hewitt is the closest museum to the Guggenheim Museum.
It should be noted that 90.5% of all Cooper-Hewitt members live within the Metropolitan New York area, compared to 62.0% of Smithsonian members who live within New York City or its suburbs.
-1 7-

Figure 3.4
Reaso n for Visit: Local and Non-Local Visitor3
Percent
70.0
60.0
50.0
40.0
30.0
20.0
10.0
0.0
68.4 -
See Power Museum Building Free General Guggenheim of Maps Shop Reason Admision
Non-Local I Local I 1
As shown in Figure 3.5, almost one-third of all respondents who had heard about the exhibition prior to entering the museum had learned about it from the newspapers; among those who knew of the exhibition from a newspaper nearly all (95.4%) heard about it from the New York Times. Nearly one quarter (24.4%) heard about the exhibition from friends or family and presumably received a favorable recommendation.
Figure 3.5
Where did vou first hear about The Power of Maps e xhi bition?
N / R ad io
Other
Museum Calendar
Sign on Fifth Avenue
Magazines
Family/Friends
Newspapers
0.0 5.0 10.0 15.0 20.0 25.0 30.0 35.0 Percent
-1 8-

Overall, one of the less frequent sources of information about The Power of Maps exhibition was Cooper-Hewitt calendar, as it is mailed only to the membership and as indicated above only 5.3% of the visitors were members. The calendar is, however, a primary information source for members; 58.7% of members learned of the exhibition through the calendar. Among Smithsonian members, 30.4% learned of the exhibition through family or friends and 27.8% learned through the newspaper. Among those who were members of neither, 33.2% heard of The Power of Maps exhibition through the newspaper.
Among adults who completed the interview, we found that 49.4% had been to Cooper-Hewitt previously and 50.6% were visiting for the first time. About one-quarter (26.0%) of the total had been to the museum within the last year. Among visitors from New York City and the suburbs, about one-third (38.0%) were making a first visit and almost two-thirds were repeat visitors (62.0%). Among the non-local visitors, nearly three-quarters (74.8%) were making their first visit to Cooper-Hewitt museum and the remainder were repeat visitors (25.2%).
Almost two-thirds (63.2%) of all visitors came to Cooper-Hewitt specifically to see The Power of Maps exhibition. Just over one-quarter (26.6%) of the visitors were making a general visit to the museum. The remaining 10.2% of individuals were at Cooper-Hewitt for other reasons (e.g., shopping).
Among all those interviewed, 5.3% are members of Cooper-Hewitt and 19.5% are members of the Smithsonian. Almost four-fifths (79.5%) of Cooper-Hewitt members visiting stated that they came to see The Power of Maps exhibition, compared to 62.8% of Smithsonian members and 62.3% of those who are not formally affiliated with either.
Almost one-third (31 .O%) of all respondents who had heard about the exhibition prior to entering the museum had learned about it from the newspapers and another 16.1% from magazine reviews; among those who knew of the exhibition from a newspaper nearly all (95.4%) heard about it from the New York Times. Nearly one- quarter (24.4%) heard about the exhibition from friends or family and presumably received a favorable recommendation.
-1 9-
IV. The Effectiveness of The Power of Maps in Communicatina its Messaaes
1 nt roduct ion
As indicated above, assessing the extent to which the curatorial perspective on maps as interpretive objects was communicated to the exhibition's audience was one of the central analytic issues of this study. In an effort to do so, survey respondents were asked whether they agreed with a set of nine statements about the nature of maps or that compared maps to other commonplace objects. The curators identified, in advance of the study, responses they would expect from visitors who had perceived the exhibition's messages accurately or who shared their perspective. Based on these answers, a scale measuring agreement with the curatorial message was created and individuals were assigned scores. This section presents analyses of respondents' scores as a way to assess the exhibition's success in communicating the interpretive nature of maps. We also present results from a question about the artifacts in the exhibition asked only in the Cooper-Hewitt Exit Survey. These exiting respondents were asked, without reference to any of the exhibition messages, to identify which map, object or section in the exhibition they would tell a friend about. Finally, results from an open-ended question that asked respondents who had seen the exhibition to articulate its central message conclude this section of the report.
Maps Messaae Sca le
Recall that individuals were intercepted in three locations: in the lobby of the National Portrait Gallery in Washington D.C., as they entered The Power of Maps exhibition at Cooper-Hewitt, and as they exited the exhibition rooms on Cooper-Hewitt's first floor. This survey design allowed us to measure the opinions of people who were not aware of the exhibition or who had not considered the subject of maps prior to the interview (NPG respondents), people who had decided to visit Cooper-Hewitt and/or to view the exhibit but had not yet been exposed to the presentation (Entrance Survey sample), and people who had been exposed to the exhibition (Exit Survey sample). Our assumption was that the visitors at NPG would be least likely to agree with the curatorial interpretation compared to those who had experienced the exhibition. Those who entered Cooper-Hewitt would be more likely to agree, as many have already read materials about the exhibition or given the general topic of maps some thought. Finally, if the exhibition presentation was effective, those who saw the exhibition would be closest to the "desired" interpretation presented in the exhibition. By comparing each of these groups of respondents, we can investigate the effects of exposure to the exhibition materials on their opinions and assess the effectiveness of the exhibition in communicating its message.
The text of the Maps Message Scale items, along with the scoring criteria established by the exhibition staff, are listed in Table 4.1. In the table, the items are divided into several groups: Comparison of maps to other documents (train schedules, historic documents, newspaper editorials) and works of art (portrait paintings), the role of Intention in map making, and whether map making requires any specialized knowledge or Expertise. Responses agreeing with what the exhibition staff was trying to communicate received one point (1 .O); answers that were partially correct were given one-half a point (0.5). Those that failed to agree with the staff message were assigned a zero.
-20-

Table 4.1
Items and Desired Responses for Power of Maps Messaae Scale
Partially Correct Correct
Item1 Text Answer2 Answer3
Comparison 1. Practical
2. Historic
3. Editorial
4. Portrait
Intention
5. Maker's Interest
6. Many Purposes
7. Geography
Expertise
8. Expert
9. Science
I think maps are practical and objective, similar to train schedules.
I think maps are like historic documents, because they tell you how people thought at a particular time.
I think a map is somewhat like a newspaper editorial, because each of them represents a point of view.
think a map is somewhat like a portrait painting, because each of them reflects a particular point of view.
think every map is made to serve the interest of its makers.
I think a map might be made for one purpose, but end up being used later or elsewhere for a very different purpose.
I think maps accurately reflect geography.
I think only an expert can make a true map.
I think nowadays, map-makers choose the colors in maps according to scientific rules.
Disagree
Agree
Agree
Agree
Agree
Agree
Disagree
Disagree
Disagree
Mostly Disagree
Mostly Agree
Mostly Agree
Mostly Agree
Mostly Agree
Mostly Agree
Mostly Disagree
Mostly Disagree
Mostly Disagree
Item numbers are for reference only, they are not in this order on the questionnaire. Response given for a full point (1 .O) on the resulting score. Response given for half a point (0.5) on the resulting score.
-21-

Results. The Maps Message Scale scores have a possible range from zero (indicating that the respondent did not receive, or believe, any of the exhibition's messages) to nine points (indicating that the respondent received or is in agreement with all of the exhibition's messages). For all survey respondents (Cooper-Hewitt and NPG combined), the mean score was 4.31 (with a standard deviation of 3.28 points). This indicates that for the 1,009 adults who completed interviews at all three locations, the average respondent answered slightly more than four of the items in the way the ex hi bit designers desi red.1
When the score is calculated for the three different sites separately, a much more interesting picture emerges. For respondents from the National Portrait Gallery the mean score was 3.85 (k2.95); for respondents intercepted before entering the exhibition in New York the mean score was 4.26 (+ 3.26); and for respondents intercepted as they left the exhibition the mean score was 4.74 (k 3.36). These differences are statistically, as well as substantively, significant. The complete distribution of scores, for the total and for each of the three sites, is shown in Figure 4.1.
Figure 4.1
Distribution of Maps Messaae Score. Total and bv Location
All Respondents
Mean = 4.3 N=lOO9
SD= 3.3
National Portrait Gallery Respondents
Mean = 3.9 N = 271
SD = 2.9
Cooper-Hewitt Entrance Respondents
Mean = 4.3 N = 390
SD = 3.3
Cooper-Hewitt Exit Respondents
Mean = 4.7 N = 348
SD = 3.4 0 1 2 3 4 5 6 7 8 9
Maps Message Score
This is not strictly accurate, given the scoring system of 1 .O (Correct) and 0.5 (Partially Correct).
-22-

The overall trend of mean scores by interview locations indicate both communication and persuasion effects, i.e., that the message of the exhibition was effectively communicated to the audience, beyond what they brought with them to the exhibition from previous experience or reading and hearing about the exhibition, and that they accepted it. Between respondents from NPG, who had no exposure to The Power of Maps exhibition, and respondents intercepted after viewing the exhibition, the mean score increased by nearly a full point (0.91 points). The differences between the mean score at NPG and those people intercepted before they entered the Cooper- Hewitt exhibition hall was nearly half a point (0.44). Viewing the exhibition increases the mean score by another half point, or 0.47 points, when we compare Entrance Survey and Exit Survey scores.
Those people who had no exposure or current inclination to view the Power of Maps exhibit had the lowest scores (NPG). People who had decided to view the exhibition had higher scores (Entrance Survey), indicating some appreciation for the exhibition themes, or at least some thought about the issues that the exhibition raised. People who had seen the exhibition had even higher scores, suggesting that they were persuaded by the exhibition's presentation (Exit Survey). In other words, the exhibition's message had been communicated (as measured by the average scale score) and accepted.
Beyond looking at the aggregate scores, we find significant differences between each location for eight out of the nine individual items in the scale, as shown on the next page in Figure 4.2 and Table 4.2.2 The exception was the statement that, "A map might be made for one purpose, but end up being used later or elsewhere for a very different purpose." Almost all respondents, at all survey locations, agreed with the statement. In the case of all other items, the results clearly show an increase in the percent giving a Correct or Partially Correct response between the NPG location, the Cooper-Hewitt Entrance Survey and the Cooper-Hewitt Exit Survey.
The last three columns of Table 4.2 show the percentage increase between the NPG respondents and the respondents intercepted at the Cooper Hewitt entrance, the people entering and exiting the exhibition, and the NPG interviewees and those who saw the exhibition. The percentage increases are consistent with shifts which result from reading about and, more importantly, from key points made in the exhibition. For example, "Practical," "Historic," and "Geography" show the largest percentage increase in accepting the curatorial perspective between those who did not see the exhibition (NPG) and those who either read and heard about or saw The Power of Maps (items 1, 2 and 7 in Table 4.1) . Similarly, "Practical," "Maker's Interest, "Geography," and "Science" show the largest increases between entering and exiting visitors at Cooper- Hewitt (items 1, 5, 7, and 9 in Table 4.1). The concepts captured in agreeing with "Maker's Interest" (interpretive) and disagreeing with "Science" (objective) are major points made by the exhibition alone.
In both Figure 4.2 and Table 4.2, we have combined the percent of respondents giving a Correct or Partially Correct response for each item by survey location. The disaggregated data are in Table D.5, Appendix D.
-23-

Figure 4.2
Percent of ResPonde nts Givina a Cor rect or Partially Correct Respo nse to Power of Ma.ps Messaae Sca le. bv He m and Su rvev Locat ion
Percent
100
70
60
50
40
30
20
10
0
Nm
C-H Entrance
C-H Exit
Table 4.2
Percent of Respo ndents Givina a Co rrect or Partiallv Correct Respo nse to Power of Maps Messaae Scale and Percentaae Increase. bv Item and Survev Location
Correct and Partially Correct Percentage Increase Cooper- Hewitt
Item* NPG Entrance Exit NPG** Entrance NPG to Entrance to Exit to Exit
Practical 12.4 20.1 28.3 62.1 40.8 128.2 Historic 49.2 96.7 97.9 96.5 1.2 99.0 Editorial 64.0 73.5 80.2 14.8 9.1 25.3 Portrait 75.9 80.9 85.2 6.6 5.3 12.3 Maker's Interest 52.7 57.6 68.7 9.3 19.3 30.4
Geography 13.6 25.5 32.5 87.5 27.5 139.0
Science 42.2 45.9 57.0 8.8 24.2 35.1 *See Table 4.1 for complete wording. ** Following standard convention, change is calculated with the first named point as reference. In this case, for "Practical," ((20.1-12.4/12.4)= 62.1.
Many Purposes 91.3 93.1 93.2 2.0 0.1 2.1
Expert 49.2 52.8 59.6 7.3 12.9 21 .I
-24-

Given these differences in scores among the various interview sites, it is reasonable to ask if the background characteristics of individual respondents influence their overall scores. For example, are differences in scores attributable to differences in the demographic composition of visitors intercepted at the two museums? To explore this possibility, we used multiple regression analysis as an analytic tooI.3 The Maps Scale Score was regressed on a number of visitor characteristics: gender, age, raciaVethnic identification, respondent education, respondent occupation, the number of information sources for the Power of Maps exhibition, and respondent's interview location. The results of the final regression model, presented in Table 4.2, show that differences in scores are not due to the different demographic characteristics of respondents. Rather, a respondent's score was best predicted by three factors: the respondent's occupation, the number of information sources from which the respondent heard about the exhibition, and the visitor's experience in the exhibition itself. The coefficients in Table 4.3 support the idea that exposure to the exhibition materials, including publications, press materials, etc., influenced visitor opinion in the ways hoped for by the exhibition designers. (The details of the regression models are in Table F.1, Appendix F).
Among these three predictive factors, the strongest effect is due to the respondent's occupation. Persons with "artistic" occupations (Artists, Designers, Teachers), as opposed to all other respondents, had significantly higher scores.4 On the average, being an artist increased respondent scores by 0.7 points. This is followed by the effect of seeing the exhibition (i.e., being among the respondents who were intercepted as they exited the exhibition). On the average, having seen the exhibition increased respondent scores by 0.5 points. Finally, respondents increased their score
3 Regression analysis is a technique for explaining the variation of one variable (or outcome) in a dataset in terms of the variation of other explanatory factors. Typically, the variable whose variation is to be explained is called the dependent variable and the variables used to explain this variation are called the independent variables. The most common type of regression model is called a linear regression model because it exploits the key property of a straight line, a constant amount of change in the value of the dependent variable for each one-unit change in value of an independent variable. This amount of explanatory change or causal effect is presented as a summary statistic, the regression coefficient.
For example, suppose we were trying to explain differences in the amount of money visitors to a museum shop spent in terms of the number of minutes they browsed. The dependent variable is the amount of money people spent in the shop and the independent variable is the number of minutes they spent in the shop. If the regression model produced a coefficient of 2.5 for the independent variable, one would conclude that for each additional minute a visitor browsed in a museum shop (a one-unit change in the independent variable) their expenditure would increase by $2.50 (the specified amount of change in the dependent variable). So, because this estimate of change is constant, we would expect someone who spent two minutes in a shop to spend $2.50 more than a person who spent one minute, a person who spent ten minutes $25.00 more, and so on. [Technically, there is another term in the regression equation called the intercept which refers to the mean amount of money someone would spend if they didn't browse at all. Since in this example everyone browses, the intercept is not zero.]
Regression results allow us to interpret the simultaneous effects of any number of independent variables on the variation of a dependent variable. These models are used frequently in statistical analysis because they are simple to interpret, and the mathematical calculations yield reliable results (as defined by specified confidence intervals) over a wide range of data and analysis situations.
For a discussion of the occupations of visitors, see Section I I .
-25-

by 0.3 points above the sample average of 4.31 for each additional source of information about the exhibition .
Table 4.3
Final Rearession Model for Power of Maps Messaae Scale1
Standardized Variable Coefficient Coefficient
Intercept 3.663** Arts Professional 0.738** Exit Interview 0.509** Number of information sources 0.342** from which the respondent heard about The Power of Maps
0.000 0.196 0.142 0.125
R2 0.083
Details of the complete model, including variable definitions are in Appendix F. ** Coefficient significant at the 0.0001 level.
The Confiauration of Maos Messaae Sca le Sco re Values
To complement the analysis of the Maps Messages Scale Scores, we analyzed the internal consistency of the nine individual responses. If the exhibition was truly successful in communicating its message, one would expect that items dealing with the same general subjects would be highly correlated; Le., respondents answer similar items in the same way. We measured the internal consistency of sets of responses using the statistical technique "cluster analysis." The details of the analysis, together with the resultant graphic presentations, are discussed at the end of this section as a "Technical Note." Here we summarize and discuss the results.
Overall, the results of the cluster analysis show that respondents believe maps are either interpretive and historically specific or practical and scientific. Included as interpretive and historically specific are items "Editorial," "Portrait", and "Maker's Interest" (items 3, 4 and 5 in Table 4.1) which tap the interpretive qualities and items "Historic" and "Many Purposes" (items 2 and 6 in Table 4.1) which address historically specific. The second main theme, practical and scientific, includes "Practical" and "Geography" as practical (items 1 and 7 in Table 4.1) and "Expert" and "Science" (items 8 and 9 in Table 4.1) as scientific.
The results also show, more importantly, clear differences between sites:
-- At NPG, respondents did not answer the individual items in a way that indicated consistent differentiation between the subgroups identified above.
-- At Cooper-Hewitt, respondents interviewed in the Entrance Survey responded in a way which shows some consistency between the interpretive and historically specific items. The practical items were considered as somewhat independent from the scientific items.
-26-

-- At Cooper-Hewitt, respondents interviewed in the Exit Survey clearly differentiated between interpretive and historically specific scale items and practical and scientific scale items. This pattern is consistent with the message of the exhibition and reflects the expected progress of a "learning curve."
We interpret the results of the cluster analysis as showing a sequence akin to a learning curve; i.e., recognizing conceptual differences that accompany changed perceptions. We see movement in the results from NPG visitors to the Cooper-Hewitt Exit Survey respondents from minimal differentiation of maps as objective and interpretive objects to distinct differentiation. Those Cooper-Hewitt visitors interviewed before seeing the exhibition had apparently considered the issues addressed by the exhibition, but were either not convinced of the divergent roles of maps or had mixed feelings either because of their backgrounds or materials they had read. Finally, those visitors interviewed after seeing the exhibition made a clear differentiation between the objective and interpretive nature of maps.
If we combine this finding with the previous discussion of the aggregate scale scores, recalling that respondents interviewed after exiting the exhibition scored a full point higher than respondents interviewed at NPG, we must conclude that the presentation of the Maps exhibition was successful in communicating its message and changing the way visitors thought about maps.
Exhibition-Specific Questions
After responding to the Maps Message Scale, respondents in the Cooper-Hewitt Exit Survey were asked two additional exhibition-specific questions. First, almost as an introduction, they were asked "Which map, object or section in the exhibition would you tell a friend about? Why?" (Q.8, Appendix C). The responses to this question, not unexpectedly, ranged from "Everything, it was all wonderful" to the identification of a specific map with the comment that the individual had read about it in a review article. Our experience has shown that most people, especially at the moment of leaving an exhibition, have a difficult time describing or naming specific artifacts that are not familiar to them. In addition, so as not to convey an impression of "testing," interviewers were trained not to probe and to accept almost all answers. Consulting with the exhibition staff led us to develop a coding scheme for the open-ended replies. The codes capture both the exhibition section to which the respondent makes reference and categories of objects within a section. Table 4.4 below shows the two distributions of replies.
Looking first at exhibition sections, note that 40.6% of the respondents made no reference to a specific exhibition section or room in their replies.5 An additional 10.9% enthusiastically indicated that everything was worth seeing, while a small group (4.9%) indicated they would not identify anything special to a friend. The remaining 43.8% mentioned specific sections, with almost a fourth (or 12.2 of the total) mentioning the North Carolina room. When specific maps or objects were mentioned, they tended to be primarily historic maps of Western origins (28.1% of the total), followed by world maps and globes (1 6.1 Yo). Here we find that about one-fourth (21.3%) of visitors did not mention a specific object or map.
A description of each of the exhibition sections is in Appendix A.
-27-

Table 4.4
Sections in the Exhibition or Objects Recommended bv Respondents
Percent Section* Description
1.7 1 6.8 2 1.3 3 7.4 4
12.2 5 9.9 6 4.5 7
40.6 10.9 - 4 7 100.0
28.1 3.4
16.1 6.7 8.9
21.3 10.9 4.7
One world ... So many maps (Introductory galleries) Which way is up? (Globe room) Whose world is this? (Cultural maps room) Whose map is this? (Historic maps/Dining room) Whose agenda ... glove compartment? (North Carolina room) Open the map! (Local/regional/NY/AIDS map room) Use the map! (Computer mapping room/Upstairs) No room or section mentioned Everything Nothing special
Tvpe of Map/Object
Historic maps/old maps Imaginary mapdartistic maps World mapdglobes Non-western maps/cuItural object maps Videohnteractive maps No mention of specific object Everything Nothing special
100.1 * See Appendix A, pages 40-41, for description of section contents
Given the data in Table 4.4, we can ask whether there is any relationship between the visitors' responses to this question and their score on the Maps Message Scale. The results of a special analysis show that there is a limited relationship between responses to this question and the score.6 Specifically, when we looked at the various response categories for specific maps or objects in Table 4.4 and scores, we found no relationships. Similarly, when we looked at all the categories for rooms in Table 4.4, we found no relationships. However, when respondents were classified into three groups: first, those who mentioned the North Carolina room; second, those who mentioned no specific room; and third, those who named a room/section other than the North Carolina room (Le. Sections 1-4, or 6 and 7), significant differences were found. Namely, those who named a specific room/section (other than North Carolina) had significantly different (lower) mean scale scores than those who either did not name a specific room/section or those who named the North Carolina room. Further, the small group of respondents who named North Carolina had the highest mean scores on the scale. The mean scores are shown here:
North Carolina (NC) room 5.75 (A 3.03) No specific room named 4.91 (k 3.1 1) Named room/section, exc. NC 4.42 (+ 3.56)
6 Analysis of variance results are on file in the Institutional Studies Off ice.
-28-

We would like to suggest that visitors who named specific rooms or sections, other than the North Carolina room, were attending or paying attention to more specific exhibition elements in those room (rather than the exhibition as a whole) compared to those who did not mention a specific room and were less attuned to the various aspects of the curatorial messages. In the case of the North Carolina room, it may be that its objects, maps and text articulated the curatorial messages so forcibly that visitors who attended to it closely were both in tune with and most persuaded by the curatorial message so as to get a high score on the Maps Message Scale.
Exhibit ion Messagl: . Above we presented an analysis of the Maps Message Scale, the primary analytic tool used in assessing the extent to which respondents concurred with the curatorial message. In addition, we also attempted to discern the extent to which respondents were able to articulate a central message in their own words. We first asked, "Do you think the exhibition has a central message?" (Question 9, Appendix C.) and further asked those who said "Yes," (83.1 Yo of exiting respondents) "What do you think that message is?" As shown in Table 4.5, half of the respondents who felt there was a central message (50.3%) were able to articulate it clearly to the interviewer. The others gave a response which was either neutral or inconsistent with the curatorial perspective.
Table 4.5
Respo nses to Or, . en-Ended Quest ion about t he Central Messaae o f The Power of Maps
Percent Description
Do you think the exhibition has a central message?
16.9 No 83.1 Yes
100.0 What do you think that message is?
Maps reflect a subjective point of view Maps serve the interest of their makers Maps are powerful objects in their multiple uses
(e.g., different cultures make different maps)
24.4 13.0 5.8 4.8 Maps are interpretive objects 2.3 Maps reflect different cultures
150.31 Sub- total
18.0 No n-evaluat ive statement (e.g., show what maps can do)
Maps are pretty/ interesting/ attractive Maps are useful/ important / reliable Maps show geography (Le., accurately reflect
No real answer/ can't articulate
6.9 Maps reflect changing history 4.1
14.1 0.2
6.5 the physical world)
100.1 Total
-29-

The results presented here from the open-ended questions are less clear than those from analyses based on the Maps Message Score. We believe that this is due to the structure of the interviewing. The respondents were interviewed at the end of their visit to the museum; many were in a hurry to leave the building for other appointments or plans. From the visitors perspective, responding to items in the Maps Message Scale was much simpler than articulating complete thoughts about recommendations to friends or central messages. Similarly, from the interviewers perspective, reading items in the Maps Message Scale, and waiting for and recording a response was simpler than recording open-ended responses. When these considerations are taken into account, we believe the results complement each other.
Sum marv
In an effort to assess the extent to which the curatorial perspective on maps as interpretive objects was communicated to the exhibition's audience, survey respondents were asked whether they agreed with a set of nine statements about the nature of maps or that compared maps to other commonplace objects. The Maps Message Scale scores have a possible range from zero (indicating that the respondent did not receive or believe any of the exhibition's messages) to nine points (indicating that the respondent received or was in agreement with all of the exhibition's messages). For respondents from the NPG the mean score was 3.85 (k2.95); for respondents intercepted before entering the ex ition in New York the mean score was 4.26 (k 3.26); and for respondents intercepted as they left the exhibition the mean score was 4.74 (+ 3.36). These differences are statistically, as well as substantively, significant.
We also find significant differences between each survey location for eight out of the nine individual items in the scale. The exception was the statement that "A map might be made for one purpose, but end up being used later or elsewhere for a very different purpose.'' Almost all respondents, at all survey locations, agreed with the statement. In the case of all other items, the results clearly show an increase in the percent giving a Correct or Partially Correct response between the NPG location, the Cooper-Hewitt Entrance Survey and the Cooper-Hewitt Exit Survey.
The results of the final regression model show that differences in scores are not due to the different demographic characteristics of respondents. Rather, a respondent's score was best predicted by three factors: the respondent's occupation, the respondent's experience in the exhibition itself, and the number of information sources from which the respondent heard about the exhibition. The results support the proposition that exposure to the exhibition materials, including publications, press materials, etc., influenced visitor opinion in the ways hoped for by the exhibition designers.
On the average, artistic occupations (Artist, Designer) increased respondent scores by 0.7 points, having seen the exhibition increased respondent scores by 0.5 points, and each additional source of information about the exhibition increased the respondents' score by 0.3 points above the sample average of 4.31.
We interpret the results of the cluster analysis to show a sequence akin to a learning curve. We see progress in the results from NPG visitors to the Cooper-Hewitt Exit Survey respondents in the differentiation between maps as objective and interpretive objects. Those Cooper-Hewitt visitors interviewed before seeing the
-30-

exhibition had apparently considered the issues addressed by the exhibition, but were either not convinced of the divergent roles of maps or had mixed feelings either from their backgrounds or from materials they had read. Finally, those visitors interviewed after seeing the exhibition made a clear differentiation between the objective and interpretive nature of maps -- one of the exhibition's central messages.
In their hypothetical recommendations to friends, 43.8% mentioned specific sections, with almost a fourth (or 12.2 of the total) mentio ng the North Carolina room; an additional 10.9% enthusiastically indicated that everything was worth seeing, while a small group (4.9%) indicated they would not identify anything special to a friend and the remainder did not mention a section. When specific maps or objects were mentioned, they tended to be primarily historic maps of Western origins (28.1% of the total), followed by world maps and globes (16.1%). Here we find that about one-fourth (21.3%) of visitors do not mention a specific object or map. We also find that the small group of respondents who named North Carolina (12.2%) had the highest mean scores on the scale, suggesting that this room was most effective in communicating the curatorial message.
If we combine the findings from the various analyses, recalling that respondents interviewed after exiting the exhibition scored a full point higher than respondents interviewed at NPG, we must conclude that the presentation of the Maps exhibition was successful in communicating its central message to the museum audience and changing the way visitors thought about maps.
-31-

Technical Note
Cluster Analvs is: The Confiauration of Maps Messaae Sca le Sco re Values
Cluster analysis is a statistical technique that classifies responses to questions into groups based on their differences, or "distances" from one another. The statistical procedure has several steps. First, all of the responses included in an analysis are correlated with one another. The set of correlations is called a distance matrix since one assumes that the responses to pairs of questions that are highly correlated (both positively and negatively) are close together, Le., are separated by small distances, and responses to those pairs of questions that are not highly correlated are far apart. Once the distance matrix is calculated, cluster analysis combines the pairs that are close together into groups, or clusters. Once all the close pairs of questions are grouped into clusters the distance matrix is calculated again, this time correlating the clusters (instead of the individual questions). Clusters that are close together are grouped into larger or "nested" clusters, and the process repeats itself until all of the responses to the original questions are combined into a single cluster.
Once the clustering is complete, one looks at the pattern of the grouping (called the agglomeration schedule ) to identify any underlying patterns among the different groups. Because the agglomeration schedule shows which questions were grouped together and when in the process those particular clusters were formed, one can identify similarities and differences among sets of responses to questions that are not apparent by looking at simple frequencies or individual correlations. Often, the ways questions are clustered together reveals some underlying concepts too complex to capture by a single question. Finding and interpreting such general concepts in a set of specific questions is one of the most common applications of cluster analysis.
Figures 4.3, 4.4, 4.5 and 4.6 present the agglomeration schedules for cluster analyses of the entire dataset and by each interview location. These diagrams show a clear configuration of scale items that are classified into two groups, one dealing with pbiective qua lities of maps and one dealing with interpretive qua lities of maps. Looking at the configuration for all respondents in Figure 4.3, we see that most respondents gave similar responses to questions about the interpretive qua lities of maps ("Editorial", "Portrait", and "Maker's Interest"), the historically specific nature of maps ("Historic" and "Many Purposes"), and the practical nature of maps ("Practical" and "Geography"). Finally, the last two items, which both deal with the process of map makinq ("Expert" and "Science"), are clustered with the practical group. Of these three main groups, only two are clustered together. Respondents clearly believe that maps are either interpretive and historically specific or they are practical and scientific. Again, we interpret this configuration as an indication of successful communication of the exhibition message.
When we look at the diagrams for each of the individual survey locations we clearly see the effect of actually viewing the exhibition. Respondents interviewed at NPG (Figure 4.4) do not clearly differentiate the divergent opinions about maps.-/ The items in the "practical" cluster are combined with items in the "historically specific" cluster, and the items in the "interpretive" cluster do not join with any other cluster until all items are combined into a single cluster at the end of the procedure.
-/ For a comparison of the NPG and Cooper-Hewitt survey populations, see Appendix E.
-32-

Respondents interviewed at Cooper-Hewitt before entering the exhibition (Figure 4.5) show some of the differentiation in Figure 4.3. The items in the practicalcluster are distinct from other clusters until one step before the end of the analysis, and the items in the historically specific cluster are closer to the interpretive cluster. This diagram reveals some consideration of the exhibition message, although the differences between the clusters are not entirely clear.
Figure 4.3
Clusterina Diaaram for Maps Messaae Sca le Items, All Respondents
DISTANCES 0.000 5.000
EXPERT
SCIENCE
GEOGRAPWY
PRACTICAL
HISTORIC
MANY PURPOSES
PORTRAIT
EDITORIAL
MAKER'S INTEREST
Figure 4.4
Clusterina - Diaaram - for Maps Messaae Sea le Items, National Portrait Gallerv Respo ndents
DISTANCES 0.000
HISTORIC
M A N Y PURPOSES I- PRACTICAL
5.000
1 GEOGRAPHY
EXPERT I
PORTRAIT
EDITORIAL
MAKER'S INTEREST
-33-

Figure 4.3A MDS So lution for Mao . s Messaae Sca le Items. All Respo n de n t ~8
1 .o
0.5
cu 0.0
-0.5
-1 .o
I I
I I -
-2 -1 0 1
Figure 4.4A. MDS Solution for Maos Messaae Sca le Items, NPG Respo ndents 9
1 .o
0.5
cu 0.0
-0.5
-1 .o
I
Science
Expert
itorial 1
Geography
I I I -2 -1 0 1
Dimension 1
Alternative presentation of Figure 4.3. Alternative presentation of Figure 4.4.
-34-

Figure 4.6, which uses data from the Cooper-Hewitt Exit Survey, replicates the configuration in Figure 4.3. These results show a clear differentiation between interpretive and historically specific scale items and practical and scientific scale items.
It is important to note that cluster analysis examines the relationship between respondents as well as groups or "clusters" of respondents as defined by the factors specified in the statistical procedure. It is not sensitive, however, to the size of membership of the respective "cluster" groups. That is, the internal consistency of responses may result in relatively small numerical groups. Hence, the assignment of "clusters" may not necessarily mirror the changes in respondents' cognitive processes; a small group of internally consistent scores may define the underlying MDS structure.
As stated in the text above, this series of diagrams clearly shows a progression akin to a thought process. Respondents at NPG, those who had no contact with Maps exhibition or who had not considered maps prior to the interview, did not fully differentiate between maps as objective and interpretive objects. Cooper-Hewitt visitors interviewed before seeing the exhibition had apparently considered the issues addressed by the exhibition, but were either not convinced of the divergent roles of maps or had mixed feelings either from their backgrounds or from materials they read. Finally, those visitors interviewed after seeing the exhibition made a clear differentiation between the objective and interpretive nature of maps.
Figure 4.5
Clusterina Diaaram for Maps Messaae Sca le Items, Coope r-Hewitt Entrance Respo ndents
0.000 EXPERT
SCIENCE I- GEOGRAPHY
PRACTICAL
HISTORIC
MANY PURPOSES
PORTRAIT I
EDITORIAL 'I
DISTANCES 4.000
MAKER' S INTEREST
-35-

Figure 4.6
Clusterina Diaaram for Maps Messaae Sca le Items, Cooper -Hewitt Exit Respo ndents
0.000 EXPERT
I SCIENCE
I GEOGRAPHY I
PRACTICAL -!-
MANY PURPOSES
HISTORIC
PORTRAIT
EDITORIAL
DISTANCES 5.000
MAKER' S INTEREST
Figure 4.5A
MDS Solution for Maps Messaae Scale Items, Cooper-Hewitt Entrancelo
1 .o
0.5
0.0
-0.5
-1 .o
I
I I I
-1 0 1
Dimension 1
l o Alternative presentation of Figure 4.5.
-36-

Figure 4.6A
N
MDS So lution for Maps Messaae Sca le Items, Cooper-Hewitt Exit1 1
1 .o
0.5
0.0
-0.5
-1 .o
Science . \
vlany Purpl
Makers Ir
Historic
!rest
I I I I -2 -1 0 1
Dimension 1
Alternative presentation of Figure 4.6.
-37-

25 -- IS 10’
The Power of Maps (:oolwr-Llewitt Tel: 212 860 6868 October 6, 1992 Ncitiorial Museuiri Fax: 212 860 6909 to March 7, 1993 of 1)esign
Appendix A Smithsonian Institution 2 East 91st Street
‘bescr ipt ive Mater i a1 s : The Power of Maps Exhibition
New York, NY 1012
For Release September 8,1992
Cooper-Hewitt National Museum of Design Presents
First Exhibition to Explore the Persuasive Power of Maps
From Ancient Mesopotamian Tablet to State-of-the-Art Computer Mapping Programs
THE POWER OF MAPS
On View Oct. 6,1992 - March 7,1993
Press Preview: Monday, Oct. 5,1992 10 a.m. - noon
NEW YORK -- Over 300 historic and contemporary maps dating from 1500 B.C. to the
present will be on view at Cooper-Hewitt, National Museum of Design, Smithsonian Institution, from
Oct. 6,1992, through March 7,1993. THE POWER OF MAPS is the first exhibition to examine the
significance of maps as instruments of communication, persuasion and authority.
THE POWER OF MAPS is made possible by a grant from American Express Company.
Major funding is also provided by the Smithsonian‘s Special Exhibition Fund. Additional
Supporters include Environmental Systems Research Institute, Inc. (ESRI) for the Computer Mapphg
Room, p d General Electric Foundation for educational programs. THE POWER OF MAPS is an
activity of the Smithsonian Quincentenary Program.
THE POWER OF MAPS demonstrates that all maps -- whether rare or familiar, old or new,
Westerp or non-Western -- are more than simply guides to help you find your way. Like
advertisements and other forms of graphic design, maps express particular viewpoints in support of
specific interests. Depending on their function and purpose, all maps present information selectively,
shaping our view of the world and our place in it.
According to Lucy Fellowes, co-curator of the exhibition, “Maps represent the world through
design, They put things in perspective. Powerfully and graphically, maps offer everyone the immediate
everience of seeing space. By showing the world drawn to scale, maps also remind us that everything
is relative.“
- 1~38-
1
SI-288-92 ‘I lua ~ ~ X l l l l ~ l t l l l l l Additional supporters 15 mddr pimdile Major funding is also pro- include Environmental Mapping Room, and
m IJY r( gririt fium vided by the Smithsonian’s Systems Research Institute, General Electric Foundation Anienc i n Expic-5” C:wnpm) Special Exhibition Fund. Inc. (ESRI) for the Computer for educational programs.

"Maps provide us with a powerful perspective on the world,'' said Roger Ballou, President of American
Express's Travel Services Group. "They can dramatize trends, communicate a point of view, even inspire a
journey. After viewing this extraordinary exhibition, I doubt anyone will look at a map in quite the same way."
THE POWER OF MAPS presents a wide variety of maps from around the world, ranging from a 1500
B.C. clay tablet from Mesopotamia and a 19th-century Sioux map, to a G-foot-diameter rotating globe and a
contemporary supercomputer map of the ozone hole over Antarctica. Highlights also include a 13th-century
world map on vellum; a 1513 map documenting the voyages of Columbus to the New World; a 1701 chart of
Earth's magnetic variations by Edmund Halley; a 1784 map from Capt. Cook's voyage to the Pacific Ocean; a
Native American star chart from the Pawnee tribe; a contemporary topographical map of the Great Sphinx in
Egypt; and a global "hotspots" map used to develop ecosystem conservation strategies.
THE POWER OF MAPS occupies Cooper-Hewitt's entire first ffoor and is divided into seven sections.
(See attached.)
THE POWER OF MAPS opens with an overview of the richness and variety of maps; subsequent
sections demonstrate how points of view are established in maps. The exhibition ends with maps that
communicate concern about crises of our times, including health care, water-shed pollution and biodiversity.
THE POWER OF M A P S also encourages audience participation with interactive computer stations set up for
visitors to work with state-of-the-art geographic information systems software.
The exhibition's curators are Lucy Fellowes of the Exhibitions Office, Cooper-Hewitt, and Denis
Wood, professor of design, School of Design, North Carolina State University. Exhibition design is by
Pentagram, an international design partnership.
THE POWER OF MAPS is accompanied by an educational program including lectures, seminars,
workshops and tours, as well as programs designed for schools, teachers and families.
A publication by co-curator Denis Wood, The Power of Maps, will be published by The Guilford Press
to coincide with the opening of the exhibition. The illustrated, 256-page, softcover book sells for $15.95. For
further information on the book, contact Rahel Crowley at The Guilford Press (212) 431-9800.
_I
-39-

THE POWER OF MAPS
THE SEVEN SECI'IONS OF THE EXHIBITION
Section 1. One worl &..So many maps
In the introductory galleries, visitors encounter maps from different places and periods, ranging from a 1500 B.C. plan of fields on a clay tablet from Nippur, Mesopotamia (present-day Iraq), to a contemporary supercomputer map of the omne hole over Antarctica. These maps differ widely in function. Some document exploration, such as a 1513 map charting the voyages of Columbus to the New World, and a 1784 map from Capt. Cook's voyage in search of the Northwest Passage. Others were used for navigation, such as a 16th- century sea chart of the Mediterranean. Still others relate to archaeology, such as a recent topographical map of the Great Sphinx. These maps span many cultures, from a 16th-century Italian globe to a Pawnee star chart.
section 2. which way is up?
Every map is designed to persuade us to share its perspective. The central feature in this room is a 6-foot- diameter rotating globe. Adjacent displays show how maps shape our view of the world by the way they show the Earth as flat, by what they put at the top and in the center, and by what they leave out. Richard Edes Harrison's 1944 painting "Eight Views of the World" makes clear how our perceptions are influenced by what map makers choose to place in the center. A computer-generated flight over Earth introduces the dynamic elements missing from static maps on paper.
Sedion 3. Whose world is this?
Every map takes the perspective of its time and place. What is considered a map depends on who its makers and users are. This section features maps from many cultures, including a 19th-century Sioux map, Pacific Islanders' stick charts, secret-society maps from central Africa and an Australian aboriginal painting that maps a "Dreaming." Also on view in this room is a sequence of signifcant Western world maps, representative of different periods, ranging from a 13th-century manuscript on vellum, and a 1482 hand-colored wood-block print of the known world, to a 1943 map of world air routes. The central feature of this room is a matrix of maps selected to highlight how mapmakers "create" world views. A contemporary American world map compiled from satellite data is compared and contrasted with a series of maps showing how basic choices of content, scale and color combine to present different but convincing images of the world.
section 4. Whose map is this?
A map belongs first to those who commission it. Once made, a map is available to others to use in different ways to serve their own interests. The maps presented in this room include a c. 1595 map of the around-the- vorld voyages of Sir Francis Drake and Thomas Cavendish; a 1773 British map consulted during the Treaty of Paris negotiations that ended the Revolutionary War; a map of the Pyramids from Napoleon's survey of Egypt; the original 1812 "Gerrymander" map of the Boston area; and a 1938 map of Robert Moses' New York projects. The central feature of this room is a study of maps for the area of Ringwood, NJ . Some of these maps were produced by the U. S. Geological Survey, an agency established in 1879 through legislation introduced by Rep. Abram S. Hewitt (1822-1902), whose daughters founded Cooper-Hewitt Museum. The USGS maps show Hewitt's properties, iron mines and place names reflecting his imprint on the land.
-40-

Section 5. Whase agenda is in your glove compartment?
Even the most ordinary map has hidden messages. Through illustrated commentary, Denis Wood, co-curator of this exhibition and a resident of North Carolina, shares his reading of a variety of maps from that state. Also included are license plates, postcards and souvenirs.
Section 6. Opem the map!
In this gallery visitors are encouraged to take the power of maps into their own hands by fmdmg out about maps commonly available from many sources. Case studies demonstrate how maps can be used effectively to address local, regional and global issues. Local mapping projects include a study of injury to children, commissioned by Cooper-Hewitt Museum with the Harlem Hospital Injury Prevention Program, and a cumulative survey of the incidence of AIDS in the Bronx. The Westchester Land Trust shows how regional maps are tools for protection of the Mianus River Watershed. Maps by Conservation International stress the global conflict between development and biodiversity. A feature of this section is a video of maps viewed and manipulated not on paper, but on computer. This sampling of contemporary mapping applications ranges from studying severe storms to simulating landscapes.
Sedion 7. Use the map!
In the Computer Mapping Room and the Map Resource Center, visitors can continue their exploration of maps by working with computer programs, atlases, books and periodicals.
FOR MORE INFORMATION, CONTACT:
Philippa Polskin/Betsy Ennis Arts 8c Communications Counselors (212) 593-6488/(212) 715-1540
Gwen Loeffler, Public Affairs Cooper-Hewit t National Museum of Design, Smithsonian Institution (212) 860-6894
-41-
Appendix B
Desian and Implementation of The Power of Maps Survev
I ntroduct ion
This appendix explains, in some detail, the design for The Power of Maps Study.' This study is one of a series conducted by the Institutional Studies Office to profile visitors to Smithsonian museums, increase our knowledge of the visit experience and provide information for future exhibition planning. Each of these studies has been tailored to the particular needs of the sponsor and the resources available for the study. In what follows, the questionnaire, the rationale for the sample design, and the survey's implementation and results are discussed.
In order to assess the extent to which visitors understood the exhibition's point of view and to capture a profile of visitors to Cooper-Hewitt, National Museum of Design, The Power of Maps Survey was based on personal interviews with respondents who were selected using a "continuous" systematic sample design. Depending on the time of day and day of the week, interviewers intercepted visitors who were identified through a special procedure developed for sampling a mobile population.2 They administered a short questionnaire, with both pre-coded and open- ended questions, to eligible respondents and thanked the participants with a booklet or postcard provided by the museum.
Data collection took place at two different venues, Cooper-Hewitt, in New York City (Cooper-Hewitt) where The Power of Maps exhibition took place, and the National Portrait Gallery (NPG) in Washington, D.C.; the latter served as a control group for comparison purposes. The data collection in New York was conducted from Wednesday, October 28 through Tuesday, November 17 and in Washington from Monday, November 2 to Saturday, November 14. In total, 18 days were spent interviewing at Cooper-Hewitt (the museum is closed on Mondays) and 7 days at NPG (where interviewing was conducted every other day). A systematic survey schedule was designed to encompass all of the public visitation days and hours. Smithsonian staff and contractors, as well as members of school groups making formal tours, were excluded from the study.
During the 18 survey days in New York, we estimate that approximately 3,358 individuals passed our interviewing locations during the hours in which interviewing was conducted. From these, 915 individuals were selected for the survey, including 15 employees who were not interviewed. In Washington, we estimate that 1,166 individuals passed the interviewing location in the NPG entrance area, 314 of whom were intercepted for interviews, including 18 employees excluded from the study. The
The reader of multiple IS0 publications will note that the structure of the methodological appendices, as well as some of the language used is quite similar. Using a basic description, we have made study specific changes and data.
The procedure and its rationale are described below.
-42-

Sample Selection Form is described and included in this appendix, and the survey schedules and questionnaires are shown in Appendix C.
A. Quest ion nai re Development
In Section I , we noted that the curators sought to demonstrate that depending on their function and purpose, all maps present information selectively, shaping our view of the world and our place in it. The study's key objective was to assess the extent to which visitors understood the exhibition's point of view and the extent to which they were influenced by it. A secondary objective was to capture a profile of visitors to Cooper-Hewitt. In New York City, we interviewed individuals at both the entrance to the museum and exit of the exhibition to determine if there was any difference between those who saw the exhibition and those who had not yet seen it, although many of those who had not seen it were planning to or had heard about it. As already noted, interviews were also conducted at NPG for comparison purposes. This entails different research objectives for the two surveys. At NPG, visitors were asked questions about maps, but unlike visitors at Cooper-Hewitt, they had neither seen or heard about the exhibition, and were assumed to be unaware of the exhibition's point of view.
The initial portion of the questionnaire, as reproduced in Appendix C, was designed to collect general information about the visit. Aside from asking the frequency of and the reason for the visit to the museum, we also wanted to understand the visitor's sources of information, if any, about the exhibition. After establishing some rapport with the visitor, we posed a series of nine statements about the various aspects of maps and asked the respondent to agree or disagree with each. (In New York, respondents who had seen the exhibition were asked additional exhibition-related questions). The interview ended with a set of standard IS0 demographic questions: age, educational attainment, cultural/racial/ethnic identity, gender, residence and who accompanied the respondent to the museum.
Maps Messaae Sca le Development. The issue of how to assess whether or not respondents' understood and shared the exhibition's point of view was the most challenging part of developing the questionnaire. As noted and elaborated below, our sample design allowed us to analytically determine the extent to which viewing the exhibition influenced or modified respondents' positions. After exploring several measurement options, the approach we settled on, one fairly common in the social sciences, was to develop a multiple item index or scale3. Respondents' were asked to indicate their level of agreement (Agree, Somewhat Agree, Somewhat Disagree and Disagree) with each of several statements. Each statement reflected a distinct theme or underlying dimension of the curatorial point of view.
The final nine items that were used (see Question 7, Appendix C) were the product of extensive pre-testing of several dozen items developed in conjunction with Cooper-Hewitt staff. Four items asked the respondent to compare maps to other documents (train schedules, historic documents, newspaper editorials) and works of art (portrait paintings). The remaining five items are not comparative in structure;
Many researchers use the terms "scale" and "index" interchangeably. In the most technical sense, we developed an "index" since items are not in a particular order and each item has the same weight or importance when a score is assigned.
-43-

rather, they are declarative statements. These items can be broadly divided into the categories of "intentions" in map making and whether map making requires any specialized knowledge or "expertise."
The development of the scale also included experimentation with the order of the items. That is, we tried not only different items but also different orders. The order used in the final questionnaire was decided on after examining the response patterns of several dozen respondents, both in New York and Washington, and interviewer feedback about respondent fatigue. In determining the final order of the items in the questionnaire, we sought to maximize the internal consistency of responses, while minimizing respondent fatigue and the respondents' feeling that they were being tested.
To allow for possible differences in item interpretation, responses received were scored one point (1.0) if they conformed to what the exhibition staff was trying to communicate, one-half a point (0.5) if they were partially correct and zero (0) if they were incorrect.
The questionnaire also includes a section for recording administrative information that is necessary for empirical analysis. This included the time, date and location of the interview, and the reason, if applicable, that an interview was not completed (e.g., Smithsonian employee).
Approximately 40 preliminary questionnaires were administered in both New York City and Washington, D.C. by Institutional Studies staff as part of questionnaire development. Interviewer training was conducted on Tuesday, October, 13 in New York and Friday, October 30 in Washington. All interviewers were trained by IS0 staff.
B. Sample Desian and Selection
Backaround. Selecting appropriate samples of museum visitors for study presents a multitude of problems. Museum visitors are "mobile populations" and cannot be sampled in the same way that members of households, students in classrooms, or other groups with known characteristics are selected for study. These members of the general public are in transit and, from the point of view of sample design, similar to shoppers in a mall, travelers in airports or users of public libraries. In all these cases, individuals can only be defined as a population because they are in a particular space at a particular time.4
With the exception of a long-term survey of the National Air and Space Museum (NASM), Institutional Studies Office surveys have employed a relatively simple systematic random sample design.5 First, each visitation day was divided into several equal time intervals. A schedule was then constructed which ensured, as guided by
This discussion is indebted to Graham Kalton, "Sampling Flows of Mobile Human Populations," in Proceedings of Statistics Canada Symposium 90 : Measurement and Improvement of Data Quality, October 1990. See Z. D. Doering, R. D. Manning and K. J. Black, The 7988 National Air and Space Museum Survey: Technical Documentation. Report 92-1 1. (Washington, D.C.: Smithsonian Institution, 1992).
-44-

resource constraints, that interviewing took place at least once within each time interval on each day of the week.6
Within the time intervals, selection of respondents is complicated by variation in visitor flow. Conventional wisdom and observation clearly indicate that visitor flow varies across time intervals (e.g., more visitors on Saturday afternoon than on Monday morning) and within an interval (e.g., different sized groups, single individuals, etc.). Further, our selection method is clearly influenced by a need to make full use of available resources (interviewers) while maintaining a probability sample within each time interval.
Our general approach has been to count visitors as they enter (or exit) the interviewing site, select visitors according to a predetermined sample selection interval (every nth person) for a systematic sample, and ask that person to complete an interview. Choosing the selection interval has to be done so that there is always an interviewer available to interview the next person selected. Clearly, if the interval is very large, this will always be the case. However, large intervals mean that interviewers will not be occupied for long periods of time, leading to inefficient use of resources and few completed interviews. If the interval is too small, interviewers cannot interview the selected respondents. Depending on the anticipated number of visitors, based on data from the Office of Protection Services and observations, we have tried to set selection intervals that optimize interviewer activity within any given time period.
To account for the fact that interviewers would sometimes not be available to interview the selected respondents, the person counting would also be required to record some basic facts about the "missed respondents." Clearly, however, this approach led to inefficiencies and possible sample bias. Further, since the selection interval was frequently changed at the beginning of different time intervals within a given study, statistical weights were needed in the final survey analysis.
A review of the results of many studies led the IS0 to conclude that a more efficient utilization of interviewers could be achieved by using a samplina strateav which called for "continuous interviewina." This strategy was first devised for the NASM Survey. Like the "fixed interval" methods, this approach entails using one person to count and one or two interviewers. However, the "sampling interval" varies according to on-site visitor flow and deta iled co ntextual data a re co llected which provide the bas is for weiahtina the final samples.
Within each time interval, the counter uses a mechanical counter and a stop watch to keep track of the number of persons entering or exiting (depending on the study) a particular location and maintains a record of the number of persons entering or exiting within small time segments (10 or 15 minute intervals). The counter also identifies the persons to be intercepted whenever an interviewer has completed one interview and is ready to begin the next. This method of selecting sample persons keeps the interviewers fully occupied. The counter is essentially incorporating a self- adjusting selection interval. (In the NASM Survey, during some hours the flow of visits
6 In more technical language, the sampling frame is a list of time interval/site primary sampling units (PSUs). Rather than select a sample of PSU's and then respondents within them, we attempt systematic coverage of all PSU's and then select respondents within PSU's.
-45-

was so slow so that approximately every l o t h exit was intercepted, while during several hours it was so heavy that every 350th was intercepted).
Counting and recording the number of individual visitors exiting or entering in small intervals (10 or 15 minutes) rather than recording a summary total per interviewing session ensures adequate controls for one possible source of bias; i.e., the unequal flow of people within a time segment. This means that each questionnaire can be statistically weighted with information from precise time intervals and we do not have to assume essentially equal visit flow patterns throughout the time interval. Indeed, examination of data shows quite different patterns at the beginning and end of selected time intervals. The procedures for actual respondent selection, maintenance of control data, and exclusion of persons not eligible for the study are described below.
C. Data Co I le ct i o n
Resource and other constraints restricted the data collection in New York to an 18 day period. Within each day, the schedule covered only 4.5 hours instead of the 7 hours in which the museum is open (excluding Tuesday nights when the museum is open until 9 PM). 7 At the Portrait Gallery, the interviewing sessions also covered only 4.5 hours out of a possible 7.5 hour day in a 7 day period. The combination of days and hours is approximately a 40% sample of hours at Cooper-Hewitt and a 20% sample at NPG. The actual schedule (shown at the end of this appendix) was designed to take into account various resource limitations as well as hypothesized variations in visitor types during different days of the week and times of the day. The basic approach was as follows:
Cooper Hewitt:
The museum's hours are shown below:
Monday Closed
Wednesday-Saturday Tuesday
Sunday
1O:OO AM - 9100 PM
12100 PM - 5100 PM 1O:OO AM - 500 PM
(a) Admission is charged at all times, except on Tuesday evenings between 5:OO PM and 9:00 PM.
(b) For survey purposes, we restricted data collection to the period between 10:30 AM and 4:OO PM during times when admission is charged and divided these hours into three interviewing segments of ninety minutes each: 10:30 AM - 12:OO PM, or the morning tourist crowd; 12:30 PM until 2:OO PM, the heavy lunch and post-luncheon phase; and 2:30 PM until 4:OO PM, the late afternoon group of visitors (on Sunday, only two interviewing segments were available). In addition, we added two interviewing segments 5:30-7:00 PM and 7:15-8:45 PM for the free admission period (Tuesday evenings).
The 4.5 hours are not continuous. A series of 5 specific 1.5 hour interviewing sessions were selected. Each day of interviewing never contained more than 3 sessions.
-46-

(c) In order to minimize the possibility of either counting (or intercepting) the same individual as they entered and exited the museum, the schedules for the entry and exit survey were established in such a way as to reduce the probability of that occurrence.
(d) These considerations led to scheduling two segments on Wednesday through Saturday, three on Tuesday, and one or two sessions on Sundays. The result was a total of 12-1 3 segments each week or 38 for the entire survey period.
National Portrait Gallerv:
The museum's hours are shown below:
Monday - Sunday 1O:OO AM - 5130 PM Admission fees are never charged.
(a) For survey purposes, we restricted data collection to the period between 11 :00 AM and 4:30 PM and divided these hours into six interviewing segments of ninety minutes each: 10:30 AM - 12:OO PM and 11:OO AM - 12:30 PM, or the morning tourist crowd; 12:30 PM - 2:OO PM and 1:OO PM until 2:30 PM, the heavy post-luncheon phase; and 2:30 - 4:OO and 3:OO - 4:30 PM, the late afternoon group of visitors.
(b) With resources for two time blocks per day and wanting to ensure coverage of each day of the week, we had 14 time blocks at our disposal to schedule. An extra session was added on the only Saturday in which interviewing was conducted.
(c) Unlike Cooper-Hewitt, respondents were interviewed at only one location within the building.
A detailed schedule for both Cooper-Hewitt and the National Portrait Gallery is provided in Appendix C.
Specific Field Instructions for Selectina Respondents
We have already discussed the rationale for "continuous sampling.'' Below we provide detailed instructions for selecting respondents using this approach, as implemented for The Power of Maps study. This approach uses an interviewing team composed of one person who counts and selects visitors and up to three interviewers. The counter is designated as the Team Leader. A team cannot rotate its members among the different roles (Team Leader or Interviewer) within an interviewing session.
Overall Approach.
The systematic, unbiased and orderly selection of respondents is the p m responsibility of the Team Leader. In order to provide the information necessary for other aspects of the study, the Team Leader is also responsible for recording the number of persons who enter ( ntrance Survey) or exit (Exit Survey) during the 15 minute intervals of each Session. Everyone, except those in escorted groups, is counted. The interviewers are responsible for intercepting and interviewing
-47-

respondents as well as recording an assigned Count Number and filling out the administrative information on each questionnaire.
In both survey locations, several staff members (one specifically assigned as Survey Coordinator to manage the fieldwork), paid interviewers and interns were trained to understand the goals of the study, the intended meaning of each question, and the proper way to fill out the questionnaire. Each interviewer also learned how to select respondents when designated as Team Leader, and how to collect specific information about individuals who refused or were not eligible to participate (IS0 staff or contractors). General interviewing instructions were based on a manual developed for another Smithsonian study; specific instructions were incorporated for this study!
The sample selection task is to be undertaken with the aid of a Sample Selection Form, a mechanical counter, and a watch. Counts of visitors are recorded on the Form by 15 minute intervals. An example of a Sample Selection Form is on the next page. In addition, when intercepts are made, the number on the mechanical counter ("Count Number") is recorded by both the Team Leader on the Sample Selection Form and by the interviewer on the questionnaire to be used.
The instructions are written so that they apply to both an Entrance Survey and an Exit Survey.
Specific Steps.
(1) The Team Leader fills out the administrative information at the top of the Sample Selection Form before the interviewing hour begins. The Session Number is the critical item of information at the top. This is done before the data collection begins. The names of Interviewer #1 and Interviewer #2 are also recorded. The team members set their watches to the same time.
(2) The two interviewers each have about ten to fifteen questionnaires on a clipboard. The Administrative Information at the end of each questionnaire is filled out, to the best of their knowledge at the time, on approximately eight of the questionnaires before the Session starts on .
(3) The Team Leader stands at a designated location near the entrance or exit at which interviewing is to take place. We assume a hypothetical line which separates the "entrance interviewing area" from the "museum area" or the "exit interviewing area" from the exhibition exit. These hypothetical lines are shown to interviewers.
(4) The counter is set at zero (0) at the start of the Session and two interviewers stand by, ready to begin. Counting starts from the person closest to the Team Leader. A Session always begins by interviewing the third and sixth persons who enter or exitg:
8 See Institutional Studies, A Manual for Interviewers. Prepared for the 1988 National Air and Space Survey. Report 88-3. (Washington, D. C. : Smithsonian Institution, 1988). Question-by-question specifications for this study are available from the Institutional Studies off ice. Starting with the 3rd and 6th visitors assures some spacing of interviews and that two individuals from a given social group will not be interviewed.
9
-48-

(a) A 03 is preprinted as the "Count Number" in the column marked "Interviewer #I on the Form.
(b) Interviewer #I also records 03 on the questionnaire to be used in the count number boxes (first page, upper right corner).
(c) A 06 is pre-printed in the column marked "Interviewer #2" on the Form.
(d) Interviewer #2 records 06 on the questionnaire to be used.
(e) If two people are crossing the line at the same time when the Team Leader is ready to identify the 3rd or 6th person, the closest person to the Team Leader is selected for interview.
(5) The Team Leader continues to count the flow of visitors.
(6) When either interviewer returns after completing an interview, and is readv to beain the next interview,the Team Leader identifies the next person to approach the line as the next respondent. The Team Leader notes the "Count Number" and records it on the Sample Selection Form under the interviewer's name. The interviewer also records the number on the next blank questionnaire and moves out to intercept the identified respondent.
(7) After 15 minutes, the Team Leader writes the number of visitors recorded on the counter ("Count Number") on the Form in the column titled "Count" for that 15 minute segment. The mechanical counter is re-set.
(8) The Team Leader continues to provide "Count Numbers" every time interviewers indicate that they are ready to "intercept." The interviewer always writes down a "Count Number" on the next blank questionnaire. There is only one exception when the interviewer does not intercept the next person approaching the line. The exception is described below.
(9) If the next person approaching the line is a child that is part of an escorted school aroup or an adult in a clearlv led tour aroup, he/she is not to be interviewed.10
(a) The Team Leader, at this point stops cou nting, writes a "G" in the column marked Groups on the Sample Selection Form and estimates the size of the Group.
(b) After the Group passes, the Team Leader continues counting and then assigns the next person to the interviewer.
0 This exclusion means that our counts reflect "voluntary" visitors and exclude those who are clearly part of a group. In practice, school groups and docent led tours are thus excluded.
-49-

SAMPLE SELECTION FORM
Session No. 6 Date: 30-03 Day: Frida-v
Shift: 1 2 3 4 5
Weather: Clear
Team Leader: L. Skinner
Interviewer #1 D. Glover
Interviewer #2 A. Ziebarth
Survey : En trance
Exit
Intercepts: 11 10 Total Intercept 21
Note: Entries shown in italics are entered by Team Leader.
-50-
(10) If both interviewers return to the Team Leader at the same time, he/she handles them sequentially. In other words, a "Count Number" is given to the first interviewer and he/she is sent out. Then a "Count Number" is given to the second interviewer and the next person is intercepted. These two "Count Numbe rs" should be at least 3 people apart.11
(1 1) The above procedure continues until the end of the Session.
(12) At the end of the Session, the interviewers put their used questionnaires in numerical order (i.e., those with assigned Count Numbers) and give them to the Team Leader. He/she reconciles the number of questionnaires with the assignments on the Sample Selection Form. For example, if the assigned Count Numbers on the Sample Selection Form are as shown on the attached example, 21 questionnaires should exist with those corresponding numbers (e.g., 03, 06, 12, 17, 28, etc.).
Interviewers completed a questionnaire for every individual they intercepted, even if he or she was not eligible for the study (an SI employee) or refused to participate. In order to allow us to assess possible response bias, every effort was made to ask those who refused participation in the survey several key questions (who they were with and their residence) and to record additional information based on in te rvi ewe r observations (gender, approxi mate age, and cu It u ral/raci al/et h n i c identity) . If the person to be intercepted turned out to be an employee, an interview was not conducted. If it was a child, and the child was too young to be interviewed, the adult was asked to respond for the child. Permission to interview children under 12 was asked of the accompanying adult.
As scheduled, 53 (New York and Washington, D.C. combined) one and one- half hour sessions were completed -- a total of 79.5 (57 at C-H and 22.5 at NPG) hours of data collection following the schedule in Appendix C. The Survey Coordinator ensured that questionnaires and Sample Selection Forms were available for each day, interviewed or counted during almost every session, and scheduled interviewers for each session.
D. Office Procedures
Here we provide detailed instructions for reviewing the sample selection portion of the questionnaires and preparing them for data entry. The main purpose of this review is to ensure that the computer file generated from the data will include the appropriate information for weighting the data.
Overall Approach. The Editor has the responsibility for transferring information from the Sample Selection Form to questionnaires filled out during the session and ensuring that the forms are ready for data entry.
1 1 This qualification prevents two individuals from the same social group from being interviewed. In practice, when visitation is extremely low the Team Leader may change the interval to two people apart.
-51 -
Specific Steps.
(1) The Editor takes all the questionnaires from a specific Session and puts them in numerical order according to their Count Number. The numbers on the questionnaires are compared to those shown in the columns labeled Interviewer #1 and Interviewer #2 on the Sample Selection Form to ensure that they are identical.
(2) The sum of the entries in the columns labeled Interviewer #I and Interviewer #2 in each Segment (1 through 6) should equal the number entered in the column labeled "lnt. in Seg." (Intercepts in Segment). The "Total Intercepts" at the bottom of the Sample Selection Form should equal the sum of the column totals for the columns labeled Interviewer #I and Interviewer #2 and for the column labeled "Int. in Seg." Discrepancies should be identified and corrected.
(3) Taking each questionnaire in turn, the Editor enters the information requested in the Administrative Information Box at the end of the questionnaire as fo I lows:
(a) Current Segment Count (CSC) = The number of visitors who have passed through a certain point in time. It is the same as the number in the "Count" column on the Sample Selection Form. It includes those visitors from the current segment plus those from the previous segment within a single session.12 The Editor has to determine which segment applies to a specific questionnaire by matching the "Count" to a number entered in the columns labeled Interviewer #1 or Interviewer #2. For example, if the Editor was looking at a questionnaire with the number 33 on it, the Count would have to be 70, which will be entered as the Current Segment Count on the questionnaire.
(b) Previous Segment Count (PSC) = The number of visitors recorded in the previous segment. For example, the number 30 would be entered for a questionnaire filled out in Segment #2. In the case of questionnaires filled out in Segment # I , Previous Segment Count = 0. Or, for example, the number 140 would be entered for a questionnaire filled out in Segment #6.
(c) Intercepts in Segment (Int. in Seg.) = Intercepts in Segment from Sample Selection Form.
(d) Segment # (Seg.) = The applicable Segment.
(e) Status: Filled out by interviewer, but checked by the Editor based on study specific instructions. "Interview-Adult" and "interview-Child" designate a completed questionnaire, "Refusal-Language" and "Refusal-Other" are questionnaires with only partial demographic information, and "SI Empl./Contractor" are intercepts which are terminated as not eligible for interview.
l 2 Obviously, the "Count" in the first segment, is the actual number who have passed from the beginning of the interviewing session. The "Count" in all subsequent sessions is additive; i.e., the mechanical counter is not re-set every segment.
-52-

(4) When all of the questionnaires for a specific study are edited, the Editor adds up the final count on all of the Sample Selection Forms. This number, the total number of visitors counted during a study, is used as a check against the computer generated weights.
E. Response Rates and Weiahtina the Data
Respo nse Rates. The response rate to any survey is rarely 100%. Often there are characteristics of the population which differ between respondents and non- respondents. If one can determine which people have responded to a survey, and which have not, then one can statistically adjust (weight) the existing data so that it approximates the entire survey population. One can only weight according to known variation between the respondents and the non-respondents. There may be many other differences between these two groups that are not known and therefore cannot be compensated by the weighting procedure.
The results of intercepts of visitors were quite successful. Two response rates can be deduced from the information in Table D.l, Appendix D. As seen in the middle panel of the table, a response rate of 84.4% was achieved at Cooper-Hewitt and 92.6% was achieved at the Portrait Gallery. However, the third panel shows that some 25 potential respondents at Cooper-Hewitt and six at the Portrait Gallery did not participate in the study due to language difficulties. Thus, among English-speaking intercepted visitors, a response rate of 86.6% was achieved at Cooper-Hewitt and 94.5% at the Portrait Gallery.
These high response rates together with an analysis conducted using information from the people who refused, led to the decision not to weight for non- response bias (see Section F. below). However, respondents were not selected with equal probability throughout the survey. Thus, each record received a weight as described below. Using these weights allows us to discuss the visitors to Cooper- Hewitt and National Portrait Gallery.
Weiahtina the Data The data processing procedures for assigning weights are described here. They assume that the specific weight-related data have been checked and corrected for inconsistencies by referring to hard copy questionnaires. For example, an editor may have forgotten to enter a count or the number of intercepts.
(1) Overall weight for each questionnaire is defined as: The number of visitors counted in a specific segment [Current Segment Count minus Previous Segment Count] divided by the number of Intercepts in Segment. For example, each questionnaire filled out in Segment #2, corresponding to the Count Numbers shown on the attached Sample Selection Form in the columns labeled Interviewer #I and Interviewer #2 (33, 41, 50, and 62) would receive a weight of 10 [(70-30)/4].
(2) After weights are assigned, the computer-generated sum of weights from the questionnaires is compared to the sum generated from the Sample Selection Forms. Minor differences are generally the result of computer rounding procedures; major differences are resolved through additional data checks.
-53-

F. Respondent Refusal: Patterns of Response Bias in The Power of Maps Studv
A multivariate analysis of respondent refusal was conducted to assess the degree of systematic bias in the characteristics of those respondents that refused to participate in The Power of Maps Survey at Cooper-Hewitt. As background, Table D.2 contains the demographic characteristics for respondents and those who refused to participate for both Cooper-Hewitt and NPG. Our preliminary analysis, and the extremely high response rate at NPG (92.6%) indicated that a extensive analysis of response bias was not necessary. Thus, the remainder of this section applies only to Cooper-Hewitt portion of the study.
The logistic regression procedure was used to identify statistically significant predictors of respondent refusal for each survey subgroup (Entrance or Exit) and for the total or "pooled" sample. The "raw" logistic coefficients were then transformed into percentage change statistics (AP) for ease of interpreting the magnitude of the individual variables' independent or Vet" effect on the probability of respondent refusal. The results discussed below provide the empirical basis for the decision to analyze the systematically selected Cooper-Hewitt Museum visitors at the aggregate or ''pooled" data level. Furthermore, the presence of only modest participation bias obviates the need to statistically "re-weight" the sample in order to compensate for the observed non-random fluctuations in the distribution of reported socio-demographic characteristics. The initial "full" multivariate models are available from IS0 and the final or "reduced form" model is presented below.
Determinants of Respondent Refusal
Two issues are important in this analysis. First, do the effects vary by interview site? Second, are some specific socio-demographic factors significantly more likely to contribute to respondent refusal in The Power of Maps survey? To investigate these issues, a series of independent variables were specified. They were constructed from information collected directly from the eligible respondents or indirectly based on interviewer observation; administrative data from the questionnaires provide information on interview site, volume of visitors, reason for refusal, day of week, etc.
The analyses included specifying the following variables: G E N D E R
AGE (Under 35, 35-44, 45-54, 55-64, Over 64); RESIDENCE (NY City, NY Metro Suburbs, Other US. states, Foreign); VISIT GROUP (Alone, Couples, With Friends, Several Adults, Adults with Children, Tour Group); INTERVIEW LOCATION (Entrance or Exit), and DAY of WEEK (Weekday, Weekend).
(m ale/f e male) ; R AC I AUETH N ICE ULTU R AL H ER ITAGE (Whit e, B lac WAA, Lat i no/N A, Asian) ;
Addressing first the question of differences in the pattern[s] of respondent refusal by interview location, the data indicate only modest differences between the Entrance Survey and Exit Survey subsamples. Those visitors who were intercepted in the Exit Survey were only 2.1% more likely not to cooperate. That is, as discussed below, the probability of not participating in the survey is primarily explained by respondents' geographic residence, race/ethnicity, age, and the social composition of the visit group. In comparison, discernible differences in the socio-demographic characteristics of the location (Entrance or Exit) subgroups appear to be primarily due to random fluctuations or sampling error. Hence, this preliminary finding justifies our decision to proceed with the analysis based on the combined or "pooled" sample.
-54-

The analytical strategy entailed specifying the "full" model (all available, relevant variables) and then successively deleting those independent variables that were not statistically significant. The latter include GENDER and DAY of WEEK . Overall, the most important predictors of respondent refusal are RE DENCE, the social
reported in Table B.l , only eight of the twenty variables initially specified are statistically significant and they demonstrate only modest to moderate effects; being interviewed in the Exit Survey is the only factor that increases the likelihood of non- participation and it is a minor effect (2.1%). That is, the probability of respondent refusal in The Power of Maps survey is least likely among visitors from Other U.S. states (-1 1.4%) and residents of New York City (-5.7%) (compared to those from the NYC suburbs or outside the U.S.), followed by those visiting with Friend[s] (-9.3%), Couples (-7.5%), Alone (-3.5%) (compared to Tour Groups or Adults with Children), Whites (-5.6%) (compared to minority visitors), and Young Adults (Under 35) (-2.6%) compared to all other age groups.
composition Of VISIT GROUP, RACIAL/ETHNIC/CULTURAL HERITAGE, and then AGE. AS
In other words, the results slightly overrepresent the characteristics, attitudes and views of: visitors from New York City and Other U.S. states; those who came alone, with friends, or in couples; Whites; and young adults. Of these factors, only the greater participation rate of U.S. visitors from outside the New York Metropolitan Area (Other U.S. states) is of substantive importance. In sum, the overall impact of the response bias is minimal due to the small size of these various socio-demographic subgroups.
-55-

Table B.l
Loaistic Rearession Analvsis of Refusina to Participate in The Power of Maps Survey at Cooper-Hewitt (Loait and Percentaae C hanae Statistics)
Logistic Regression Percentage VARIABLE Coefficient Change
GENDER Female (Male)*
AGE Under 35 35-44
55-64 (45 -5 4) *
Over 64
-0.7530 ---
RAC I AUETHN I C/ CULTURAL HERITAGE White -1.3704 Blac k/Af ri can Ame r Latino/Native Amer --- (Asian) *
---
RESIDENCE New York City -1.6377
Other U.S. States -2.071 4 (NY Metro Suburb)*
Foreign ---
VISIT GROUP Alone -0.8434 Couple -1.5209 With Friends -1.2224 Adults with Children --- (Tour Group)*
INTERVIEW LOCATION Exit 0.6928 (Entrance)*
-0.0255 ---
-0.0560 ---
-0.0565
-0.1 135 ---
-0.0353 -0.0 7 45 -0.0926
---
0.0206
DAY OF WEEK Weekend (Weekday )* * Omitted category
-56-

Appendix C Count No.
Hello, my name is . I am a Cooper-Hewitt volunteer and would like to talk to you about your visit.
1. Is TODAY your first visit to the Cooper-Hewitt? 1 Yes: GOTOQ.2 5/ 2 Work at C-H: Go to Admin Box. 3 No: ASKQ.1A
7. Next, I am going to read you 9 comments people have made about maps. In your opinion, please tell me if you Agree, Mostly Agree, Mostly Disagree or Disagree with each. [HAND CARD]
1A. When was the last time you were here?
1 Since Oct. 8, 1992 4 2-3 years ago 7/ 2 In the last year 5 3-4 years ago 3 1-2 years ago 6 4+yearsago
*2. Who are you here with today? 9/
1 Alone 5 Friends/Peers (Teens) 2 One other Adult 6 Adults (3 or more) 3 Children 7 School group 4 Adult(s) & child(ren) 8 Tour group 9 Other:
3. Are you or your household a member of the Cooper-Hewitt or the Smithsonian? 1 No 11/ 2 Yes,C-H 3 Yes, Smithsonian
4. What is the MAIN reason you visited the Cooper- Hewitt today?
1 See Maps exhibition: GO TO Q.6 13/ 2 Visit museum shop 3 See mansion/building 4 Free admission (Tuesday nights) 5 General visit/No particular reason
5. Before today, had you heard about the MAPS exhibition?
1 Yes 2 No:GOTOQ.7 15/
6. How did you hear about this exhibition? [MARK ALL THAT APPLY] 1 Repeat visit to Maps: ASK: 17/
How did you first hear about it? 1 Newspaper: 19/
21/ 1 Magazine: 23/
A
1
1
1
1
1
1
1
1
1
MA
2
2
2
2
2
2
2
2
2
MD
3
3
3
3
3
3
3
3
3
D
4 I think maps are practical and objective, similar to train schedules. 37/
4 I think only an expert can make a true map. 39/
4 I think maps are like historic documents,because they tell you how people thought at a particular time. 41/
4 I think nowdays, map-makers choose the colors in maps according to scientific rules. 431
4 1 think every map is made to serve the interest of its makers.
45/
4 I think a map might be made for one purpose,but end up being used later or elsewhere for a very
4 I think a map is somewhat like a newspaper editorial, because each of them represent a point of view. 49/
different purpose. 4 7/
4 I think maps accurately reflect geography. 51/
4 I think a map is somewhat like a portrait painting, because each of them reflects a particular view.
53/
[ENTRANCE SURVEY: Go to Q.101
[EXIT SURVEY: Continue] 1 TV/ Radio 27/ 1 Friends/Family 29/ 1 Cooper-Hewitt Calendar 31/ 1 Exterior Banner/Poster 33/ 1 Other: 35/
-57-

8. [EXIT ONLY] Which map, object or section in the exhibition would you tell a friend about? Why?
n 5 5 - 5 6 / 0 0 5 8 - 5 9
9. [EXIT ONLY] Do you think the exhibition has a central message? 1 No: GotoQ10 2 Yes:AskQ9A 61/
Office use only: m 83-84/
+*14. What is your cuItural/racial/ethnic identity?
1 Afr. Amer./Black 4 HispanidLatino 2 Asian/Pac. Islander 5 Nat Am./AK Native 3 Caucasian 6 Other
86/
15. Did you know that Cooper-Hewitt exhibitions are financially supported by both public and private funds?
1 Yes 2 No 88/
16. Do you think private financial support affects an exhibition?
1 Yes:How? 2 No 90/
9A. [EXIT ONLY] What do you think that message is?
0 6 3 - 6 4 / 0 0 6 6 - 6 7 /
FINALLY, I HAVE A FEW QUESTIONS ABOUT YOU...
+lo. What is the highest level of schooVeducation you have completed?
1 Pre/Grade school (0-8) 5 Bachelor's degree 2 SomeHS 6 Some graduate study 3 HSgraduate 7 M A/P h. D./Prof essio nal 4 Some college/Tech.
69/
*1 1. What is your occupation?
m 7 1 - 7 2 /
+*12. How old are you? Enter precise age 74-751 OR Record for RefusaVEstimate: 77-78/
+*13. Where do you live?
10 11 Above 96th St.in Man. 15 Lower Manhattan in 12 Bronx (33rd St. to Battery) 13 Midtown (34th to 96th) 16 Queens 14 Brooklyn 17 Staten Island
New York Citv SHOW CARD: In what area?
20 New York Citv subu rbs in NY/NJ/CONN 30 Other US. state: 40 Outside the U.S.: 80-8 1/
-58-
17. Do you know who the financial supporters are for the Maps exhibition?
1 Yes:Who? 2 No 95/
+*18. Gender: [MARK. DO NOT ASK!] ~
1 Female 2 Male 99/
GIVE GIFT!!! ADMINISTRATIVE INFORMATION
1 Entrance 2 Exit 101
Shift: 1 2 3 4 5 103
Status: 1 Interview-Adult 4 Refusal - Language 2 Interview-Child 5 Refusal - Other 3 Work at C-H/SI 105
Day: 0 Month :m D a t e : U l 107 109-110 112-13
(l=Sun, 2=Mo, etc.) For Office use onlv: un Session# I I L e s s i o n Count
118-120 115-116
Segment# 122 Intercepts in Seg.
Current Segment Count ~ 127-129
Previous Segment Count 131-133
ID Number. ~ 135-137
124-125

Count No.
I l - 3
Hello, my name is . I am a Portrait Gallery volunteer and would like to talk to you about your visit.
1. Is TODAY your first visit to the Portrait Gallery? 1 Other: 35/ 1 Yes: GOTOQ.2 51 2 Work at NPG: Go to Admin Box. 3 No: ASKQ.1A
1A. When was the last time you were here?
1 ---- 4 2-3yearsago 71 2 In the last year 5 3-4 years ago 3 1-2 years ago 6 4+yearsago
*2. Who are you here with today? 91
1 Alone 5 Friends/Peers (Teens) 2 One other Adult 6 Adults (3 or more) 3 Children 7 School group 4 Adult(s) & child(ren) 8 Tour group 9 Other:
3. Are you or your household a member of the Smithsonian?
1 No 1 11 2 -- 3 Yes
4. What is the MAIN reason you visited the Portrait Gallery today?
1
3 See Noble Herifage exhibition 4 See other exhibition: 5 Visit museum shop 6 Visit NMAA 7 General visit/No particular reason
See Rembrandt Peak exhibition: GO TO Q6 2 See Spirit of Party exhibition 13/
5. Before today, had you heard about the Rembrandt Peale exhibit ion?
1 Yes 2 No:GOTOQ7 15/
6. How did you hear about this exhibition?
How did you first hear about it?
[MARK ALL THAT APPLY] 1 Repeat visit to Rembrandt Peale: ASK: 17/
1 Newspaper: 19/
1 Magazine: 23/
7. The Smithsonian is planning for a new exhibition, The Power of Maps, which is coming to Washington from New York. I am going to read you 9 comments people have made about maps. In your opinion, please tell me if you Agree, Mostly Agree, Mostly Disagree or Disagree with each. [HAND CARD]
A
1
1
1
1
1
1
1
1
1
MA
2
2
2
2
2
2
2
2
2
MD
3
3
3
3
3
3
3
3
3
D
4 I think maps are practical and objective, similar to train schedules. 37/
4 I think only an expert can make a true map. 39/
4 I think maps are like historic documents,because they tell you how people thought at a particular time. 41/
4 I think nowdays, map-makers choose the colors in maps according to scientific rules. 431
4 I think every map is made to serve the interest of its makers.
45/
4 I think a map might be made for one purpose, but end up being used later or elsewhere for a very different purpose . 47/
4 I think a map is somewhat like a newspaper editorial, because each of them represent a point of view. 49/
4 I think maps accurately reflect geography. 51/
4 I think a map is somewhat like a portrait painting, because each of them reflects a particular view.
53/
continue on reverse ....
1 TV/ Radio 1 Friends/Family 1 Portrait Gallery Calendar 1 Exterior Banner/Poster
27/ 29/ 31/ 33/
-59-

8. Before today, had you heard about The Power of Maps exhibition at the Cooper-Hewitt in New York?
1 Yes 2 No:GOTOQ.lO 55/
9. How did you hear about it? [MARK ALL THAT APPLY] 1 Saw it in New York: ASK: 57/
1 Newspaper: 59/ HOW did you first hear about it?
1 Magazine: 63/
1 TV/ Radio 67/ 1 Friends/Family 69/ 1 Cooper-Hewitt Calendar 71/ 1 Exterior Banner/Poster 73/ 1 Other: 75/
FINALLY, I HAVE A FEW QUESTIONS ABOUT YOU ... +lo. What is the highest level of school/education you have completed?
1 Pre/Grade school (0-8) 5 Bachelor's degree 2 SomeHS 6 Some graduate study 3 HSgraduate 7 MAIPh. D./Professional 4 Some college/Tech.
77/
"1 1. What is your occupation?
+*12. How old are you? m Enter precise age82-83/ OR Record for Refu sal/Estimate: 85-86/
+*13. Where do you live?
1 Washington, DC 2 Washington, DC suburbs in MD/VA 3 Other U.S. state: 4 Outside the U.S.: 88-89/
Office use only: m 91-92/
+*14. What is your cuItural/raciaI/ethnic identity?
1 Afr. Amer./Black 4 HispanidLatino 2 Asian/Pac. Islander 5 Nat Am./AK Native 3 Caucasian 6 Other
94/
15. Did you know that Portrait Gallery exhibltions are financially supported by both public and private funds?
1 Yes 2 No 96/
16. Do you think private financial support affects an exhibition?
1 Yes:How? 2 No 98/
m 101/
17. Do you think public financial support affects an exhibition?
1 Yes:How? 2 No 103/
m 105- 1 06/
+*18. Gender: [MARK. DO NOT ASK!] 1 Female 2 Male 108/
GIVE GIFT!!! ADMINISTRATIVE INFORMATION
1 Entrance 2 Exit 3 DC 110/
Shift: 1 2 3 4 5 6 112/
Status: 1 lnterview-Adult 4 Refusal - Language 2 Interview-Child 5 Refusal - Other 3 Work at NPG/SI 114/
Day: 0 Month :m imLEl 116/ 1 18- 119/ 121-122/
(l=Sun, 2=Mo, etc.) For Office use onlv:
~ Session# I e s s i o n Count
Segment# 131/
127- 129/ 124-125/
Intercepts in Seg. m 133- 134/
Current Segment Count 136-138/
-60-

Survey Schedules
Cooper -Hewitt Museu m of Des ian
- Time Date Day 1 0 130- 1 2130- 2130- 5 130- 711 5-
12:oo 2:oo 4:OO 7:OO 8:45
28-Oct Wednesday Exit Enter 29-Oct Thursday Exit Enter 30-Oct Friday Enter Exit 31-Oct Saturday Exit Enter l-Nov Sunday Exit Enter 3-Nov Tuesday Enter Exit Exit
4-NOv Wednesday Exit Enter 5-NOv Thursday Enter Exit 6-Nov Friday Exit Enter 7-Nov Saturday Exit Enter 8-Nov Sunday Exit 10-Nov Tuesday Exit Enter Exit Enter
11 -Nov Wednesday Enter Exit 12-Nov Thursday Exit Enter 13-Nov Friday Exit Enter 14-Nov Saturday Enter Exit 15-NOV Sunday Enter 17-NOv Tuesday Exit Enter Enter
National Portrait Gallerv
Time Date Day 10:30- 11 100- 12130- 1100- 2:30- 3 100-
12:OO 12:30 2:OO 2:30 4:OO 4:30
2-Nov Monday Int. Int. 4-NOv Wednesday Int Int. 6-Nov Friday Int. Int. 8-Nov Sunday Int. Int. 10-Nov Tuesday Int. Int. 12-Nov Thursday Int. Int. 14-NOV Saturday Int. Int. Int.
*Int = Times at which interviewing took place.
-61 -

Appendix D
Supplementary Tables
Table D.l Composition of Sample and Disposition: 1992 Power of Maps Studv
New York Washington Cooper- Hewitt National Portrait
Exit Entrance Combined Gal le ry
Type N % N % N % N %
I. Composition
SI staff/contractors* 10 2.2 5 1.1 15 1.6 18 5.7 Visitors 445 97.8 455 98.9 900 98.4 296 94.3
Total 455 100.0 460 100.0 915 100.0 314 100.0
II. Disposition. All Eliaible Visitors
I n t ervi ews 358 80.4 402 88.4 760 84.4 274 92.6 Non-Interviews 87 19.6 53 11.6 140 15.6 22 7.4
Total 445 100.0 455 100.0 900 100.0 296 100.0
Ill. Reasons for Non- Participation. Eliaible Visitors Refusal, Language difficulty 12 13.8 13 24.5 25 17.9 6 27.3 Refusal, Other 75 86.2 40 75.5 115 82.1 16 72.7
Total, Non-interviews 87 100.0 53 100.0 140 100.0 22 100.0
IV. Response Rates All eligible visitors** 80.4 88.4 84.4 92.6
* Includes C-H or NPG staff, other SI staff, and contractors ** From II. above
-62-

Table D.2 Comparison of Survev Participants and Non-Participants: Cooper-Hewitt and NPG Survevs
Jnterviewed Jnterviewed Cooper-Hewitt National Portrait Gallery
No Yes Total
Female 59.7 52.0 53.0 Male 40.3 48.0 47.0 Total 100.0 100.0 100.0
Gender
&e Less than 12 12-19
20-24 25-34 35-44 45-54 55-64 65 and over Total
0.0 3.0 2.9 0.0 0.9 0.8 0.0 7.3 7.0
15.1 25.0 24.6 27.9 20.5 20.8 44.2 23.6 24.4 10.5 12.0 12.0 2.3 7.8 7.6
100.0 100.0 100.0
Racial/Et hn ic ldentif icatioq African AmericadBlack 8.1 0.7 1.4 Asian/Pacific Islander 4.3 3.2 3.3 Hispanic/Latino 1.9 2.0 2.0 Native American 0.0 0.1 0.1 Caucasian 85.7 93.9 93.2 Total 100.0 100.0 100.0
Residence NY CNVash ing ton, D .C. 75.5 48.6 52.0 Suburbs 4.4 18.1 16.4 Other United States 5.1 26.7 23.9 Foreign 15.1 6.6 7.7 Total 100.0 100.0 100.0
Social Comoosition of Group Alone 50.9 38.9 40.0 Two adults 27.9 45.7 44.2 Adults w l Children 14.8 4.8 5.7 Other Groups 6.4 10.6 10.2 Total 100.0 100.0 100.0
Number 53 402 455
No Yes Total No Yes Total
56.5 52.0 52.7 37.5 47.4 46.8 43.5 48.0 47.3 62.5 52.6 53.2
100.0 100.0 100.0 100.0 100.0 100.0
0.0 0.0
10.6 7.7
37.7 17.0 17.9 9.0
100.0
2.5 2.3 2.7 2.5 3.5 4.1
26.5 25.1 20.5 21.8 26.0 25.4 8.7 9.4 9.5 9.5
100.0 100.0
0.0 0.3 0.3 0.0 1.3 1.3 0.0 6.7 6.6
33.1 23.1 23.3 0.0 31.3 30.9 0.0 14.2 14.0
66.9 13.0 13.8 0.0 10.0 9.8
100.0 100.0 100.0
1.1 0.3 0.5 12.5 5.5 6.0 9.7 3.1 4.3 11.5 4.8 5.2 1.5 2.5 2.3 0.0 2.0 1.9 0.0 0.0 0.0 6.5 0.4 0.8
87.7 94.1 93.0 69.6 87.3 86.1 100.0 100.0 100.0 100.0 100.0 100.0
71.4 48.0 52.2 42.3 18.0 19.0 5.7 18.9 16.5 30.9 28.8 28.9 8.7 25.7 22.7 21.9 45.0 44.1
14.3 7.5 8.7 4.9 8.2 8.1 100.0 100.0 100.0 100.0 100.0 100.0
45.6 35.3 37.0 59.0 42.8 43.6 34.9 42.1 40.9 36.0 39.8 39.6 7.5 8.2 8.1 5.1 4.9 4.9
11.9 14.4 14.0 0.0 12.5 11.9 100.0 100.0 100.0 100.0 100.0 100.0
87 358 445 22 274 296 Percentage 11.6 88.4 100.0 19.6 80.4 100.0 7.4 92.6 100.0
-63-

Table D.3 Selected Characteristics of Survev Participants and Non-Participants
Cooper- Hewitt National Portrait NMAA/ Gallery NPG 1990
Characteristics Interviewed
Gender No Yes Total No Yes Total Total
Female 57.9 52.0 52.9 Male 42.1 48.0 47.1 Total 100.0 100.0 100.0
Aae Less than 12 12-1 9
20-24 25-34 35-44 45-54 55-64 65 and over Total
0.0 0.0 7.0
10.2 34.4 26.3 15.4 6.7
100.0
2.8 1.8 5.5
25.7 20.5 24.8 10.4 8.6
100.0
2.6 1.7 5.6
24.9 21.3 24.9 10.7 8.5
100.0
I dent if icat ion African American/Black 3.6 0.5 0.9 Asian/Pacific Islander 7.8 3.2 3.8 HispanidLatino 1.6 2.3 2.2 Native American 0.0 0.1 0.1 Minorities 13.0 6.0 6.9 Caucasian 87.0 94.0 93.1 Total 100.0 100.0 100.0
Residence NYCNVashington, D.C. 73.1 48.3 52.1 Suburbs 5.1 18.5 16.4 Other United States 7.1 26.2 23.3 Foreign 14.6 7.0 8.2 Total 100.0 100.0 100.0
Group Alone 47.5 37.2 38.5 Two adults 32.4 44.0 42.6 Adults w/ Children 10.1 6.4 10.1 Other Groups 10.0 12.4 8.9 Total 100.0 100.0 100.0
37.5 47.4 46.8 47.7 62.5 52.6 53.2 52.3
100.0 100.0 100.0 100.0
0.0 0.3 0.3 0.0 1.3 1.3 0.0 6.7 6.6
33.1 23.1 23.3 0.0 31.3 30.9 0.0 14.2 14.0
66.9 13.0 13.8 0.0 10.0 9.8
100.0 100.0 100.0
- 4.6* 5.1
19.6 23.4 22.5 13.7 11.3
100.2 *Ages 0-19
12.5 5.5 6.0 11.5 4.8 5.2 0.0 2.0 1.9 6.5 0.4 0.8
23.9 12.3 73.7 11.6 69.6 87.3 86.1 88.4
100.0 100.0 100.0 100.0
42.3 18.0 19.0 11.4 30.9 28.8 28.9 21.1 21.9 45.0 44.1 58.0 4.9 8.2 8.1 9.4
100.0 100.0 100.0 99.9
59.0 42.8 43.6 33.0 36.0 39.8 39.6 45.0 5.1 4.9 4.9 0.0 12.5 11.9
100.0 100.0 100.0 78.0 (cont.)
-64-

Table D.3 Selected Characteristics of Survey Participants and Non-Participants
Cooper- Hewitt National Portrait NMAN Gallery NPG 1990
Characteristics I n t e rviewed No Yes Total No Yes Total Total
Educational Attainment Pre-Grade School Some HS HS Graduate Some College Bachelor's degree Some graduate study MA/P hD/Professional Other D/K
Occupation Prof. N on- Scie nce Prof. Science Prof. Arts Prof. Design Prof. Writer Teac he r/Educato r Clerical Student Not in Labor Force
Completes 3.1 0.9 4.3 9.2
32.6 8.7
41.1 0.1
100.0
27.1 12.0 10.7 9.5 4.8
11.3 8.7 8.6 7.3
100.0
1.4 3.0 5.9
21.1 26.9 4.3
37.4 0.0
100.0
38.5 15.5 4.4 2.1 5.5
10.0 11.7 7.1 5.2
100.0
~~~
Number 140 760 900 22 274 296 296 Percentage 15.6 84.4 100.0 7.4 92.6 100.0 100.0
-65-

Table 0.4 Selected Characteristics of Respondents: Cooper-Hewitt. NPG and NPG/NMAA Su rvevs
Cooper-Hewitt National Portrait
Interviewed Characteristics Gallery
First Visit Yes 50.2 54.5 No 49.8 45.5 Total 100.0 100.0
Time of Last Visit Since 10/08/92 13.8 In the last year 38.8 1-2 years ago 19.8 2-3 years ago 12.5 3-4 years ago 1.4 4+ years ago 13.8 Total 100.1
Reason for Visit See Maps Exhibition 63.2 Visit Museum Shop 4.2 See Mansion/Building 4.0 Free admission/Tues. night 0.7 General Visit 26.6
Total 99.9 Guggenheim related 1.2
Membership Neither 75.2
Smithsonian 19.5 Total 100.0
Cooper-Hewitt 5.3
Todav Yes No
Sources of Information Newspapers Mag azi n es TV/Radio F ri e n ds/Fam i I y Cooper-Hewitt Calendar Exterior Banner/Poster Other Total
34.7 65.3
100.0
31 .O 16.1 2.3
24.4 6.0
14.9 5.4
100.1
- - 69.4 13.5 5.6 0.5
11.0 100.0
0.0
71 .O
29.0 100.0
0.0
0.0
-66-

Table D.5 Percent of Respondents Givina a Correct or Partiallv Correct Resrsonse to Power of Maps Messaae Scale,
bv Item and Survev Location
NPG C-H Entrance C-H Exit 1.0* 0.5** Sum*** 1 .o 0.5 Sum 1 .o 0.5 Sum
1 I think maps are practical and objective, 5.6 similar to train schedules.
2 I think maps are like historic documents, 32.1 because they tell you how people thought at a particular time.
newspaper editorial, because each of them represent a point of view.
painting, because each of them reflects a point of view.
5 I think every map is made to serve the interest of its makers.
3 I think a map is somewhat like a 22.9
4 I think a map is somewhat like a portrait 36.2
28.0
6 I think a map might be made for one purpose, but end up being used later or elsewhere for a very different purpose.
7 I think maps accurately reflect geography. 6.0
70.4
8 I think only an expert can make a true 32.1 map.
9 I think nowadays, map-makers choose the 23.6 colors in maps according to scientific rules.
6.8
1’7.1
41.1
39.7
24.7
20.9
7.6
17.1
18.6
12.4
49.2
64.0
75.9
52.7
91.3
13.6
49.2
42.2
9.1
83.3
37.9
39.4
24.6
68.7
12.8
36.0
27.6
11.0
13.4
35.6
41.5
33.0
24.4
12.7
16.8
18.3
20.1
96.7
73.5
80.9
57.6
93.1
25.5
52.8
45.9
14.4
76.6
48.2
47.9
37.0
63.9
13.2
38.4
32.2
13.9 28.3
21.3 97.9
32.0 80.2
37.3 85.2
31.7 68.7
29.3 93.2
19.3 32.5
21.2 59.6
24.8 57.0
* ** ***
Percent who gave a Correct response and were given a full point (1 .O) on the resulting score. Percent who gave a Partially Correct response and were given a half point (0.5) on the resulting score. Percent who gave either a Correct or a Partially Correct response.
-67-

Appendix E
Comparison of Visitors to the National Portrait Gallery with Visitors to the CooDer-Hewitt Museum
lntroduct ion
In Section I, we discussed our reasons for interviewing at the National Portrait Gallery (NPG) as part of The Power of Maps study. In this section we will provide a profile of visitors to NPG compared to those who came to Cooper-Hewitt. As stated in Appendix B, at NPG there were fifteen interviewing sessions between November 2 and November 14, 1992. Interviewing took place during the In Pursuit of Fame: Rembrandt Pede 7778-7860 exhibition. For an additional comparison, we also discuss the results of a previous study conducted in May 1990 at the National Museum of American Art/National Portrait Gallery building (NMAA/NPG).
Gender and Aae
During our interviewing at NPG women were a minority of the visitors (46.8%). This differs somewhat with Cooper-Hewitt where more women were encountered (52.9%). In the 1990 study of NMAA/NPG, 47.7% of visitors were women, and 52.3% were men; i.e. essentially the same proportions as found in this 1992 study.' Both museums are typical of the traditional one to one ratio encountered at most Smithsonian museums. [The difference in gender between NPG and Cooper-Hewitt is significant at the 95% level.] Please see Table E.l in Appendix E for values of significance.
Figure E.l, on the next page, displays the age distribution of visitors to NPG. As in other studies, the ages of very young children were ascertained from their parents. At NPG, visitors under the age of 24 were 8.2% of the total, compared with 9.9% at Cooper-Hewitt. At the other end of the age spectrum, those 55 years of age and older comprised 23.6% of visitors at NPG and 19.2% at Cooper-Hewitt. However, the differences in the age distribution between the two museums are not significant at the 95% level. The results at NPG are essentially the same as those found in the 1990 study.2
Residence
The distribution of the geographical origins of visitors is unique to both museums. On the surface, residents of New York City coming to Cooper-Hewitt could be considered comparable to those from Washington, D.C. Similarly, residents of the NYINJICT suburbs could be considered comparable to residents of the MDIVA suburbs. The comparison, however, is more problematic when both size, population and socio- economic composition are taken into account.
See Z. D. Doering and E. K. Ziebarth, Museum Images: A Study of the National Museum of American Art and the National Portrait Gallery. Report 91 -1. (Washington, D.C.: Smithsonian Institution, 1990). * In Museum lmages we found that 9.7 percent of visitors were under the age of 24 and 25.0 percent were over the age of 55.
-68-

Figure E.l
Aae Distribution of Visitors at NPG Percent 35.0 T 30.0
25.0
20.0
15.0
10.0
5.0
0.0 T- d d d d d +
?J ? (0 9 P c3 z & & O
In In
T- cu cu c3 d u3 In In In
T-
Figure E.2
Geoaraphic Oriains of Visitors to NPG
Percent 45 40 35 30 25 20 15 10 5 0
The results of the survey show that residents of Washington, D.C. are less than one-fifth of the total visitors to NPG (19.0%). This contrasts with visitors to Cooper- Hewitt where over half of all visitors (52.1%) were from New York City. The remainder of the local visitors were from the suburbs. Cooper-Hewitt attracted fewer suburban visitors (1 6.4%) than NPG (28.9%). Overall, local residents were over two-thirds of the audience at Cooper-Hewitt (68.5%), but less than one half at NPG (47.9%). This finding must be interpreted with caution, since the population of the Metropolitan D.C. suburbs are more than six times larger than the District of Columbia.
-69-

The result of the greater proportion of local visitors to Cooper-Hewitt, compared to NPG, is a smaller proportion of visitors from other parts of the United States (44.1% at NPG and 23.3% at Cooper-Hewitt ). These numbers include all US residents who were not from each museum's local metropolitan area. Approximately eight percent of visitors at each museum were from foreign countries. A significant statistical difference is found between NPG and Cooper-Hewitt when we use the categories of city, suburbs, other US and foreign. As we look back to the 1990 NMAA/NPG study, we find a smaller proportion of local audience visitors; in that study only 32.5% were from the Washington, D.C. Metropolitan Area compared to 47.9% reported here? Some of the difference, however, may be seasonal since the number of local visitors may not change but the "flow" of tourists varies substantially over the different seasons of the year. The 1990 NMAA/NPG study was conducted in May during the tourist season, while The Power of Maps Survey was conducted in early November when fewer tourists are in Was hi ngton.
RaciaVCu Itu ral/Et h n ic Distribution
In ascertaining the racial/ethnic composition of visitors, we rely on respondent self-identification. Both N PG and Cooper- Hewitt attracted an overwhe I ming ly Caucasian audience-- 86.1 % at NPG and 93.1 % at Cooper-Hewitt. Overall minorities represent 13.9% of the audience at NPG and 6.9% of the Cooper-Hewitt audience. However, small differences did exist when we examine the raciaVethnic groups individually (see Table D.3). The differences in racial/cuItural/ethnic distribution between the two museums are statistically significant. In the 1990 NMAA/NPG study, we found that 88.4% were Caucasians4 --again, essentially the same as in this 1992 survey.
Social Composition
Another aspect of the visitor profile is the social composition. Most visitors to both museums came either alone or accompanied by another adult (Le., couples). At NPG, 43.6% came alone and 39.6% came with one other adult. This is very similar to Cooper-Hewitt where 38.5% of visitors came alone and 42.6% came with one other adult. In 1990 at NMAA/NPG, 33.0% came alone and 45.0% came with one other adult.5 Again, some of the difference between 1990 and 1993 at NPG may be seasonal.
Approximately ten percent of visitors at Cooper-Hewitt came with children or with other adults and children. At NPG this percentage was smaller (4.9%). The remaining individuals came in groups (either school or tour) or with friends and peers. However, there is no statistically significant difference between Cooper-Hewitt and NPG in terms of social composition.
Education and Occupation
3 See Museum Images. 4 See Museum Images. 5 See Museum Images.
-70-

At both NPG and Cooper-Hewitt we asked respondents for their educational attainment and occupation. As found in most of our other studies, both museums attracted audiences that were very well educated and consisted mostly of professionals.
At NPG over two-thirds of all respondents who completed the questionnaire had at least a Bachelor's degree (68.6%) and almost ninety percent (89.7%) had at least some college. At Cooper-Hewitt 82.4% had at least a Bachelor's degree. When "some college" is added the percentage increases to over ninety percent at Cooper-Hewitt (91.6%).6 There is not, however, a statistically significant difference when comparing educational attainment at the two different locations. In 1990, at NMANNPG almost three-quarters had at least a Bachelor's degree (73.2%) and this number increases to almost ninety percent (88.7%) when "some college" is added.' Figure E.3 below shows the educational attainment distribution of respondents from NPG.
Figure E.3
Educat ional Attainment of Visitors at NPG Percent
40 T 35
30
25
20
15
10
5
0
As we look at the occupations of visitors (Figure E.4 on the next page), we find that the largest percentage at both museums are professionals in the non-science fields, i.e. lawyers, accountants, etc. (Cooper-Hewitt 27.1 YO -- NPG 38.5%). Professionals in the arts or design fields account for 20.2% of the audience at Cooper-Hewitt but only 7.6% of NPG's audience. Both museums had approximately ten percent teachers and educators (1 1.3% and 10.0% at Cooper-Hewitt and NPG, respectively) and five percent professional writers (4.8% at Cooper-Hewitt and 5.5% at NPG). Cooper-Hewitt had
6 This includes some respondents who have not yet completed their education; e.g., those under age 25 Such an exclusion would not raise the proportions significantly, as only 8.2% of respondents were in the 24 or younger age groups (see Figure E.3). 7 See Museum Images.
-71 -

slightly fewer science professionals as visitors (1 2.0%) than NPG (1 5.5%). In the 1990 NMANNPG study occupation was not asked of respondents. Overall, there was a significant difference between the two museums when comparing the occupational categories of arts professionals versus all other occupations.
Figure E.4
Occupational Distribution of Visitors at NPG Percent
35
30
25
20
15
10
5
0 -I + t t t
Summarv
The majority of visitors to both museums (91.8% at NPG and 90.1% at Cooper- Hewitt) were adults aged 25 and over. Over four fifths at NPG were either alone or came as part of a couple (43.6% and 39.6% respectively); this social composition is quite similar to Cooper-Hewitt where 38.5% came alone and 42.6% were accompanied by another adult.
Visitors coming to both Cooper-Hewitt and NPG were extremely well educated. Those with at least a Bachelor's degree made up 82.4% of the audience at Cooper- Hewitt and at least 68.6% of the audience at NPG. The differences in residence are significant. At Cooper-Hewitt over two-thirds (68.5%) were from the local New York Metropolitan Area. This is much greater than the proportion of local Washington Metropolitan Area visitors at the Portrait Gallery (47.9%). The majority of residents at both museums were Caucasian (93.1% at Cooper-Hewitt and 86.1% at NPG). And, when we look back at the 1990 study of the NMANNPG building, we see that the audience at the Portrait Gallery has essentially remained unchanged over the two-and- a-half year period.
In conclusion, statistical differences do exist between the two museums in terms of gender, residence, age, and occupation. Differences are not significant in educational attainment and social configuration. The table displaying these significance
-72-
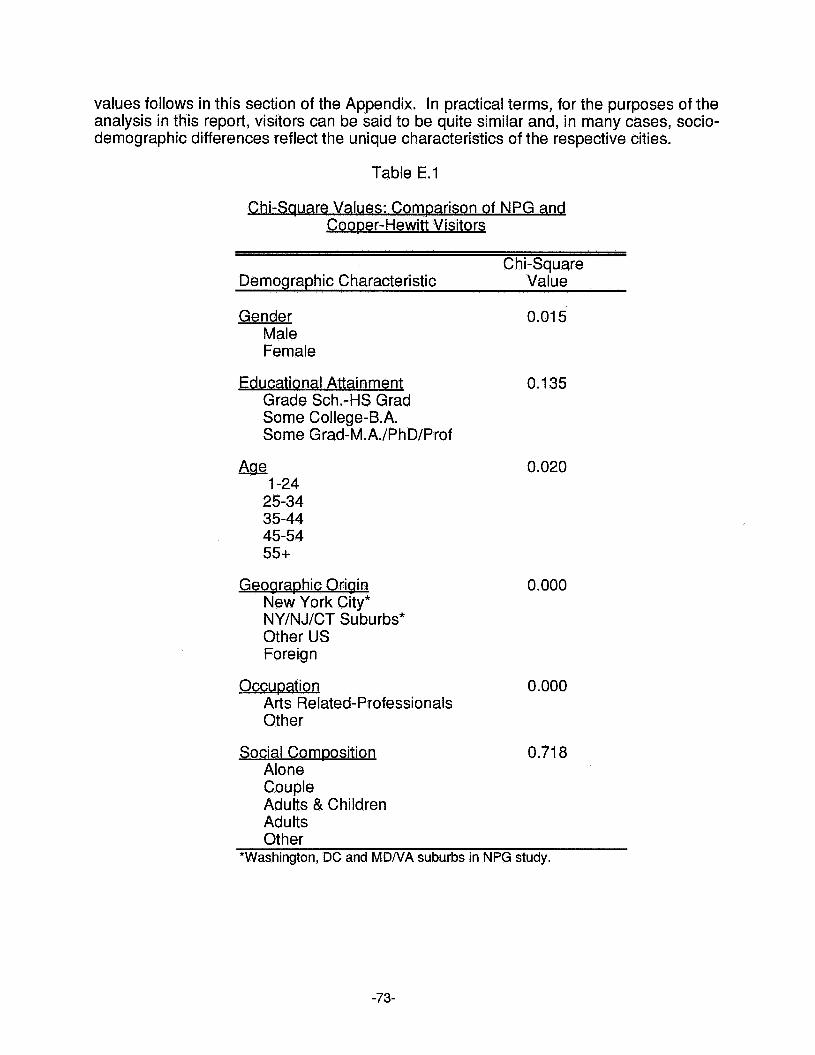
values follows in this section of the Appendix. In practical terms, for the purposes of the analysis in this report, visitors can be said to be quite similar and, in many cases, socio- demographic differences reflect the unique characteristics of the respective cities.
Table E.l
Chi-Saua re Values : Comparison of NPG and Cooper-Hewitt Visitors
C hi-Square Demographic Characteristic Value
Gender Male Female
0.01 5
Educat ional Attainment 0.1 35 Grade Sch.-HS Grad Some College-B.A. Some Grad-M.A./Ph D/Prof
Aae 1-24
25-34 35-44 45-54 55+
Geoaraphic Oriain New York City* NY/NJ/CT Suburbs* Other US Foreign
0.020
0.000
Occupat ion 0.000 Arts Related- P rofessio nals Other
Social Composition Alone Couple Adults & Children Adults Other
0.71 8
_ . -
*Washington, DC and MDNA suburbs in NPG study.
-73-

Appendix F. Rearession Models: Maps Messaae Scale Scores
Name Value Percentage I n te rp retatio n/
Demographic Characteristics Definitions
---- ---- Age in Years Mean 43.73
Standard Deviation 14.54 Minimum 9.00 Maximum 86.00
Unweighted N 986
Rac 'Ethnicity 1 91.5 Ca isasianwhite 0 8.5 Other RaciaVEthnic Group
Gender 1 48.3 Male
Educational Attainment* 0 51.7 Female
Less Than College
College
Graduate School
1 (Omitted Category)
1 44.8 Attended College or Received Bachelor's Degree
1 49.1 Attended Graduate School or Received Masters, Doctorate or
6.1 High School Graduate or Less
Other Professional Degree Occupation * Arts Professional 1 28.4 Professional Artist, Designer or Teacher
Other Professional 1 42.0 Scientist or Other Professional
Other Occupation 1 29.6 Writer, Clerical Worker, Student, Not Working (Omitted Category)
Exhibition Awareness Sources of I n fo r matio n ---- ---- Sources of Information about
Mean 0.70 Power of Maps Exhibition Standard Deviation 0.62
Minimum 0.00 Maximum 4.00
Unweighted N 986 Interview Location * NPG 1 27.2 Interviewed at National Portrait Gallery
Cooper-Hewitt Entrance 1 38.7 Interviewed Before Seeing Exhibition
Cooper-Hewitt Exit 1 34.1 Interviewed After Seeing Exhibition
* Coded as a series of dummy variables
(Omitted Category)
at Cooper-Hewitt Museum
at Cooper-Hewitt Museum
-74-

Appendix F. Rearession Models: Maps Messaae Scale Score
Intercept
Demographic Characteristics
Race/Et h nicity Gender
Age
Educational Attainment Less Than College College Graduate School
Occupation Arts Professional Other Professional Other Occupation
Exhibition Awareness Sources of Information
Interview Location NPG Cooper-Hewitt Entrance Cooper-Hewitt Exit
Adjusted R-Square
Initial Model 2oeff i ci e nt Si a n if i can ce
3.7695
-0.0051 -0.01 91 -0.0726
---- 0.1239 0.3867
0.5955 -0.1 999 ----
0.271 7
---- 0.1 689 0.6374
0.091 a
0.0001
0.1 571 0.9200 0.4927
---- 0.5835 0.091 5
0.0001 0.1 241
----
0.0023
---- 0.221 I 0.0001
0.0001
Final Model 2oefficient Sianificance
3.6626 0.0001
0.7381 0.0001
0.341 6 0.0001
0.5093 0.0001
0.0835 0.0001
-75-