Embed Size (px)
Citation preview
The Power of Council InformationPresenter - Jim Barclay, Chief Information Officer
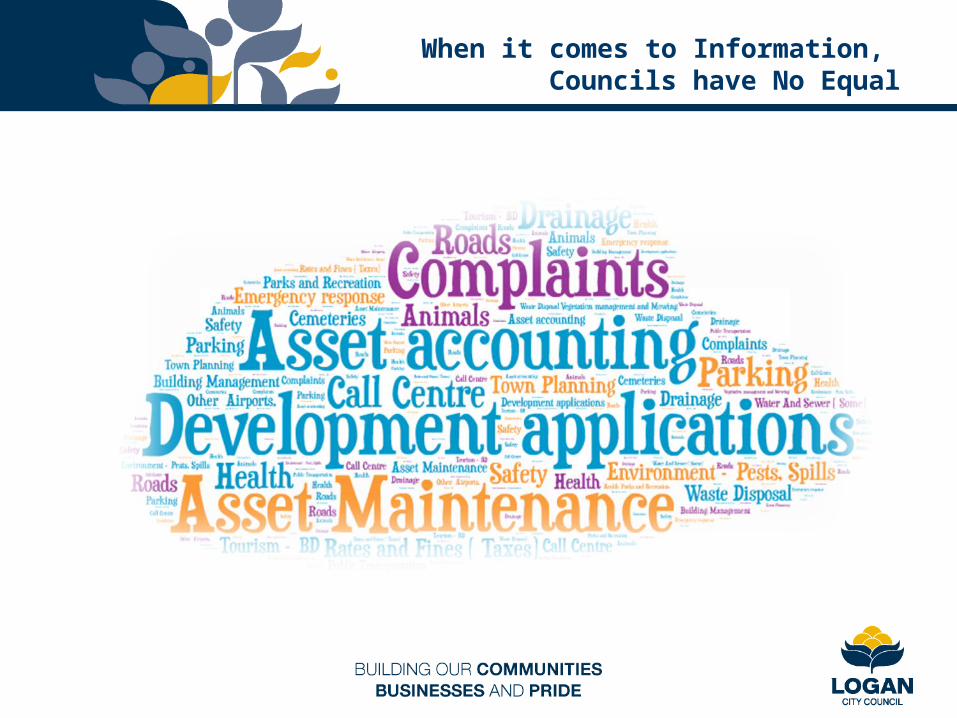
When it comes to Information, Councils have No Equal
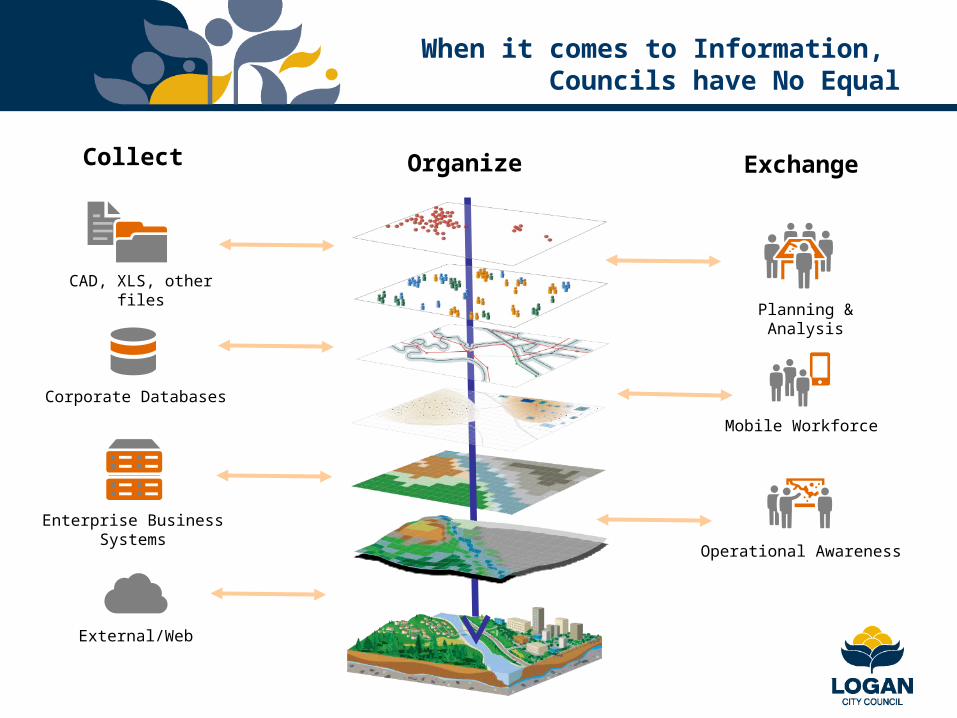
When it comes to Information, Councils have No Equal
External/Web
Enterprise Business Systems
Corporate Databases
CAD, XLS, other files
Operational Awareness
Mobile Workforce
Planning & Analysis
Collect Organize Exchange
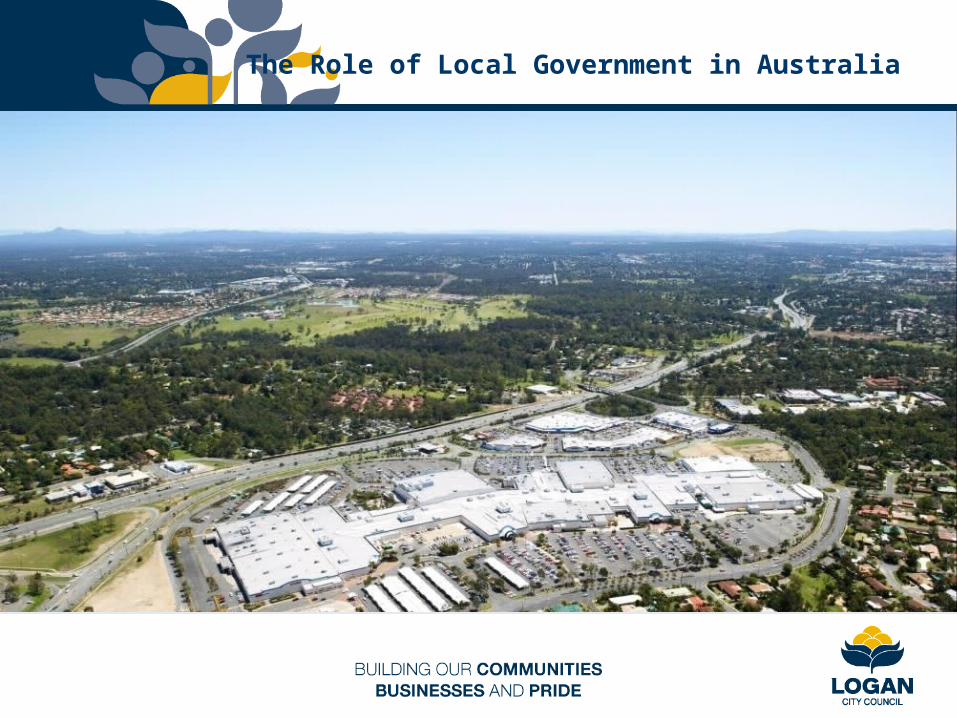
The Role of Local Government in Australia

Understanding our Communities
Information is a Valuable Resource
The right information at the right time:– Expand knowledge– Enable innovation– Boost productivity– Save lives
Value is enhanced when it is openly accessible and reused frequently

Savings and Benefits
We have the Knowledge and Information
In…– Paper– Books– Libraries– Microfiche– Boxes– People’s Heads– Computer Systems– CD/DVD– Other places that you and I can only imagine
sharing is hard…
The Change
– They want it in a style that they understand easily
– They do not want to purchase it
– They do not want to come to our office to get it
– They do not want to be blocked by the silos of Government, nor do they want to wait for you to find it
These expectations will keep increasing…
Getting on the Front Foot
• Value your information
• Do not get hung up on the information you are using and providing today
• Think about the information you will need to be using and providing in five (5) years time
• Look at what other Local Governments are doing around the world
• Start talking to State and Federal Governments about the information you need to be sharing in the future
• Do not “Loganize” things
• Make it easy to do business with and within your Council.
• Put the information in the correct location:– Public information in the public space– Private or Commercial in confidence and keep it internal– Confidential information in a locked vault with restricted access
Start the change now
What is Logan City Council doing?
We are…•Making it easier to do business with and within Logan City Council
•Sharing information with other Councils
•Talking to State and Federal Governments about opportunities of the future to share
•Focusing on the easy access to information rather than quality
•Changing information only as its source
•Making the information available to Staff and Councillors
•Moving information towards the door
•Getting used to giving information away to gain its true value to the City
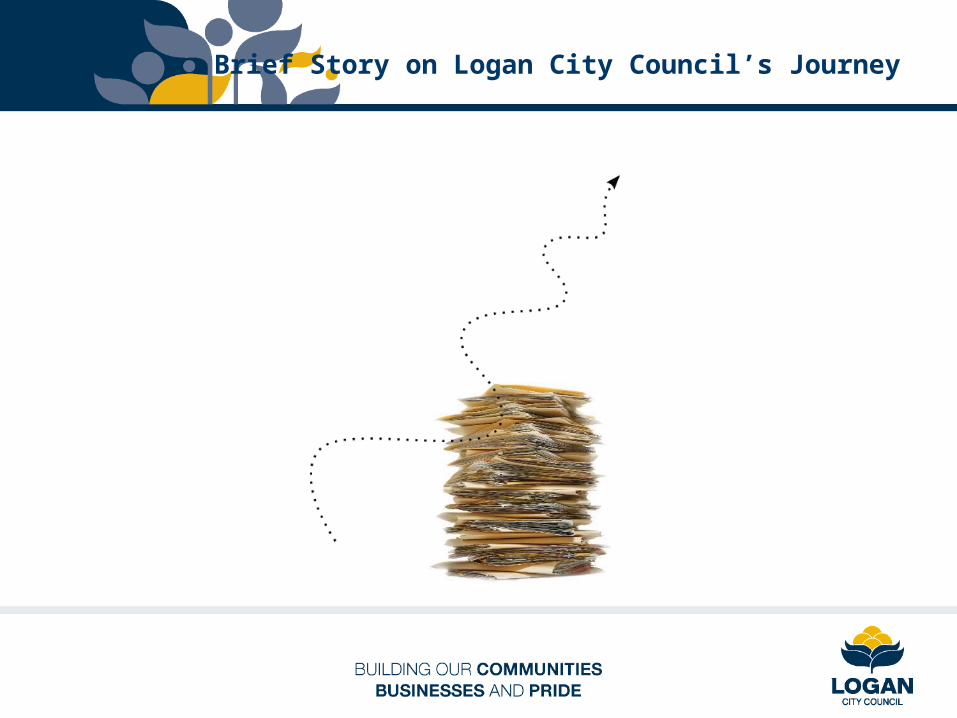
Brief Story on Logan City Council’s Journey
Text Based Road Information
Arterial Road Rehabilitation The City has a road network of approximately 3,680 lane-kilometers (lane-km) of paved roads. Approximately 1,465 lane-km of roadway are classified as Primary Collector, Arterial, Freeway, or Expressway roads which carry on average 20,000 to 45,000 vehicles/day. The remainders are Secondary Collector and Local roads. The City of London, Transportation Planning and Design Division has an annual Life Cycle program to repair and resurface the main arteries. Where feasible, work is coordinated with other infrastructure (sewer/watermain) repairs or road widening projects which sometimes results in the road surface deteriorating beyond a desirable condition as funding allocations do not always coincide.
Typical treatments utilized to maintain our roads include crack sealing, mill & pave, expanded asphalt with overlay, mat replacement, and/or full reconstruction. New technologies and materials continue to evolve and the City actively tries new methodologies in order to get the best value for our dollar.
Transportation Structure MaintenanceTransportation Planning and Design Division is responsible for the long term needs and management of the City’s transportation structures. With the convergence of the North and South Branch of the Thames River, major CP and CN Railway hubs, and the NAFTA Highway traversing through the City’s boundaries, London is a ‘bridge' city. Currently, within the 420 square kilometres that makes up the City of London, there are approximately 210 major structures in the City’s inventory, including 102 bridges, 94 large culverts, 7 pedestrian tunnels and 4 large pedestrian bridges ranging in age from brand new to 138 years old. These structures, along with minor pedestrian bridges, retaining walls and overhead sign structures are inspected every two years by a Professional Engineer in order to maintain a long term structure management system and optimize available funding for structure repairs, rehabilitations and replacements. Work on the structures is identified and prioritized as immediate, mid-term, and long-term with a 0-5, 6-10 and 11-20 year work plans developed for major and minor rehabilitations, normal and routine repairs, and/or replacement.
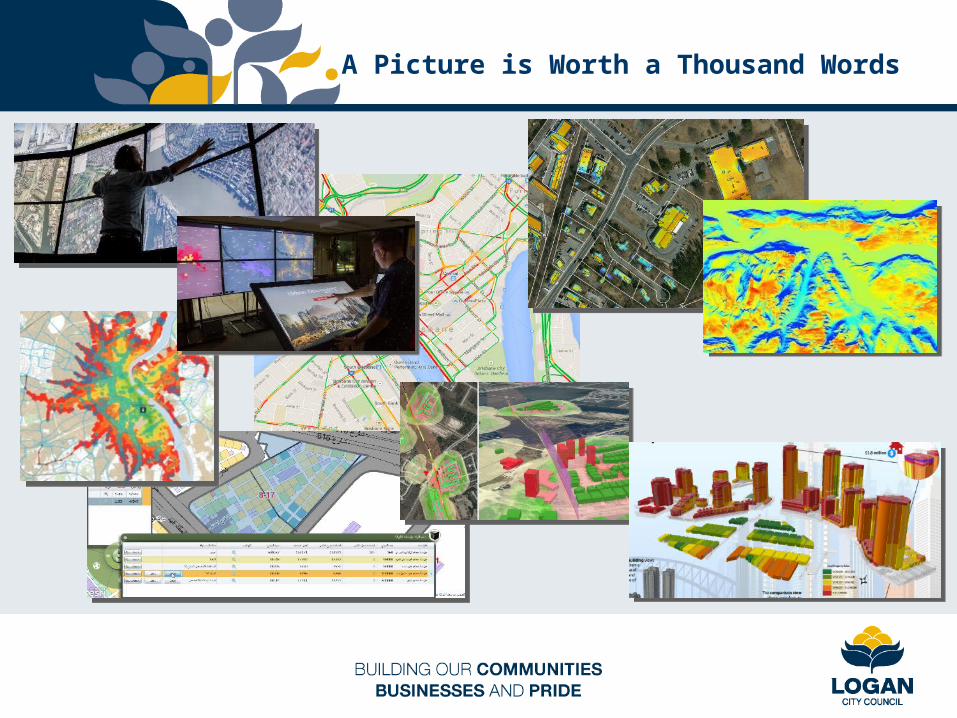
A Picture is Worth a Thousand Words
Sites of Interest
Geospatial Revolution series
Professional video series from Penn State University in 4 parts. The first part covers many of the historical aspects of mapping information.
http://geospatialrevolution.psu.edu/episode1
Local Government
Citywide Vision (Philadelphia 2035). This is an excellent example of a government communicating who it wants to be (the initial video), followed by what projects it has initiated to reach this goal, and what progress has been made towards these in each of the city areas.
http://philadelphia.maps.arcgis.com/apps/MapTour/index.html?appid=ec3dc24b512e4b908389ba257450d03a&webmap=a256bf4a82bb408980f68e462f0b531c#
Dangerous Dogs register (City of Minneapolis), but could be any other topic of community interest.
http://www.ci.minneapolis.mn.us/animals/dangerous/dangerous-dogs
Sidewalk Connectivity and points of interest (Kenton County).
http://nkapc.maps.arcgis.com/apps/MapJournal/index.html?appid=45163688d3ed46f19a829c3a1496f557&webmap=4f03319a5dae4e12bfff309dfc7ee9a2
Recovery Plan (Christchurch Central) showing a 2D Story Map with proposed development plans in central Christchurch. Many of the locations in the map view have embedded 3D web scenes showing interactive 3D views enabling the viewer a much better picture of how it will look. Make sure you have a modern browser for this (Firefox, Chrome, etc.), as the web scenes will not work on older ones.
http://nsg.maps.arcgis.com/apps/MapTour/index.html?appid=7fca7f7d656c468ba343c9df6f3a1f34&webmap=e2c47edf3eff470baa34354924ab057b
Sites of Interest
Active construction projects (Salem, Oregon) in and around the city.
http://salem.maps.arcgis.com/apps/MapJournal/index.html?appid=8aa6858ff1d944ed91e6018797f047f8
Transit orientated development (Honolulu) video showing the options and comparative impacts of unmanaged development vs transit orientated development.http://video.esri.com/watch/1640/city-and-county-of-honolulu-use-3d-to-analyze-transit_dash_oriented-development
3 clicks to any information (Port of Rotterdam) showing the simplicity which an organisation can find what it needs, and simple enough to be used by children.
http://video.esri.com/watch/3651/the-port-of-rotterdam
This in an extension of the above, and shows some of the integration between Geodesign and financial assessment – what financial impacts/returns there are through certain developments.
http://video.esri.com/watch/4167/lightning-talk-mapping-your-money
Health care
Medical Atlas showing several use cases for displaying health-related information using maps.
http://www.esri.com/esri-news/maps/2014/public-policy-maps/healthcare
Michelle Obama’s Lets Move campaign, referred to in the Geospatial Revolution video series above, helping American kids become more active and eat healthier.
http://www.letsmove.gov/activities-across-the-usa
http://www.arcgis.com/apps/MapJournal/?appid=7e0ab72747c94b5c89c9ede3798375a4
Sites of Interest
Federal Government Senators
These are a couple of example of US Senators using maps to communicate their activities and topic issues facing constituents in their state.
http://www.wyden.senate.gov/map-gallery
http://www.risch.senate.gov/public/index.cfm/idaho-map-gallery
Story Maps
There are hundreds more examples under various information topics.
http://storymaps.arcgis.com/en/
Living Atlas
http://doc.arcgis.com/en/living-atlas/
Queensland Globe
www.business.qld.gov.au/business/support-tools-grants/services/mapping-data-imagery/queensland-globe
NICTA National Map
http://nationalmap.nicta.com.au/
The QUT Cube Globe
http://www.thecube.qut.edu.au/project/cube-globe