Embed Size (px)
Citation preview
Technical University of Berlin
Faculty VII (School of Economics and Management)
Workgroup for Infrastructure Policy
Energy Economics - Student Research Project
The Potential of Sufficiency Measures to Achieve a
Fully Renewable Energy System
A case study for Germany
Authors:
Alfredo Zamora Blaumann (343460) - [email protected]
Carl-Christian Klötzsch (344972) - [email protected]
Citlali Rodriguez del Angel (346832) - [email protected]
Dylan Manning (459035) - [email protected]
Elmar Zozmann (404597) - [email protected]
Eric Rockstädt (363093) - [email protected]
Gro Lill Økland (452815) - [email protected]
Johanna Winkler (392239) - [email protected]
Michel Kevin Caibigan (459054) - [email protected]
Mirjam Helena Eerma (411198) - [email protected]
Morteza Lavaiyan (397557) - [email protected]
Nithish Kini Ullal (458480) - [email protected]
Paul Seifert (374906) - [email protected]
Seyedsaeed Hosseinioun (397543) - [email protected]
Supervisors:
Leonard Goeke
Mario Kendziorski
Dr. Jens Weibezahn
Prof. Dr. Christian von Hirschhausen
Berlin, Friday 6th August, 2021

© 2021. This work is licensed under CC BY 4.0.
To view a copy of this license, visit creativecommons.org/licenses/by/4.0.
DOI: http://dx.doi.org/10.14279/depositonce-12154
Abstract
AbstractAlthough behavioural changes during the COVID-19 pandemic lead to a noteable drop in an-
nual emissions, these effects are expected to be negligible, because no sustainable change in
behaviour can be observed. The growing body of scientific literature on the required low-carbon
transformation of the energy system is mostly focusing technological supply side solutions. On
the other hand, the demand side receives far less attention, despite having high potential for
mitigation. In contrast to research on energy efficiency, the concept of energy sufficiency re-
mains rather unexplored, although lifestyle changes towards a low-energy-demand future are
also increasingly associated with greater human well-being and satisfaction.
This paper therefore strives to answer the following question: What is the potential of sufficiency-
based demand reductions and what impacts do they have on the supply side of a 100% renew-
able energy system? Based on a literature review, alternative demand pathways for the sectors
heat, mobility and conventional electricity are derived. A demand reduction potential through
behavioural changes of up to 20.5% is identified, resulting in total annual demand reductions
of 300 TWh.
A least-cost capacity expansion model is applied to estimate the impacts of these reductions
on a greenfield, renewable energy supply for Germany in a scenario-based approach. Overall
results indicate that cost reductions of 11.3% to 25.6% in comparison to no lifestyle changes
are possible. The sectoral analysis shows that due to high peak loads, demand reductions
in the heat sector are significantly more cost-effective than demand reductions in the mobility
and conventional electricity sector. A further sensitivity analysis confirms that by cutting de-
mand peaks, less than 1% of overall demand reduction decreases the cost-optimal generation
capacity by 2% and storage capacity by 5%. Overall, this paper finds that (a) human lifestyle
changes have great potential to reduce energy consumption, (b) the impacts on the supply side
are significant and (c) should therefore be included in energy modeling and policy advice.
ii
Executive Summary
Executive SummaryAlthough there was a slight drop in annual emissions due to COVID-19, global emissions con-
tinue to increase and the pandemic is expected to have negligible long-term effect on climate
change. Whereas a growing number of countries are committing to net-zero emissions by
2050, the Nationally Determined Contributions (NDC) reveal a massive remaining emission
gap of current policies with at least 3 °C of global warming by the end of the century (UNEP,
2020). Hence, the climate crisis delivers an undeniable motivation for a rapid transformation of
the energy system.
There is a growing variety of approaches to enable a zero-carbon transformation. A majority
of scientific papers that aim at advising public policy focus mainly on technological supply-
side solutions. The demand-side solutions tend to receive far less attention, although they
have a high potential for mitigation and are associated with far less risk than the supply side
technologies. A growing body of scientific literature indicates that demand side solutions are
required to stay within 1.5 °C degrees. Whereas their focus mostly lies on energy efficiency, the
concept of energy sufficiency remains rather unexplored. However, besides the contribution
to the climate change mitigation, lifestyle changes towards a low-energy-demand future are
increasingly associated with greater human well-being and satisfaction. This paper connects
the demand-side solutions with the supply-side and strives to answer the following question:
What is the potential of sufficiency-based demand reductions and what impacts do they have
on the supply side of a 100% renewable energy system in Germany?
A cost-minimizing capacity expansion model is applied to estimate the impacts of these reduc-
tions on a greenfield, renewable energy supply for Germany in a scenario-based approach. The
model is implemented in the AnyMOD Framework (Göke, 2020a; Göke, 2020b), graph-based
framework that facilitates modeling high levels of renewable resources and sector integration.
The model’s objective consists of capacity expansion costs, energy system operating plus vari-
able costs, and energy trade costs. There is a list of predefined parameters for the set of
carriers and technologies in the model which are used to assign value to them in order to cre-
ate the desired energy system. The model’s constraints ensure that the hourly demand for
each carrier in each sector is fulfilled. In this regard, the required capacity to expand, generate,
store and transport the energy in all sort of available carriers and technologies are calculated
and compromised separately.
The technology input files are split into two categories, conversion technologies and storage
technologies. The conversion technologies convert energy from one form to another (an elec-
trolyzer converts electrical energy to chemical energy), or generate energy (such as wind or
iii
Executive Summary
solar). The following conversion technologies are included in the model input parameters:
rooftop photovoltaic (PV), open-space PV (ground-mounted), agricultural PV (raised ground-
mounted above partial-shade crops), on-shore and off-shore wind, hydrogen plant, electrolyzer,
and methanation. The costs assumed for capacity expansion for these technologies is taken
from projections made by Kost et al. (2018) (photovoltaic and wind) and Göke et al. (2019)
(electrolyzer and methanation). The capacity limits for onshore wind and solar are split into
six regions of Germany (East, West, Northeast, Northwest, Southeast, and Southwest) on an
hourly basis for an average year. The offshore wind capacity is treated as one region, and sim-
ilarly is on an hourly basis for one year. The capacity assumptions are derived from openEN-
TRANCE1, a European Union Horizon 2020 funded project. The following storage technologies
are included in the model: Li-ion batteries, Compressed Air Energy Storage (CAES), pumped
hydroelectric storage (involving two reservoirs of different elevations, water is pumped/released
during times of varying demand, storing/recapturing the energy), synthetic gas storage, and
hydrogen storage. The price assumptions for these technologies are taken from Kost et al.
(2018).
The model employed splits the energy system into three sectors: heat, mobility, and conven-
tional electricity. Based on a literature review, alternative demand pathways for these sectors
are derived. A demand reduction potential through behavioural changes of up to 20.5% is
identified, resulting in a total demand reductions of approximately 300 TWh. After extensive
literature review, reasonable demand reductions of 9.4% and 20.5% in Low and High ambition
scenarios are assumed, respectively. These reductions result in cost reductions of 11.3% to
25.6% in comparison to current consumption patterns. These demand reductions are applied
in an integrated scenario in two ways - by proportional demand reduction across all timesteps,
and by reducing only the peak load hours. These percentage demand reductions of a combined
Low ambition scenario equal a peak hour shedding at 163 GW, analogously the combined High
ambition scenario and the peak hours cut at 134 GW equal in amount of demand reduction.
Storage reduction for the combined Low scenario reach a level of 16%, while the same demand
reduction in the peak load hours only, reach a storage saving of 45%. Furthermore, savings in
renewable capacity are visible, even though they are respectively small compared to additional
storage size savings. The renewable capacity savings for the combined Low scenario is 13%
while that of the peak hour shedding at 134 GW is almost 3% more.
The sectoral analysis shows that due to high peak loads, demand reductions in the heat sector
are significantly more cost-effective than demand reductions in the mobility and conventional
1 Read more about openENTRANCE at https://openentrance.eu/
iv

Executive Summary
electricity sector. A further sensitivity analysis confirms cutting demand peaks can have an out-
sized impact on the capacity and storage required to meet demand, compared to proportional
demand reduction. Overall, this paper finds that human lifestyle changes have the potential
to significantly reduce energy consumption, and these reductions have meaningful impacts on
the cost required to meet demand with a 100% renewable energy system. These ideas and
concepts should therefore be included in energy modeling and policy advice, and are deserving
of further inspection.
v
Contents
Contents
Abstract ........................................................................................................................... i
Executive Summary......................................................................................................... iii
List of Figures.................................................................................................................. viii
List of Tables.................................................................................................................... ix
Acronyms......................................................................................................................... x
1 Introduction ................................................................................................................ 1
2 Literature Review........................................................................................................ 3
2.1 Theoretical background ........................................................................................ 3
2.2 Relevant literature for sufficiency and energy system modelling............................. 4
3 Quantifying Potential for Sufficiency-based Demand Reductions ........................... 7
3.1 Conventional electricity sector............................................................................... 7
3.2 Mobility sector ...................................................................................................... 10
3.2.1 Road ......................................................................................................... 12
3.2.2 Rail ........................................................................................................... 13
3.2.3 Aviation ..................................................................................................... 14
3.3 Heat sector........................................................................................................... 16
3.3.1 Residential and commercial heating demand ............................................. 16
3.3.2 Process heat ............................................................................................. 18
4 Methodology and Data ............................................................................................... 23
4.1 Model description ................................................................................................. 23
4.2 Renewable technology.......................................................................................... 24
4.3 Demand data........................................................................................................ 26
5 Sector-specific Scenarios .......................................................................................... 28
5.1 Conventional electricity demand reduction ............................................................ 28
5.2 Mobility demand reduction .................................................................................... 29
5.3 Heat demand reduction ........................................................................................ 30
5.3.1 Private and commercial heat scenario........................................................ 30
5.3.2 Process heat scenario ............................................................................... 31
5.3.3 Load shifting potential of heating demand .................................................. 32
vi
Contents
5.3.4 Entire heating sector.................................................................................. 33
6 Integrated Scenarios .................................................................................................. 34
6.1 Downward shifting load curve ............................................................................... 34
6.2 Peak load shedding .............................................................................................. 34
6.3 Sensitivity scenario of peak load shedding ............................................................ 35
7 Results........................................................................................................................ 37
7.1 Conventional electricity sector............................................................................... 37
7.2 Mobility sector ...................................................................................................... 38
7.3 Heating sector ...................................................................................................... 39
7.3.1 Reduction of private and commercial demand............................................ 39
7.3.2 Reduction of process heat demand............................................................ 41
7.3.3 Load shifting potential of heating demand .................................................. 42
7.4 Comparison of sectoral potential and impact ......................................................... 44
7.4.1 Integrated sector results ............................................................................ 44
7.4.2 Comparison of sectoral results................................................................... 46
7.4.3 Peak load shedding results ........................................................................ 47
7.4.4 Sensitivity analysis of peak load shedding.................................................. 48
8 Conclusion.................................................................................................................. 50
A Supplementary data ................................................................................................... 52
References....................................................................................................................... 54
vii
List of Figures
List of Figures1 Conventional electricity consumption in Germany.................................................. 8
2 Energy consumption of the mobility sector in Germany ......................................... 11
3 Residential space heating by energy source for Germany ..................................... 17
4 Qualitative energy flow diagram for reference case................................................ 24
5 Renewable potentials of the model........................................................................ 25
6 AnyMOD Energy Flow Graph.................................................................................... 25
7 Load profile: All sectors and reference case................................................................ 27
8 Impact of sufficiency measures on the demand of the conventional electricity sector 29
9 Impact of sufficiency measures on the demand of the mobility sector .................... 30
10 Impact of sufficiency measures on the demand of the residential and commercial
heat sector ........................................................................................................... 31
11 Load profile: Private and commercial heating demand .......................................... 33
12 Impact of sufficiency measures on the demand of the combined Low and High
ambitions scenarios.............................................................................................. 34
13 Load profile: Demand curves for sufficiency scenarios and peak load shedding .... 35
14 Load profile: Demand profile for load shedding scenarios...................................... 36
15 Renewable generation capacity and storage size in the electricity sector ............... 38
16 Renewable generation capacity and storage size in the mobility sector.................. 39
17 Renewable generation capacity and storage size in the private and commercial
heating sector....................................................................................................... 40
18 Renewable generation capacity and storage size in the industrial process heat
sector ................................................................................................................... 41
19 Storage costs and size for different load shifting assumptions of the private and
commercial heating demand sector....................................................................... 43
20 Total system costs for different load shifting assumptions of the private and com-
mercial heating demand sector ............................................................................. 43
21 Renewable generation capacity and storage size in the combined Low and High
ambitions scenarios.............................................................................................. 45
22 Comparison of the High ambitions scenarios impact to the energy system for the
three sectors ........................................................................................................ 46
23 Renewable generation capacity and storage cost for High ambitions scenarios ..... 47
24 Comparison sufficiency scenarios and peak load shedding to include the same
amount of demand reduction ................................................................................ 48
25 Total reductions of load shedding scenarios .......................................................... 49
viii
List of Tables
List of Tables1 Conventional electricity demand reduction measures from literature related to
behavioral change ................................................................................................ 9
2 Transport demand reduction measures from literature related to behavioral change 12
3 Heating demand reduction measures from literature related to behavioral change . 16
4 Process heat demand share of industry branches ................................................. 19
5 Saving potential in Low and High Ambition scenarios for conventional electricity
demand ................................................................................................................ 28
6 Saving potential in Low and High Ambition scenarios for mobility demand............. 29
7 Saving potential in Low and High Ambition scenarios for private and commercial
heating demand.................................................................................................... 31
8 Saving potential in Low and High Ambition scenarios for industrial process heat-
ing demand .......................................................................................................... 32
9 Saving potential in Low and High Ambition scenarios for heating sector ................ 33
10 Saving potential in Low and High Ambition scenarios in each sector ..................... 34
11 Total system cost savings for the electricity sector ................................................. 37
12 Total system cost savings for the mobility sector.................................................... 38
13 Total system cost savings for the private and commercial part of the heat sector ... 41
14 Total system cost savings for the industry process heat sector .............................. 42
15 Total system cost savings combined sector Low and High scenario....................... 44
16 Comparison of total system cost reductions for two different methods of imple-
menting demand side reductions........................................................................... 48
ix

Acronyms
AcronymsCAES Compressed Air Energy Storage
CBSM Community-Based Social Marketing
CCTS Carbon-Capture-Transport-and-Storage
eceee European Council for an Energy Efficient Economy
GCAM Global Change Assessment Model
GHG Greenhouse Gas
ICT information and communication technology
MIT Motorized Individual Transport
NDC Nationally Determined Contributions
PV photovoltaic
RES Renewable Energy Sources
x
Introduction
1. IntroductionAlthough behavioural changes during the COVID-19 pandemic lead to a noteable drop in an-
nual emissions, these effects are expected to be negligible, because no sustainable change in
behaviour can be observed. Since the Paris Agreement in 2015, annual CO2 emissions have
increased by more than 4% and the remaining emission budget to stay within 1.5°C of global
warming is rapidly shrinking (Friedlingstein et al., 2019; Peters et al., 2020; Mundaca et al.,
2019). Although there is a growing number of countries committing to net-zero emissions by
2050, the Nationally Determined Contributions (NDC) reveal a massive remaining emissions
gap of current policies, resulting in at least 3°C of global warming projected by the end of the
century (UNEP, 2020).
There is a large and growing variety of approaches to enable a zero-carbon transformation, but
a majority of scientific papers that aim at advising public policy focus on technological supply
side solutions. Emerging pathway literature widely includes Carbon-Capture-Transport-and-
Storage (CCTS), nuclear energy and a large-scale deployment of hydrogen to decarbonize
the supply side. In contrast, demand side solutions receive far less attention, although they
have high potential for mitigation and are associated with far less risk than the mentioned
supply side technologies. Approximately two thirds of global emissions are linked to private
households in consumption-based accounting, and final energy use is the most inefficient part
of the energy system (Grubler et al., 2018; Samadi et al., 2017; UNEP, 2020). Simultaneously,
a growing body of scientific literature indicates that demand side solutions are required to stay
within 1.5 °C degrees. The existing demand side solutions are not only insufficiently covered by
quantitative energy system models, but also strongly focus on energy efficiency. In contrast, the
concept of energy sufficiency remains rather unexplored, although lifestyle changes towards a
low-energy-demand future are also increasingly associated with greater human well-being and
satisfaction. This paper therefore strives to answer the following question: What is the potential
of sufficiency-based demand reductions and what impacts do they have on the supply side of
a 100% renewable energy system in Germany?
Based on a extensive literature review, alternative demand pathways for the sectors heat, mo-
bility and conventional electricity are derived. A demand reduction potential through behavioral
changes of up to 20.5% is identified, resulting in total demand reductions of 300 TWh. A least-
cost capacity expansion model is applied to estimate the impacts of these reductions on a
greenfield, renewable energy supply for Germany in a scenario-based approach. The model is
implemented in the AnyMOD Framework (Göke, 2020a; Göke, 2020b) with renewable availabil-
ity time series in a high temporal resolution and technology cost assumptions for 2035. Overall
1
Introduction
results indicate that cost reductions of 11.3% to 25.6% in comparison to no lifestyle changes
are possible. The sectoral analysis shows that due to high peak loads, demand reductions
in the heat sector are significantly more cost-effective than demand reductions in the mobility
and conventional electricity sector. A further sensitivity analysis confirms that by cutting de-
mand peaks, less than 1% of overall demand reduction decreases the cost-optimal generation
capacity by 2% and storage capacity by 5%. Overall, this paper finds that (a) human lifestyle
changes have the potential to reduce energy consumption, (b) the impacts on the supply side
are significant and (c) should therefore be included in energy modeling and policy advice.
The following analysis is structured as follows: Section 2 provides an overview on the existing
literature that relates to sufficiency in existing capacity expansion modeling studies and the
economic aspect of behavioral changes. The potential for sufficiency-based demand reductions
in the three sectors is quantified in Section 3. Section 4 contains a description of the applied
model, including the relevant input data and cost assumptions. The demand reduction potential
identified in Section 3 is translated to sector-specific scenarios in Section 5. The scenarios for
the combined sectoral analysis are described in Section 6, including a sensitivity analysis on
peak load shedding. Section 7 discusses the most relevant results and Section 8 concludes.
2
Literature Review
2. Literature ReviewIn this Section, first the theoretical background of sufficiency is briefly explained. Then, the
related literature on incorporating behavioural change of demand for energy services in en-
ergy system modelling is concisely expressed. The related literature on quantifying potential
sufficiency measures in the three sectors chosen for this study will be elaborated in Section 3.
2.1. Theoretical background
Similar to any other intellectual concept, there have been several definitions for the term "energy
sufficiency" in the related literature. Here, some of the main and explicit ones are provided. Ac-
cording to Darby and Fawcett (2018), energy sufficiency is defined as "a state in which humanity
would only consume energy services equitably and in quantities compatible with sustainabil-
ity and ecological limits". Regarding energy sufficiency as a strategy, Toulouse, Le Dû, et al.
(2017) describe it as "favoring behaviours and activities that are intrinsically low on energy use".
In the Energy Sufficiency Project which is run by the European Council for an Energy Efficient
Economy (eceee), energy sufficiency is described as "the situation where everyone has access
to all the energy services they need and a fair share of the energy services they want whilst, at
the same time, the impacts of the energy system do not exceed environmental limits"2.
These definitions promote the differences between "energy" and "energy services" to better
capture the idea behind what sufficiency means in this context. Energy services are assumed
to be the utility which is gained by consuming energy in different manners and in various con-
ditions (Toulouse, Sahakian, et al., 2019). With this focus on energy services instead of energy
itself, it is easier to realize the notion of sufficiency in terms of meeting the needs and not con-
suming too much. Moreover, the definitions focus on people’s needs to indicate the difference
between needs and wants. Proposed by social and philosophical sciences where there have
been efforts to define the universal human needs, the debate on how to distinguish the neces-
sities and preferences remains in the relevant literature of energy services as well (Wilhite and
Norgard, 2003). The theory of need put forward by Gough (Gough, 2015; Gough, 2017) brings
forth the basis for sufficiency as it outlines the distinction between wants that are derived from
preferences and needs that are vital for social and physical survival of humanity. It is worth
to mention that he refers to social needs, being elucidated as essential capabilities of chasing
one’s goals and dreams in life (Gough, 2015). "Social need" is also described by Sen’s capabil-
ity approach (Sen, 1999) as what people can do from both an individual and social perspective.
In other words, what an independent individual needs to be a part of society. In this report,
sufficiency is defined as the reduction of energy consumption to a level where benefit is not
2 https://www.energysufficiency.org/about/undersida/, accessed: 2021-02-20
3
Literature Review
significantly diminished.
The concept of sufficiency to meet sustainability goals is something beyond efficiency and con-
sistency. While efficiency improves the input-output-ratio and consistency changes production
and consumption patterns (e.g. replacing fossil generation with renewable generation), suffi-
ciency aims directly at limiting energy consumption,while still providing energy services that
contribute to human well-being in an equitable and affordable way (Darby and Fawcett, 2018).
In other words, efficiency is about doing things right whereas sufficiency is about doing the right
things (Samadi et al., 2017).
With regard to triggering the behavioral change and spreading energy-sufficient way of living,
sufficiency policies should usually take into account two phases: (a) investment phase, mean-
ing that policies target size of products or promote common usage, and (b) the usage phase,
meaning that policies promote a more aware usage of services, e.g. shorter travel distances
or a lower room temperature in winter (Samadi et al., 2017). Moreover, political instruments
to achieve sufficiency can be roughly divided into (a) the modification of individual preference
(meaning changing or moving the utility function of humans), (b) providing external incentives
in form of a tax and (c) command and control, meaning the implementation of bans and limits
(Samadi et al., 2017).
2.2. Relevant literature for sufficiency and energy system modelling
Emphasized by the experts and scientists in the field of sufficiency, Toulouse, Sahakian, et al.
(2019) indicate that incorporating sufficiency in energy system modelling and defining quan-
titative scenarios for it is necessary to provide objective criteria for policy-makers. They also
address that related research on sufficiency should be more developed and extended. The ar-
eas/sectors with higher priority for research with regards to sufficiency, as indicated by those ex-
perts, include mobility, heating and cooling spaces, work and income and finally, food. Grubler
et al. (2018) provide a narrative for a low energy demand future that is able to meet the 1.5 °C
target without relying on negative emission technologies. They also find that increasing the use-
efficiency of the energy services has great potential to improve the feasibility of a low-carbon
transformation of the supply side. Samadi et al. (2017) give a definition of sufficiency in the
energy context as a Greenhouse Gas (GHG) mitigation option, arguing that sufficiency has a
large potential to contribute to emission reduction. They review existing prominent energy sce-
narios and find that most of them do not include sufficiency, concluding that sufficiency in terms
of behavioral changes should be included at least in one scenario of energy system models.
Moreover, Pfenninger et al. (2014) demonstrate the current status of energy system modelling
in application, its transition, challenges and probable potentials for the future policy-making.
4
Literature Review
One of the main challenges that they address, is how to add the recently-developed concept of
demand flexibility and its behavioral aspect, which is at least equally important if not more, in
the models.
There have been some studies during the recent years that tried to incorporate sufficiency
or demand behavioral changes into the energy system modelling or future energy roadmaps.
Using the REMod optimization model, Sterchele et al. (2020) illustrate and evaluate the tra-
jectories towards a carbon-free energy system for Germany until 2050. In their model, they
incorporate scenarios that include the related social contexts of sufficiency for the energy tran-
sition paths. They have defined six scenarios, two of which represent the energy transition
with measures of sufficiency for the years 2030 and 2050. Their results demonstrate that the
sufficiency scenario until the end of 2050 has by far the lowest net cumulative expenditures
and CO2 avoidance costs over the period of 2020 to 2050. Although, their study is one of a
few which take into account the behavioral changes in energy consumption, their sufficiency
scenarios include a single level of demand reduction. Ven et al. (2018) utilize Global Change
Assessment Model (GCAM) to incorporate behavioral without initial investments for individu-
als into the emission reduction scenarios for the EU. Those measures include diet and food
consumption, mobility choices and households’ treatment. The results of their model demon-
strate that modest to strict behavioral change can decrease the CO2 footprint per capita by 6%
to 16%, respectively. Moreover, it can be observed that these behavioral flexibilities are able
to reduce the related costs of climate policies e.g. emission trading scheme by a scale from
13.5% to 29.5%. Therefore, policymakers should consider behavioral change as a strong sup-
port for emission reduction policies. In order to prepare a roadmap for a smart energy system
with 100% renewable energy production in Denmark, Mathiesen et al. (2015) incorporate en-
ergy saving scenarios into their model for the years 2035 and 2050. They consider enhanced
regulations, behavioral changes, and technical improvements to be the foundation of electric-
ity saving. The results of their model illustrate that a high level of energy savings can reduce
the demand for biomass. However, they include both sufficiency and efficiency measures into
energy saving measures simultaneously and do not take into account the effect of each sepa-
rately. Also, they do not mention any clear consideration of sufficiency measures for heat and
transport sector. Auer et al. (2020) design four main trajectories for the low-carbon future of
the energy system in Europe three of which include behavioral changes in the demand from
individuals and communities. They compare these scenarios based on quantitative measures
like primary energy demand, installed capacities, electricity generation and annual emission.
Yet, they do not specifically focus on sufficient measures of communities.
5

Literature Review
As noted, none of the previously reviewed studies evaluate the influence of sufficiency in differ-
ent sectors on the trajectories of energy systems which, as mentioned earlier, can be of utmost
importance for the related policies of energy transformation. Nevertheless, the négaWatt As-
sociation in France has conducted country-level research and published a scenario for 2050,
which also covers consumption reduction through behavioral change (Association négaWatt,
2017). They demonstrate that sufficiency in different sectors can contribute to reducing final
energy consumption in 2050 by 60%. In this report, demand reductions in Germany are con-
sidered, divided into three sectors: heat, mobility and electricity. The scenarios for each sector
are quantified (Section 5) based on the demand reduction potential gathered from related liter-
ature which are elaborated in the next section.
6
Quantifying Potential for Sufficiency-based Demand Reductions
3. Quantifying Potential for Sufficiency-based Demand ReductionsIn the following section, the concept of sufficiency is used to identify areas where energy de-
mand could be reduced without violating basic human needs. Therefore, demand reduction
potentials are quantified based on existing literature in the sectors conventional electricity, heat
and mobility.
3.1. Conventional electricity sector
This section analyzes the conventional electricity consumption in Germany and the possible
measures to reduce its total demand. The sector includes electricity used for traditional appli-
cations such as lighting, information and communication technology (ICT), refrigeration, and
mechanical energy. So far, efficiency and consistency have played an important role in reduc-
ing the conventional electricity consumption, however, a growing proliferation of appliances,
increase in sizes and functionalities, longer usage hours, and new areas of application can
be observed (Toulouse and Attali, 2018). This perspective indicates that efficiency and con-
sistency alone will not be enough to achieve climate protection goals, thus societal behavior
will play a decisive role in whether and in what form the energy transition can be implemented
(Sterchele et al., 2020).
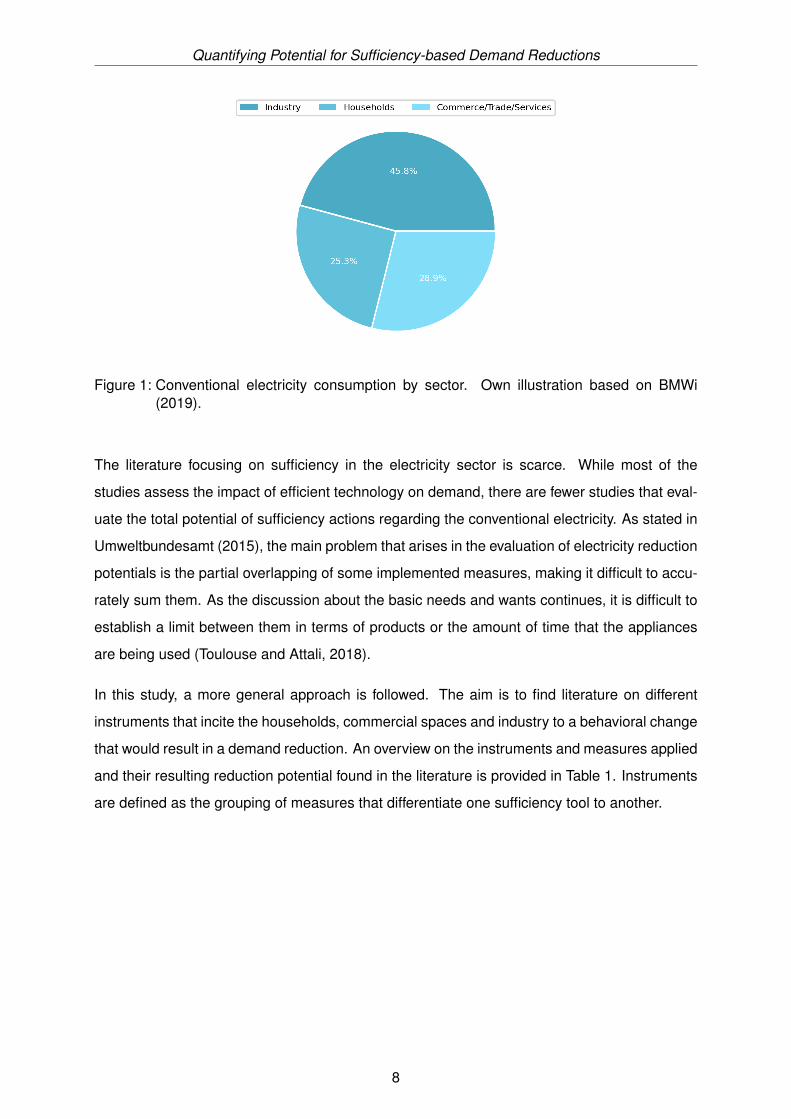
Based on the differences in utilization of electricity and the shares provided in BMWi (2019),
the total conventional electricity consumption is distributed between households, commercial
spaces and industry (Figure 1). The highest share of electricity in households is used for
low process heat (i.e. cooking and baking) and cooling. Also, ICT has a considerable share in
electricity consumption. In the commercial sector, most electricity is used for lightning and other
appliances, such as PCs. In industry, the use of electricity to operate electric driven-motors
and machines dominates the demand. The mentioned partition helps to identify measures in
the literature to save a maximum of energy and analyze how much demand reduction these
measures could bring.
7
Quantifying Potential for Sufficiency-based Demand Reductions
Figure 1: Conventional electricity consumption by sector. Own illustration based on BMWi(2019).
The literature focusing on sufficiency in the electricity sector is scarce. While most of the
studies assess the impact of efficient technology on demand, there are fewer studies that eval-
uate the total potential of sufficiency actions regarding the conventional electricity. As stated in
Umweltbundesamt (2015), the main problem that arises in the evaluation of electricity reduction
potentials is the partial overlapping of some implemented measures, making it difficult to accu-
rately sum them. As the discussion about the basic needs and wants continues, it is difficult to
establish a limit between them in terms of products or the amount of time that the appliances
are being used (Toulouse and Attali, 2018).
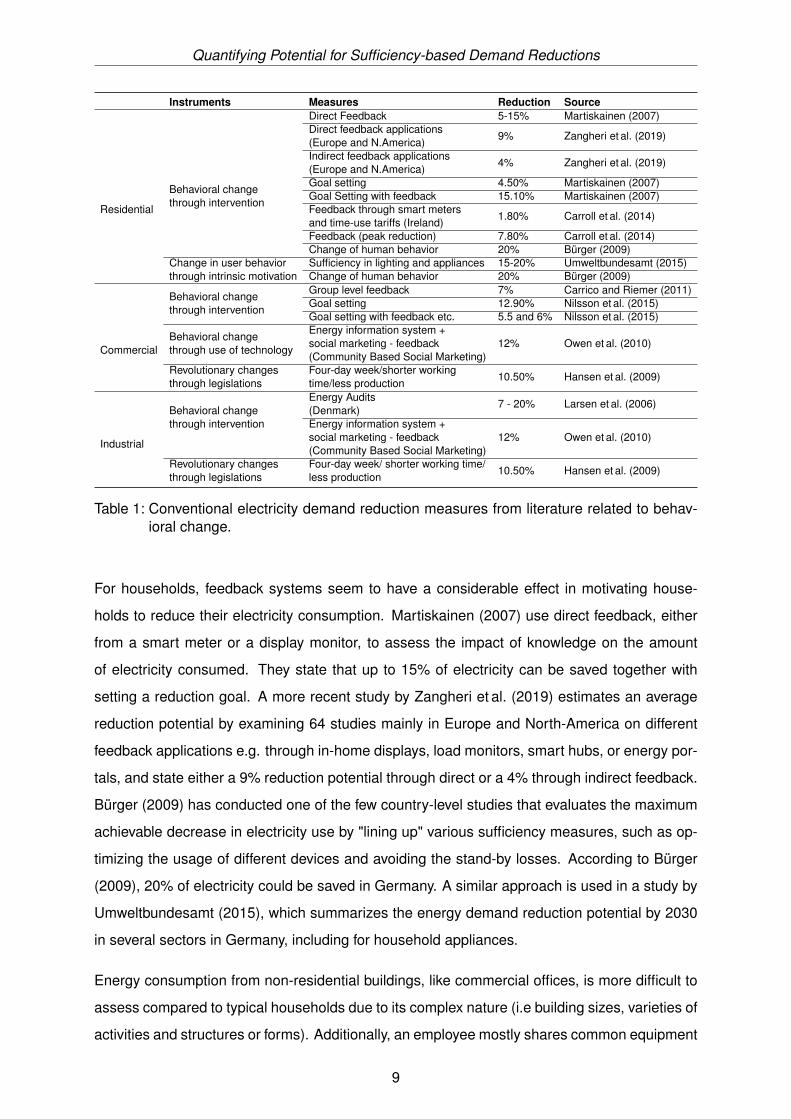
In this study, a more general approach is followed. The aim is to find literature on different
instruments that incite the households, commercial spaces and industry to a behavioral change
that would result in a demand reduction. An overview on the instruments and measures applied
and their resulting reduction potential found in the literature is provided in Table 1. Instruments
are defined as the grouping of measures that differentiate one sufficiency tool to another.
8
Quantifying Potential for Sufficiency-based Demand Reductions
Instruments Measures Reduction SourceDirect Feedback 5-15% Martiskainen (2007)Direct feedback applications(Europe and N.America)
9% Zangheri et al. (2019)
Indirect feedback applications(Europe and N.America)
4% Zangheri et al. (2019)
Goal setting 4.50% Martiskainen (2007)Goal Setting with feedback 15.10% Martiskainen (2007)Feedback through smart metersand time-use tariffs (Ireland)
1.80% Carroll et al. (2014)
Feedback (peak reduction) 7.80% Carroll et al. (2014)
Behavioral changethrough intervention
Change of human behavior 20% Bürger (2009)Sufficiency in lighting and appliances 15-20% Umweltbundesamt (2015)
Residential
Change in user behaviorthrough intrinsic motivation Change of human behavior 20% Bürger (2009)
Group level feedback 7% Carrico and Riemer (2011)Goal setting 12.90% Nilsson et al. (2015)
Behavioral changethrough intervention
Goal setting with feedback etc. 5.5 and 6% Nilsson et al. (2015)
Behavioral changethrough use of technology
Energy information system +social marketing - feedback(Community Based Social Marketing)
12% Owen et al. (2010)Commercial
Revolutionary changesthrough legislations
Four-day week/shorter workingtime/less production
10.50% Hansen et al. (2009)
Energy Audits(Denmark)
7 - 20% Larsen et al. (2006)Behavioral changethrough intervention Energy information system +
social marketing - feedback(Community Based Social Marketing)
12% Owen et al. (2010)Industrial
Revolutionary changesthrough legislations
Four-day week/ shorter working time/less production
10.50% Hansen et al. (2009)
Table 1: Conventional electricity demand reduction measures from literature related to behav-ioral change.
For households, feedback systems seem to have a considerable effect in motivating house-
holds to reduce their electricity consumption. Martiskainen (2007) use direct feedback, either
from a smart meter or a display monitor, to assess the impact of knowledge on the amount
of electricity consumed. They state that up to 15% of electricity can be saved together with
setting a reduction goal. A more recent study by Zangheri et al. (2019) estimates an average
reduction potential by examining 64 studies mainly in Europe and North-America on different
feedback applications e.g. through in-home displays, load monitors, smart hubs, or energy por-
tals, and state either a 9% reduction potential through direct or a 4% through indirect feedback.
Bürger (2009) has conducted one of the few country-level studies that evaluates the maximum
achievable decrease in electricity use by "lining up" various sufficiency measures, such as op-
timizing the usage of different devices and avoiding the stand-by losses. According to Bürger
(2009), 20% of electricity could be saved in Germany. A similar approach is used in a study by
Umweltbundesamt (2015), which summarizes the energy demand reduction potential by 2030
in several sectors in Germany, including for household appliances.
Energy consumption from non-residential buildings, like commercial offices, is more difficult to
assess compared to typical households due to its complex nature (i.e building sizes, varieties of
activities and structures or forms). Additionally, an employee mostly shares common equipment
9
Quantifying Potential for Sufficiency-based Demand Reductions
with other employees which makes them feel less responsible in conserving energy (Carrico
and Riemer, 2011). Yet, there is a huge potential to reduce electricity consumption through
sufficiency (Toulouse and Attali, 2018). Also in commercial spaces, a similar approach as
in households to incite employees to energy conservation is found in the literature. Carrico
and Riemer (2011) and Nilsson et al. (2015) both use the group feedback system and peer
education as a tool to change employee behavior and stated a promising 7% and 6% reduction
in electricity consumption. Hansen et al. (2009) provided a promising overall energy demand
reduction due to several behavioral changes brought by the changing working schedules during
the program. Assuming that in the future a 4-days-week work is possible, 10,50% alone could
be saved.
As for industrial demand, Banks et al. (2012) and Larsen et al. (2006) have cited energy au-
dits, energy and environment management systems, and voluntary agreements as possible
measures to reduce energy in energy intensive sectors, as it pushes the entire organization to
follow an internationally recognized process that influences overall energy consumption. Fur-
thermore, Owen et al. (2010) declare a 12% reduction potential through Community-Based
Social Marketing (CBSM), such as energy information and feedback systems. Moreover, the
4-days-week work alternative by Hansen et al. (2009) could be partly transferred over to in-
dustry, since the office spaces are mostly utilizing the same lighting and equipment as far as
conventional electricity is concerned.
3.2. Mobility sector
Following the structure of conventional electricity, this section provides an overview of the en-
ergy consumption in the mobility sector alongside with a short literature review of other studies
that quantified sufficiency-based demand reductions in the mobility sector. Finally, potential
demand reductions through more sufficient behavior are discussed.
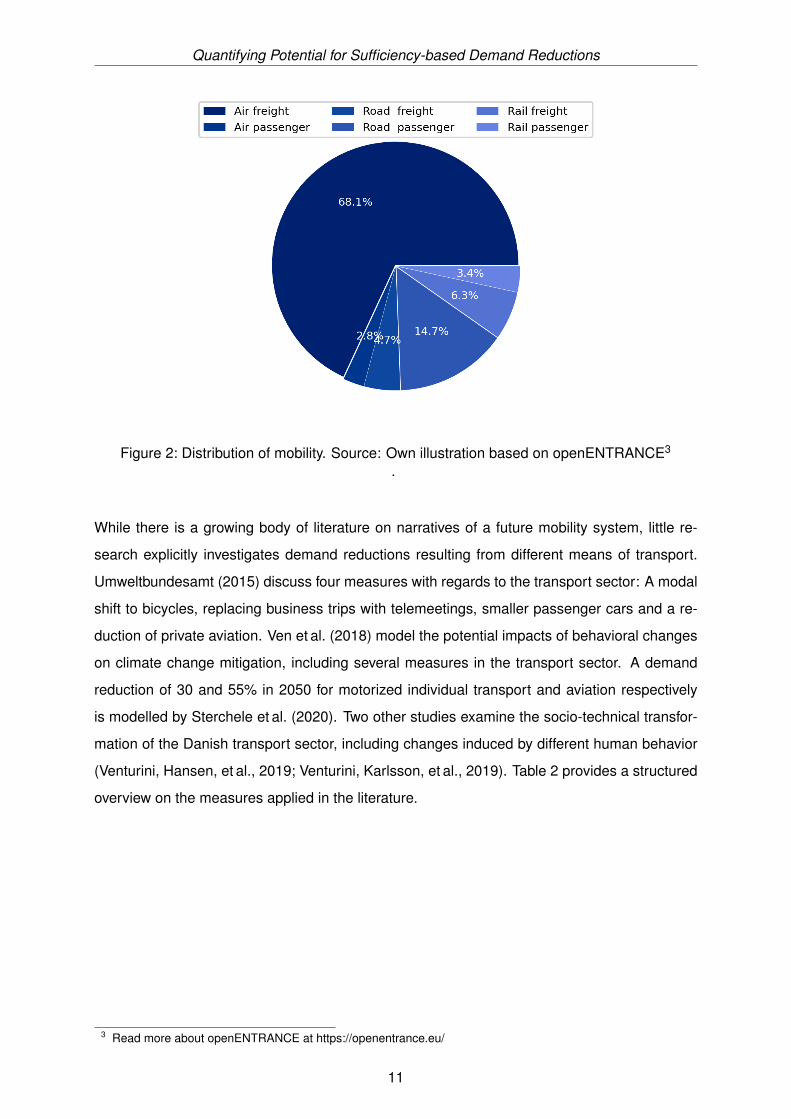
Despite increases in energy efficiency in the mobility sector, its energy consumption has been
rising continuously since 2010 (BMWi, 2019). To reverse this trend and achieve climate targets,
the German Government determined a final energy consumption reduction of 15% to 20% in
the mobility sector is required compared to 2005 levels in order to achieve reductions of 60%
by 2050 in total energy demand. In the following analysis, mobility demand is split in the
sub-categories rail, road and air transport, which are divided again into passenger and freight
transport. While rail and road technologies are expected to run with electricity only, air transport
demand is fully met by hydrogen.
10
Quantifying Potential for Sufficiency-based Demand Reductions
Figure 2: Distribution of mobility. Source: Own illustration based on openENTRANCE3
.
While there is a growing body of literature on narratives of a future mobility system, little re-
search explicitly investigates demand reductions resulting from different means of transport.
Umweltbundesamt (2015) discuss four measures with regards to the transport sector: A modal
shift to bicycles, replacing business trips with telemeetings, smaller passenger cars and a re-
duction of private aviation. Ven et al. (2018) model the potential impacts of behavioral changes
on climate change mitigation, including several measures in the transport sector. A demand
reduction of 30 and 55% in 2050 for motorized individual transport and aviation respectively
is modelled by Sterchele et al. (2020). Two other studies examine the socio-technical transfor-
mation of the Danish transport sector, including changes induced by different human behavior
(Venturini, Hansen, et al., 2019; Venturini, Karlsson, et al., 2019). Table 2 provides a structured
overview on the measures applied in the literature.
3 Read more about openENTRANCE at https://openentrance.eu/
11
Quantifying Potential for Sufficiency-based Demand Reductions
Measure Value range Source
Bicycles
Modal shift from MIT to cycling -3.5 to -10% (Umweltbundesamt, 2015; Ven et al., 2018)Increased level of investment in bike infrastructure +50 to +100% (Venturini, Karlsson, et al., 2019)Increased share of E-Bikes in total +1 to +50% (Venturini, Karlsson, et al., 2019)
Motorized individual transport
Replacing business trips with telemeetings -40% to -60% (Umweltbundesamt, 2015)Smaller passenger cars through regulation -7.5% (Umweltbundesamt, 2015)Reduction of motorized individual transportation -30% (Sterchele et al., 2020)Reduced commuting demand through teleworking -1% to -20% (Ven et al., 2018; Venturini, Karlsson, et al., 2019)Increased load factor for every commute car trip (carpooling) 2 (Ven et al., 2018; Venturini, Karlsson, et al., 2019)
Public transport
Modal shift to public transport for all commuting demand -100% (Ven et al., 2018)Reduced traveling time of public transport -1% to -10% (Venturini, Karlsson, et al., 2019)
Aviation
Reduction of aviation -55% (Sterchele et al., 2020)Reduction of private aviation -50% (Umweltbundesamt, 2015)Avoid flights that can be replaced by another transport mode <10h -25% (Ven et al., 2018)Replace intercontinental leisure flights with intra-EU trips -50% (Ven et al., 2018)
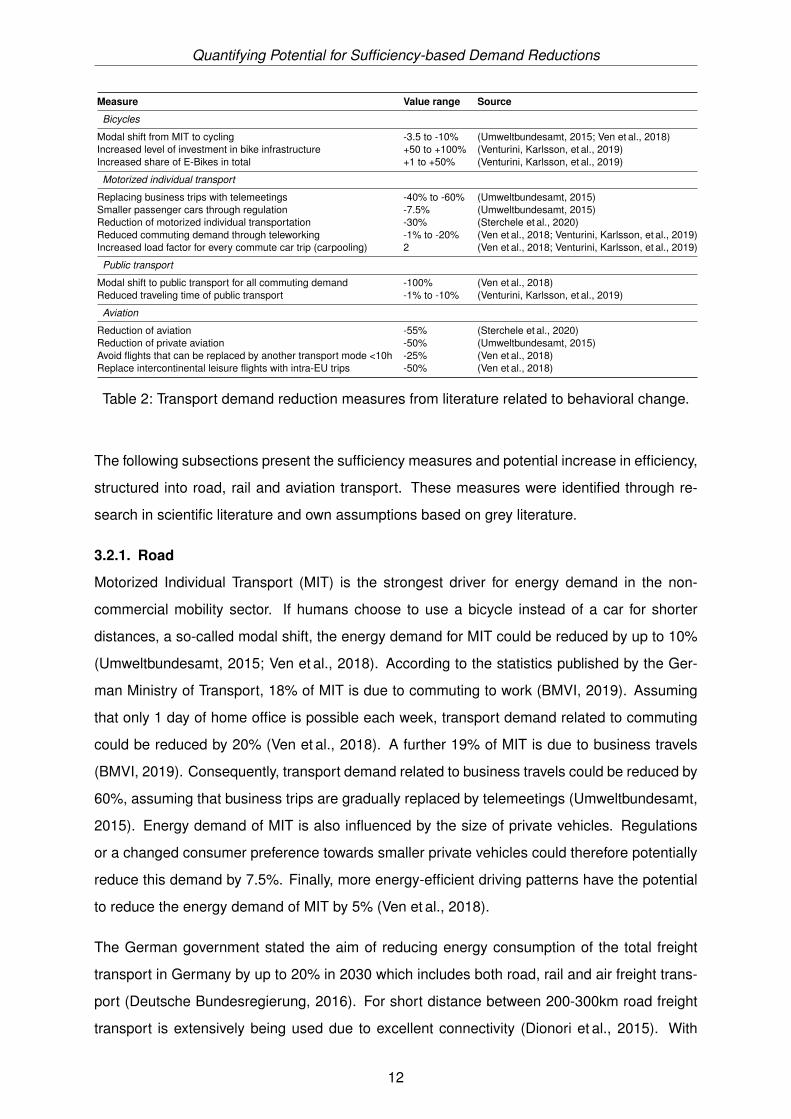
Table 2: Transport demand reduction measures from literature related to behavioral change.
The following subsections present the sufficiency measures and potential increase in efficiency,
structured into road, rail and aviation transport. These measures were identified through re-
search in scientific literature and own assumptions based on grey literature.
3.2.1. Road
Motorized Individual Transport (MIT) is the strongest driver for energy demand in the non-
commercial mobility sector. If humans choose to use a bicycle instead of a car for shorter
distances, a so-called modal shift, the energy demand for MIT could be reduced by up to 10%
(Umweltbundesamt, 2015; Ven et al., 2018). According to the statistics published by the Ger-
man Ministry of Transport, 18% of MIT is due to commuting to work (BMVI, 2019). Assuming
that only 1 day of home office is possible each week, transport demand related to commuting
could be reduced by 20% (Ven et al., 2018). A further 19% of MIT is due to business travels
(BMVI, 2019). Consequently, transport demand related to business travels could be reduced by
60%, assuming that business trips are gradually replaced by telemeetings (Umweltbundesamt,
2015). Energy demand of MIT is also influenced by the size of private vehicles. Regulations
or a changed consumer preference towards smaller private vehicles could therefore potentially
reduce this demand by 7.5%. Finally, more energy-efficient driving patterns have the potential
to reduce the energy demand of MIT by 5% (Ven et al., 2018).
The German government stated the aim of reducing energy consumption of the total freight
transport in Germany by up to 20% in 2030 which includes both road, rail and air freight trans-
port (Deutsche Bundesregierung, 2016). For short distance between 200-300km road freight
transport is extensively being used due to excellent connectivity (Dionori et al., 2015). With
12
Quantifying Potential for Sufficiency-based Demand Reductions
rising international trade, it is expected that the ton-kilometers in Germany is likely to rise by
12% by the year 2030 compared to the 2010 levels (BMVI, 2016). The Federal Government
also expects a rise of 38% of freight moved and is considering a vast expansion of the existing
networks to potentially reduce impacts such as road haulage and environmental emissions.
The following sufficiency measures could help reduce large-scale infrastructure expansions of
roads and yield climate friendly solutions.
Fuel consumption can be minimized by practicing regular maintenance of the freight fleet. Us-
age of tire pressure monitoring systems, low friction oil, and low rolling resistance tires vary
the fuel consumption in vehicles (Roth et al., 2015). By establishing best practices in operation
and maintenance of the freight vehicles the energy demand can be reduced up to 10%. Since
drivers play an important role in movement of the vehicles, training on efficient driving can lead
to reduced energy consumption. Training in speed regulation of vehicles coupled with other fuel
efficient driving techniques can reduce the fuel utilization leading to a reduced energy usage of
10% (Villalobos and Wilmsmeier, 2016). Optimal space utilization can be achieved by develop-
ing better packaging solutions. Inappropriate packaging and the need of immediate deliveries
and empty trips lead to under- utilization of the available capacity in freight transport. According
to a study conducted by Roth et al. (2015), planned packaging to reduce the packaging volume
increased the utilized transport capacity by 30%. The measure can include small modifications
to product designs and also long term planning leading to significant savings in energy due to
reduced trips. Online shopping deliveries are rising astronomically which is evident from the
numbers by Statista 4. In 2019, 30% of the population in Germany shopped online every week.
This contributes to the large proportion of the freight transport by road as most deliveries are
made by delivery vans around the country. According to reports by Nicole Goebel 5, 12% of
the online orders in Germany are returned. This not only has an impact on the revenue for the
retailers but also increases a need in transportation of the goods back to the suppliers. Overall,
the process of returns and replacements can increase the strain on the road freight systems.
Better quality checks for defective items and responsible online shopping has the potential to
reduce this number by 50%.
3.2.2. Rail
Rail transport constitutes a smaller share of private transport and sufficiency-based demand re-
ductions follow a similar pattern as private MIT reductions. A modal shift from public transport
to bicycles could reduce the energy demand of rail transport by roughly 3% (Greiner and Her-
mann, 2016). 21% of public transport is due to commuting and 11% of public transport is due
4 https://www.statista.com/statistics/1086382/online-shopping-frequency-germany/, accessed: 2021-02-195 German online shoppers are serial returners, available at: https://p.dw.com/p/, accessed: 2021-01-22
13
Quantifying Potential for Sufficiency-based Demand Reductions
to business travels (BMVI, 2019). Analogous to MIT, these shares of public transport demand
could be reduced by 20% through home office and 60% through telemeetings respectively.
Rail freight transport has seen low levels of absolute growth in the EU compared to the road
freight transport since 2000 (Dionori et al., 2015). There are several factors that decide the
type of freight transport opted by the shippers which are based on the type of goods carried
and the time constraint in hand. However, above distances of 300km train freight transport is
extremely competitive in terms of cost. Since 1994, the development of the railway infrastruc-
ture in Germany has been slower than the road infrastructure. The regulations in Germany
currently support air and road transport in terms of taxation which has led to the slow growth of
the sector. However, the German Government has identified the potential of the trains in mov-
ing freight to reduce the CO2 emissions, as it is one of the lowest amount of GHG emissions
per ton-km (Donat, 2020).
Train speed control during operation has one of the highest potential for reducing energy use.
Controlling parameters such as acceleration, cruising and coasting can yield better engine per-
formances which develops optimal driving regimes. This can be facilitated by using continuous
traction control systems which utilize the principles of optimization using numeric algorithms.
Several algorithms have been developed such as Particle Swarm Optimization and Artificial
Neural Networks with various objective functions. Minimizing energy usage has been a part
of most of these algorithms and is capable of decreasing the present energy consumption by
rail between 20-30% (Corlu et al., 2020).Using network optimization algorithms can also con-
tribute to reducing energy consumption in rail freight transport. This would require support
systems from the government such as increased public investment on rail infrastructure and
expansion planning based on time table intervals coordination (Donat, 2020). Such optimiza-
tion algorithms have the potential to reduce energy demand in rail freight scheduling by up to
14% (Corlu et al., 2020).
3.2.3. Aviation
In this Section, reduction measures for freight and passenger air transport that will be imple-
mented in this study are explained. First passenger transport is analyzed followed by freight
transport.
Up to 60% of passenger flights in Germany will be related to business travel in 2030, according
to Umweltbundesamt (2015). Given the rise of COVID-19, and thus the move of essentially
all business meetings online, a future is imaginable in which most business meetings between
entities in different locations occur online. The annual flights report for 2020 of the Fraport
14
Quantifying Potential for Sufficiency-based Demand Reductions
AG for Germany’s biggest airport located in Frankfurt (Main) showed a reduction of 86.5% of
all business flights, compared to 2019 (Fraport AG, 2021). Furthermore, the well-developed
infrastructure and the technological progress in today’s train traffic allow the replacement of
national business flights by rail if they are unavoidable. The location of main stations for trains
in city centers and the absence of security checks before traveling can lower the difference in
travel time between flights and trains significantly. Saving an enormous amount of energy at the
same time and benefit of around 61% renewable electrification of the rail system in Germany
(Deutsche Bahn AG, 2020).
Data analysis of EUROSTAT6 show that the average amount of passenger flights in Germany
diminished by around 71% in the first three quarters of 2020 in comparison to the previous
due to COVID-19. The trend for the last quarter of 2020 has been extrapolated with help of
the annual report for 2020 of the Fraport AG as it related very well to the EUROSTAT data
(Fraport AG, 2021). A total decrease of about 74% was calculated for passenger flights in
2020, including starts and landings in Germany. On average 33.8% of all German flights are
intercontinental and 56.1% to other European countries (Fraport AG, 2020). Assuming that
flight behavior in Germany will change towards more sustainability, the private flight rate of
2020 was taken as basis for the scenarios in this study. Excluding the business flights rate for
2035 from the total decrease, a decline of 54% in private air traffic for 2035 is calculated. As the
flight reduction rates in 2020 were similar for intercontinental and intra-european flights (75.3%
and 72.3%, respectively) (Fraport AG, 2020), an energy reduction according to the reduction of
flights is assumed. Intra-european, this and higher reduction rates can be reached by replacing
flights by train journeys. Replacing almost all intra-european flights in that way, the measure
could compensate for possible increases of intercontinental flights.
Plans to replace kerosene fueled planes by hydrogen fueled ones is a big step forward re-
garding CO2 emissions reduction, provided the hydrogen is not produced with fossil resources
(BMVI, 2018). Nevertheless, air traffic has a high energy demand compared to other mobil-
ity technologies. Taking the increasing freight traffic into account it is very unlikely, that there
will be a significant energy demand reductions from decreasing freight in the future, including
cargo flights (Umweltbundesamt, 2019). Nonetheless, huge energy savings are possible in this
transport method and will be demonstrated in the following. In 2019, 22% of all cargo flights to
and from Germany were continental flights (EU-27)7. A ton of freight that is transported by train
instead of plane currently consumes more than 90% less energy. The energy consumption per
6 https://appsso.eurostat.ec.europa.eu/nui/show.do?dataset=avia_paoc&lang=en, accessed: 2021-01-287 https://ec.europa.eu/eurostat/statistics-explained/index.php/Air_transport_statistics#Progressive_growth_\in_
air_transport_of_passengers_in_the_course_of_2019, accessed: 2021-02-01
15
Quantifying Potential for Sufficiency-based Demand Reductions
ton of freight for ships is even lower (Own calculations based on 8, 9. Assuming that in 2035 all
continental and national freight flights are replaced by ships and trains, energy savings of 20%
in air freight transport related to Germany could be achieved. Expanding this measures to 10%
of intercontinental flights, around 30% of energy could be saved.
3.3. Heat sector
The heat sector is responsible for 54% of the overall energy demand. This reflects the impor-
tance of possible reduction potentials which are investigated in the following paragraphs. The
heat sector is then further subdivided into residential and commercial heat demand represent-
ing space heating and domestic hot water demand, which is fully supplied by heat pumps, as
well as the process heat demand representing the industrial energy demand. Process heat
has three categories reflecting on the respective temperature level in the industry branches as
outlined in Section 3.3.2. The researched measures and their potentials are summarized in
Table 3 and further explained in the upcoming sections.
Measure Value range Source
Space heating demand
Lowering average room temperature by 1-2°C -4.4% to -9% (Umweltbundesamt, 2015; Marshall et al., 2016)Turning down thermostat by 1°C -13% (Palmer et al., 2012)Decreasing living space per person -24.9% to 35.7% (Bierwirth and Thomas, 2019b)
Hot water consumption
Water efficient shower heads -50% (Palmer et al., 2012)Feedback system about showering time -5% to -10% (Toulouse and Attali, 2018)Shorter and less frequent showering -20% to -30% (Palmer et al., 2012)Adjusting water consumption -70% (Lehmann et al., 2015)
Process heat low temperature
Decreasing food waste 8.6% - 13.2% (Schmidt et al., 2019; Vita et al., 2019)
Process heat mid temperature
Increasing plastic recycling 1.4% - 2.1% (Umweltbundesamt, 2021; Chemischen Industrie, 2020; Association négaWatt, 2018)Extending useful life of products and 3% - 8.2% (Prakash et al., 2016)establishing service-based sharing economy - (Vita et al., 2019)Modal shift construction products and 0.67% - 1.7% (Hertwich et al., 2019; Bundesverband Baustoffe – Steine und Erden, 2019)reduced construction materials -
Process heat high temperature
Modal shift construction products and 3% - 7.6% (Hertwich et al., 2019; WV-Stahl, 2020)reduced construction materials -
Table 3: Heating demand reduction measures from literature related to behavioral change.
3.3.1. Residential and commercial heating demand
As of 2019, space heating accounts for a share of 26.34% of the total end-energy consump-
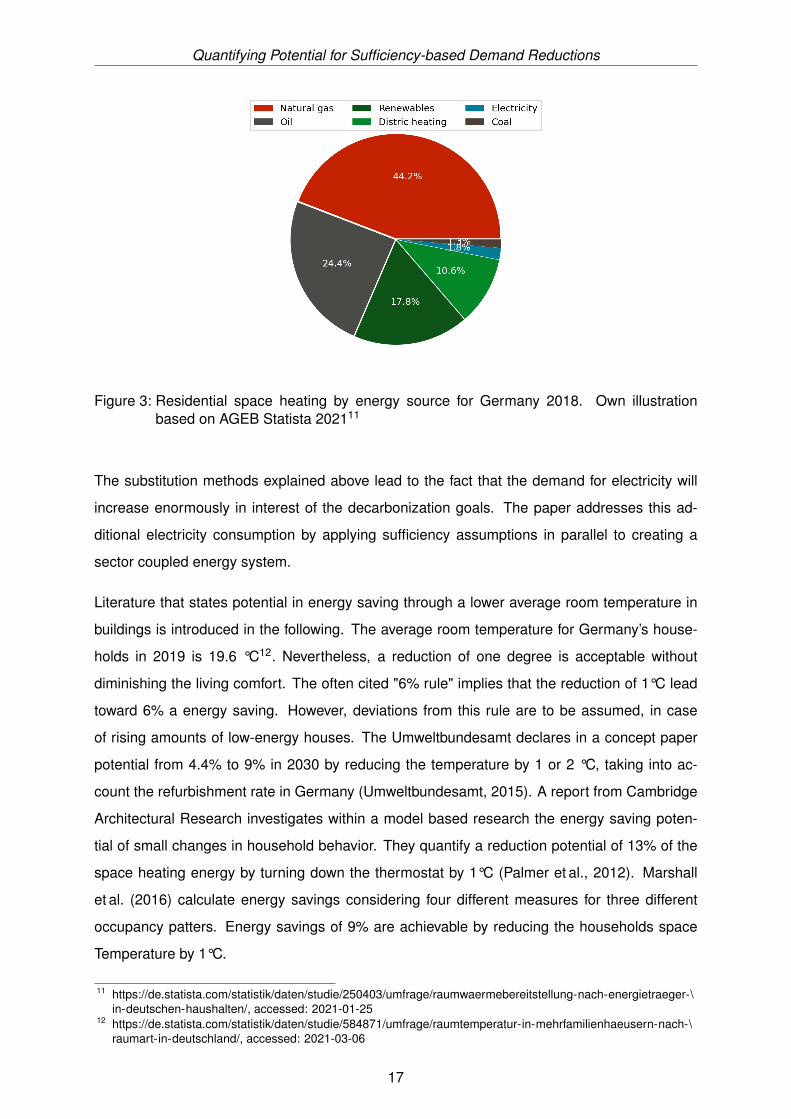
tion10. As can be seen in Figure 3, more then 70% of the energy used for space heating in
Germany is currently covered by non-renewable sources like natural gas, oil and coal.
8 https://ibir.deutschebahn.com/2019/de/konzernlagebericht/oekologie/klimaschutz/unser-klimaziel-halbierung-der-treibhausgasemissionen-bis-2030,accessed: 2021-02-24
9 https://modernairliners.com/boeing-747-8/boeing-747-8i-and-8f-specs/, accessed 2021-03-0510 https://www.bmwi.de/Redaktion/DE/Artikel/Energie/energiedaten-gesamtausgabe.html, accessed: 2021-01-31
16
Quantifying Potential for Sufficiency-based Demand Reductions
Figure 3: Residential space heating by energy source for Germany 2018. Own illustrationbased on AGEB Statista 202111
The substitution methods explained above lead to the fact that the demand for electricity will
increase enormously in interest of the decarbonization goals. The paper addresses this ad-
ditional electricity consumption by applying sufficiency assumptions in parallel to creating a
sector coupled energy system.
Literature that states potential in energy saving through a lower average room temperature in
buildings is introduced in the following. The average room temperature for Germany’s house-
holds in 2019 is 19.6 °C12. Nevertheless, a reduction of one degree is acceptable without
diminishing the living comfort. The often cited "6% rule" implies that the reduction of 1°C lead
toward 6% a energy saving. However, deviations from this rule are to be assumed, in case
of rising amounts of low-energy houses. The Umweltbundesamt declares in a concept paper
potential from 4.4% to 9% in 2030 by reducing the temperature by 1 or 2 °C, taking into ac-
count the refurbishment rate in Germany (Umweltbundesamt, 2015). A report from Cambridge
Architectural Research investigates within a model based research the energy saving poten-
tial of small changes in household behavior. They quantify a reduction potential of 13% of the
space heating energy by turning down the thermostat by 1°C (Palmer et al., 2012). Marshall
et al. (2016) calculate energy savings considering four different measures for three different
occupancy patters. Energy savings of 9% are achievable by reducing the households space
Temperature by 1°C.
11 https://de.statista.com/statistik/daten/studie/250403/umfrage/raumwaermebereitstellung-nach-energietraeger-\in-deutschen-haushalten/, accessed: 2021-01-25
12 https://de.statista.com/statistik/daten/studie/584871/umfrage/raumtemperatur-in-mehrfamilienhaeusern-nach-\raumart-in-deutschland/, accessed: 2021-03-06
17
Quantifying Potential for Sufficiency-based Demand Reductions
Regarding domestic hot water consumption, two influencing factors are conceivable, technically
actions or change in behavior. For instance, the installation of water efficient shower heads
can save up to half of the energy usage for showering (Palmer et al., 2012). This action only
takes place once and does not change the consumer behavior in a long term perspective.
Additionally, a change in behavior caused by climate awareness or price incentives can reduce
energy demand for hot water by approximately 20-30%, as a consequence of shorter and less
frequency showering. Toulouse and Attali (2018) experienced an average cut of 5-10% in
energy usage which emerges from the feedback about showering time. As stated by Lehmann
et al. (2015), the demand of hot water in households can be simply reduced by shortening the
daily shower time and adjusting the water consumption with water saving fittings up to 70%.
Bierwirth and Thomas (2019b) argue, in an extended extract of their published concept pa-
per about sufficiency in buildings (Bierwirth and Thomas, 2019a), that the European trend
of increasing living space per person creates high demand for energy along with societal ef-
fects. They focus on the balance between what floor space is needed for a decent living and
what is too much. The average living space 2018 in Germany is 46.7m2 per person13. Tak-
ing into account five different sizes of households, Bierwirth and Thomas (2019b) calculate a
"adequate" average space of 32.3m2 per person. Consequently an energy saving potential of
24.9% (35m2/cap) to 35.7% (30m2/cap) are achievable for the space heating. Associated re-
ductions of energy service demand related to lightening and building material are not included
and would lead to even more saving potentials. Compared to other European countries, energy
sufficiency potential of Germany is rated as "very high" and is only surpassed by Luxembourg
(Bierwirth and Thomas, 2019b).
3.3.2. Process heat
It is becoming increasingly evident that a systemic change in the use of energy services is re-
quired, as current economic growth highly depends on the industrial energy throughput. Com-
monly, the solution of degrowth was established to achieve a reduction in energy demand by
reducing the overall consumption and thereby production level of a society as well, challeng-
ing the traditional thinking of continuous economic growth which is considered unsustainable
(Robra et al., 2020; Sandberg et al., 2019). To achieve such consumption reductions, certain
sufficiency measures can support this development, but placing the responsibility solely on
the consumer will not have the desired scale effect and therefore needs to aim at including
the interconnected production side as well. Modal shifts occurs as emission free consump-
tion where energy intensive materials and products are substituted by less energy intensive
13 https://www.destatis.de/EN/Themes/Society-Environment/Housing/Tables/average-living-floor-space-per-person-germany.html, accessed: 2021-02-15
18
Quantifying Potential for Sufficiency-based Demand Reductions
products (Vita et al., 2019). This inclusion can be versatile and is investigated in the upcoming
parts. Accurate estimations of sufficiency measures in the industry sector regarding the de-
mand of process heat are yet to be developed and verified. Thus, qualified assumptions and
correlations of various institutional and governmental studies are used to determine the extent
to which a demand reduction could be realized in a simplified system where the import and ex-
port of goods is neglected. The subdivision of the prospective process energy demand in each
industry branch is carried out by Auer et al. (2020) and serves as the baseline demand without
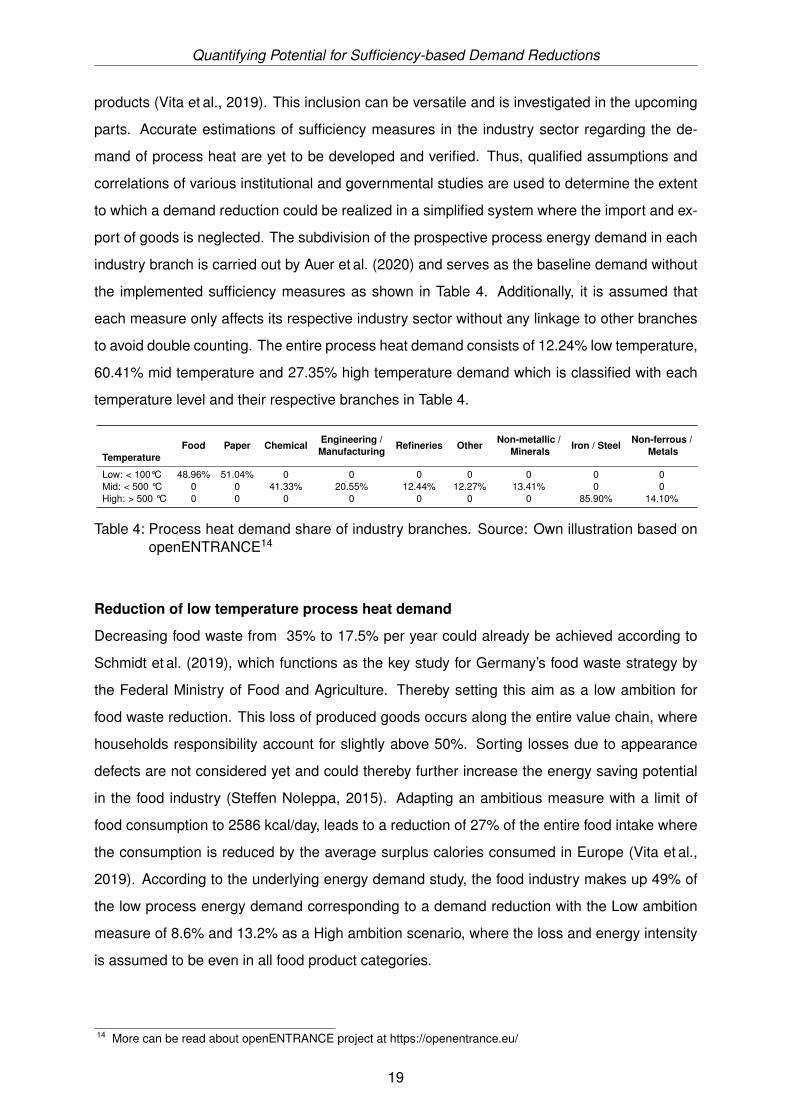
the implemented sufficiency measures as shown in Table 4. Additionally, it is assumed that
each measure only affects its respective industry sector without any linkage to other branches
to avoid double counting. The entire process heat demand consists of 12.24% low temperature,
60.41% mid temperature and 27.35% high temperature demand which is classified with each
temperature level and their respective branches in Table 4.
TemperatureFood Paper Chemical Engineering /
Manufacturing Refineries Other Non-metallic /Minerals Iron / Steel Non-ferrous /
Metals
Low: < 100°C 48.96% 51.04% 0 0 0 0 0 0 0Mid: < 500 °C 0 0 41.33% 20.55% 12.44% 12.27% 13.41% 0 0High: > 500 °C 0 0 0 0 0 0 0 85.90% 14.10%
Table 4: Process heat demand share of industry branches. Source: Own illustration based onopenENTRANCE14
Reduction of low temperature process heat demand
Decreasing food waste from 35% to 17.5% per year could already be achieved according to
Schmidt et al. (2019), which functions as the key study for Germany’s food waste strategy by
the Federal Ministry of Food and Agriculture. Thereby setting this aim as a low ambition for
food waste reduction. This loss of produced goods occurs along the entire value chain, where
households responsibility account for slightly above 50%. Sorting losses due to appearance
defects are not considered yet and could thereby further increase the energy saving potential
in the food industry (Steffen Noleppa, 2015). Adapting an ambitious measure with a limit of
food consumption to 2586 kcal/day, leads to a reduction of 27% of the entire food intake where
the consumption is reduced by the average surplus calories consumed in Europe (Vita et al.,
2019). According to the underlying energy demand study, the food industry makes up 49% of
the low process energy demand corresponding to a demand reduction with the Low ambition
measure of 8.6% and 13.2% as a High ambition scenario, where the loss and energy intensity
is assumed to be even in all food product categories.
14 More can be read about openENTRANCE project at https://openentrance.eu/
19
Quantifying Potential for Sufficiency-based Demand Reductions
Reduction of mid temperature process heat demand
Additional reduction of overall waste accumulation for various material groups can be achieved
by increasing their respective recycling efforts. Especially plastic materials are primarily in-
cinerated instead of returned into the material flow, also due to its pollution where behavioral
change of feeding cleaner plastic back to waste treatment facilities can have a positive im-
pact. According to Umweltbundesamt (2021), the recycling rate for plastics only amount to
47% whereas the rate for paper and metal products are 75.9% and 92% respectively. Here,
all plastic exports are counted as recycled which incorporates uncertainty. That’s why the ad-
justed recycling rate drops to 17.3% of the reused recycled material in new plastic products
Conversio GmbH, 2018. The potential of plastics being recycled to a similar amount as paper
is 30% to 60% even though it would require a higher material unity and recyclability to achieve
the upper end of the potential which has already been implemented in the European plastic
strategy with the action plan to transform towards a circular economy (European Commission,
2020). That’s why an increase by 45% and equivalent substitution of virgin material is assumed
as a high ambition and 30% as a low ambition. The plastic production is incorporated in the
chemical industry sector which accounts for a share of 12.6% of its overall production index
(Chemischen Industrie, 2020). As a simplification, the energy intensity is uniformly distributed
among all products in the chemical industry requiring a mid temperature process heat demand
of 41.3%. When using recycled plastic material instead of virgin material in the plastic material
stream, 90% of the required energy demand can be reduced (Association négaWatt, 2018).
This measure leads to an overall reduction potential of 2.1% of the mid temperature process
heat demand when following a High ambition and 1.4% as a Low ambition.
One of the key sufficiency strategies mentioned in many studies is an extended product life-
time (Umweltbundesamt, 2015; Wieser, 2016). As this is aimed at reducing the consumption
of consumer products, different kinds of obsolescence have to be considered and overcome to
realize the extended useful life (Prakash et al., 2016). The need of economic growth effected
a continuous decrease of product longevity and thereby an unsustainable material and energy
input. When facing product defects, general repair possibilities are hindered due to complicated
component integration or unavailable replacement components. Software obsolescence occurs
after updates are only available for new models, forcing the consumer to abandon still function-
ing products. These are mostly factors which are influenced by the producer. Nevertheless,
psychological obsolescence occurs at the consumer side with a desire of owning the newest
models or using newly developed functions, thus significantly decreasing the primal useful life
of a product with at least 10% between 2004 and 2013 for all major appliances besides laptops
(Prakash et al., 2016). When evaluating precisely, this is also enforced by marketing efforts of
20
Quantifying Potential for Sufficiency-based Demand Reductions
the producer. Creating a sustainable market with extensive product longevity could be fostered
by introducing a statutory warranty and increasing the already implemented defects liability of
only two years as stated in § 438ff German Civil Code. Replacing large household appliances
due to a defect within 5 years has increased from 3.5% to 8.3% and between 6 and 10 years
from 16.7% to 18.3% of all replacement acquisitions. The overall acquisitions made because of
defects amount to 55.6%. Implementing a statutory warranty of 5 years and setting the defects
liability to 10 years would nearly eliminate this type of early replacements and save at least
14.8% of produced products. Additionally, regulating a mandatory availability of components
for at least 20 years would ensure prospective repairability, which is already practiced by the
most sustainable companies, achieving even greater longevity. When assuming a similar sub-
stitution quota for all product categories, this would lead to a reduction of at least 14.8% of the
manufacturing/engineering energy demand even though it would have a significant scale effect
in other product categories such as smartphones, which are typically replaced within 2.5 years.
This is incorporated with a share of 20.5% in the mid process heat demand, leading to a total
reduction of 3%. Thereby the efficiency effect of new machines is not considered but was also
not recognized as relevant when compared to a significantly extended useful life (Prakash et al.,
2016).
Another way to decrease consumer product consumption is by supporting consumption com-
munities, such as shared washing facilities in multi-family houses. Consumption communities or
shared economy can be applied to all kinds of product categories, decreasing the rate of prod-
uct ownership as is already occurring in car transportation. This way repair obstacles could be
overcome when producers engage in service based business models and replacement can be
simply restricted to a useful life of at least 10 years. Thereby, certain product categories which
are effected by functional and psychological obsolescence by the consumer could increase
their useful life as well and reduce the overall energy demand of its production. In the sum-
mary of sufficiency measures conducted by Vita et al. (2019) and their respective assumptions,
a consumption reduction of 50% is assumed for a repair and share scenario, where 10% will
be shifted to services. The spread of 40% implements the upper limit in the manufacturing /
engineering energy demand reduction potential as the ambitious scenario of 8.2% in this study.
Reduction high temperature process heat
Enforcing a modal shift in the construction industry where current materials such as steel and
cement are replaced by wooden structures can have a significant impact in the reduction of
the industrial energy demand as the iron/steel production makes up 86% of the high process
heat demand. According to Hertwich et al. (2019), 10% of all construction materials can be
21
Quantifying Potential for Sufficiency-based Demand Reductions
replaced by wood already. The share of steel produced for the construction industry makes
up 35% in 2020 which would lead to an energy demand reduction potential of 3% regarding
the high process heat (WV-Stahl, 2020). Due to the tremendous difference in energy intensity
of the lumber production compared to steel production, it is assumed to be energy neutral.
Additionally, cement production has a large share of energy demand regarding construction
materials, making up 50% of the subsector of non-metallic minerals which account for 13.4%
of the mid process heat demand (Bundesverband Baustoffe – Steine und Erden, 2019). As
no other measure is implemented within this branch, double counting will be avoided and the
reduction potential of 0.67% of the mid process heat demand can be added. This potential is
considered to be the Low ambition scenario.
When implementing the sufficiency strategy of reducing the average floor space per capita in
the residential/commercial heating mentioned in 3.3 by 30%, a similar reduction in construction
materials will occur due to the reduced demand in living space. As 10% of the materials are
already substituted in the measure before, it can only be applied to 90% of the material pro-
duction. The occurring construction volume for residential buildings amounts to 57.1% of all
construction activities in 2017 and it is assumed that the demand of materials are the same for
all types of construction projects (Bundesverband Baustoffe – Steine und Erden, 2019). This
leads to a reduction potential of 4.6% of the high process heat demand when observing the
steel production and 1.03% of mid process heat demand when decreasing the cement pro-
duction accordingly. The ambitious scenario is reflected by the combination of the previous
measure and the present measure when added to their respective temperature levels.
22
Methodology and Data
4. Methodology and DataThe following section presents the methodological framework needed to simulate a capacity
expansion model for a 100% renewable energy system scenario in Germany by 2035. First,
the chosen modeling tool is introduced along with its corresponding attributes and constraints.
A reference case, to which further reduction assumptions will be applied, is also presented.
Second, the mix of renewable technologies including generation, storage and conversion as-
sets are described. Finally, the demand data used for this research is explained as well as its
associated sector share.
4.1. Model description
For the purpose of this study, a cost-minimizing model provided by AnyMOD framework is
used. AnyMOD is a graph-based framework that facilitates modeling high levels of renewable
resources and sector integration (Göke, 2020a). Besides these, the AnyMOD framework pro-
vides the ability to define the level of temporal and spatial parameters for each energy carrier
and technology as needed. For instance, the supply and demand of electricity can be balanced
hourly, while hydrogen balance can be set to daily resolution. This approach, on one hand,
reflects certain flexibilities inherent to the energy system and on the other hand, leads to a
noticeable reduction of the model size. The framework itself and the documentation to facilitate
its practical application are openly available15.
The model’s objective consists of capacity expansion costs and energy system operating plus
variable costs. There is a list of predefined parameters for the set of carriers and technologies
in the model which are used to assign value to them in order to create the desired energy
system. The model’s constraints ensure that the hourly demand for each carrier in each sector
is fulfilled. In this regard, the required capacity to expand, generate, store and transport the
energy in all sort of available carriers and technologies are calculated separately.
Based on this model, a baseline energy system for Germany is designed which is referred to
hereafter as the "reference case". In this energy system, electricity is the primary energy carrier
which is transformed to hydrogen and synthetic gas as secondary energy carriers. All required
energy is generated by 100% renewable technologies (see Section 4.2) and after running the
model, the optimal capacity of these technologies are calculated in order to meet total demand
(see Section 4.3) in each period. Imports and exports of energy were not included in the model,
as the focus is on the impact of demand-side changes. Without explicitly modelling neighbor-
ing countries, which exceeds the scope of this research, imports cannot be guaranteed to be
fully renewable as well. The approach to omit import and exports when analyzing fundamen-
15 The link to the corresponding repository is: https://github.com/leonardgoeke/AnyMOD.jl
23
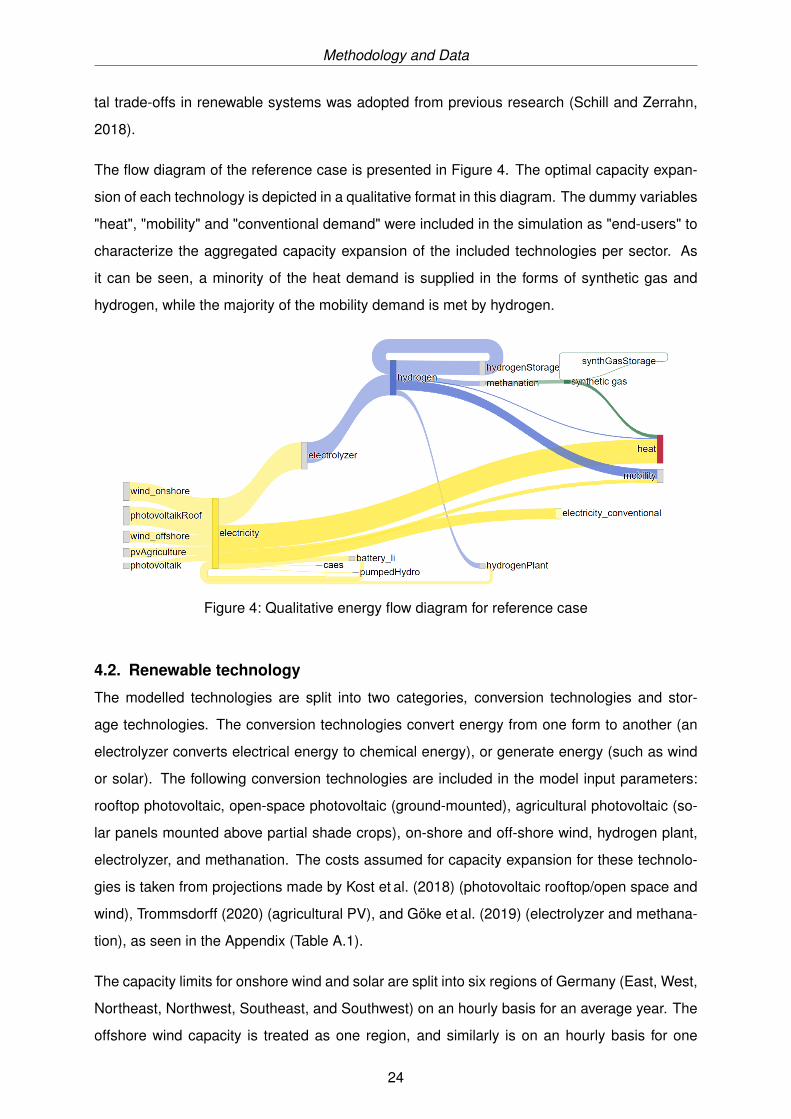
Methodology and Data
tal trade-offs in renewable systems was adopted from previous research (Schill and Zerrahn,
2018).
The flow diagram of the reference case is presented in Figure 4. The optimal capacity expan-
sion of each technology is depicted in a qualitative format in this diagram. The dummy variables
"heat", "mobility" and "conventional demand" were included in the simulation as "end-users" to
characterize the aggregated capacity expansion of the included technologies per sector. As
it can be seen, a minority of the heat demand is supplied in the forms of synthetic gas and
hydrogen, while the majority of the mobility demand is met by hydrogen.
Figure 4: Qualitative energy flow diagram for reference case
4.2. Renewable technology
The modelled technologies are split into two categories, conversion technologies and stor-
age technologies. The conversion technologies convert energy from one form to another (an
electrolyzer converts electrical energy to chemical energy), or generate energy (such as wind
or solar). The following conversion technologies are included in the model input parameters:
rooftop photovoltaic, open-space photovoltaic (ground-mounted), agricultural photovoltaic (so-
lar panels mounted above partial shade crops), on-shore and off-shore wind, hydrogen plant,
electrolyzer, and methanation. The costs assumed for capacity expansion for these technolo-
gies is taken from projections made by Kost et al. (2018) (photovoltaic rooftop/open space and
wind), Trommsdorff (2020) (agricultural PV), and Göke et al. (2019) (electrolyzer and methana-
tion), as seen in the Appendix (Table A.1).
The capacity limits for onshore wind and solar are split into six regions of Germany (East, West,
Northeast, Northwest, Southeast, and Southwest) on an hourly basis for an average year. The
offshore wind capacity is treated as one region, and similarly is on an hourly basis for one
24
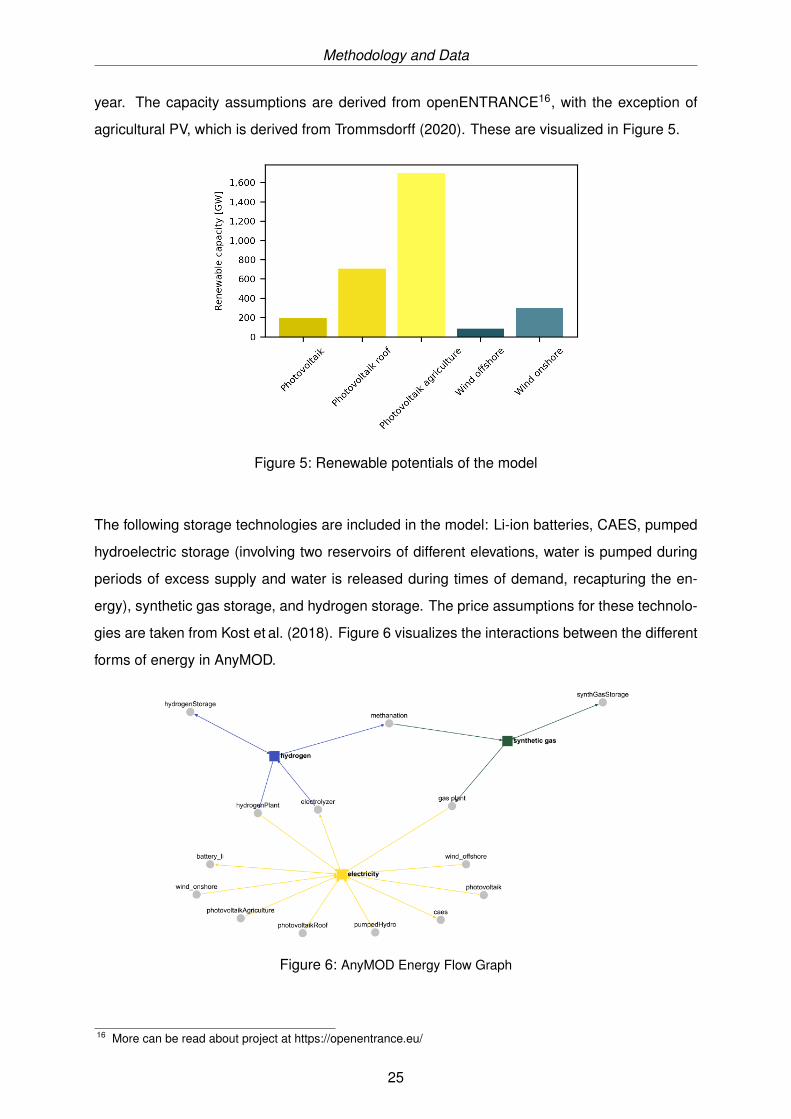
Methodology and Data
year. The capacity assumptions are derived from openENTRANCE16, with the exception of
agricultural PV, which is derived from Trommsdorff (2020). These are visualized in Figure 5.
Figure 5: Renewable potentials of the model
The following storage technologies are included in the model: Li-ion batteries, CAES, pumped
hydroelectric storage (involving two reservoirs of different elevations, water is pumped during
periods of excess supply and water is released during times of demand, recapturing the en-
ergy), synthetic gas storage, and hydrogen storage. The price assumptions for these technolo-
gies are taken from Kost et al. (2018). Figure 6 visualizes the interactions between the different
forms of energy in AnyMOD.
Figure 6: AnyMOD Energy Flow Graph
16 More can be read about project at https://openentrance.eu/
25
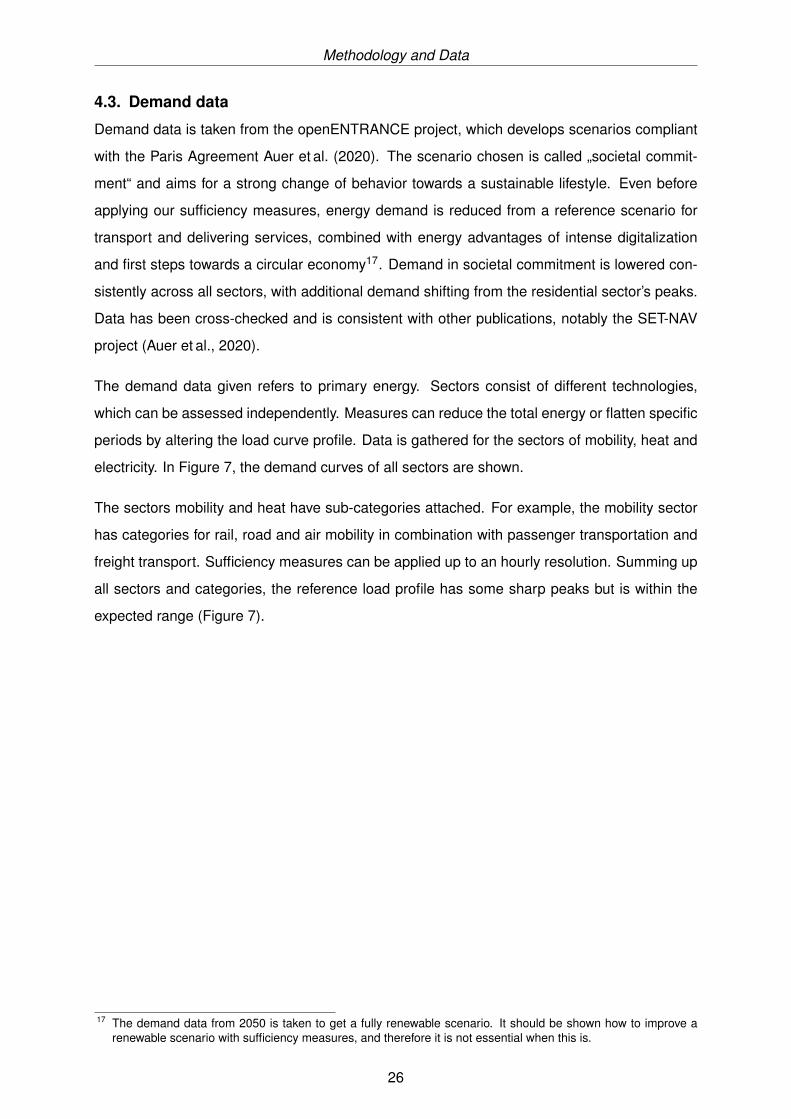
Methodology and Data
4.3. Demand data
Demand data is taken from the openENTRANCE project, which develops scenarios compliant
with the Paris Agreement Auer et al. (2020). The scenario chosen is called „societal commit-
ment“ and aims for a strong change of behavior towards a sustainable lifestyle. Even before
applying our sufficiency measures, energy demand is reduced from a reference scenario for
transport and delivering services, combined with energy advantages of intense digitalization
and first steps towards a circular economy17. Demand in societal commitment is lowered con-
sistently across all sectors, with additional demand shifting from the residential sector’s peaks.
Data has been cross-checked and is consistent with other publications, notably the SET-NAV
project (Auer et al., 2020).
The demand data given refers to primary energy. Sectors consist of different technologies,
which can be assessed independently. Measures can reduce the total energy or flatten specific
periods by altering the load curve profile. Data is gathered for the sectors of mobility, heat and
electricity. In Figure 7, the demand curves of all sectors are shown.
The sectors mobility and heat have sub-categories attached. For example, the mobility sector
has categories for rail, road and air mobility in combination with passenger transportation and
freight transport. Sufficiency measures can be applied up to an hourly resolution. Summing up
all sectors and categories, the reference load profile has some sharp peaks but is within the
expected range (Figure 7).
17 The demand data from 2050 is taken to get a fully renewable scenario. It should be shown how to improve arenewable scenario with sufficiency measures, and therefore it is not essential when this is.
26
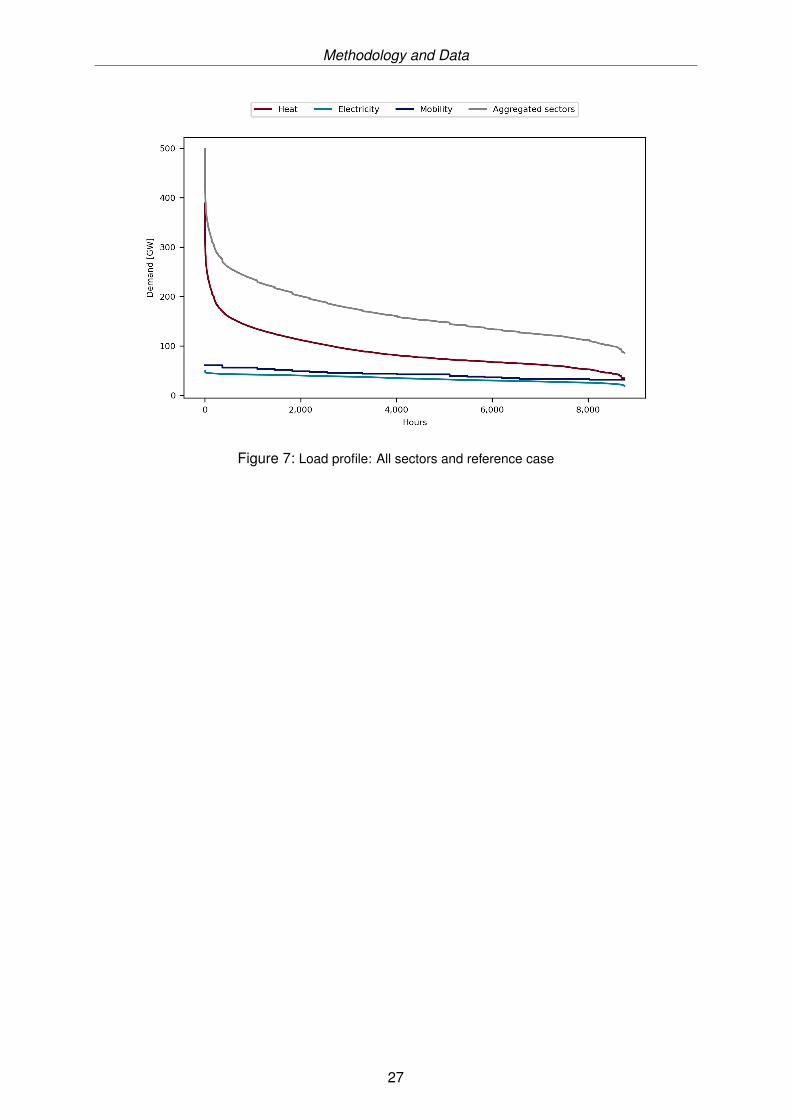
Methodology and Data
Figure 7: Load profile: All sectors and reference case
27
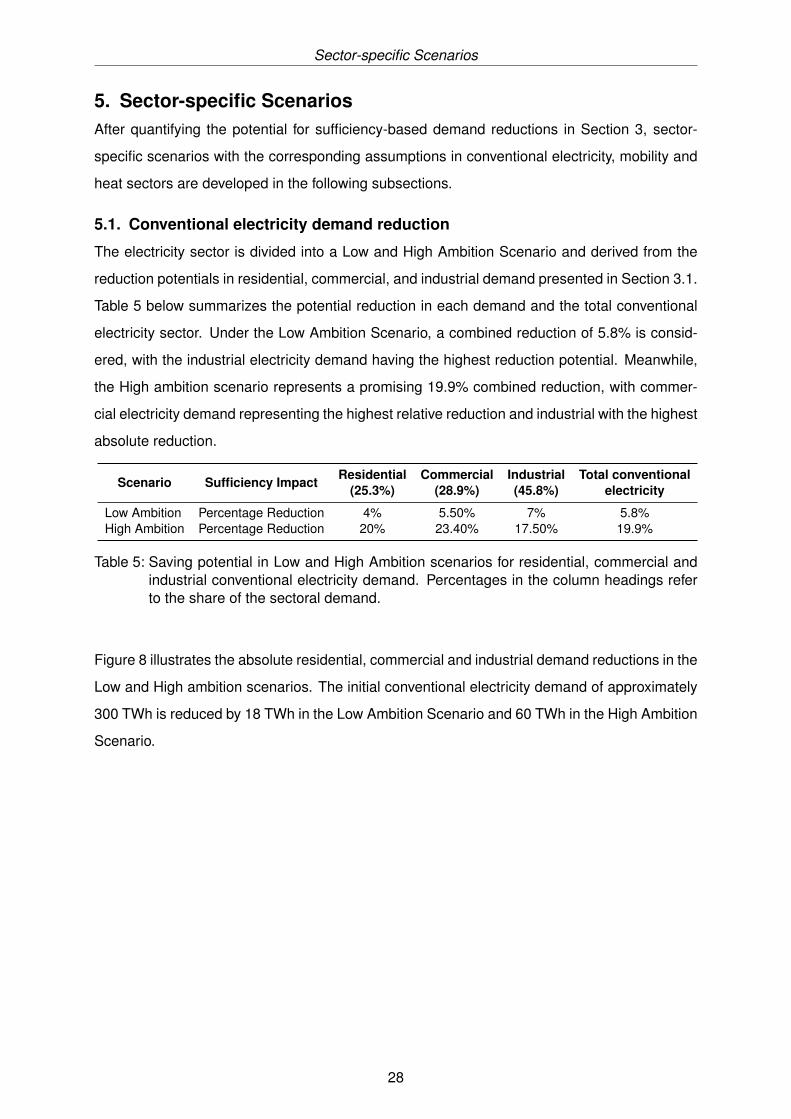
Sector-specific Scenarios
5. Sector-specific ScenariosAfter quantifying the potential for sufficiency-based demand reductions in Section 3, sector-
specific scenarios with the corresponding assumptions in conventional electricity, mobility and
heat sectors are developed in the following subsections.
5.1. Conventional electricity demand reduction
The electricity sector is divided into a Low and High Ambition Scenario and derived from the
reduction potentials in residential, commercial, and industrial demand presented in Section 3.1.
Table 5 below summarizes the potential reduction in each demand and the total conventional
electricity sector. Under the Low Ambition Scenario, a combined reduction of 5.8% is consid-
ered, with the industrial electricity demand having the highest reduction potential. Meanwhile,
the High ambition scenario represents a promising 19.9% combined reduction, with commer-
cial electricity demand representing the highest relative reduction and industrial with the highest
absolute reduction.
Scenario Sufficiency Impact Residential(25.3%)
Commercial(28.9%)
Industrial(45.8%)
Total conventionalelectricity
Low Ambition Percentage Reduction 4% 5.50% 7% 5.8%High Ambition Percentage Reduction 20% 23.40% 17.50% 19.9%
Table 5: Saving potential in Low and High Ambition scenarios for residential, commercial andindustrial conventional electricity demand. Percentages in the column headings referto the share of the sectoral demand.
Figure 8 illustrates the absolute residential, commercial and industrial demand reductions in the
Low and High ambition scenarios. The initial conventional electricity demand of approximately
300 TWh is reduced by 18 TWh in the Low Ambition Scenario and 60 TWh in the High Ambition
Scenario.
28
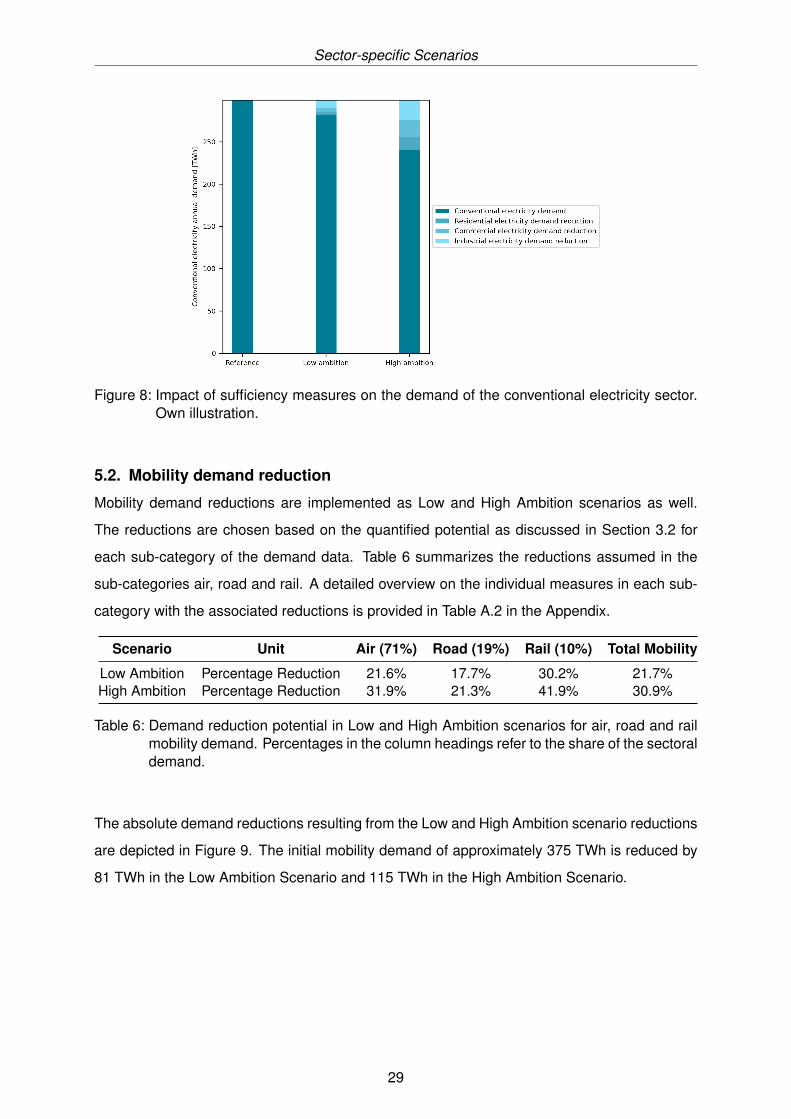
Sector-specific Scenarios
Figure 8: Impact of sufficiency measures on the demand of the conventional electricity sector.Own illustration.
5.2. Mobility demand reduction
Mobility demand reductions are implemented as Low and High Ambition scenarios as well.
The reductions are chosen based on the quantified potential as discussed in Section 3.2 for
each sub-category of the demand data. Table 6 summarizes the reductions assumed in the
sub-categories air, road and rail. A detailed overview on the individual measures in each sub-
category with the associated reductions is provided in Table A.2 in the Appendix.
Scenario Unit Air (71%) Road (19%) Rail (10%) Total Mobility
Low Ambition Percentage Reduction 21.6% 17.7% 30.2% 21.7%High Ambition Percentage Reduction 31.9% 21.3% 41.9% 30.9%
Table 6: Demand reduction potential in Low and High Ambition scenarios for air, road and railmobility demand. Percentages in the column headings refer to the share of the sectoraldemand.
The absolute demand reductions resulting from the Low and High Ambition scenario reductions
are depicted in Figure 9. The initial mobility demand of approximately 375 TWh is reduced by
81 TWh in the Low Ambition Scenario and 115 TWh in the High Ambition Scenario.
29
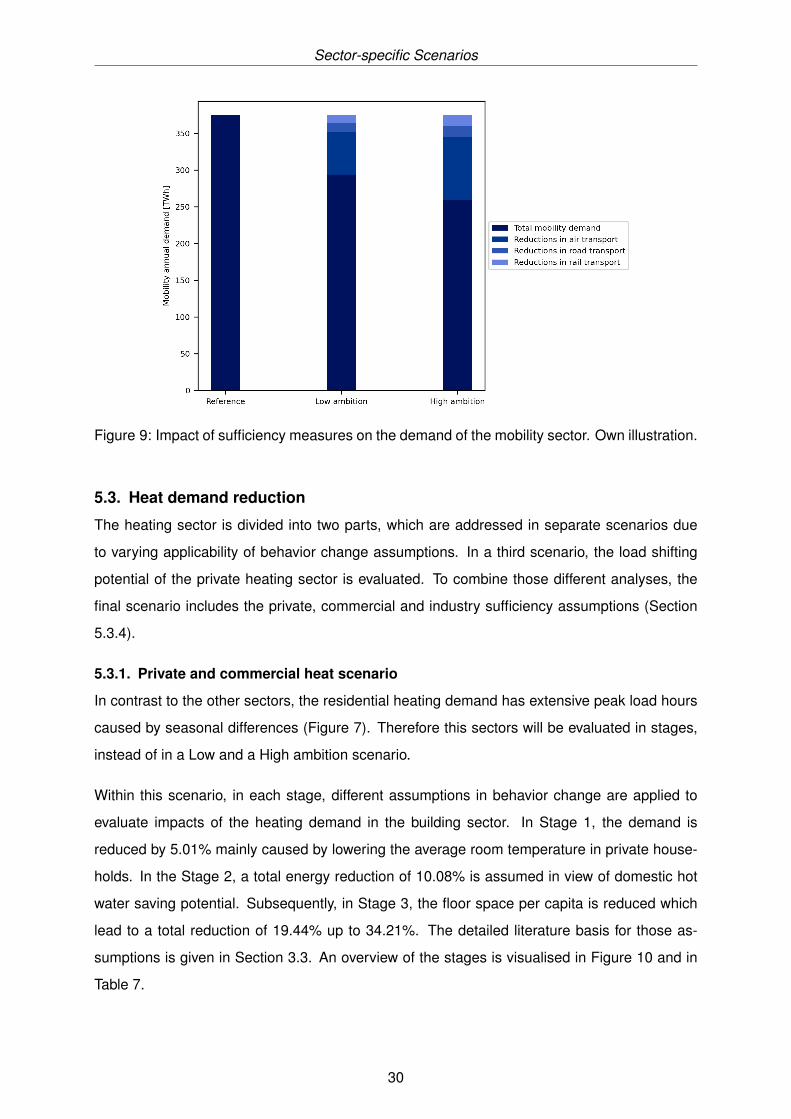
Sector-specific Scenarios
Figure 9: Impact of sufficiency measures on the demand of the mobility sector. Own illustration.
5.3. Heat demand reduction
The heating sector is divided into two parts, which are addressed in separate scenarios due
to varying applicability of behavior change assumptions. In a third scenario, the load shifting
potential of the private heating sector is evaluated. To combine those different analyses, the
final scenario includes the private, commercial and industry sufficiency assumptions (Section
5.3.4).
5.3.1. Private and commercial heat scenario
In contrast to the other sectors, the residential heating demand has extensive peak load hours
caused by seasonal differences (Figure 7). Therefore this sectors will be evaluated in stages,
instead of in a Low and a High ambition scenario.
Within this scenario, in each stage, different assumptions in behavior change are applied to
evaluate impacts of the heating demand in the building sector. In Stage 1, the demand is
reduced by 5.01% mainly caused by lowering the average room temperature in private house-
holds. In the Stage 2, a total energy reduction of 10.08% is assumed in view of domestic hot
water saving potential. Subsequently, in Stage 3, the floor space per capita is reduced which
lead to a total reduction of 19.44% up to 34.21%. The detailed literature basis for those as-
sumptions is given in Section 3.3. An overview of the stages is visualised in Figure 10 and in
Table 7.
30
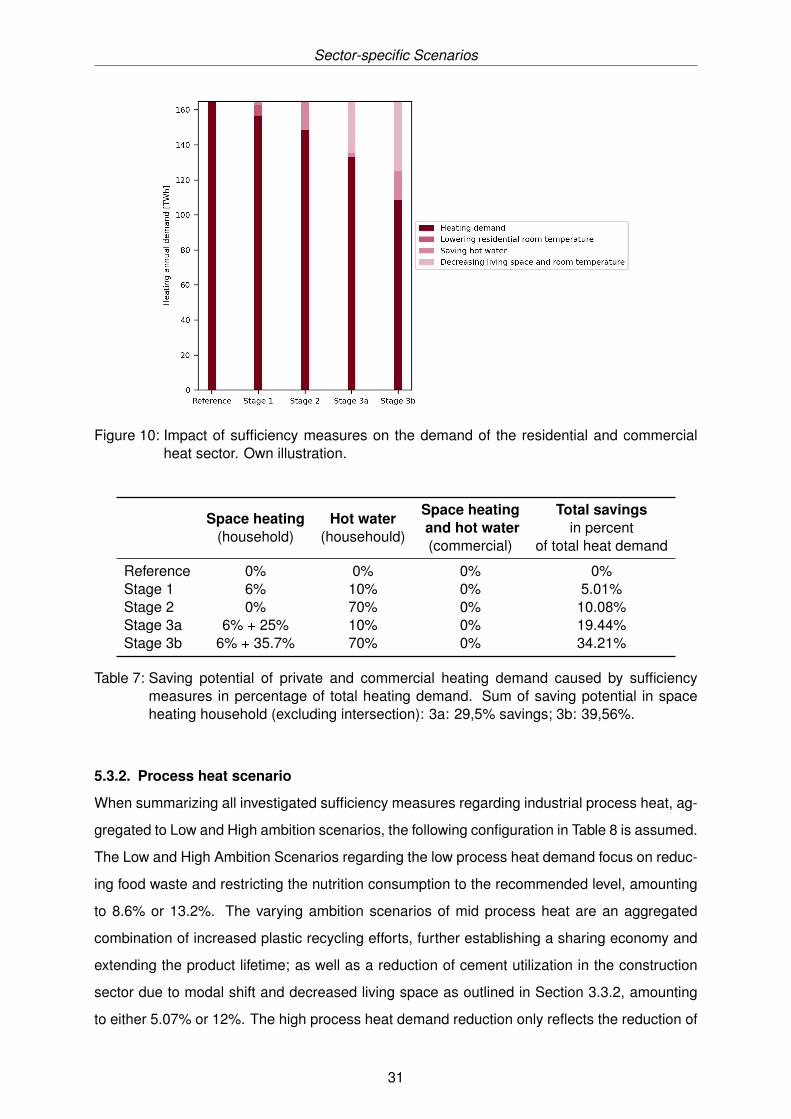
Sector-specific Scenarios
Figure 10: Impact of sufficiency measures on the demand of the residential and commercialheat sector. Own illustration.
Space heating(household)
Hot water(househould)
Space heatingand hot water(commercial)
Total savingsin percent
of total heat demand
Reference 0% 0% 0% 0%Stage 1 6% 10% 0% 5.01%Stage 2 0% 70% 0% 10.08%Stage 3a 6% + 25% 10% 0% 19.44%Stage 3b 6% + 35.7% 70% 0% 34.21%
Table 7: Saving potential of private and commercial heating demand caused by sufficiencymeasures in percentage of total heating demand. Sum of saving potential in spaceheating household (excluding intersection): 3a: 29,5% savings; 3b: 39,56%.
5.3.2. Process heat scenario
When summarizing all investigated sufficiency measures regarding industrial process heat, ag-
gregated to Low and High ambition scenarios, the following configuration in Table 8 is assumed.
The Low and High Ambition Scenarios regarding the low process heat demand focus on reduc-
ing food waste and restricting the nutrition consumption to the recommended level, amounting
to 8.6% or 13.2%. The varying ambition scenarios of mid process heat are an aggregated
combination of increased plastic recycling efforts, further establishing a sharing economy and
extending the product lifetime; as well as a reduction of cement utilization in the construction
sector due to modal shift and decreased living space as outlined in Section 3.3.2, amounting
to either 5.07% or 12%. The high process heat demand reduction only reflects the reduction of
31
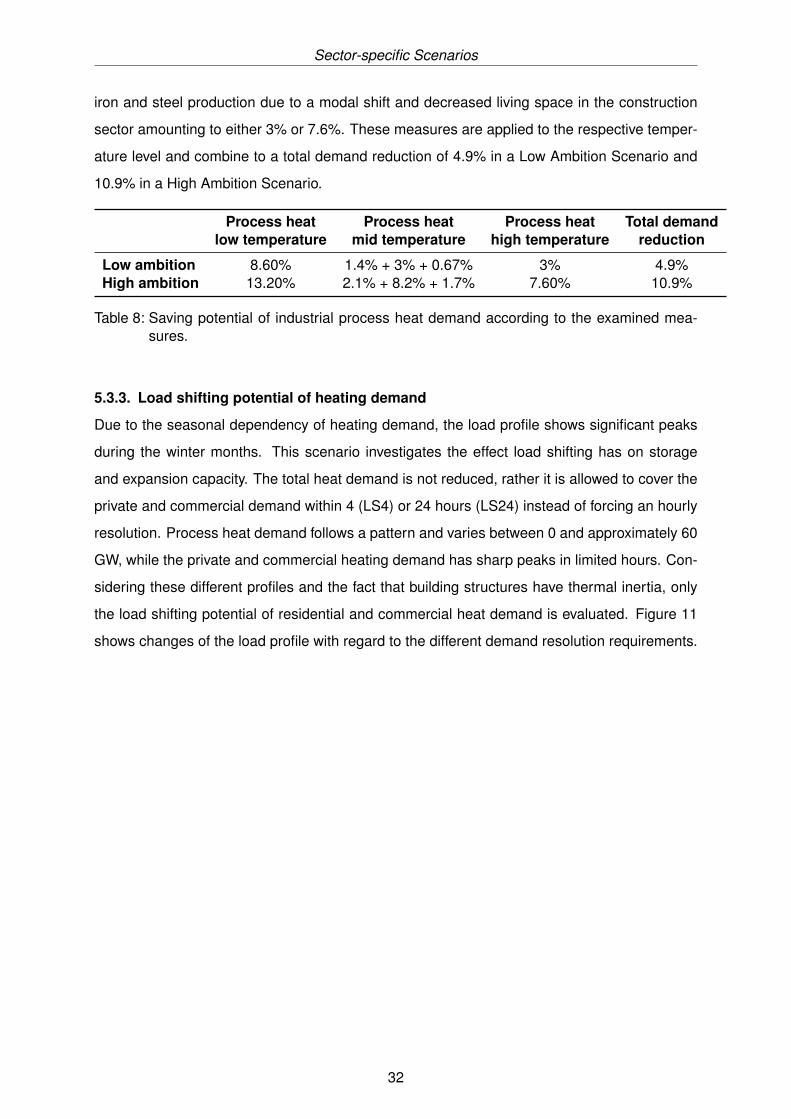
Sector-specific Scenarios
iron and steel production due to a modal shift and decreased living space in the construction
sector amounting to either 3% or 7.6%. These measures are applied to the respective temper-
ature level and combine to a total demand reduction of 4.9% in a Low Ambition Scenario and
10.9% in a High Ambition Scenario.
Process heatlow temperature
Process heatmid temperature
Process heathigh temperature
Total demandreduction
Low ambition 8.60% 1.4% + 3% + 0.67% 3% 4.9%High ambition 13.20% 2.1% + 8.2% + 1.7% 7.60% 10.9%
Table 8: Saving potential of industrial process heat demand according to the examined mea-sures.
5.3.3. Load shifting potential of heating demand
Due to the seasonal dependency of heating demand, the load profile shows significant peaks
during the winter months. This scenario investigates the effect load shifting has on storage
and expansion capacity. The total heat demand is not reduced, rather it is allowed to cover the
private and commercial demand within 4 (LS4) or 24 hours (LS24) instead of forcing an hourly
resolution. Process heat demand follows a pattern and varies between 0 and approximately 60
GW, while the private and commercial heating demand has sharp peaks in limited hours. Con-
sidering these different profiles and the fact that building structures have thermal inertia, only
the load shifting potential of residential and commercial heat demand is evaluated. Figure 11
shows changes of the load profile with regard to the different demand resolution requirements.
32
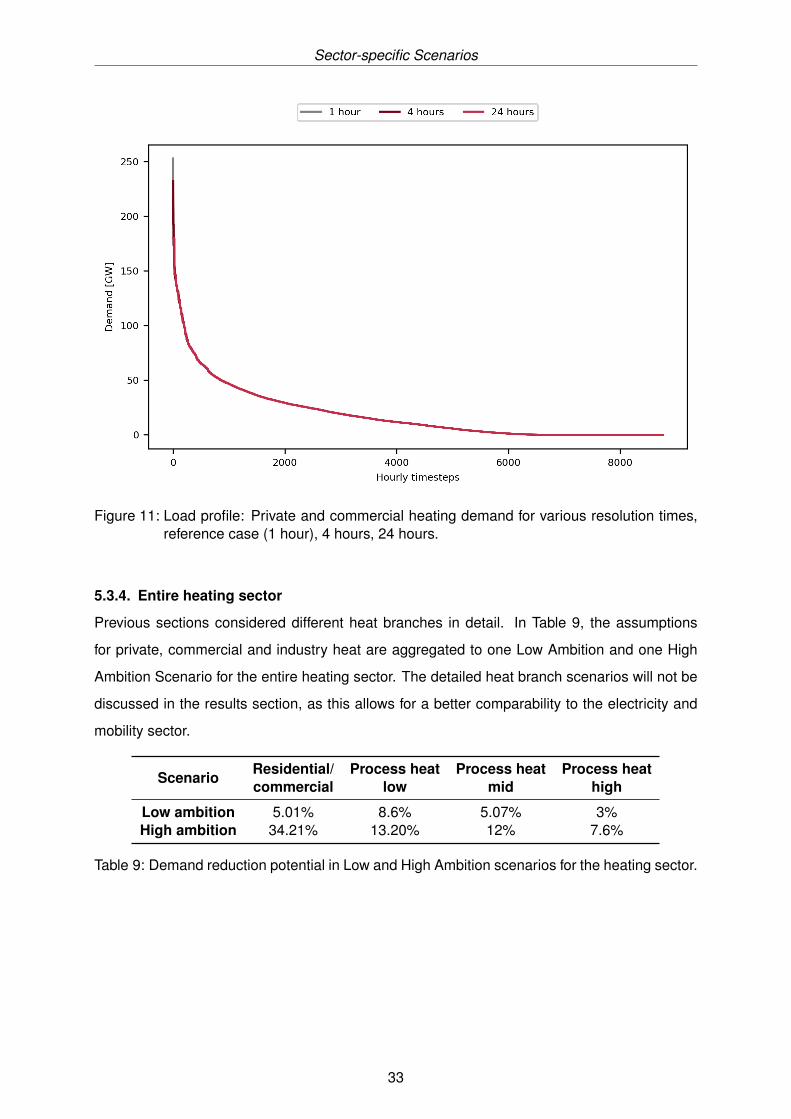
Sector-specific Scenarios
Figure 11: Load profile: Private and commercial heating demand for various resolution times,reference case (1 hour), 4 hours, 24 hours.
5.3.4. Entire heating sector
Previous sections considered different heat branches in detail. In Table 9, the assumptions
for private, commercial and industry heat are aggregated to one Low Ambition and one High
Ambition Scenario for the entire heating sector. The detailed heat branch scenarios will not be
discussed in the results section, as this allows for a better comparability to the electricity and
mobility sector.
Scenario Residential/commercial
Process heatlow
Process heatmid
Process heathigh
Low ambition 5.01% 8.6% 5.07% 3%High ambition 34.21% 13.20% 12% 7.6%
Table 9: Demand reduction potential in Low and High Ambition scenarios for the heating sector.
33
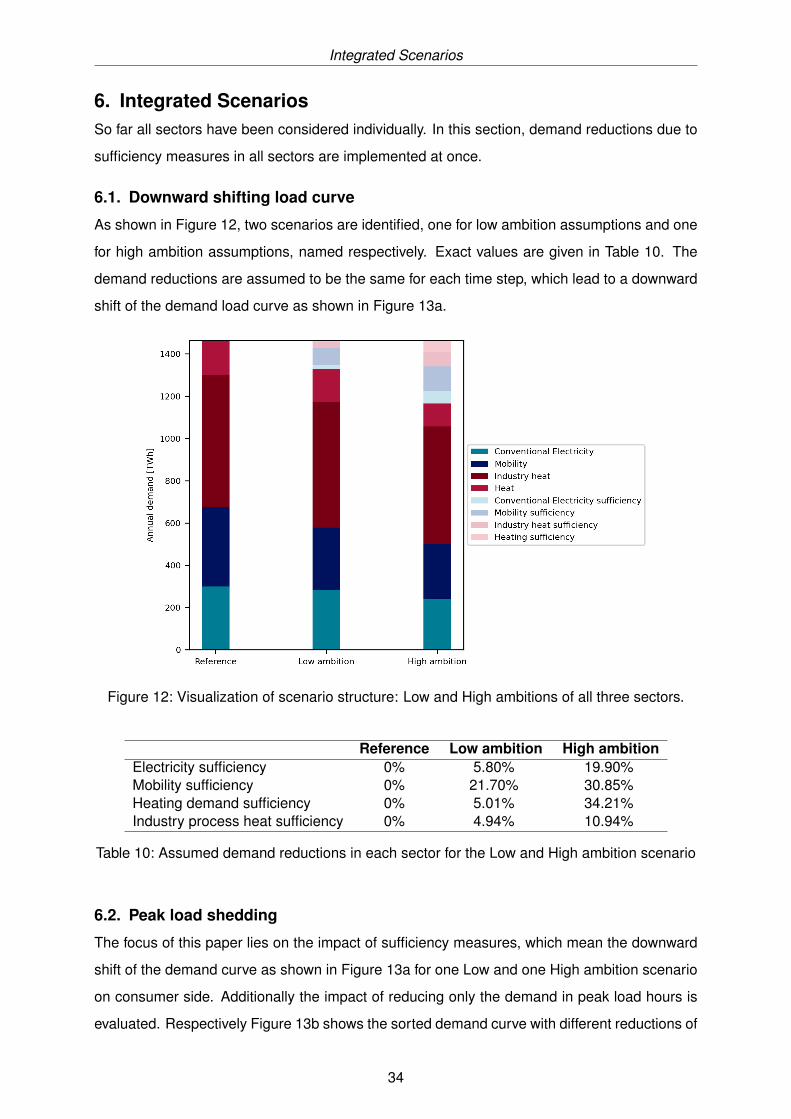
Integrated Scenarios
6. Integrated ScenariosSo far all sectors have been considered individually. In this section, demand reductions due to
sufficiency measures in all sectors are implemented at once.
6.1. Downward shifting load curve
As shown in Figure 12, two scenarios are identified, one for low ambition assumptions and one
for high ambition assumptions, named respectively. Exact values are given in Table 10. The
demand reductions are assumed to be the same for each time step, which lead to a downward
shift of the demand load curve as shown in Figure 13a.
Figure 12: Visualization of scenario structure: Low and High ambitions of all three sectors.
Reference Low ambition High ambitionElectricity sufficiency 0% 5.80% 19.90%Mobility sufficiency 0% 21.70% 30.85%Heating demand sufficiency 0% 5.01% 34.21%Industry process heat sufficiency 0% 4.94% 10.94%
Table 10: Assumed demand reductions in each sector for the Low and High ambition scenario
6.2. Peak load shedding
The focus of this paper lies on the impact of sufficiency measures, which mean the downward
shift of the demand curve as shown in Figure 13a for one Low and one High ambition scenario
on consumer side. Additionally the impact of reducing only the demand in peak load hours is
evaluated. Respectively Figure 13b shows the sorted demand curve with different reductions of
34
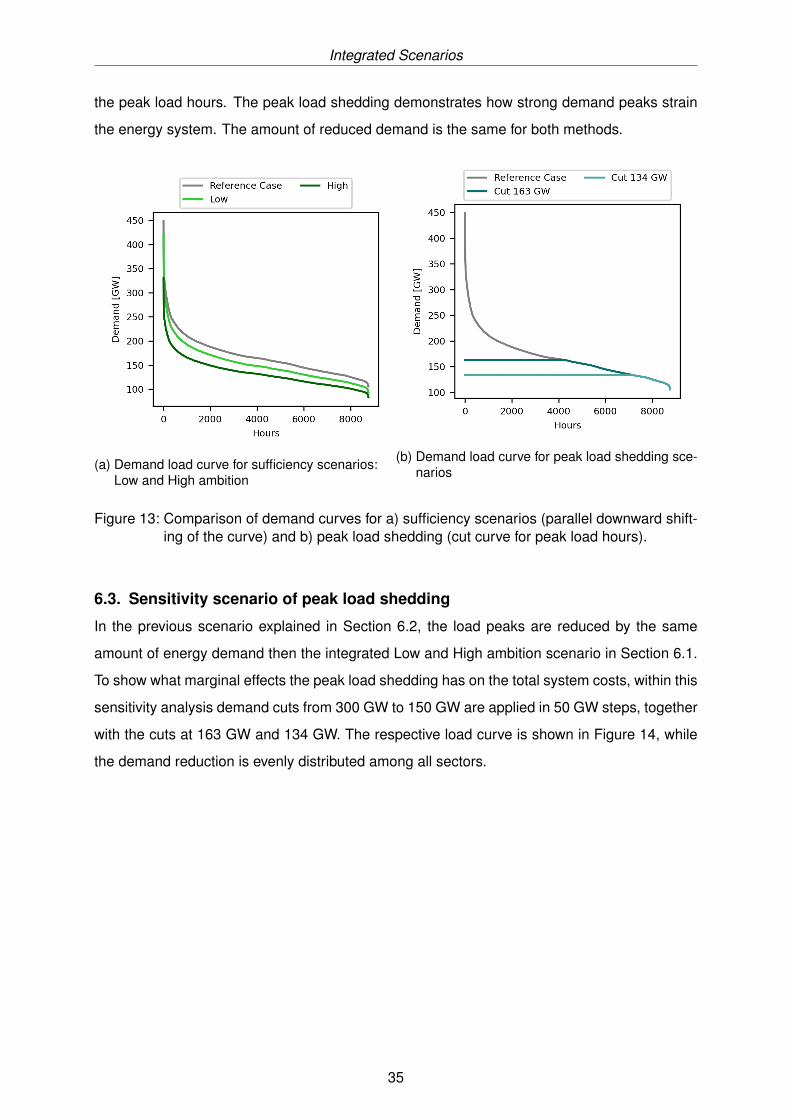
Integrated Scenarios
the peak load hours. The peak load shedding demonstrates how strong demand peaks strain
the energy system. The amount of reduced demand is the same for both methods.
(a) Demand load curve for sufficiency scenarios:Low and High ambition
(b) Demand load curve for peak load shedding sce-narios
Figure 13: Comparison of demand curves for a) sufficiency scenarios (parallel downward shift-ing of the curve) and b) peak load shedding (cut curve for peak load hours).
6.3. Sensitivity scenario of peak load shedding
In the previous scenario explained in Section 6.2, the load peaks are reduced by the same
amount of energy demand then the integrated Low and High ambition scenario in Section 6.1.
To show what marginal effects the peak load shedding has on the total system costs, within this
sensitivity analysis demand cuts from 300 GW to 150 GW are applied in 50 GW steps, together
with the cuts at 163 GW and 134 GW. The respective load curve is shown in Figure 14, while
the demand reduction is evenly distributed among all sectors.
35
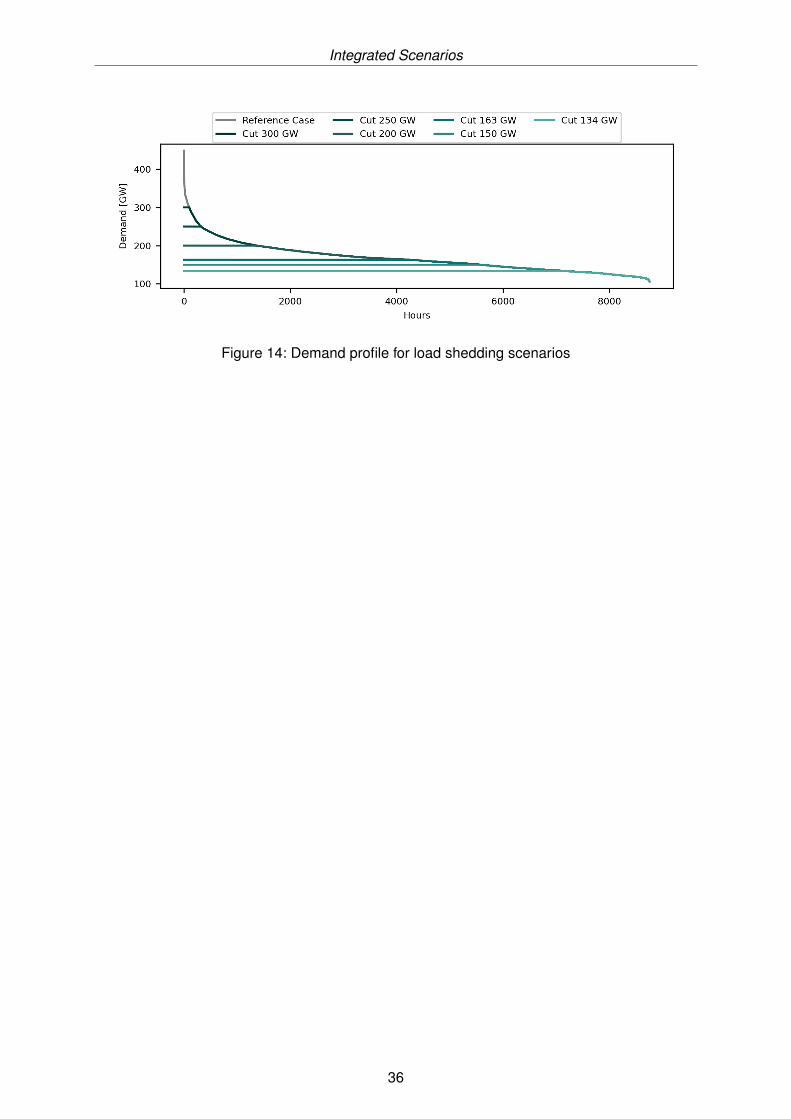
Integrated Scenarios
Figure 14: Demand profile for load shedding scenarios
36
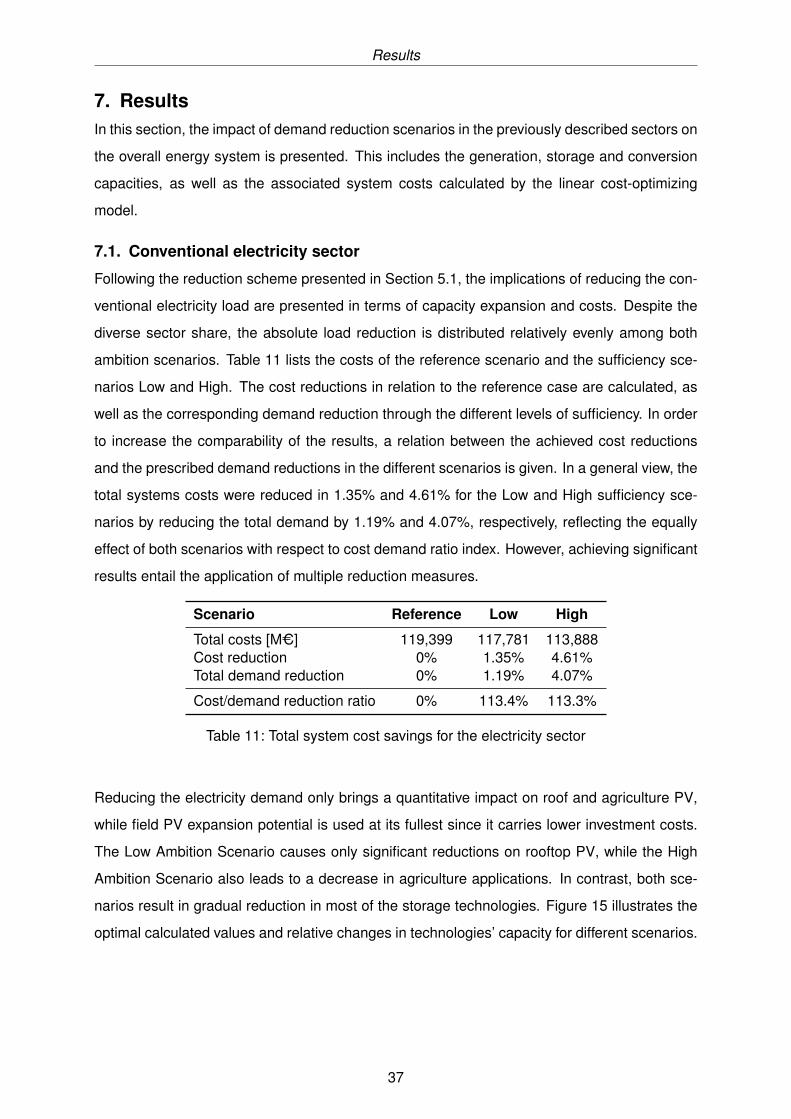
Results
7. ResultsIn this section, the impact of demand reduction scenarios in the previously described sectors on
the overall energy system is presented. This includes the generation, storage and conversion
capacities, as well as the associated system costs calculated by the linear cost-optimizing
model.
7.1. Conventional electricity sector
Following the reduction scheme presented in Section 5.1, the implications of reducing the con-
ventional electricity load are presented in terms of capacity expansion and costs. Despite the
diverse sector share, the absolute load reduction is distributed relatively evenly among both
ambition scenarios. Table 11 lists the costs of the reference scenario and the sufficiency sce-
narios Low and High. The cost reductions in relation to the reference case are calculated, as
well as the corresponding demand reduction through the different levels of sufficiency. In order
to increase the comparability of the results, a relation between the achieved cost reductions
and the prescribed demand reductions in the different scenarios is given. In a general view, the
total systems costs were reduced in 1.35% and 4.61% for the Low and High sufficiency sce-
narios by reducing the total demand by 1.19% and 4.07%, respectively, reflecting the equally
effect of both scenarios with respect to cost demand ratio index. However, achieving significant
results entail the application of multiple reduction measures.
Scenario Reference Low High
Total costs [MC] 119,399 117,781 113,888Cost reduction 0% 1.35% 4.61%Total demand reduction 0% 1.19% 4.07%
Cost/demand reduction ratio 0% 113.4% 113.3%
Table 11: Total system cost savings for the electricity sector
Reducing the electricity demand only brings a quantitative impact on roof and agriculture PV,
while field PV expansion potential is used at its fullest since it carries lower investment costs.
The Low Ambition Scenario causes only significant reductions on rooftop PV, while the High
Ambition Scenario also leads to a decrease in agriculture applications. In contrast, both sce-
narios result in gradual reduction in most of the storage technologies. Figure 15 illustrates the
optimal calculated values and relative changes in technologies’ capacity for different scenarios.
37
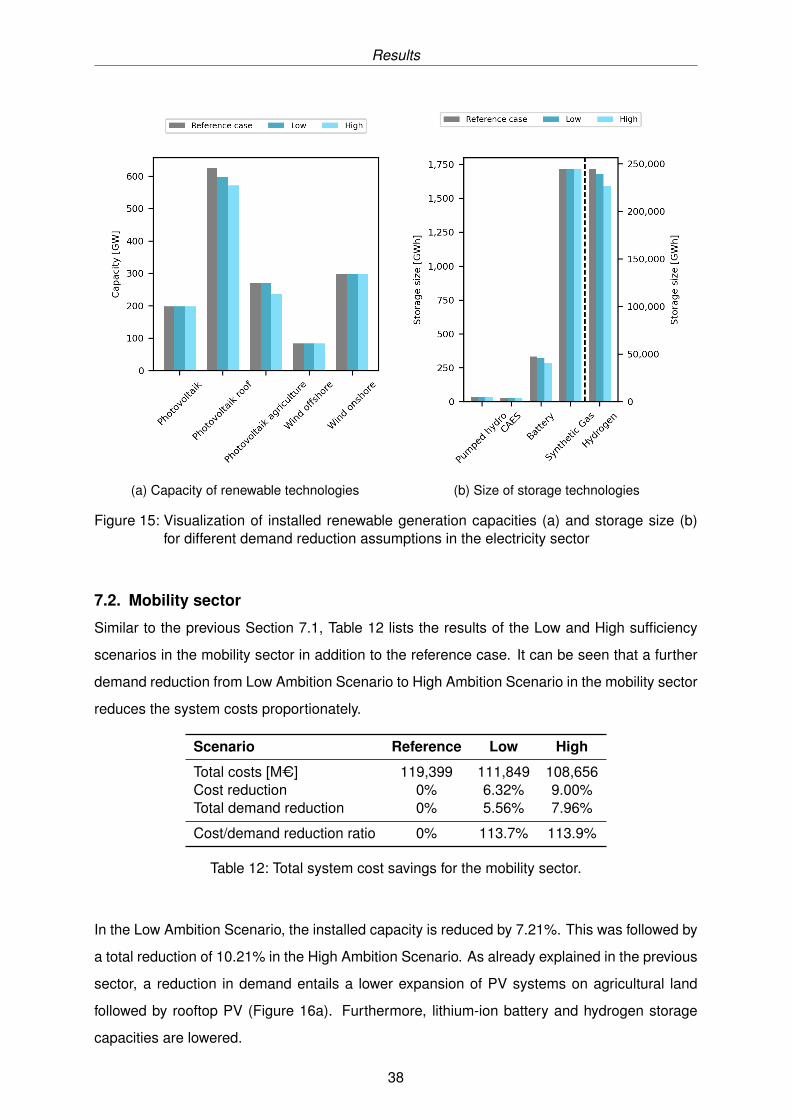
Results
(a) Capacity of renewable technologies (b) Size of storage technologies
Figure 15: Visualization of installed renewable generation capacities (a) and storage size (b)for different demand reduction assumptions in the electricity sector
7.2. Mobility sector
Similar to the previous Section 7.1, Table 12 lists the results of the Low and High sufficiency
scenarios in the mobility sector in addition to the reference case. It can be seen that a further
demand reduction from Low Ambition Scenario to High Ambition Scenario in the mobility sector
reduces the system costs proportionately.
Scenario Reference Low High
Total costs [MC] 119,399 111,849 108,656Cost reduction 0% 6.32% 9.00%Total demand reduction 0% 5.56% 7.96%
Cost/demand reduction ratio 0% 113.7% 113.9%
Table 12: Total system cost savings for the mobility sector.
In the Low Ambition Scenario, the installed capacity is reduced by 7.21%. This was followed by
a total reduction of 10.21% in the High Ambition Scenario. As already explained in the previous
sector, a reduction in demand entails a lower expansion of PV systems on agricultural land
followed by rooftop PV (Figure 16a). Furthermore, lithium-ion battery and hydrogen storage
capacities are lowered.
38
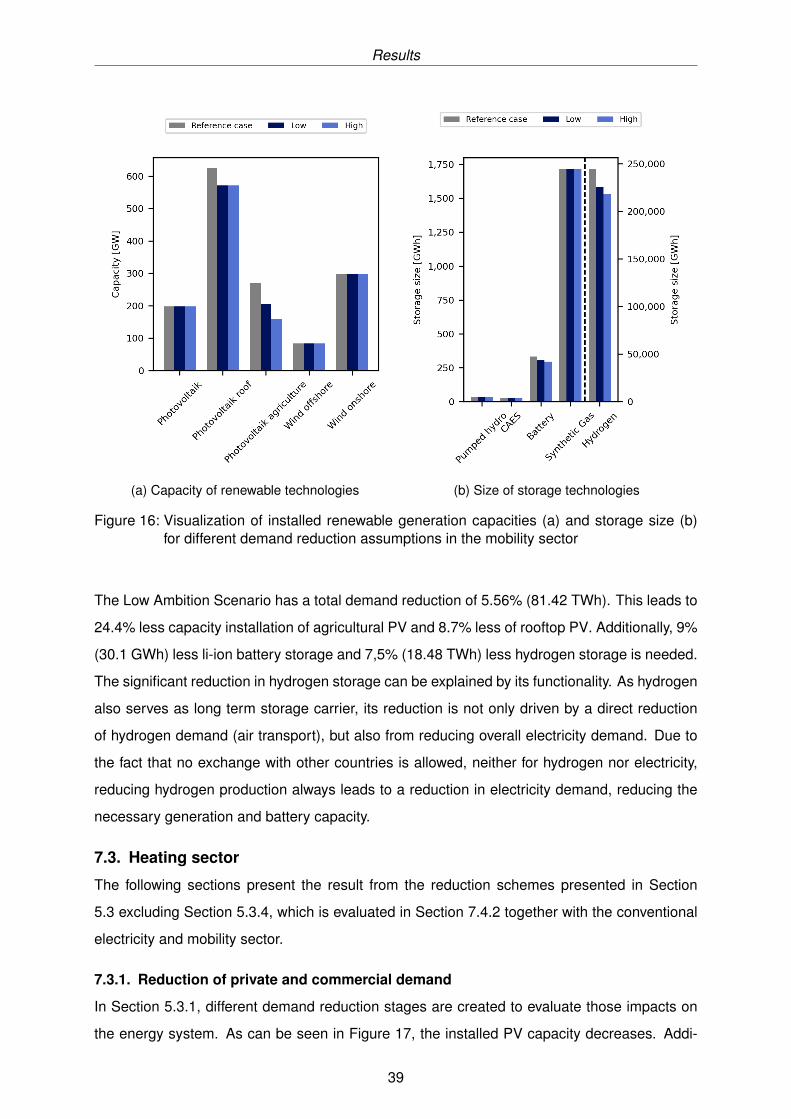
Results
(a) Capacity of renewable technologies (b) Size of storage technologies
Figure 16: Visualization of installed renewable generation capacities (a) and storage size (b)for different demand reduction assumptions in the mobility sector
The Low Ambition Scenario has a total demand reduction of 5.56% (81.42 TWh). This leads to
24.4% less capacity installation of agricultural PV and 8.7% less of rooftop PV. Additionally, 9%
(30.1 GWh) less li-ion battery storage and 7,5% (18.48 TWh) less hydrogen storage is needed.
The significant reduction in hydrogen storage can be explained by its functionality. As hydrogen
also serves as long term storage carrier, its reduction is not only driven by a direct reduction
of hydrogen demand (air transport), but also from reducing overall electricity demand. Due to
the fact that no exchange with other countries is allowed, neither for hydrogen nor electricity,
reducing hydrogen production always leads to a reduction in electricity demand, reducing the
necessary generation and battery capacity.
7.3. Heating sector
The following sections present the result from the reduction schemes presented in Section
5.3 excluding Section 5.3.4, which is evaluated in Section 7.4.2 together with the conventional
electricity and mobility sector.
7.3.1. Reduction of private and commercial demand
In Section 5.3.1, different demand reduction stages are created to evaluate those impacts on
the energy system. As can be seen in Figure 17, the installed PV capacity decreases. Addi-
39
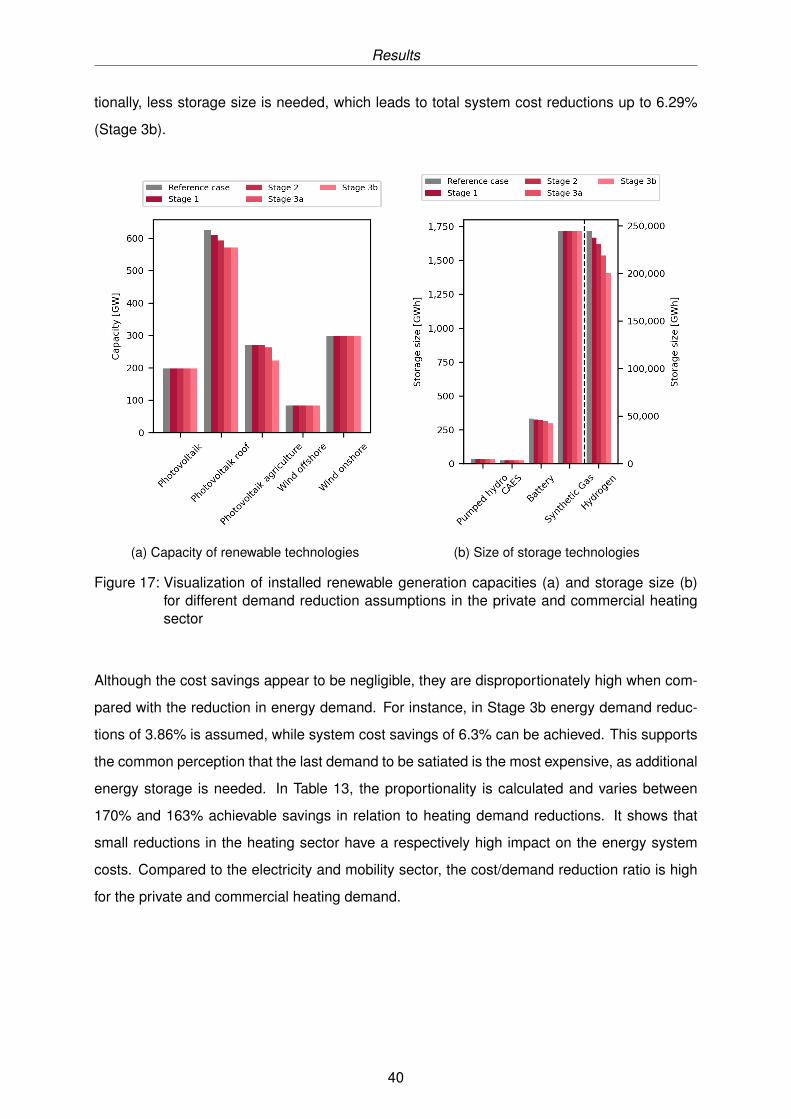
Results
tionally, less storage size is needed, which leads to total system cost reductions up to 6.29%
(Stage 3b).
(a) Capacity of renewable technologies (b) Size of storage technologies
Figure 17: Visualization of installed renewable generation capacities (a) and storage size (b)for different demand reduction assumptions in the private and commercial heatingsector
Although the cost savings appear to be negligible, they are disproportionately high when com-
pared with the reduction in energy demand. For instance, in Stage 3b energy demand reduc-
tions of 3.86% is assumed, while system cost savings of 6.3% can be achieved. This supports
the common perception that the last demand to be satiated is the most expensive, as additional
energy storage is needed. In Table 13, the proportionality is calculated and varies between
170% and 163% achievable savings in relation to heating demand reductions. It shows that
small reductions in the heating sector have a respectively high impact on the energy system
costs. Compared to the electricity and mobility sector, the cost/demand reduction ratio is high
for the private and commercial heating demand.
40
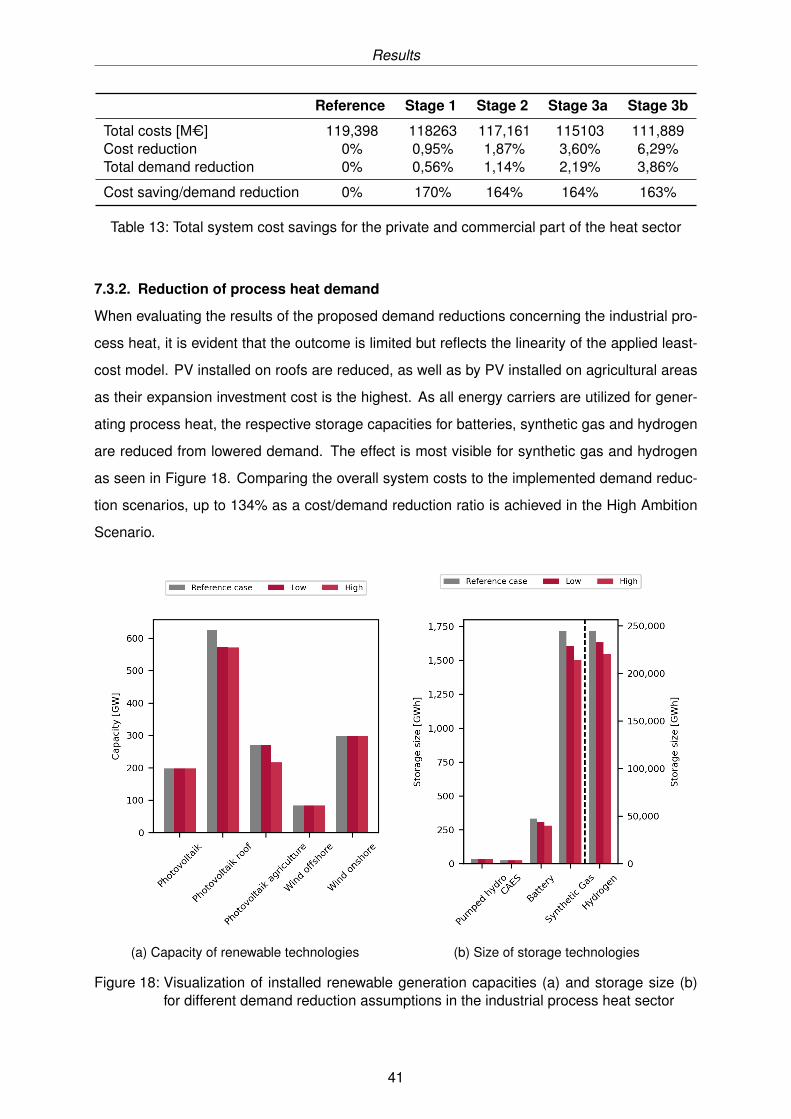
Results
Reference Stage 1 Stage 2 Stage 3a Stage 3b
Total costs [MC] 119,398 118263 117,161 115103 111,889Cost reduction 0% 0,95% 1,87% 3,60% 6,29%Total demand reduction 0% 0,56% 1,14% 2,19% 3,86%
Cost saving/demand reduction 0% 170% 164% 164% 163%
Table 13: Total system cost savings for the private and commercial part of the heat sector
7.3.2. Reduction of process heat demand
When evaluating the results of the proposed demand reductions concerning the industrial pro-
cess heat, it is evident that the outcome is limited but reflects the linearity of the applied least-
cost model. PV installed on roofs are reduced, as well as by PV installed on agricultural areas
as their expansion investment cost is the highest. As all energy carriers are utilized for gener-
ating process heat, the respective storage capacities for batteries, synthetic gas and hydrogen
are reduced from lowered demand. The effect is most visible for synthetic gas and hydrogen
as seen in Figure 18. Comparing the overall system costs to the implemented demand reduc-
tion scenarios, up to 134% as a cost/demand reduction ratio is achieved in the High Ambition
Scenario.
(a) Capacity of renewable technologies (b) Size of storage technologies
Figure 18: Visualization of installed renewable generation capacities (a) and storage size (b)for different demand reduction assumptions in the industrial process heat sector
41
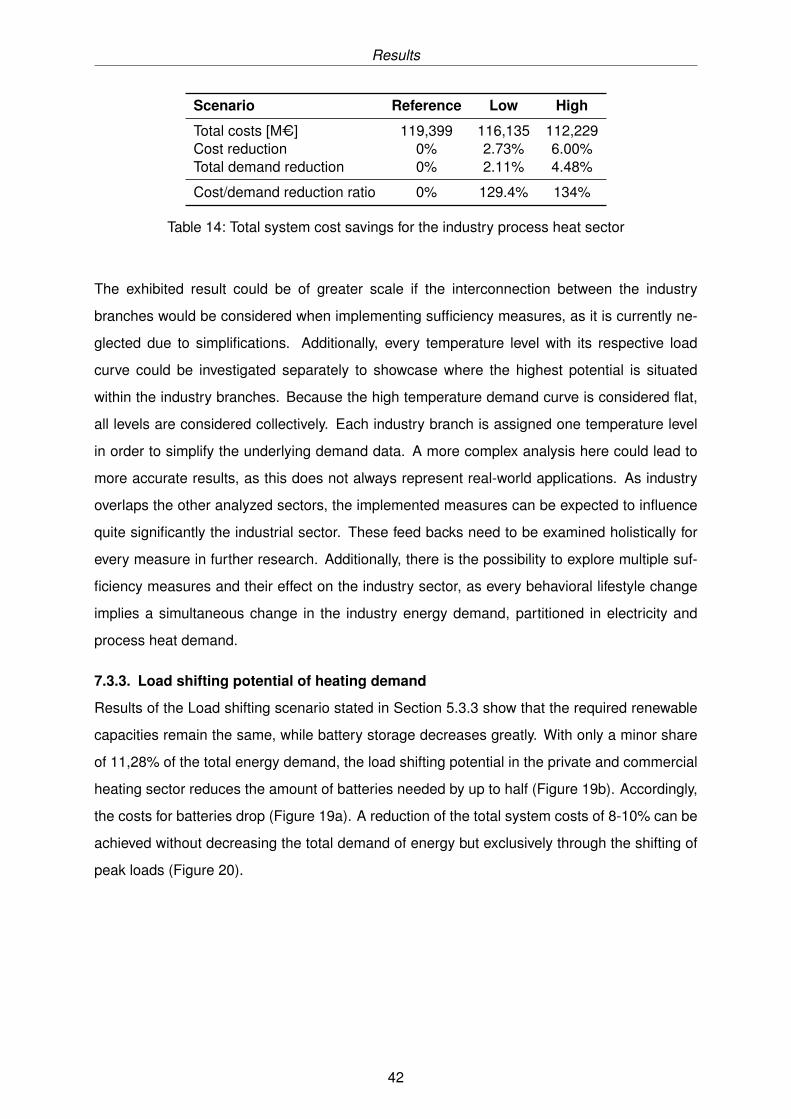
Results
Scenario Reference Low High
Total costs [MC] 119,399 116,135 112,229Cost reduction 0% 2.73% 6.00%Total demand reduction 0% 2.11% 4.48%
Cost/demand reduction ratio 0% 129.4% 134%
Table 14: Total system cost savings for the industry process heat sector
The exhibited result could be of greater scale if the interconnection between the industry
branches would be considered when implementing sufficiency measures, as it is currently ne-
glected due to simplifications. Additionally, every temperature level with its respective load
curve could be investigated separately to showcase where the highest potential is situated
within the industry branches. Because the high temperature demand curve is considered flat,
all levels are considered collectively. Each industry branch is assigned one temperature level
in order to simplify the underlying demand data. A more complex analysis here could lead to
more accurate results, as this does not always represent real-world applications. As industry
overlaps the other analyzed sectors, the implemented measures can be expected to influence
quite significantly the industrial sector. These feed backs need to be examined holistically for
every measure in further research. Additionally, there is the possibility to explore multiple suf-
ficiency measures and their effect on the industry sector, as every behavioral lifestyle change
implies a simultaneous change in the industry energy demand, partitioned in electricity and
process heat demand.
7.3.3. Load shifting potential of heating demand
Results of the Load shifting scenario stated in Section 5.3.3 show that the required renewable
capacities remain the same, while battery storage decreases greatly. With only a minor share
of 11,28% of the total energy demand, the load shifting potential in the private and commercial
heating sector reduces the amount of batteries needed by up to half (Figure 19b). Accordingly,
the costs for batteries drop (Figure 19a). A reduction of the total system costs of 8-10% can be
achieved without decreasing the total demand of energy but exclusively through the shifting of
peak loads (Figure 20).
42
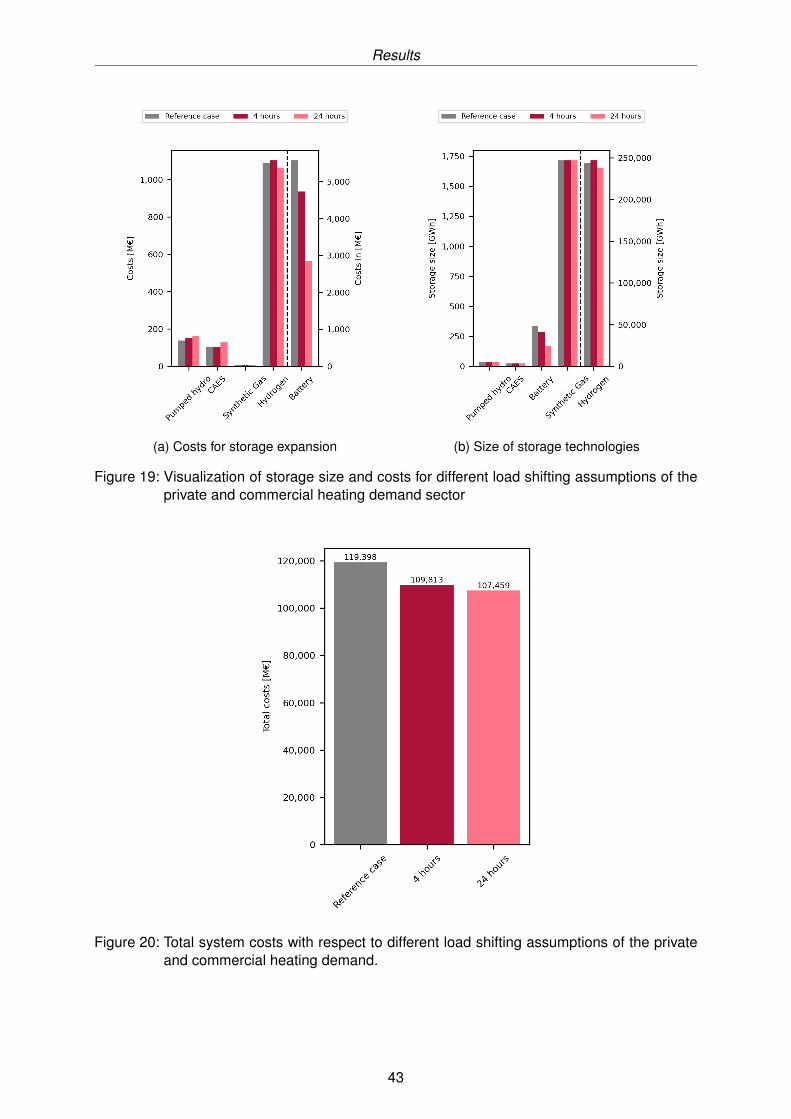
Results
(a) Costs for storage expansion (b) Size of storage technologies
Figure 19: Visualization of storage size and costs for different load shifting assumptions of theprivate and commercial heating demand sector
Figure 20: Total system costs with respect to different load shifting assumptions of the privateand commercial heating demand.
43
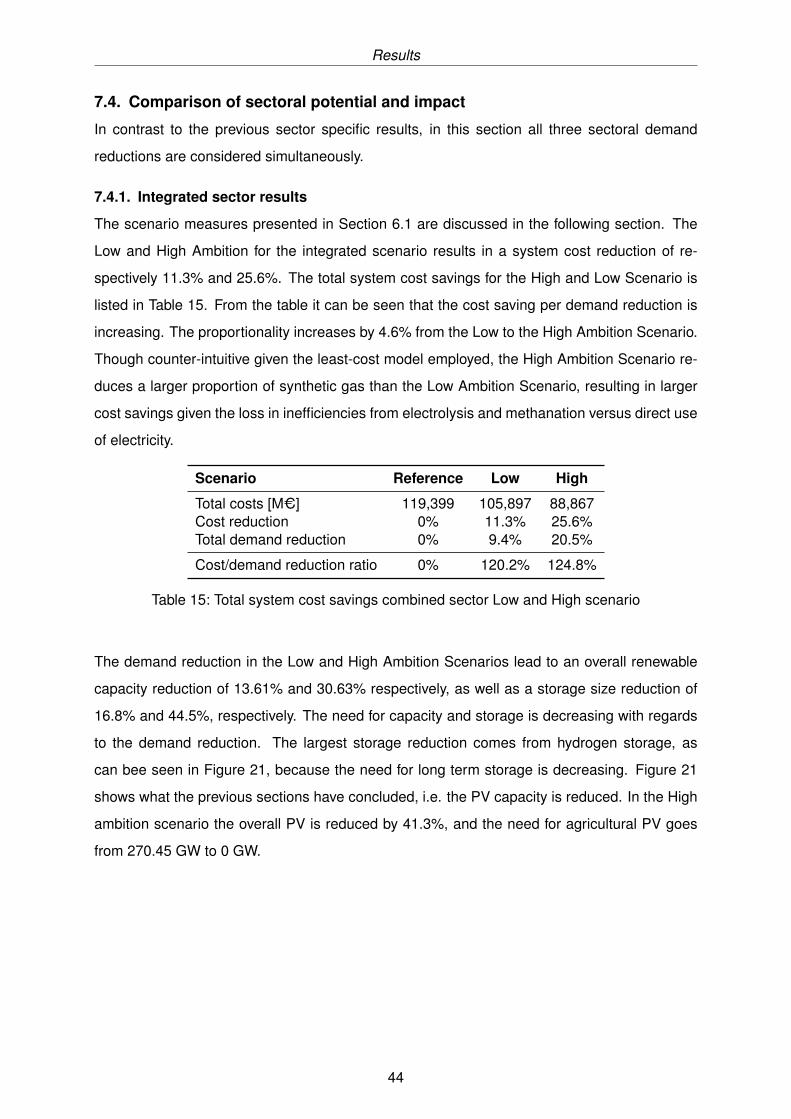
Results
7.4. Comparison of sectoral potential and impact
In contrast to the previous sector specific results, in this section all three sectoral demand
reductions are considered simultaneously.
7.4.1. Integrated sector results
The scenario measures presented in Section 6.1 are discussed in the following section. The
Low and High Ambition for the integrated scenario results in a system cost reduction of re-
spectively 11.3% and 25.6%. The total system cost savings for the High and Low Scenario is
listed in Table 15. From the table it can be seen that the cost saving per demand reduction is
increasing. The proportionality increases by 4.6% from the Low to the High Ambition Scenario.
Though counter-intuitive given the least-cost model employed, the High Ambition Scenario re-
duces a larger proportion of synthetic gas than the Low Ambition Scenario, resulting in larger
cost savings given the loss in inefficiencies from electrolysis and methanation versus direct use
of electricity.
Scenario Reference Low High
Total costs [MC] 119,399 105,897 88,867Cost reduction 0% 11.3% 25.6%Total demand reduction 0% 9.4% 20.5%
Cost/demand reduction ratio 0% 120.2% 124.8%
Table 15: Total system cost savings combined sector Low and High scenario
The demand reduction in the Low and High Ambition Scenarios lead to an overall renewable
capacity reduction of 13.61% and 30.63% respectively, as well as a storage size reduction of
16.8% and 44.5%, respectively. The need for capacity and storage is decreasing with regards
to the demand reduction. The largest storage reduction comes from hydrogen storage, as
can bee seen in Figure 21, because the need for long term storage is decreasing. Figure 21
shows what the previous sections have concluded, i.e. the PV capacity is reduced. In the High
ambition scenario the overall PV is reduced by 41.3%, and the need for agricultural PV goes
from 270.45 GW to 0 GW.
44
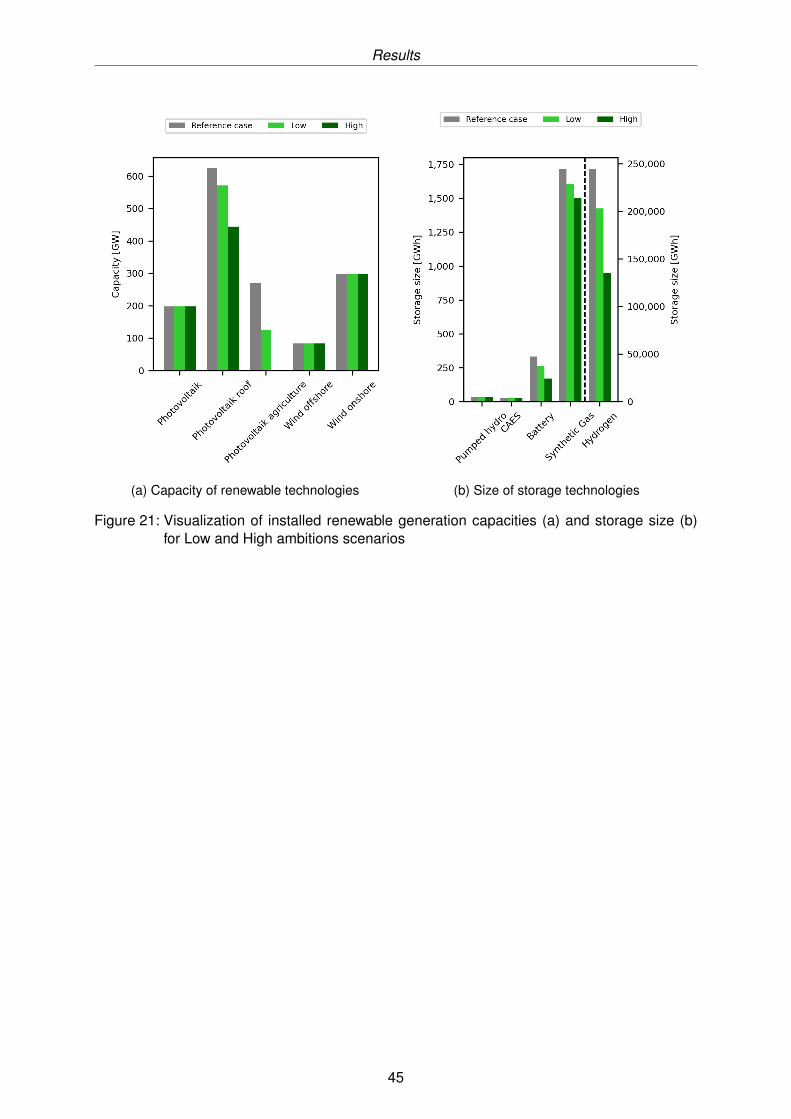
Results
(a) Capacity of renewable technologies (b) Size of storage technologies
Figure 21: Visualization of installed renewable generation capacities (a) and storage size (b)for Low and High ambitions scenarios
45
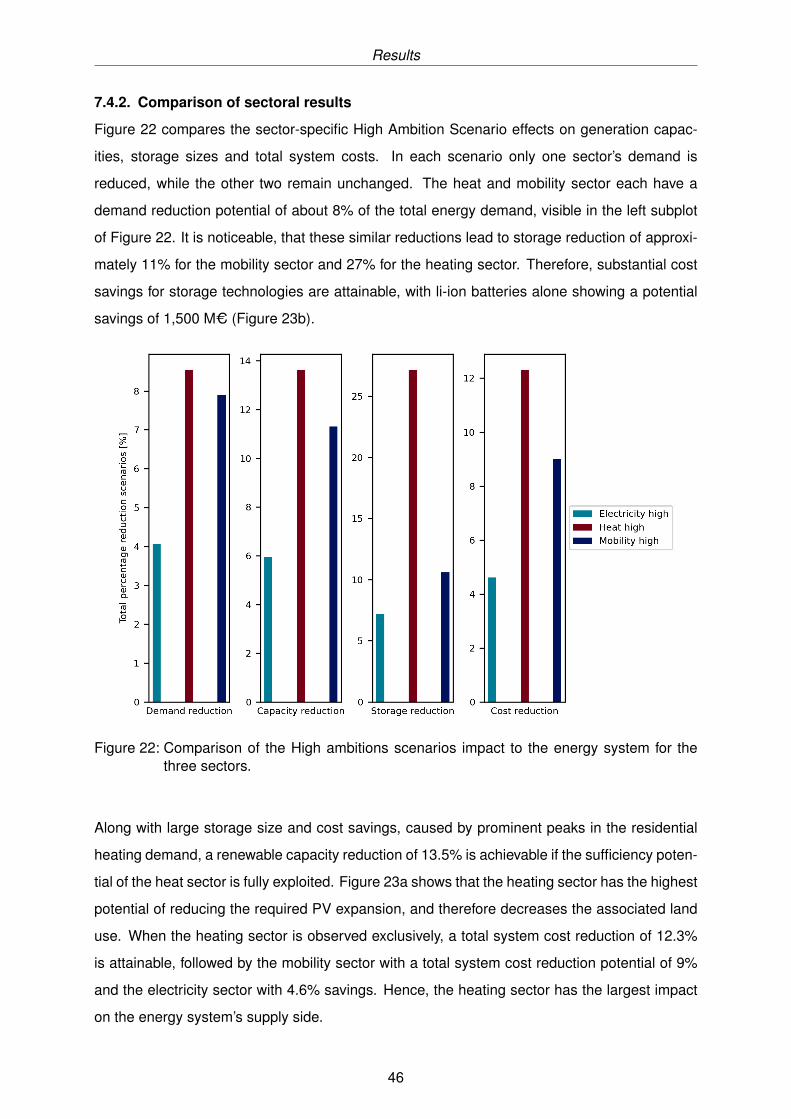
Results
7.4.2. Comparison of sectoral results
Figure 22 compares the sector-specific High Ambition Scenario effects on generation capac-
ities, storage sizes and total system costs. In each scenario only one sector’s demand is
reduced, while the other two remain unchanged. The heat and mobility sector each have a
demand reduction potential of about 8% of the total energy demand, visible in the left subplot
of Figure 22. It is noticeable, that these similar reductions lead to storage reduction of approxi-
mately 11% for the mobility sector and 27% for the heating sector. Therefore, substantial cost
savings for storage technologies are attainable, with li-ion batteries alone showing a potential
savings of 1,500 MC (Figure 23b).
Figure 22: Comparison of the High ambitions scenarios impact to the energy system for thethree sectors.
Along with large storage size and cost savings, caused by prominent peaks in the residential
heating demand, a renewable capacity reduction of 13.5% is achievable if the sufficiency poten-
tial of the heat sector is fully exploited. Figure 23a shows that the heating sector has the highest
potential of reducing the required PV expansion, and therefore decreases the associated land
use. When the heating sector is observed exclusively, a total system cost reduction of 12.3%
is attainable, followed by the mobility sector with a total system cost reduction potential of 9%
and the electricity sector with 4.6% savings. Hence, the heating sector has the largest impact
on the energy system’s supply side.
46
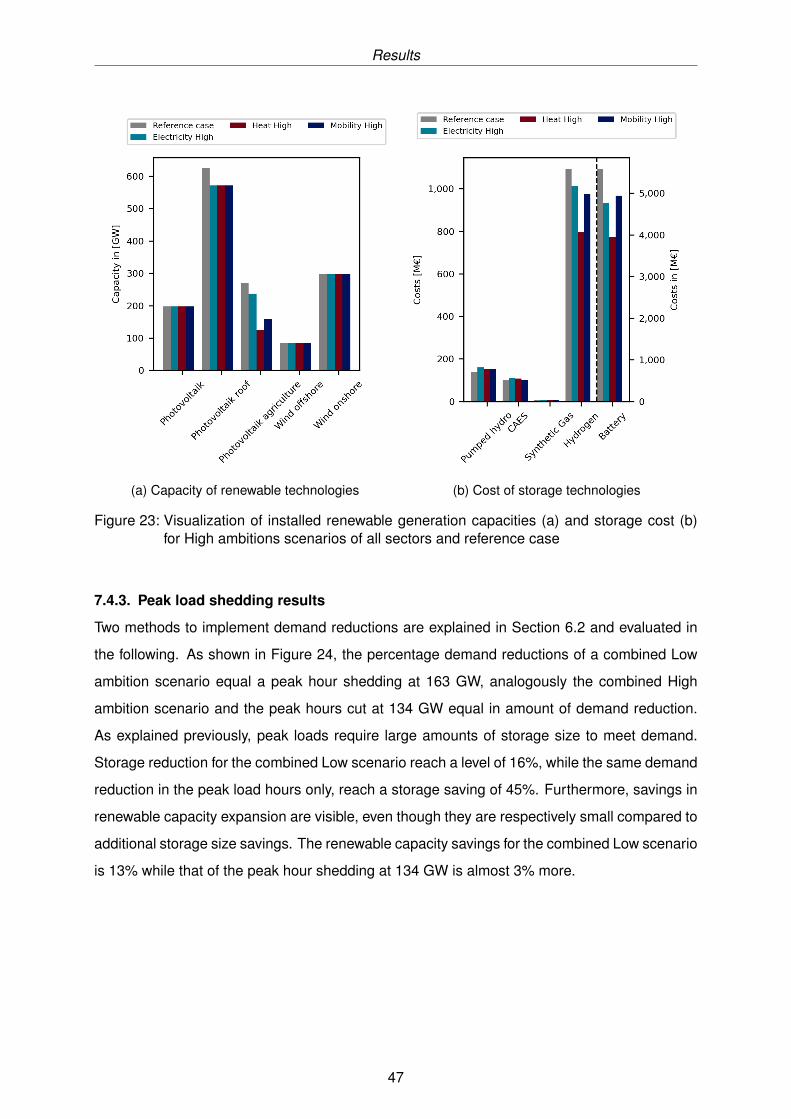
Results
(a) Capacity of renewable technologies (b) Cost of storage technologies
Figure 23: Visualization of installed renewable generation capacities (a) and storage cost (b)for High ambitions scenarios of all sectors and reference case
7.4.3. Peak load shedding results
Two methods to implement demand reductions are explained in Section 6.2 and evaluated in
the following. As shown in Figure 24, the percentage demand reductions of a combined Low
ambition scenario equal a peak hour shedding at 163 GW, analogously the combined High
ambition scenario and the peak hours cut at 134 GW equal in amount of demand reduction.
As explained previously, peak loads require large amounts of storage size to meet demand.
Storage reduction for the combined Low scenario reach a level of 16%, while the same demand
reduction in the peak load hours only, reach a storage saving of 45%. Furthermore, savings in
renewable capacity expansion are visible, even though they are respectively small compared to
additional storage size savings. The renewable capacity savings for the combined Low scenario
is 13% while that of the peak hour shedding at 134 GW is almost 3% more.
47
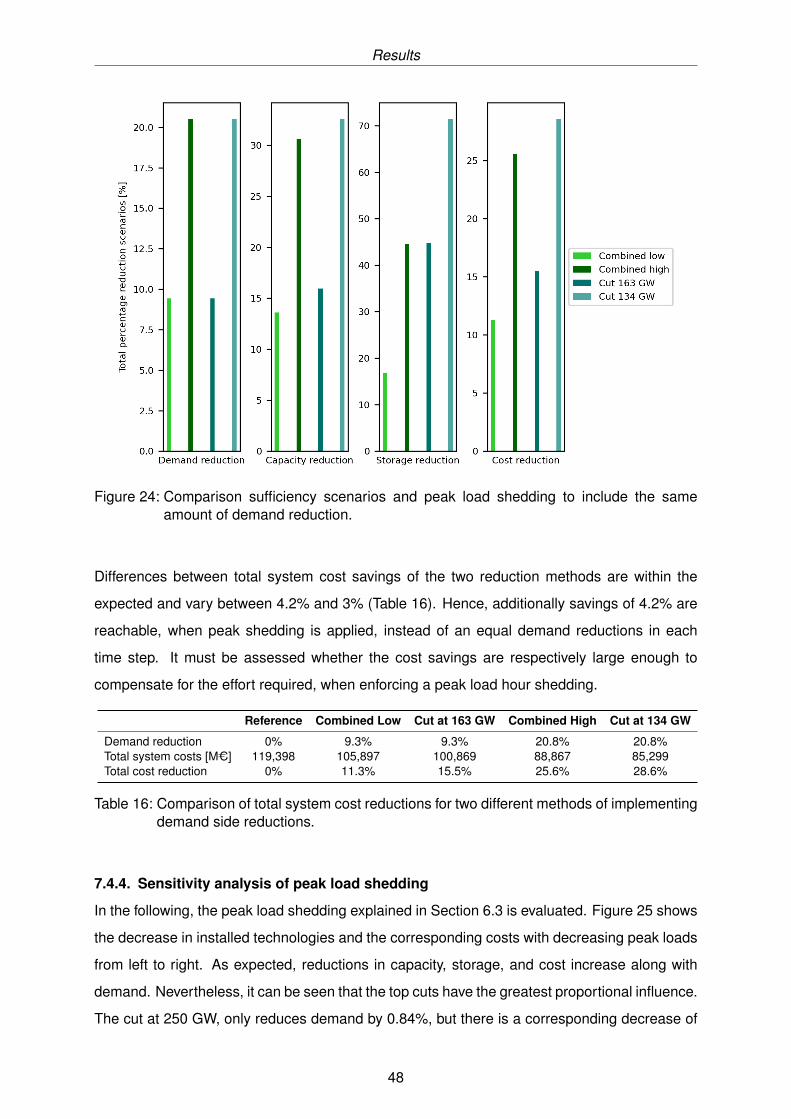
Results
Figure 24: Comparison sufficiency scenarios and peak load shedding to include the sameamount of demand reduction.
Differences between total system cost savings of the two reduction methods are within the
expected and vary between 4.2% and 3% (Table 16). Hence, additionally savings of 4.2% are
reachable, when peak shedding is applied, instead of an equal demand reductions in each
time step. It must be assessed whether the cost savings are respectively large enough to
compensate for the effort required, when enforcing a peak load hour shedding.
Reference Combined Low Cut at 163 GW Combined High Cut at 134 GW
Demand reduction 0% 9.3% 9.3% 20.8% 20.8%Total system costs [MC] 119,398 105,897 100,869 88,867 85,299Total cost reduction 0% 11.3% 15.5% 25.6% 28.6%
Table 16: Comparison of total system cost reductions for two different methods of implementingdemand side reductions.
7.4.4. Sensitivity analysis of peak load shedding
In the following, the peak load shedding explained in Section 6.3 is evaluated. Figure 25 shows
the decrease in installed technologies and the corresponding costs with decreasing peak loads
from left to right. As expected, reductions in capacity, storage, and cost increase along with
demand. Nevertheless, it can be seen that the top cuts have the greatest proportional influence.
The cut at 250 GW, only reduces demand by 0.84%, but there is a corresponding decrease of
48
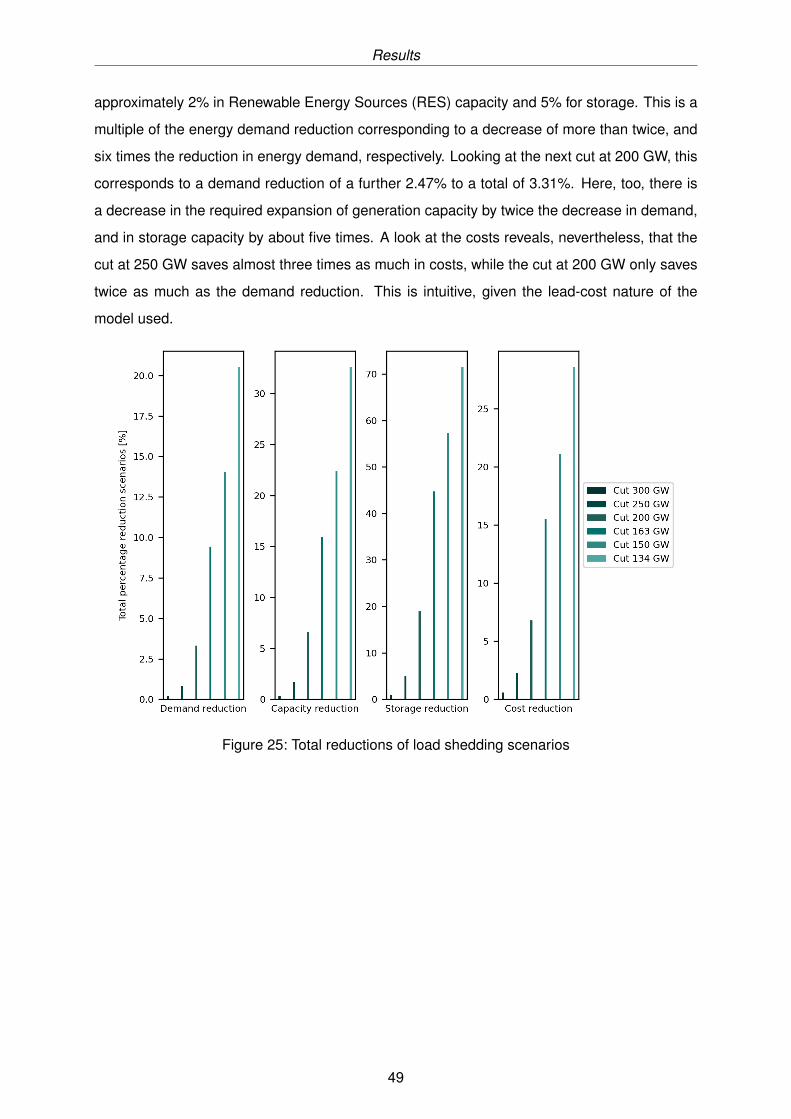
Results
approximately 2% in Renewable Energy Sources (RES) capacity and 5% for storage. This is a
multiple of the energy demand reduction corresponding to a decrease of more than twice, and
six times the reduction in energy demand, respectively. Looking at the next cut at 200 GW, this
corresponds to a demand reduction of a further 2.47% to a total of 3.31%. Here, too, there is
a decrease in the required expansion of generation capacity by twice the decrease in demand,
and in storage capacity by about five times. A look at the costs reveals, nevertheless, that the
cut at 250 GW saves almost three times as much in costs, while the cut at 200 GW only saves
twice as much as the demand reduction. This is intuitive, given the lead-cost nature of the
model used.
Figure 25: Total reductions of load shedding scenarios
49
Conclusion
8. ConclusionTechnological development and political commitments are beginning to enable the vision of a
sustainable, carbon-neutral society. Worldwide investment is rising in renewable energy re-
search and development, and installed capacities of wind and solar continue to grow. However,
political and public acceptance can shift, as technology will inevitably be constrained by the
physical space allowed for renewable capacity expansion. The ongoing discussions on path-
ways towards net-zero economies have centered their focus on adapting the industrial appara-
tus to sustain its consumption trends. Now, every possible solution must be explored thoroughly
to ensure the most efficient pathway towards a sustainable future.
This paper investigates a relatively unexplored topic within energy planning: the value of re-
ducing the absolute energy demand through behavioural changes. Modifying human behavior
becomes a complex task when individual needs are tackled. Consequently, many contributions
to this field have not attracted much attention to the public and hence to political agendas. For
alternative solutions to be taken seriously, studies focused on demand reduction must intro-
duce feasible changes to consumption behaviors, while producing competitive results. Such
studies do not include efficiency or other technological solutions, but are instead are focused
on people’s actions, individual and collective. Through extensive literature review, reasonable
demand reductions were arrived at based off personal choices, whether it be cycling more often
to work, telecommuting, reducing consumer purchasing, or reducing the temperature in one’s
household.
A least-cost energy system model is applied to model the effects of behavioural changes on the
supply side. The model minimizes total system costs of a greenfield, 100% renewable energy
system for Germany, using costs assumptions for 2035. Results show that a reduction of up
to 20% of the required generation and storage capacity is achievable. A such reduction would
also decrease the amount of land needed to support the installation of renewable generation
technologies, such as in case of wind and solar. This can potentially reduce political friction,
increasing social acceptance of further renewable capacity expansion and create incentives for
further reductions in demand. Additionally, savings in marginal and investment cost can reach
up to 25%, reducing not only the amount of resources needed but also increasing the feasibility
of the model within the considered time frame.
The scarcity of research on demand reduction and similar topics makes this field of investiga-
tion relatively open to further expansion. Models targeting change in social behavior can be
tested against typical opposing arguments such as rebound or spillovers effects (Sorrell et al.,
2020). The presented framework for this paper can also be extended by testing it in more com-
50

Conclusion
plex designs by adding neighbours countries and their respective energy exchange. It has been
shown that these sufficiency measures are feasible and have a significant impact on the Ger-
man energy system. Therefore, sufficiency must be considered as a policy option to reducing
energy demand in Germany and hence support the transformation of the energy system.
51

Appendix
A. Supplementary dataTechnology Cost (C/kW)
Offshore Wind 3111.24Onshore Wind 1199.22Rooftop PV 594.20Open-space PV 406.97Agricultural PV 813.94Electrolyzer 542.49Methanation 865.32Hydrogen Plant 184.90
Table A.1: Technology cost assumptions, 2035 (Kost et al., 2018; Trommsdorff, 2020; Gökeet al., 2019).
52
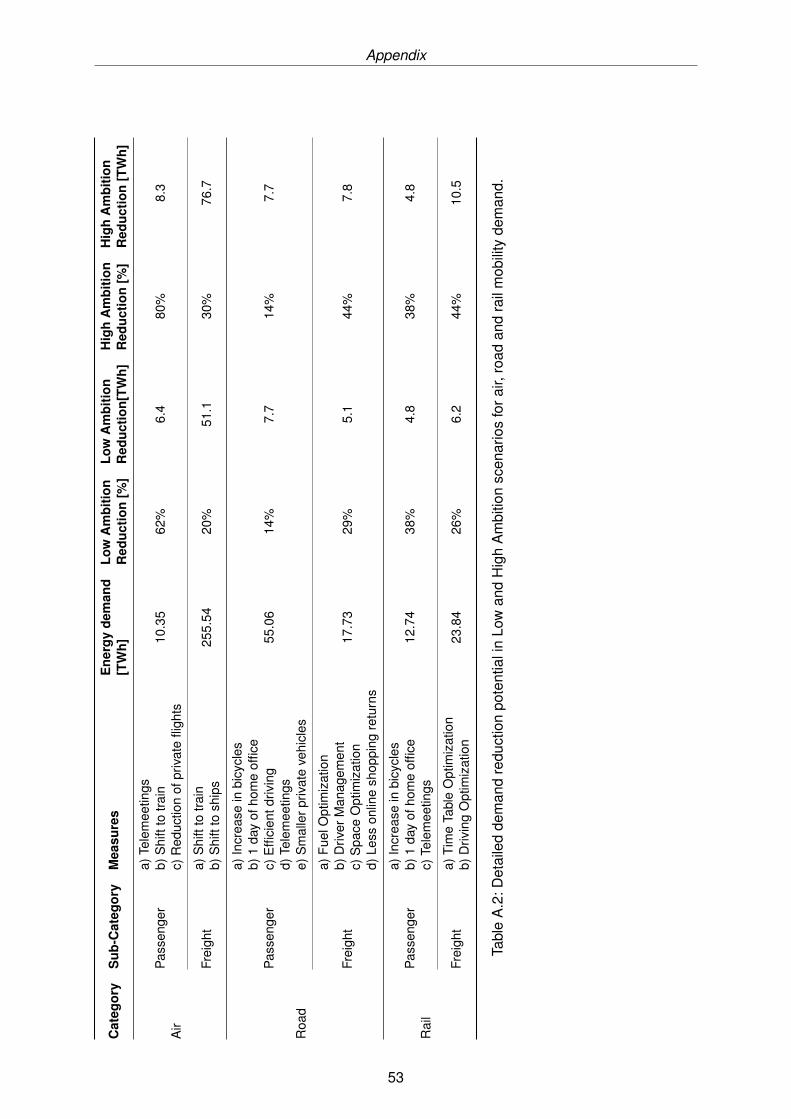
Appendix
Cat
egor
yS
ub-C
ateg
ory
Mea
sure
sE
nerg
yde
man
d[T
Wh]
Low
Am
bitio
nR
educ
tion
[%]
Low
Am
bitio
nR
educ
tion[
TWh]
Hig
hA
mbi
tion
Red
uctio
n[%
]H
igh
Am
bitio
nR
educ
tion
[TW
h]
Air
Pas
seng
era)
Tele
mee
tings
10.3
562
%6.
480
%8.
3b)
Shi
ftto
train
c)R
educ
tion
ofpr
ivat
efli
ghts
Frei
ght
a)S
hift
totra
in25
5.54
20%
51.1
30%
76.7
b)S
hift
tosh
ips
Roa
d
Pas
seng
er
a)In
crea
sein
bicy
cles
55.0
614
%7.
714
%7.
7b)
1da
yof
hom
eof
fice
c)E
ffici
entd
rivin
gd)
Tele
mee
tings
e)S
mal
lerp
rivat
eve
hicl
es
Frei
ght
a)Fu
elO
ptim
izat
ion
17.7
329
%5.
144
%7.
8b)
Driv
erM
anag
emen
tc)
Spa
ceO
ptim
izat
ion
d)Le
sson
line
shop
ping
retu
rns
Rai
lP
asse
nger
a)In
crea
sein
bicy
cles
12.7
438
%4.
838
%4.
8b)
1da
yof
hom
eof
fice
c)Te
lem
eetin
gs
Frei
ght
a)Ti
me
Tabl
eO
ptim
izat
ion
23.8
426
%6.
244
%10
.5b)
Driv
ing
Opt
imiz
atio
n
Tabl
eA
.2:D
etai
led
dem
and
redu
ctio
npo
tent
iali
nLo
wan
dH
igh
Am
bitio
nsc
enar
ios
fora
ir,ro
adan
dra
ilm
obili
tyde
man
d.
53
References
References
Association négaWatt (2017). The 2017-2050 négaWatt Scenario. Tech. rep. Alixan, France:
Association négaWatt.
Association négaWatt (2018). Energy sufficiency - Towards a more sustainable and fair soci-
ety. Tech. rep. Alixan, France: négaWatt Association.
Auer, H., Granado, P. C. del, Oei, P.-Y., Hainsch, K., Löffler, K., Burandt, T., Huppmann, D.,
and Grabaak, I. (2020). "Development and modelling of different decarbonization scenarios
of the European energy system until 2050 as a contribution to achieving the ambitious 1.5 °C
climate target—establishment of open source/data modelling in the European H2020 project
openENTRANCE." In: Elektrotechnik & Informationstechnik 1.13, 346–358.
Banks, N., Redgrove, Z., Gunn, M., Mullen, J., Ryle, J., Fawcett, T., Ristic, L., and Bird,
S. (2012). What are the factors influencing energy behaviours and decision-making in the
non-domestic sector. A Rapid Evidence Assessment. London, UK: Department of Energy
and Climate Change.
Bierwirth, A. and Thomas, S. (2019a). Energy sufficiency in buildings. Concept Paper. Ac-
cessed: 2021-01-20. Stockholm, Schweden: ECEEE.
Bierwirth, A. and Thomas, S. (2019b). "Estimating the sufficiency potential in buildings : the
space between underdimensioned and oversized," in: proceedings of Is efficient sufficient? :
ECEEE 2019 Summer Study. Stockholm: European Council for an Energy Efficient Economy,
pp. 1143–1153.
BMVI (2016). Freight Transport and Logistics Masterplan. Tech. rep. Berlin, Germany: Bun-
desministerium für Verkehr, Bau und Stadtentwicklung.
BMVI (2018). Energie auf neuen Wegen, Aktuelles zur Weiterentwicklung der Mobilitäts- und
Kraftstoffstrategie der Bundesregierung. Tech. rep. Berlin, Germany: Bundesministerium für
Verkehr und digitale Infrastruktur (BMVI), Referat G20 „Energie und Klimaschutz“.
BMVI (2019). Verkehr in Zahlen 2019/20. Tech. rep. Flensburg, Germany: Bundesministerium
für Verkehr und digitale Infrastruktur (BMVI).
BMWi (2019). Energieeffizienz in Zahlen. Entwicklungen und Trends in Deutschland 2019.
Tech. rep. Berlin, Germany: Bundesministerium für Wirtschaft und Energie (BMWi).
Bundesverband Baustoffe – Steine und Erden (2019). bbs-Zahlenspiegel 2019 - Daten
und Fakten zur Baustoff-, Steine-und-Erden-Industrie. Tech. rep. Bundesverband Baustoffe
– Steine und Erden e. V.
Bürger, V. (2009). Identifikation, Quantifizierung und Systematisierung technischer und ver-
haltensbedingter Stromeinsparpotenziale privater Haushalte. TRANSPOSE Working Paper
No3. Freiburg, Germany: Öko-Institut e.V.
54
References
Carrico, A. R. and Riemer, M. (2011). "Motivating energy conservation in the workplace: An
evaluation of the use of group-level feedback and peer education." In: Journal of Environ-
mental Psychology 31.1, 1–13.
Carroll, J., Lyons, S., and Denny, E. (2014). "Reducing household electricity demand through
smart metering: The role of improved information about energy saving." In: Energy Eco-
nomics 45, 234–243.
Chemischen Industrie, V. der (2020). Chemiewirtschaft in Zahlen 2020. Tech. rep. Frankfurt
am Main, Germany: Verband der Chemischen Industrie e.V.
Conversio GmbH (2018). Material flow analysis plastics in Germany 2017. Tech. rep. Frankfurt
am Main, Germany.
Corlu, C. G., Torre, R. de la, Serrano-Hernandez, A., Juan, A. A., and Faulin, J. (2020).
"Optimizing energy consumption in transportation: Literature review, insights, and research
opportunities." In: Energies 13.5, 1115.
Darby, S. and Fawcett, T. (2018). Energy sufficiency: An Introduction. Tech. rep.
Deutsche Bahn AG (2020). Integrierter Zwischenbericht Januar-Juni 2020. Tech. rep. Berlin,
Germany: Deutsche Bahn AG, Investor Relations.
Deutsche Bundesregierung (2016). Deutsche Nachhaltigkeitsstrategie - Neuauflage 2016.
Tech. rep. Berlin, Germany: Deutsche Bundesregierung.
Dionori, F., Casullo, L., Ellis, S., Ranghetti, D., Bablinski, K., Vollath, C., and Soutra, C.
(2015). Freight on road: why EU shippers prefer truck to train. Tech. rep. Brussels, Belgium:
European Parliament Committee on Transport and Tourism.
Donat, L. (2020). Policy Paper- Decarbonising transport in Germany: Policy options to support
a shift to rail. Bonn, Germany.
European Commission (2020). Circular economy action plan - For a cleaner and more com-
petitive Europe. Tech. rep. Brussels, Belgium.
Fraport AG (2020). Fraport-Verkehrszahlen 2020. Tech. rep. Frankfurt, Germany: Fraport AG.
Fraport AG (2021). Flughafen Frankfurt Monatsbericht zur Verkehrsentwicklung mit Jahreskom-
mentierung Dezember 2020. Tech. rep. Frankfurt, Germany: Fraport AG, Market and Trend
Research (UEW-MF).
Friedlingstein, P. et al. (2019). "Global Carbon Budget 2019." In: Earth System Science Data
11.4, 1783–1838.
Göke, L. (2020a). AnyMOD – A graph-based framework for energy system modeling with high
levels of renewables and sector integration. Tech. rep. arXiv: 2004.10184 [physics.soc-ph].
Göke, L. (2020b). AnyMOD.jl: A Julia package for creating energy system models. Tech. rep.
TU Berlin. arXiv: 2011.00895 [physics.soc-ph].
55
References
Göke, L., Poli, D., and Weibezahn, J. (2019). Current and Perspective Technology and Cost
Data of Flexibility Options. Tech. rep. OSMOSE Project EU Horizon 2020.
Gough, I. (2015). "Climate change and sustainable welfare: the centrality of human needs." In:
Cambridge Journal of Economics 39, 1191–1214.
Gough, I. (2017). “Climate capitalism: emissions, inequality, green growth”. In: Heat, Greed
and Human NeedClimate Change, Capitalism and Sustainable Wellbeing. Cheltenham, UK:
Edward Elgar Publishing.
Greiner, B. and Hermann, H. (2016). Sektorale Emissionspfade in Deutschland bis 2050.
Tech. rep. Öko-Institut: Freiburg, Germany.
Grubler, A., Wilson, C., Bento, N., Boza-Kiss, B., Krey, V., McCollum, D. L., Rao, N. D., Ri-
ahi, K., Rogelj, J., De Stercke, S., et al. (2018). "A low energy demand scenario for meeting
the 1.5 C target and sustainable development goals without negative emission technologies."
In: Nature energy 3.6, 515–527.
Hansen, M., Harrington, J., Herring, J., and Sowards, G. (2009). Working4Utah - Final Ini-
tiative Performance Report. Tech. rep. Utah, USA: Utah Governor’s Office.
Hertwich, E. G., Ali, S., Ciacci, L., Fishman, T., Heeren, N., Masanet, E., Asghari, F. N.,
Olivetti, E., Pauliuk, S., Tu, Q., et al. (2019). "Material efficiency strategies to reducing
greenhouse gas emissions associated with buildings, vehicles, and electronics—a review."
In: Environmental Research Letters 14.4, 043004.
Kost, C., Shammugam, S., Jülch, V., Nguyen, H.-T., and Schlegl, T. (2018). Stromgeste-
hungskosten Erneuerbare Energien. European Union Horizon 2020 Research Paper. Freiburg,
Germany: Fraunhofer Institute.
Larsen, A., Leth-Petersen, S., Kjærbye, V., and Rieper, O. (Oct. 2006). "The Effect of Energy
Audits in Danish Industry - Evaluation of a DSM Programme." In: Energy Studies Review 14
(2), 30–41.
Lehmann, F., Weiß, U., and Brischke, L.-A. (2015). Stromeinspareffekte durch Energieef-
fizienz und Energiesuffizienz im Haushalt. Modellierung und Quantifizierung für den Sektor
private Haushalte in Deutschland. Arbeitspapier im Rahmen des Projektes „Energiesuffizienz
- Strategien und Instrumente für eine technische, systemische und kulturelle Transformation
zur nachhaltigen Begrenzung des Energiebedarfs im Konsumfeld Bauen / Wohnen. Berlin,
Germany: ifeu - Institut für Energie- und Umweltforschung Heidelberg.
Marshall, E., Steinberger, J. K., Dupont, V., and Foxon, T. J. (Jan. 2016). "Combining en-
ergy efficiency measure approaches and occupancy patterns in building modelling in the UK
residential context." In: Energy and Buildings 111, 98–108.
56
References
Martiskainen, M. (2007). Affecting consumer behaviour on energy demand. Project Report.
Brighton, East Sussex: EdF Energy.
Mathiesen, B. et al. (2015). IDA’s Energy Vision 2050: A Smart Energy System strategy for
100% renewable Denmark. Department of Development and Planning, Aalborg University.
Mundaca, L., Ürge-Vorsatz, D., and Wilson, C. (2019). "Demand-side approaches for limiting
global warming to 1.5 °C." In: Energy Efficiency 12.2, 343–362.
Nilsson, A., Andersson, K., and Bergstad, C. J. (2015). "Energy behaviors at the office: an
intervention study on the use of equipment." In: Applied energy 146, 434–441.
Owen, T., A. Pape-Salmon, and B. McMurchy, eds. (2010). Employee engagement and energy
information software supporting carbon neutrality. Vol. 7. 2010 ACEEE Summer Study on
Energy Efficiency in Buildings. Pacific Grove, California.
Palmer, J., Terry, N., and Pope, P. (2012). How much energy could be saved by making small
changes to everyday household behaviours. Tech. rep. London, United Kingdom.
Peters, G. P., Andrew, R. M., Canadell, J. G., Friedlingstein, P., Jackson, R. B., Kors-
bakken, J. I., Le Quéré, C., and Peregon, A. (Jan. 2020). "Carbon dioxide emissions con-
tinue to grow amidst slowly emerging climate policies." In: Nature Climate Change 10.1, 3–
6.
Pfenninger, S., Hawkes, A., and Keirstead, J. (2014). "Energy systems modeling for twenty-
first century energy challenges." In: Renewable and Sustainable Energy Reviews 33, 74–
86.
Prakash, S., Dehoust, G., Gsell, M., Schleicher, T., and Stamminger, R. (2016). Einfluss
der Nutzungsdauer von Produkten auf ihre Umweltwirkung: Schaffung einer Informations-
grundlage und Entwicklung von Strategien gegen „Obsoleszenz “. Tech. rep. Berlin,Germany:
Umweltbundesamt.
Robra, B., Heikkurinen, P., and Nesterova, I. (2020). "Commons-based peer production for
degrowth?-The case for eco-sufficiency in economic organisations." In: Sustainable Futures
2, 100035.
Roth, J.-J., Bernecker, T., Lohre, D., Grandjot, H.-H., and Poerschke, V. (2015). Sustain-
able Logistics- An Introduction to the Concept and Case Studies from Germany. Tech. rep.
Eschborn, Germany: Deutsche Gesellschaft für Internationale Zusammenarbeit (GIZ).
Samadi, S., Gröne, M.-C., Schneidewind, U., Luhmann, H.-J., Venjakob, J., and Best,
B. (2017). "Sufficiency in energy scenario studies: Taking the potential benefits of lifestyle
changes into account." In: Technological Forecasting and Social Change 124, 126–134.
57
References
Sandberg, M., Klockars, K., and Wilén, K. (2019). "Green growth or degrowth? Assessing the
normative justifications for environmental sustainability and economic growth through critical
social theory." In: Journal of Cleaner Production 206, 133–141.
Schill, W.-P. and Zerrahn, A. (2018). "Long-run power storage requirements for high shares of
renewables: Results and sensitivities." In: Renewable and Sustainable Energy Reviews 83,
156–171.
Schmidt, T., Schneider, F., Leverenz, D., and Hafner, G. (2019). Lebensmittelabfälle in Deutschland–
Baseline 2015–. Tech. rep. Braunschweig, Germany: Thünen Institut.
Sen, A. (1999). Development as Freedom. Newyork, USA: Oxford University Press.
Sorrell, S., Gatersleben, B., and Druckman, A. (2020). "The limits of energy sufficiency: A
review of the evidence for rebound effects and negative spillovers from behavioural change."
In: Energy Research & Social Science 64, 101439.
WV-Stahl (2020). Fakten zur Stahlindustrie in Deutschland 2020. Tech. rep. Berlin, Germany:
Wirtschaftsvereinigung Stahl.
Steffen Noleppa, M. C. (2015). Das große Wegschmeißen - Vom Acker bis zum Verbraucher:
Ausmaß und Umwelteffekte der Lebensmittelverschwendung in Deutschland. Tech. rep. Berlin,Germany:
WWF Deutschland.
Sterchele, P., Brandes, J., Heilig, J., Wrede, D., Kost, C., Schlegl, T., Bett, A., and Hen-
ning, H.-M. (2020). Paths to a Climate-neutral Energy System. Tech. rep. Freiburg, Germany:
Fraunhofer Institute for Solar Energy Systems ISE.
Toulouse, E. and Attali, S. (2018). Energy sufficiency in products. Concept Paper. ECEEE.
Toulouse, E., Le Dû, M., Gorge, H., and Semal, L. (2017). "Stimulating energy sufficiency:
barriers and opportunities," in: proceedings of Consumption, efficiency and limits : ECEEE
2017 Summer Study ; 29 May–3 June 2017, Belambra Les Criques, Toulon/Hyères, France ;
proceedings. Stockholm: European Council for an Energy Efficient Economy, pp. 59–70.
Toulouse, E., Sahakian, M., Lorek, S., Bohnenberger, K., and Bierwirth Anja Leuser, L.
(2019). "Energy sufficiency: how can research better help and inform policy-making?," in:
proceedings of Is efficient sufficient? : ECEEE 2019 Summer Study ; 03-08 June 2019,
Presqu’ile de Giens, France ; proceedings. Stockholm: European Council for an Energy Effi-
cient Economy, pp. 321–331.
Trommsdorff, M. (2020). Agri-Photovoltaik: Chance Für Landwirtschaft und Energiewende.
Fraunhofer Research Paper. Freiburg, Germany: Fraunhofer ISE.
Umweltbundesamt (Nov. 2015). Konzept zur absoluten Verminderung des Energiebedarfs:
Potenziale, Rahmenbedingungen und Instrumente zur Erreichung der Energieverbrauchs-
58
References
ziele des Energiekonzepts. Climate Change 17/2016. Dessau-Roßlau, Germany: Öko-Institut
Freiburg im Auftrag des Umweltbundesamtes.
Umweltbundesamt (2019). Umweltschonender Luftverkehr, lokal-national-international. Tech.
rep. Dessau-Rosslau, Germany: Umweltbundesamt.
Umweltbundesamt (2021). Kunststoffe – Produktion, Verwendung und Verwertung. Tech. rep.
Berlin, Germany: Umweltbundesamt.
UNEP (2020). Emissions Gap Report 2020. Tech. rep. United Nations Environment Programme
(UNEP) and UNEP DTU Partnership (UDP).
Ven, D.-J. van de, González-Eguino, M., and Arto, I. (2018). "The potential of behavioural
change for climate change mitigation: A case study for the European Union." In: Mitigation
and adaptation strategies for global change 23.6, 853–886.
Venturini, G., Hansen, M., and Andersen, P. D. (2019). "Linking narratives and energy sys-
tem modelling in transport scenarios: A participatory perspective from Denmark." In: Energy
Research & Social Science 52, 204–220.
Venturini, G., Karlsson, K., and Münster, M. (2019). "Impact and effectiveness of transport
policy measures for a renewable-based energy system." In: Energy Policy 133, 110900.
Villalobos, J. and Wilmsmeier, G. (2016). Freight transport by road: Tools and strategies for
energy efficiency and sustainability. Tech. rep. Vitacura, Santiago de Chile.
Vita, G., Lundström, J. R., Hertwich, E. G., Quist, J., Ivanova, D., Stadler, K., and Wood, R.
(2019). "The environmental impact of green consumption and sufficiency lifestyles scenarios
in Europe: connecting local sustainability visions to global consequences." In: Ecological
economics 164, 106322.
Wieser, H. (2016). "Beyond planned obsolescence: Product lifespans and the challenges to a
circular economy." In: GAIA-Ecological Perspectives for Science and Society 25.3, 156–160.
Wilhite, H. and Norgard, J. S. (2003). "A case for self-deception in energy policy," in: Time
to turn down energy demand : ECEEE 2003 Summer Study. Stockholm, Sweden: European
Council for an Energy Efficient Economy, pp. 126–134.
Zangheri, P., Serrenho, T., and Bertoldi, P. (2019). "Energy Savings from Feedback Systems:
A Meta-Studies’ Review." In: Energies 12.19.
59


![[DATA SUFFICIENCY] - Solutions](https://img.pdfslide.us/doc/110x75/62019492cf1b84113b6594e5/data-sufficiency-solutions.jpg)