Embed Size (px)
Citation preview
Loughborough UniversityInstitutional Repository
The potential of kaolin as areinforcing filler for rubbercomposites with new sulfur
cure systems
This item was submitted to Loughborough University's Institutional Repositoryby the/an author.
Citation: SHEIKH, S.H. ... et al, 2017. The potential of kaolin as a reinforcingfiller for rubber composites with new sulfur cure systems. Journal of ReinforcedPlastics and Composites, 36(16), pp.1132-1145.
Additional Information:
• This paper was accepted for publication in the journal Journal of Re-inforced Plastics and Composites and the definitive published version isavailable at https://doi.org/10.1177/0731684417712070.
Metadata Record: https://dspace.lboro.ac.uk/2134/25591
Version: Accepted for publication
Publisher: SAGE c© The Author(s)
Rights: This work is made available according to the conditions of the Cre-ative Commons Attribution-NonCommercial-NoDerivatives 4.0 International(CC BY-NC-ND 4.0) licence. Full details of this licence are available at:https://creativecommons.org/licenses/by-nc-nd/4.0/
Please cite the published version.
1
The potential of kaolin as reinforcing filler for rubber composites
with new sulfur cure systems
Saad H Sheikh1, Xuena Yin1, Ali Ansarifar1, Keith Yendall2
1Materials Department, Loughborough University, UK
2Loughborough Materials Characterization Centre, Loughborough University, UK
Abstract
The effect of a large amount of kaolin (China clay) on the viscosity, cure, hardness,
Young’s modulus, tensile strength, elongation at break, stored energy density at
break, tear energy and compression set resistance of some sulfur-cured natural
rubber (NR), polybutadiene rubber (BR) and ethylene-propylene-diene rubber
(EPDM) composites was investigated. The kaolin surface had been pre-treated with
3-mercaptopropyltrimethoxysilane (MPTS) to improve its dispersion in the rubbers.
For NR, the hardness and Young’s modulus improved, tensile strength and tear
energy were unchanged and the remaining properties deteriorated when kaolin was
added. The viscosity increased and the scorch and optimum cure times decreased
whilst the cure rate rose with kaolin. For BR and EPDM, with the exception of the
compression set resistance, all the properties including the viscosity gained from the
kaolin. The kaolin was found to be extending or non-reinforcing filler for NR, and
highly reinforcing for BR and EPDM. In addition, the scorch and optimum cure times
and cure rate of BR benefitted, whereas with the exception of the scorch time, the
optimum cure time and cure rate of EPDM were adversely affected by kaolin.
Corresponding author: A. Ansarifar at [email protected], Tel: +44 01509-223159
Fax no:+44 01509 223949
2
Keywords
Rubber, kaolin, viscosity, cure properties, mechanical properties
Introduction
Solid fillers and curing chemicals perform two distinct functions in rubber compounds.
Fillers increase the dynamic and mechanical properties1,2 and curing chemicals
produce crosslinks between the rubber chains at elevated temperatures, i.e., 140-
220oC.3,4 Since the discovery of their reinforcing qualities almost 100 years ago,
petroleum-based colloidal carbon blacks (CB) have been used extensively in rubber
reinforcement.5,6 The term reinforcement is defined as the increases in properties
such as tensile strength, tear strength, hardness, abrasion resistance and modulus.7
Synthetic silicas have been replacing CBs in some applications for example tire
tread compound8 and proved to be as effective as CBs. However, the surface of
silicas possesses siloxane and silanol groups, which make the filler acidic9 and
moisture adsorbing.10 Acidity and moisture are both detrimental to the cure of rubber
compounds11 and can also cause loss of crosslink density in sulfur-cured rubbers.12
Bifunctional organosilanes, known also as coupling agent, remedy the problems
aforementioned and are used to enhance the reinforcing capability of silicas in
rubber.12 Other fillers such as layer silicates13-18, carbon nanotubes19-21, and
exfoliated graphene22,23 have been intensively researched as a potential reinforcing
agent in rubber. Several examples of reviews24-27 suggest that the nanofillers
mentioned above are a promising reinforcing agent to improve mechanical and
dynamic properties of rubber particularly at low filler loading. Among the fillers,
hydrous aluminium phyllosilicates or clay minerals such as montmorillonite (MMT)
and kaolin have received much attention in recent years because they are relatively
3
inexpensive and also non-carcinogenic. Since MMT consists of a triple-layer
sandwich structure, hence its dispersion mechanism in rubber is different from
carbon black and silica which have a spherical shape.28 As reported in literature28-32
intercalation and exfoliation morphologies are used to characterise the clay layer
dispersion in clay/polymer nanocomposites. The latter morphology is more desirable
due to its high surface area, which is important in rubber reinforcement.
Nevertheless, producing a high level of clay dispersion in rubber is still a challenge.
Several studies have looked into potential replacement of CB and silica with
kaolin. Similar to silica, the kaolin surface possesses OH groups, which makes it
polar and moisture adsorbing. To improve dispersion of the kaolin particles in rubber,
the filler surface is often treated with silane.33 Previous studies where kaolin was
used in natural rubber (NR) showed promising results. For example, in a study small
amount of kaolin, i.e. 10 phr, was modified with sodium salt of rubber seed oil (SRSO)
and mixed with NR.34 The rubber filled with SRSO-modified kaolin cured faster than
that of a similar mix containing unmodified kaolin. In addition, the NR composites
containing SRSO-modified kaolin showed considerable increases in tensile modulus,
tensile strength, and elongation at break. This indicated kaolin potential as an
organo-modified nanofiller.
In a study, importance of the surface organo-modification of kaolin was
demonstrated.35 Metal salt of rubber seed oil (RSO-Na) was used to modify kaolin
and then was introduced into NR. Rubber composites mixed with various
compositions of pristine and modified kaolin (2-10 phr) were then prepared and
tested. The results showed that the modified kaolin improved the cure and
mechanical properties of the rubber composite compared to the pristine kaolin-filled
rubber. For example, the viscosity and hardness increased with increase in filler
4
concentration. Furthermore, the extent of crosslink density and rubber-filler
interaction also improved. It was concluded that the presence of the modified kaolin
resulted in the formation of a higher number of crosslinks, which was attributed to the
confinement of the rubber chains within the silicate galleries and consequently, to
better interaction between the filler and the rubber.
Typical rubber formulation for commercial products such as NR-based conveyor
belt cover consists of up to eleven different chemical additives including cure system
and reinforcing filler. The cure system is made of sulfur, three accelerators (primary
and secondary), and primary and secondary activators (zinc oxide and stearic acid),
respectively), adding up to 9.7 parts per hundred rubber (phr) by weight.36 The
reinforcing filler is carbon black (CB).36 In any rubber formulation, chemical curatives
and solid fillers are indispensable. The former provides shape stability and the latter,
reinforcement of the dynamic and mechanical properties of the cured rubber, which
is essential for the performance, durability and life of the final product in service.37-38
Excessive use of the chemical curatives is harmful to health, safety, and the
environment. According to the European Directive 67/548/EEC, zinc oxide is very
toxic to aquatic organisms. Stearic acid causes skin and eye irritation and is
classified as highly flammable.39 Both of these chemicals are used extensively as
activator in sulfur vulcanization.36 & 40 Besides, CBs could be highly toxic and pose a
considerable health risk associated with their use in rubber compounds.41 There is a
need to replace CB with less harmful solid fillers.
The aim of this study was to investigate effect of up to 140 phr of kaolin modified
with a mercaptosilane on the viscosity, cure and mechanical properties of some
commercially important rubber composites. The study used a new method for
5
measuring the exact amount of the chemical curatives required in the sulfur
vulcanization of the rubbers. The idea was to substantially reduce the usage of these
harmful chemicals and replace toxic carbon black and silica/silane filler systems with
the much safer mineral kaolin.
Experimental
Materials and mixing
The raw rubbers used were standard Malaysian natural rubber (NR) grade L
(98wt%1,4-cis content; SMRL); high cis polybutadiene rubber (96wt% 1,4-cis content;
Buna CB24, Bayer, Newbury, UK; not oil extended); ethylene-propylene-diene
rubber (EPDM; 48wt% ethylene content, 9wt% ethylidene norbornene content, and
13wt% oil content, Keltan 6251A, Lanxess, The Netherlands). The reinforcing filler
was Mercap 100 (Imerys Ceramics, USA). Mercap 100 is kaolin (China clay;
Al2Si2O5 (OH)4), the surface of which had been pre-treated with 3-mercaptopropyl-
trimethoxysilane (MPTS) to reduce its polarity and prevent it from adsorbing moisture.
As mentioned earlier, surface polarity and moisture are detrimental to the dispersion
of filler particles in rubber and sulfur vulcanization of rubber compounds.9-12 MPTS
contains less than 2wt% of sulfur. Mercap 100 has a very fine particle size of about
0.3 micron and 25 m2/g surface area measured by nitrogen adsorption (Imerys
Ceramics, USA). It contains approximately 90 parts per million (ppm) of sulfur, which
primarily comes from trace secondary minerals, mainly pyrite (FeS2) with a melting
point of 1,100oC. The kaolin was supplied in a plastic bag. The powder was placed in
an oven at 80oC for at least 48 h to remove moisture if any before mixing it with the
rubbers.
6
In addition to the raw rubbers and kaolin, the other ingredients were elemental
sulfur (curing agent, Solvay Barium Strontium, Hannover, Germany), N-tert-butyl-2-
benzothiazole sulfenamide (a fast-curing delayed-action accelerator with a melting
point of 105oC, Santocure TBBS, Sovereign Chemicals, USA), zinc oxide (ZnO, an
activator, Harcros Durham Chemicals, Durham, UK), stearic acid (an activator,
Anchor Chemicals Ltd, UK); and N-(1,3-dimethylbutyl)-N-phenyl-p-phenylene-
diamine (6PPD) (an antidegradant with a melting point of 45-51oC, Santoflex 13,
Brussels, Belgium).
The raw rubbers were mixed with the chemical ingredients in a Haake Rheocord
90 (Berlin, Germany), a small laboratory mixer with counter-rotating rotors, to
produce compounds. The Banbury rotors and the mixing chamber were initially
set at ambient temperature (23°C) and the rotor speed was set at 45rpm. The
volume of the mixing chamber was 78 cm3 and it was 60% full during mixing. Polylab
monitor 4.17 software was used for controlling the mixing condition and storing data.
To prepare the unfilled NR, BR and EPDM compounds, the raw rubber was
introduced first into the mixer and mixed for 1 min and then sulfur, TBBS, ZnO,
stearic acid and antidegradant were added and mixed for another 12 min. A similar
procedure was used for making the kaolin-filled compounds where kaolin was added
3 min after mixing started. The temperature of the compounds during mixing was 58-
62°C.
Determination of the optimum amount of the chemical curatives in the sulfur-filled NR, BR and EPDM rubbers Sulfur is used extensively in the vulcanization of a wide range of industrial rubber
articles. For example, the cure system in NR-based tyre belt skim compound has 5
phr 42, in SBR/BR-based compound for footwear 2 phr 43, and in EPDM-based
7
general gaskets 1 phr of sulfur.44 In this study, the NR had 1 and 4 phr, BR 0.5 and 1
phr, and EPDM 1 phr of sulfur. To react the sulfur with the rubber to form crosslinks,
TBBS was added. The loading of TBBS was raised from 0.25 to 4.5 phr and forty
seven compounds were made. Zinc oxide was used as primary activator to improve
the effectiveness of TBBS during curing. The loading of ZnO in the rubbers with
sulfur and TBBS was increased from 0 to 0.5 phr and forty four compounds were
mixed. To evaluate effect of stearic acid (used as secondary activator with ZnO) on
the cure properties of the rubbers with sulfur, TBBS and ZnO, twenty two
compounds were prepared. The loading of stearic acid was raised from 0 to 2.5 phr
to measure the amount needed to improve efficiency of the cure systems.
Viscosity, cure properties, hardness, tensile properties, tear energy and compression set of the rubber vulcanizates The viscosity, cure properties, hardness, tensile properties and tear energy of the
rubbers were measured according to the procedures described in the British
Standards.
Viscosity: British Standard 1673, Part 3 (1969), using a Mooney viscometer
(Wallace Instruments, Surrey, UK) and the results were expressed as Mooney
Units (MU).
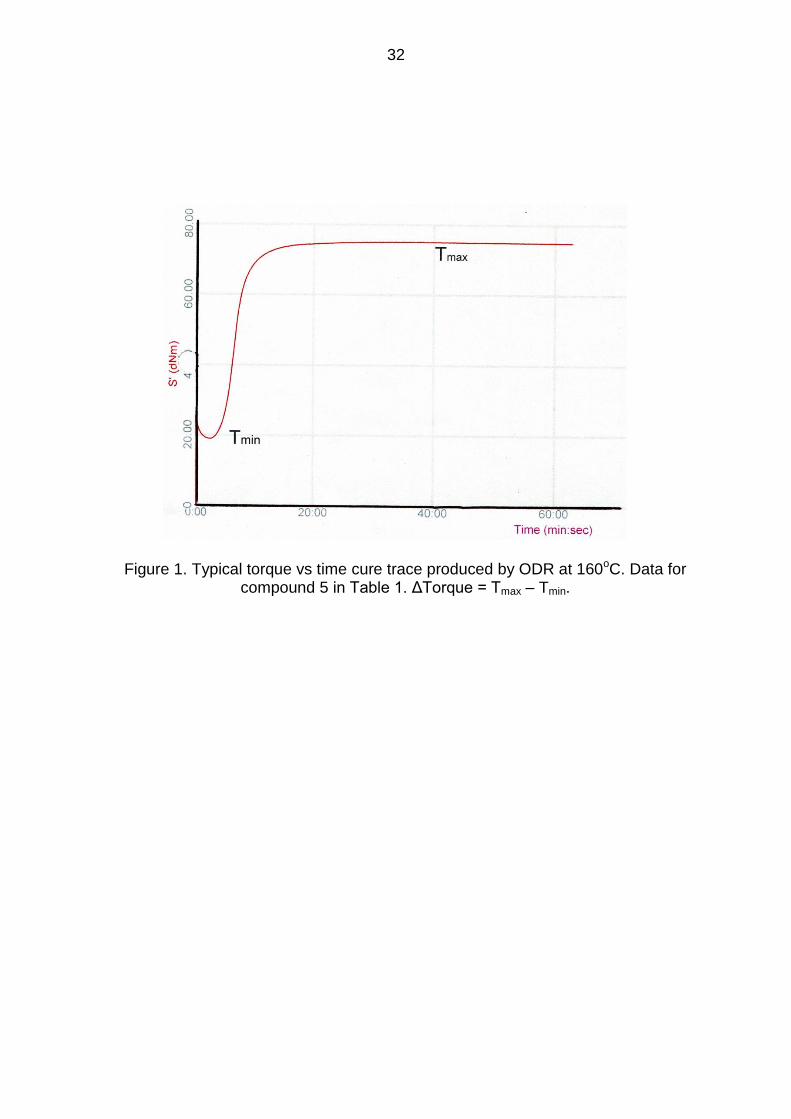
Cure properties: British Standard 1673: Part 10 (1977), using oscillating disc
rheometer curemeter (ODR, Monsanto, Swindon, UK) at 160 ± 2oC. From the cure
traces (Figure 1), scorch time, ts2, which is the time for the onset of cure,
and the optimum cure time, t95, which is the time for the completion of cure were
determined. Torque which is the difference between the maximum and minimum
torque values on the cure trace of a compound and is an indication of crosslink
density changes in the rubber45 was also measured. ∆torque was afterwards
8
plotted against the loading of TBBS, ZnO, and stearic acid.
Cure rate index (CRI): British Standard 903: Part A60: Section 60.1. (1996). CRI is
an indication of the rate of cure in the rubber.
Hardness: British Standard 903: Part A26 (1995), using cylindrical samples
6 mm thick and 15 mm in diameter, in a Shore A Durometer hardness tester (The
Shore Instrument & MFG, Co., New York). The test temperature was 23.5oC.
Tensile stress-strain properties (tensile strength, elongation at break, stored energy
at break and Young’s modulus: British Standard 903: Part A2 (1995), in a
LR50K plus materials testing machine (Lloyd Instrument, UK), using standard
dumbbell test pieces. Lloyd Nexygen 4.5.1. was used to process and store the
data. The test temperature was 22oC and the crosshead speed was set at 100
mm/min.
Tear energy: British Standard 903: Part A3 (1995), in a LR50K plus materials
testing machine (Lloyd Instruments, UK), using trouser test pieces. The test
temperature was at ambient (23oC), tear angle 180o, and crosshead speed
was set at 50 mm/min.
Compression set: British Standard 903: Part A6 (1992), in circular steel
compression set jig, 210 mm in diameter, at 25% compression for 24 h at 70oC,
using cylindrical samples 6 mm thick and 15 mm in diameter. At the end of each
test, the sample was removed and allowed to cool down at room temperature
(20oC) for 30 min before the set was measured.
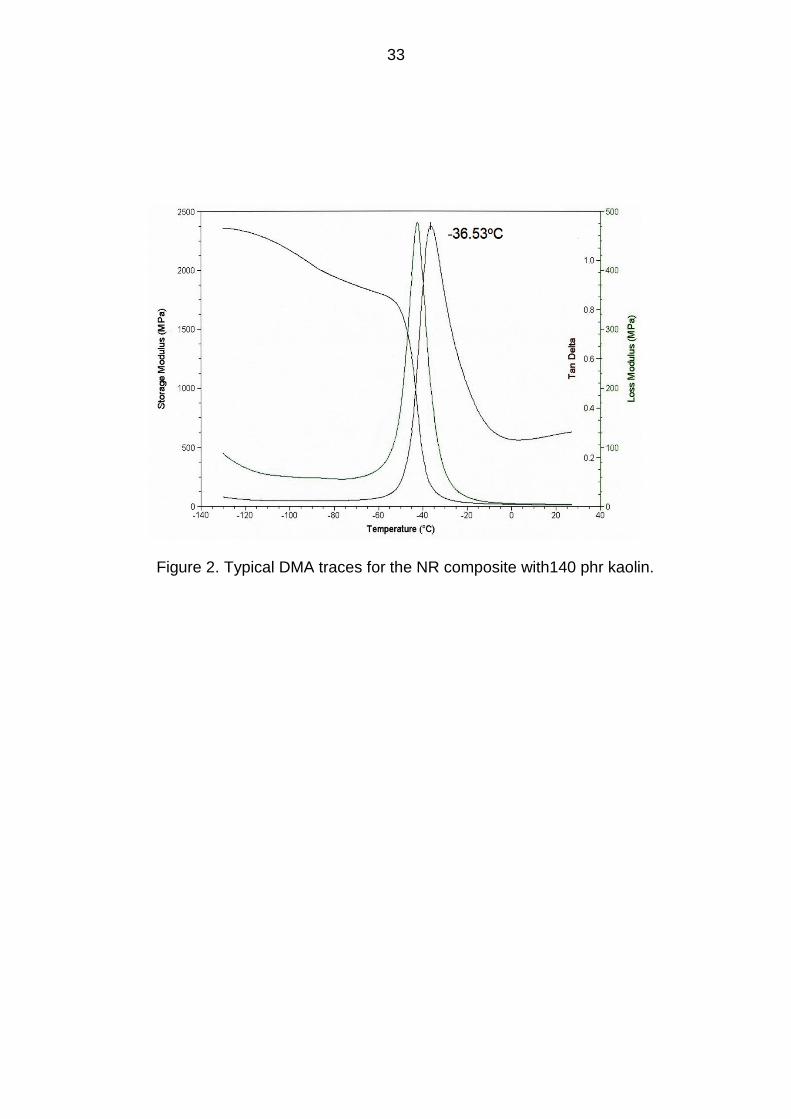
Glass transition temperature of the rubber composites
Tan is the ratio between loss modulus and elastic modulus. The loss modulus
represents the viscous component of modulus and includes all the energy dissipation
processes during dynamic strain. The loss modulus, storage modulus and tan were
measured in DMAQ800 model CFL-50 (TA Instruments, USA), using Universal
9
Analysis 2000 Software Version 4.3A. Test pieces 35 mm long, 10 mm wide and
approximately 2.8 mm thick were used. The tests were performed at 1Hz frequency.
The samples were deflected 256 µm (nominal peak to peak displacement) during the
test, and the sample temperature was raised from -130oC to 30oC at 3oC/min steps.
The measurements were repeated to ensure reproducibility of the results. The glass
transition temperature of the rubber composites was subsequently determined from
the peak values on the tan vs temperature traces (Figure 2).
Swelling tests in solvent
The organic solvent used for the swelling tests was a laboratory reagent grade
Toluene (Fisher Scientific, UK). In these tests, approximately 1.5 g of rubber was
placed in 60 ml of the solvent in labelled bottles and allowed to swell for 50 days at
20°C. The weight of the sample was measured every day until it reached equilibrium.
The mass of the rubber in the kaolin-filled sample was calculated before it was
placed in the solvent. Increase in the weight of the sample in the solvent was
attributed to the swelling of the rubber phase. This excluded the dilution effect of the
unswellable rigid kaolin from the measurements. The degree of swelling or solvent
intake of the rubber in percentage was calculated, using the following expression:
Degree of swelling = 𝑊𝑠𝑟−𝑊𝑑𝑟
𝑊𝑑𝑟 ˟ 100 (1)
where Wsr is the weight of the swollen rubber and Wdr the weight of the dry rubber in
the sample.
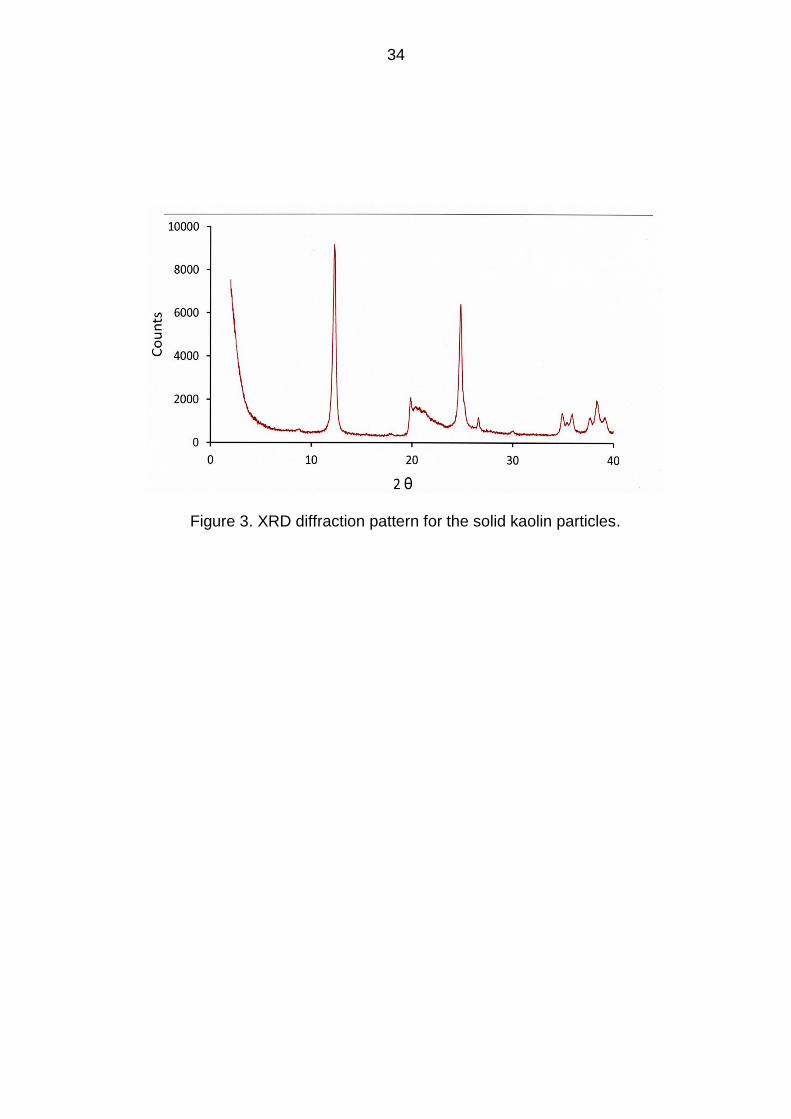
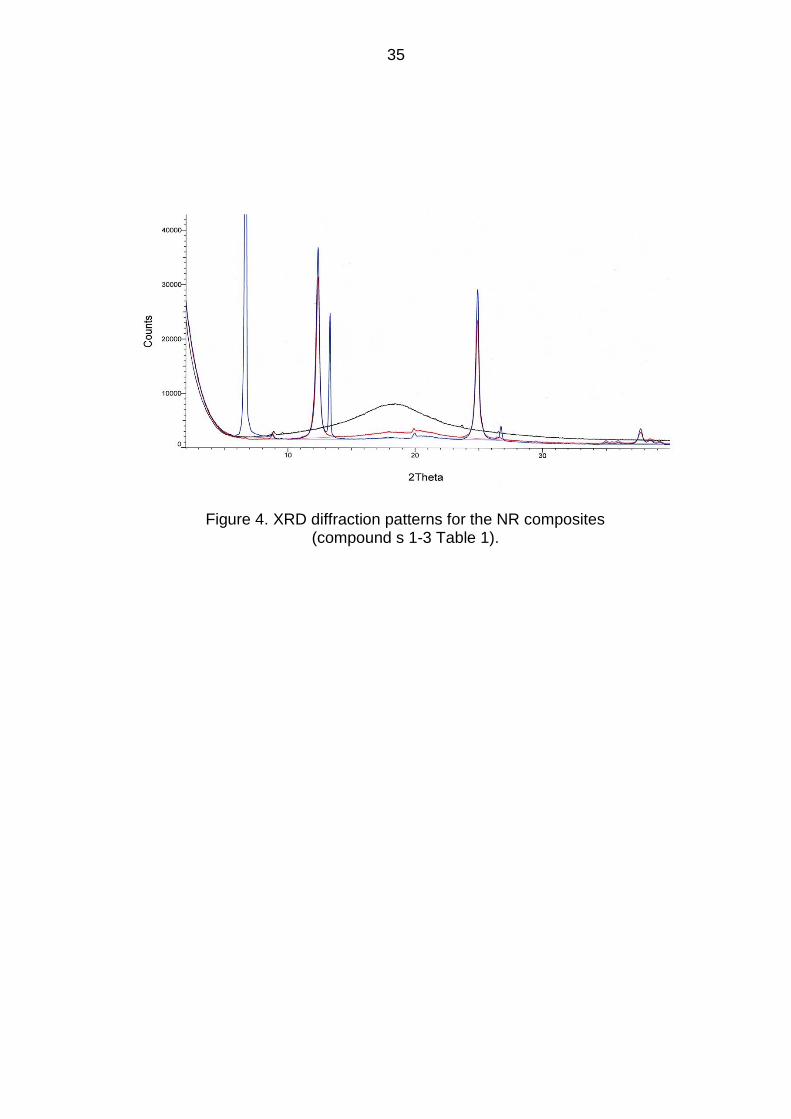
X-ray diffraction analysis of the kaolin powder and internal structure of the NR composites The X-ray diffraction (XRD) patterns of the layered kaolin and NR composites
(compounds 1-3; Table 1) were produced on a Bruker D2 diffractometer (Bruker,
10
Germany). The diffractometer was equipped with Cu Kα radiation (= 0.15418 nm),
10 mA of current and 30 kV of voltage. A minimum of 3 g of dried kaolin powder was
used to carry out the X-ray analysis of the mineral clay. Square flat sheets, 20 mm
by 20 mm and 2.8 mm thick, of the cured rubbers were used for the X-ray analysis of
the NR composites. The experiment was performed at low angle in the range
2θ = 1-10oC with the scan rate of 0.02o/s. In addition, the spacing between the
structural layers of the kaolin was measured according to the Bragg’s law (eq. (2)),
n = 2 d sin θ (2)
where n is an integer, is the X-ray wavelength, d is the interlayer spacing, and θ is
the angle of diffraction. Some XRD diffraction patterns of the solid kaolin particles
and NR composites were subsequently produced (Figures 3 and 4).
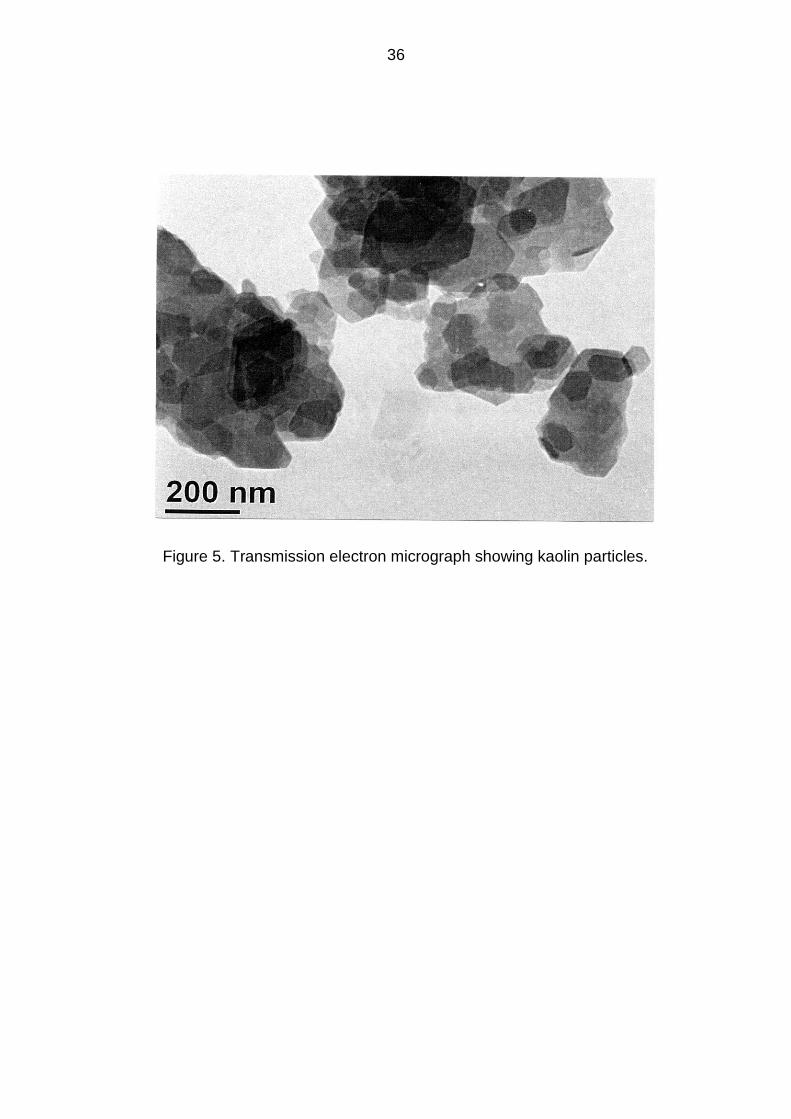
Assessment of the kaolin filler and dispersion of the kaolin particles in the rubbers by electron microscopy
The kaolin was investigated by a transmission electron microscope (TEM) model
2000FX (JEOL, Japan). A small amount of the dry kaolin powder, approximately 0.1
g in weight, was placed in a glass tube and mixed with 3 ml of a HPLC grade
methanol solvent (Fisher Scientific, UK). The glass tube was then placed in an
ultrasonic machine for 15 minutes in order to disperse the kaolin particles in the
solvent. After this time elapsed, an electron transparent standard holey carbon film
10-20 nm thick was placed on a copper mesh grid 25 microns thick for TEM samples
and inserted in the tube to collect the kaolin nanoparticles. The grid was recovered
and placed on a clean tissue paper to remove excess solvent and left in a clean
cabinet at room temperature (~20oC) for 24 hours to allow the solvent to fully
evaporate before placing it in the TEM. Some micrographs were then prepared for
final analysis (Figure 5).
11
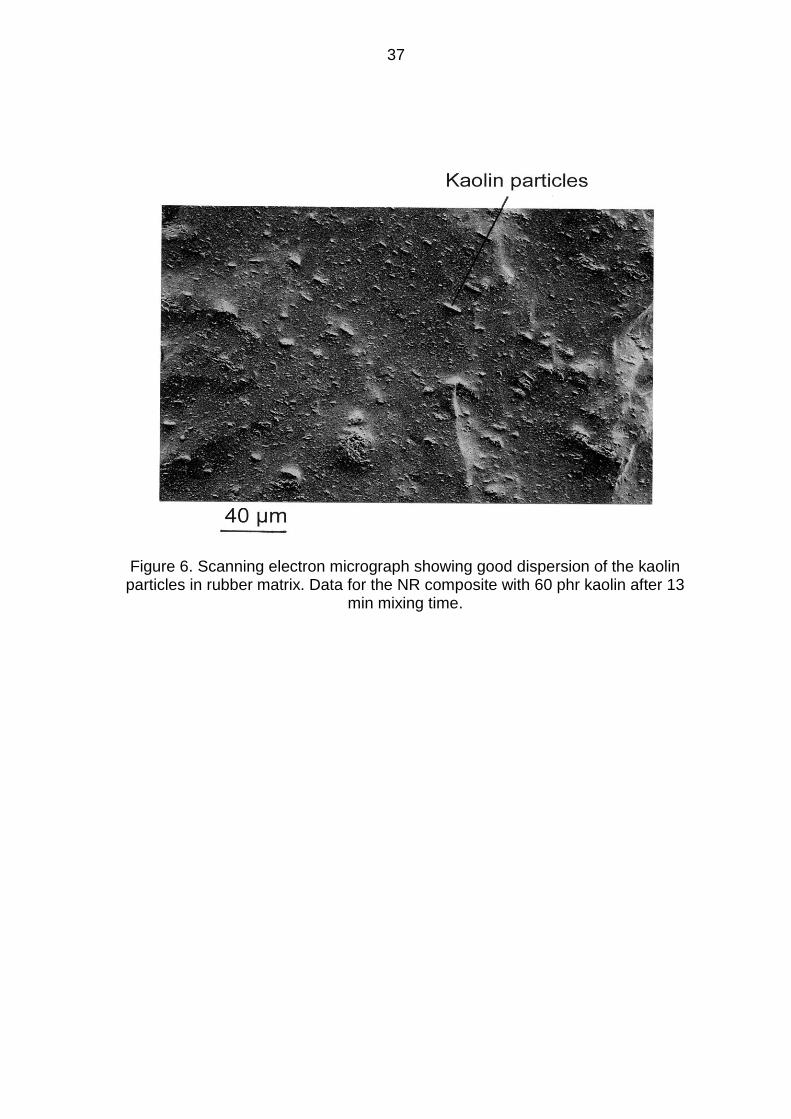
To select a suitable mixing time for incorporating the kaolin in the rubbers, the
mixing time was increased to 24 min to disperse the kaolin particles fully in the
rubber. Twenty-four hours after the mixing ended, the rubbers were examined in a
scanning electron microscope (SEM) to assess the filler dispersion. Dispersion of the
kaolin particles in the rubber was assessed by a Cambridge Instruments Stereoscan
360 Tungsten filament scanning electron microscope. Small pieces of the uncured
rubber were placed in liquid nitrogen for 3 min and then fractured to create two fresh
surfaces. The samples, 9 mm2 in area and 7 mm thick, were coated with gold and
then examined and photographed in the SEM. The degree of dispersion of the kaolin
particles in the rubber was then studied from SEM micrographs. After the
micrographs were examined, a total mixing time of 13 min was found to be sufficient
to fully disperse the kaolin particles in the rubbers (Figure 6). This mixing time was
then used to make rubber compounds for this study.
Results and discussion
New optimum sulfur cure systems for the rubbers
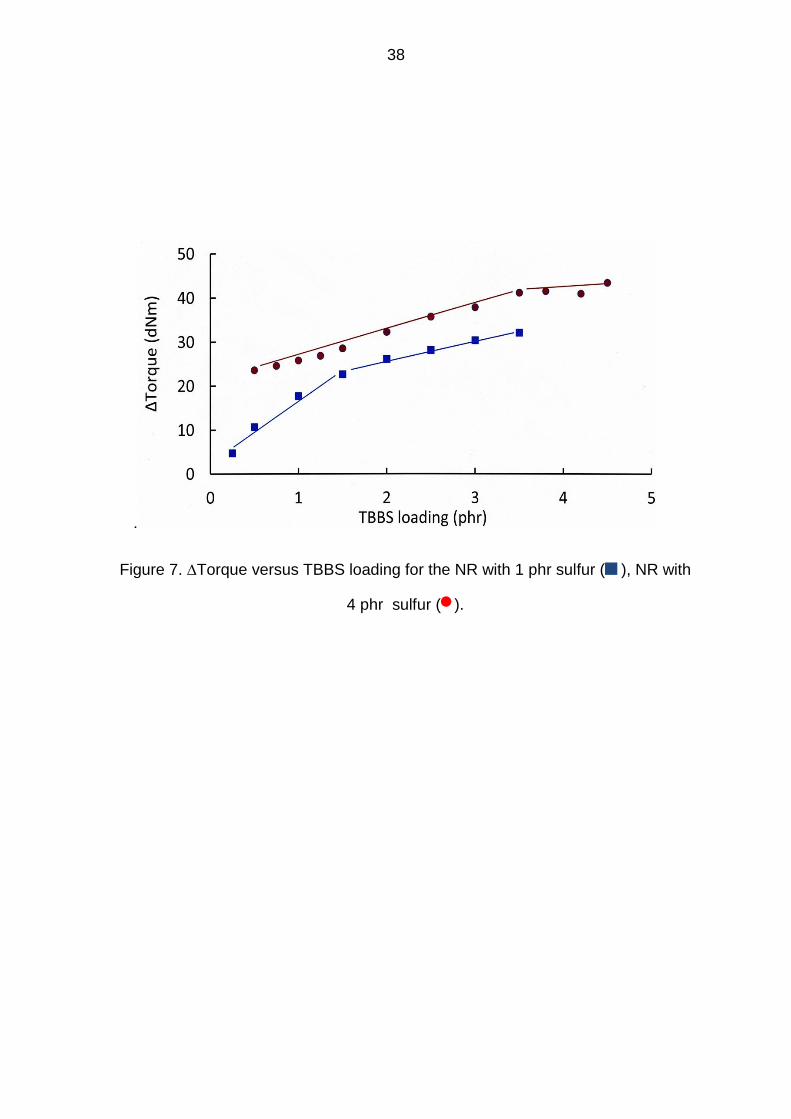
Figure 7 shows torque as a function of TBBS loading for the NR rubbers with 1 and
4 phr sulfur. For the rubber with 1 phr sulfur, torque increased from 5 to 23 dNm as
the loading of TBBS was raised to 1.5 phr, and it continued rising at a much slower
rate to about 32 dNm when the loading of TBBS reached 3.5 phr. The addition of 1.5
phr TBBS was sufficient to react the sulfur with the rubber to form crosslinks. For the
rubber with 4 phr sulfur, torque increased from 24 to 41 dNm as the loading of
TBBS was increased from 0.5 to 3.5 phr. Subsequently, torque rose to 43 dNm
when an additional 1 phr TBBS was incorporated in the rubber. Clearly, 3.5 phr
TBBS was sufficient to react the sulfur with the rubber.
12
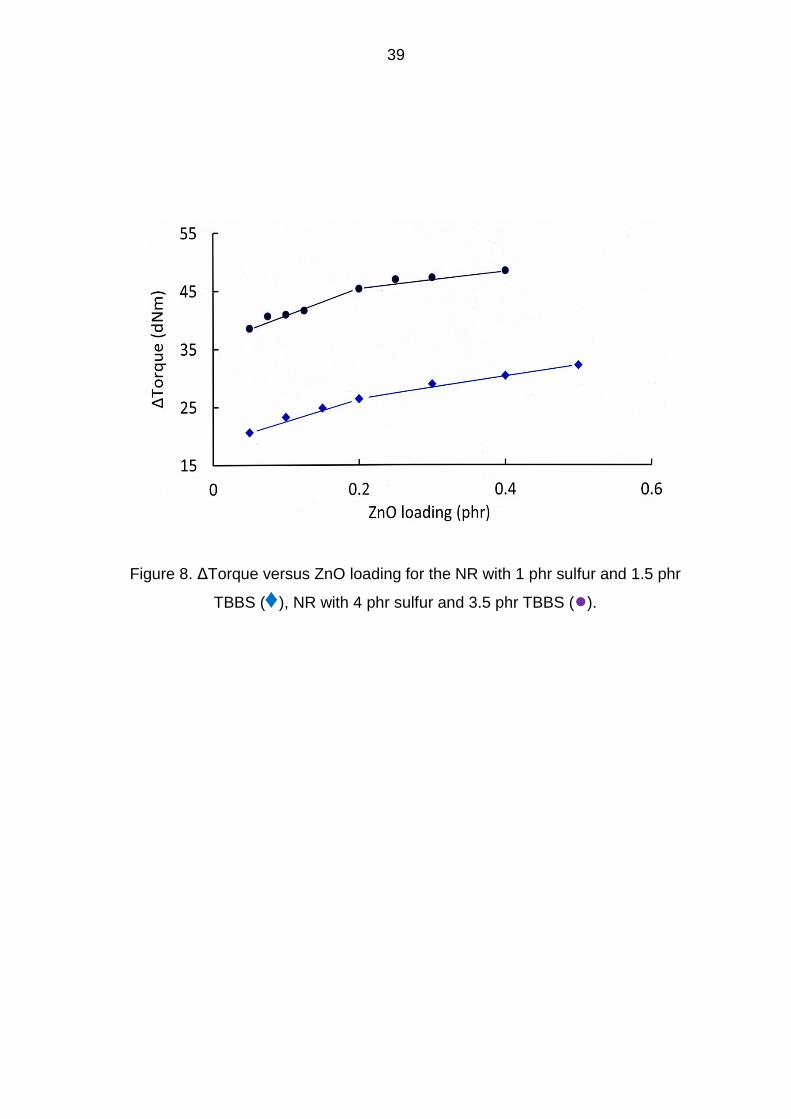
To enhance the efficiency of cure in the NR with sulfur and TBBS, ZnO was
added (Figure 8). The addition of 0.2 phr ZnO to the rubber with 1 phr sulfur and 1.5
phr TBBS was enough to improve the efficiency of TBBS as indicated by increase in
torque from 21 to 26 dNm. However, when the loading of ZnO was raised to 0.5 phr,
Δtorque rose at a much slower rate to about 33 dNm. Similarly, Δtorque for the
rubber with 4 phr sulfur and 3.5 phr TBBS reached optimum value at 0.2 phr ZnO
and thereafter the rise was marginal. Note that a small amount of ZnO, i.e. as low as
0.2 phr, when added as primary activator, improved the performance of TBBS to
such a degree during curing as shown by increase in torque.
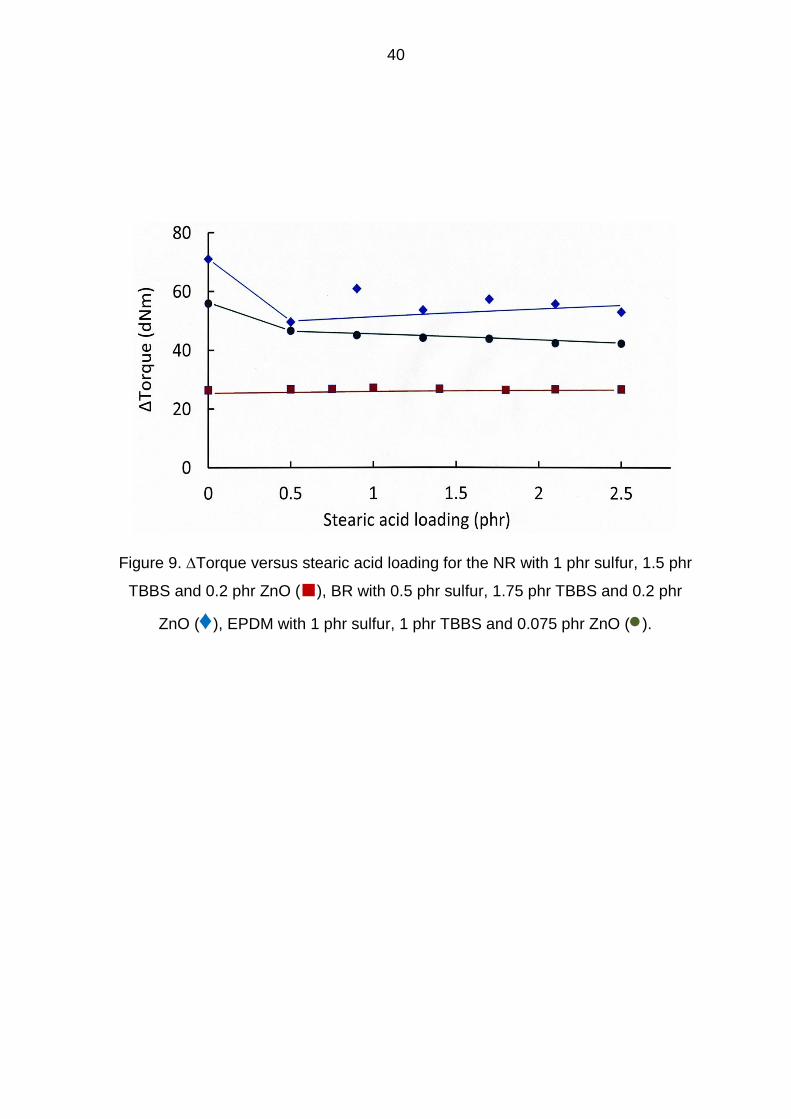
Stearic acid is a fatty acid that is added as co-activator with ZnO in sulfur
vulcanization. It also acts as plasticiser and internal lubricant between polymer
chains, and aids dispersion of solid ingredients in the rubber. Zinc stearate is formed
when stearic acid reacts with ZnO and is an essential cure activator.46 The loading of
stearic acid in the NR with 1phr sulfur, 1.5 phr TBBS and 0.2 phr ZnO was raised
from 0 to 2.5 phr to increase the dispersion and solubility of ZnO and enhance
efficiency of the curing reaction in the rubber. Figure 9 shows torque versus stearic
acid loading. The inclusion of stearic acid in the cure system had no benefit for
torque at all, which stayed constant at about 27 dNm. It is abundantly clear that
ZnO is a very effective primary activator in improving the performance of TBBS in the
absence of secondary activators such as stearic acid.
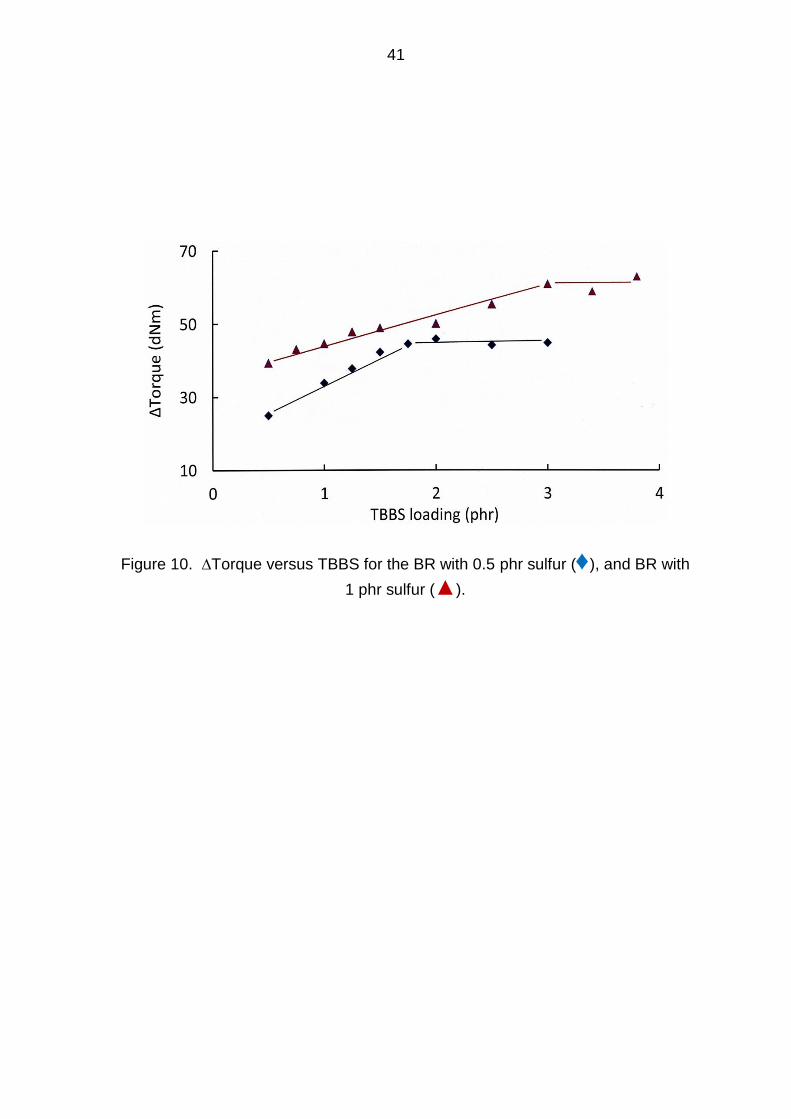
Figure 10 shows torque as a function of TBBS loading for the BR rubbers with
0.5 and 1 phr sulfur. For the rubber with 0.5 phr sulfur, torque increased from 25 to
45 dNm as the loading of TBBS was raised to 1.75 phr, and then it stopped rising
once the loading of TBBS reached 3 phr. The addition of 1.75 phr TBBS was
sufficient to react the sulfur with the rubber to form crosslinks. For the rubber with 1
13
phr sulfur, torque increased from 39 to 61 dNm as the loading of TBBS was raised
from 0.5 to 3 phr. Subsequently, torque remained essentially unchanged when an
additional 0.8 phr TBBS was incorporated in the rubber. Clearly, 3 phr TBBS was
sufficient to react the sulfur with the rubber.
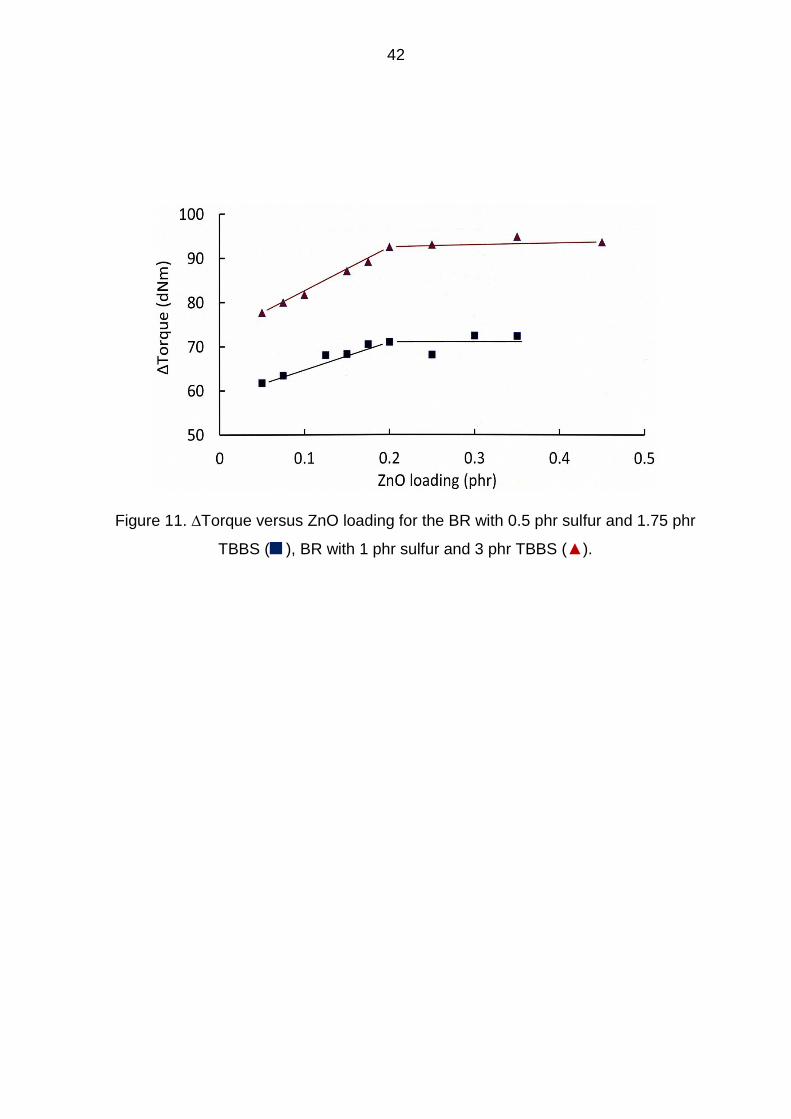
Zinc oxide was then added to enhance the efficiency of cure in the BR with sulfur
and TBBS. For the rubber with 0.5 phr sulfur and 1.75 phr TBBS, the addition of 0.2
phr ZnO was enough to make TBBS more effective as indicated by increase in
torque from 62 to 71 dNm. But when the loading of ZnO was raised to 0.35 phr,
Δtorque showed no increase and remained at about 72 dNm (Figure 11). ΔTorque
for the rubber with 1 phr sulfur and 3 phr TBBS reached optimum value, i.e. 92 dNm,
at 0.2 phr ZnO, and afterwards it rose marginally to about 94 dNm when an extra
0.25 phr ZnO was added. Notably, when 0.5 phr stearic acid was added to the BR
with 0.5 phr sulfur, 1.75 phr TBBS and 0.2 phr ZnO, Δtorque first decreased sharply
from 71 to 50 dNm and then remained almost steady until the loading of stearic acid
reached 2.5 phr. Evidently, small amounts of stearic acid, i.e. up to 0.5 phr, were
detrimental to the crosslink density of the rubber as indicated by drop in Δtorque
(Figure 9).
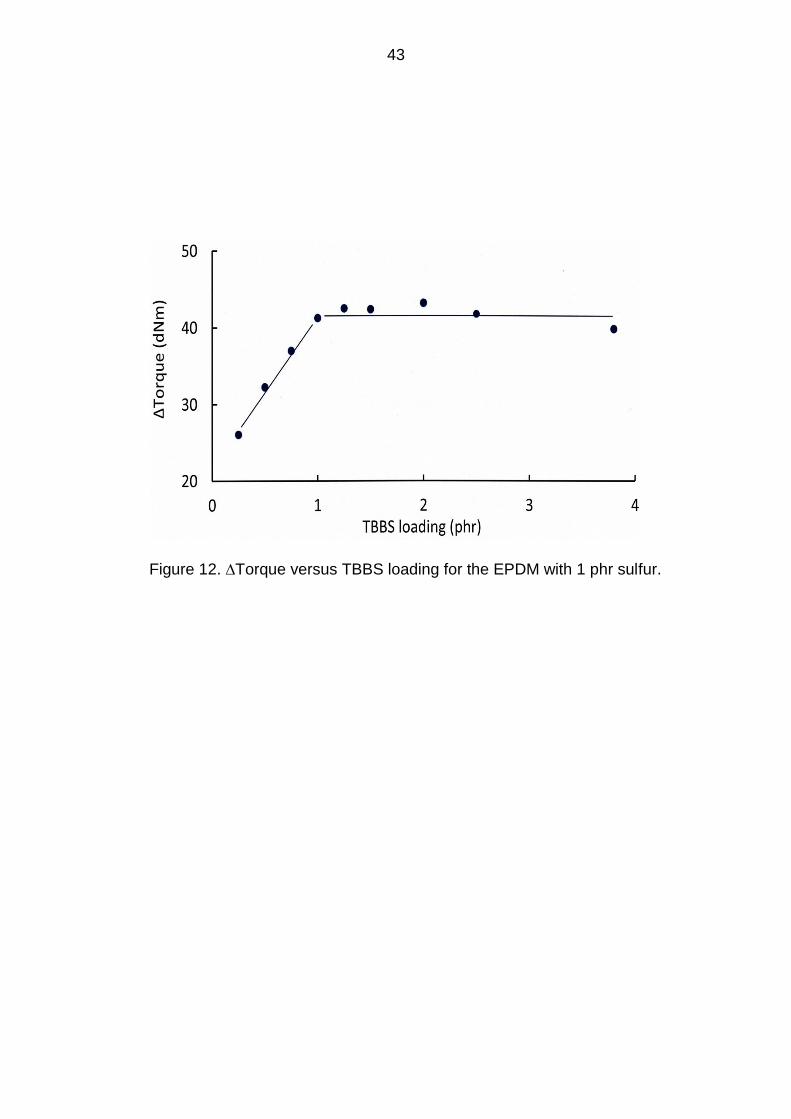
Figure 12 demonstrates Δtorque versus TBBS loading for the EPDM with 1 phr
sulfur. ΔTorque increased steeply from 26 to 42 dNm as the loading of TBBS was
boosted from 0.25 to 1 phr. Subsequently, there was no improvement in Δtorque
once the amount of TBBS reached 3.8 phr. Apparently, 1 phr TBBS was enough to
react the sulfur with the rubber. Zinc oxide was later added to improve the efficiency
of TBBS. ΔTorque rose noticeably from 41 dNm at 0 phr ZnO to 56 dNm at 0.075 phr
ZnO and the rate of increase slowed down significantly thereafter. Δtorque then
reached to about 67 dNm when the loading of ZnO was raised by an additional 0.325
14
phr (Figure 13). It is remarkable that a small amount of ZnO, i.e. as low as 0.075 phr,
had such a major influence on the performance of TBBS in the cure system as
indicated by a significant rise in Δtorque. When 0.5 phr stearic acid was mixed with
the EPDM with 1 phr sulfur, 1 phr TBBS and 0.075 phr ZnO, torque decreased from
56 to 47 dNm and subsequently continued decreasing slowly to about 42 dNm when
the amount of stearic acid was raised to 2.5 phr (Figure 9). The crosslink density as
shown by Δtorque did not benefit from the addition of stearic acid to the rubber and
consequently it can be eliminated from the cure system completely. In the absence
of stearic acid, no zinc stearate was formed in the rubber. Hence, zinc stearate is not
an essential ingredient in the curing of rubber as has been claimed.46
After these measurements were completed, three cure systems were selected
for further work. For NR, the cure system consisted of 4 phr sulfur, 3.5 phr TBBS,
and 0.2 phr ZnO; for BR, 0.5 phr sulfur, 1.75 phr TBBS and 0.2 phr ZnO; for EPDM,
1 phr sulfur, 1 phr TBBS and 0.075 phr ZnO. To protect the rubbers against
environmental ageing, 1 phr antidegradant (6PPD) was also added. Note that there
were only three chemicals in the cure systems, i.e. sulfur, TBBS and ZnO, which
added up to 7.7 phr in the NR compounds, 2.45 phr in the BR compounds and 2.075
phr in the EPDM compound. This is a significant reduction both in the number and
amount of the chemicals in the cure system. In addition to the chemical curatives,
the NR compounds had 60 and 140 phr kaolin and the BR and EPDM compounds
60 phr kaolin (compounds 1-7, Table 1). These compounds were mixed as described
already and their viscosity and cure properties measured. They were then cured at
160oC and their hardness, tensile properties and tear energy determined.
Effect of kaolin on the viscosity and cure properties of the rubber compounds

15
The inclusion of kaolin affected the viscosity and cure properties of the rubbers not in
the same way. The viscosity of NR increased from 44 to 85 MU when 140 phr kaolin
was added (Figure 14). A similar trend was also observed for BR and EPDM where
the viscosity rose from 42 to 66 MU and from 70 to 89 MU, respectively after 60 phr
kaolin was mixed (Table 1). This was expected, since the inclusion of solid particles
in raw rubber raises the rubber viscosity.47
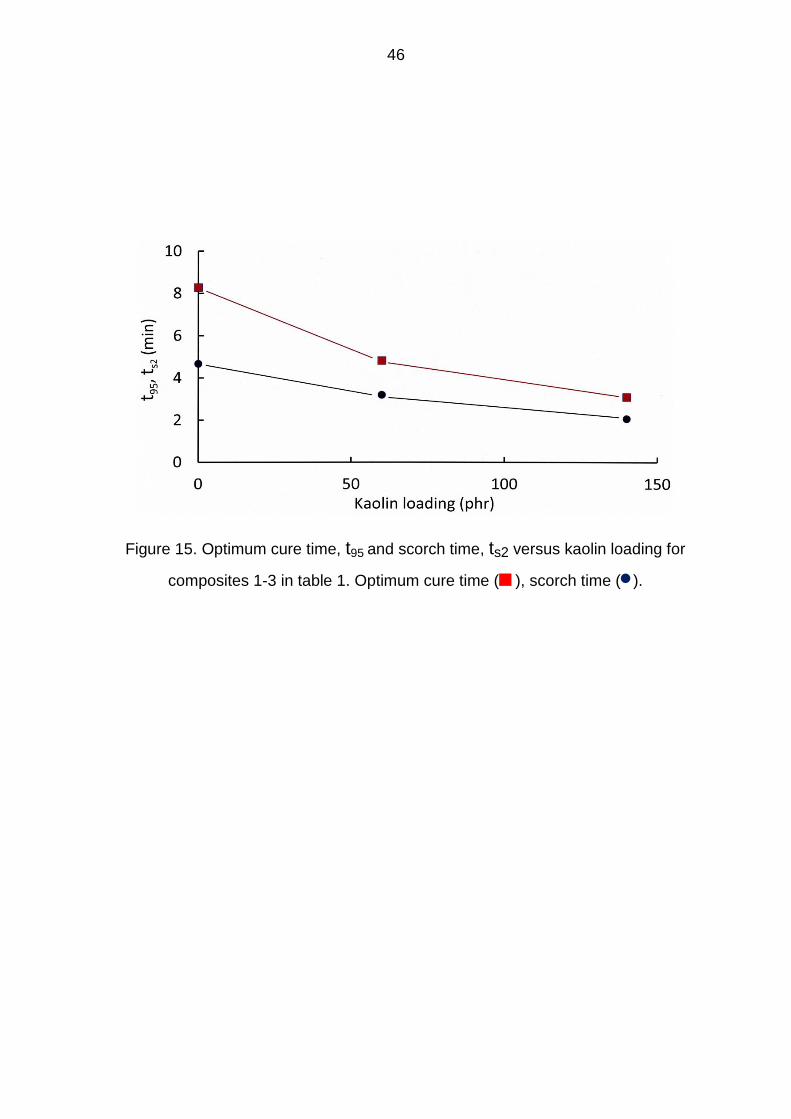
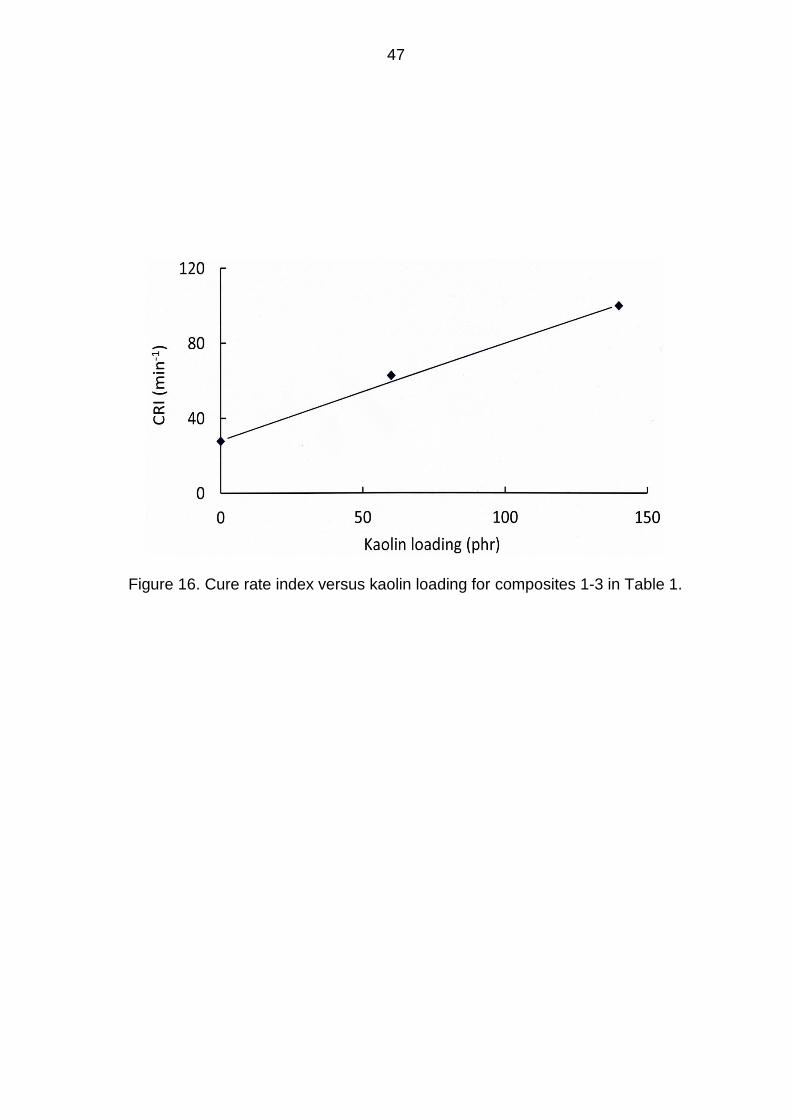
The ts2 and t95 of NR shortened from 4.7 to 2.1 min and 8.3 to 3.1 min,
respectively with 140 phr kaolin (Figure 15). The rate of cure as indicated by CRI
benefitted greatly from kaolin and increased from 27.8 at 0 phr kaolin to 100 min-1 at
140 phr kaolin loading (Figure 16). Probably, this was the highest cure rate ever
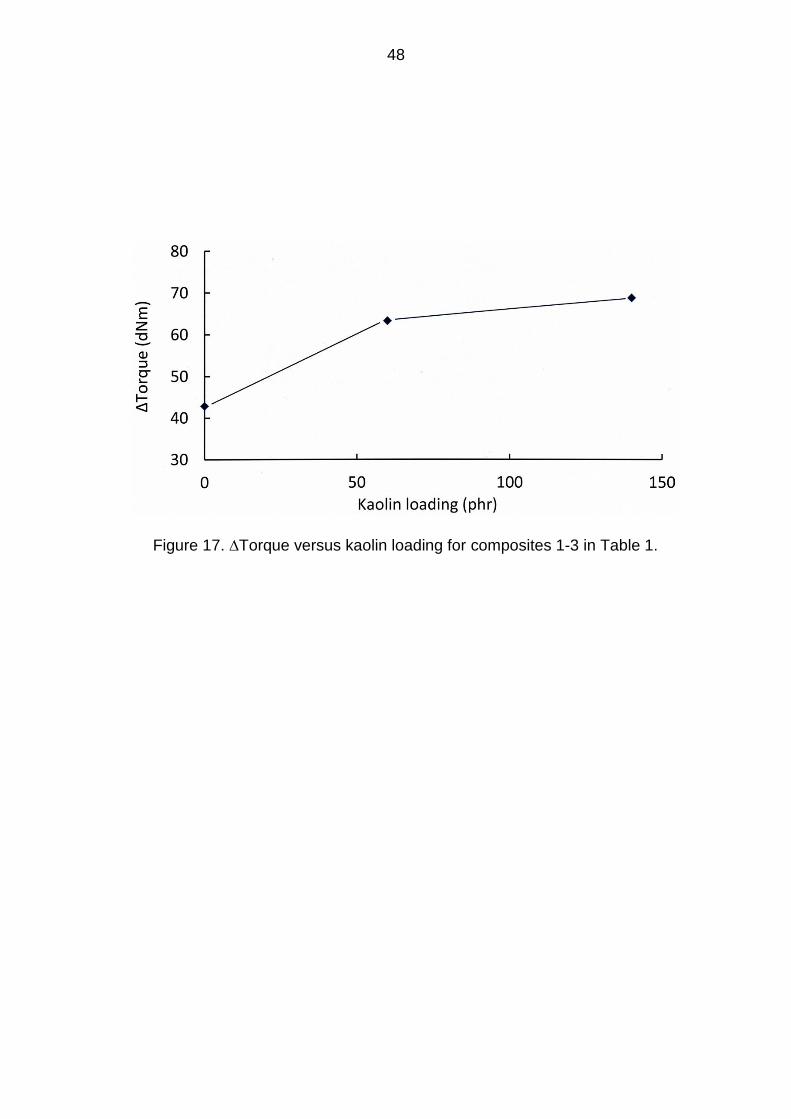
reported for a sulfur-cured NR-based compound. As mentioned earlier, torque is an
indication of crosslink density changes in the rubber. torque for NR increased from
43 to 69 dNm as the loading of kaolin was raised from 0 phr to 140 phr , which
indicated a large rise in the crosslink density of the rubber (Figure 17).
For BR, the addition of kaolin shortened the ts2 and t95 from 11.3 to 3.5 min and
47.5 to 12.5 min, respectively. The rate of cure also improved from 2.8 to 11.1 min-1.
Though, kaolin had a detrimental effect on the crosslink density of the rubber
because torque decreased from 72 to 56 dNm (Table 1).
For EPDM, the ts2 decreased from 6.2 to 2.6 min but surprisingly, the t95
increased from 21.5 to 40 min when 60 phr kaolin was added. Compound 7 had a
marching cure and the torque kept increasing as a function of time. To calculate an
optimum cure time for this compound, an arbitrary maximum torque value was
considered. Hence, there was some uncertainty regarding the exact optimum cure
time of this compound. But, it was evident that kaolin retarded the cure, causing it to
16
march indefinitely. It is worth mentioning that the remaining compounds in Table 1
had equilibrium cure (Figure 1). The rate of cure declined as shown by a large fall in
CRI from 6.5 to 2.7 min-1. The rubber lost some crosslinks as demonstrated by
reduction in torque from 55 to 44.5 dNm (Table 1). This revealed the damaging
effect of kaolin on the crosslink density of both BR and EPDM.
Effect of kaolin on the hardness and mechanical properties of the rubber composites Table 2 summarizes the hardness and mechanical properties of the rubber
composites. These properties benefitted to a great extent from the addition and
progressive increases in the loading of kaolin. For NR, the hardness increased by 64%
when 60 phr kaolin was added and the trend continued rising by another 28% when
the loading of kaolin reached 140 phr. Similarly, the Young’s modulus rose by 170%
with 60 phr kaolin and then by an extra 148% when the full amount of kaolin, i.e. 140
phr, was reached. This was expected, since when soft rubber is replaced with solid
filler, the rubber becomes harder, causing the Young’s modulus to increase. The
tensile strength and tear energy were unchanged and the elongation at break and
stored energy density at break deteriorated by a total of 65% and 34%, respectively
when 140 phr kaolin was mixed with the rubber. Notably, the compression set of the
rubber was adversely affected by the addition of kaolin. For the unfilled rubber, the
set was 41%, and it then rose to 64% and 71%, when 60 and 140 phr kaolin was
added, respectively.
Kaolin was very beneficial to the properties of BR and EPDM. For BR, the
hardness increased by 23% and for EPDM, by 34%, respectively when 60 phr kaolin
was incorporated in the rubbers. For BR, the tensile strength, elongation at break
and Young’s modulus rose by 759%, 256% and 114%, respectively. The
17
compression set of the unfilled rubber was 9.4%, and subsequently rose to 26%
when 60 phr kaolin was mixed with the rubber.
The effect of kaolin on the properties of EPDM was even more impressive. For
this rubber, the tensile strength, elongation at break and Young’s modulus improved
by 964%, 332% and 71%, respectively. The properties related to fracture were also
enhanced very substantially. For BR, the stored energy density at break and tear
energy were increased by 2442% and 536%, respectively and for EPDM, by 3133%
and 1479%, respectively. The compression set of the unfilled rubber was 39%, and
afterward increased to 48% with 60 phr kaolin. Hence kaolin was detrimental to the
compression set resistance of these rubbers.
Evidently, kaolin is extending or non-reinforcing filler for the strain-induced
crystallizing NR, and highly reinforcing for the non-crystallizing BR and EPDM. Since
kaolin has a platelet structure (Figure 5), it may be assumed that the mechanism by
which rubber is reinforced may be different to that by spherical particles such as CB
and silica. The results suggest that strain-induced crystallizing NR benefits less from
kaolin than the non-crystallizing BR and EPDM do. In a study48, some rubber
composites were obtained by mixing NR, BR, and EPDM with up to 60 phr kaolin.
The cure system consisted of 3 phr primary and secondary accelerators and 4 phr
primary and secondary activators, adding up to 7 phr, as well as 2.5 phr sulfur. The
kaolin-filled rubber composites had outstanding mechanical and thermal properties.
For the NR composite, the highest hardness (38 Shore A), tensile strength (10.10
MPa) and elongation at break (296%) were recorded at 40 phr loading of kaolin. For
the BR composite, the highest hardness (58 Shore A), tensile strength (7.75 MPa)
and elongation at break (53%) were measured at 50 phr loading of kaolin. Finally, for
the EPDM composite, the highest hardness (58 Shore A), tensile strength (9.26 MPa)
18
and elongation at break (208%) were determined at 50 phr kaolin, respectively. Our
results compared well with the reported ones above. For instance, the filled EPDM
composite had a hardness of 55 Shore A, tensile strength of 14.9 MPa and an
elongation at break of 1512%, significantly better than those reported for the EPDM
above, in spite of the cure system having one accelerator and one activator, adding
up to 2.075 phr (Table 1). All the indications are that kaolin reinforces rubber
effectively, and reduction in the use of the chemical curatives in the vulcanization
process does not affect the mechanical properties of the rubbers adversely.
There are various factors which affect reinforcement of rubbers by solid fillers.
They are filler-rubber interaction49,50, filler-filler interaction51, and formation of
crosslinks in rubber.4,40 Increasing mixing time is an effective way to disperse solid
fillers in rubber compounds.52 As Figure 6 shows, the kaolin particles dispersed well
in the rubber matrix. The reinforcing effect of kaolin on the mechanical properties
was optimized through good dispersion53 and consequently the filler-filler interaction
was minimal. The rubber breaks down during mixing, which causes reduction in
molecular weight and viscosity. This is often compensated by the reinforcing effect of
the filler. The reduction in molecular weight is attributed to the mechanical rupture of
the primary carbon-carbon bonds that are present along the backbone of the rubber
chains.54 For example, for unfilled NR, a mixing time of 11 min reduced the
molecular weight by roughly 25%55 and its viscosity by 13%.56 As the results in Table
2 show, in spite of a long mixing, i.e. 13 min, the mechanical properties of the BR
and EPDM composites improved significantly when kaolin was added. This showed
the reinforcing capabilities of kaolin.
Solid fillers reinforce rubber properties because of their large surface area. There
were at least two contributions made to the rubber-kaolin interaction. Kaolin had a
19
surface area of 25 m2/g and this provided area for bound rubber to form. The
formation of bound rubber increases with factors such as temperature, time, surface
activity and surface area of the filler.5 A mixing temperature of 58-62oC and a mixing
time of 13 min provided a favourable condition for bound rubber to form in the
composites. In addition, the silanization of the kaolin surface with MPTS, helped to
improve the filler dispersion and increased the available surface area for rubber to
interact with the filler to form bound rubber. Viscosity increases as a function of
bound rubber, and bound rubber improves as a function of filler surface area and
filler loading.57 The results in Table 1show large increases in the viscosity for the
kaolin-filled rubbers, signifying bound rubber formation in the composites. Effect of
bound rubber on the filler-rubber interaction has been studied extensively and all the
results suggest major enhancement of this property when bound rubber forms.5
In a study, modified kaolin was introduced into NR and cured at 140oC for 10 min
to produce some composites.35 The interspacing between the kaolin layers
measured by XRD was from 7 to 14 Ao. The presence of the modified kaolin resulted
in increase in the torque value caused by the formation of a higher number of
crosslinks, which was attributed to the confinement of the rubber chains within the
silicate galleries and hence to better interaction between the filler and the rubber.
The XRD indicated a gallery spacing of about 7 Ao for the kaolin used in this study.
Since the size of a carbon atom along the backbone of hydrocarbon rubber is about
3 Ao,58 it is likely that some segments of the rubber chains entered into the kaolin
galleries during mixing, causing strong interaction between the two. This in turn,
could have enhanced the kaolin-rubber interaction and improved the properties of
the BR and EPDM composites (Table 2). It seems that confinement of the rubber
chains within a layered structure is a major factor in the ability of mineral fillers such
20
as kaolin to reinforce the rubber properties. Apparently, this was not so for the NR
composite.
The NR viscosity increased by approximately 64% when the loading of kaolin
was raised from 60 to 140 phr (Table 1). When the viscosity rose, higher shear
forces were produced in the rubber, resulting in a more efficient break down of the
filler aggregates, better dispersion of the filler particles and more surface area for the
rubber chains to interact with (Figure 6). Consequently, more bound rubber was
formed in the kaolin-filled composites. Furthermore for NR, the peaks on the XRD
patterns of the kaolin-filled composites were the same as the ones appearing on the
XRD pattern of the kaolin particles but getting larger as more kaolin was added (cf.
Figure 3 with Figure 4). It was concluded that there was no evidence of
crystallization in the rubber. Small amounts of suitable impurities accelerate the
crystallization process markedly in NR in the absence of strain, presumably by
promoting crystal nucleation.59 Clearly, this was not the case with kaolin.
As mentioned earlier, Δtorque is an indication of crosslink density changes in
rubber. The Δtorque of the NR composites increased from 43 to 69 dNm when the
loading of kaolin was raised from 0 to 140 phr, respectively (Table 1). This indicated
a significant rise in the crosslink density of the composite. For the BR and EPDM
composites, torque decreased by approximately 22% and 19%, respectively when
60 phr kaolin was added (Table 1).
The compression set of the composites increased when kaolin was incorporated
in the rubber (Table 2). In the swelling tests, the unfilled NR composite solvent intake
was 489%, and decreased to 347% and 335% for the composites with 60 and 140
phr kaolin, respectively. The decrease in solvent intake correlated well with the
increase in torque (Table 1), since higher crosslink density inhibits chain mobility
21
and reduces swelling.46 But the compression set increased by 73% when the kaolin
loading was raised to 140 phr. This trend did not match that of the torque (Table 2)
because higher crosslink density should have reduced the set. The reason for this
discrepancy is not immediately clear but it is likely that the NR composites had more
physical links and less chemical crosslinks, which affected both the extent of swelling
and Δtorque.
For the unfilled and filled BR and unfilled and filled EPDM composites, the
solvent intake was 360% and 428%, and 263% and 323%, respectively. The higher
solvent intake indicated lesser crosslink density or lower torque than the unfilled
counterparts. This meant higher compression set for the filled composites. As shown
in Table 2, the filled BR and EPDM composites did have lower torques, which
implied lesser crosslink density and higher compression set. It appeared that kaolin
was detrimental to the crosslink density of these composites. It is expected that
swelling of the BR and EPDM composites was affected mostly by the chemical
crosslinks and less by the physical ones. Therefore, chemical and physical
crosslinks influenced the torque and solvent intake in these composites though the
exact contribution to the crosslink density remains to be determined.
Glass transition temperature is governed by the extent of chain mobility within
the rubber network. When chain mobility is inhibited, e.g. by the presence of
chemical and/or physical crosslinks between the rubber chains and strong rubber-
filler interaction, Tg rises.60 The Tg of the unfilled NR composite was -41oC and rose
to about -42 and -43oC when the filler loading was 60 phr and 140 phr, respectively
(Table 2). The Tg for the unfilled and filled BR composites and unfilled and filled
EPDM composites were -100oC and -97oC, and -42oC and -40oC, respectively. The
kaolin filler raised the Tg of the composites by up to three degrees centigrade.
22
Conclusions
From this study, the following main conclusions can be drawn.
1. A new method measured the exact optimum amount of TBBS accelerator and
ZnO activator at a given loading of sulfur in the composites of NR, BR and EPDM
and eliminated stearic acid from the cure system entirely. The requirement for ZnO
was 0.075-0.2 phr. interestingly, in spite of using less chemical curatives in sulfur
vulcanization, the rubber composites were fully cured with outstanding properties.
2. Kaolin was extending or non-reinforcing filler for the strain-induced crystallizing
NR and highly reinforcing for the non-crystallizing BR and EPDM.
It is predictable that reduction in the use of ZnO and stearic acid will improve
health and safety at work-place, reduce cost, and minimise damage to the
environment. The use of MPTS pre-tread kaolin in conjunction with the new method
for measuring the exact amount of the curatives in sulfur vulcanization provides an
effective means for designing green composites for industrial applications. The
indications are that MPTS pre-treated kaolin is an ideal replacement for carbon black
and silica/silane systems in rubber reinforcement, at least for non-crystallizing BR
and EPDM rubbers.
Acknowledgment
We thank Mr Keith Grandstaff of Imerys Ceramics for providing the kaolin powder.
We also than Dr Zhaoxia Zhou of LMCC for performing the TEM work.
Declaration of conflicting interests
The authors declared no potential conflict of interest with respect to the research,
authorship, and/or publication of this article.
Funding

23
The authors received no financial support for the research, authorship, and /or
publication of this article.
24
References
1. Dunnom DD. Use of reinforcing silicas. Rubber Age 1968; 100: 49-57.
2. Dannenberg EM. Carbon black dispersion and reinforcement. Rubber
ChemTechnol 1982; 25: 843-857.
3. Bristow GM and Tiller RF. Correlation of structure and properties of natural
rubber vulcanizates. Kautsch Gummi Kunstst 1970; 23: 55-9.
4. Nasir M and Teh GK. The effects of various types of crosslinks on the physical
properties of natural rubber. Eur Polym J 1988; 24: 733-736.
5. Wolff S, Wang MJ and Tan EH. Filler-elastomer interactions. Part VII. Study on
bound rubber. Rubber Chem Technol 1993; 66: 163-177.
6. Dannenberg EM. The effects of surface chemical interactions on the properties of
filler-reinforced rubbers. Rubber Chem Technol 1975; 48: 410-443.
7. Andrews EH. Reinforcing of rubber by fillers. Rubber Chem Technol 1963; 36:
325-336.
8. Saeed F, Ansarifar A, Ellis RJ, et al. Two advanced styrene-butadiene/
polybutadiene rubber blends filled with a silanized silica nanofiller for potential use in
passenger car tire tread compound. J Apply Polym Sci 2012; 123: 1518-1529.
9. Hair ML, Hertl W. Acidity of surface hydroxyl groups. J Phys Chem 1970; 74: 91-
94.
10. Hockey JA, Pethica BA. Surface hydration of silicas. Trans Faraday Soc 1961;
57: 2247-2262.
11. Wolff S, GÖrl U, Wang MJ, Wolff W. Silane modified silicas-silica-based tread
compounds. Eur Rubber J 1994; 16: 16-19.
12. Wolff S. Chemical aspects of rubber reinforcement by fillers. Rubber Chem
Technol 1996; 69: 325-346.
25
13. Li P, Wang L, Song G, et al. Characterization of high-performance exfoliated
natural rubber/organoclay nanocomposites. J Appl Poly Sci 2008; 109: 3831-3838.
14. Teh, PL, Mohd Ishak ZA, Hashim AS, et al. Physical properties of natural
rubber/organoclay nanocomposites compatibilized with epoxidized natural rubber.
J Apply Polym Sci 2006; 100: 1083-1092.
15. Thostenson ET, Li C and Chou TW. Nanocomposites in context. Comp Sci
Technol 2005; 65: 491-516.
16. Varghese S, Karger-Kocsis J and Gatos KG. Melt compounded epoxidized
natural rubber/layered silicate nanocomposites: structure-properties relationships
Polymer 2003; 44: 3977-3983.
17. Rattanasom N, Prasertsri S and Ruangritnumchai T. Comparison of the
mechanical properties at similar hardness level of natural rubber filled with various
reinforcing-fillers. Polymer Test 2009; 28: 8-12.
18. Jia D, Liu L, Wang X et al. Advances in natural rubber/montmorillonite
nanocommposites,” in Biodegradabale polymer blends and composites from
renewable resources. NJ: John Wiley & Son, Inc., Hoboken, 2008.
19. Chua TP, Mariatti M, Azizan A et al. Effects of surface-functionalized multi-walled
carbon nanotubes on the properties of poly(dimethyl siloxane) nanocomposites.
Comp Sci Technol 2010; 70: 671-677.
20. Verdejo R, Saiz-Arroyo C, Carretero-Gonzalez J et al. Physical properties of
silicone foams filled with carbon nanotubes and functionalized graphene sheets.
Eur Polym J 2008; 44: 2790-2797.
21. Bokobza L. Multiwall carbon nanotube elastomeric composites. A review.
Polymer 2007; 48:4907-4920.
26
22. Zhan Y, Wu JK, Xia HS, et al. Dispersion and Exfoliation of Graphene in
Rubber by an Ultrasonically-Assisted Latex Mixing and In situ Reduction Process.
Macromol Mater Eng 2011; 296: 590-602.
23. Lewicki JP, Liggat JJ and Patel M. The thermal degradation behaviour of
polydimethylsiloxane/montmorillonite nanocomposites. Polym Degrad Stab 2009;
94: 1548-1557.
24. Sengupta R, Chakraborty S, Bandyopadhyay S, et al. A short review on
rubber/clay nanocomposites with emphasis on mechanical properties. Polym Eng
Sci 2007; 47: 1956-1974.
25. Kim JK, Pal K and Sridhar V. Recent advances in elastomeric nancomposites:
Advanced structured materials, Verlag, Berlin, Heidelberg, 2011, 5.
26. Bokobza L. The Reinforcement of Elastomeric Networks by Fillers. Macromol
Mater Eng 2004; 289: 607-621.
27. Das A, Stockelhuber KW, Jurk R et al. Routes to Rubber Nanocomposites.
Macromol Symp 2010; 291-292: 95-105.
28. Stephen R and Thomas S. Rubber nanocomposites: Preparation, properties and
applications, Wiley, New Jersey 2010 Chapter 1.
29. Paul DR and Robeson LM. Polymer nanotechnology: Nanocomposites.
Polymer 2008; 49: 3187-3204.
30. Ahmadi SJ, Huang Y and Li W. Fabrication and physical properties of EPDM-
organoclay nanocomposites. Comp Sci Technol 2005; 65: 1069-1076.
31. Labruyère C, Gorrasi G, Monteverde F, et al. Transport properties of organic
vapours in silicone/clay nanocomposites. Polymer 2009; 50: 3626-3637.
32. Horsch S, Serhatkulu G, Gulari E et al. Supercritical CO2 dispersion of nano-
clays and clay/polymer nanocomposites. Polymer 2006; 47: 7485-7496.
27
33. Zoromba Sh M, Belal AAM, Ali AEM et al. Preparation and characterisation of
some NR and SBR formulations containing different modified kaolinite. Polym-Plast
Technol Eng 2007; 46:529-535.
34. Sukumar R and Menon ARR. Organomodified kaolin as a reinforcing filler for
natural rubber. J Apply Polym Sci 2008; 107:3476-3483.
35. Yahaya LE, Adebowale KO and Olu-Owolabi BI. Cure characteristics and
rheological properties of modified kaolin-natural rubber composites. Am Chem Sci J
2014; 4: 472-480.
36. Ciullo PA and Hewitt N. The Rubber Formulary, Noyes Publications, New York,
1999, 91.
37. Ostad-Movahed S, Ansar Yasin K, Ansarifar A, et al. Comparing effects of
silanized silica nanofiller on the crosslinking and mechanical properties of natural
rubber and synthetic polyisoprene. J Appl. Poly. Sci 2008; 109:869-881.
38. Wang MJ. Effect of polymer-filler and filler-filler interaction on dynamic properties of filled vulcanizates. Rubber Chem. Technol 1998; 71: 520-589. 39. http://www.westliberty.edu/health-and-safety/files/2012/08/Stearic-Acid.pdf
40. Brown PS, Porter M and Thomas AG. The dependence of strength properties on
crosslinked structure in vulcanized polyisoprenes. Kautsch Gummi Kunstst 1987;
40: 17-19.
41. Hallett J and Moninot G. The 7th International Conference on Rubber Chemicals,
Compounding and Mixing, Vienna Austria December 2010.
42. Ciullo PA and Hewitt N. The rubber formulary. Noyes publications, NY, 1999.
P79.
43. Ciullo PA and Hewitt N. The rubber formulary. Noyes publications, NY, 1999.
P147.
28
44. Ciullo PA and Hewitt N. The rubber formulary. Noyes publications, NY, 1999.
P275.
45. Movahed SO, Ansarifar A and Mirzaie F. Effect of various efficient vulcanization
cure systems on the compression set of a nitrile rubber filled with different fillers. J.
Appl. Poly. Sci. 2015; 132:1-10.
46. Datta RN. Rubber curing systems. Rapra review reports, Report 144 2002;
12:1-37.
47. Ansarifar A and Saeed F. Developing ethylene-propylene-dien rubber
compounds for industrial applications using a sulfur-bearing silanized silica nanofiller.
Polym Compos 2013; 34: 2019-2025.
48. Wu W and Tian L. Formulation and morphology of kaolin-filled rubber
composites. Appl Clay Sci 2013; 80-81: 93-97.
49. Leblanc JL. Elastomer–filler interactions and the rheology of filled rubber
compounds. J Appl Polym Sci 2000; 78: 1541-1550.
50. Wang MJ, Wolff S and Donnet JB. Filler-elastomer interactions. Part I: Silica
surface energies and interactions with model compounds. Rubber Chem Technol
1991; 64:559-576.
51. FrÖhlich J, Niedermeier W and Luginsland HD. The effect of filler–filler and filler-
elastomer interaction on rubber reinforcement. Composites Parts A 2005; 36: 449-
460.
52. Wolff S. Optimization of silane-silica OTR compounds. Pat I: variation of mixing
temperature and time during the modification of silica with bis-(3-triethyoxysilyl-
propyl)-tetrasulfide. Rubber Chem Ttechnol 1982; 55: 967-989.
29
53. Cochet P, Barruel P, Barriquand I, et al. Dispersibility measurements of pre.
silicas. Influence of dispersion on mechanical properties. Rubber World 1994; 219:
20-24.
54. Ahagon, A. Evaluation of Chain Scission during Mixing of Filled Compounds.
Rubber Chem Technol 1996; 69: 742-751.
55. Harmon DJ and Jacobs HL. Degradation of natural rubber during mill mastication.
J Appl Polym Sci 1966; 10: 253-257.
56. Fries H and Pandit RR. Mastication of rubber. Rubber Chem Technol 1982; 55:
309-327.
57. Pliskin I and Tokita N. Bound rubber in elastomers: Analysis of elastomer filler
interaction and its effect on viscosity and modulus of composite systems. J. Appl.
Poly. Sci 1972; 16: 473-492.
58. http://hyperphysics.phy-astr.gsu.edu/hbase/Particles/atomsiz.html.
59. Gent AN. Crystallisation in natural rubber. II: The influence of impurities.
Transactions 1954; 30: 139-143.
60. Cook S, Groves S and Tinker AJ. Investigating crosslinking in blends by
differential scanning calorimetry. J Rubb Res 2003; 6: 121-128.
30
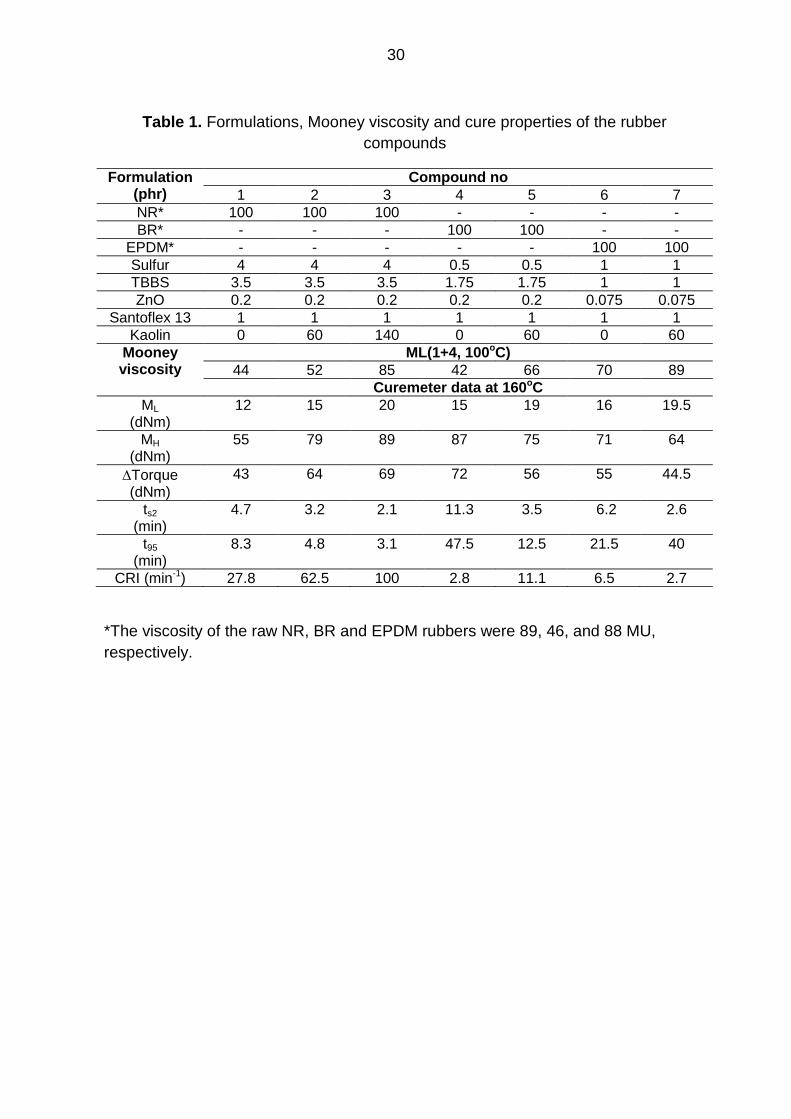
Table 1. Formulations, Mooney viscosity and cure properties of the rubber
compounds
Formulation (phr)
Compound no
1 2 3 4 5 6 7
NR* 100 100 100 - - - -
BR* - - - 100 100 - -
EPDM* - - - - - 100 100
Sulfur 4 4 4 0.5 0.5 1 1
TBBS 3.5 3.5 3.5 1.75 1.75 1 1
ZnO 0.2 0.2 0.2 0.2 0.2 0.075 0.075
Santoflex 13 1 1 1 1 1 1 1
Kaolin 0 60 140 0 60 0 60
Mooney viscosity
ML(1+4, 100oC)
44 52 85 42 66 70 89
Curemeter data at 160oC
ML (dNm)
12 15 20 15 19 16 19.5
MH (dNm)
55 79 89 87 75 71 64
Torque (dNm)
43 64 69 72 56 55 44.5
ts2 (min)
4.7 3.2 2.1 11.3 3.5 6.2 2.6
t95 (min)
8.3 4.8 3.1 47.5 12.5 21.5 40
CRI (min-1) 27.8 62.5 100 2.8 11.1 6.5 2.7
*The viscosity of the raw NR, BR and EPDM rubbers were 89, 46, and 88 MU,
respectively.
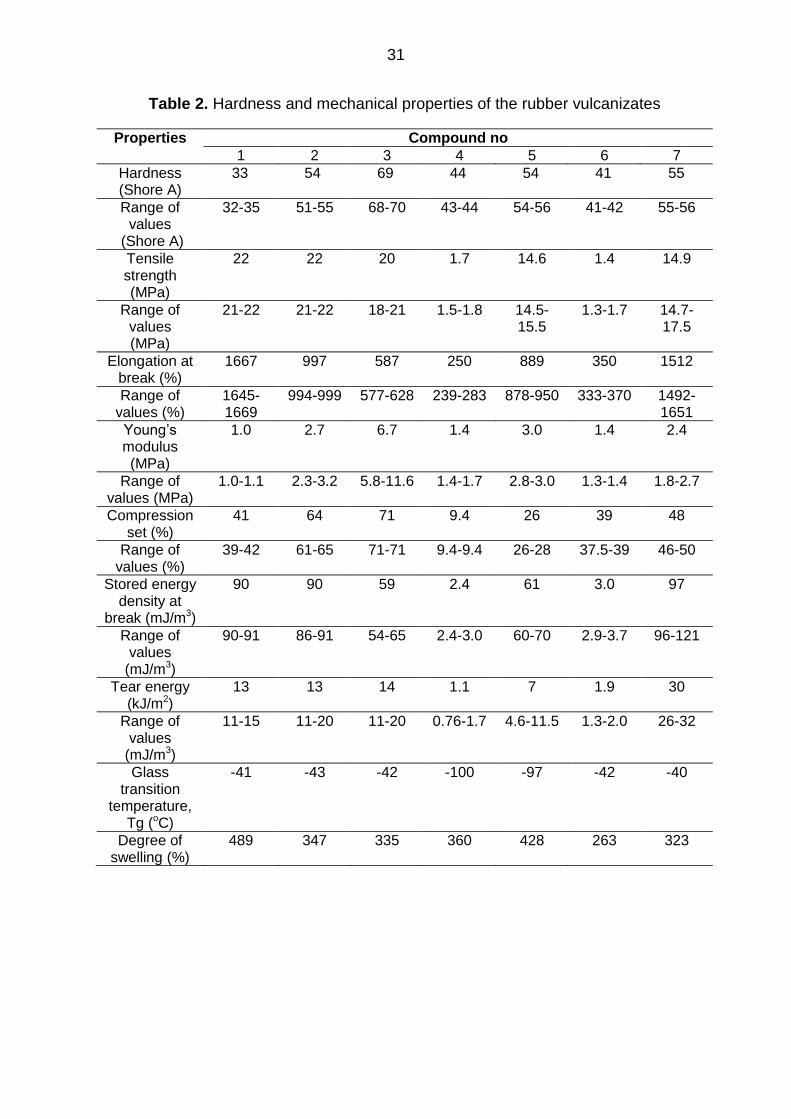
31
Table 2. Hardness and mechanical properties of the rubber vulcanizates
Properties Compound no
1 2 3 4 5 6 7
Hardness (Shore A)
33 54 69 44 54 41 55
Range of values
(Shore A)
32-35 51-55 68-70 43-44 54-56 41-42 55-56
Tensile strength (MPa)
22 22 20 1.7 14.6 1.4 14.9
Range of values (MPa)
21-22 21-22 18-21 1.5-1.8 14.5-15.5
1.3-1.7 14.7-17.5
Elongation at break (%)
1667 997 587 250 889 350 1512
Range of values (%)
1645-1669
994-999 577-628 239-283 878-950 333-370 1492-1651
Young’s modulus (MPa)
1.0 2.7 6.7 1.4 3.0 1.4 2.4
Range of values (MPa)
1.0-1.1 2.3-3.2 5.8-11.6 1.4-1.7 2.8-3.0 1.3-1.4 1.8-2.7
Compression set (%)
41 64 71 9.4 26 39 48
Range of values (%)
39-42 61-65 71-71 9.4-9.4 26-28 37.5-39 46-50
Stored energy density at
break (mJ/m3)
90 90 59 2.4 61 3.0 97
Range of values
(mJ/m3)
90-91 86-91 54-65 2.4-3.0 60-70 2.9-3.7 96-121
Tear energy (kJ/m2)
13 13 14 1.1 7 1.9 30
Range of values
(mJ/m3)
11-15 11-20 11-20 0.76-1.7 4.6-11.5 1.3-2.0 26-32
Glass transition
temperature, Tg (oC)
-41 -43 -42 -100 -97 -42 -40
Degree of swelling (%)
489 347 335 360 428 263 323
32
Figure 1. Typical torque vs time cure trace produced by ODR at 160oC. Data for compound 5 in Table 1. ΔTorque = Tmax – Tmin.
33
Figure 2. Typical DMA traces for the NR composite with140 phr kaolin.
34
Figure 3. XRD diffraction pattern for the solid kaolin particles.
35
Figure 4. XRD diffraction patterns for the NR composites (compound s 1-3 Table 1).
36
Figure 5. Transmission electron micrograph showing kaolin particles.
37
Figure 6. Scanning electron micrograph showing good dispersion of the kaolin particles in rubber matrix. Data for the NR composite with 60 phr kaolin after 13
min mixing time.
38
.
Figure 7. Torque versus TBBS loading for the NR with 1 phr sulfur (■), NR with
4 phr sulfur ().
39
Figure 8. ΔTorque versus ZnO loading for the NR with 1 phr sulfur and 1.5 phr
TBBS (♦), NR with 4 phr sulfur and 3.5 phr TBBS (●).
40
Figure 9. Torque versus stearic acid loading for the NR with 1 phr sulfur, 1.5 phr
TBBS and 0.2 phr ZnO (■), BR with 0.5 phr sulfur, 1.75 phr TBBS and 0.2 phr
ZnO (♦), EPDM with 1 phr sulfur, 1 phr TBBS and 0.075 phr ZnO ().
41
Figure 10. Torque versus TBBS for the BR with 0.5 phr sulfur (♦), and BR with
1 phr sulfur (▲).
42
Figure 11. Torque versus ZnO loading for the BR with 0.5 phr sulfur and 1.75 phr
TBBS (■), BR with 1 phr sulfur and 3 phr TBBS (▲).
43
Figure 12. Torque versus TBBS loading for the EPDM with 1 phr sulfur.
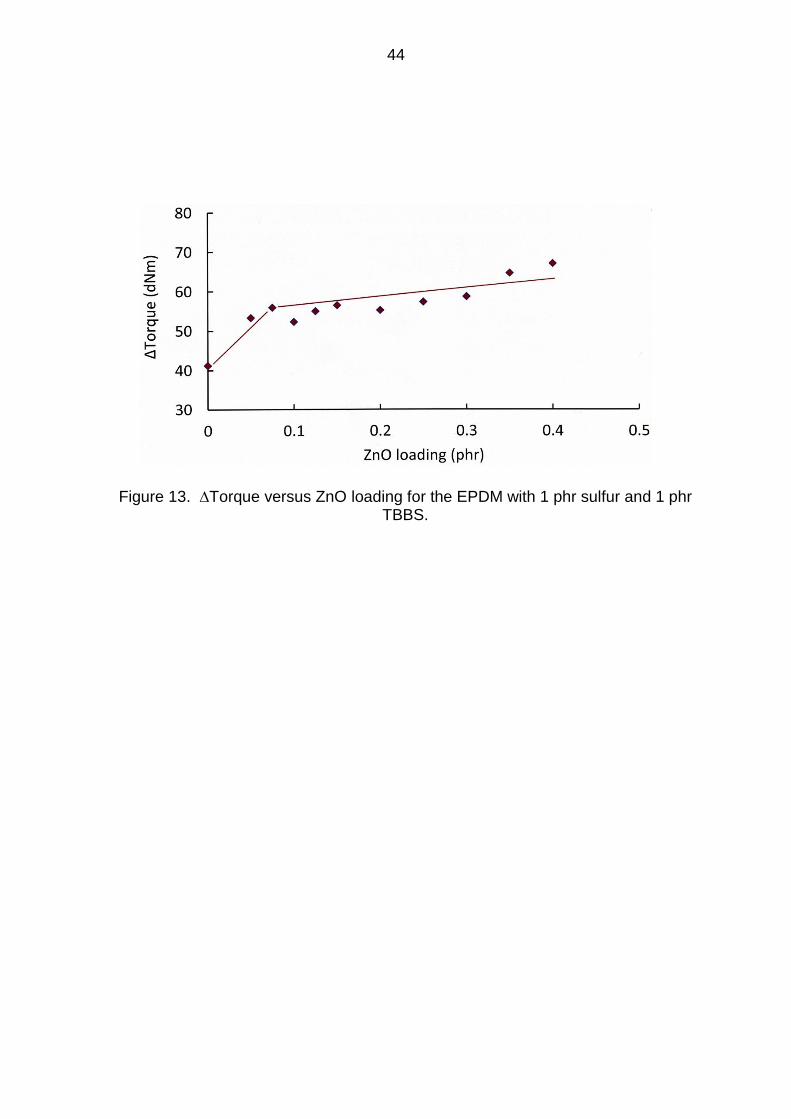
44
Figure 13. Torque versus ZnO loading for the EPDM with 1 phr sulfur and 1 phr TBBS.
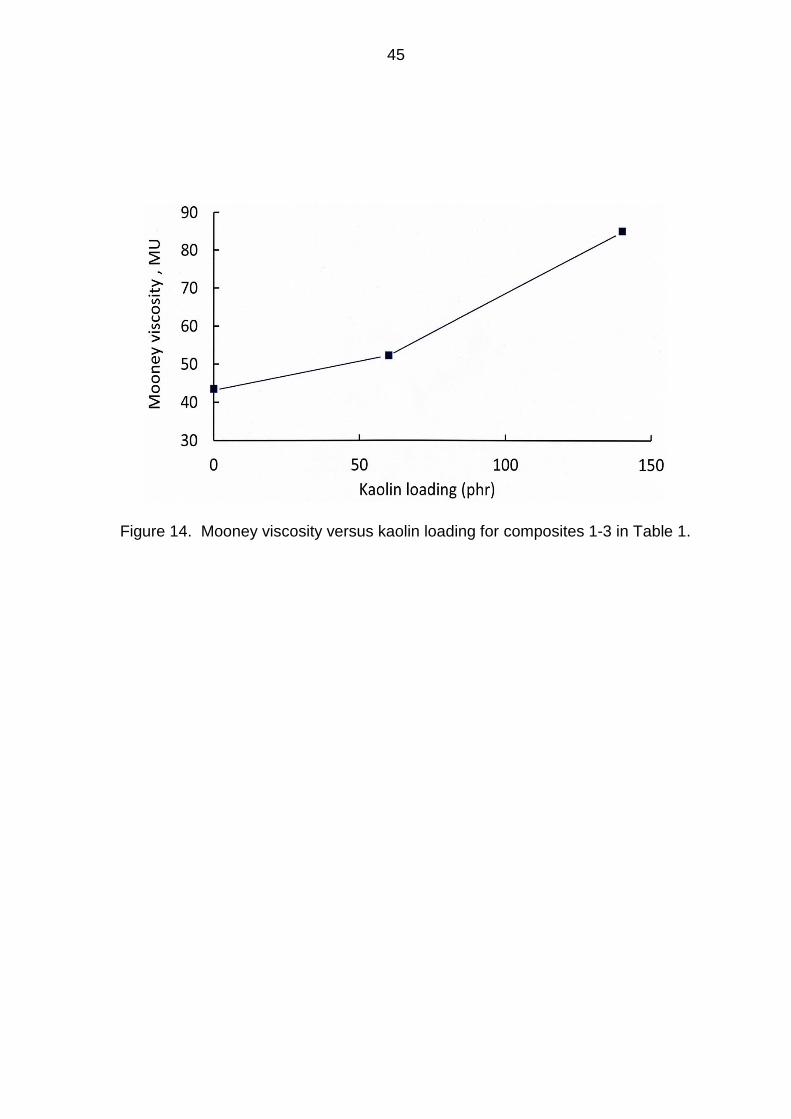
45
Figure 14. Mooney viscosity versus kaolin loading for composites 1-3 in Table 1.
46
Figure 15. Optimum cure time, t95 and scorch time, ts2 versus kaolin loading for
composites 1-3 in table 1. Optimum cure time (■), scorch time ().
47
Figure 16. Cure rate index versus kaolin loading for composites 1-3 in Table 1.
48
Figure 17. Torque versus kaolin loading for composites 1-3 in Table 1.