Embed Size (px)
Citation preview
THE POTENTIAL IMPACT OF OCEAN ACIDIFICATION ON
EGGS AND LARVAE OF YELLOWFIN TUNA
Vernon Scholey1, Simon Nicol2, Daniel Margulies1, Don Bromhead2, Jeanne
Wexler1, Maria Santiago1, Jane Williamson3, Simon Hoyle2, Peter Schlegel3, Jonathan Havenhand4, Tatiana Ilyina5, Patrick Lehodey6
1Inter-American Tropical Tuna
Commission (IATTC), 2Secretariat of the Pacific Community
(SPC),3Macquarie University, Australia, 4University of Gothenburg,5Max Planck
Institute for Meteorology,6Collecte Localisation Satellites (CLS)
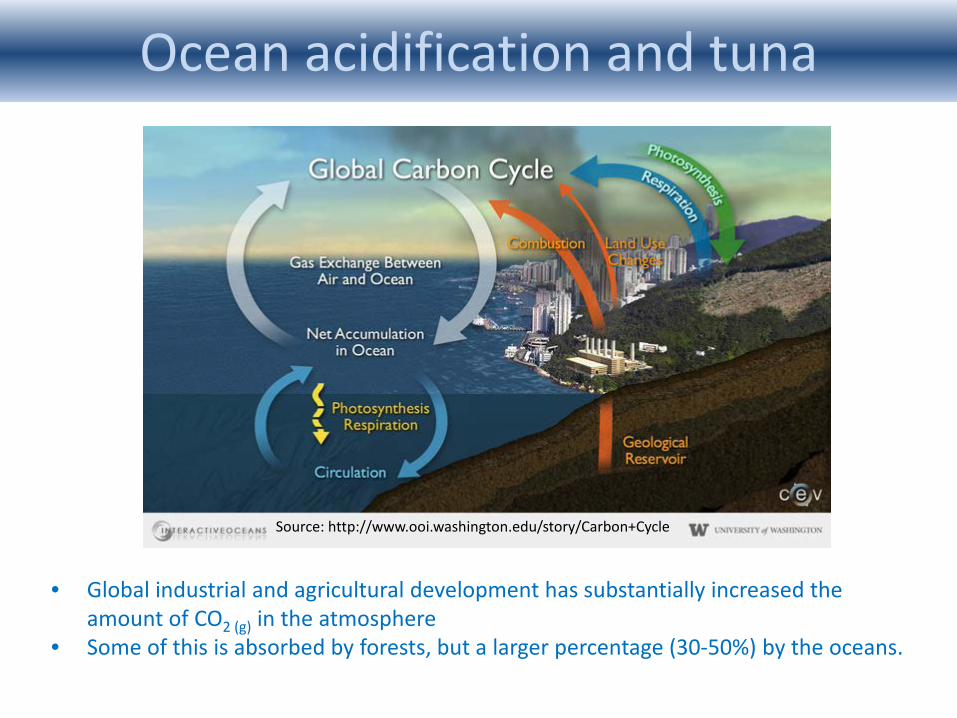
Source: http://www.ooi.washington.edu/story/Carbon+Cycle
Ocean acidification
• Global industrial and agricultural development has substantially increased the amount of CO2 (g) in the atmosphere
• Some of this is absorbed by forests, but a larger percentage (30-50%) by the oceans.
Ocean acidification and tuna
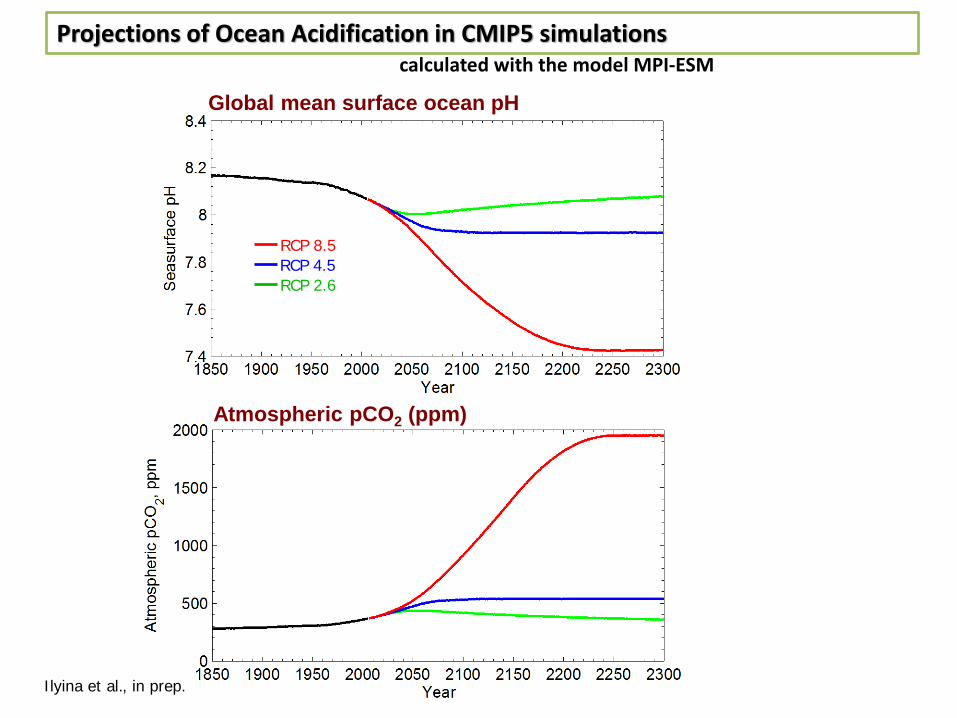
Atmospheric pCO2 (ppm)
RCP 8.5
RCP 2.6 RCP 4.5
calculated with the model MPI-ESM
Global mean surface ocean pH
Projections of Ocean Acidification in CMIP5 simulations
Ilyina et al., in prep.
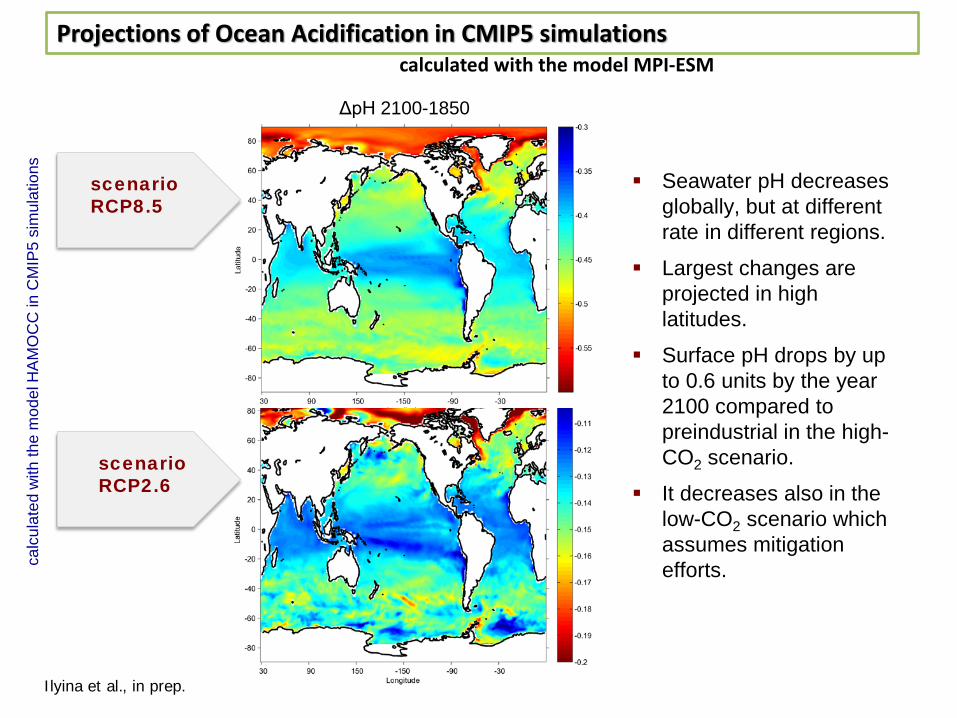
ΔpH 2100-1850
scenario RCP8.5
scenario RCP2.6
Seawater pH decreases globally, but at different rate in different regions.
Largest changes are projected in high latitudes.
Surface pH drops by up to 0.6 units by the year 2100 compared to preindustrial in the high-CO2 scenario.
It decreases also in the low-CO2 scenario which assumes mitigation efforts. ca
lcul
ated
with
the
mod
el H
AM
OC
C in
CM
IP5
sim
ulat
ions
Projections of Ocean Acidification in CMIP5 simulations
calculated with the model MPI-ESM
Ilyina et al., in prep.
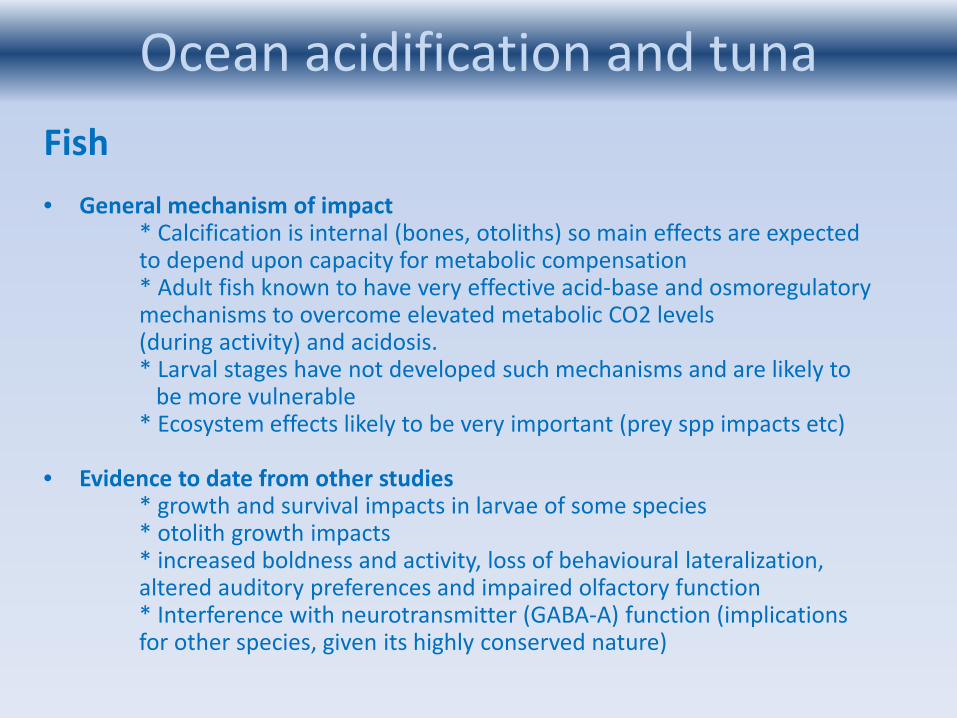
Ocean acidification - Evidence Fish • General mechanism of impact * Calcification is internal (bones, otoliths) so main effects are expected to depend upon capacity for metabolic compensation * Adult fish known to have very effective acid-base and osmoregulatory mechanisms to overcome elevated metabolic CO2 levels (during activity) and acidosis. * Larval stages have not developed such mechanisms and are likely to be more vulnerable * Ecosystem effects likely to be very important (prey spp impacts etc) • Evidence to date from other studies * growth and survival impacts in larvae of some species * otolith growth impacts * increased boldness and activity, loss of behavioural lateralization, altered auditory preferences and impaired olfactory function * Interference with neurotransmitter (GABA-A) function (implications for other species, given its highly conserved nature)
Ocean acidification and tuna

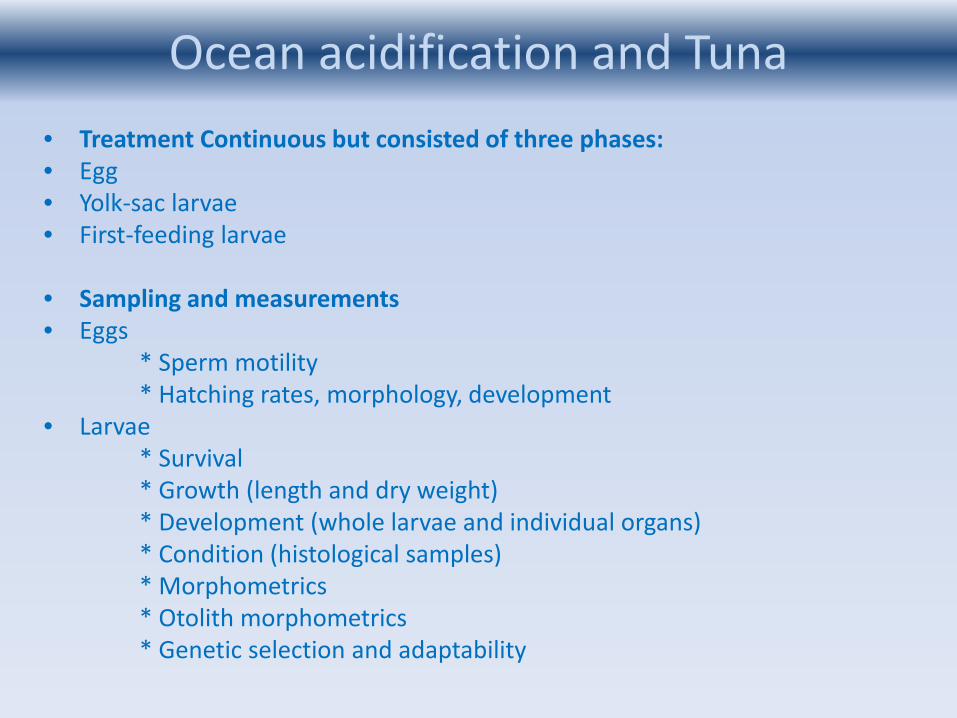
Ocean acidification - Evidence • Treatment Continuous but consisted of three phases: • Egg • Yolk-sac larvae • First-feeding larvae • Sampling and measurements • Eggs * Sperm motility * Hatching rates, morphology, development • Larvae * Survival * Growth (length and dry weight) * Development (whole larvae and individual organs) * Condition (histological samples) * Morphometrics * Otolith morphometrics * Genetic selection and adaptability
Ocean acidification and Tuna
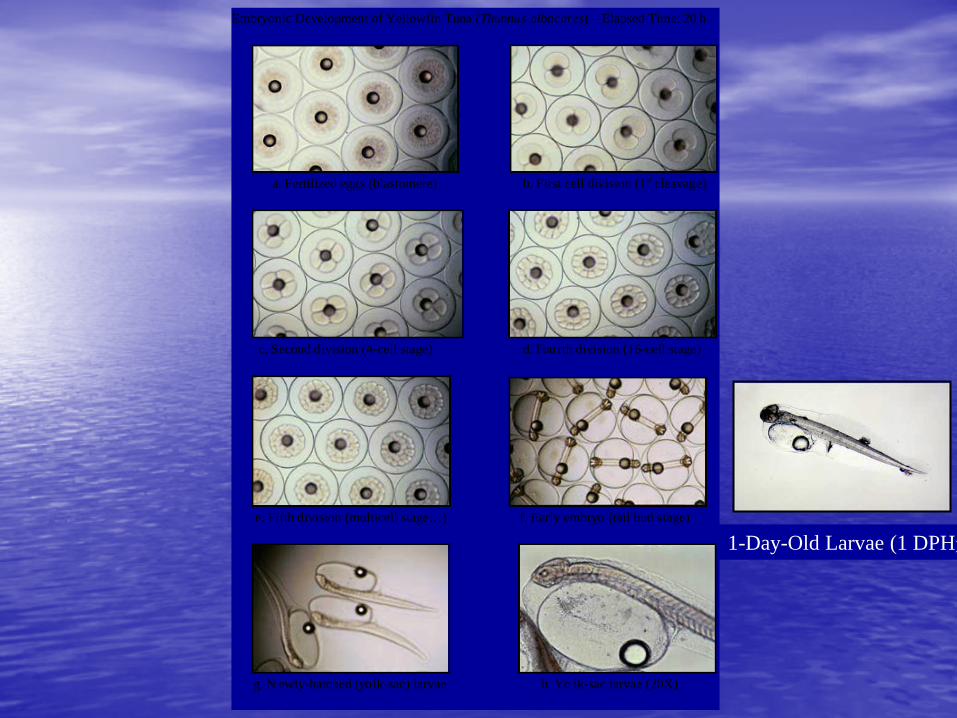
Embryonic Development of Yellowfin Tuna (Thunnus albacares) – Elapsed Time: 20 h
a. Fertilized eggs (blastomere) b. First cell division (1st cleavage)
c. Second division (4-cell stage) d. Fourth division (16-cell stage)
e. Fifth division (multicell stage…) f. Early embryo (tail bud stage)
g. N ewly-hatched (yolk-sac) larvae h. Yo lk-sac larvae (20X)
1-Day-Old Larvae (1 DPH)
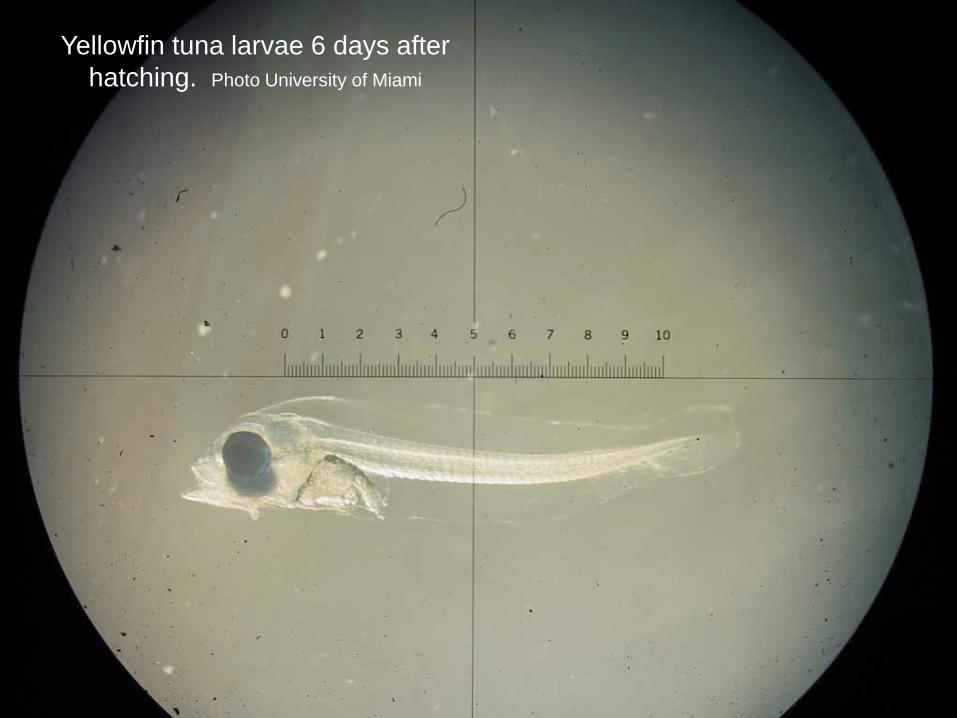
Yellowfin tuna larvae 6 days after hatching. Photo University of Miami
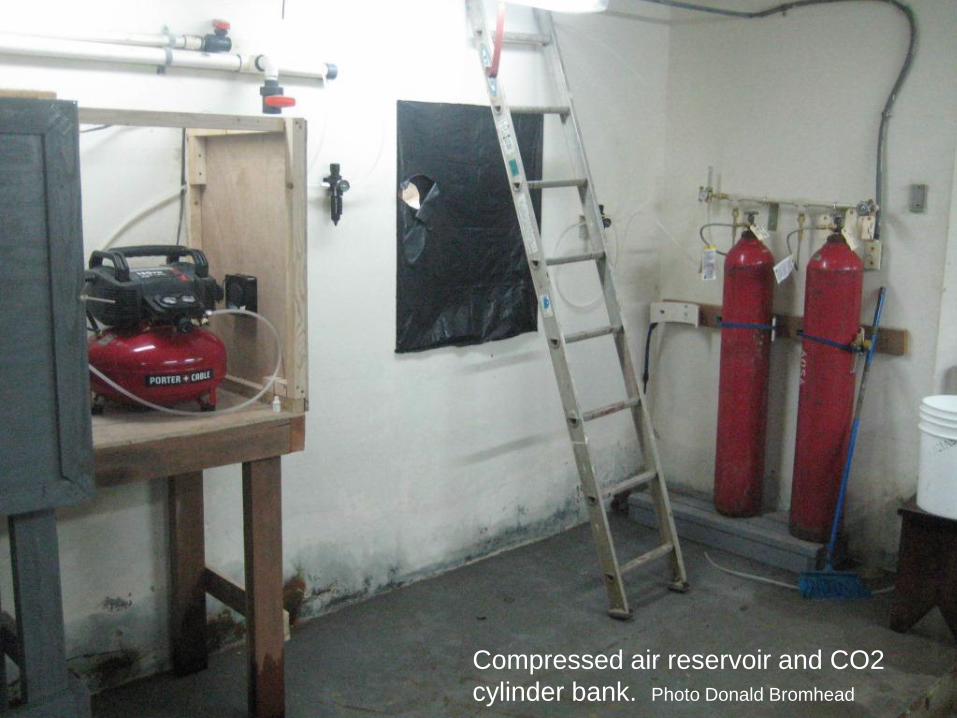
Compressed air reservoir and CO2 cylinder bank. Photo Donald Bromhead
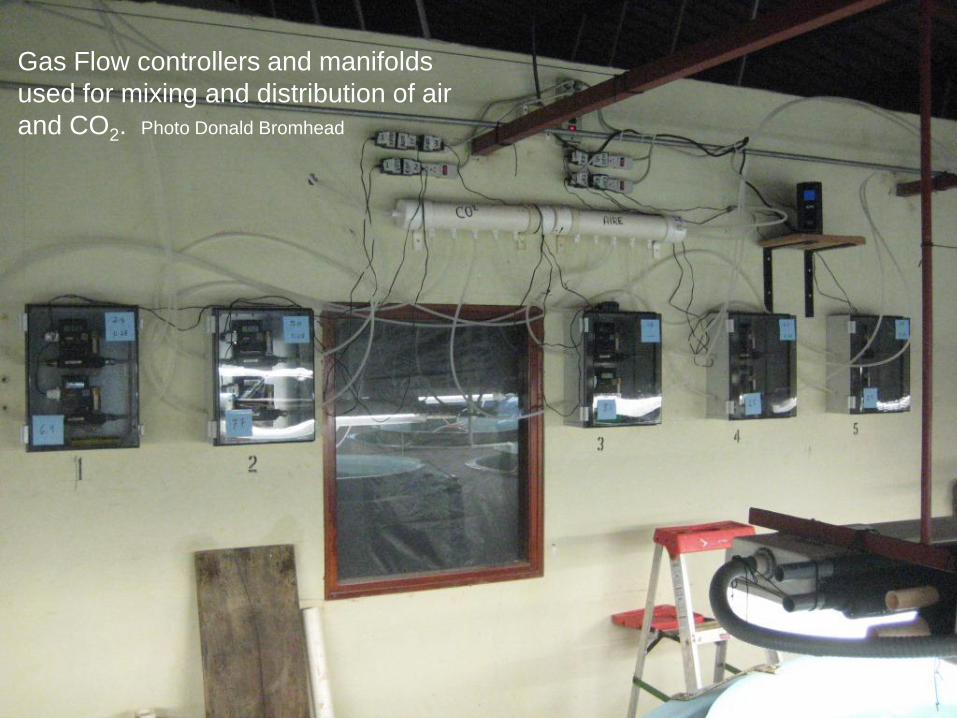
Gas Flow controllers and manifolds used for mixing and distribution of air and CO2. Photo Donald Bromhead
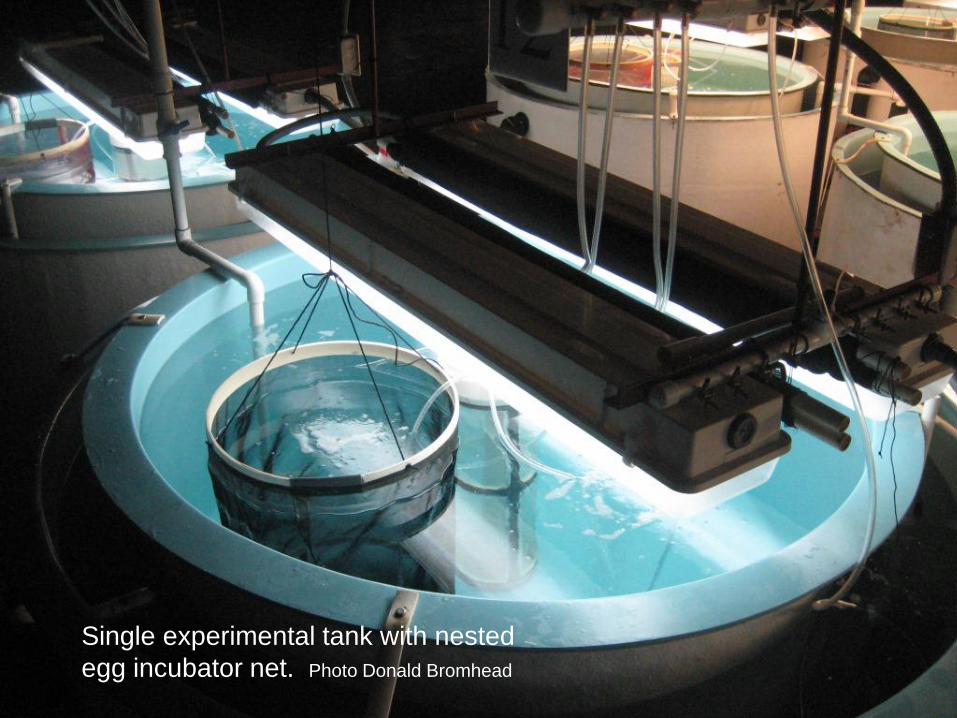
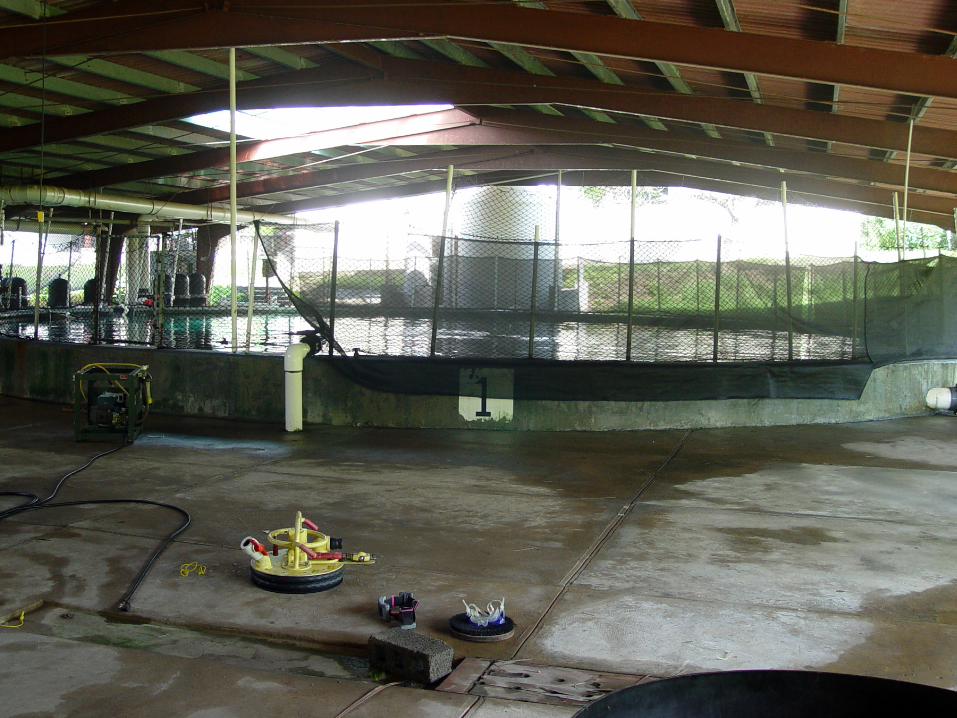
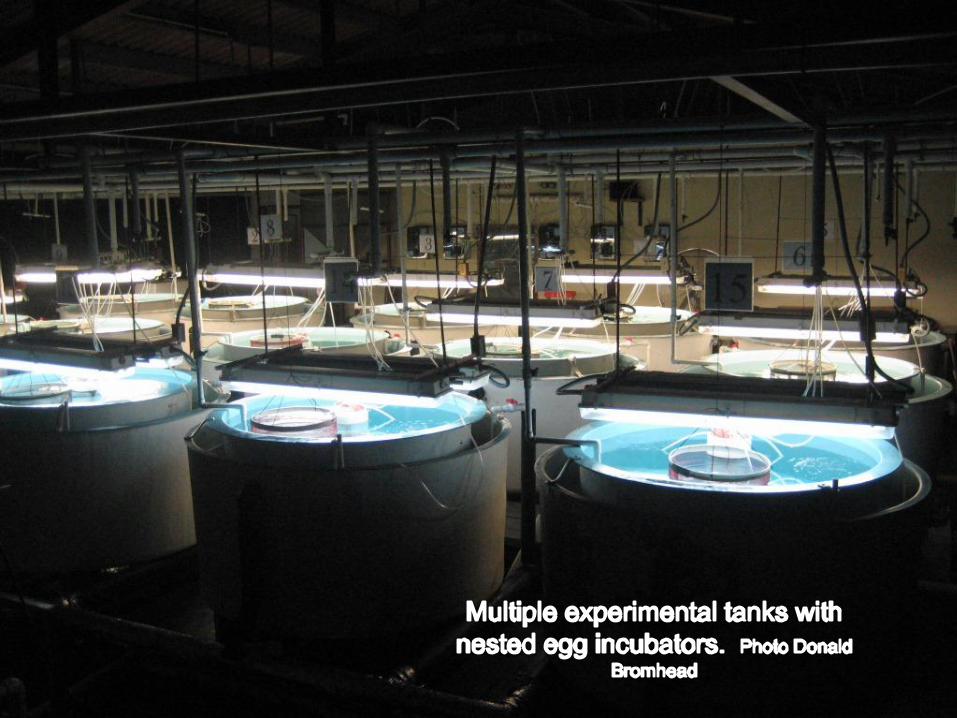
Single experimental tank with nested egg incubator net. Photo Donald Bromhead
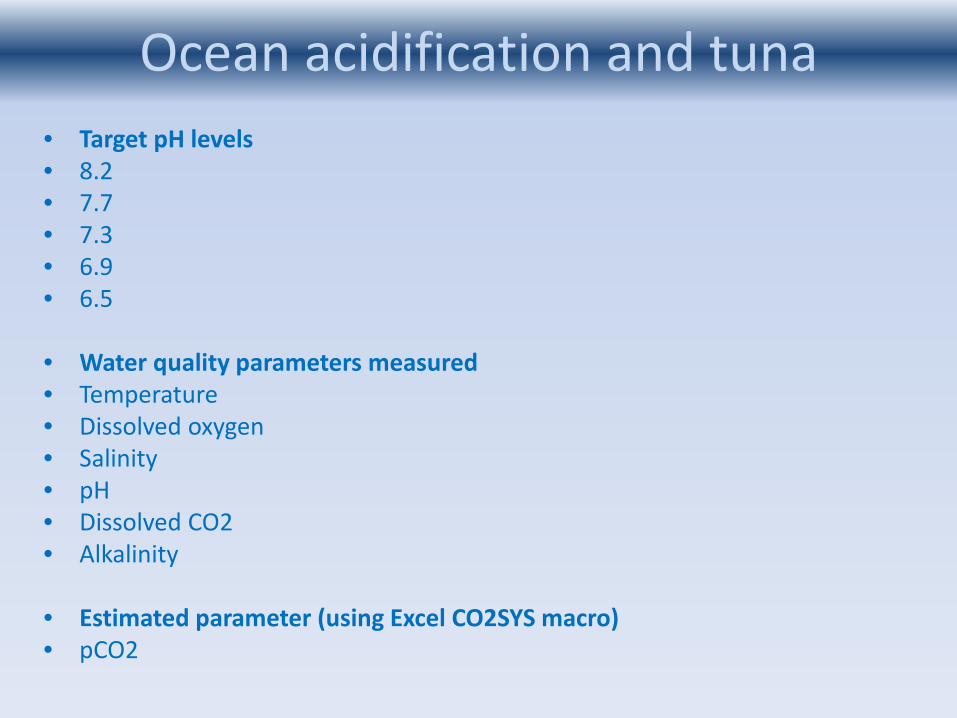
Ocean acidification - Evidence • Target pH levels • 8.2 • 7.7 • 7.3 • 6.9 • 6.5 • Water quality parameters measured • Temperature • Dissolved oxygen • Salinity • pH • Dissolved CO2 • Alkalinity
• Estimated parameter (using Excel CO2SYS macro) • pCO2
Ocean acidification and tuna
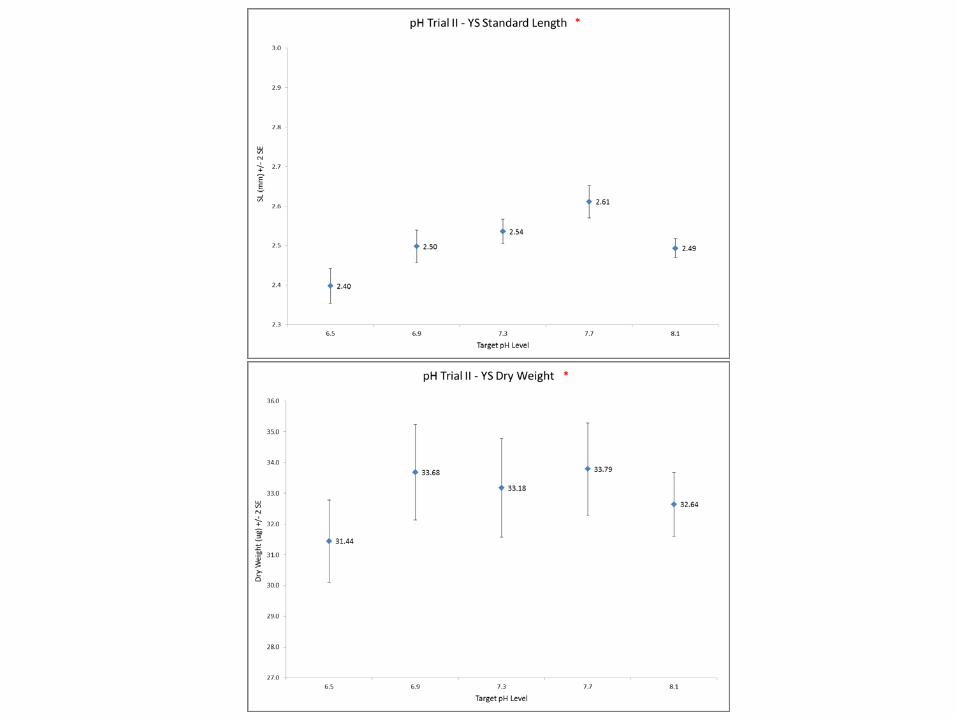
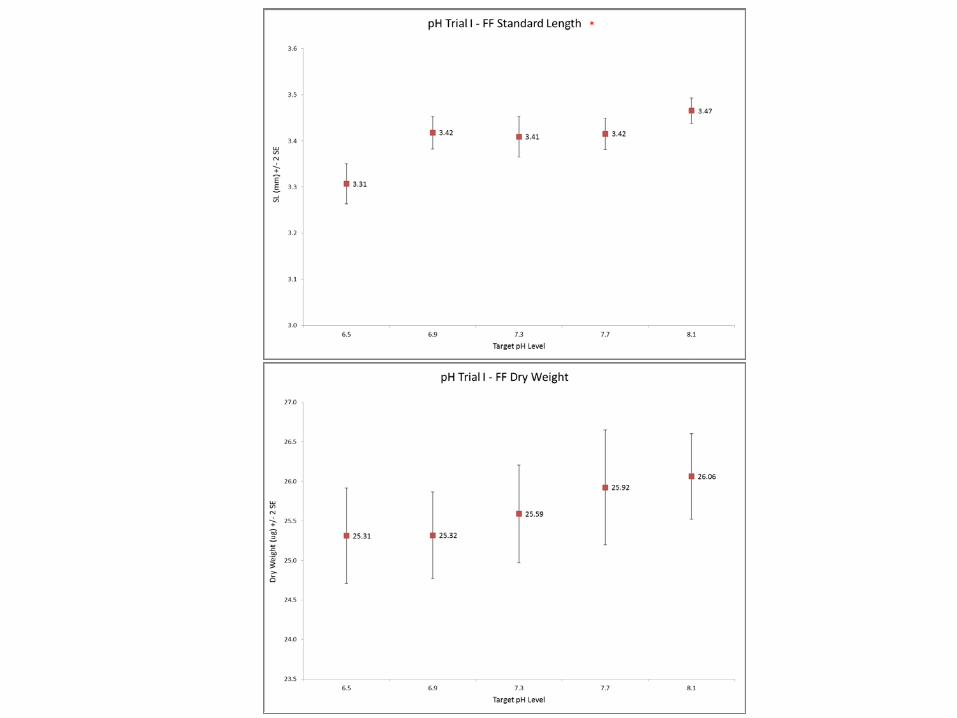
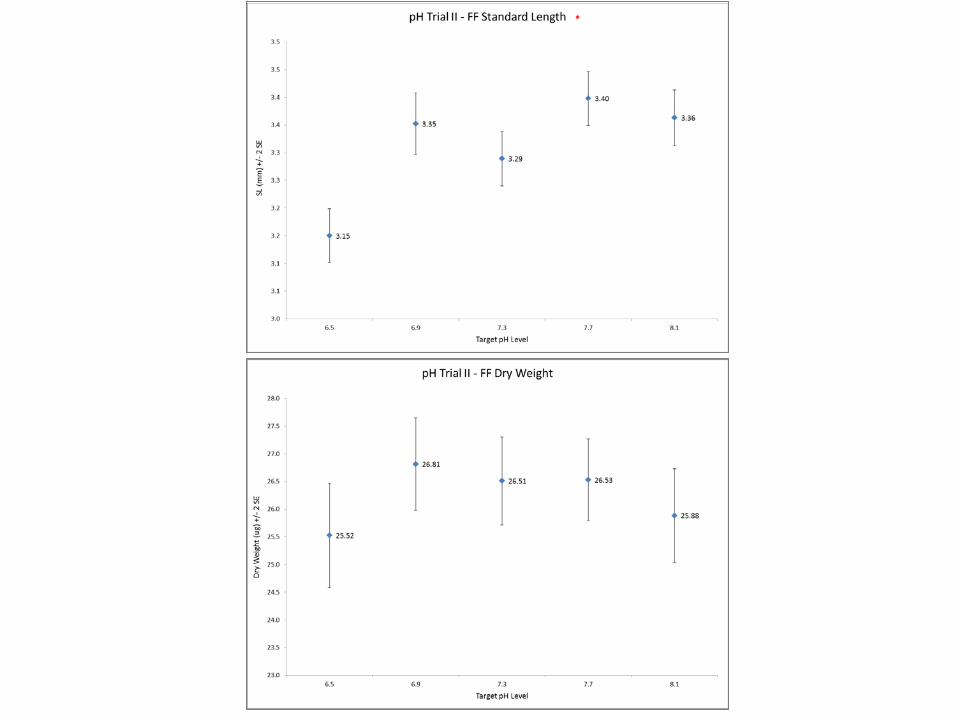
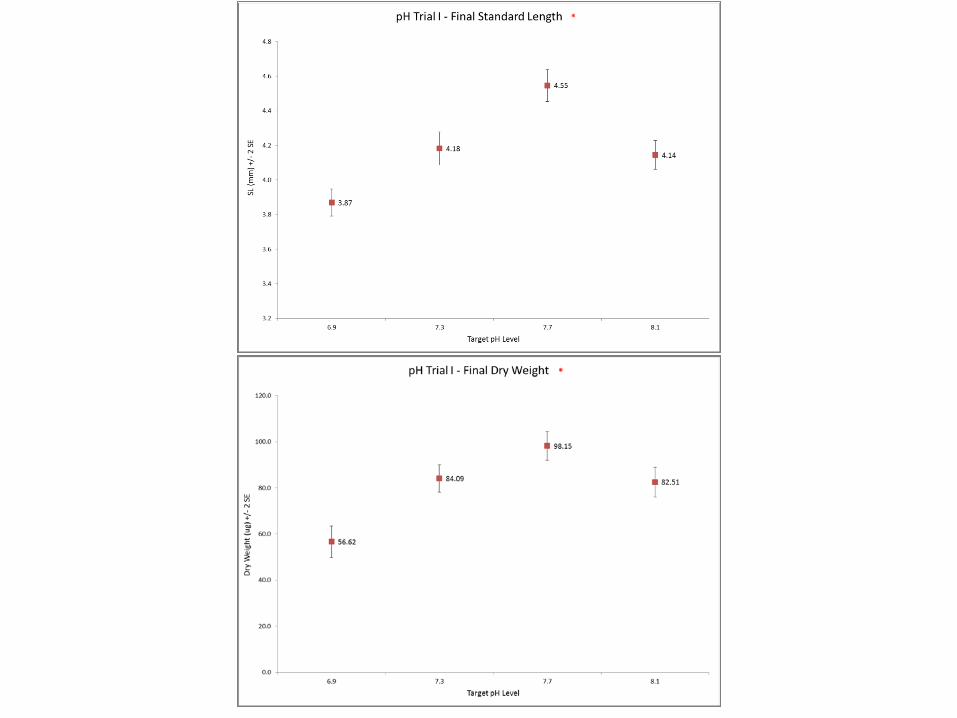
Ocean acidification - Evidence Statistical Analyses • Generalised Linear Models * Egg hatching rates Time at hatch~ pCO2 + salinity + temperature + dO2 * Larval survival Survival no.s ~ pCO2 + Trial * Larval growth (in progress)
Ocean acidification and Tuna
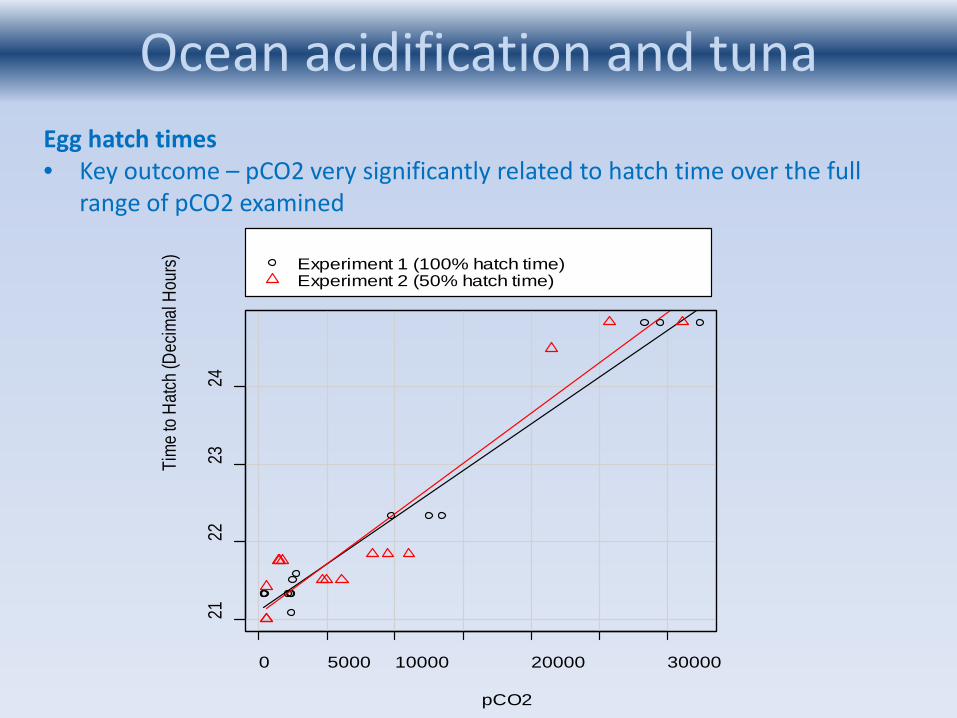
Ocean acidification - Evidence Egg hatch times • Key outcome – pCO2 very significantly related to hatch time over the full
range of pCO2 examined
Ocean acidification and tuna
0 5000 10000 20000 30000
2122
2324
pCO2
Tim
e to
Hat
ch (D
ecim
al H
ours
) Experiment 1 (100% hatch time)Experiment 2 (50% hatch time)
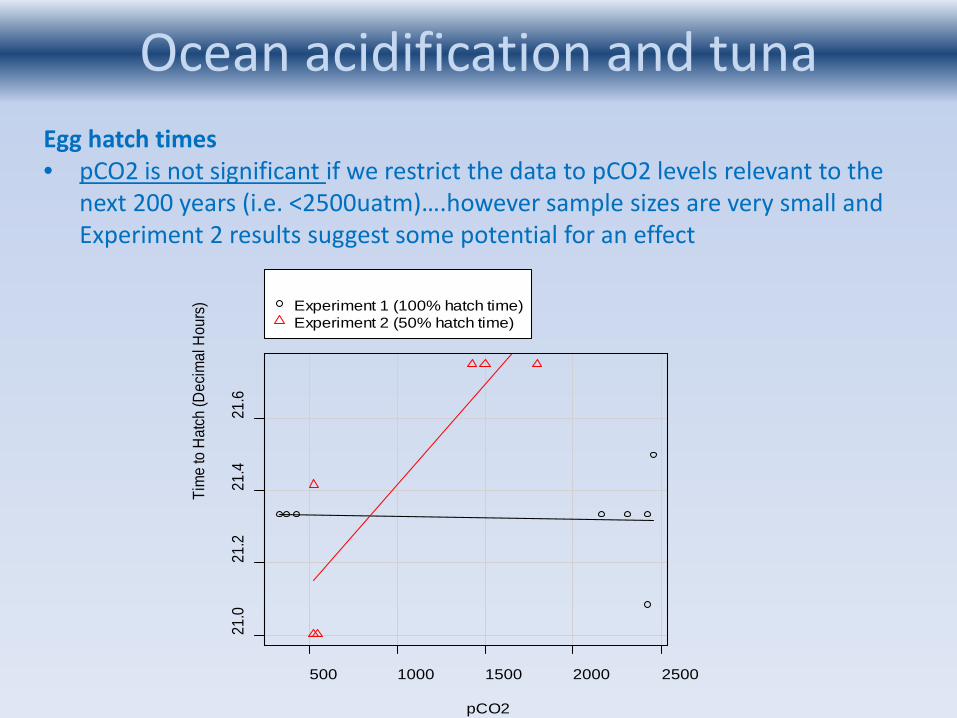
Ocean acidification - Evidence Egg hatch times • pCO2 is not significant if we restrict the data to pCO2 levels relevant to the
next 200 years (i.e. <2500uatm)….however sample sizes are very small and Experiment 2 results suggest some potential for an effect
Ocean acidification and tuna
500 1000 1500 2000 2500
21.0
21.2
21.4
21.6
pCO2
Tim
e to
Hat
ch (D
ecim
al H
ours
) Experiment 1 (100% hatch time)Experiment 2 (50% hatch time)
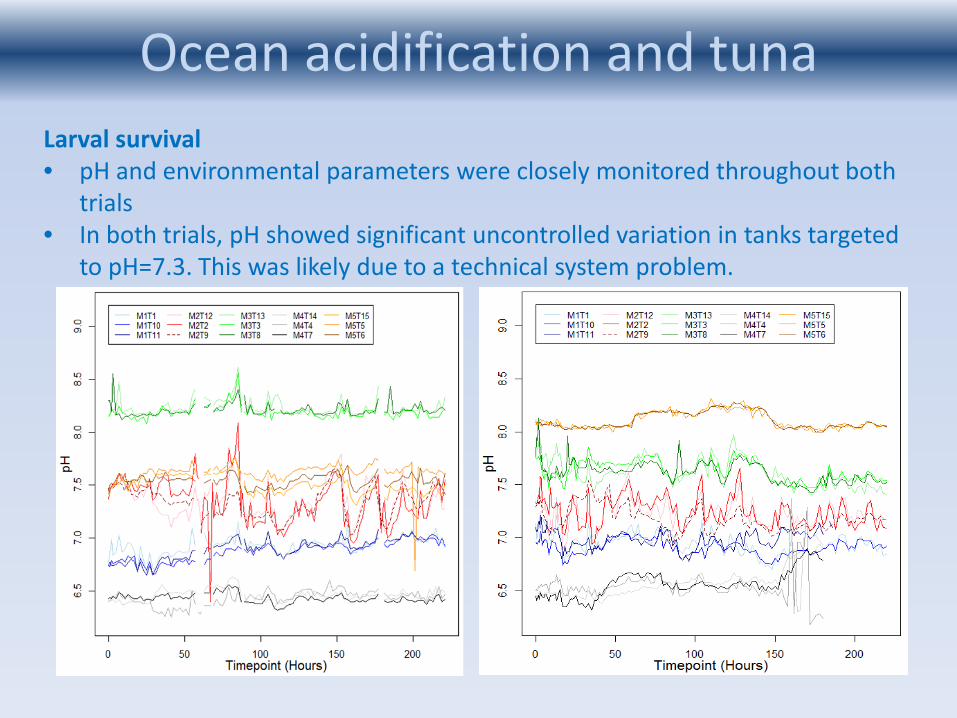
Ocean acidification - Evidence Larval survival • pH and environmental parameters were closely monitored throughout both
trials • In both trials, pH showed significant uncontrolled variation in tanks targeted
to pH=7.3. This was likely due to a technical system problem.
Ocean acidification and tuna
Ocean acidification - Evidence Larval survival
• At the end of trial 2, a red tide in the Achotines Bay may have caused
fluctuations in environmental parameters including pH in some tanks and also coincided with a mass mortality in two control tanks the night before final survival counts. Visual estimates of numbers in the control tanks were higher than any other treatment tanks but final counts the next morning were very low due to an overnight mortality event possibly due to an ammonia spike or the red tide.
• Due to both occurrences, survival data from treatments targeted at pH=7.3 (both trials) and day 6 of larval feeding (trial 2) were excluded from analyses
Ocean acidification and tuna
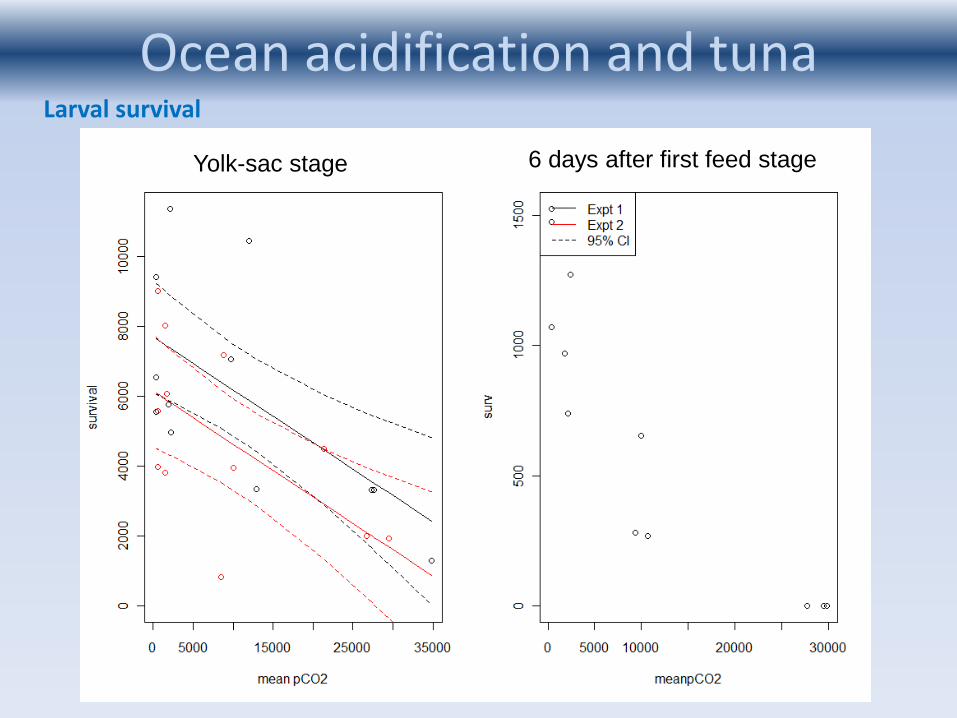
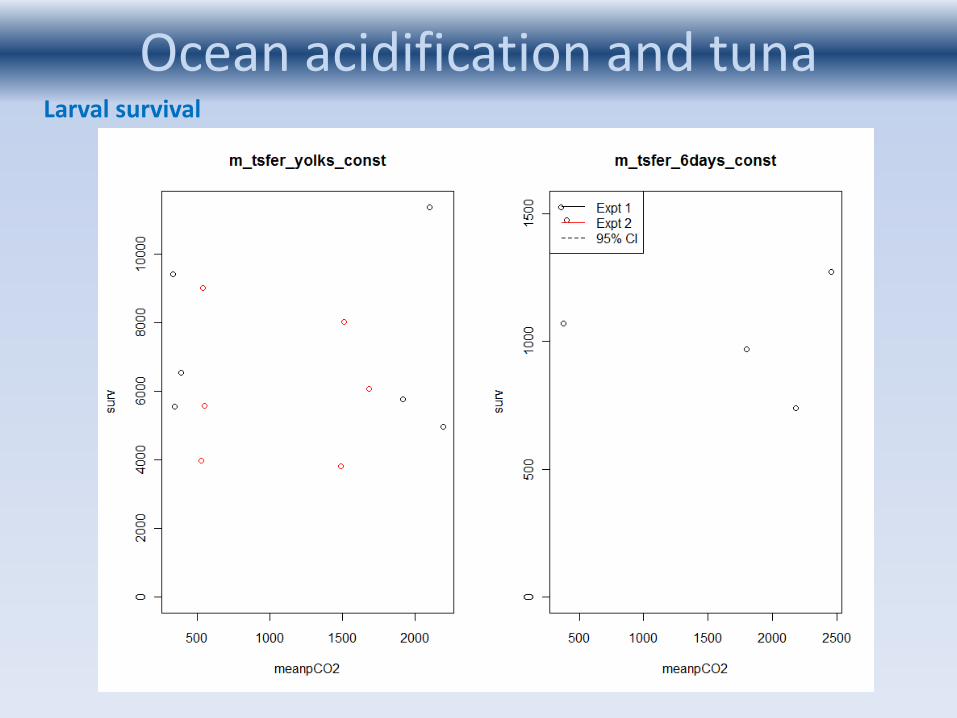
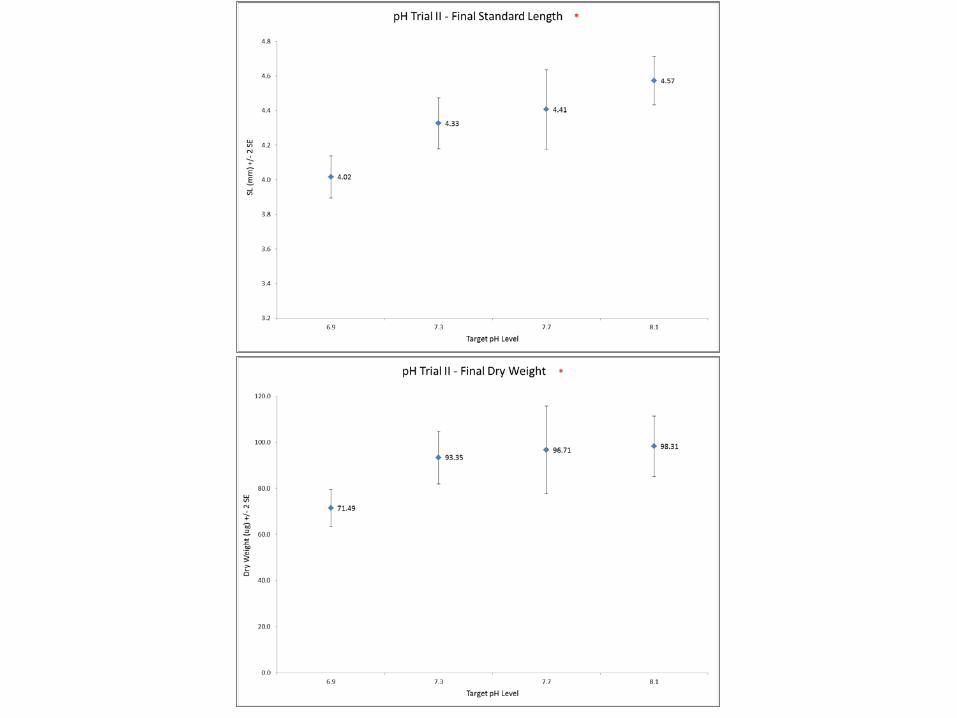
Ocean acidification - Evidence Ocean acidification and tuna Larval survival
Yolk-sac stage 6 days after first feed stage
Ocean acidification - Evidence Ocean acidification and tuna Larval survival
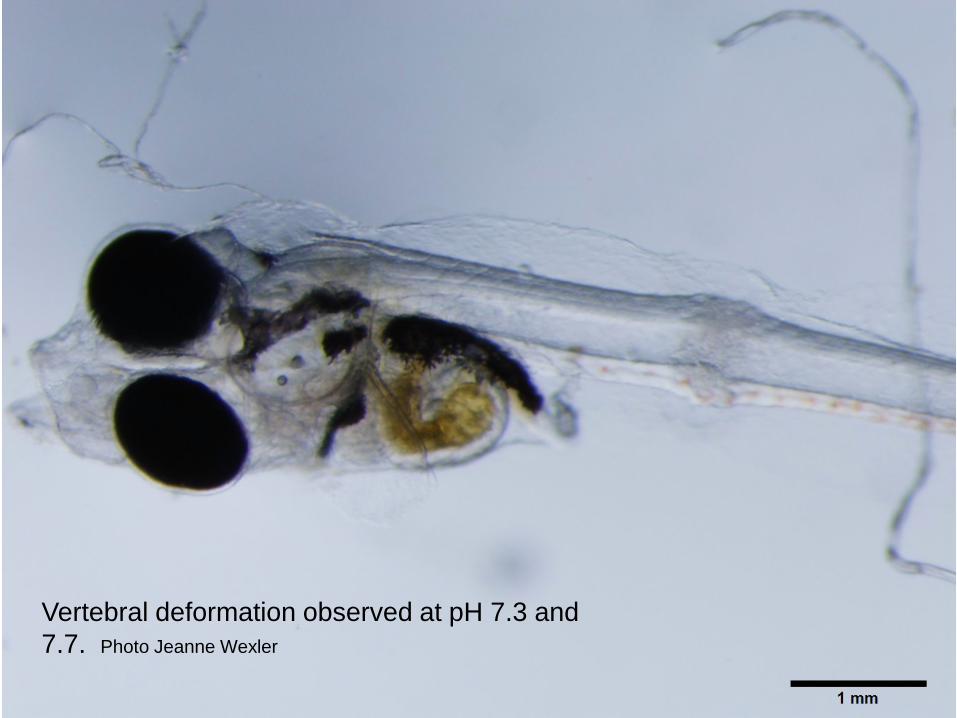
Vertebral deformation observed at pH 7.3 and 7.7. Photo Jeanne Wexler
Ongoing Activities • Histological Sample Processing
and Analysis • Final Data Analysis • SEAPODYM modeling
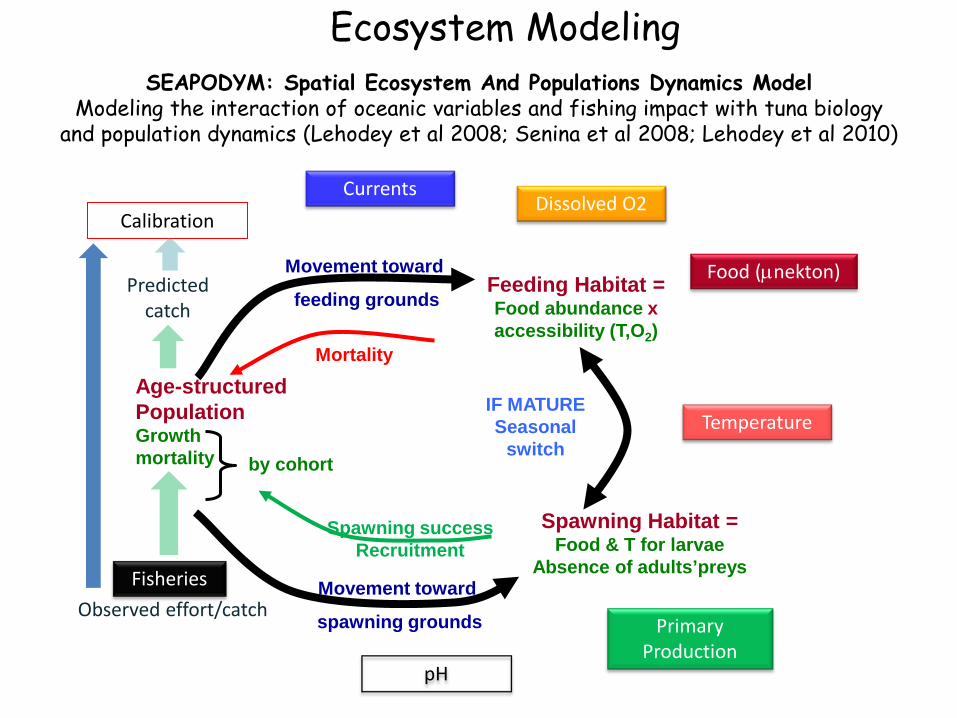
Ecosystem Modeling
Age-structured Population Growth mortality by cohort
Feeding Habitat = Food abundance x accessibility (T,O2)
IF MATURE Seasonal
switch
Movement toward
feeding grounds
Movement toward
spawning grounds
Mortality
Spawning success Recruitment
Spawning Habitat = Food & T for larvae
Absence of adults’preys Fisheries
Predicted catch
Observed effort/catch
Calibration
SEAPODYM: Spatial Ecosystem And Populations Dynamics Model Modeling the interaction of oceanic variables and fishing impact with tuna biology
and population dynamics (Lehodey et al 2008; Senina et al 2008; Lehodey et al 2010)
Currents
Primary Production
Dissolved O2
Food (µnekton)
pH
Temperature
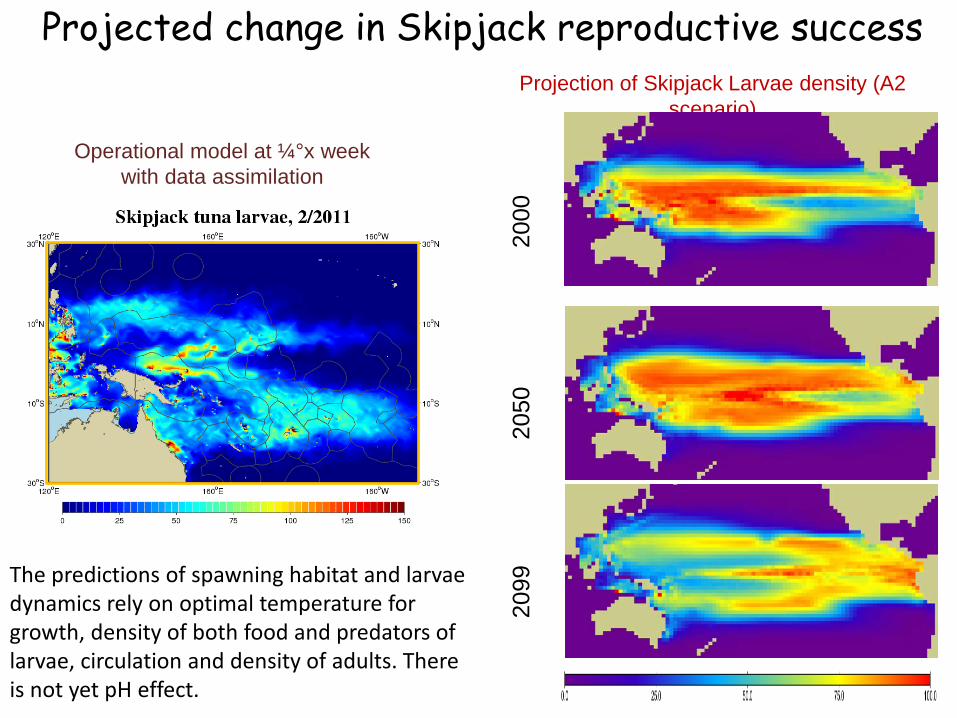
Projection of Skipjack Larvae density (A2 scenario)
2000
20
50
2099
Operational model at ¼°x week with data assimilation
Projected change in Skipjack reproductive success
The predictions of spawning habitat and larvae dynamics rely on optimal temperature for growth, density of both food and predators of larvae, circulation and density of adults. There is not yet pH effect.
Ocean acidification - Evidence Ocean acidification and tuna The tuna OA trials represented the very first time the implications of OA have been experimentally tested on tuna species From a technical and logistical perspective, the project was very challenging and some difficulties were encountered. Most of these were overcome through the development of novel techniques, while other problems led to ideas for improving experimental designs in the future. The current trials represent the first step in investigating the impact of ocean acidification upon tuna resources of the Pacific Ocean. It is our intention to pursue funding to further this work in the near future, to develop our understanding of the biological effects and to then apply these within predictive population models such as SEAPODYM.
Ocean acidification - Evidence Ocean acidification and tuna Phase II Trials • Concentrate on higher sample numbers and increased replicates from a
restricted pCO2 range • Further investigations of impacts on sperm and egg fertilisation rates • Look at interacting factors * Temperature and pCO2 * Food availability and pCO2 • Larval behavior studies • Dry Season (pH 7.8) and wet season (pH 8.2) trials to see if broodstock
tuna/eggs/larvae adapt to shifts
ACKNOWLEDGEMENTS
•Pelagic Fisheries Research Program (PFRP)
•Staff of IATTC Achotines Laboratory
• Integrated Aqua Systems, Inc.