Embed Size (px)
Citation preview

Copyright is owned by the Author of the thesis. Permission is given for a copy to be downloaded by an individual for the purpose of research and private study only. The thesis may not be reproduced elsewhere without the permission of the Author.

A thesis presented in partial fulfilment of the requirements for
the degree of Master of Environmental Management at Massey
University, New Zealand.
Melody Natasha Mendez
2013


i
Abstract Unsustainable development worldwide, is leading to a variety of environmental, social and
economic issues. Economic growth which impacts these three pillars of sustainability,
affects the current populations’ ability to meet their needs or those of future generations.
For many developing countries, tourism is an economic developmental tool that can
contribute to their economy. However, unsustainable tourism, such as mass tourism,
exacerbates socio-environmental issues and can be contributory factors to poverty and
environmental degradation. Additionally, strategies to alleviate poverty and conserve the
environment may conflict with each other, reducing their efficacy. These issues can be
most pronounced in popular tourist destinations and highlight the need for a win-win
solution.
This research investigated the potential for ecotourism in the Yercaud Taluk, India, by
identifying human and physical resources - including the natural and cultural features -
available for development. It also identified socio-environmental problems to highlight the
necessity for a win-win poverty alleviation and conservation strategy. Yercaud is a popular
domestic tourist destination receiving large numbers of visitors, further emphasising the
need for sustainable tourism and the vital requirement for successful implementation of
ecotourism.
A mixed methods approach using surveys, semi-structured interviews, personal
observations and an attractions inventory was utilised. Data was captured regarding
tourist preferences and destination attractivity factors based on tourist motivations;
resident socio-economic data and incidences of poverty based on the presence of certain
indicators; the state of the environment; and development requirements for tourist
attractions.
Study findings are site-specific, but the framework can be utilised in other tourist
destinations. Results revealed that a tourism demand existed for ecotourism and that
there are resources available for ecotourism development. However, degradation of
natural and cultural resources poses a risk. Most importantly, environmental degradation
significantly threatens the continued existence of the Taluk, including its tourism industry.
As such, it is recommended that future development is sustainable, preserving
biodiversity, the environment and community features.
Keywords: Ecotourism, poverty alleviation, sustainable development, Yercaud, India.

ii
Acknowledgements I would like to acknowledge my supervisor, Associate Professor John Holland, who drove
me across the globe! His support and belief in me gave me the confidence to pursue this
research, and his guidance has helped me grow (I am also grateful for his understanding
and concern after my house burnt down with my research in it).
I would like to thank Massey University for funding which permitted me to do my research
in India.
This project would not have been the product it is without those who assisted in my
research, particularly those in Yercaud: Razak, Mr Mohan Rajes, Mr and Mrs Joel, Cletus,
Emmanuel, Janet, Mr Jayaprakash and team, Dr Joseph, Mother Louis, Sister Melice, Dr
Rajendran (staff and family), Shaw Nawaz, Mr Sugirtharaj, Altamoush and many others.
I would like to thank my family, friends, flatmates and colleagues in the department who
have been extremely supportive. I especially want to thank my parents and siblings for all
their support over the years. I would not be where I am today without them.

iii
Table of Contents
CHAPTER 1: Introduction _____________________________________________________________ 1
1.1 Background _____________________________________________________________________ 1
1.2 Problem Statement _____________________________________________________________ 2
1.3 Aim of Research ________________________________________________________________ 3
1.4 Objectives _______________________________________________________________________ 3
1.5 Limitations of the Study _______________________________________________________ 3
1.6 Contribution to Knowledge ____________________________________________________ 4
1.7 Thesis Outline __________________________________________________________________ 5
CHAPTER 2: Research Site ____________________________________________________________ 6
2.1 National Setting _________________________________________________________________ 6
2.1.1 Study Site – Yercaud Taluk _______________________________________________ 8
2.2 Environment ____________________________________________________________________ 9
2.2.1 Geography __________________________________________________________________ 9
2.2.2 Climate ____________________________________________________________________ 13
2.2.3 Flora and Fauna __________________________________________________________ 14
2.2.4 Forest Vegetation _________________________________________________________ 18
2.3 Community _____________________________________________________________________ 19
2.3.1 Culture and History ______________________________________________________ 20
2.4 Local Economy _________________________________________________________________ 23
2.4.1 Infrastructure and Development ________________________________________ 25
2.5 Tourism ________________________________________________________________________ 27
2.5.1 Tourist Attractions _______________________________________________________ 28
2.6 Summary _______________________________________________________________________ 28
CHAPTER 3: Literature Review ______________________________________________________ 29
3.1 Tourism ________________________________________________________________________ 29
3.1.1 Definition __________________________________________________________________ 29
3.1.2 Travel-based Tourism Types ____________________________________________ 30
3.1.3 Tourist Classification and Typologies ___________________________________ 31
3.1.4 Tourist Destination _______________________________________________________ 33
3.1.5 Sustainability _____________________________________________________________ 34

iv
3.1.5.1 Impact on Environment _____________________________________________ 36
3.1.5.2 Impact on Community ______________________________________________ 39
3.1.5.3 Impact on Economy _________________________________________________ 42
3.1.6 Tourism in India __________________________________________________________ 45
3.2 Poverty _________________________________________________________________________ 46
3.2.1 Definitions ________________________________________________________________ 46
3.2.1.1 Poverty _______________________________________________________________ 46
3.2.1.2 Absolute Poverty ____________________________________________________ 47
3.2.1.3 Relative Poverty _____________________________________________________ 47
3.2.2 Causes of Poverty ________________________________________________________ 48
3.2.3 Indicators of Poverty _____________________________________________________ 49
3.2.4 Measuring Poverty _______________________________________________________ 51
3.2.5 Alleviation Strategies ____________________________________________________ 52
3.3 Conservation __________________________________________________________________ 53
3.3.1 Definition _________________________________________________________________ 53
3.3.2 Ecosystem Services ______________________________________________________ 53
3.3.3 Importance of Biodiversity ______________________________________________ 54
3.3.4 Reasons for Biodiversity Loss ___________________________________________ 54
3.3.5 Strategies _________________________________________________________________ 55
3.4 Conflict between Poverty Alleviation and Conservation Efforts __________ 56
3.5 Ecotourism _____________________________________________________________________ 56
3.5.1 Definition _________________________________________________________________ 56
3.5.2 Ecotourism vs. Other Forms of Tourism _______________________________ 57
3.5.3 As a Conservation and Poverty Alleviation Strategy __________________ 59
CHAPTER 4: Research Methods _____________________________________________________ 60
4.1 Research Design _______________________________________________________________ 60
4.2 Questionnaire design _________________________________________________________ 61
4.2.1 Tourist Questionnaires __________________________________________________ 62
4.2.2 Resident Questionnaires _________________________________________________ 63
4.3 Pretesting, Pilot Study and Implementation ________________________________ 64
4.3.1 Tourists ___________________________________________________________________ 64
4.3.2 Residents __________________________________________________________________ 64

v
4.4 Sample Design and Implementation _________________________________________ 66
4.4.1 Tourists ___________________________________________________________________ 66
4.4.1.1 Bias ___________________________________________________________________ 67
4.4.2 Residents __________________________________________________________________ 67
4.4.2.1 Bias ___________________________________________________________________ 68
4.5 Interview Design ______________________________________________________________ 68
4.5.1 Bias ________________________________________________________________________ 71
4.6 SWOT Analysis _________________________________________________________________ 71
4.7 Attractions Inventory _________________________________________________________ 71
4.8 Personal Observations ________________________________________________________ 72
4.9 Research Ethics ________________________________________________________________ 73
4.10 Limitations __________________________________________________________________ 74
4.10.1 Data Collection _________________________________________________________ 74
4.10.2 Sampling ________________________________________________________________ 74
4.10.3 Questionnaires _________________________________________________________ 75
4.10.4 Respondents ____________________________________________________________ 75
CHAPTER 5: Data Analysis and Results _____________________________________________ 76
5.1 Analysis ________________________________________________________________________ 76
5.1.1 Questionnaires ____________________________________________________________ 77
5.1.1.1 Editing and Missing Data____________________________________________ 77
5.1.1.2 Descriptive Statistics ________________________________________________ 79
5.1.1.3 Contingency Tables __________________________________________________ 80
5.1.1.4 Correlation ___________________________________________________________ 80
5.1.2 Interviews _________________________________________________________________ 80
5.2 Questionnaire Results _________________________________________________________ 81
5.2.1 Tourist Surveys ___________________________________________________________ 81
5.2.1.1 Tourist Profile _______________________________________________________ 82
5.2.1.2 Tourist Trip Characteristics ________________________________________ 85
5.2.1.3 Tourist Group Characteristics ______________________________________ 88
5.2.1.4 Tourist Movements __________________________________________________ 91
5.2.1.5 Tourist Attitudes ____________________________________________________ 94
5.2.2 Resident Surveys _________________________________________________________ 99

vi
5.2.2.1 Resident Characteristics ____________________________________________ 99
5.2.2.2 Household Characteristics ________________________________________ 104
5.2.2.3 Resident-Environment Interactions _____________________________ 107
5.2.2.4 Resident-Tourism Interactions __________________________________ 108
5.3 SWOT Results ________________________________________________________________ 110
5.4 Attractions Inventory _______________________________________________________ 113
CHAPTER 6: Discussion ____________________________________________________________ 121
6.1 Socio-environmental and Tourism Issues _________________________________ 121
6.1.1 Environment ____________________________________________________________ 121
6.1.1.1 Environmental Threats and Issues ______________________________ 121
6.1.1.2 Environment-animal-community Interactions and Conflict ___ 128
6.1.2 Community _____________________________________________________________ 129
6.1.2.1 Social Issues _______________________________________________________ 130
6.1.2.2 Tourist Related Issues ____________________________________________ 141
6.1.3 Tourism _________________________________________________________________ 142
6.1.3.1 Issues Facing Tourism ____________________________________________ 143
6.1.3.2 Issues with Tourism_______________________________________________ 144
6.1.3.3 Development Required ___________________________________________ 145
6.2 Supply ________________________________________________________________________ 148
6.2.1 Environment ____________________________________________________________ 148
6.2.2 Community _____________________________________________________________ 152
6.3 Demand ______________________________________________________________________ 157
6.3.1 Current Tourist Trends ________________________________________________ 157
6.3.1.1 Destination Attractivity ___________________________________________ 157
6.3.1.2 Tourist Preferences _______________________________________________ 158
6.3.1.3 Tourist Satisfaction _______________________________________________ 158
CHAPTER 7: Conclusions & Recommendations __________________________________ 161
7.1 Issues and Recommendations ______________________________________________ 161
7.1.1 Environment ____________________________________________________________ 161
7.1.2 Community _____________________________________________________________ 163
7.1.3 Tourism _________________________________________________________________ 166
7.2 Conclusions __________________________________________________________________ 168

vii
7.3 Further Research ____________________________________________________________ 168
References _____________________________________________________________________________ 170
Appendices _____________________________________________________________________________ 179
List of Figures
Figure 1: Map showing location of Yercaud Taluk in India and Yercaud Taluk as
outlined in green. _________________________________________________________________________ 8
Figure 2: Historic view of Big Lake (Nicholas and Company, 1875). ________________ 11
Figure 3: View of Big Lake in the 80s-90s (Unknown, n.d.). _________________________ 11
Figure 4: Recent view of Big Lake (Peter, 2012). _____________________________________ 12
Figure 5: Yercaud temperature averages and extremes based on the last 20 years
(Weather2, 2013). _______________________________________________________________________ 13
Figure 6: Leopard shot near Small Lake (Unknown, 1928). _________________________ 15
Figure 7: Unidentified example of one of the species of frog observed in Yercaud. 16
Figure 8: Unidentified crab species found in Yercaud. _______________________________ 16
Figure 9: Vegetation types of Shevaroyan Hills (Balaguru et al., 2006). ____________ 19
Figure 10: Historic photo of a group of Malaiyalis. Males can be seen wearing the
kambli draped over their shoulders (Thurston, 2004). ______________________________ 22
Figure 11: Modern photo of group of Malaiyalis. _____________________________________ 22
Figure 12: Silver Oak monoculture in Yercaud Asambur (Unknown, n.d.). _________ 24
Figure 13: Fishing on Yercaud Lake (Unknown, n.d.). ________________________________ 25
Figure 14: Age groups of surveyed tourists visiting Yercaud Taluk. ________________ 83
Figure 15: Combined annual household incomes of tourists visiting Yercaud Taluk.
____________________________________________________________________________________________ 84
Figure 16: Highest level of education of tourists visiting Yercaud Taluk. ___________ 84
Figure 17: Number of visits made to Yercaud by repeat visitors. ___________________ 86
Figure 18: Total expenditure for tourists visiting. ____________________________________ 87
Figure 19: Tourist state of origin in India. _____________________________________________ 88
Figure 20: Location of most common tourist origin in relation to Yercaud. ________ 89
Figure 21: Travel party types. __________________________________________________________ 91
Figure 22: Tourist attractions visited. _________________________________________________ 91

viii
Figure 23: External transportation options used by tourists to reach Yercaud. ___ 92
Figure 24: Overnight accommodation used by tourists. _____________________________ 93
Figure 25: Destination factors showing mild correlation. ___________________________ 95
Figure 26: Moderately related tourist activities and services. ______________________ 97
Figure 27: Correlated tourist experiences. ____________________________________________ 99
Figure 28: Distribution of surveyed residents' ages. _______________________________ 101
Figure 29: Number of years of education undergone by residents. _______________ 101
Figure 30: Work areas of residents within Yercaud Taluk _________________________ 102
Figure 31: Residents’ combined monthly household income. _____________________ 105
Figure 32: Number of households with individuals employed in various fields. 105
Figure 33: Total number of sources of income for residents. ______________________ 106
Figure 34: Debt or savings based on household income and expenditure. _______ 107
Figure 35: Level of tourist interaction during the past year. ______________________ 109
Figure 36: Tourist attractions located near Yercaud town centre. ________________ 113
Figure 37: Tourist attractions located away from Yercaud town centre. _________ 114
Figure 38: Location of villages visited in Yercaud Taluk. __________________________ 120
Figure 39: Remaining shola forest within Yercaud Town. _________________________ 123
Figure 40: Location of a rubbish dump in Yercaud town relative to Big Lake and
surrounding settlements (Google, 2013). ___________________________________________ 127
Figure 41: Outside wall of rubbish dump with some garbage spill over. _________ 127
Figure 42: Living conditions of those in Melalaganburam. ________________________ 131
Figure 43: Inside a villager's mud house with an open flame being used for lighting.
__________________________________________________________________________________________ 133
Figure 44: Distribution of shares of LPG across differing household income groups
(Ministry of Finance, 2013). __________________________________________________________ 138
Figure 45: Young boy observed helping with road construction work. __________ 140
Figure 46: Example of public rubbish bin found in Yercaud. ______________________ 141
Figure 47: Papilio polymnestor (Blue peacock) observed near Asambur. ________ 149
Figure 48: Walking path to Keeraikkadu. ___________________________________________ 149
Figure 49: Traditional implement used to remove husks from grains like chamai.
__________________________________________________________________________________________ 153
Figure 50: Traditional blacksmith at work with products in foreground. ________ 154

ix
Figure 51: Traditional method of cleaning pulping coffee. _________________________ 155
Figure 52: Traditional tribal tattoos worn only by women. _______________________ 156
Figure 53: Example of locally made product. Made from coffee plant trunks and
unique to the area. ____________________________________________________________________ 159
List of Tables
Table 1: Documented fauna species on the Shevaroyan Hills. _______________________ 16
Table 2: Endemic flora species and their distribution (Balaguru et al., 2006). _____ 17
Table 3: Status of IUCN red list plant species (Balaguru et al., 2006). ______________ 17
Table 4: 2011 Yercaud Taluk census data comparing rural and urban populations
(Government of India, 2011). __________________________________________________________ 20
Table 5: 2001 Yercaud Taluk population characteristics (Government of India,
2001). ____________________________________________________________________________________ 20
Table 6: Educational Facilities in Yercaud Taluk (Government of India, 2001). ___ 26
Table 7: Medical Facilities in Yercaud Taluk (Government of India, 2001). ________ 26
Table 8: Potable Water Sources in Yercaud Taluk (Government of India, 2001). __ 26
Table 9: Tourist attractions found in Yercaud Taluk. ________________________________ 28
Table 10: Potential negative environmental impacts associated with tourism in
protected areas. _________________________________________________________________________ 38
Table 11: Interview Guidelines. ________________________________________________________ 70
Table 12: Tourist profile. _______________________________________________________________ 82
Table 13: Tourist trip characteristics. _________________________________________________ 85
Table 14: Length of tourist stay vs. tourist arrival day. ______________________________ 86
Table 15: Tourist city of origin. ________________________________________________________ 89
Table 16: Length of stay vs. state of origin. ____________________________________________ 90
Table 17: Group characteristics. _______________________________________________________ 90
Table 18: Tourist transport used within Yercaud. ____________________________________ 93
Table 19: Yercaud destination attractivity factors affecting tourist choice. ________ 94
Table 20: Important activities and services associated with tourist holidays. _____ 96
Table 21: Tourists’ satisfaction of their experiences in Yercaud. ____________________ 98

x
Table 22: Resident characteristics. __________________________________________________ 100
Table 23: Age group vs. number of days worked per month. ______________________ 102
Table 24: Alternative skill areas as indicated by residents. _______________________ 103
Table 25: Resident household characteristics. ______________________________________ 104
Table 26: Sources of household income. ____________________________________________ 106
Table 27: Resident environmental perceptions. ____________________________________ 108
Table 28: Tourism interaction characteristics. _____________________________________ 109
Table 29: Resident skill areas which can be applied towards tourist activities and
services. ________________________________________________________________________________ 110
Table 30: SWOT for developing ecotourism in Yercaud Taluk. ____________________ 112
Table 31: Attractions inventory (natural). __________________________________________ 114
Table 32: Attractions inventory (cultural). _________________________________________ 117
Table 33: Evaluation of tourist attractions in Yercaud Taluk. _____________________ 119
Table 34: Development and issues with current attractions. ______________________ 145
Table 35: Tourist attractions and their assessed current and potential use for
tourism. ________________________________________________________________________________ 150
Table 36: Environmental issues and recommendations. __________________________ 162
Table 37: Social issues and recommendations. _____________________________________ 164
Table 38: Tourism related issues and recommendations. _________________________ 167

1
CHAPTER 1: INTRODUCTION 1.1 Background
Tourism is the fastest growing and largest economic sector worldwide and over
the period of 2011-2012, international tourist arrivals reached over 1 billion
(UNWTO, 2013). Countries seeking a tool to aid in the development of their
economy are therefore looking to tourism, as this industry continues to grow.
However, large influxes of tourists can result in negative impacts upon the three
pillars of sustainability, namely, environment, society and economy. Mass tourism
and its impacts can be observed worldwide and are the worst in popular tourist
destinations that have not adequately planned for sustainable development.
Damaging the three pillars of sustainability threatens the destination’s ability to
provide valuable ecosystem functions and services, as well as the potential for
continued tourism. Yercaud is a popular tourist destination and has experienced
increasing economic growth and tourist interest in the last few decades.
Consequently, a greater desire has emerged to develop tourism and this has
resulted in increased pressure on ecosystems that, in turn, exacerbate socio-
environmental issues in the area.
Ecotourism is a form of tourism that was officially defined in the 1980s. Since then,
it has been evolving and current ideal ecotourism practices promote sustainable
tourism; tourism which considers “its current and future economic, social and
environmental impacts, addressing the needs of visitors, the industry, the
environment and host communities” (World Tourism Organization, 2005). With
destinations facing increasing rates of poverty and degradation of environments,
the need for a win-win solution is necessary. As such, ecotourism is a potential
solution that could help contribute to poverty alleviation and conservation efforts
and help encourage more sustainable development.

2
1.2 Problem Statement
Yercaud is a popular domestic tourist destination. However unsustainable human
activities and practices, both past and present, have negatively impacted the
environment resulting in: micro-climatic changes; significant loss of flora and
fauna (biodiversity); environmental degradation and poor living conditions for a
proportion of the population (Balaguru, John Britto, Nagamurugan, Natarajan, &
Soosairaj, 2006; Saravanan & Rao, 2012). Economic activities, including tourism in
its current state, are not sustainable and threaten remaining biodiversity.
Previous studies have showed that much of the forest is highly degraded despite
its protection status as a reserve forest (Balaguru et al., 2006; Jayakumar,
Ramachandran, Bhaskaran, & Heo, 2009). Impoverished residents are in a
situation of being unable to improve their situations and may be contributing to its
degradation in order to subsist.
Other studies have highlighted that: further research is required into tourism
development in Yercaud; economic benefits are not evenly distributed with
vulnerable communities seeing little to no benefits from tourism growth; and joint
conservation and social development strategies are required (Balaguru et al.,
2006; Kadavul & Parthasarathy, 1999; Meganathan, Selvakumar, Prabu, Pandian, &
Kumar, 2009; Saravanan & Rao, 2012).
In situations where tourist destinations have unsustainable development,
environmental degradation and poverty are common. This case study identifies the
need to create an alternative activity that people can participate in and is more
environmentally conscious. As a predominantly nature orientated destination,
Yercaud has the potential to be a sustainable ecotourist destination which would
help to reduce poverty and protect the environment. However, little research has
been conducted to contribute towards this goal by assessing the potential for
ecotourism, or justifying the need for sustainable development through identifying
social and environmental problems.

3
1.3 Aim of Research
The aim of this research is to investigate whether ecotourism is a feasible ‘win-win’
solution for aiding vulnerable communities and conservation in the area through
identifying demand, supply and resources for development.
1.4 Objectives
1. Identify vulnerable communities and assess their living conditions
2. Identify environmental problems in the area
3. Evaluate existing tourist attractions
4. Identify undeveloped local resources for ecotourism development
5. Determine potential for community involvement in ecotourism
6. Identify current tourist market
7. Determine the potential demand for ecotourism
1.5 Limitations of the Study
Published information regarding the state of the environment of Yercaud Taluk is a
limiting factor, consequently personal observations and communications were
used in this study. As such, statements about the state of the environment have
limited scientific evidence and may not provide a complete background to the
condition of biodiversity in the area.
Time and funding limitations meant that questionnaires were conducted during
the off-peak tourism season, at major tourist attractions and different
accommodation types. The results presented may be biased or limited in the
applicability of tourist responses if significant differences exist between tourists
visiting patterns. Similarly, the condition of tourist attractions and facilities may
not be applicable for the entire year. Some attractions and facilities appeared to be
under poor maintenance, but might be better maintained during peak tourism

4
seasons. Responses may also differ if particular groups of tourists were excluded
because they did not frequent the survey locations.
Residential data is subject to bias due to the nature of the situation and sampling
method. Villagers may have exaggerated or responded inaccurately to economic
questions believing that they could receive financial benefits if they appeared to be
struggling. Additionally, they may have feared facing repercussions for activities
which are restricted or illegal despite questionnaires remaining anonymous.
Resource constraints and accessibility were limiting factors in village selection for
administering surveys. It was not feasible to visit villages that were very difficult to
reach, due to remoteness or lack of proper roads. Resident results presented may
be biased and may not be a representative sample of the target population.
With regards to applying this research to implementing ecotourism, this study
instigates part of the examination required to develop ecotourism in the Yercaud
Taluk. Attempts to utilise the results and conclusions from this research to
implement ecotourism, without further research or proper consideration, risks
jeopardising opportunities for genuine conservation and poverty alleviation
efforts. Findings are incomplete with regards to all the information required for
successful application of authentic ecotourism. To complete the tourism
assessment process in Yercaud Taluk, an assessment of the following areas should
be included: the supporting infrastructure and services; overall competitiveness of
Yercaud; human resource and institutional capacity; and costs and benefits
associated with the project.
1.6 Contribution to Knowledge
The Shevaroyan Hills on which Yercaud Taluk is situated are an important
biogeographic region with a deficiency in literature concerning its environment,
community and economic activities. This study contributes to knowledge
surrounding ecotourism; in particular, it focuses on the assessment of the potential
for ecotourism at a destination in an Indian setting. Majority of ecotourism cases
deal with the efficacy of an ecotourism project or the changes associated with it
following its implementation. Examples of the tourism assessment process are not

5
common in the literature, including the assessment of the feasibility and potential
for ecotourism at a destination prior to implementation. This research enriches
literature regarding ecotourism as a possible strategy for dual poverty alleviation
and conservation. It also analyses current conditions and development that would
be required.
1.7 Thesis Outline
Chapter 1: Introduces the research and provides an outline of the problem being
researched and covers the research aim, objectives, limitations, contribution to
knowledge and outline of the thesis.
Chapter 2: Describes the research site, Yercaud Taluk and highlights key
environmental, social and economic aspects of the destination and provides
evidence showing the need for investigation into sustainable economic activities in
the area.
Chapter 3: Examines relevant literature and covers concepts required for the
research. It provides background information about tourism, ecotourism, and
poverty alleviation and conservation. Poverty alleviation and conservation
strategies are compared and contrasted.
Chapter 4: Outlines the processes and methods completed to carry out the
research. The tools used to gather data and analyses are explained.
Chapter 5: Presents results. Data is rendered in the form of descriptive statistics
and contingency tables
Chapter 6: Discusses the results over three main categories: issues, supply and
demand. These are examined in the research context of: environmental,
community and tourism issues; environmental and community-based supply; and
current tourism and ecotourism demand.
Chapter 7: Draws conclusions about the feasibility of implementing ecotourism in
the Yercaud Taluk and provides recommendations. Details further research
required to implement valid ecotourism practices.

6
CHAPTER 2: RESEARCH SITE The first chapter outlined the issue facing the case study site and that of tourist
destinations around the world. This chapter explores this problem in the context of
the case study by describing the research site. A description of the state of the
environment, community, and economy is provided based on information gathered
from the literature and personal observations. This background highlights tourism
features and growing environmental and socioeconomic issues found in the area
by also exploring historic accounts. Various issues were apparent during the
research period which helped reinforce the necessity for this research.
The chapter is divided into several sub-headings to span information about
existing features and characteristics of the area. Subjects covered include: site
description, including a national overview; environmental features, such as climate
and biodiversity; social components including history and culture; economic
activities and their impacts; and tourism features and trends. Insight into the area
provides justification for the research and methods implemented. It was also a
guide for what key data to pursue, as well as which methods and tools would be
best suited for the destination.
2.1 National Setting
India has one of the largest and most diverse economies in the world. However,
due to its large population, it is also one of the poorest (“India,” 2013). It is the
second most populous country with a July 2013 estimate of 1.2 billion (CIA, 2013).
The World Bank uses two poverty lines based on purchasing power parity (PPP) to
assess levels of poverty and absolute poverty. PPP is a technique to determine a
currency value that would be equivalent to each country’s purchasing power after
taking into account the exchange rates between them. Using PPP permits the
adoption of an international poverty line, which can be applied to different
countries and allows for global comparisons. In 2010, 32.7% of the Indian
population lived below the international poverty line of $1.25 per day (PPP);
concurrently 68.7% of the population lived on less than $2 per day (PPP) (World

7
Bank, 2013). While there have been improvements in the proportion of people
living under $1.25 a day, the total number has still increased. In 1981, the poverty
rate as a ratio of the total population was 60%, which decreased to 42% in 2005
this equated to 421 million and 456 million people, respectively (Mozumder &
Tuck, 2008).
Other concerns include the various environmental issues which can be found in the
country. Ecological issues that can be seen in the country include deforestation,
soil erosion, desertification, air pollution, water pollution, and biodiversity loss
(CIA, 2013). India has 614 animal species and 321 plant species listed as critically
endangered, endangered or vulnerable in the 2012 IUCN Red List of threatened
species (IUCN, 2012). The most vulnerable groups - those suffering from poverty -
often heavily depend on the environment to create a livelihood. When
environmental health decreases, they are commonly the worst affected as they
may be unable to subsist on the land they depend on (Khatri, n.d.). The added
impacts of climate change create additional strains for this group (World Bank,
2013).
Tamil Nadu is one of 28 states and is located at the southernmost part of the
peninsula. It is the eleventh largest state, with two major geographic features: the
Western Ghats’ Nilgiri hills (an important biodiversity hotspot in India) and the
lower Eastern Ghats (Anonymous, 2003). Socially, it fares better than northern
states; human development indicators for this state are comparable to those in
developed countries (World Bank, 2011). Furthermore, poverty rates in this state
are lower compared to overall rates for the country (17.1% and 29.8% total
poverty rates respectively for 2009-2010). 2009-2010 rural-urban ratios for this
state are also better compared to overall country performance, with 21.2% and
12.8% of Tamil Nadu’s rural and urban population respectively being under the
poverty line. These rates are lower than national figures for rural and urban
poverty, at 33.8% and 20.9% respectively (Ministry of Finance, 2013). These
figures are derived from a poverty line definition based on monthly per capita
consumption expenditure (MPCE), which computes national poverty lines at Rs

8
673 for rural areas and Rs 860 for urban areas. Both these rates are equivalent to
less than USD$0.50 a day (Ministry of Finance, 2013).
2.1.1 Study Site – Yercaud Taluk
The Eastern Ghats run parallel to India’s East Coast and constitute an important
biogeographic region, despite being a broken mountain range. It is identified as an
area of major plant diversity with a variety of unique floral species (Miller, 2009),
and is home to many endangered native flora and fauna; 100 of the 3,000 species
of flowering plants found in the area are known to be endemic to the region
(Miller, 2009). The Eastern Ghats is made up of several forest vegetation types.
Increased economic activities along coastal regions have led to exploitation of
these unique forest ecosystems for wood fuel and fodder purposes (Miller, 2009).
Yercaud is one of nine Taluks (an administrative division) located in the Salem
District. It is situated on the Servarayan (anglicised as Shevaroy or Shevaroyan)
Hills which are found on the lower Eastern Ghats, in northern Tamil Nadu
(Saravanan & Rao, 2012). It was, and still is, one of the major hill stations in India
(Baker, 2009). Figure 1 shows the location of the Taluk relative to state and
national boundaries.
Figure 1: Map showing location of Yercaud Taluk in India and Yercaud Taluk as outlined in green.

9
The administrative extent of the Taluk is 382.75 km2, making it the smallest in the
District (Government of India, 2001). However, the Shevaroyan Hills extend
further to encompass an area of 469.9 km2 (Balaguru et al., 2006). The Taluk is
further divided into nine Panchayats. The main town is also known as Yercaud and
most allusions to Yercaud refer to the town rather than the whole Taluk. As a
Taluk, Yercaud has much to offer - the 2011 census identifies 87 villages, inclusive
of the town and 25 villages within the Reserve Forest (Government of India, 2011).
Information regarding these villages is hard to find, as previous government
records claim they are uninhabited. Discounting these 25 Reserve Forest villages
leaves 62 villages, according to the census. On the other hand, other records list
between 63–108 villages. However, most residents and records identify 67 villages
in the Taluk. During fieldwork, additional villages were visited, which could not be
found in other records. Thus, the exact number of villages is difficult to ascertain. A
list of Panchayats and their respective villages can be found in Appendix 1. The list
is based on census data and personal observations.
2.2 Environment
The Shevaroyan Hills are not a biodiversity hotspot like the Western Ghats, due to
their broken geography and drier climate, but locally are an important site. The
presence of Reserve Forest (which constitutes a protected area) amongst a drier
agricultural landscape adds weight to its local import.
2.2.1 Geography
As a hill station, Yercaud sits at an elevation approximately 1200 m higher than the
surrounding plains. Its highest peak is at the Shevaroyan Temple, on Cauvery Peak,
at a height of approximately 1623 m above sea level (Google Earth, 2013).
The Sanyasimalai reserve forest is located on the slopes of the Shevaroyan Hills
and is counted as part of the Taluk (Balaguru et al., 2006; “Shevaroy Hills,” 2013).
The soil type in the area has been classified as ‘red loamy and lateritic’ and is
common in tropical rainforests. While deep, these soils are predisposed to leaching
and thus have low fertility.
10
Archaean crystalline rock - such as amphibolite, leptinite, garnetiferous granite
and charnockite - make up the area along with bauxite and magnesite mineral
resources. Bauxite, magnesite and granite are important resources in the area
providing the basis for mining and quarrying in the area. The laterite on the
Shevaroys was found to have considerable bauxite stocks, mostly in six hilltops.
The flat tops of these hills were at elevations of about 1800 m and were deemed to
have the best source of bauxite reserves (Geological Survey (U.S.), 1986).
Yercaud town has two lakes, Big Lake (Emerald Lake) and Small Lake (Ornamental
Lake). A historic photograph of Big Lake can be seen in Figure 2 while Figure 3
shows Big Lake in the 1980s-1990s. Figure 4 is a view of the lake in 2012 showing
the considerable development that has taken place within the last two to three
decades. Both of these are natural lakes in comparison to the artificially created
lake at Ooty (Anonymous, 2003), a more popular hill station visited by tourists.
However, a 2006 study showed that the Yercaud Lake had high counts of faecal
contaminants and were not suitable for drinking or recreational purposes. This can
indicate that there are serious water borne problems that can pose a threat to
human and animal health (Rajakumar, Velmurugan, Shanthi, Ayyasamy, &
Lakshmanaperumalsamy, 2006).

11
Figure 2: Historic view of Big Lake (Nicholas and Company, 1875).
Figure 3: View of Big Lake in the 80s-90s (Unknown, n.d.).

12
Figure 4: Recent view of Big Lake (Peter, 2012).
In addition to the two lakes in Yercaud, there are several smaller lakes and bodies
of water around the Taluk, which many villagers rely on for water. A second study
was conducted to investigate water quality around the Taluk. At the 25 sites
sampled around various villages, several exceeded safe fluoride levels as outlined
by the World Health Organisation (WHO). 20% of pre-monsoon and 16% post-
monsoon season samples indicated poor water quality, and 8% of pre-monsoon
season water samples were very poor quality (Florence, Paulraj, &
Ramachandramoorthy, 2012). Water quality around the Taluk varies and it is
important to note that the most important body of water, tourism-wise, has poor
environmental health to the extent that it poses a health risk to people.

13
2.2.2 Climate
Yercaud has always been popular for its climate as it is more temperate than the
surrounding plains. The local tourism guide implies Yercaud’s climate is better
than other hill stations, such as Ooty and Kodaikanal, because it’s lower altitude
makes it less cold and damp (Rotary Yercaud, n.d.). The summer season starts in
March and extends to June, and is the most popular season for tourists to visit,
while winter extends from October to February.
Temperature records appear to vary. The official Tamil Nadu Tourism website
provides an average temperature of 13 °C to 30 °C with a maximum temperature of
30 °C. A climate profile based on data from the past two decades can be seen in
Figure 5. It shows the average high and low temperatures for each month,
including maximum and minimum recorded temperatures. As can be seen, the
average minimum temperature tends to stay above 20 °C; lower temperatures are
recorded as extremes rather than the norm. Historically, however, the weather
would remain a maximum average of 23 °C and would fall to a minimum of 16 °C
or less (Wilson, 1888) and shows how the climate has changed over the last
century.
Figure 5: Yercaud temperature averages and extremes based on the last 20 years (Weather2, 2013).
The mean annual rainfall is 1638 mm with 850 mm for the foot hills (Balaguru et
al., 2006). This matches with a historical figure that states rainfall averaged about

14
1650 mm (Wilson, 1888). However, during 2012, rainfall in Yercaud was less than
half this amount. There are two monsoons which are responsible for most of the
rainfall in Yercaud - the southwest and northeast monsoons - which occur mostly
between the months of July to September (Rotary Yercaud, n.d.). However, the
Western Ghats block much of the rain-bearing clouds from the South West. As
such, the Eastern Ghats, and thus the Shevaroyan Hills, are drier in comparison and
not as lush (Anonymous, 2003).
2.2.3 Flora and Fauna
Over the last several decades, human activities have greatly diminished the
diversity of flora and fauna species present on the hills. A historic account written
by Francesca Wilson, a European resident of the Shevaroyan Hills in the late 1800s,
highlights the awe she and her companions felt as they viewed the landscapes and
forests of these hills. While it does not provide extensive descriptions about the
different species found in the area, it does show that species of current interest
were prevalent in the area, but have since become locally extinct.
Wilson states that at the time when the hills were first being developed around
1825, they were entirely “covered with deep forest, and were full of wild beasts,
tigers, panthers, bison, bears, hyenas, wild pig etc.” (Wilson, 1888, p. 32). Figure 6
shows a leopard that was shot near Small Lake - further proof of the presence of
these now-endangered animals in the Shevaroyan Hills.

15
Figure 6: Leopard shot near Small Lake (Unknown, 1928).
Jackals, porcupines, deer, flying fox (fruit bats) and pythons were other common
animals found in these hills, but it is difficult to say whether they are still present.
Human activities, degradation of the forest, and lack of understanding mean that
local fauna are met with hostility. In addition, the current state of their habitats
cannot support the species that were once found in the area.
The main fauna species that can be found on the Shevaroyan Hills can be seen in
Table 1. Additionally, there are: approximately 121 species of birds (the complete
list can be found in Appendix 3), at least one species of crab, numerous insects and
various frog species (one of which is shown in Figure 7). There are no studies on
fauna present on these hill ranges, and communications with locals have not
provided definitive evidence of the presence of many other species. As such, they
have not been mentioned in this work. The choice to exclude these species is based
on the fact that many residents believe that they are still present without concrete
evidence. In turn, this may cause experts and officials to incorrectly believe that
these fauna species are still extant in the area and thus there is no need for
management to ensure their continued existence locally.

16
Table 1: Documented fauna species on the Shevaroyan Hills.
Common Name Scientific Name Comment
Rufous horseshoe bat Rhinolophus rouxii New phonic type
Gaur, Indian bison Bos gaurus Vulnerable listing on IUCN Red List
Madras tree shrew Anathana ellioti Not vulnerable, however, are uncommon to see
Indian palm squirrel Funambulus palmarum Very common, starting to become pests
Yercaud day gecko Cnemaspis yercaudensis New species described in 2000
Beddome's Coral Snake Calliophis beddomei Data deficient
Southern Ghats Slender Gecko Hemiphyllodactylus aurantiacus Least concern
Figure 7: Unidentified example of one of the species of frog observed in Yercaud.
Figure 8: Unidentified crab species found in Yercaud.
On the other hand, flora species have been more closely studied in this area, with a
number of studies investigating the uses of ethnomedicinal plants from the region.
Balaguru et al. (2006), identify 322 plant species;Table 2 shows the 24 species that

17
are endemic, while Table 3 shows the status of the IUCN red-listed plant species
found on the Shevaroyan Hills.
Table 2: Endemic flora species and their distribution (Balaguru et al., 2006).
Distribution Species Name
Local Endemic (endemic to Eastern Ghats
Crotalaria shevaroyensis
Regional Endemic (endemic to Peninsular India) Peperomia dindigulensis, Vaccinium neilgherrense Miliusa
eriocarpa, Litsea oleoides, Neolitsea scrobiculata, Curcuma
neilgherrensis, Eranthemum capense, Dolichandrone arcuata
Indian Endemic (endemic to India) Neonotonia wightii, Elaeagnus indica, Decalepis hamiltonii,
Jasminum trichotomum, Ixora notoniana, Pavetta blanda,
Psychotria octosulcata, Randia candolleanavar.candolleana,
Wendlandia angustifolia, Mallotus stenanthus, Tetrastigma
sulcatum, Pamburus missionis, Leucas diffusa, Shorea
roxburghii, Chionanthus mala-elengi
Table 3: Status of IUCN red list plant species (Balaguru et al., 2006).
Species Name Red listed categories
Buchanania lanzan
Celastrus paniculatus
Cycas circinalis
Decalepis hamiltonii
Gloriosa superba
Nothopegia colebrookiana
Pseudarthria viscida
Santalum album
Sapindus emarginata
Smilax zeylanica
Terminalia arjuna
Gardenia gummifera
Michelia champaca
Symplocos cochinchinensis
Rubia cordifolia
Gnetum edule
Naravelia zeylanica
Hemidesmus indica
Withania somnifera
Stephnia japonica
Evolvulus alsinoides
Gymnema sylvestre
Vernonia arborea
Polystachya concreta
Lower risk
Vulnerable
Threatened
Endangered
Lower risk
Data Deficient
Lower risk
Endangered
Lower risk/Least concerned
Vulnerable
Lower risk
Endangered
Vulnerable
Lower risk
Critically endangered
Endangered
Vulnerable
Vulnerable
Vulnerable
Vulnerable
Lower risk
Vulnerable
Endangered
Endangered

18
Of particular interest is the species Vernonia shevaroyensis, which is not included
on this list. Only two wild specimens have been found on the Shevaroy hills. To
date, no other specimens of this species has been found elsewhere, although it has
been successfully propagated by the BSI institute in Yercaud for conservation
(Rajannan, 1992). However, there exists very little information or research
available about this species to ascertain its importance or status.
2.2.4 Forest Vegetation
Wilson (1888) once described the shola - a forest type consisting of dense mixed
evergreen and semi-evergreen forest found in mountain regions of southern India
- as a beautiful attraction well worth seeing. In particular, Wilson commented that
trees were a great feature of the Shevaroyan Hills as there were many of
“extraordinary size and beauty”. The Shevaroyan Hills have been found to share
some major species in common with the shola of the Western Ghats making it the
only hill range on the Eastern Ghats to exhibit this characteristic (Balaguru as cited
in Balaguru et al., 2006).
49.5% (232.61 km2) of the Shevaroyan Hills is covered in forest of varying types.
However, these forests are isolated in that they occur in very small patches, are not
extensive as they once were, and are badly degraded. They are more prone to
damage due to the large extent of forest that is in close proximity to human
activities, especially harmful activities like mining (Balaguru et al., 2006). Other
human activities in the area, such as logging, burning and grazing animals have
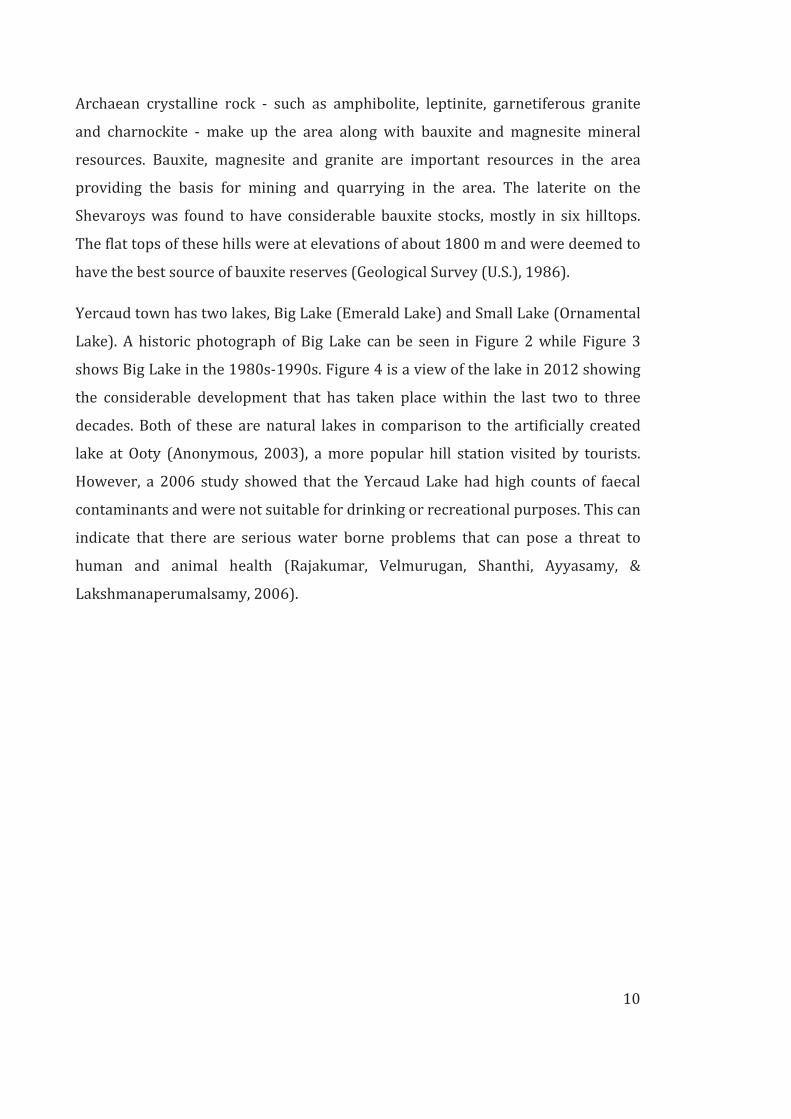
contributed to forest degradation considerably. Figure 9 shows the vegetation
types currently found on the hills. These forest ecosystems are highly fragmented,
which can be seen in the vegetation map. Southern Thorn scrub is the most
extensive vegetation type - it contributes to 46.2% (107.36 km2) of forest cover,
despite being a highly degraded vegetation type (Balaguru et al., 2006). On the
other hand, evergreen and semi-evergreen forest (such as Shola) is sparse, at 0.5%
and 4.5% of total forest cover respectively (Balaguru et al., 2006)
19
Figure 9: Vegetation types of Shevaroyan Hills (Balaguru et al., 2006).
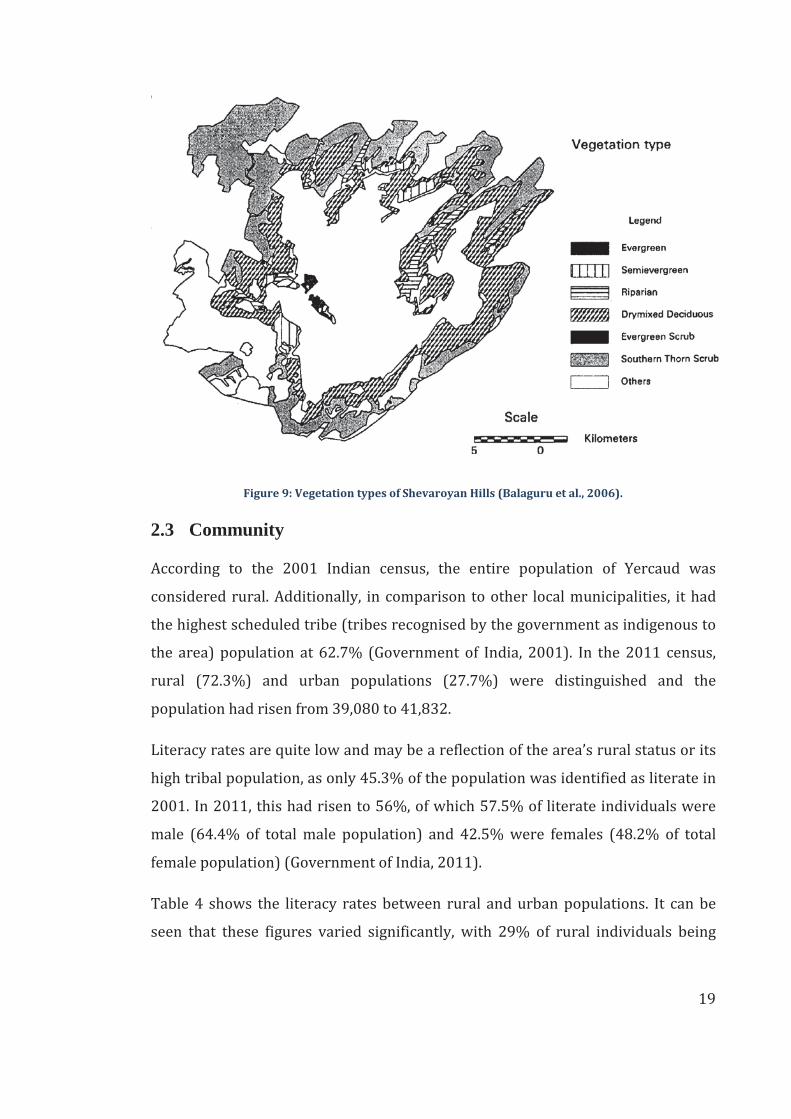
2.3 Community
According to the 2001 Indian census, the entire population of Yercaud was
considered rural. Additionally, in comparison to other local municipalities, it had
the highest scheduled tribe (tribes recognised by the government as indigenous to
the area) population at 62.7% (Government of India, 2001). In the 2011 census,
rural (72.3%) and urban populations (27.7%) were distinguished and the
population had risen from 39,080 to 41,832.
Literacy rates are quite low and may be a reflection of the area’s rural status or its
high tribal population, as only 45.3% of the population was identified as literate in
2001. In 2011, this had risen to 56%, of which 57.5% of literate individuals were
male (64.4% of total male population) and 42.5% were females (48.2% of total
female population) (Government of India, 2011).
Table 4 shows the literacy rates between rural and urban populations. It can be
seen that these figures varied significantly, with 29% of rural individuals being

20
literate in comparison to 77% for those in urban environments (Government of
India, 2011).
The distribution of children aged 0-6 in rural and urban areas can also be seen in
Table 4. Children make up a slightly larger proportion of the rural population
compared to the urban population, with 11% versus 8.8% of their respective
populations. This in itself is not an issue, but the number of rural children leads to
the question of whether this large population has adequate access to similar
services and goods offered to the urban population.
Table 4: 2011 Yercaud Taluk census data comparing rural and urban populations (Government of India, 2011).
Population Child population in age group 0-6 Literates
2011 Total Male Female Total Male Female Total Male Female
Total 41832 21047 20785 4331 2214 2117 23585 13562 10023
Rural 30264 15188 15076 3314 1721 1593 14688 8736 5952
Urban 11568 5859 5709 1017 493 524 8897 4826 4071
The tribal people of Yercaud are referred to as Malaiyalis, which designates the fact
they are inhabitants of the hills, ‘malai’ meaning ‘hill’ or ‘mountain’(Campbell,
1839). They are not to be confused with Malayalees, speakers of a language of the
same name originating from the state of Kerala. Table 5 shows that during the
2001 census, scheduled tribes were the dominant group in Yercaud in comparison
to scheduled castes and other castes.
Table 5: 2001 Yercaud Taluk population characteristics (Government of India, 2001).
Total Scheduled Caste Scheduled Tribe Other Caste
Total 39080 5277 24491 9312
Male 19834 2587 12199 5048
Female 19246 2690 12292 4264
Complete 2001 census data for Yercaud Taluk can be found in Appendix 2.
2.3.1 Culture and History
Wilson (1888) notes that Yercaud was already being visited by Government
officials long before the Nilgiris, a hill station on the Western Ghats that was

21
developed in 1819. Circa 1825, the Collector of the Salem District (the chief
administrative and revenue officer) Mr M.D. Cockburn, started to develop the hills.
He planted a variety of plants, such as pears, peaches, and coffee (which proved to
be a valuable crop to the area), and built the first non-native buildings.
It was around this time that the institution of Hill stations was being developed by
British colonists to recreate a piece of England in India, where they could feel at
home. Additionally, it provided a cool respite from the heat of the plains and many
visited in the belief that it was good for their health (Baker, 2009; Spencer &
Thomas, 1948). It grew to become a popular summer resort for Europeans and
several bought land to establish houses and estates (Rajannan, 1992; Wilson,
1888).
While European occupation of the area is relatively well documented, the history
of Malaiyalis in the area is harder to discern. Thurston (2004) describes the
population from the information he gathered in the late 1800s. It was noted that in
comparison to the ancient Toda hill tribes of the Nilgiris, the Malaiyalis of the
Shevaroyan Hills were recent migrants to the area. They were Tamil-speaking
people from the surrounding plains. The primary dissimilarity between the people
from the plains and Malaiyalis was the ‘kambli’ the Malaiyalis wore (see Figure 10)
- the kambli being a blanket which was worn only by males in a “triple capacity of
great coat, waterproof, and blanket” (Thurston, 2004, p. 153).

22
Figure 10: Historic photo of a group of Malaiyalis. Males can be seen wearing the kambli draped over
their shoulders (Thurston, 2004).
Figure 11: Modern photo of group of Malaiyalis.

23
However, there is evidence of Neolithic and Iron Age settlements based on the
discovery of various implements by Robert Bruce Foote in 1864 (a British
geologist and archaeologist with the Geological Survey of India) (Rajes, n.d.;
Ramesh, 2013) and there are two tales about how the Malaiyalis migrated to the
Shevaroyan Hills. The first is that the tribe belonged to a caste of cultivators (called
Vellala) who emigrated from the sacred city of Kanchipuram during the rule of
Muhammadan in Southern India. Among them were three brothers who all went to
different hill ranges in the Salem district, with the eldest settling in the Shevaroys.
Thus, the Shevaroyan Malaiyalis are called the ‘Peria’ (big) Malaiyalis while the
Malaiyali tribes on another hill range are called ‘Chinna’ (little) Malaiyalis. The
alternative story states that Kariraman, a Malaiyali deity, took up a new abode and
three of his followers followed him with their families. The three followers,
Perianan, Naduvanan and Chinnan (the eldest, the middle man and the youngest),
arrived in the Salem district and proceeded to take different routes to their
respective hill ranges Periamallai, Nadumallai and Chinnamalai (Thurston, 2004).
2.4 Local Economy
The primary economic activity on these hill ranges is coffee production. The
practice was first established in 1820 on the Grange Estate and has been
economically important for the area since then (Rotary Yercaud, n.d.; Wilson,
1888). This crop requires a certain amount of shading, and a few plantations have
retained native shola for this purpose. Others have instead opted for silver oak,
commonly referred to as a ‘cash crop’, and extensive monocultures of silver oak
are a familiar sight (see Figure 12). The multi-tiered method also uses pepper
plants. In recent years, however, coffee plantations have not been faring well; there
have been cases where plantations have been sold to land developers as rising
costs make the practice uneconomical (Rajes, n.d.).

24
Figure 12: Silver Oak monoculture in Yercaud Asambur (Unknown, n.d.).
The other significant industry in the area is bauxite mining, which started in the
70s. These mining activities should have ceased in 2003 when the mining lease
expired, but continued until reserves were reportedly exhausted in 2009.
Remaining activities were to be limited to the removal of bauxite waste, and the
reclamation and rehabilitation of the mines. However, illegal mining outside of
these restrictions was still continuing in late 2011 (Times of India, 2011). Despite
claims that mitigating practices would be put in place for reclamation, none were
observed at any of the sites. Throughout the whole mining process, the company
responsible carried out their activities controversially without environmental
consideration, creating a large negative impact on both the environment and
people (Special Correspondent, 2011).
Granite is another important mineral resource in the area and personal data
collection revealed that quarrying of this resource does exist locally (Sugirtharaj,
2012). There is uncertainty, however, as to the extent of this activity as well as its
impact on environment and people. Personal observations showed some villagers
employed in the blasting, excavation and chiselling of the granite.

25
Other economic activities include fishing, agriculture, and rearing livestock. Big
Lake has been a fishing spot in the past, however, fishing of late has been scarce;
furthermore, it is potentially hazardous as studies have showed that the water
quality is very poor. Agriculture and rearing livestock are other important sources
of income for many villagers. However, this may not be sufficient to meet needs.
Many have sold their small plots of land in order to gain short-term wealth, which
allows them to pay off debts and send their children to higher education.
Figure 13: Fishing on Yercaud Lake (Unknown, n.d.).
2.4.1 Infrastructure and Development
There are 75 roads spanning a total of 122.06 km in the Taluk, but it was observed
that many of these roads are in poor condition (large potholes, uneven surfaces or
untarred), even to key tourist sites such as Kiliyur Falls. They can be difficult to
travel on with normal vehicles and can be flooded during the monsoon season. The
road to several villages are in similarly poor condition, and in some cases more so.
The number of educational and medical facilities can be seen in Table 6 and Table
7 respectively. From personal observations, there now appears to be more private
schools than the numbers given for 2001.

26
Table 6: Educational Facilities in Yercaud Taluk (Government of India, 2001).
Educational Facilities
Panchayat Based/
Government Schools Private Schools Total
Primary Schools 30 5 35
Secondary Schools 10 0 10
Higher Secondary Schools 1 2 3
Total 41 7 48
Table 7: Medical Facilities in Yercaud Taluk (Government of India, 2001).
Medical Facilities
Government Hospitals 1
Government Primary Healthcare Centres 2
Supporting Healthcare Centres 12
Total 15
Table 8 shows the number and type of potable water facilities available in Yercaud.
As can be seen, there are a large number of open wells and bore wells. Many are
susceptible to pollution and contamination, posing a health risk. There are 73
electric pumps in comparison to the number of potable water facilities. Villagers
who use the remaining water sites are forced to manually collect water and carry it
back to their homes. Similarly, electric pumps also pose a problem to villagers.
There are frequent power cuts during the day, with electricity being available for a
short period only. As water cannot be pumped at these times, it is stored. . The use
of generators is common in Yercaud. However, generators require fuel and this is
an expensive practice. For many this is unlikely to be a viable option.
Table 8: Potable Water Sources in Yercaud Taluk (Government of India, 2001).
Potable Water Facility Total Working Permanently Dried Temporarily Dried
Open Wells/ Surface Wells 159 95 24 40
Bore Wells 81 62 14 5
Electric Pumps Total
Overhead Water tank 35
Mini overhead water tank 38
Total 73

27
2.5 Tourism
Yercaud has long been established as a summer resort since European colonists
first frequented it in the 1800s. Visitors would originally ‘go to the hills’ as it was a
popular activity that was deemed to be restorative for British colonists (Baker,
2009). Now, however, its popularity has shifted towards the domestic market. The
main attraction continues to be the climate, landscape and views, offering a cooler
contrast to the surrounding drier rocky hills of the plains (Rajannan, 1992).
Yercaud is colloquially known as ‘poor man’s Ooty’, reflecting the fact that
compared to its sister town, it is cheaper and more affordable than the more
expensive and developed Ooty (Saravanan & Rao, 2012). Saravanan & Rao (2012)
state that Yercaud has not had the opportunity to explore its tourism potential to
the world. Moreover, despite claims to the contrary, current tourism practices in
Yercaud do not adhere to the principles of ecotourism; they neither improve the
wellbeing of the local people nor consider the health of the environment
(Saravanan & Rao, 2012).
The peak tourist season is March to June, coinciding with the summer months in
India. The Summer Festival is held during this time, in the month of May. This
festival usually sees a large influx of tourists. Relatives of children boarding at
Montfort School (located in Yercaud town), constitute another large regular influx
of visitors as relatives of the students are permitted to visit during specific
weekends and school events.
The bulk of tourism development is in the main town of Yercaud. There are a large
number of hotels/lodges (over 100) in the town and a large number of extensive
housing plots found throughout the Taluk. The majority of tourists remain in this
area to view the nearby attractions. Subsequently, this is where a large majority of
environmental degradation and pollution is evident.
28
2.5.1 Tourist Attractions
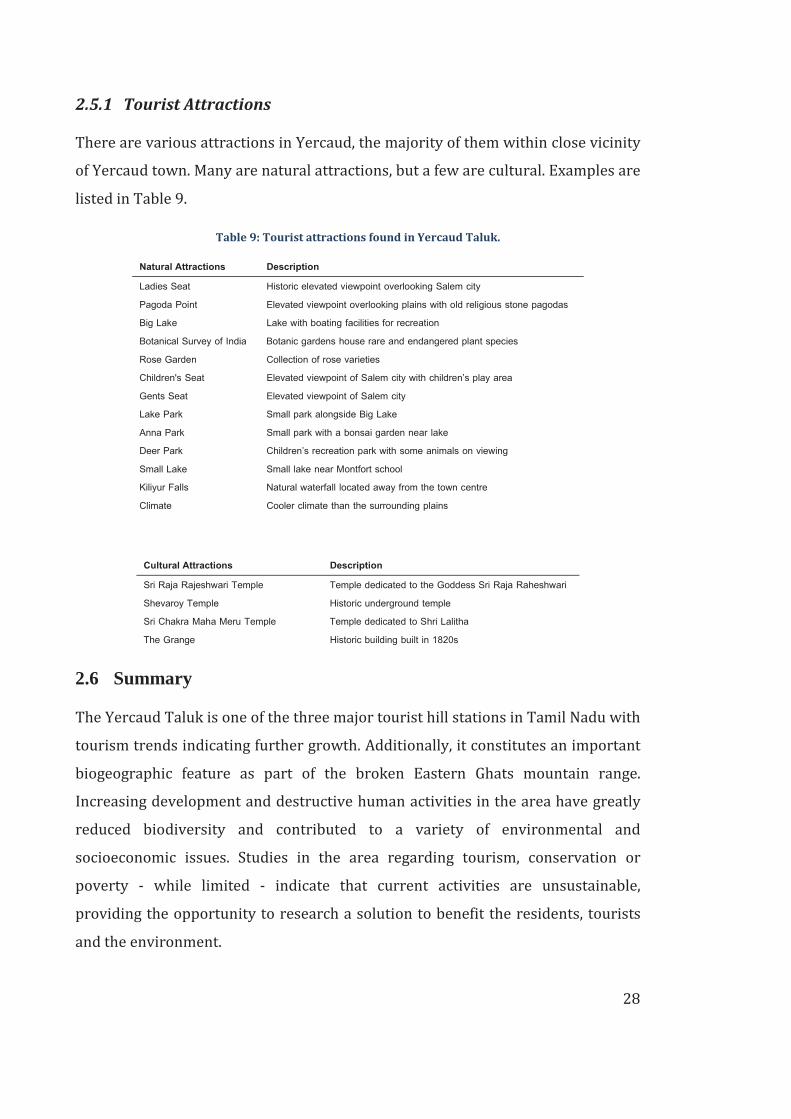
There are various attractions in Yercaud, the majority of them within close vicinity
of Yercaud town. Many are natural attractions, but a few are cultural. Examples are
listed in Table 9.
Table 9: Tourist attractions found in Yercaud Taluk.
Natural Attractions Description
Ladies Seat Historic elevated viewpoint overlooking Salem city
Pagoda Point Elevated viewpoint overlooking plains with old religious stone pagodas
Big Lake Lake with boating facilities for recreation
Botanical Survey of India Botanic gardens house rare and endangered plant species
Rose Garden Collection of rose varieties
Children's Seat Elevated viewpoint of Salem city with children’s play area
Gents Seat Elevated viewpoint of Salem city
Lake Park Small park alongside Big Lake
Anna Park Small park with a bonsai garden near lake
Deer Park Children’s recreation park with some animals on viewing
Small Lake Small lake near Montfort school
Kiliyur Falls Natural waterfall located away from the town centre
Climate Cooler climate than the surrounding plains
Cultural Attractions Description
Sri Raja Rajeshwari Temple Temple dedicated to the Goddess Sri Raja Raheshwari
Shevaroy Temple Historic underground temple
Sri Chakra Maha Meru Temple Temple dedicated to Shri Lalitha
The Grange Historic building built in 1820s
2.6 Summary
The Yercaud Taluk is one of the three major tourist hill stations in Tamil Nadu with
tourism trends indicating further growth. Additionally, it constitutes an important
biogeographic feature as part of the broken Eastern Ghats mountain range.
Increasing development and destructive human activities in the area have greatly
reduced biodiversity and contributed to a variety of environmental and
socioeconomic issues. Studies in the area regarding tourism, conservation or
poverty - while limited - indicate that current activities are unsustainable,
providing the opportunity to research a solution to benefit the residents, tourists
and the environment.

29
CHAPTER 3: LITERATURE REVIEW This chapter aims to provide a background for the research being undertaken by
analysing important concepts and definitions from the relevant literature. This
promotes a greater understanding about the research themes and highlights the
need for this research.
This chapter is split into several sections. The first section defines tourism, looks at
the different forms that it takes and considers its impact upon the three pillars of
sustainability - society, economy and environment. The second section looks at
poverty, comparing and contrasting alleviation strategies to identify the best
methods to tackle this issue. The third section looks at conservation, outlines the
challenges associated with it, and identifies the best solutions based on the related
literature. The fourth section looks at issues that arise between poverty alleviation
strategies and conservation strategies, followed by a section which explores win-
win solutions for both these issues. The final section defines ecotourism after
examining the literature for the most suitable definition to match the research site.
This form of tourism’s efficacy as a poverty alleviation strategy and as a
conservation strategy is investigated. The chapter concludes by looking at
ecotourism at a national level.
3.1 Tourism
Tourism is the largest and fastest growing economic sector with international
global tourist arrivals increasing 4% over the period of 2011-2012 to reach 1.035
billion 2012 (UNWTO, 2013).
3.1.1 Definition
Jafari’s definition engenders a holistic view of tourism and explains it as:
The study of man (the tourist) away from his usual habitat; of the touristic apparatus and networks responding to his various needs; and of the ordinary (where the tourist is coming from) and the non-ordinary (where the tourist goes to) worlds and their dialectic relationships (2003, p. 585)

30
This definition is helpful as it considers the tourists’ interactions with their
destination and host community. However, as it refers to the activity of tourists, it
does not include the temporal aspect of tourism and it raises the question of how
much time a person can spend at a destination to be considered a tourist. The
United Nations World Tourism Organisation (UNWTO) defines a tourist as a visitor
travelling outside of their usual environment for less than a year (Department of
Economic and Social Affairs, 2008); however, this does not include ‘day-trippers’. It
is also useful to consider the reason for the trip - the UNWTO states that any
purpose, whether business, leisure or other personal reasons, would classify a
travelling individual as a tourist. The exception would be if they were travelling to
be employed by a resident entity at the destination (Department of Economic and
Social Affairs, 2008).
As can be seen from these definitions, tourism cannot be fully understood without
defining ‘tourists’ as well. A complete concept thus considers the activity, systems
and individuals associated with tourism. For the purposes of this study, tourism
will be defined as the activity of individuals interacting with environments outside
of their usual locale and the systems associated with these activities. It is limited to
individuals travelling to the destination for less than one year for any purpose
except for employment at the destination.
3.1.2 Travel-based Tourism Types
Tourism can be categorised into three forms based on the type of travel occurring.
These are: domestic tourism and travel, which involves the activities of a resident
travelling within their country; inbound tourism and travel, involves travel to a
country by a non-resident and their activities within that country as part of their
trip; outbound tourism and travel, involves travel outside a resident’s country and
includes their activities within the other country (Department of Economic and
Social Affairs, 2008). As identified in the tourism definition, there are various
motivations for the trip - this will often define the activities undertaken by tourists
at their destination and thus the form of tourism that they are participating in.

31
3.1.3 Tourist Classification and Typologies
Over the years, different forms of tourism and knowledge have evolved. This has
resulted in a variety of tourist typologies being defined. This variety recognises
that tourists are not a homogenous group. As the tourism phenomenon is shaped
by the individuals perpetuating it, it is valuable to understand them and the
diversity of tourist types. Investigating tourist motivations and values can provide
an insight into the different forms of tourism arising and create a better
understanding of development.
One of the simplest methods of classifying tourists is to identify the reason for the
trip, such as for business, leisure, or visiting friends and family (Jafari, 2003). This
is commonly seen in statistical surveys, which often categorise tourists based on
such aforementioned reasons. These can provide an insight into trip
characteristics and choices that the tourist will make. For example, business travel
might be characterised by last minute bookings, with cities as the destination
rather than resorts. Furthermore, business tourists are more likely to visit during
weekdays and travel during non-business hours such as evenings or early
mornings. They are more likely to be the target of associated tourism businesses,
as this group is usually educated and wealthy (Jafari, 2003). As can be seen, this
simple method of tourist classification can help provide a range of valuable
information about tourists and their habits.
Cohen put forward two sets of tourist classifications (as cited in McMinn & Cater,
1998). The first was a four-fold classification consisting of two non-
institutionalised typologies - the drifter and the explorer - and two
institutionalised typologies: the individual mass tourist and the organised mass
tourist. These classifications identify tourist behaviour and the probable
subsequent impacts associated with them. However, use in identifying other
characteristics, such as tourist movements and values, are limited. Cohen later
proposed a new way to classify tourists by learning about their ‘centre’ (1979) . A
tourist’s ‘centre’ is based on the individual’s feelings about their home country and
perceptions. This influences the types of experience that the tourist will pursue.

32
These experiences are grouped under the following types: recreational,
diversionary, experiential, experimental and existential. For example the
experiential tourist typology can be applied to a person who feels alienated in their
own home country. This individual will therefore seek out different and new
cultures to learn about and experience (Cohen, 1979). The classification categories
are useful in identifying the types of experiences a tourist may be interested, but
their definitions may be obscure or difficult to apply.
Smith (as cited in Jafari, 2003) uses a different approach by using the following
factors to classify tourists based on destination interests: ethnic, cultural,
historical, environmental and recreational. This approach takes into account what
the destination has to offer, linking it with tourist interests. Smith also proposed
other typologies; in particular, one typology is useful for determining the level of
interaction between the tourist and the host community, and the subsequent
changes in behaviour from this interaction. As cited in Jafari (2003), Smith
considers the adaptability of the tourist, using the example of how an ‘explorer’
type tourist would be able to adapt and acclimatise to the host’s culture, but a mass
tourist would not be able to adjust to the host’s lifestyle. Similarly, the host
community’s behaviour can be influenced through interactions with tourist culture
with the level of change being determined by their adaptability.
The role that motivations and destination play in classifying tourists has been
highlighted by multiple authors. Acott, Trobe and Howard (1998) note that it is
plausible that tourist types have motivations that don’t match up with the
destination that they’re visiting. For example, a business traveller might visit a
resort, while an ecotourist might visit a non-ecotourist destination, such as an
urban centre. As such, distinguishing tourists in these situations would require an
investigation into their values and motivations. Observing behaviours at the
destination would offer further clarification, as tourist actions would conform to
their values. Furthermore, a single destination can be heterogeneous in the
tourists visiting it, giving rise to a combination of typologies specific to the site.
This can be seen in studies by McMinn and Cater (1998) and Wickens (2002). Both

33
destinations have different characteristics and histories and therefore have
different types of tourists visiting the area.
These observations support the idea that creating tourist typologies is
complicated. The prioritisation of different characteristics can result in different
classifications and as such, requires multiple aspects to be considered before
tourists are grouped into a typology. Furthermore, the aforementioned typologies
should not be used to limit and bias categorisation of tourists by fitting them into
the proposed genres. Instead they should be viewed as options which provide
methods or criteria that can be used to classify and characterise tourists. However,
recent literature on creating and characterising tourists is sparse, which may be
attributed to a move toward site-specific studies. Therefore, typologies will not
accurately capture the diversity of tourists at the destination without considering
the study site.
3.1.4 Tourist Destination
A tourist destination is the geographical unit which the tourist visits. A town, city,
village, island or region is not the only type of destination considered and this term
can be extended to include self-contained centres or even moving destinations
such as cruises (Jafari, 2003). It has been suggested that a tourist destination
should be considered as part of a tourist product. While there is debate over this as
the boundaries of a tourist product are difficult to define, Smith (1994) states that
a common thread creates an ideal tourist product - the experience of tourism. This
concept has five layers: the site, facility or equipment; service; hospitality; quality
of perceived freedom; and quality of involvement. Tourist destinations are
included in this definition and therefore can be subject to similar marketing
schemes. One such marketing factor is the destination’s perceived image, which
has additionally been covered in the push-pull factors that attract or repel a tourist
from a destination (Jafari, 2003).
Demand for a tourist destination can be summarised in a variety and combination
of push factors (from the tourists’ origin) and pull factors (attractivity) from the
destination. Push factors can be summarised as the tourist’s predisposition to

34
travel, and a variety of socio-demographic factors have been shown to affect push
factors. Additionally, external factors such as the individuals’ social circle has been
shown to affect choice - for example, tourists visit an area based on a
recommendation from friends and family, or because their companions wish to
visit specific areas (Um & Crompton, 1990). Pull factors can be characterised by a
variety of destination features related to the attractiveness of a destination.
Destination attractivity is determined by several features: attractions, amenities,
accessibility, destination image, and cost (Jafari, 2003; Kozak & Rimmington,
1999).
Attractions are primary pull factors and can fall into: natural, built, cultural or
social attractions. Destination amenities are not primary tourist motivations for
visiting an area, but greatly enhance a tourist’s experience by making the stay
comfortable and feasible. Lack of amenities might thus prove to be a deterring
factor (Jafari, 2003). Amenities include basic infrastructures, accommodation,
transportation, catering services, entertainment, shopping facilities and visitor
information. The presence of proper amenities contributes to the quality of a
destination and therefore can increase the appeal of a destination and its
attractions. Accessibility, how easy it is to reach a destination, is determined by
transport infrastructure facilities available, such as airports, roads and railways.
Tourist destination image - the way a tourist perceives the destination or what
they believe and think about it - further influences decisions to visit particular
destinations. Costs associated with the destination are one of the major deciding
factors of destination choice and include travel costs, accommodation and
participation in services and activities available (Formica, 2006). Primary
influences for price variations for different destinations are based on seasonality,
distance, and development (Jafari, 2003).
3.1.5 Sustainability
The growing tourism industry has facilitated a variety of changes, from improving
infrastructures to preserving cultures. However, many forms of tourism are
unsustainable, violating the three pillars of sustainability - economic, environment,

35
and social - outlined by the World Bank’s Development Report (Khatri, n.d.; World
Bank, 2003). Since the 1980s, the definition of the term sustainability has been
applied to development that “meets the needs of the present without
compromising the ability of future generations to meet their own needs” (United
Nations General Assembly, 1987, para. 1). This definition covers two key concepts
addressed by the World Development Report, which should be applied to tourism.
The first of these concepts considers the impoverished, stating that “the essential
needs of the world’s poor” should be given overriding priority; the second concept
states that the environment’s ability to meet present and future needs should be
limited by the state of technology and social organisation (United Nations General
Assembly, 1987, para. 1).
Using these two concepts in conjunction with the three aspects of sustainability
provides an outline, which can be used to identify and develop sustainable
practices in relation to tourism. Thus in the context of this study, sustainable
tourism provides benefits for vulnerable communities (primarily impoverished),
either directly, or indirectly, and enhances economic gains, at any scale. It does not
create social issues in the process, or damage social customs, nor harm the
environment to the extent that it significantly reduces its ability to meet future
needs. An additional concept to include, concerns the tourist destination as
product, and a sustainable tourist destination is one which has the ability to attract
first time visitors, as well as repeat visitors, while competing against newer and
less explored destinations (Gee, Organization, & Network, 1997).
Carrying capacity is a separate, but related concept that can be used in conjunction
with sustainability. In relation to the tourist destination, it refers to the maximum
number of tourists that can use an area without a subsequent decline in the quality
of the environment or the tourist’s experience (Mathieson and Wall, as cited in
O’Reilly, 1986). This definition does not explicitly meet the three core ideas of
sustainability. However, O’Reilly (1986) recognises that there are three
interrelated subsystems which each have carrying capacities of their own, and the
aforementioned definition fails to reflect the economic and social characteristics of
the destination. Despite its theoretical advantages, identifying the carrying

36
capacity of destinations prior to their levels being exceeded has been largely
unsuccessful to date (Jafari, 2003). However, in spite of this drawback, it can assist
in outlining clearer boundaries for sustainable practices. The impacts of exceeding
these three subsystems are considered below.
3.1.5.1 Impact on Environment
Activities, individuals and systems associated with tourism pose a risk to the
physical and environmental features of a destination. For example, the presence of
tourists in fragile ecosystems, such as Antarctica, is sufficient to threaten the
ecology. However, determining a physical and environmental carrying capacity of a
destination is difficult due to multiple reasons. Various factors need to be taken
into account as the degree of the impact varies based on: the infrastructure,
policies and rules in place to mitigate the impact of the tourist population, and the
form of tourism (Gee et al., 1997).
Attempts to identify environmental carrying capacity thresholds of a destination,
before they have been exceeded have been largely unsuccessful. Multiple reasons
have been cited for this including complexity - carrying capacity differs from
destination to destination based on the destination characteristics, type of tourism
present (e.g. mass tourism), and tourism/environment interface (Coccossis &
Mexa, 2004). Additionally, identifying and policing the ‘appropriate’ level of
activity to avoid exceeding the carrying capacity of a destination is difficult to
determine. In particular, this lack of success has predominantly been attributed to
the fact that: the concept lacks clear principles to calculate situations prior to limits
being exceeded; and there is potential to wrongly assume that there is a simple
negative relationship with increasing people on the quality of environment and
tourist experience (Coccossis & Mexa, 2004). In some cases, infrastructure may be
sufficiently well-developed that the environment can cope with large tourist
populations.
Some of the primary issues associated with tourism include degradation of the
natural environment and various forms of pollution. Butler’s (1980) destination
life cycle theory states, that a tourist destination moves through five stages. The
37
first is discovery, then involvement, development, consolidation and either decline,
rejuvenation or stabilisation. At first visitors are independent and adaptive and
there is little change to the destination. However, as popularity of the destination
increases, tourists to the area increase and the destination undergoes changes to
cater to their needs and preferences. This can result in visitors becoming less
adaptive and more dependent on host community. Furthermore, the destination
may become more commercialised and degraded, losing the original untouched
qualities that initially drew tourists to the area (Butler, 1980; O’Reilly, 1986).
Following this there are three possible results: a stabilisation stage where the
number of tourists that visit, over time, levels out; a rejuvenation stage where
tourism in the area undergoes a ‘makeover’ in order to revitalise its appeal as a
tourist destination; or a decline stage where the area is unable to compete with
newer attractions and eventually moves away from tourism as the market
declines.
When a destination is overdeveloped, carrying capacity of the environment and
other factors has been exceeded, the destination can enter the aforementioned
decline stage, or stagnation stage (Butler, 1980). In this stage, the natural quality of
the destination may be lost among an excessive number of manmade structures
and may develop rural slums (Gee et al., 1997). The destination may attempt to
meet unrealistically high demands for certain resources and facilities in order to
benefit from tourist dollars. This can lead to overdevelopment in a short amount of
time without regard to the environment. Natural and authentic cultural attractions
may be degraded and overlooked in favour of creating imported artificial
attractions in hopes of maintaining waning tourist popularity. Further, the
destination may be adulterated to the point where its image is no longer reflective
of its geographic environment (Butler, 1980). This means that the destination may
have elements of development unrelated to local culture and environment, losing
its original unique charm.
Table 10 outlines additional tourist issues and their subsequent negative impacts
in natural environments (Gee et al., 1997; Lilieholm & Romney, 2000). Tourism
factors which place a stress on ecosystem services and functions pose a greater

38
risk to human populations and the environment than other factors. Ecosystem
services and functions are essential for survival and represent a variety of features
and systems, such as food production, waste assimilation, water supply and
pollination (Costanza et al., 1997). These anthropogenic impacts can hinder a
tourist destinations ability to cope with tourists and its attractivity.
Table 10: Potential negative environmental impacts associated with tourism in protected areas.
Factor involved Impact on Natural Quality Comment
Overcrowding Environmental stress - including stress
on ecosystem services and functions,
change in animal behaviour, animal
harassment and stress
Tourist, resident and wildlife irritation,
potential for human-animal conflict or
animal avoidance of habitat, reduction in
natural quality, limit tourist numbers or
improve regulation to cope
Noise pollution
Air pollution
Water pollution
Litter
Vandalism destruction
Vehicles and off-road driving
Introduction of exotic plants and animals
Disturbance of natural sounds, change in
animal populations and interaction -
Climate change, acid rain, environmental
stress - including stress on ecosystem
services and functions, degradation of
flora and fauna due to reduced health
Environmental stress - including stress
on ecosystem services and functions,
reduced aquatic plant and animal health,
reduced animal health
Impairment of natural scene, habituation
of wildlife to garbage, contribution to
pollution
Mutilation and facility damage
Wildlife mortality, soil and vegetation
damage, contribution to noise, air and
water pollution
Competition with native species,
reduction of biodiversity
Irritation/disruption to wildlife, residents
and other visitors,
Health hazard to tourists, residents, and
wildlife, difficult to mitigate except by
limiting activities which increase
particulate air matter
Aesthetic loss and health hazard to
tourists, residents, and wildlife
Aesthetic loss and health hazard
Costly to fix and aesthetic loss
Ecological changes, dust, disturbance to
wildlife
Public confusion regarding native and
endangered species
Source: Adapted from (Gee et al., 1997; Lilieholm & Romney, 2000)
Tourism has been found to have some positive impacts by developing tourist
attractions and infrastructure. Perceived revenue benefits from tourism can drive
the restoration, conservation, or protection of tourist attractions (cultural, physical

39
and natural) (Gee et al., 1997). Additionally, increased tourist support and
recognition can provide the necessary funding and outside interest required to
develop these projects (Lilieholm & Romney, 2000). Locally, infrastructure
improvements - such as roads, waste and water management systems - and
revenue benefits from tourism can provide incentive for residents to accept more
sustainable practices associated with the natural and physical environment (Gee et
al., 1997).
3.1.5.2 Impact on Community
Many countries, including India, have looked to tourism as a tool for economic
development. It can create job opportunities for residents, including vulnerable
groups such as women. However these benefits may be inequitably distributed - in
general, those who benefit most from tourism development are those who have the
capacity to invest, which does not include impoverished residents in need of the
economic benefits that tourism brings. Additionally, while women may benefit
from employment opportunities associated with tourism, tensions may arise if
males suffer from decreased self-esteem and the women attempt to maintain their
traditional role alongside their new jobs (Gee et al., 1997). In some cases, tourist
interest in culture has resulted in strengthening artistic traditions, traditional
activities (festivals) and increasing residents’ sense of identity (Gee et al., 1997).
However, the authenticity and cultural meaning of traditional practices may be
destroyed when they are modified to attempt to gain financial benefit from tourists
and cater to tourist tastes. Tourist interest can also be intrusive as they can
overstep boundaries and invade residents’ privacy. Unsustainable tourism can
therefore further perpetuate a range of environmental and socio-economic issues.
Concerns associated with tourism include negative social consequences and
degradation, such as loss of traditional cultures, behaviour among youth that
mimics tourists’ behaviour, and declining moral value (Al-Oun & Al-Homoud,
2008). Mitigating this impact can be difficult as the host community may choose to
adopt tourist culture despite tourist attempts to reduce their influence by
adjusting to the host community’s culture (Smith as cited in Jafari, 2003). One of
the negative reasons for this willingness to abandon their ways is the belief that

40
the tourist culture is superior to their own - called ‘passing’. Alternatively, the host
community may believe they can benefit (or increase their existing benefits) from
tourism development by taking this course of action (Jafari, 2003). In these cases,
the minimum preventative action would include placing an emphasis on the
importance of retaining the host community’s own culture during the development
of tourism.
Further social issues include resentment among the resident community towards
unsustainable tourism development. This can subsequently lead to negative
opinions and emotions towards tourists (Pizam, 1978). As such, the original
aspects of destinations which resulted in their appeal - such as their social,
economic and environmental qualities - should be protected for tourists and
residents to create greater harmony between these groups (Brunt & Courtney,
1999; Harrill, 2004). Furthermore, incorporating input from the host community
during development is more likely to achieve sustainable results. A variety of
studies examine resident attitude towards tourism, but due to the dynamic nature
of the elements associated with tourism (the environment, destination, economy
and other factors), it is necessary to continually assess resident attitudes (Gursoy,
Chi, & Dyer, 2009). Therefore, changing variables require regular reassessment of
social attitudes for successful sustainable tourism development.
Tourism impacts differ based on community and a study conducted by Mason and
Cheyne (2000) examined a rural community’s attitude towards proposed tourism
development. Their findings supported arguments put forward by others that due
to the smaller size of the community, tourism is more visible and results in
stronger attitudes and greater concerns (Capenerhurst, 1994; Pearce, Moscardo, &
Ross, 1996). Similarly, a high guest/host ratio in a community of any size results in
higher visibility of tourists and can increase social impacts in communities
(O’Reilly, 1986). Hence, different types of tourism can have varying degrees of
impact on the host community, and generally, positive attitudes are recorded
towards perceived beneficial social and economic impacts - such as provision of
recreation areas and job development. Negative attitudes are recorded towards
perceived unfavourable impacts, such as traffic congestion and litter (Gursoy,

41
Jurowski, & Uysal, 2002; Mason & Cheyne, 2000; Milman & Pizam, 1988; Sheldon &
Var, 1984).
Another factor affecting attitudes includes perceived cultural or perceptual
distances between the residents and potential tourists. As identified by Sheldon
and Var (1984), if there is a greater cultural difference between the two groups,
then the social impacts are greater as well. For example, they found that residents
strongly felt that tourists were not aware of their way of life, thus creating a
disparity between the two groups (Sheldon & Var, 1984). This could easily be part
of the reason why residents blame tourists for negative changes seen in their
community such as increases in crime. This was not seen in the Mason and Cheyne
(2000) study as it was conducted prior to tourism development, but it also did not
seek to determine, or consider, whether opposition to development was influenced
by any perceived potential cultural differences. Community conflict can result
between community groups when differences in opinion occur regarding these
cultural perceptual distances. An example of this is the demonstration effect
where, younger residents often view certain tourist influences differently to older
traditional residents. In particular, the loosening of their society’s rules may be
viewed as a positive change by youth, while traditional residents may view this
change with hostility (Gee et al., 1997).
Gursoy and Jurowski (2002) expanded on this concept; their findings implied that
residents who lived close to tourism resources and used them often had negative
perceptions and were unlikely to support tourism development. This was
attributed to the possibility that residents feared that their use of the resource
would be impaired and was also identified in their later study. However, Jurowski
and Gursoy (2004) applied this in context of the Social Exchange Theory, which
identified that as a result of tourism and development, there was a risk of costs
outweighing the benefits for residents. Conversely, residents living far from
attractions perceived positive impacts from tourism and were more likely to
support development (Gursoy et al., 2002; Jurowski & Gursoy, 2004). Harrill and
Potts (2003) found this to be somewhat untrue. This, however, was additionally
influenced by economic benefits as the neighbourhood further away from tourist
42
centres was financially independent from tourism and thus perceived less
economic benefits and positive impacts. Thus, not only were perceptions toward
tourism development location-dependent, but economically dependent as well. In
contrast, both Sheldon and Var (1984) and Beslisle and Hoy (1980) found
contradicting results. Sheldon and Var (1984) found that despite residents being
exposed to high levels of tourism, they were generally positive towards tourism as
they valued the increased employment opportunities, good maintenance and
development of facilities. The authors commented that it was encouraging to
observe this, as it showed the residents showed a lack of hostility and a sense of
maturity in their attitudes. However, they also found that residents also felt that
tourists were unaware of their way of life; that tourism exploited Welsh people;
and they were more likely to stereotype tourists (Sheldon & Var, 1984).
A variety of models have aimed to capture the interrelated relationship between
tourism, destination development and host community. These models have aimed
to highlight developmental issues and to identify and realise positive and negative
impacts of tourism. In regards to social approaches, there have been a variety of
attempts to categorise residents, communities and tourists in order to gain a better
understanding of their characteristics and their relation to tourism; this is seen in
the ‘Irridex’ model proposed by Doxey (as cited in Harrill, 2004). This model states
that there are four time-related stages which are linked to the number of tourists
increasing in an area. At the first stage the population is ‘euphoric’ and residents
welcome visitors; the next stage is ‘apathy’, where contact becomes more formal as
residents take visitors for granted; ‘annoyance’ starts to spread through the
population as the population is saturated with tourists and residents start
resenting their presence; the final stage is ‘antagonism’ as residents openly express
their irritation (Doxey as cited in Harrill, 2004).
3.1.5.3 Impact on Economy
Tourism dollars can contribute significantly to the local economy. However,
tourism has been linked to inflated prices, unbalanced economic development, low
paid seasonal employment, and rises in the price of goods, services and labour.
Further local economic development can be hindered when tourist ventures fail to

43
employ workers from the resident labour force (Khatri, n.d.). These impacts, rather
than contributing to development, can stunt growth. As such, unsustainable
tourism ventures are unsuitable for poverty reduction or conservation strategies.
As highlighted by Harrill and Potts (2003), economic factors can significantly
influence perceptions. In particular, economic benefit, or state of the local
economy, has been used to predict resident attitudes towards tourism. Thus, a
range of studies have been conducted which investigate economic dependence,
with the most common assumption being, the more dependent communities or
individuals are on tourism, the more favourably they view it (Harrill, 2004). This is
supported by Pizam (1978), who found that in Cape Cod, the more dependent an
individual was on tourism as a means of livelihood, the more positive their attitude
toward it. However, Pizam also recognised that an individual’s tourist contact also
influenced their attitude alongside economic dependence. As such, despite support
for this hypothesis, there are other important variables which work alongside
economic dependency to influence attitudes.
Allen, Hafer, Long, and Perdue (1993) found that positive attitudes were observed
where there were either low levels of both economic and tourism development or
high levels of economic and tourism development. However, resident attitudes
from communities with mixed levels of economic and tourism development were
not as favourable. The authors speculated that positive attitudes were observed at
low levels, since communities were not economically dependent on tourism, and
had high expectations for its future development. At high levels the communities
had recognised and obtained some of the benefits from tourism and thus had
favourable perceptions towards tourism. However, it was identified that
communities with high economic activity and low tourism development were
economically stable and independent from tourism. This meant that residents did
not observe economic benefits from tourism, and as such did not see a need for its
development. Those with low economic activity and high tourism development
had not seen any of the economic benefits that they might have anticipated with
tourism development and as such were dissatisfied and held negative attitudes. In
cases where communities placed a high economic dependence on tourism an

44
unbalanced tourist-host relationship can evolve. In such cases, hosts need tourists
more than tourists need them (Horn & Simmons, 2002) and can result in economic
instability for the community.
Gursoy, Jurowski and Uysal (2002) found that the economic wellbeing of
communities had the strongest effect on residents’ support for tourism
development. Other studies tend to support this effect that economic costs or
benefits have on resident perceptions of tourism. For example, Lawson et al.
(1998) found that in all ten towns they sampled, residents agreed that tourism
benefited the local economy of their community as well as other individuals.
However, residents were less sure of personal economic benefits from tourism. Liu
and Var (as cited in Harrill, 2004) found that residents also strongly agreed that
there were economic benefits from tourism, but were uncertain about
environmental benefits. Milman and Pizam (1988) also found that the major
positive impacts on central Florida were economic, in the forms of employment
opportunities; income and standard of living; town overall tax revenue; and quality
of life.
However, there are negative economic impacts as well, often for those
communities who are unable to develop mechanisms to cope with tourism. These
are often perceived by residents as increases in the costs of living and prices of
tourism products. This was clearly identified in several New Zealand towns by
Lawson et al. (1998), where the residents felt the prices had raised costs in their
living area and had priced tourism products beyond the resources of some
domestic consumers. Residents also perceived negative economic impacts through
subsidies paid as part of local rates which are used to offset expenses and support
the tourism industry. This was especially a problem for towns with a high
guest/host ratio which had a high economic dependence on tourism. However,
Raglan - a similarly small town in New Zealand with a high guest/host ratio and
high economic dependence on tourism - did not identify such issues. Instead,
residents ranked economic benefits highly in questionnaires thus acknowledging
the importance of tourism within their community (Ryan & Cooper, 2004). It

45
should be noted, however, that benefits were assessed in terms of jobs and local
economy and did not venture to address living costs.
3.1.6 Tourism in India
The number of foreign international tourists arriving in India in 2011 was 6.29
million. In contrast, the number of global international tourists was 983 million.
Domestic tourist visits around the country were 850.86 million (Market Research
Division, Ministry of Tourism, Govt. of India, 2012). The annual growth rate for
foreign and domestic tourist visits were 8.9% and 13.8%, thus showing that
domestic tourism will continue to play a big role in the local economy.
The scale of domestic tourism far exceeds the scale of international tourism and
there may be geographical reasons behind this e.g. in large countries such as USA, a
greater number of domestics choose to travel within their country, than leave it.
Such may be the case in India as the nation’s own resources provide sufficient
attractions to keep residents within their own country (Gee et al., 1997). However,
the increasing domestic travel is likely to be primarily attributed to an increasing
middle class population with greater disposable incomes. As a result, vacationing is
becoming a more popular activity which drives travel and tourism (Baker, 2009).
Domestic tourism is a rapidly growing sector and many more people are choosing
to explore and experience their own country. Various organisations believe that
tourism could be a significant economic tool for developing countries (Gee et al.,
1997). However, the focus has predominantly been on international tourism and in
many Asian countries, including India, the promotion of domestic tourism is not
given much priority. Recent years have seen greater investment in tourism
development by the Department of Tourism with domestic earning expected to be
greater than international tourist earnings (Rao & Suresh, 2001). Sustainable
forms of tourism can contribute greatly to a destinations’ economy and provide
much needed employment for the vulnerable in the area. However, increasing
tourism development results in greater tourism related environmental impacts
(Rao & Suresh, 2001).

46
3.2 Poverty
In 2008, 1.29 billion people (22.7%) lived in extreme poverty, living on less than
$1.25 a day (World Bank, 2013). Comparatively, in 2012, the proportion of those
living on less than $2.50 a day was 50% of the world population (3 billion people),
while 80% were living on $10 a day or less (Statistic Brain Research Institute,
2012). The $10 a day threshold is used to assess poverty in developing countries as
this reflects the higher costs of living and is mostly characterised by the inability to
live securely or comfortably (Lüsted, 2010). The 2008 recession (which still affects
today’s economy) puts a disproportionate pressure on this group as they lack the
personal resources that allow higher income groups to cope with financial
hardships. For the wider community, the impacts of poverty are felt when states
use resources to combat this social issue (“poverty,” 2013).
3.2.1 Definitions
Poverty is a state characterised by an inability to meet an individual’s basic needs.
Furthermore, the extent of deprivation has a bearing on the severity of poverty
being experienced. Due to the range of basic needs an individual has and the
complexity of the issue, there are a multitude of strategies that aim to meet these
various needs. These definitions provide a guideline which can be used to identify
indicators that explore what constitutes basic needs.
3.2.1.1 Poverty
The most basic and essential needs are those which enable an individual to survive
and subsist. The deprivation of these needs result in poverty, and severity of
deprivation varies due to the range of needs an individual has. The World Bank
defines poverty as a “pronounced deprivation in well-being” and also explains the
concept of ‘well-being’. The UN provides a similarly comprehensive definition
which is more accessible. This second definition considers what poverty entails for
an individual and captures more than the physical struggles that the poorest face.
This is outlined in the following paragraph:
47
Fundamentally, poverty is a denial of choices and opportunities, a violation of human dignity. It means lack of basic capacity to participate effectively in society. It means not having enough to feed and clothe a family, not having a school or clinic to go to, not having the land on which to grow one’s food or a job to earn one’s living, not having access to credit. It means insecurity, powerlessness and exclusion of individuals, households and communities. It means susceptibility to violence, and it often implies living in marginal or fragile environments, without access to clean water or sanitation (UN Statement as cited in, Gordon, 2005).
Thus, meeting an individual’s basic needs is more complex than ensuring that an
individual has sufficient food or access to clean water. It encompasses their well-
being and the requirements to maintain this, such as social inclusion. Measuring all
these features is difficult, but can be achieved through situational research and the
use of poverty indicators.
3.2.1.2 Absolute Poverty
Absolute poverty is also referred to as destitution or extreme poverty. The severity
of this situation is worse for individuals in this position compared to those living in
poverty, as the lack of access to basic needs can be life threatening. Individuals in
this group are characterised by living on less than $1.25 per day, with wellbeing
featuring secondary to survival. The Copenhagen Declaration highlights this fact in
its definition:
Absolute poverty is a condition characterized by severe deprivation of basic human needs, including food, safe drinking water, sanitation facilities, health, shelter, education and information. It depends not only on income but also on access to social services (as cited in Gordon, 2005).
Where the definition of poverty considers an individual’s place in society, absolute
poverty does not provide individuals the opportunity, or luxury, to look beyond
their basic survival needs.
3.2.1.3 Relative Poverty
Relative poverty diverges from poverty and absolute poverty, as it is distinguished
not by hardship, but the comparative deprivation of an individual’s living situation
in contrast to others in the same society (Barker, 1996). It is a measure of social
inequality, defined by individuals having fewer resources and being unable to meet

48
needs as easily as those around them. There are a variety of examples of relative
poverty in societies and Chossudovsky outlines two cases as observed in 1990 (as
cited in Barker 1996). The first made the comparison of a Peruvian agricultural
worker who paid higher prices for consumer goods than a person would have to in
New York. The second example presented a Filipino peasant who worked two
years to earn what a New York lawyer made in an hour (as cited in Barker 1996).
As isolated cases, these individuals don’t appear to be under any particular
hardship and can lead to social acceptance of the situation. However, considering it
in a larger context provides a different perspective on the differences in well-being
and hardship. It illustrates the results and impacts of social inequality and invites
further scrutiny.
3.2.2 Causes of Poverty
Accurately identifying the extensive variety of factors that can cause poverty is
necessary in attempting to combat the issue. This can sometimes be complicated
by difficulties in distinguishing between cause (e.g. poverty due to lack of
education) or effect (unable to receive education due to poverty). Furthermore,
recent studies acknowledge that poverty is not determined by simple cause-and-
effect relationships. They are dynamic, part of a wider system interrelated with
various practices and vulnerabilities contributing to the problem (Green & Hulme,
2005). Difficulties in identifying, or addressing, these can be major reasons for the
failure of poverty reduction schemes. In general, causes can be categorised into a
variety of groups, with interactions occurring between groups. For the purposes of
this research, they have been broadly categorised into economic, environmental
and social.
A range of economic reasons have been identified as possible correlates of poverty.
These include an unstable government, corruption, unemployment, property
owned, adverse distributive policies, low human and social capital, dominance of
particular economic activities, changing trends in a country’s economy and level of
development (Green & Hulme, 2005; World Bank Institute, 2005).

49
Social reasons include: lack of opportunity, inadequate education, high divorce rate
which causes feminization of poverty, a culture of poverty, overpopulation,
presence of epidemic diseases such as AIDS and malaria, access and availability of
infrastructure and social services, household size, gender, race or caste, age
structure (Badrudin & Warokka, 2012; Green & Hulme, 2005). For example, in
cases where men have died of AIDS in East Africa, their widows and children may
have their land seized by the deceased’s male kin. This results in a loss of security
and self-sufficiency and can force them into situations of poverty (Ewelukwa, as
cited in Green & Hulme, 2005).
Environmental factors can contribute significantly to poverty such as droughts,
vulnerability of the region to natural disasters, remoteness, climate change,
environmental degradation and associated problems such as declining agricultural
yields, and various geological and ecological factors (World Bank Institute, 2005;
World Bank, 2013). For example, environmental crises such as droughts and soil
degradation can result in declining agricultural yields. This reduces food supply,
results in increasing food costs, and affects the ability of individuals to meet their
nutritional requirements.
3.2.3 Indicators of Poverty
Defining poverty as a deprivation of needs provides a range of indicators that can
be used to identify those experiencing poverty and absolute poverty. The
categories for these are: food; safe drinking water; sanitation facilities; health;
shelter; education; information; and access to services (Gordon, 2005).
The various dimensions of poverty - low incomes, poor work and living
environments, lack of education and unsafe water - can impact an impoverished
individual’s health. This can further exacerbate symptoms of poverty and can
result in higher incidences of disease, illness, injury and lower life expectancies
(Murray & Marks, 2008). Poverty related health ailments are the most pronounced
in vulnerable groups such as women, children and disabled. Deprivation of health
and health services contribute to the 22,000 children who die each day due to
poverty (Statistic Brain Research Institute, 2012). Severe health deprivation occurs

50
when: women do not receive any of the following - treatment for a recent serious
illness; antenatal care; assistance with birth; or a tetanus inoculation during her
pregnancy - and when men do not receive treatment for a recent serious illness
(Gordon, 2005). Deprivation of health occurs when women do not receive:
treatment for a serious illness; minimum standard of antenatal care from a person
trained in midwifery; when men do not receive treatment for a serious illness; or
when men and women lack basic knowledge about HIV/AIDs transmission
(Gordon, 2005).
Food deprivation, malnutrition or hunger results from a lack of access to adequate
or proper food. Rising costs of food and disruption of global food supplies can help
perpetuate this issue, with impoverished struggling to afford enough food to meet
their household’s nutritional requirement. Furthermore, the strain and stress of
this situation can seriously impact health - physical and mental. Food deprivation
is defined by the Body Mass Index (BMI) of the individual where basic deprivation
is a BMI of 18.5 or below (underweight). Severe deprivation occurs at a BMI of 16
or below (severely underweight)(Gordon, 2005). Additionally, water deprivation is
defined as: access to unimproved water sources such as open wells or open
sources; or having to make more than a 15 minute walk (one-way) to reach a
water source (Gordon, 2005).
Deprivation of sanitation facilities is access to unimproved sanitation facilities such
as covered pit latrines etc. or no access to any toilets; severe deprivation of this
commodity is the lack of access to any toilets of any type privately or communally
in the vicinity of their dwelling. Education and information deprivation refers to
youth who did not complete a primary education or are illiterate and a lack of
access to some type of broadcast media at home. Severe deprivation occurs when
youth have not received an education and are illiterate, while severe information
deprivation refers to absolutely no access to any information sources even
newspapers and telecommunication. Shelter deprivation occurs when three people
or more are living in the same room; the house has no flooring, or inadequate
roofing. Severe deprivation of shelter occurs in dwellings with four or more people
per room; or in a dwelling with no flooring (Gordon, 2005).

51
3.2.4 Measuring Poverty
There are a variety of ways to measure poverty and this reflects the various
hardships observed. Indicators of poverty are commonly used as measures of
poverty and each are useful in their own fields for representing incidences of
poverty.
The most commonly seen measure of poverty is the $1 and $2 (PPP) a day
thresholds introduced by the World Bank in the 1980s. These are used to
distinguish between poverty and extreme poverty and have since changed to $1.25
and $2.50 a day to reflect inflation. Many argue that these values are too low, or
treat those living in the most extreme of poverty conditions the same as those
living closer to the poverty line. Poverty lines are another measure of poverty and
these vary from place to place due to differences in definition of basic needs. One of
the earliest ideas of a poverty line was established by Rowntree in 1901. It was
based on the income required by a person to survive at the subsistence level of
food, shelter, clothing and other necessities. Essentially it equates to the minimum
amount of money a person needs to meet their basic needs (Blackwood & Lynch,
1994). This amount varies from place to place to reflect the different costs of living.
Measuring deprivation in order to determine poverty of populations is the other
main method utilised. Gordon (2005) states that poverty is the deprivation of two
or more of the indicators identified on the deprivation scale (and outlined in
Section 3.2.3) while absolute poverty is two or more on the severe deprivation
scale. However, in using these methods there are several factors that should be
considered, as ambiguities exist around the application of these indicators. For
example, food deprivation might be considered in the context of a farmer who
grew sufficient food on their land to meet their nutritional needs, but did not have
any cash income; they would be unable to buy clothes, pay for healthcare and pay
their taxes making it difficult to classify them as not living in poverty. Thus, this
issue brings to light something that has not been considered, the necessity for
essential possessions such as bedding and household equipment (Barker, 1996).

52
3.2.5 Alleviation Strategies
There are a variety of strategies to reduce poverty which can be categorised into
different alleviation approaches. In particular, there are two main broad
approaches which strategies can be categorised into, the first increases access and
supply to basic needs while the second increases the income necessary to purchase
or attain those needs.
Strategies to increase basic needs directly include building roads which can bring
access to a variety of basic needs. It can reduce the remoteness of a region and
make needs such as healthcare or education from urban areas available. This can
additionally increase incomes as job markets may be more accessible. Improved
infrastructure and technologies are tools that can be used to increase food supply
and fuel demand for other goods. For example, by improving agricultural
technologies available to impoverished, it is possible to increase yield output,
ensuring that basic food needs can be met. Furthermore, improved infrastructure
can make these better technologies more easily available, such as having proper
road infrastructure to transport fertiliser for use in agriculture. Improving health
care and education can be achieved if the right strategies are employed. Simple
cost effective measures such as installing water filters can reduce illness from
waterborne diseases, thus reducing the strain on health care facilities. Additionally
it can increase educational benefits by reducing the number of school days missed
by a sick child. Another strategy includes population limitation. Currently,
improved sanitary conditions, better health and lowered mortality rates can result
in increased population. As such, in combination with improving these basic needs,
programmes have been put into place to attempt to reduce rapid population
growth by educating people about family planning (“poverty,” 2013).
At a national level, Governments can implement policies and schemes to assist
impoverished. These can come in a variety of policy types from subsidies on
important items, to providing healthcare and financial aid. Strategies of increasing
income to make basic needs more affordable typically include unemployment
53
compensation, welfare, economic freedoms, employment on public work projects
and providing financial services. (“poverty,” 2013).
3.3 Conservation
Humans rely on the various ecosystem services that the environment provides,
from fresh water to natural resources. With growing environmental degradation,
habitat and biodiversity loss, the range, quality and capacity of ecosystem services
provided is reduced. Growing awareness of human impacts on the environment
and the resulting outcomes has resulted in the recognition of the importance of
conservation.
3.3.1 Definition
The term conservation in the research context refers to the protection of particular
aspects of the environment. It is often applied in conjunction with natural resource
management models to study biodiversity loss and management solutions to halt
or improve these losses. Conservation can be applied at various biological levels,
from smaller species level to larger ecosystem levels (“conservation,” 2013).
3.3.2 Ecosystem Services
The environment provides humans with a multitude of resources and services that
are vital to our survival and health. The collective benefits of these processes are
known as ecosystem services and goods (Costanza et al., 1997). These services
include clean air and drinking water, and an assimilative capacity for wastes that
we generate. The environment provides four categories of services: provisioning,
such as food and water production; regulating, such as climate control; supporting,
such as crop pollination; and recreational benefits (Costanza et al., 1997).
However, as populations grow, an increasing stress is placed on these services. The
destruction of habitat which supports these services hinders and adversely
impacts the human population’s survival, contributing to poverty.

54
3.3.3 Importance of Biodiversity
Biodiversity is important to human health as it provides various goods and
services. Genetic diversity in food systems provides the foundations of crop
development and food security. It promotes resistance and resilience to
environmental stresses, including pests and diseases of crops and livestock, thus
creating robust agricultural systems. Biodiversity loss and ecosystem change can
increase the risk of emergence/spread of infectious diseases in human, plants and
animals, including economically important livestock (Chapin III et al., 2000). It also
provides important resources for medical research which can lead to
developments in human medicine (such as medicinal herbs) (Newmark, 2002). In
particular, loss of biodiversity can affect ecosystem functions, which in turn affect
ecosystem services which humans and animals rely on for survival (Chapin III et
al., 2000; Gamfeldt, Hillebrand, & Jonsson, 2008).
3.3.4 Reasons for Biodiversity Loss
Biodiversity loss can be attributed to a variety of human activities. These range
from direct to indirect interactions.
Primary extinctions of species may occur from direct hunting to the point of
extinction, or overharvesting, to the point where a population cannot recover and
it becomes extinct. However, one of the main causes is deforestation and habitat
loss. It is the permanent conversion of natural forest area to other uses, including
agriculture, ranching, settlements and infrastructure. It does not include areas
degraded by fuel wood gathering (Wood, Stedman-Edwards, & Johanna, 2000).
Others include secondary extinction, when a species relies on another species,
which has gone extinct, for its survival. Pollution, another factor, affects the health
of the species and ecosystems. It can degrade a species habitat to the point where
it can no longer survive in that environment. Introduced species from other
environments, either through human introductions or accidental introductions can
result in displacement of the native species if the new species is aggressive or more
competitive. One of the most widespread reasons however, is global change. The
impact of changing climate can alter a species habitat and make it untenable for its

55
survival (Wood et al., 2000). Further climate change has resulted in increasing
temperatures, changing precipitation patterns, more frequent and longer lasting
climate-related events which pose large risks for agriculture, food production, and
water supplies. Such environmental issues have the greatest impact on poor
people.
3.3.5 Strategies
Management strategies can be applied at various biological levels, such as at
species population levels and ecosystems, and in situ or ex situ.
Ex situ conservation is usually a last resort in cases where the species is at
imminent risk of extinction and involves removing a species from its natural
setting. Species are then kept in facilities such as zoos, wildlife parks and
aquariums. Captive breeding programmes may be used to increase numbers or
release programmes to help sustain a wild population (Hunter & Gibbs, 2009). In
situ conservation involves actions to maintain species in the wild.
Actions taken to conserve species in the wild often involve preserving habitats and
at this point, strategies for ecosystem management and species population
management merge. Ecosystem, or habitat, conservation may involve the removal
of invasive species which compete with native species; habitat management, such
as fire and flood control; habitat connections to reduce the impacts of island
biogeography, restoration of degraded habitats to improve the species that can be
supported in that environment, and protected areas which prevent any adverse
human activities occurring within their boundaries (Hunter & Gibbs, 2009).
Management strategies may be introduced at a systematic level (through the
implementation of environmental policies) or local level (local conservation
programmes) (Wood et al., 2000).

56
3.4 Conflict between Poverty Alleviation and Conservation Efforts
Past poverty alleviation and conservation strategies have come into conflict. By
outlining goals that are beneficial to both, these conflicts can be avoided. The
conflicts can be summarised as follows.
Some poverty alleviation strategies involve increased development or financial aid.
This can be at odds with conservation strategies if development is unsustainable,
where natural resources are abused by putting perceived economic and financial
gain ahead of environmental losses.
Conversely, conservation efforts can compromise poverty reduction (Adams,
2004). This occurs primarily through the formation of protected areas. For
communities and individuals that rely on natural areas for sustenance and their
livelihoods, this can have negative social impacts. In some cases, this may create
indirect benefits for the poor, such as improved ecosystem services, but strict
protected areas can create animosity and social conflict.
3.5 Ecotourism
Unlike conventional tourism, ecotourism has arisen in the last two decades as a
form of tourism to benefit the environment and the community. The term has
entered the mainstream industry, becoming more popular among both tourists
and operators alike, but the risk of contributing to environmental and cultural
degradation is still a high possibility in cases where it has been adopted merely in
name and not practice as well.
3.5.1 Definition
Ceballos-Lascuráin was one of the first to formally define ecotourism:
travelling to relatively undisturbed or uncontaminated natural areas with the specific objective of studying, admiring, and enjoying the scenery and its wild plants and animals, as well as any existing cultural manifestations (both past and present) found in these areas” (as cited in Weaver, 2001, p. 5)

57
Although this definition is effective in capturing the essence of what ecotourism is,
Acott et al (1998) state that it is possible to have an ecotourist visit a non-
ecotourist destination and for a non-ecotourist to visit an ecotourist destination.
Additionally, Shores suggests that it is inappropriate as it focuses almost
exclusively on the motives of the traveller, and not on the impacts that such travel
has on the cultural and ecological environments of the setting (as cited in Fennell,
2001). Stewart and Sekartjakrarini similarly highlight the supply-side of
ecotourism in suggesting that as an industry it has to be concerned with the host
community, the resource base, and tour operators (as cited in Fennell, 2001).
As the research site is a predominantly natural destination, and is characterised by
increased unsustainable development, an ecotourism definition which is
sustainable and takes into account impact on the environment and community will
be utilised. Thus, ecotourism can be defined using the sustainable tourism
definition outlined by the World Tourism Organisation (WTO), as "Tourism that
takes full account of its current and future economic, social and environmental
impacts, addressing the needs of visitors, the industry, the environment and host
communities" (World Tourism Organization, 2005).
3.5.2 Ecotourism vs. Other Forms of Tourism
As growing environmental awareness has spread amongst tourists, this new form
was developed to reflect their environmentally minded motivations and values
(Smith and Eadington as cited in Jafari, 2003). There are many monikers for a form
of tourism that is sustainable, such as ecotourism, geotourism, nature tourism,
green tourism, low-impact tourism, adventure travel and alternative tourism
(Goeldner & Ritchie, 2006, p. 473) However, identifying the reasons for the
popularity of ecotourism over other forms in literature, and the tourism industry is
difficult to isolate. In the case of this research, this form was chosen based on a set
of performance indicators outlined by Ecotourism Australia and Green Globe 21
and included (Gutierrez, Lamoureux, Matus, & Sebunya, 2005):
1. Direct contributions to the conservation of a natural area
2. Benefits to the local community

58
3. Interpretation and education so visitors better understand and appreciate
nature
4. Opportunities to experience nature
5. Environmental sustainability
6. Cultural respect and sensitivity
7. Customer satisfaction
8. Honest and accurate marketing and promotions
9. Ecologically compatible infrastructure
10. Ethical standards and codes of conduct
11. Management and operational guidelines on minimizing impacts
There were other tourism types which are similar, but were not as comprehensive
as ecotourism in meeting research objectives. Responsible tourism shared similar
cultural aspects and is defined as culturally sensitive tourism. It promotes mutual
respect between tourists and hosts, and includes the building of local pride and
confidence in destinations. Sustainable tourism protects and increases future
opportunities while meeting the needs of present tourists and host regions. The
ecotourism definition utilised in this research uses a sustainable tourism
definition. However, it was chosen over sustainable tourism for the destination’s
orientation towards nature. Nature-based tourism relies primarily on the natural
environment for its attractions, however, lacks any emphasis on sustainability.
Similar to nature tourism is adventure tourism with the added risk factor and
higher levels of exertion associated with activities. Geo-tourism fits quite closely
with the destination features as it is based on the destination’s geographical
character, including the environment, heritage, aesthetics and culture.
Furthermore, it aims to maintain these features and aid in the welfare of residents.
However, it is not as well-known as ecotourism and could require increased
marketing if the form created confusion in the industry. Pro-poor tourism was
geared towards helping poor people in the areas visited by tourists, but does not
consider other aspects such as environmental impacts (Vashakmadze, 2008).

59
3.5.3 As a Conservation and Poverty Alleviation Strategy
Conservationists are increasingly promoting the argument that biodiversity
underpins poverty reduction because of the importance of natural resources to the
livelihoods and well-being of the poor (Walpole & Wilder, 2008). As such,
strategies which have goals towards benefiting both the environment and
community could have high chances of success.
Ecotourism provides an incentive for residents to conserve the environment as it is
main attraction for the local tourism industry (Stronza, as cited in Appiah-Opoku,
2011). In rural regions it can stimulate economic activities and reduce rural-urban
migration, which is a correlate for poverty (Wells, as cited in Appiah-Opoku, 2011).
It also provides a potential alternative income to economic activities that may have
been damaging to the environment. Additionally, the ecotourist spends more
money than the average mass tourist. This would have a dual benefit of reducing
the impact of tourism on the environment by staying within the destination’s
carrying capacity, while still generating an adequate income for residents. There
have been ecotourism cases which have been successful and unsuccessful at aiding
conservation. The differences between success and failure were difficult to target,
but in some cases were a result of poor implementation, lack of communication
and interaction with community and visiting tourists.

60
CHAPTER 4: RESEARCH METHODS The appropriate tools and methods to carry out the research were identified by
reviewing the literature and investigating the research site. These are outlined in
this chapter and include the development of tools and the data gathering process
implemented. The chapter is divided into sub-headings describing each data
collection tool - processes employed in the field to gather data. The ethics of the
research and data collection process is reviewed as well as limitations.
A mixed methods approach was used as several different methods and tools were
required to collect the necessary data. There are four techniques used: survey data
to collect quantitative data about tourists and vulnerable residents; interviews to
collect more detailed information from vulnerable residents and key informants;
an attractions inventory; and personal observations.
4.1 Research Design
The research strategy used involved a mixed approach method as described by
Churchill (1979). There are several stages including the initial literature review,
which gathered information regarding tourism, conservation and poverty. A study
of the research site based on scientific and historic literature, internet based
information, and communications with an ex-resident provided all the knowledge
that could be found prior to first hand data gathering during fieldwork. It provided
an understanding of what areas were lacking in information and what tools would
be feasible in the field. Previous studies in the area have not focused on capturing
tourist data or residential data - as such the tools developed aimed to capture as
much information as possible. The strength of using a mixed approach method is
the ability to capture detailed information about the research situation, as well as
more generalised information from a large population to identify and create a
more complete understanding about Yercaud, the residents, and tourists visiting
the Taluk (Tashakkori & Teddlie, as cited in Sandelowski, 2000).
Three different methods were used to meet the objectives of this study. These
were questionnaires, interviews and personal observations. Questionnaires were

61
used to gather information about vulnerable communities and assess the potential
for their involvement in future ecotourism. Questionnaires were also used to
identify the current tourist market and determine the potential demand for
ecotourism. Interviews were used to identify further information regarding the
target resident community; environmental issues in the Taluk; and undeveloped
local resources for ecotourism development. Personal observations were made
throughout data collection to capture unrecorded information that would assist in
answering the research objectives.
Fieldwork started with collection of the most accessible data - interviews with key
informants and stakeholders - to utilise time efficiently while surveys were
translated. Additionally, this ensured that participants were available for
interviews and was an opportunity to identify other key informants quickly. This
permitted the identification of the target populations and feedback on resident
surveys.
4.2 Questionnaire design
Survey lengths are usually kept as short as possible to ensure high and valid
response rates (Layne & Thompson, 1981). However, the desired data could not be
acquired by reducing the length. Recommendations for longer surveys suggest a
less cramped layout with more “white space” to make them look easier to complete
and thus increase response rate (Bradburn, Sudman, & Wansink, 2004). However,
this was not viable with the questionnaires; while it was employed to some degree,
creating more white space would have made them too long, impairing the
advantages of this method.
The drawbacks of the long survey length were overcome through the method of
administration. A paper-and-pen method was used and while it is more costly and
time consuming, it also permitted the opportunity for further questions to clarify
or gain additional insights not captured through the survey tool. This approach
was a suitable choice for the situation as this permitted a representative and
diverse sample. Additionally, personal interaction made participants more

62
cooperative - interviewers could raise the quality of responses by highlighting the
importance of the respondents’ contributions and of the research.
Both questionnaires were translated into Tamil, and then translated back to
English to ensure that errors were minimal during the translation process and that
the original meanings were retained (Iarossi, 2006). Additionally, two separate
translators checked surveys to ensure their meanings were retained after
translation. Leading questions, loaded questions, and double-barrelled questions
were avoided. Multiple choice questions provided all reasonable response
alternatives; an option for respondents to provide their own response was
provided to ensure all possible answers would be captured.
Likert items were used extensively in both tourist and resident questionnaires to
gauge attitudes of respondents. The scales did not follow traditional 5-point agree-
disagree Likert scales as set out by Churchill (1979) and varied between
questionnaires. To reduce confusion that might occur among structurally similar
questions, different formatting was utilised to highlight the key terms.
Both survey tools utilised a cover page with similar information regarding the
purpose and importance of the research. This was followed with details of the
researcher including contact details, should there be additional queries regarding
the study. Confidentiality of the participants was emphasised and approval of the
ethics behind the research had been provided to confirm the authenticity of the
survey.
4.2.1 Tourist Questionnaires
During the development of tourist questionnaires, particular attention was paid to
collecting as much information about tourist preferences and motivations. This is
to provide information which can be utilised by residents to improve and develop
sustainable, but appealing attractions and services. Thus, survey length was longer
than recommended at six pages. However, personal interaction with the
respondents made participants more tolerant of the longer questionnaire and
uptake of the questionnaire was high.

63
Easily answered introductory questions regarding demographic information and
trip characteristics were designed to facilitate and encourage the transition into
more detailed and sensitive questions. The latter questions concerned expenditure
during their trip. The depth and detail required of the introductory questions were
used to enhance understanding of the level of disclosure required for the
questionnaire (Bradburn et al., 2004). The final question looked at tourist
satisfaction of their experience in Yercaud. It followed previous questions
regarding tourist destination attractivity factors, and important activities and
services for respondents. A copy of the tourist survey (English) can be found in
Appendix 4.
4.2.2 Resident Questionnaires
Development of resident surveys focused on identifying the characteristics of the
target sample population and lifestyle circumstances. Further, it attempted to
identify the human resources and knowledge that were available for utilising in
ecotourism development. Many of these people have poor literacy skills and it was
originally planned to conduct interviews alone to identify hardships which this
population faced. However, as villages would be visited personally, using
questionnaires would permit the collection of data on income and expenditure,
which is lacking from the area. Furthermore, time and resource constraints made
the use of interviews as the primary source of data collection for this population
unfeasible in comparison to questionnaires. The questionnaires were translated
into Tamil, but a translator was still required to administer the tool.
The introductory questions were designed to capture valuable demographic and
lifestyle data. Questions regarding environmental interactions and opinions were
to determine resident opinion and knowledge regarding their environment.
Attitudes towards tourists were also measured. The final question explored how
residents felt they could contribute towards tourism activities and services. It
aimed to identify their confidence in being able to participate in a tourist related
job or to identify in which areas training would be required for residents.
Additionally, it identified a local resource base that could cater to tourist demands.

64
Additionally, interviews with several people who employed tribal villagers
indicated that they were dissatisfied with their attendance at work. The
generalisation was that this group of people was untrustworthy and lazy, attending
work a few days out of the week. To investigate this claim a question was included
in questionnaires. Several villages and other key informants were asked to offer
explanations for this statement. A copy of the resident survey is found in Appendix
4.
4.3 Pretesting, Pilot Study and Implementation
Prior to wider implementation of surveys, pre-testing was necessary. This involved
administering the survey to a small group of subjects and gaining feedback about
any points of confusion or areas for improvement. These were then taken into
account and the relevant changes made.
4.3.1 Tourists
Tourist questionnaires were checked by the researcher’s supervisor prior to
fieldwork being carried out. They were then tested on a small sample of tourists
staying overnight. Three issues were raised by this sample group, these being that:
the survey was too long; a bit repetitive; and the Likert scale questions a little
difficult to understand. With this feedback, two changes were made. The Likert
scaling, wording and numbering was modified so it would be more easily
understood; and the length of the survey was shortened, by removing scaled
structured questions which were similar to each other. A few tourists still felt the
questionnaire was a bit lengthy, but feedback had improved greatly. Moreover, the
issue of length was further circumvented through administering questionnaires
using a paper-and-pencil method and remaining with the participant until
completion.
4.3.2 Residents
Resident questionnaires were checked by the researcher's supervisor and later by
key informants working with vulnerable community groups at the research site.
Income and expenditure questions which were based on calculating figures

65
annually were changed to a monthly basis. Key informants pointed out that this
would be more reliable as resident respondents lived on a weekly and monthly
basis and did not keep track of their activities on an annual basis (Banerjee,
Benabou, & Mookherjee, 2006). These questions were also applied at a household
level rather than individual level to ensure information could be applied to
children and other dependents in the household.
Questionnaires were then tested on a small sample of villagers that were identified
and gathered by a key informant. A conventional pre-testing method was utilised;
various questions were posed during debriefing to ensure that the sample group
understood the purpose of the research, the questionnaire and to identify any
issues that arose while answering them. This also provided the opportunity to
ensure the key informant administered the questionnaires correctly as they were
also acting as a translator for village visits. Doubts were raised regarding accuracy
of their explanations regarding the research purpose and questionnaire as their
proficiency in English was limited. This initial uncertainty was substantiated
during a second excursion with the key informant and an individual who was also
assisting the researcher. The assistant, who had some understanding of the
language, pointed out that the reason for the research, and the survey tool was not
being properly explained to participants.
Furthermore, there was the possibility of interviewer bias, as the key informant
was well known to the target population and influential with them as well. To
reduce the impact of interviewer bias and ensure that future questionnaires were
conveyed as intended, a translator was engaged. The assistant observed another
questionnaire session and confirmed that the translator had conducted the
questionnaire more effectively. The translator was completely unknown to the
participants, thus reducing interviewer bias that was likely occurring with the key
informant.
The pilot study with the sample resident group brought up several issues which
were addressed. Respondents commented that spacing was inadequate. Some
found it insufficient because they had poor literacy/writing skills and required

66
more space to fit their sentences in. Later surveys therefore provided more space
for responses (Layne & Thompson, 1981). To overcome literacy issues observed in
the sample group, the questionnaire was read out to the respondents so they
would not misunderstand questions. In addition, questionnaires would be filled
out for them if a literate relative was not available to help.
4.4 Sample Design and Implementation
There are several problems associated with data collection through surveys. These
include exclusion of certain groups through sampling methods, or inclusion of
groups based on convenience, and survey tool limitations. The sampling methods
used are described. Efforts were made to avoid the issues identified and any
potential sampling bias that may have occurred is explained and described in the
following sections.
4.4.1 Tourists
For the purpose of this research, the sample tourist population was identified as -
individuals who were in Yercaud at the time of surveys and who were not
permanent residents or worked daily in the Taluk. These people were asked to
complete questionnaires when they were encountered. However, the
characteristics of this sample population required a survey technique which took
into account their mobile nature. For this reason, location sampling was utilised in
combination with a paper-and-pencil method.
The sample population was selected based on their willingness to participate, their
presence at a few popular tourist attractions and a range of accommodation
options (from dormitories to luxury hotels) (Kalton, 2001). These were primarily
completed during weekends with some opportunistic sampling during weekdays if
tourists were present at tourist attractions.
Self-administering surveys using the paper-and-pencil method allowed the
researcher to be mobile as well and capture a range of tourist types. This also
ensured a high response rate as personal interaction meant that participants rarely
refused to answer a questionnaire; were more receptive, as the interviewer

67
remained with the respondent until completion to collect the survey; and so were
more likely to answer conscientiously. Responses are more reliable with this
method as questions could be explained to respondents immediately if there was
confusion and participants were less likely to be negative about the length of the
survey.
4.4.1.1 Bias
There is potential for omission bias due to the sampling method used. That is, it is
possible certain groups of tourists were excluded - tourists groups who chose not
to visit the most popular attractions and stayed in accommodation options out of
the main tourist area. Observations and personal communications showed that
Yercaud is mainly a weekend attraction and very few tourists visit during the week
(unless there are holidays). To compensate for this, multiple tourist sites and
accommodation types were sampled.
4.4.2 Residents
The sample resident population was identified as vulnerable groups in the Yercaud
Taluk - those that face hardships gaining access to safe drinking water, health,
shelter, education, food and services. As such, to locate the sample population that
fit this definition, the help of key informants was required.
Two key informants were able to indicate the target population, majority of whom
lived in villages outside of the main town. Some residents were also sampled
within the town of Yercaud. 16 villages out of 67 were sampled - including Yercaud
- based on accessibility, time, relevance to research and potential for development
based on the recommendations of key informants.
Two different sampling techniques were involved. The first key informant
accompanied the researcher to villages. They arranged for people from a group
they worked with, to gather and fill out surveys. They were predominantly women
from different households and it was done during the evenings when villagers
would be home from work. The second key informant organised excursions during
the mornings while being accompanied by a translator and helper. Individuals and

68
households were chosen based on whether they were present at the time of the
village visit and their willingness to fill out a questionnaire.
4.4.2.1 Bias
A combination of response bias and interviewer bias may have occurred during
some village visits. Residents may have responded to questions with the idea that
they might receive benefits if their living situation was exaggerated. This issue
would have occurred with initial visits made with the first key informant (who ran
a society to aid community groups). This could have led to residents believing that
the researcher had visited to provide financial aid. Furthermore, the key informant
may have given residents the impression that this was the researcher’s intention,
also resulting in a similar outcome.
Inclusive bias could have been introduced when the key informant gathered
groups of people who they interacted with through the Society. As such, this group
was a convenient choice and may not have been a representative sample. This
potential bias was partially resolved by using a translator and visiting villages
without a pre-organised meeting.
On the other hand, this second sampling method occurred during the day while
working individuals were away and could have introduced omission bias. This was
avoided by the fact that household members were aware of details, such as income,
and possibly more aware of other details such as expenditure as they may have
taken care of household shopping and other expenditures.
4.5 Interview Design
The depth of village and key informant interviews was not anticipated. As the
survey tools were the main data gathering tool, the choice to include more detailed
interviews was a result of the villagers’ and participants’ willingness to aid and
provide information towards the research.
The initial development of interviews was designed to be short, at most 20 minutes
in length. However, interview length varied greatly, ranging from 5 minutes to 60
minutes. In the case of village interviews which could be very long, this was due to
69
extra time the translator spent communicating between the researcher and
participants. Furthermore, the number of participants was greater than expected,
as only a few key informants were initially selected, but due to the enthusiasm for
the research many additional people were eager to provide detailed information.
Original plans had included short questions about participants’ opinions and
knowledge regarding tourism in the area, the environment (biotic and abiotic
features), and conservation. This was expanded to include questions regarding
poverty and hardships faced by communities in the Taluk; additional information
participants had regarding the background of Yercaud - as this was deficient in the
literature; information regarding economic activities in the area; and more
detailed questions regarding tourism and the environment.
Interviewees were various stakeholders in the regions and included: authority
figures in the Taluk; members of non-governmental organisations and community
groups who worked with villagers; accommodation owners and managers. As the
opportunity presented itself to interview groups of villagers with more in-depth
questions than originally planned, it was decided to take advantage of this. Key
informant interviews were semi-structured and resident interviews were more
unstructured, but followed along similar threads. Table 11 provides an outline of
the interviews conducted.

70
Table 11: Interview Guidelines.
Semi-structured Interview Guidelines:
1. Introduction
a. Interviewer introduction
b. State research purpose
c. Reason for interviewing individual/group
d. Receive permission to record interview
e. Discus preferred interview structure for interviewee i.e. Would they like to talk in general about topics
or would they prefer if I asked questions first and then added to it
2. Key informants:
a. Personal Background
i. History in Yercaud
ii. Occupation/Business
iii. Personal interactions with vulnerable communities/tourists/environment
b. Yercaud
i. History
ii. Flora and fauna (past and present)
iii. Development trends
iv. Environmental issues and threats
v. Vulnerable communities and poverty
vi. Harmful economic activities in the area
vii. Yercaud statistics
c. Tourism and ecotourism
i. Personal suggestions for implementing ecotourism
ii. Threats from tourism
iii. Potential for ecotourism
iv. Potential threats from increased tourism
v. Undeveloped tourist attractions
vi. Tourism statistics
d. Other key informants who should be contacted
3. Residents:
a. Personal experiences
i. Difficulties or problems in daily life e.g. educating children etc.
ii. Negative experiences with tourism/tourists
iii. Negative experiences regarding aid schemes e.g. government schemes
iv. Problems from nearby economic activities e.g. coffee plantations
b. Environment
i. Threats to wildlife
ii. Threats to environment
iii. Personal opinions/attitudes towards environment and wildlife
c. Tourism and ecotourism
i. Undeveloped tourist attractions
ii. Local cultural attractions (festivals, traditions, cuisine)
iii. Personal opinions and attitude towards ecotourism development in the area
4. Conclusion
a. Further information to add

71
4.5.1 Bias
As with any qualitative work, there is potential for bias. This was reduced by
maintaining and expressing impartial opinions as much as possible during
interviews and genuinely displaying interest in participant’s opinions and
knowledge.
The use of a translator, in cases where a language barrier existed, ensured that
unintentional cues from the researcher were not transferred to the interviewee in
their speech.
The bias of the translator would be minimal as the participants were unknown to
them; they were earnest and honest about helping the researcher; and their own
motivations to help was enjoyment from being able to visit various villages and
interact with different people.
4.6 SWOT Analysis
A SWOT analysis was conducted to assess the practicality of executing this project
in Yercaud. It was completed using available literature about the area; personal
observations of the target populations and some internet opinions about the area;
personal assessment of available resources; and personal communications with
stakeholders and key informants.
4.7 Attractions Inventory
A list of attractions was identified via tourist guides, the internet and key
informants. Time constraints, accessibility and safety issues meant that not all
potential attractions were visited. Existing popular tourist attractions were visited
and assessed due to ease of access and current importance to tourism. Less
popular attractions were difficult to visit due to their more remote location - these
were natural attractions which to reach required trekking and would have been
valuable attractions to develop for ecotourism or adventure tourism. Undeveloped
attractions nearby, or in villages were difficult to identify. Many residents claimed
there was nothing to see nearby and only Yercaud town had attractions that would

72
interest tourists. Ideally, without time constraints, personal identification of
potential attractions would have been conducted. Attractions and their
surroundings were critically analysed - they were categorised into natural or
cultural and their location and ease of access considered.
Information gathered regarding attractions was then collated and organised into a
table providing a brief description and location in the form of geographical
coordinates. Two additional tables were created based on development required
for ecotourism and environmental fragility of the area. The final table scores
attractions, based on a range of factors to provide a final mark and ranking. The
factors were based on those set out by Gutierrez, Lamoureux, Matus, and Sebunya
(2005) and tailored to apply to the research site.
4.8 Personal Observations
These were made to describe events or behaviours that were pertinent to the
research during interviews and the administration of questionnaires. Subjects
were aware of the researcher’s presence and purpose of the research. Personal
observations were also used to record observed environmental issues using the
researcher’s environmental and ecological knowledge.
The main disadvantage about subjects being aware of the researcher and their
purpose is the fact that they might modify their behaviour to portray themselves
favourably or to their advantage. However, this approach has the advantage of
being within the boundaries of the necessary ethical guidelines, as subjects are not
deceived to make these observations (Price, 2010). These observations were
valuable in that it provided a greater sense of understanding of the subjects and
their circumstances, values and perspectives. Further, this enables more reliable
and relevant conclusions to be drawn about the research.
While some interviews and surveys provided information regarding
environmental issues, these did not fully capture the situation. Thus, personal
observations were used to provide more detail to stakeholder identified issues and
other issues observed by the researcher.

73
No form of analysis is used, but instead they are included in the discussion to
enrich the data collected.
4.9 Research Ethics
The data collection processes presented a low risk to the researcher and
participants. To ensure that all interactions in the field remained low risk, actions
and precautions which were necessary were taken.
Personal observations were made overtly, while participants knew the role and
purpose for the researcher’s presence. Therefore, any form of deception was
avoided. Additionally, any risk of harm from the disclosure of observations is
avoided through maintaining the anonymity of vulnerable participants.
Questionnaires had the potential to cause discomfort due to the sensitive nature of
some aspects. Questions are considered high risk if they cause discomfort or
embarrassment. Sensitive questions regarding the participants’ lifestyle and
economic situation were posed in surveys. However, discomfort was reduced or
avoided as participants knew they were free to leave questions unanswered if it
distressed them. Furthermore, the reasons for the research were openly
communicated, in particular the fact that the involvement of vulnerable groups
was required. In situations where participants could not read or write;
embarrassment was avoided by explaining and emphasising that their
participation was important to aid the researcher and was for the individual’s
benefit and the wider community. Finally, all surveys are anonymous; there is no
communication of survey number or region regarding sensitive information, thus
ensuring participants cannot be identified
Interviews have been conducted in a similar manner. Where necessary,
interviewees have remained anonymous. Voice recordings are secured and
discarded once a transcript has been made to ensure confidentiality.
Social norms and appropriate code of conduct was observed while the fieldwork
was carried out. A local translator acted as a chaperone for safety measures and to
provide guidance for acceptable interactions.

74
The aforementioned activities ensured the researcher had a low impact and stayed
within the bounds of the ethical guidelines as set out and approved by the Massey
University Research Ethics Office.
4.10 Limitations
Several limitations were identified and are outlined below.
4.10.1Data Collection
This study was conducted during the off peak season and as such, the same
conclusions may not apply for those visiting during the peak tourist season.
However, it is known for certain, from the present study and historical literature
that the destination has been popular for its climate and that is very likely to be
one of the main motivations for many peak season tourists for visiting the area.
Some data were not available. A particular example of this was seen in regards to
getting information from the Botanical Survey of India (BSI) regarding
unique/rare/endemic flora. Information regarding endangered, endemic or native
species would not be released to individuals as the information falls under the
Central Government and not the State Government jurisdiction. Authority to
release information would have to be gained from them and would only be
released to the Departmental Head in Massey University. The reason cited for this
was the risk of smuggling and illegal trade of these species.
4.10.2Sampling
One of the major limitations of the tourist questionnaires is that domestic tourists
were the only ones surveyed. It was noted that a few international tourists were
observed in Yercaud, but a refusal to participate in the study meant this tourist
group could not be considered.
Due to time, resource constraints, survey length and characteristics of the target
populations, sample sizes were limited and might be insufficient for statistically
significant results.

75
4.10.3Questionnaires
There was a trade-off between complexity and length of the survey and sample
size. The more questions asked, the less likely tourists were willing to answer and
participate. Thus, the number of surveys completed was limited. In the case of
resident surveys, time constraints were the more important limiting factor as
residents were willing to answer long questions and were eager to provide
information. There is a chance that residents were answering with what they
thought interviewers wanted to hear. Also, it appeared as though many
participants had never been asked questions of this nature before (such as those
associated with the health of their surrounding environment). As such, they may
not have had sufficient time to give it proper thought to accurately reflect the
situation.
Unfortunately, some typos were allowed to remain in the surveys. Although these
errors were found the researcher decided against reprinting due to major technical
problems (extensive power cuts made printing surveys challenging). Translation
to Tamil required some reformatting, in some cases this meant the English version
had to be readjusted, to ensure no confusion arose for the researcher and those
assisting in administering the survey. In this process some typos have come
through. Additionally, this could have resulted in the attractiveness of the survey
being reduced marginally.
4.10.4Respondents
Cultural conclusions drawn about residents could not be applied using other hill
stations as the tribal populations vary considerably between them. Furthermore,
there is a possibility that respondents did not fill out surveys honestly or
accurately (in the case of not understanding questions).

76
CHAPTER 5: DATA ANALYSIS AND RESULTS Data obtained using the methods of collection outlined in the preceding chapter
have been presented here. This section details the analyses used and subsequent
results and presents the information gathered from the survey tools. The data
presented attempts to fill the gap in information available regarding two aspects:
tourist characteristics and attitudes; and resident villager economic situations.
Additionally, potential relationships were investigated to seek explanations for the
situation observed.
The first section covers the analyses performed on data gathered. This leads into
the results produced from this data exploration. The data did not require complex
analysis, however, trends that were observed are presented or described to
support results from descriptive analyses. Tourist data has been presented first
and divided based on differing characteristics that were surveyed. Resident data
follows in a similar pattern. The third section provides a SWOT result. It is based
on the destination’s potential for ecotourism development and has been completed
using personal observations and survey or interview data. The final results section
presents the attractions inventory put together from field notes and available
literature.
5.1 Analysis
These descriptive statistics will be used to characterise and profile respondents
(Churchill, 2009). It can be useful in demand forecasting for marketing and
running promotions.
Data analysis primarily focused on questionnaire data and makes up the bulk of
the results presented.
Extensive interview data was also gathered, which provided various valuable
insights into the location and phenomena being investigated. The method in which
they were handled, including reasons for this course of action, have been outlined
below.

77
A SWOT analysis was completed using information gathered from informal
interviews, survey comments, and personal observations. It evaluates Yercaud as a
potential ecotourist destination.
The final component of the results section is the compiled inventory of existing and
potential tourist attractions located within the Yercaud Taluk.
5.1.1 Questionnaires
Analysis of questionnaire data involved several stages. The initial step required
input of data into a software package and Microsoft Excel was chosen for its ease of
access, user-friendliness and range of basic functions available.
Tourist and resident data were inputted into separate Microsoft Excel workbooks;
this provided an easy platform to clean data, check for accuracy of data entry and
consistency of responses to interrelated questions (Iarossi, 2006).
Descriptive statistics were completed in Excel, while a few more advanced
analyses were completed in Minitab 16. Missing data required the use of an
imputation technique in order to perform analyses. This process has been outlined
below.
Most Likert item responses have been presented in a table showing the mode for
each response item. Contingency tables investigating relationships were
completed in Minitab 16.
5.1.1.1 Editing and Missing Data
After the input of data into Excel worksheets, a process of examining the responses
to ensure they were logical, accurate and consistent was carried out. This also
included coding and filling in of missing data (Iarossi, 2006).
Categorical responses were assigned a numerical code to make its use in analyses
possible. In the case of non-legible or indistinguishable responses to survey items,
these were coded to indicate that there was a response, but could not be
categorised. These cases were assigned to ‘other’ where the item context
permitted, or assigned to a similar category - this was an attempt to retain the
78
information despite lack of clarity. For questions that generated a large range of
different responses (more than ten), responses were consolidated into broader
categories or ‘other’/related equivalent depending on their context. Item
responses which had the lowest frequencies were those selected for reassignment
into broader categories.
Tourist and resident missing data consisted of item non-response. A process of
deductive imputation was possible in a few cases as it was possible to identify with
a high probability what their answer would have been (Brick & Kalton, 1996). This
is due to the survey method which allowed personal interaction with the
participant; it was possible to gather the missing information through
conversation with participants and fill in missing answers when the survey was
returned to the interviewer. In other cases of item non-response, blanks were left
to indicate the value “Not Applicable” which was later rectified during input and
cleaning.
Missing data were not an issue for descriptive statistics, which are the
predominant results provided from the surveys. However, in order to determine
correlation between items it was necessary to impute data - correlation should
only be done on complete data sets and case deletion would have risked
introducing non-response bias. Missing data were dealt with using two methods.
The first round involved case deletion of surveys missing large portions of
responses. This occurred mostly amongst Likert scale items, which had multiple
sub-items. These cases were missing more than approximately 80% of the
variables used in analyses not including open ended questions. Following this a
combination of hot deck imputation and mean imputation was utilised and
Durrant explains them in greater detail (2005).
Hot deck imputation involved using values from similar cases to replace missing
values (Durrant, 2005). For example, a student whose highest degree of education
was higher secondary school, and had failed to provide their age were more likely
to be younger than the mean of the sample population. Therefore, the value from a
similar case was utilised instead of the sample age mean. Reducing the number of

79
cases that were dropped through these imputation methods maintains statistical
power and reduces non-response bias.
These responses were coded for analysis, with some items requiring collation of
data before being transferred to a more powerful statistical software package for
further analysis. The choice of software package was Minitab 16; chosen for its
ability to complete the desired analyses, ease of access and user-friendliness.
Contingency tables (two-way tables) were completed on this platform (Ashcroft &
Pereira, 2003).
Items removed from analyses occurred due to high number of non-response or
uncertainty regarding accuracy of responses associated with those items. The
tourist survey had two questions which met these criteria. These were Questions
7b and 8. The first had poor response rates, while the second generated too much
confusion to ensure accurate responses. The resident survey had one question
with poor response rates- Question 15 and its sub-questions. This was likely due
either to confusion on how to answer the question or lack of genuine information
to supply. The responses have not been included in the results section, but the
information has been used to supplement other concepts and observations.
5.1.1.2 Descriptive Statistics
In the case of presenting survey data, descriptive statistics can be a strong and
effective method of analysing the data (United Nations Statistical Division &
National Household Survey Capability Programme, 2005). Thus, survey items have
been summarised through the use of graphs and tables. This method of analysis
also highlights the presence of outliers in data and several were identified in
various items. Outliers were excluded from subsequent analyses to ensure
accuracy and credibility of data if there was no valid explanation for its presence
(Iarossi, 2006).
The extensive use of Likert items throughout both surveys meant that a simple
percentage and tabulation would be insufficient to properly visualise and present
data (Churchill, 1979). For tourist surveys, Likert items were collated and
represented in a table showing the mode for each item response (Jamieson, 2004).

80
Due to the nature of responses in resident surveys, however, a table showing
mode, mean and standard deviation was chosen to display Likert item data and the
variability in responses.
5.1.1.3 Contingency Tables
Contingency tables were used to display the relationships between two items and
required the use of Minitab 16 to cross tabulate. These were used for both tourist
and resident surveys and subsequently had a ‘heat map’ style applied to highlight
different frequencies across item variables. This is an effective and simple method
for displaying information regarding the relationship between two items with
multiple categories.
5.1.1.4 Correlation
Strength of relationships between items was measured through the use of
correlation coefficients. Correlation between parametric variables utilised
Pearson’s correlation coefficient while Spearman’s rank correlation coefficient was
utilised for non-parametric variables (Ashcroft & Pereira, 2003). A p-value for
correlation coefficients was also generated. This was also used to determine
whether correlation between variables differed significantly from zero.
In cases where coefficient values were greater than 0.5, the variables were
investigated further using more advanced analyses. However, tests such as
Kruskal-Wallis or Chi-square did not provide any constructive information.
Most correlation coefficient values were either weak (0.0 - 0.3) or moderately
strong (0.3 - 0.7). As many of the correlation values showed a low moderate
relationship, only values greater than 0.5 and with a significant p-value were
considered suitable.
5.1.2 Interviews
While it was decided that qualitative analyses would not be feasible, the
information gathered was utilised throughout to supplement observations and
survey data. Interviews were transcribed; however, no analyses were carried out

81
on interviews, as the main focus was to examine information gathered through the
survey tools.
Information from interviews of key informants was utilised in various ways. Key
informants who dealt with residents provided valuable information which was
used to help shape questionnaires presented to residents. Other informants
provided information regarding the research site which was utilised in Chapter 2,
as available literature did not provide adequate coverage. Information was also
used to complement survey data and is used to provide more in-depth insights in
the discussion, Chapter 6.
5.2 Questionnaire Results
A total of 268 surveys were collected over a two month period (August-October
2012) from tourists and residents in the Yercaud Taluk. This involved visiting
several tourist spots and residential villages.
For both tourist and resident questionnaire results, descriptive statistics have been
presented first to provide characterisation of these groups and are followed by
analyses which investigate relationships of interest to the research.
5.2.1 Tourist Surveys
A total of 138 tourist questionnaires was gathered, with participants having been
approached at tourist attractions and accommodations. All survey data was
utilised in analyses except if they were deemed outliers. Additionally, during
cleaning of data, answers that were illegible were discarded and contributed to the
following values obtained for survey completeness. 118 (86%) surveys had
completed no less than approximately 90% of the questionnaire; and only 5 (4%)
surveys had completed less than approximately 50% of the questionnaire. Each
Likert sub-item within attitude questions was treated as an individual question. As
such, each unanswered Likert sub-item contributed to overall completeness.
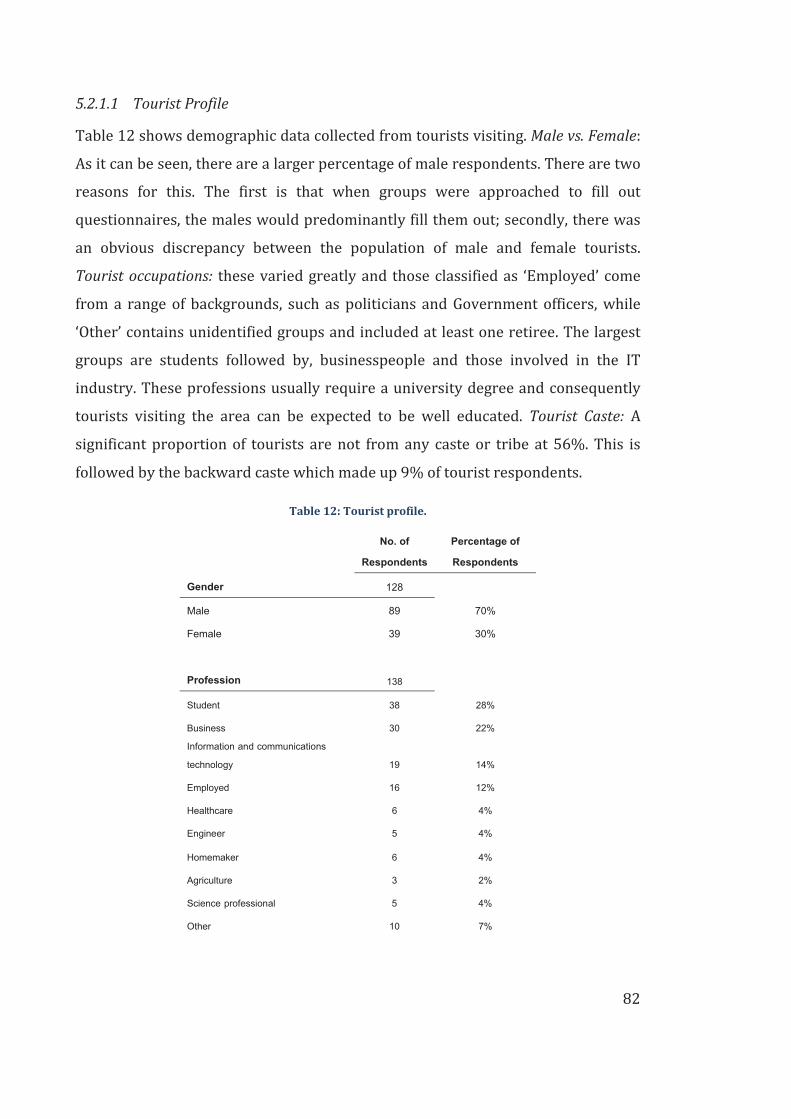
82
5.2.1.1 Tourist Profile
Table 12 shows demographic data collected from tourists visiting. Male vs. Female:
As it can be seen, there are a larger percentage of male respondents. There are two
reasons for this. The first is that when groups were approached to fill out
questionnaires, the males would predominantly fill them out; secondly, there was
an obvious discrepancy between the population of male and female tourists.
Tourist occupations: these varied greatly and those classified as ‘Employed’ come
from a range of backgrounds, such as politicians and Government officers, while
‘Other’ contains unidentified groups and included at least one retiree. The largest
groups are students followed by, businesspeople and those involved in the IT
industry. These professions usually require a university degree and consequently
tourists visiting the area can be expected to be well educated. Tourist Caste: A
significant proportion of tourists are not from any caste or tribe at 56%. This is
followed by the backward caste which made up 9% of tourist respondents.
Table 12: Tourist profile.
No. of
Respondents
Percentage of
Respondents
Gender 128
Male 89 70%
Female 39 30%
Profession 138
Student 38 28%
Business 30 22%
Information and communications
technology 19 14%
Employed 16 12%
Healthcare 6 4%
Engineer 5 4%
Homemaker 6 4%
Agriculture 3 2%
Science professional 5 4%
Other 10 7%

83
Age Group: Yercaud is visited by a largely younger population, see Figure 14. They
fall between the ages of 16 to 35. Retirees, who would be expected to make up the
over 50 age groups make up less than 10% of visitors to the area. The average age
is about 30 years old.
Figure 14: Age groups of surveyed tourists visiting Yercaud Taluk.
Tourist Income: Figure 15 shows that the largest income bracket which tourist
household incomes fall into is the ‘Rs 250,000 - 500,000’ category. This makes up
29.3% of the 116 item responses provided. Less than 10% of tourists had a
combined household income of over Rs 2,000,000

84
Figure 15: Combined annual household incomes of tourists visiting Yercaud Taluk.
Education: Over 50% of those visiting held a university degree and nearly 30% had
a post-graduate degree. This reinforces the concept that tourists are well educated
(Figure 16).
Figure 16: Highest level of education of tourists visiting Yercaud Taluk.
0
5
10
15
20
25
30
35
40Fr
eque
ncy
Income Categories (Rs)
Tourist Income Groups
0
13
74
39
8 4
Tourist Education Levels

85
5.2.1.2 Tourist Trip Characteristics
First time vs. Repeat Visitor: A large percentage of tourists are first time visitors
(62.5%), but a considerable number are repeat visitors (37.5%) to the area. This
can be seen in Table 13. Arrival Day: 10.3% of visitors arrived between Monday
and Thursday while the vast majority, 90%, arrived on Friday or the weekend
Table 13: Tourist trip characteristics.
No. of
Respondents
Percentage of
Respondents
First Time visitor 85 62.5%
Repeat Visitor 51 37.5%
Tourist Arrival Days 127
Monday 2 1.6%
Tuesday 1 0.8%
Wednesday 7 5.5%
Thursday 3 2.4%
Friday 25 19.7%
Saturday 68 53.5%
Sunday 21 16.5%
Length of Stay (days) 136
1 27 19.9%
2 58 42.6%
3 40 29.4%
4 7 5.1%
5 4 2.9%
Frequency of Past Visits: Of the 51 repeat visitors, seven (13.7%) were guardians or
relatives of Montfort School boarders. These individuals regularly visited Yercaud
and contributed to those making more than 15 visits. Six tourists, who had visited
more than five times, were not associated with Montfort boarders, instead visiting
for leisure.

86
Figure 17: Number of visits made to Yercaud by repeat visitors.
Length of Stay vs. Arrival Day: Table 14 shows the relationship between duration of
stay and arrival day. Higher numbers can be seen where patches are darker. Lower
counts have lighter gradations. Predictably, tourists arriving on Friday or Saturday
are most common while tourists staying for 2-3 days make up most of visitors at
72%.
Table 14: Length of tourist stay vs. tourist arrival day.
Arrival Day
No. o
f day
s
Monday Tuesday Wednesday Thursday Friday Saturday Sunday Total
1 0 0 0 0 1 23 1 25
2 1 1 0 1 15 33 3 54
3 0 0 1 1 9 9 17 37
4 0 0 3 1 0 3 0 7
5 1 0 3 0 0 0 0 4
Total 2 1 7 3 25 68 21 127
Tourist Expenditure: Figure 18 shows the total amount that tourists spent on their
trip to Yercaud. Expenses included: transport to reach Yercaud; transport within
Yercaud; meals; activities; shopping; entertainment; and accommodation. The
asterisks in the graph indicate outliers; these have been retained as there were
0
2
4
6
8
10
12
1 2 3 4 5 6 7 8 9 10 Morethan 15
visits
Freq
uenc
y
No. of Trips made
No. of Visits made to Yercaud by Repeat Visitors

87
reasonable explanations for their presence. Some outliers were excluded; for
example, in one case Rs 50,000 was put down as total expenditure, which could not
be explained by accommodation type, size of group, or length of stay. Outliers that
have been retained included a couple staying for 3 days. Their high expenditure
value could be explained by staying at an expensive resort which would have
contributed to at least a third of their expenditure. Another outlier was the case of
a group of sixteen people – all family members whose expenses were shared
between them all. Out of 117 responses, the median is Rs 6,000 with a lower
quartile of Rs 2,950 and upper quartile of Rs 11,700. Minimum and maximum
values are Rs 150 and Rs 40,000 (including outliers). A low value can be
contributed to the fact that the question asked, what their expenses had been so
far. As such, some tourists may have just arrived at Yercaud, while others may not
have stayed overnight and therefore did not accrue many expenses.
40000
30000
20000
10000
0
Tota
l
Total Tourist Expenditure
Figure 18: Total expenditure for tourists visiting.

88
5.2.1.3 Tourist Group Characteristics
Tourist Origin (State): All respondents were from India and were domestic tourists.
The few international tourists approached were unwilling to participate. This can
be seen in Figure 19, which shows tourist origin. All tourists surveyed originated
from five different states in India, each of which share a border with the state of
Tamil Nadu where the destination is located. Tamil Nadu contributed the most
tourists to Yercaud, followed by Karnataka and Kerala.
Figure 19: Tourist state of origin in India.
Tourist Origin (City): Tamil Nadu contributes the most tourists overall and this is
also reflected by the most common tourist origination by city. The second most
common city of origin is Bangalore, in Karnataka. Chennai is the most common
tourist origin.
70%
14%
12%
1% 1%
2%
Tourist Origins (States)
Tamil Nadu
Karnataka
Kerala
Puducherry
Delhi
Other

89
Table 15: Tourist city of origin.
No. of
Respondents
Percentage of
Respondents
Tourist Origin (City) 138
Chennai (Tamil Nadu) 38 28%
Bangalore (Karnataka) 19 14%
Salem (Tamil Nadu) 12 9%
Coimbatore (Tamil Nadu) 11 8%
Tirupur (Tamil Nadu) 6 4%
Dharmapuri (Tamil Nadu) 6 4%
Trichy (Tamil Nadu) 5 4%
Other 41 30%
Main Tourist Origins: Figure 20 shows Yercaud relative to the main tourist origins,
and to the State of Kerala. Bangalore is the closest at approximately 230 km away,
while Chennai is 360 km.
Figure 20: Location of most common tourist origin in relation to Yercaud.

90
Duration of Stay vs. State Origin: Table 16 shows that unlike other states, those
from Tamil Nadu are the only tourists to spend more than 3 days in Yercaud.
Table 16: Length of stay vs. state of origin.
State of Origin
Tamil Nadu Karnataka Kerala Puducherry Delhi Total
No. o
f day
s
1 22 4 1 0 0 27
2 35 11 8 2 1 57
3 27 4 8 0 0 39
4 7 0 0 0 0 7
5 4 0 0 0 0 4
Total 95 19 17 2 1 134
Travel Group Size: Majority of tourist groups travelled in sizes of one to five people.
Larger groups than these consisted of large families and groups of friends
travelling together. The largest consisted of students travelling for a school trip
and had up to 60 in one group.
Table 17: Group characteristics.
No. of
Respondents
Percentage of
Respondents
Travel Party Size 135
1-5 69 51.1%
6-10 38 28.1%
>11 28 20.7%
Group Relationship: Figure 21 shows that tourists were most commonly travelling
with family (30%), or with friends (35.5%). The high proportion of family
travellers is in line with increasing family market trends. The high proportion of
tourists travelling with friends was observed to be groups of males. A single
person who was travelling alone was a relative of a Montfort School boarder.

91
Figure 21: Travel party types.
5.2.1.4 Tourist Movements
Attractions Visited: Figure 22 shows that the most popular attractions are -
Emerald Lake (Big Lake), Pagoda Point, and Lady’s Seat – which are centrally
located.
Figure 22: Tourist attractions visited.
1%
17%
13%
30%
35%
4%
Travel Party Types
Alone
As a couple
In a tour group
With family
With Friends
With friends or family
0
10
20
30
40
50
60
70
80
90
Freq
uenc
y
Attractions
Tourist attractions visited during tourist trips
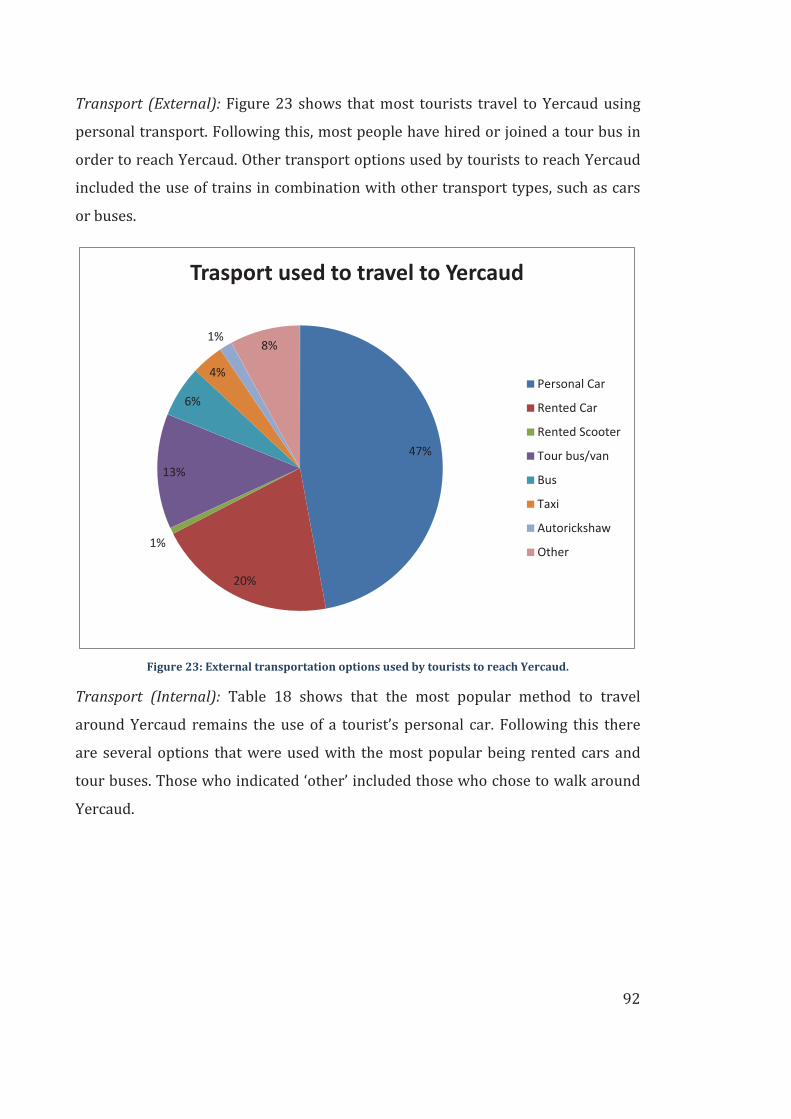
92
Transport (External): Figure 23 shows that most tourists travel to Yercaud using
personal transport. Following this, most people have hired or joined a tour bus in
order to reach Yercaud. Other transport options used by tourists to reach Yercaud
included the use of trains in combination with other transport types, such as cars
or buses.
Figure 23: External transportation options used by tourists to reach Yercaud.
Transport (Internal): Table 18 shows that the most popular method to travel
around Yercaud remains the use of a tourist’s personal car. Following this there
are several options that were used with the most popular being rented cars and
tour buses. Those who indicated ‘other’ included those who chose to walk around
Yercaud.
47%
20%
1%
13%
6%
4%
1% 8%
Trasport used to travel to Yercaud
Personal Car
Rented Car
Rented Scooter
Tour bus/van
Bus
Taxi
Autorickshaw
Other

93
Table 18: Tourist transport used within Yercaud.
No. of
Respondents
Percentage of
Respondents
Transportation Types used Within Yercaud 129
Personal Car 65 50.4%
Rented Car 28 21.7%
Rented Scooter 1 0.8%
Tour bus/van 18 14.0%
Bus 8 6.2%
Taxi 5 3.9%
Auto rickshaw 2 1.6%
Other 2 1.6%
Accommodation: Figure 24 shows that the most common accommodation types are
resorts followed by hotels. Only 7% of tourists stayed in a boarding
home/homestay environment and one tourist owned their own house in Yercaud.
Figure 24: Overnight accommodation used by tourists.
8%
22%
46%
16%
7%
1%
Overnight Accommodation Types
Not Staying Overnight
Hotel
Resort
Dormitory
Boarding House/Homestay
Other
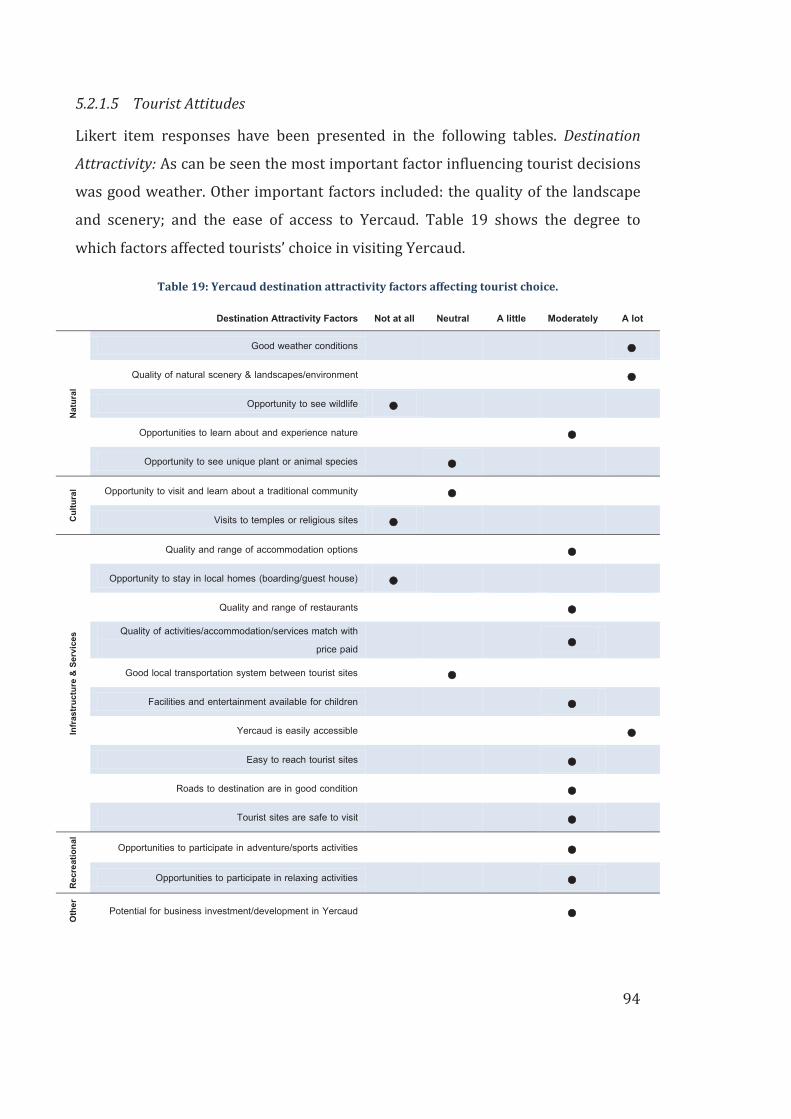
94
5.2.1.5 Tourist Attitudes
Likert item responses have been presented in the following tables. Destination
Attractivity: As can be seen the most important factor influencing tourist decisions
was good weather. Other important factors included: the quality of the landscape
and scenery; and the ease of access to Yercaud. Table 19 shows the degree to
which factors affected tourists’ choice in visiting Yercaud.
Table 19: Yercaud destination attractivity factors affecting tourist choice.
Destination Attractivity Factors Not at all Neutral A little Moderately A lot
Natu
ral
Good weather conditions
Quality of natural scenery & landscapes/environment
Opportunity to see wildlife
Opportunities to learn about and experience nature
Opportunity to see unique plant or animal species
Cultu
ral Opportunity to visit and learn about a traditional community
Visits to temples or religious sites
Infra
stru
ctur
e &
Serv
ices
Quality and range of accommodation options
Opportunity to stay in local homes (boarding/guest house)
Quality and range of restaurants
Quality of activities/accommodation/services match with
price paid
Good local transportation system between tourist sites
Facilities and entertainment available for children
Yercaud is easily accessible
Easy to reach tourist sites
Roads to destination are in good condition
Tourist sites are safe to visit
Recr
eatio
nal
Opportunities to participate in adventure/sports activities
Opportunities to participate in relaxing activities
Oth
er
Potential for business investment/development in Yercaud

95
Correlation between Factors: Several destination attractivity factors were
moderately correlated. Questions with the same themes are related, showing that
respondents answered consistently. Figure 25 shows interrelatedness between
factors. Cultural, recreational and other factors showed no correlation.
Infrastructure and services were distinguished into separate categories by tourists.
The trend observed, showed that tourists answered related questions similarly e.g.
those who indicated a high level of influence from ‘good weather conditions’ on
their decision were similarly likely to indicate a high level of influence from the
‘quality of natural scenery and landscape’.
Figure 25: Destination factors showing mild correlation.

96
Tourist Activities and Services: As can be seen in Table 20, the most important
tourist activities/services are hiking/trekking and entertainment for children.
Those of least interest or import are fishing, horse-riding, and harvesting own fruit.
Neutral positions were held about volunteer environmental programmes; art and
craft performances; spiritual inspiration; shopping and organised entertainment.
Table 20: Important activities and services associated with tourist holidays.
Important Tourist Activities & Services Not at all Neutral A little Moderately A lot
Natu
ral
Hiking/trekking/camping
Wildlife viewing or bird watching
Fishing
Visiting parks, natural sites or gardens
Swimming/boating
Biking
Horse riding
Volunteer conservation programs e.g. tree planting
Visiting coffee or spice plantations
Visiting agricultural lands or orchards
Cultu
ral
Attending art, craft or music performances (e.g. dancing)
Visiting cultural heritage sites or historical places
Visiting small towns or villages
Spiritual inspiration
Harvesting your own fruits/vegetables
Farm stays (experience an agricultural/estate lifestyle)
Boarding houses/home stays
Traditional practices and products
Herbal or natural medicinal practices and products
Serv
ices
Restaurants
Shopping
Organized entertainment
Entertainment for children

97
Correlated Activities and Services: Several preferred activity options were
correlated, showing relationships which cannot be detected from the summary of
tourist activity preferences. Figure 26 displays linked preferences. Fishing and
volunteer programmes have different levels of importance as seen in the earlier
graph; however, despite this difference there is a moderate trend where the level
of preference for one is exhibited at a similar level for the other. This trend has
been observed in all the other variable pairs included in Figure 26.
Figure 26: Moderately related tourist activities and services.
Tourist Satisfaction: Table 21 shows that tourists were dissatisfied in two areas -
the lack of diversity in adventure and sports activities and the lack of shopping
opportunities and facilities. Viewing and learning about local wild animals was ‘not
applicable’ reflecting the poor diversity of wildlife (particularly large mammals)
present in Yercaud.

98
Table 21: Tourists’ satisfaction of their experiences in Yercaud.
Tourist Experience Not
Applicable
Very
Unsatisfying Unsatisfying Satisfying
Very
Satisfying
Natu
re
Viewing and learning about local wild animals
Viewing and learning about local plant life
Viewing natural areas
Nature learning experiences
Local environmental conservation efforts
Cultu
re Traditional ways of life in local community
The quality and availability of locally made products
Infra
stru
ctur
e
Local transport to tourist sites
Facilities/entertainment for children
Serv
ices
Local’s attitudes towards visitors
Local cuisine and drinks
Admission prices to tourist sites
Recr
eatio
n Stores/shopping opportunities
The diversity of adventure/sports activities
Correlated Experiences: Some experience variables were moderately correlated,
with tourists exhibiting equivalent levels of satisfaction among related variables.
For example, those reporting satisfactory experiences of ‘nature learning
experiences’ also reported satisfactory experiences of ‘viewing natural areas’. This
also applies to those who reported unsatisfactory experiences (Figure 27).
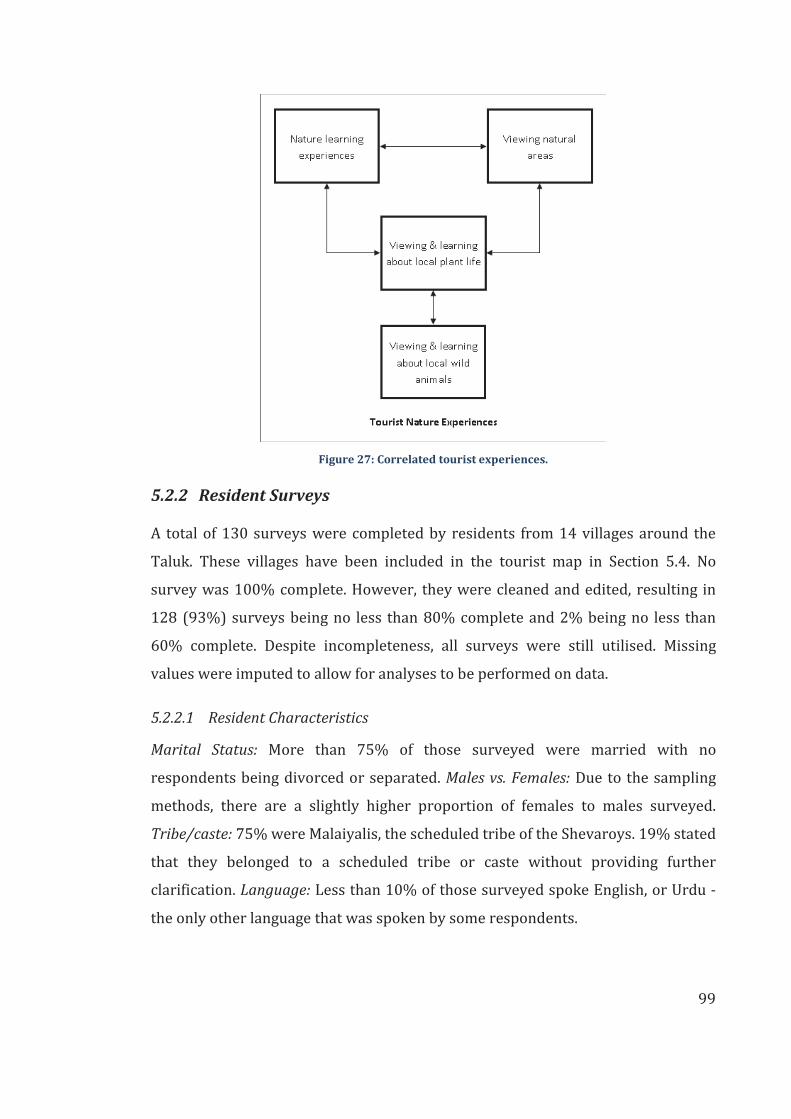
99
Figure 27: Correlated tourist experiences.
5.2.2 Resident Surveys
A total of 130 surveys were completed by residents from 14 villages around the
Taluk. These villages have been included in the tourist map in Section 5.4. No
survey was 100% complete. However, they were cleaned and edited, resulting in
128 (93%) surveys being no less than 80% complete and 2% being no less than
60% complete. Despite incompleteness, all surveys were still utilised. Missing
values were imputed to allow for analyses to be performed on data.
5.2.2.1 Resident Characteristics
Marital Status: More than 75% of those surveyed were married with no
respondents being divorced or separated. Males vs. Females: Due to the sampling
methods, there are a slightly higher proportion of females to males surveyed.
Tribe/caste: 75% were Malaiyalis, the scheduled tribe of the Shevaroys. 19% stated
that they belonged to a scheduled tribe or caste without providing further
clarification. Language: Less than 10% of those surveyed spoke English, or Urdu -
the only other language that was spoken by some respondents.

100
Table 22: Resident characteristics.
No. of
Respondents
Percentage of
Respondents
Marital Status 125
Married 97 77.6%
Single 21 16.8%
Widowed 7 5.6%
Divorced/separated 0 0.0%
Gender 105
Male 49 46.7%
Female 56 53.3%
Caste 85
Malaiyali 64 75.3%
Scheduled Caste 3 3.5%
Backward Caste 2 2.4%
Other 16 18.8%
Languages Spoken 129
Tamil 119 92.2%
Tamil & English 8 6.2%
Tamil & Urdu 2 1.6%
Age Distribution: Figure 28 shows the age distributions of surveyed residents.
There were initial concerns regarding accuracy of age responses - some
participants were unsure about their age and provided estimates. The residents
were clearly underestimating their ages by at least a decade. This was noticed
amongst those with little to no schooling and so those with less than five years of
study (equivalent to finishing Primary school) were excluded. However, after
comparing figures there was little difference made by excluding this subset.
Excluding this population decreased the average age by two years. As such, this
population subset was retained and the following figures show that much of the
population is younger than 40; 24% were between the ages of 26 and 35 while
38% of respondents were between the ages of 36 and 45.

101
605040302010
30
25
20
15
10
5
0
Age (Years)
Freq
uenc
yMean 36.98StDev 11.46N 125
NormalResident Age Distribution
Figure 28: Distribution of surveyed residents' ages.
Education: A notable proportion of those surveyed had received no schooling at
14.6% (Figure 29). However, 47% of them had attended higher secondary school
(10-12 years of schooling) with 6% having completed degrees such as
mathematics and electrical engineering degrees.
Figure 29: Number of years of education undergone by residents.
0
10
20
30
40
50
60
70
0 1-4 5-9 10-12 >12
Freq
uenc
y
No. of Years
No. of Years of Education

102
Resident Work Areas: Only 5% of respondents worked in a tourist area and 14%
worked in Yercaud (Figure 30). Those working in the village, held positions as local
shop owners, teachers and village health nurses. Those labelled as other, consisted
of drivers and several unspecified responses.
Figure 30: Work areas of residents within Yercaud Taluk
Days Worked vs. Age Groups: Table 23 shows the distribution of number of days
worked by each age group. To claims that tribal residents tended to work less than
5 days a week, results showed that less than 5% of those surveyed fell into that
group. There are also 16 year olds who work 20 days or more as can be seen in the
first row of the table. Furthermore, those in the 56 to 65 age group do not work
less than 20 days a month.
Table 23: Age group vs. number of days worked per month.
No. of days worked per month
14 15 16 20 22 23 24 25 26 28 30 31
Age
Gro
up
16-25 0 0 0 4 1 0 2 4 1 1 2 0
26-35 1 2 0 7 0 1 3 6 2 0 0 0
36-45 0 0 1 16 1 2 3 10 3 0 3 1
46-55 0 1 0 2 0 0 1 5 2 0 3 1
56-65 0 0 0 3 1 0 1 2 1 0 0 0
Alternate Occupation Skills: Table 24 presents data gathered from villagers, rating
the extent to which their current skill set could be applied to in these work areas. It
Agricultural lands 24%
Tourism sites 5%
Forest 20% Yercaud
14% Within village
5%
Estate 13%
Other 19%
Resident Work Areas

103
is obvious that an overwhelming number believe they are unable to apply
themselves to these alternate areas. However, there are some areas where they
exhibit some confidence in applying their skills and ‘1’, ‘2’ and ‘3’ correspond to ‘a
little’, ‘moderate’, and ‘a lot’ respectively. In order to report on these areas, those
who have indicated ‘not at all’ have not been included in the following table.
Respondents who indicated ‘other’, mainly suggested working on estates or
working as coolies. The former refers to plantation related work such as coffee
picking and clearing weeds. The latter refers to hard labour. In particular, it is
associated with the numerous rapid construction projects occurring in Yercaud
Taluk with coolies completing much of the work with no proper machinery.
Additional areas provided included agriculture, masonry work, education,
electrical and timber business. The main areas where residents believe they can
apply themselves (as indicated by mode) are those related to tourism. These are
also characterised by relatively low positive responses. Using the mean presents
the same areas with the addition of plantation work to potential alternative skill
areas.
Table 24: Alternative skill areas as indicated by residents.
Alternate Skill Areas Number Mode Mean Std Dev
Fruit cultivation 19 1 1.5 0.6
Coffee/spice plantation 63 1 2.0 0.9
Cattle/poultry rearing 51 1 1.7 0.8
Crop farming 35 1 1.8 0.8
Fishing 7 1 1.3 0.5
Hunting 6 1 1.2 0.4
Environmental conservation projects 12 2 2.1 0.7
Retail & wholesale 17 2 1.6 0.6
Tourism 11 3 2.1 0.8
Boarding home/homestays 25 3 2.3 0.8
Farm-stays 3 3 2.7 0.6
Timber products 16 1 1.6 0.6
Non-timber products 10 1 1.8 0.8
Ethno-medicine 11 1 1.5 0.7
Restaurants 19 1 1.7 0.7
Other 22 2 2.2 0.6

104
5.2.2.2 Household Characteristics
Household size: The largest household consisted of 12 individuals, both adults and
children. 34.6% of households had a household size of five people with 46.9% of
households having less than five people per household and 18.5% having more
than five. The largest number of adults found in one household was nine. 50% of
households had two adults while 46.2% had three or more. The largest number of
children found in one household was five. 27.7% of households had no children;
27.7% had two children and 30.8% had more than two children. Land ownership:
Two respondents owned their house alone, while one person said they lived on
government land. This latter case occurs when individuals occupy government
land for a period of many years. In this instance they had occupied the land for
nearly 30. Nearly 50% of residents did not own any land and at most residents
owned 3 acres (Table 25).
Table 25: Resident household characteristics.
No. of
Respondents
Percentage of
Respondents
Ave. no of Individuals in household
Adults 3
Children 2
Amount of land owned (acres) 130
None 64 49.2%
<1 22 16.9%
>1 41 31.5%
Household Income: 90% of respondents earned between Rs 0-7,500 per month and
only 10% earned greater than Rs 7,500. Majority of residents were in the Rs 2,500
- 5,000 income bracket at 44.5%.

105
Figure 31: Residents’ combined monthly household income.
Household Employment: Majority of households had family members who worked
in plantations and agriculture (Figure 32). In some cases, individuals had more
than one employment area and this was reported by indicating multiple work
areas. Those that indicated ‘others’ reported individuals working as teachers,
tailors, coolies, store keepers and masonry workers, electricians and office
workers.
Figure 32: Number of households with individuals employed in various fields.
Income Sources: Most residents have indicated that their household either had no
source of income, or just a single area (Figure 33). In the case of residents with
0
10
20
30
40
50
60
Freq
uenc
y
Income Category (Rs)
Monthly Household Income
010203040506070
Freq
uenc
y
Axis Title
No. of Households with Individuals Employed
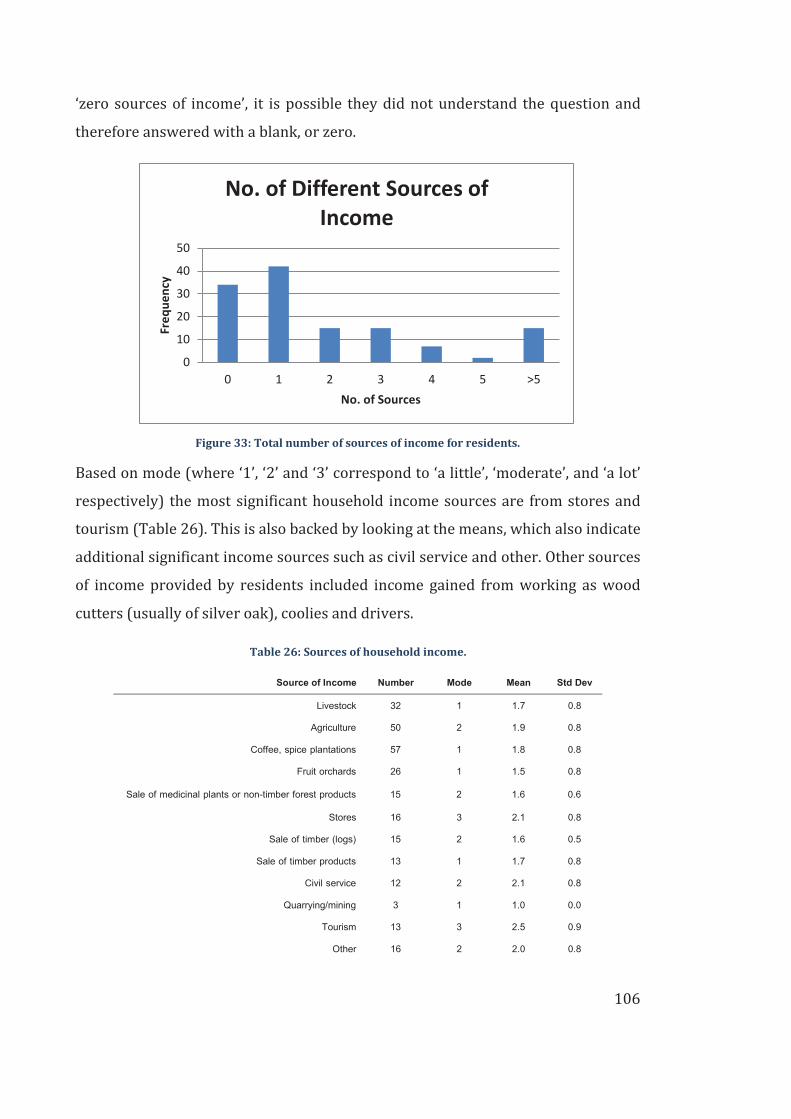
106
‘zero sources of income’, it is possible they did not understand the question and
therefore answered with a blank, or zero.
Figure 33: Total number of sources of income for residents.
Based on mode (where ‘1’, ‘2’ and ‘3’ correspond to ‘a little’, ‘moderate’, and ‘a lot’
respectively) the most significant household income sources are from stores and
tourism (Table 26). This is also backed by looking at the means, which also indicate
additional significant income sources such as civil service and other. Other sources
of income provided by residents included income gained from working as wood
cutters (usually of silver oak), coolies and drivers.
Table 26: Sources of household income.
Source of Income Number Mode Mean Std Dev
Livestock 32 1 1.7 0.8
Agriculture 50 2 1.9 0.8
Coffee, spice plantations 57 1 1.8 0.8
Fruit orchards 26 1 1.5 0.8
Sale of medicinal plants or non-timber forest products 15 2 1.6 0.6
Stores 16 3 2.1 0.8
Sale of timber (logs) 15 2 1.6 0.5
Sale of timber products 13 1 1.7 0.8
Civil service 12 2 2.1 0.8
Quarrying/mining 3 1 1.0 0.0
Tourism 13 3 2.5 0.9
Other 16 2 2.0 0.8
0
10
20
30
40
50
0 1 2 3 4 5 >5
Freq
uenc
y
No. of Sources
No. of Different Sources of Income

107
Household Debt/savings: Figure 34 is an optimistic calculation as monthly income
used the higher interval in the income category to calculate debt and non-debt.
Regardless of this fact, 42.9% of 112 households surveyed had expenditures which
exceeded their monthly income, while 57.1% had the opposite occurring. On
average, households had Rs 46 leftover after paying their expenses (standard
deviation ±Rs 3801).
Figure 34: Debt or savings based on household income and expenditure.
5.2.2.3 Resident-Environment Interactions
These questions were designed to assess: benefits gained from surrounding
environment; the degree of interaction between residents and the environment;
and capture information about positive and negative attitudes. Question 15 of the
resident survey had a poor response rate and was of poor quality; however, it did
provide some insight. Based on the level of response, it could be determined that
-15000
-10000
-5000
0
5000
10000
Debt
/Sav
ings
(Rs)
Survey Cases
Household Income minus Household Expenditure
Cases Mean Standard Deviation

108
residents had the most positive feelings and benefits from the forest, followed by
the lake, while wildlife provided the least benefits. Table 27 shows the
environmental perceptions of residents. There were very few respondents who
believed that their environment is at risk; only three out of 130 respondents felt
that both the Lakes’ and Forests’ health were at risk. Overall, residents also felt
wildlife was a nuisance because there have been frequent human-animal conflicts.
Most conflicts are with Gaur, which have killed people in the past, and snakes, as
many residents working on estates and fields are vulnerable to being bitten by
them.
Table 27: Resident environmental perceptions.
Yes No
Opportunity for tourists to see wildlife 29 62
Forest Health at Risk 37 64
Lake Health at Risk 5 77
Undeveloped tourism opportunities surrounding lake/forest 28 70
Forest health at Risk
Lake Health at Risk
Yes No
Yes 3 21
No 2 49
5.2.2.4 Resident-Tourism Interactions
These questions aimed to: identify residents with current tourism-related jobs and
how much they relied upon tourism for their income; establish current exposure to
tourism and attitudes towards tourists; pinpoint current issues with tourism; and
identify potential employment areas for residents. Tourism Industry: Six
respondents indicated that they worked in a tourism related profession and that
they maintained this position year-round. Table 28 shows that no respondents
relied on tourism for their entire income. The highest level of reliance fell within
the 61-80% interval. Attitude towards Tourists: Four residents held a neutral or
unfriendly attitude towards tourists, with majority as ‘friendly’.

109
Table 28: Tourism interaction characteristics.
No. of
Respondents
Percentage of
Respondents
Percentage of Income gained from Tourism 11
0-20% 3
21%-40% 4
41%-60% 2
61%-80% 2
81%-100% 0
Attitude towards Tourists 108
Very Friendly 32 29.6%
Friendly 72 66.7%
Indifferent 2 1.9%
Unfriendly 2 1.9%
Very Unfriendly 0 0.0%
Tourist Interaction Levels: Figure 35 shows that 41% of residents have never
interacted with tourists and a further 28% do not interact with tourists on a
regular basis. A small percentage (17%) interacts with tourists on a daily basis.
Figure 35: Level of tourist interaction during the past year.
Tourism Related Skills: Table 29 displays the tourist related activities and services
that residents believe they can participate in based on their current skill set and
knowledge. Responses indicating ‘not at all’ were not considered due to the large
Daily 17%
Weekly 6%
Monthly 8%
Quarterly 28%
Never 41%
Level of Tourist Interaction

110
number in this category. ‘1’, ‘2’ and ‘3’ correspond to ‘a little’, ‘moderate’, and ‘a lot’
respectively and based on mode, areas which residents felt they could contribute
to the most included: environmental conservation projects and
hosting/participating in cultural or religious events.
Table 29: Resident skill areas which can be applied towards tourist activities and services.
Tourist related skills and knowledge Number Mode Mean Std Dev
Wildlife tour guide 63 1 2.0 0.8
Nature tour guide 63 2 2.0 0.8
Wildlife warden 34 1 1.8 0.8
Park caretaker 22 2 2.1 0.8
Environmental conservation projects 40 3 2.4 0.8
Boating operator 12 1 1.6 0.7
Plantation owner/operator 41 1 1.6 0.7
Hosting/participating in cultural or religious events for tourists 44 3 2.2 0.8
Create range of unique locally-made products 22 1 1.6 0.8
Teaching tourists about your culture, way of life and heritage 31 2 1.9 0.7
Cultural and heritage site tour guide 23 1 2.1 2.2
Ethno-medicine practitioner/educator 16 2 1.9 0.8
Retail or wholesale 10 1 1.9 0.9
Providing boarding house/home-stay accommodation 22 1 1.5 0.7
Providing farm-stay accommodation 8 2 2.0 0.8
Transporting tourists around destination and between tourist sites 27 2 2.2 0.8
Providing facilities and entertainment for children 43 2 1.9 0.8
Providing relaxation activities 30 1 1.3 0.5
Providing food stall/restaurant 24 2 2.1 0.7
Providing horses/donkeys for trekking 4 1 1.8 1.0
5.3 SWOT Results
The following SWOT analysis of Yercaud Taluk has been compiled based on
information gathered from participants and personal observations (Table 30). It
evaluates the various strengths, weaknesses, opportunities and threats that are
associated with Yercaud as a potential ecotourist destination.
Strengths and weaknesses are internal features. The former make Yercaud
desirable or increase the possibility of ecotourism being implemented; the latter

111
are likely to hinder the implementation of ecotourism. They are limitations which
tourists and the tourist industry currently face. Opportunities and threats are
external factors. They can directly or indirectly aid or obstruct the development of
ecotourism or impact current tourism trends.

112
Table 30: SWOT for developing ecotourism in Yercaud Taluk.
Strengths Weaknesses
- Temperate climate in comparison to surrounding lower altitude tourist destinations and plains
- Lower altitude than Ooty:
Does not take as long to reach destination from foot hills
Not as cold and damp - Centrally located in South India
Close to large cities, such as Chennai and Bangalore
- Many viewpoints and excellent landscapes - Have some unique local products such as honey,
coffee and herbs - Within destination, attractions are close to each other - Many little quiet villages with their own charm where
people can seek solitude from crowds - Friendly community - Cleaner air and less crowded and polluted than
populated cities (including Ooty) - Variety of interesting crops are grown, such as coffee
and pepper - Unique threatened and protected animals such as
Gaur, which can act as a draw - 120 different bird species that can be seen - Reserved forest status which could be marketed if
forest is protected and restored - Natural Lake
- Poor signage or information regarding the area, sites and facilities
- Poor environmental record including failure to maintain environmental policies and behaviours
- Unskilled/untrained local community - Poor infrastructure, lack proper sewage and amenities - Excessive housing development - Loss of unique cultural traditions - Environmental degradation, especially of Lake and
forest - Heavy (and often dangerous) traffic up narrow Ghat
road
Opportunities Threats
- Changing tourist market:
Increasing family market is expected to grow
Emerging business and student group market that could visit during the weekdays
- Growing awareness about the environment and ecotourism
- Strong demand from tourists (off-peak, but equally likely for peak season tourists) for a natural experience
- Competing hill station destinations are either overdeveloped or underdeveloped (Ooty or Yelagiri)
- Warmer climate: tourists starting to find it hot - Poor environment: Degraded forest and few wild
animal species remaining to attract tourist interest - High rate of development of land into dense house
plots - Not as well developed as Ooty/Coonoor for facilities - Recession results in lower spending, with tourists
looking for a cheap services and products - Climate change: popular for cool weather and lack of
rain affects water reserves, crops and tourist visitation numbers
- Whatever changes are made in Yercaud are mimicked by other destinations to compete and gain tourist attention
- Yelagiri Hill Station is more attractive and pristine - promotes adventure activities. Source of competition for tourists seeking nature experiences.
- Ooty Hill Station and Coonoor are more developed for tourists - provide multiple sources of natural and cultural attractions
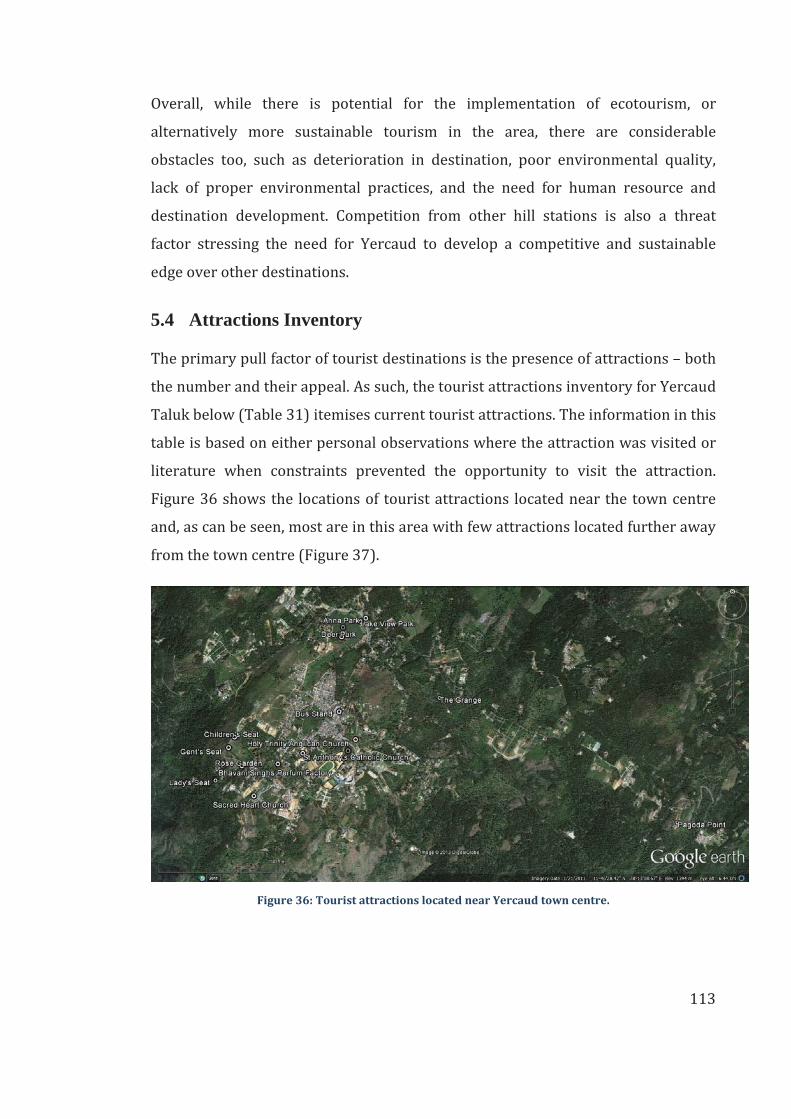
113
Overall, while there is potential for the implementation of ecotourism, or
alternatively more sustainable tourism in the area, there are considerable
obstacles too, such as deterioration in destination, poor environmental quality,
lack of proper environmental practices, and the need for human resource and
destination development. Competition from other hill stations is also a threat
factor stressing the need for Yercaud to develop a competitive and sustainable
edge over other destinations.
5.4 Attractions Inventory
The primary pull factor of tourist destinations is the presence of attractions – both
the number and their appeal. As such, the tourist attractions inventory for Yercaud
Taluk below (Table 31) itemises current tourist attractions. The information in this
table is based on either personal observations where the attraction was visited or
literature when constraints prevented the opportunity to visit the attraction.
Figure 36 shows the locations of tourist attractions located near the town centre
and, as can be seen, most are in this area with few attractions located further away
from the town centre (Figure 37).
Figure 36: Tourist attractions located near Yercaud town centre.

114
Figure 37: Tourist attractions located away from Yercaud town centre.
Table 31 presents the natural, cultural and historic attractions currently found in
Yercaud Taluk. Attractions are predominantly natural and easy to access.
Table 31: Attractions inventory (natural).
Name Description Coordinates Ease of
Access
Lady's Seat Elevated panoramic viewpoint of the neighbouring city (Salem)
and surrounding environment/landscape. A telescope house
has also been built. In the past, European women are said to
have frequented this spot. Since then it has been known as
Lady's Seat
11°46.23600' 078°11.93000' Easy
Pagoda Point Elevated panoramic viewpoint of the nearby village
(Kakkampady) and surrounding environment/landscape. So
named because of the presence of ancient stone pagodas at
this lookout. A temple has recently been built here which
detracts from the natural beauty
11°46.01250' 078°14.36400' Easy
Big Lake
(Emerald Lake)
Natural lake in the centre of the township. Has boating
facilities. Surrounded by parks and some shola forest. Popular
attraction with tourists. Originally surrounded by thick shola
forest which is now sparse
11°47.05350' 078°12.56017' Easy
Botanical
Survey of India
Botanical garden and orchidarium run by the BSI. Houses
various species of local and exotic plant species. One of two
orchidariums run by BSI
11°48.01200' 078°12.84100' Easy
Cauvery Peak Said to be an extinct volcano and is the highest point on the
Shevaroy hills. Many beautiful views of the surrounding
11°48.87900' 078°13.10700' Easy
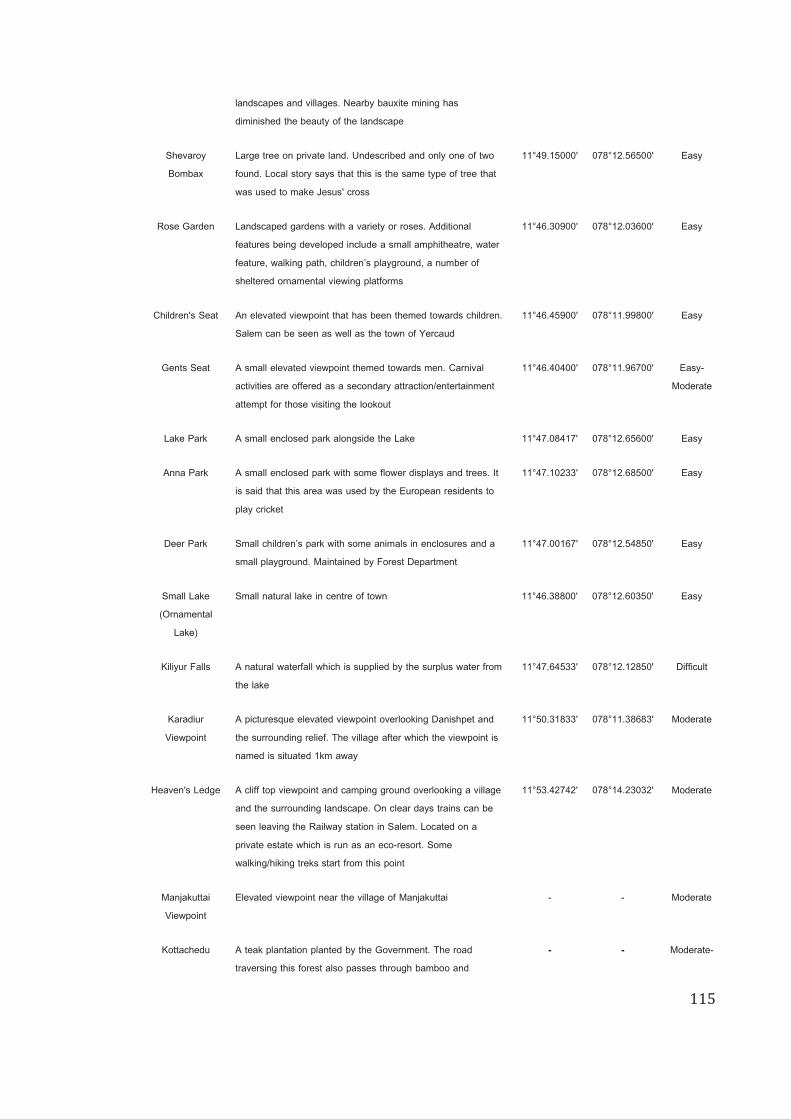
115
landscapes and villages. Nearby bauxite mining has
diminished the beauty of the landscape
Shevaroy
Bombax
Large tree on private land. Undescribed and only one of two
found. Local story says that this is the same type of tree that
was used to make Jesus' cross
11°49.15000' 078°12.56500' Easy
Rose Garden Landscaped gardens with a variety or roses. Additional
features being developed include a small amphitheatre, water
feature, walking path, children’s playground, a number of
sheltered ornamental viewing platforms
11°46.30900' 078°12.03600' Easy
Children's Seat An elevated viewpoint that has been themed towards children.
Salem can be seen as well as the town of Yercaud
11°46.45900' 078°11.99800' Easy
Gents Seat A small elevated viewpoint themed towards men. Carnival
activities are offered as a secondary attraction/entertainment
attempt for those visiting the lookout
11°46.40400' 078°11.96700' Easy-
Moderate
Lake Park A small enclosed park alongside the Lake 11°47.08417' 078°12.65600' Easy
Anna Park A small enclosed park with some flower displays and trees. It
is said that this area was used by the European residents to
play cricket
11°47.10233' 078°12.68500' Easy
Deer Park Small children’s park with some animals in enclosures and a
small playground. Maintained by Forest Department
11°47.00167' 078°12.54850' Easy
Small Lake
(Ornamental
Lake)
Small natural lake in centre of town 11°46.38800' 078°12.60350' Easy
Kiliyur Falls A natural waterfall which is supplied by the surplus water from
the lake
11°47.64533' 078°12.12850' Difficult
Karadiur
Viewpoint
A picturesque elevated viewpoint overlooking Danishpet and
the surrounding relief. The village after which the viewpoint is
named is situated 1km away
11°50.31833' 078°11.38683' Moderate
Heaven's Ledge A cliff top viewpoint and camping ground overlooking a village
and the surrounding landscape. On clear days trains can be
seen leaving the Railway station in Salem. Located on a
private estate which is run as an eco-resort. Some
walking/hiking treks start from this point
11°53.42742' 078°14.23032' Moderate
Manjakuttai
Viewpoint
Elevated viewpoint near the village of Manjakuttai - - Moderate
Kottachedu A teak plantation planted by the Government. The road
traversing this forest also passes through bamboo and
- - Moderate-

116
Teak Forest
evergreen forest. Vaniar river passes through this area as well
and overall it is a beautiful and scenic route which is the
alternate Ghat road between Yercaud and the plains
Difficult
Arthur Seat Elevated viewpoint providing a view of Big Lake, Yercaud
Town and Cauvery Peak
- - Unknown
Silk Farm Sericulture and cultivation of Mulberries. Demonstrations of silk
being spun (Rajes & Sadanandan, n.d.)
- - Unknown
Bears Cave A cave which goes deep into the hill. Located on private
property which has one of the oldest Bungalows, Norton’s
Bungalow (Rajes & Sadanandan, n.d.). Local legend has it that
Tipu Sultan escaped the British through this tunnel. Rockfall
has blocked it, but 40 years ago a group travelled a few
kilometres into it
- - Unknown
Bears Hill Panoramic viewpoint of the Schools and Seminaries of
Yercaud. Located diagonally adjacent to Montfort School on
the South Eastern side of Yercaud (Rajes & Sadanandan, n.d.)
- - Unknown
Tipperary
Viewpoint
Elevated viewpoint which provides a view of the Elephant
Tooth Rocks and Salem. Part of Tipperary estate (privately
owned), . It has recently been closed to sightseers (Rajes &
Sadanandan, n.d.)
- - Unknown
White Elephant
Tooth and
Elephant Rock
Two white quartz rocks standing approximately 120ft high. One
is located below the village of Gundur, while the other is
located overlooking the Ghat Road (Rajes & Sadanandan,
n.d.)
- - Unknown
Butterfly
Swarms
Seasonal breeding leads to large swarms of butterflies. These
are seen in certain areas and were observed particularly
passing over the Ghat road
- - -
Climate Temperate, cooler than surrounding plains with a monsoon
season later in the year
- - -
Ghat Road The hill road has 21 hairpin bends and passes through some
semi-evergreen and scrub forest. Along the journey between
Yercaud and the plains there are several stops ranging from
small natural waterfalls and panoramic elevated viewpoints, to
cultural shrines
- - Moderate-
Difficult

117
Table 32: Attractions inventory (cultural).
Name Description Coordinates Ease of Access
Sri Raja Rajeshwari
Temple
Founded in 1983 and dedicated to the
Goddess Sri Raja Rajeshwari. Located at the
top of a hill towards Nagalur
11°48.44100' 078°12.79300' Moderate
Shevaroy Temple Underground temple. Long history in the area
and has a sacred spring. Some iron age
artefacts were found in the area
11°48.87900' 078°13.10700' Easy
Agathiur Herbarium Centre for herbal medicines and herbal
treatments and sells various herbal products
11°48.64400' 078°13.27300' Easy
Sri Chakra Maha Meru
Temple
A Temple dedicated to Shri Lalitha (Tripura
Sundari). Has the largest Sri Chakra (holy
wheel)
11°50.55600' 078°12.96800' Easy
Bus Stand Bus depot, where buses arrive and depart.
Surrounded by small clothes stores, fruit
vendors, grocery stores and small businesses
11°46.59300' 078°12.55300' Easy
Bhavani Singhs Perfum
Factory
Factory where various plant and herbal
essential oil products can be purchased
11°46.31900' 078°12.22700' Easy
St Anthony's Catholic
Church
An old Catholic Church 11°46.37500' 078°12.36000' Easy
Holy Trinity Anglican
Church
An old Anglican Church. Its cemetery is where
most of the earliest inhabitants are buried
11°46.44600' 078°12.64400' Easy
Sacred Heart Church Oldest church in Yercaud 11°46.16100' 078°12.14400' Easy
Montfort School Large attractive school campus with various
facilities (Rajes & Sadanandan, n.d.)
11°46.34900' 078°12.58200' Easy
Retreat Belongs to a religious society founded by St
Don Bosco. Grounds overlooks one of the
Elephant rocks (Rajes & Sadanandan, n.d.)
- - Easy
The Grange One of the oldest buildings in Yercaud and is
historically significant. It was also the site of
the first coffee plantation. Currently a resort set
amongst a multi-cropped plantation of silver
oak, pepper and coffee. Some native trees
remain
11°46.66933' 078°13.09033' Easy

118
A variety of attraction types were considered and evaluated using a number of
components. An overall profile of the attractions has been created (Table 33). This
has been compiled based on the researcher’s opinion from personal observations
and information gathered. Each factor is rated on a scale of 1 to 5 to give the final
attraction rank. They have been ranked in order of highest to lowest, with the
highest ranking attractions being Heaven’s Ledge (a natural attraction part of a
larger ecoresort), and The Grange (a combined historical and natural attraction
part of a plantation resort).

119
Table 33: Evaluation of tourist attractions in Yercaud Taluk.
Scen
ic v
alue
Biod
iver
sity
Cultu
ral v
alue
Hist
oric
al v
alue
Uses
and
Act
iviti
es
Com
mun
ity p
artic
ipat
ion
Acce
ss
Prod
uct d
evel
opm
ent
Tota
ls
Heaven's Ledge 5 5 0 0 5 3 3.5 5 26.5
The Grange 4 3 0 4.5 5 0 5 3.5 25
Karadiur Viewpoint 5 4 0 0 4.5 2.5 3.5 4 23.5
Shevaroy Temple 3 1.5 4 4 3 1 4 3 23.5
Rose Garden 4.5 3 0 0 5 1 5 4.5 23
Big Lake (Emerald Lake) 3 2 0 1 5 2 5 3.5 21.5
Botanical Survey of India 4 5 0 0 3 0 4.5 4 20.5
Pagoda Point 4 1.5 0.5 0.5 3 2.5 4.5 3 19.5
Ghat Road 4 3.5 1 1.5 3 0.5 3.5 2.5 19.5
Shevaroy Bombax 5 4.5 0.5 0 1.5 0 4 3.5 19
Kiliyur Falls 4 3.5 0 0.5 4 0.5 3 3.5 19
Lady's Seat 4 1.5 0 1 2 1 5 3 17.5
Cauvery Peak 4 1.5 0 0.5 3.5 1 4 3 17.5
Kottachedu Teak Forest 4 3 0 1 3 0.5 3.5 2.5 17.5
Anna Park 3.5 1 0 0.5 2.5 0.5 5 4 17
Deer Park 3 2 0 0 3 0.5 5 3.5 17
Lake Park 3.5 1 0 0 2 0.5 5 4.5 16.5
Sri Chakra Maha Meru Temple 3 0 3 0 2 0.5 4 3.5 16
Children's Seat 3 1 0 0 2 0.5 5 3.5 15
Sri Raja Rajeshwari Temple 3 0 2.5 0 2 0.5 3.5 3.5 15
Holy Trinity Anglican Church 4 0.5 1 1 1 0.5 5 2 15
Sacred Heart Church 4 0 1 1 1 0.5 5 2 14.5
Agathiur Herbarium 3 0 0 0 2 0.5 4 4 13.5
St Anthony's Catholic Church 3 0 1 0.5 1 0.5 5 2 13
Bus Stand 2 0 1 0 1 1.5 5 2 12.5
Montfort School 4 0 0 2 1 0 5 0 12
Gents Seat 2 1 0 0 1 0 5 2 11
Retreat 3 0 1 1 1 0 5 0 11
Butterfly Swarms 0 4 0 0 3 0.5 1.5 1.5 10.5
Small Lake (Ornamental Lake) 1 1 0 0.5 1 0 5 1 9.5

120
Figure 38 shows the location of villages visited during the data collection period.
Karadiur and Manjakuttai have developed viewpoints nearby, but are not well
known or very popular amongst tourists yet. There are numerous other attractions
on private land which in the 60’s/70’s, were open for public viewing and to
residents for picnics but are now closed due to an excess of tourists. Other villages
also had attractive qualities for tourism. These were predominantly scenic, and in
some cases cultural. Overall, the villages in themselves provided a unique
experience, with more pristine environments than Yercaud offered and a better
quality nature experience. Friendly local interactions also contributed to the
overall experience and showed that some interesting cultural aspects could still be
evidenced.
Figure 38: Location of villages visited in Yercaud Taluk.

121
CHAPTER 6: DISCUSSION The current chapter discusses and explains the findings outlined in the previous
chapter. Research objectives are answered over three sections: socio-
environmental and tourism issues, supply and demand. Within these sections, the
key research aspects of environment, community and tourism have been
investigated where applicable. They aim to provide an argument for sustainable
development - in the form of ecotourism - to benefit vulnerable community
members and a fragile environment.
6.1 Socio-environmental and Tourism Issues
This research has identified three areas of need based on data collected from local
stakeholders, tourists and personal observations. These are - environment,
community and tourism - and are further supported by literature where available.
6.1.1 Environment
The following section about the environment is predominantly based on
interviews, personal observations and a small number of studies. Surveys
administered to residents included questions regarding three different aspects of
the environment - the forest, lakes, and wildlife. Despite poor feedback, responses
provided an insight into perceptions and opinions held by some residents. A
number of environmental issues have been identified. These can impair the
healthy operation of ecosystem functions and services in the area; result in
reduced biodiversity; present health hazards to humans and animals alike;
contribute to localised climate change; and negatively impact tourism in Yercaud
Taluk.
6.1.1.1 Environmental Threats and Issues
Forest degradation and deforestation is one of the most significant environmental
issues that has been observed - and supported by literature (Balaguru et al., 2006;
Kadavul & Parthasarathy, 1999). Yercaud was so named because when it was first
discovered there was a lake (yeri) surrounded by thick forest (caadu). Today, the

122
shola forest surrounding this lake is nearly non-existent. A few specimens remain
of the original native shola, but over the years, illegal logging and lack of protection
have contributed to its current state. Residents of the area since the late 1970s
have commented on the sparseness of the shola in the centre of Yercaud town. One
resident commented that the shola had been so thick during their youth that light
barely passed through. In contrast, the same site now showed high levels of
degradation. As can be seen in Figure 39, there appears to be little, to possibly no
regeneration (lack of saplings), garbage is dumped there, and cattle and goats are
seen grazing near or within the forest stand. As these forest patches are located
within the centre of Yercaud town, it is understandable that there is a high level of
anthropogenic pressure. However, reserve forests located on the sides of the
Shevaroyan Hills appeared sparse as well, dominated mainly by scrub species
rather than shola. Despite the forests’ protected status, native shola (once the
predominant vegetation type on these hills) makes up just a small percentage of
the vegetation cover. Degradation is likely caused by multiple factors and the
initial observation is that the distribution pattern of forest (encircling Yercaud
Taluk) results in much of the treeline being exposed to anthropogenic influences.
These factors include grazing of animals within the forest and destructive felling of
forest for timber. Additionally, small isolated patches of shola face pressures of
increased vulnerability, loss of regeneration ability, and reduction in ability to
support the fauna species that once dominated them. These patches are made
more vulnerable to degradation and can lead to a permanent loss of this vegetation
type on the Shevaroyan Hills.

123
Figure 39: Remaining shola forest within Yercaud Town.
Land use change is steadily growing in the area, and potentially poses one of the
biggest threats to the environment. Historically, shola forests were converted to
coffee plantations and originally some shola species would have been used for
shading. Now, silver oak has become a popular replacement for shola species,
presenting a better financial opportunity as it grows fast and sells at a good price.
With coffee plantations being the major economic activity in the area since the
plant was first introduced to the area, large tracts of shola forest have been
converted. However, plantation owners have commented on the rising costs of
maintaining their plantations (including increased labour costs). The high real
estate value in Yercaud presents a unique opportunity for many residents and this
has resulted in some plantation owners selling significant portions of their land -
providing them the opportunity to make a quick profit from land that was
previously a financial drain. This trend is similarly observed amongst villagers and
tribals. In contrast, for the latter, the choice to follow this trend stems from a lack

124
of financial security, with many selling land in order to be able to meet expenses
(this included their children’s educational costs, which was a prominent desire
expressed by many tribal and village parents). This action creates several social
problems for these groups and will be discussed in the ensuing community section.
Environmentally, the changing land use trend contributes significantly to
unsustainable development in the area. Houses are now crowded together on plots
in order to maximise on space, regulations (such as those on building sizes) are
ignored, and there is serious doubt regarding whether proper waste management
has been installed to deal with the higher housing densities. Most importantly, it is
destroying the very attraction which draws tourists and individuals to buy
property. For example, the most noticeable pattern observed in tourist
preferences, was a desire to enjoy the nature and climate of Yercaud. However, this
unsustainable development diminishes and degrades these environmental
features, creating and contributing to multiple environmental issues - such as
sedimentation and soil erosion which was observed in the Taluk. These pose long
term threats, having the potential to become a force that drives away tourists and
investors. An observant resident said ‘they are on to a good thing’. Meaning when a
person is seeing gains, they will continue with the pattern - content to benefit from
the short term rewards rather than invest in more sustainable long term gains that
could benefit a larger population.
Water issues, such as water pollution and scarcity are a major issue. In the case of
water pollution, the main natural attraction - Big Lake - which is the source for the
town water supply, provides an important example. Garbage was observed both
within and near the lake edge and the town’s rubbish dump was found to be
present not far from the lake itself. Its smaller counterpart, which was once
picturesque and attractive, is no longer an attraction and is heavily polluted with
physical garbage. Road run off and faecal contamination is also highly likely for
both these lakes as: both have roads and buildings adjacent to them; no proper
sewage system is present and likely runs off into these water bodies during rain.
This is supported by a study of Big Lake which showed high levels of
contamination to the point that it presented a health hazard to both humans and

125
animals (Rajakumar et al., 2006). Water scarcity, has become a major issue for the
Shevaroyan Hills. Multiple villages expressed the concern that they faced water
shortages and this is further exacerbated by national climatic changes. In
particular, monsoon rains are required to replenish water reserves and, changing
rain patterns pose a significant threat to inhabitants. At the time of data collection,
monsoon rains were later and lighter than usual. Plantation owners expressed the
concern that this would decrease their coffee crop, and profits. For the wider
community, other crops, which villagers rely on to survive, may be affected as well.
Environmentally, the rains help control rising temperatures and fill water
reserves. In contrast, water shortages did not pose an issue for residents in the
past as shola forests are excellent water sinks and would have helped buffer water
shortages for residents and fauna. At present this vegetation type is on the verge of
disappearing, posing a serious risk to the future of this Taluk.
There are various other environmental issues present in Yercaud Taluk. These
include, but are not limited to: heavy vehicular traffic, improper waste
management, biodiversity loss, and detrimental human activities. Heavy vehicular
traffic is one of the first problems observed when travelling on the Salem-Yercaud
Ghat road. This issue is at its worst during weekends, holiday and peak tourist
season, resulting in a high level of noise pollution (constant use of horns and
engine noise). Additionally, the high level of traffic (cars, motorcycles,
trucks/lorries, vans and buses) would be expected to contribute significantly to
local air pollution, and contaminants in the form of chemical and particulate road
run-off. A considerable amount of travellers are non-residents, resulting in a
significant social issue for residents using the same road. Village residents who
were asked to comment on environmental problems failed to highlight the issue of
raw sewage management. There is no proper sewage treatment and management
even in developed areas. The average household uses septic tanks which used to
be cleaned manually by the untouchables (Dalit/Scheduled Caste). However, since
the Government changed their status, there is no one to carry out this degrading
job as manual cleaning remains the only method available at present. Observations
- such as the smell of raw sewage and open drains in certain areas - imply that

126
even if there is a system, it does not function properly or efficiently. Furthermore,
sanitary disposal of excreta and a reliable supply of safe drinking water are two of
the most important means of improving human health and protecting the
environment. Litter and garbage is obvious throughout Yercaud town. The most
serious feature is the presence of a rubbish dump within 500m of Big Lake (Figure
40 and Figure 41), which could be contributing contaminants and garbage to the
lake. As can be seen in the figures, they are also located in the immediate vicinity of
a settlement. Loss of biodiversity has been a significant on-going issue since British
settlement. However, there is poor information regarding fauna species present on
the Shevaroyan Hills, their distribution or numbers. The primary statement that
can be made is that species that were once widespread and common, are very
difficult to sight now. Bauxite mining and granite mining are two human activities
detrimental to environmental quality (not considering tourism). To date, bauxite
has caused the greatest damage, with a number of published news articles bringing
attention to the matter. Removal of bauxite has been shown to affect water
retention by soil and has resulted in the loss of many important plant species,
some with ethnomedicinal significance. Villages in the vicinity have complained
about contamination of water sources from bauxite mining activities - with claims
of illegal mining still continuing as recently as 2012 (Times of India, 2011). Granite
mining also occurs on the Shevaroyan Hills, with impacts most likely to include
clearing of land, soil erosion and disturbance to wildlife. Finally, despite some
efforts being made over the years to attempt to halt environmental degradation,
there has been a poor record of enforcement and maintenance.

127
Figure 40: Location of a rubbish dump in Yercaud town relative to Big Lake and surrounding
settlements (Google, 2013).
Figure 41: Outside wall of rubbish dump with some garbage spill over.
128
6.1.1.2 Environment-animal-community Interactions and Conflict
Human-animal conflict occurs with several animal species. The Indian Gaur is the
primary cause of concern for residents as they are territorial animals, becoming
aggressive towards perceived threats especially around their young. Due to habitat
degradation and lack of access to water, Gaur have been venturing outside the
forest and onto plantations and cultivated lands. Residents have reported
increasing Gaur confrontations as their population increases, and degraded habitat
is insufficient for their sustenance. These confrontations can lead to human injury
or death. Additionally, these species cause extensive damage to crops, lands and
man-made structures. Many residents were frightened of these animals and
several reported property and crop damage. Gaur are an IUCN red-listed
vulnerable species and are completely protected - residents are not allowed to
injure or kill them. They are also very large animals, with a weight of over half a
tonne, making it hard for individuals to deal with them. Snakes were another
species that residents feared. In particular, many worked in plantations and
cultivated lands, making it difficult to see them amid the vegetation and increasing
the chances of getting bitten. The presence of monkeys, while not explicitly
identified as an issue, did present some problems. Their numbers and distribution
have grown and they are now found at higher altitudes than they used to be. They
destroy crops and could be aggressive towards people, particularly at key tourist
sites.
Tribal grazing activity has also impacted the health of the forest in two ways.
Firstly, deliberate forest fires which are lit to create pasture for grazing animals
affects regeneration of important forest species. Secondly, grazing animals, mainly
goats, browse on young forest seedlings and shoots disrupting the growth of new
plants. The forest department has attempted to limit goats in the area by banning
them (Sugirtharaj, 2012). However, goats provide a good source of income for
residents. While there are efforts to provide alternate sources of income, there is
no indication as to whether residents accept these alternatives readily or how
successful they are. Furthermore, residents appear to be unconscious of the poor
state of the environment, which likely exacerbates this problem. In particular, if

129
their livelihood depends on these animals, they are unlikely to be in a position to
think about the long term consequences, especially if it conflicts with their
immediate survival. Banning goats therefore takes away an important income
source and creates animosity or resentment. This was partially reflected by
resident surveys - residents were scared away from entering the forest by
watchmen protecting it and were barred from entering it.
6.1.2 Community
Information regarding the community has been derived from surveys, interviews
and personal observations. The latter two data collection techniques were
especially useful in identifying aspects that were not captured through the surveys.
Over the years the community has been receiving help from three notable groups
and individuals and is apparent in the data collected. Mother Louis, an Irish nun,
has been doing social work in the Yercaud community for more than 60 years. She
has been helping ‘the poorest of the poor’, using whatever money she had. As part
of the Social Service Guild of Yercaud (SSGY), she has been financially aiding those
seeking University degrees and who would otherwise be unable to cover the fees.
She has helped repair and build hundreds of houses for individuals and families.
She runs a crèche, so women have the opportunity to work and earn money
without worrying about their young children. However, much of this work is
reliant on funding. Since the economic crisis of 2008, she now receives less than a
quarter of the amount that she did previously. As a result, her aid programmes
have been scaled down and she is unable to help as many people (Mother Louis,
2012).
Deepam society is a non-governmental organisation that has, since 1996, sought to
educate and assist tribals and previously discriminated castes. Education efforts
range from housing and educating orphans and abandoned children, to helping
parents fund part of their children’s education. Additionally, they provide training
in tailoring, simple electrical or similar trades that might assist them in finding a
job. They educate villagers about health and assist in the setup of village self-help
groups that help the entire community. This group is funded by overseas donations

130
and has successfully been increasing literacy rates since its development
(Rajendran, 2012).
The organisation CRëNIEO (Centre for Research on New International Economic
Order) assists in healthcare, education, tribal empowerment, improving
agricultural practices utilised by tribal farmers, provision of facilities (toilets) and
environmental education. There appears to be considerable amount of focus on
retaining tribal culture and traditions, as well as sustainable resource use and
improving the environment (Jayaprakash, 2012). However, some programmes
have not been successful, such as the tribal self-empowerment movement.
Furthermore, some methods appear to be at odds with the local Forest
Department’s conservation efforts.
These organisations all contribute and succeed in reducing poverty in different
ways; however, a social need still exists. In particular, poverty reduction methods
should be developed to cooperate with conservation efforts to benefit the entire
community.
6.1.2.1 Social Issues
Social issues in Yercaud town and villages differ. Within the town, certain areas -
such as Longlipet and Melalaganburam - are the beginnings of slums. Houses are
cramped together and living conditions are poor (Figure 42). There are no toilets
or bathing facilities in some houses, and small ditches such as those seen in Figure
42 act as open, sewage drains for waste management. These areas have been
expanding over the years and the SSGY has been helping in these areas by building
and improving the houses. Additionally, those living in Yercaud town may not have
housing. One interview with a woman revealed that she slept in her fruit stall near
the lakeside and during heavy rains she would get wet.
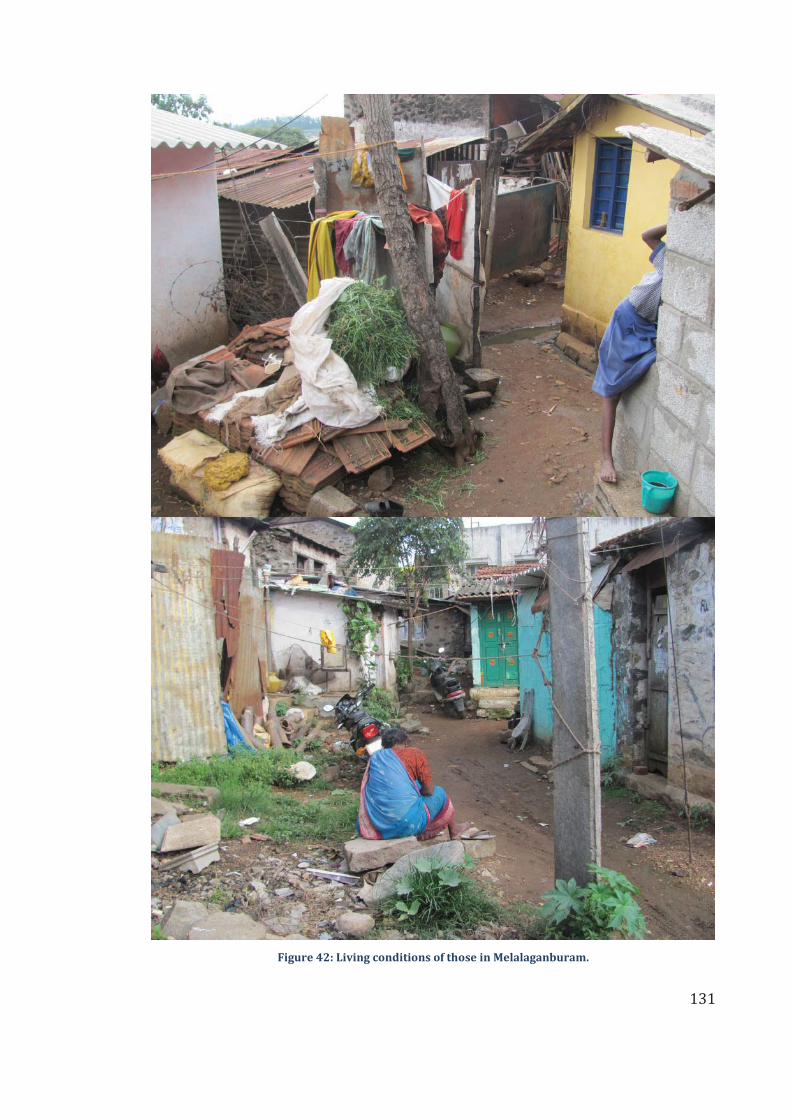
131
Figure 42: Living conditions of those in Melalaganburam.

132
In comparison to Yercaud town, the surrounding villages have better sanitation
and houses are not as cramped together. However, housing is still an issue - many
still live in houses made from mud (a combination of mud and cow dung) or
bamboo woven together and packed with mud. Villagers have lost the techniques
and skills to maintain these houses properly resulting in houses that are
deteriorating. These houses all have mud floors, as such, outlined by Gordon
(2005), it can be categorised as shelter deprivation. More importantly, while
outdoor air pollution may not be a problem at the moment for residents in
Yercaud, these houses did not have a chimney or proper ventilation. This poses a
large problem because the villagers illuminate, cook and heat their homes with
fuels such as wood. A lack of electricity, equipment and money means that burning
fuel is the only option to these people. This leads to indoor air pollution and it was
noted that the insides of many of the homes were soot blackened especially around
the cooking areas (Figure 43). It was observed on a few occasions when resident
homes were entered, that the air was thick with smoke. Globally, indoor air
pollution is responsible for 1.6 million deaths a year and long term exposure and
inhalation of soot can contribute to respiratory diseases, lung cancer, and heart
disease (World Bank, 2013).

133
Figure 43: Inside a villager's mud house with an open flame being used for lighting.
Literacy appeared to be quite high. However, it was noted that some participants
required either the translator to fill in the questionnaire, or a literate relative.
These participants were likely those who received no schooling and made up 14%
of respondents, or those who had received minimal schooling (1-4 years,
equivalent to primary school education) and made up 3% of respondents. It was
noted, that mostly those who were younger (in their early 30s) had received a
higher secondary education (10-12 years) and further education. Furthermore,
there was a higher incidence of female respondents who had not received an
education; including two younger individuals aged 25 and 32. Interviews with
residents showed that many were concerned with the safety of young girls
travelling to school and were afraid of molestation. In particular, this fear was
stronger when girls had a long way to travel resulting in their arrival home late at
night. Thus, in order for parents to protect their daughters, they would send them
to the local village school, rather than to Yercaud. However, this was not feasible if

134
they wanted a proper education for their children as there are various issues with
the village schools.
The prevalent problem with schooling is the lack of teachers and provision of
school equipment. The problem is widespread, occurring in villages located far
from Yercaud and also those stationed relatively close (such as Koilmedu). A total
of 41 Government schools have been established to ensure all children can receive
an education regardless of caste or the family’s economic situation. Government
schools charge no school fees. Additionally, there are many benefits. Children are
provided with four uniforms annually; all their books and textbooks; school bags
and footwear; writing equipment; lunches five days in the week; a cycle in their
11th year; and a laptop in their 12th year (Government School, 2012). However,
much of the school equipment isn’t distributed; the laptops at the time of data
collection had arrived, but were not being given to students as teachers were
awaiting permission to do so. School children are not receiving these benefits, thus
forcing parents to buy the necessary items. Furthermore, the only higher
secondary Government school in Yercaud Taluk is located in Yercaud town. Not all
villages have schools and those wanting to study beyond secondary school are
forced to travel to Yercaud. The cost, time, safety, and effort of doing this can be too
great for some. The problem is further compounded by the fact that there are no
teachers to teach certain subjects at the Government schools. These problems
encompass all the Government schools. Many residents stated they did not want
their children to be labourers like themselves and wanted to ensure their children
received a proper education. Thus, despite extra costs, they sent their children to
private schools. Furthermore, some residents referred to the schools in their
village as ‘Government aided’. It is an issue which might require clarification as it
might provide insight into the aforementioned issues.
Transportation is a major issue for village children, those working outside of the
village, or those requiring medical attention or facing an emergency. For many
villages, bus services operate in their area once in the morning and evening but it
does not properly coincide with school hours. Some children are required to walk
long distances to reach a bus stop or to reach school. Children from Kolagur have

135
to walk 4 km to reach the main road where they can get transport, while some
villages, such as Kakkampady, organise a van to take children to school. However,
not every parent is able to afford the charges for the private transport. Villages
such as Keeraikkadu and Talai Cholai also faced this same problem. This also
makes it difficult for youth to attend career courses and Government training
programmes. All of these schemes are in Salem - located at the foothills of the
Shevaroyan Hills - youth have to travel to Yercaud first, before travelling to Salem.
Transport costs and time required makes this infeasible and as such, many are
unable to take advantage of the government training (Rajendran, 2012).
Comparing household expenditure against household income using an optimistic
threshold reveals that 42.9% of 112 households had incomes which could not
cover their expenses. This population is often forced into borrowing from any
available sources in order to meet expenses. Alternatively they may fall into
cyclical poverty, or a debt/non-debt cycle. Residents may earn sufficient one
month (sometimes through picking up extra work) to cover their expenses and
debt, however, this is not a permanent cash flow increase. As such, they may not be
able to cover all their expenses during the next period and slip back into debt. In
some cases, they may be forced to take illegal actions in order to get out of debt.
Such actions usually involve felling a silver oak tree and making a one-off profit by
selling it to cover expenses and debts. Residents indicated that their households
earned between Rs 2,500 - 5,000. This is approximately Rs 82 - 164 per day, per
household, with the average household consisting of five people (three adults and
two children). Using the 2011 implied PPP conversion rate of 19.129, this equates
to about $4.3 to $8.6 per household, and is less than $2 a day per capita.
Usually, the most common source of income is from agriculture and plantations.
However, there are multiple problems associated with this. In recent years,
plantation owners have been hiring casual rather than permanent workers. For
residents, this work does not provide a sustainable income as it is seasonal, usually
peaking during harvest season. During the other seasons they must find alternative
sources of income. Some are unable to find work. In one case, a woman’s husband
was a forest cutter, but there was no work available for him in Yercaud Taluk. He
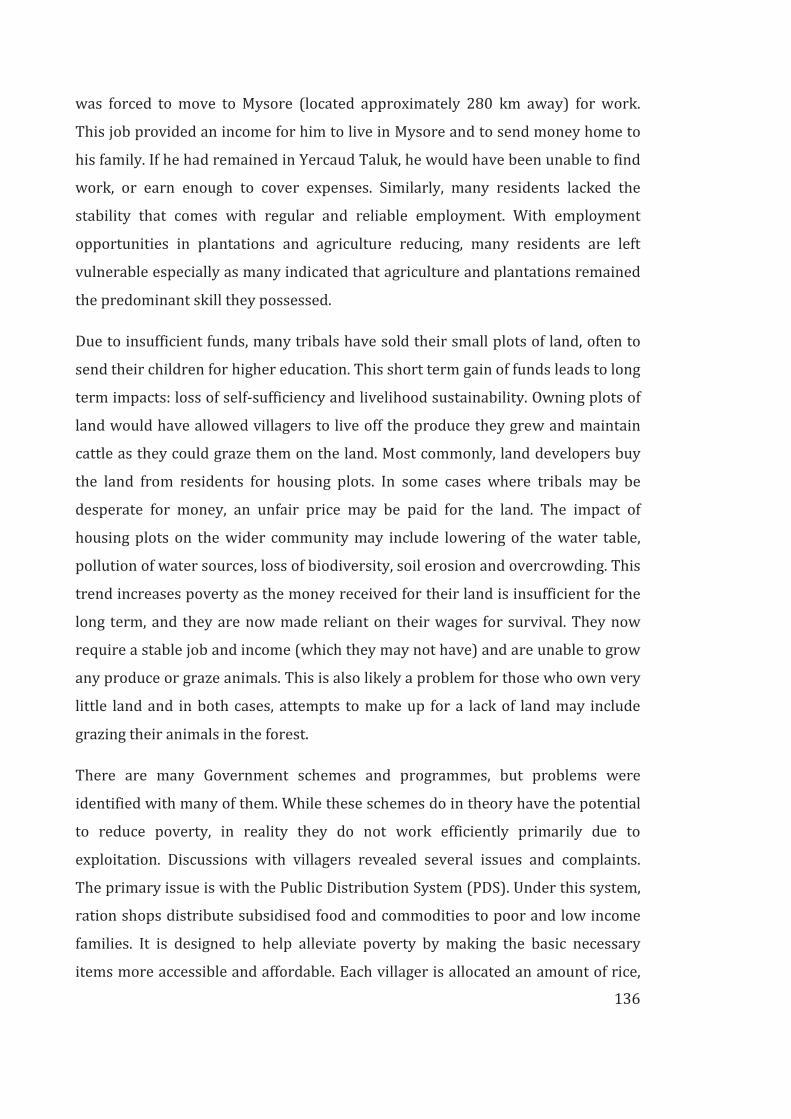
136
was forced to move to Mysore (located approximately 280 km away) for work.
This job provided an income for him to live in Mysore and to send money home to
his family. If he had remained in Yercaud Taluk, he would have been unable to find
work, or earn enough to cover expenses. Similarly, many residents lacked the
stability that comes with regular and reliable employment. With employment
opportunities in plantations and agriculture reducing, many residents are left
vulnerable especially as many indicated that agriculture and plantations remained
the predominant skill they possessed.
Due to insufficient funds, many tribals have sold their small plots of land, often to
send their children for higher education. This short term gain of funds leads to long
term impacts: loss of self-sufficiency and livelihood sustainability. Owning plots of
land would have allowed villagers to live off the produce they grew and maintain
cattle as they could graze them on the land. Most commonly, land developers buy
the land from residents for housing plots. In some cases where tribals may be
desperate for money, an unfair price may be paid for the land. The impact of
housing plots on the wider community may include lowering of the water table,
pollution of water sources, loss of biodiversity, soil erosion and overcrowding. This
trend increases poverty as the money received for their land is insufficient for the
long term, and they are now made reliant on their wages for survival. They now
require a stable job and income (which they may not have) and are unable to grow
any produce or graze animals. This is also likely a problem for those who own very
little land and in both cases, attempts to make up for a lack of land may include
grazing their animals in the forest.
There are many Government schemes and programmes, but problems were
identified with many of them. While these schemes do in theory have the potential
to reduce poverty, in reality they do not work efficiently primarily due to
exploitation. Discussions with villagers revealed several issues and complaints.
The primary issue is with the Public Distribution System (PDS). Under this system,
ration shops distribute subsidised food and commodities to poor and low income
families. It is designed to help alleviate poverty by making the basic necessary
items more accessible and affordable. Each villager is allocated an amount of rice,

137
kerosene and other similar items at a subsidised rate. However, upon receiving
their allocated amount of rations, they often find that some of it has been skimmed.
For example, if a villager was expecting 1 kg of rice, they might only receive 800 g.
They may find that it is very poor quality with the good quality goods being
reserved for members who have made a deal with the ration shop employees. In
other cases, they will not receive their ration at all as it has been sold by the ration
employees to richer people/those running retail stores and food outlets. Or they
have to wait for hours or return every day after travelling long distances because
the employees are not there and have not informed the villagers. This trend is not
unusual throughout the country and has been made a note of in the country’s
Economic Survey (2013). It can be seen that this inequity is more pronounced in
rural areas, such as Yercaud, with higher income households receiving a higher
proportion of subsidies (Figure 44). Another example of a disastrous scheme exists
between the village of Kakkampady and the tourist attraction, Pagoda Point. A
housing development project was implemented by the state government to build
houses for lower income families for a significantly lower price. However, many
said that even if they could have afforded the houses, they would not have been
able to live there as the project did not take into account the total lack of water in
the area. None of the houses were habitable for this reason and now stand in ruin.
Of particular concern, is the lack of nurses and doctors at the 2 Government clinics
which are located around Yercaud Taluk. Many residents say that, like the
government school teachers, they do not come in. Additionally, residents do not
feel like they are receiving proper care as they are treated with an injection and
then sent on their way immaterial of their complaint.

138
Figure 44: Distribution of shares of LPG across differing household income groups (Ministry of Finance,
2013).
Personal observations showed that there was social friction between tribal
villagers/impoverished and town residents. The town residents felt that residents
living in areas such as Melalaganburam and Longlipet (the poorer sections of
Yercaud town) were not trust-worthy and it was not safe to walk through the area.
Personal observations did not substantiate this claim. Instead, the primary social
problems in these areas are poverty, poor sanitation and garbage. In other cases,
residents felt that tribals were making monetary gains through dishonest means.
This opinion originated from cultural changes observed amongst tribals - such as
the abandonment of traditional ways, their ownership of cars and motorcycles and
the newer houses they built. Residents view this change as greed and an attempt to
live a ‘high life’. However, these changes have occurred through necessity and the
need to feel equal to those in Yercaud. Tribals view all these changes as positive
development towards improving their lives and this is facilitated by the influence
of those living in the towns and what they see on TV. Residents who held this view
were predominantly people who relied on tribals for labour, mostly as coolies.
Dissatisfaction has increased as tribals are becoming more independent and
aware. For example, running plantations have become more uneconomical for
plantation owners due to increasing costs, including the fact that the minimum
wage for estate workers has increased to Rs 300 a day. Tribals are aware of this
139
fact, and that they might be able to earn a better wage from other work (such as
construction), and so, they are less willing to engage in estate work. Instead, they
would rather be engaged in a job which offers greater security, better pay, and
which is less laborious. Residents on the other hand, view this behaviour as
laziness and unreliability. The Director of the Brother’s Salesian College has gained
some insight into these people during the running of a village children’s education
programme. His observation was that there is laziness due to a lack of motivation.
Their salary will not increase because they work better and as such they do the
minimum amount of work to get the maximum salary. They do not have great
dreams to motivate them to think bigger.
Most villages are predominantly made up of tribals, and over time, their culture
has changed a lot. There are a number of reasons for this, but the most damaging
was the opinion that they felt inferior to those living in the town. When in contact
with tourist culture, it was defined as ‘passing’, but in this instance this was an
inferiority based on dwelling and lifestyle differences between two different
community groups. Tribals felt insecure, or were restricted to the point where they
changed their mode of dress, religion and culture. After these changes were
adopted they were more comfortable interacting with those in town and felt less
inferior. Nowadays, they make more of an effort to dress better and make sure
their houses were done up. Additionally, if they had the funds for it, they would
invest in transportation vehicles. In other instances, tribals were restricted in their
movements which led to the loss of some of their culture. In the case of their
religion, tribals were prevented from entering the forest and they were unable to
worship their gods who were said to live in trees in the forest. As a result they
gradually changed over to the religion that was present around them, usually
Hinduism, so now many of the younger generation are unaware about their
heritage. Furthermore, as village populations were content and happy with
changes, those surveyed expressed the opinion that it was unlikely that they would
ever return to the old ways.
There are multiple other social issues that affect the area. In Yercaud town, there
are numerous illegal stalls along the lakeside and the people running these stalls
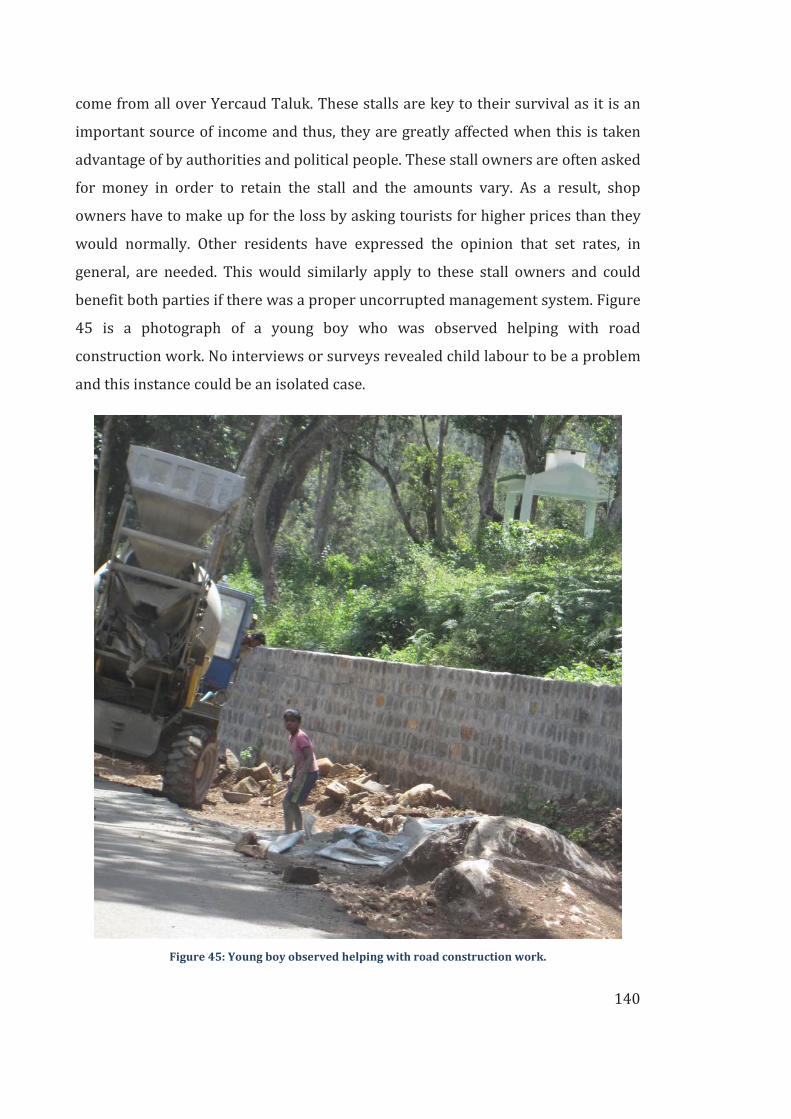
140
come from all over Yercaud Taluk. These stalls are key to their survival as it is an
important source of income and thus, they are greatly affected when this is taken
advantage of by authorities and political people. These stall owners are often asked
for money in order to retain the stall and the amounts vary. As a result, shop
owners have to make up for the loss by asking tourists for higher prices than they
would normally. Other residents have expressed the opinion that set rates, in
general, are needed. This would similarly apply to these stall owners and could
benefit both parties if there was a proper uncorrupted management system. Figure
45 is a photograph of a young boy who was observed helping with road
construction work. No interviews or surveys revealed child labour to be a problem
and this instance could be an isolated case.
Figure 45: Young boy observed helping with road construction work.

141
There is no regular/proper waste management system - rubbish bins around
Yercaud are few, inadequate in size, overflowing and seldom cleared (Figure 46);
garbage is piled into makeshift rubbish dumps wherever convenient. In general,
rubbish is buried or burnt, including those in public bins. In particular, one main
dump site was observed within 500 m of Big Lake and the Government School; and
less than 200 m away from nearby village settlements. These conditions are
unsanitary and pose a serious health hazard to inhabitants. While these areas are
unmaintained and full of litter, surrounding houses are very well maintained -
their living areas are clean and clear of rubbish, showing that residents appreciate
their living areas being clear, but are unable to receive these services.
Figure 46: Example of public rubbish bin found in Yercaud.
6.1.2.2 Tourist Related Issues
Residents do not receive many benefits from tourism as development and tourist
interest is mostly centred in Yercaud town. Karadiur, which recently had a
viewpoint created, does not receive as many tourists as the main tourist
attractions. However, the impacts are already evident - a few residents stated that
they held unfriendly feelings towards tourists and others voiced the concern that
their children’s safety may be compromised with the greater number of people and
cars going through the area. Furthermore, there are issues of promiscuous
142
behaviour occurring on the roads, forests and residents’ properties. Residents do
not like the behaviour especially when they find them on their property and this
leads to friction between the two groups.
Heavy traffic on the Ghat road is a problem, because not only does it contribute to
congestion, but drivers drive recklessly on these narrow roads. There are 21
hairpin bends and on numerous occasions there were several near misses during
the commute to Yercaud. For residents, this can be a source of particular anxiety
and vexation as tourists and visitors do not know the rules associated with hill
roads.
Yercaud town relies on tourism quite heavily and residents who rely on tourist
expenditure are being affected by the changing climate. In 2012, late monsoon
rains meant that there was reduced tourist interest in the area as the temperature
was not as cool (Times of India, 2012). Tourist interest is mainly focused on
weather and natural experiences and changing tourist behaviours create problems
for residents dependent on the same.
6.1.3 Tourism
Yercaud is primarily a weekend destination with mostly domestic tourists and a
very small number of observed international tourists. In general, most tourists
learnt about Yercaud through friends, were from Chennai and Bangalore, and were
well educated. Most tourists tend to stay within Yercaud town as this is the area
that has been developed to attract them. In contrast to the large influx of visitors
during the weekend, there are barely any visitors during the week. Some residents
expressed the opinion that there was much more to see and if people explored they
would stay longer. Currently, attempts are being made to develop Yercaud to
attract still more tourists. However, more planning should be put into developing a
tourism product which attracts long term tourists who are environmentally
conscious and spend more rather than increasing tourist numbers alone.

143
6.1.3.1 Issues Facing Tourism
One of the biggest issues is the changing climate. Delayed monsoon rains and
higher temperatures mean that tourist interest is reduced as the weather no longer
figures as an attraction. Rain is highly important in Yercaud to help control
temperatures, fill water reserves, and ensure that natural attractions such as Big
Lake and Killiyur falls have sufficient water to be a feature of interest. This was
particularly an issue in 2012 and with good weather being one of the most
important attractivity factors for tourists, changing climate can have a serious
impact on future tourist trends.
Yercaud has a combination of features that are underdeveloped and
overdeveloped. Despite Yercaud being the main tourist area, there is a lack of
amenities and facilities for tourist use. Residents identified this as a major
problem. There are no public toilets. They also identified a lack of drinking water
and poor bus services, as possible issues for tourists. Furthermore, attractions
appear badly planned as they are developed in such a way as to lose its natural
attractiveness. Further development is being planned in the area and at the time of
data collection a 40 acre botanical garden was being built. However due to a lack of
developed attractions in surrounding areas/villages which encourage tourists to
stay longer in Yercaud, tourists are mostly short term. Current attractions engage
tourists for a short time before they move on to the next. The Rose Garden is
currently being developed to fill in this niche, and due to the nature of its
attraction, the development is appropriate. A similar development plan would not
be as appropriate for other natural attractions highlighting the need for proper
planning and investigation.
In comparison to two other hill stations, Yelagiri and Ooty, Yercaud sits in the
middle in terms of development. Ooty has been identified as being overdeveloped
and crowded by tourists. However, it has a variety of features which make it
attractive. In particular, the town of Coonoor is located a short distance away from
it which provides even more attractions to visiting tourists. Thus, Ooty has the
advantage of a nearby secondary attraction. On the other hand, Yelagiri is the least
developed out of these three hill stations. However, it also appears to be less

144
popular. As a small destination there are few attractions and instead they have
capitalised on developing adventure sports and nature activities such as trekking.
Identified as an important trekking location, it poses significant competition to the
development of similar activities in Yercaud.
Stray dogs and monkeys were not identified as an issue by tourists and in general
they were tolerated and treated with indifference. However, tourists observed at
attractions were wary and uncomfortable when these animals were nearby.
Monkeys may be drawn to the area by food scraps left around or alternatively from
tourists feeding them. This behaviour encourages more monkeys to the area and
while they can provide a momentary attraction, they can become aggressive. This
poses a risk to tourists visiting the area and can affect their enjoyment.
6.1.3.2 Issues with Tourism
The most prominent impact from tourism is the increase in pollution. Several
residents have referred to the high volume of traffic and the amount of garbage
generated by this visiting population. In particular, plastic refuse (mainly plastic
bags) appears to be the most visible issue, with resident surveys saying that plastic
should be banned in the area. Longstanding residents of Yercaud resent newer
residents and visitors to the area as they have seen the impacts of development on
Yercaud. From deforestation to environmental degradation, these changes have
been attributed to the growing popularity of Yercaud as a tourist destination.
Drinking and personal safety potentially pose an issue. In the case of the
researcher visiting Kiliyur falls for data gathering, a group of men were observed
drinking and behaving in a way to cause concern. When attempts were made to
reach the attraction, two separate warnings were issued to the researcher
regarding personal safety. As this was early afternoon on a weekday, such an issue
was not anticipated. On a separate occasion when tourist surveys were being
conducted, a drunken male tourist was inadvertently handed a questionnaire.
Inappropriate conversation had to be dealt with sternly and evasive action had to
be taken. This may be a similar cause for concern for many families and women
traveling with friends.

145
One of the major issues with tourism in Yercaud is development to attract more
tourists, sometimes under the guise of ecotourism. In many cases, this may be a
marketing ploy or a lack of understanding of what ecotourism encompasses. As
such, there is the need to distinguish between the two vastly different scenarios.
6.1.3.3 Development Required
Table 34 provides an assessment of the development required for each attraction,
including current environmental and social issues.
Table 34: Development and issues with current attractions.
Name Development Requirement Environmental Fragility Socio-Cultural
Concerns
Lady's Seat Proper waste management; better fencing
for safety; proper and clean amenities
within the area for men and women;
aesthetic and natural landscaping; proper
maintenance in all seasons; control over
monkeys and stray dogs; improve
infrastructure such as adequate lighting
Pollution from litter; over-development
of small viewpoint has resulted in loss
of natural beauty; barren with few
forested areas; soil erosion nearby
from tourism development
Drinking - rowdy, lewd,
rude, unsafe behaviour
Pagoda
Point
Proper waste management; proper and
clean amenities within the area for men
and women; aesthetic and natural viewing
platforms; proper maintenance in all
seasons; improve infrastructure such as
adequate lighting; highlight original stone
pagodas
Pollution from litter; loss of natural
beauty and charm
Potential disruption of
village life from large
numbers of visiting
tourists; increased traffic
poses risk to children;
increased male tourist
population could expose
women and children to
harassment
Big Lake
(Emerald
Lake)
Proper waste management including
removal of rubbish dump to a safe location;
maintenance of facilities; restoration of
surrounding shola forest; improve
infrastructure such as sewage treatment
and lighting; proper amenities; improve
facilities, such as working fountains;
management of water hyacinth and other
pest species; reduce or mitigate impacts of
development in vicinity; vegetate riparian
strips and limit farming activities in
immediate vicinity; ensure proper stream
inflow and outflow for flushing of
hydrological system
Water pollution and contamination
from - sewage running into lake, poor
waste management, farming activities
in immediate vicinity, town rubbish
dump located in close proximity; shola
forest badly degraded - no re-
vegetation or succession of younger
saplings; over-crowding; surrounding
development has resulted in
significant sedimentation and soil
erosion; uncertainty regarding flushing
of lake system and thus build-up of
contaminants
Poses a health and
safety risk to tourists
and residents

146
Botanical
Survey of
India
Proper maintenance of grounds; improved
walking paths for safety; short guided tours
or more informative signage
Potential damage to specimens due
to tourist traffic
Potential risk of
smuggling/theft of rare
and endangered
specimens
Cauvery
Peak
Proper maintenance of grounds; improved
infrastructure and amenities; proper lighting
for safety; provide picnic tables; restore
surrounding forest and scrub
Pollution from litter; nearby bauxite
mining has heavily impacted - natural
beauty of the area, affected water
table/hydrology, degraded forest and
environment, contaminated water
sources, impacted beauty of
landscape
Drinking - rowdy, lewd,
rude, unsafe behaviour
Shevaroy
Bombax
Nil - on private residence, but could be
developed into a nature/heritage walk as
the tree is located on an old coffee
plantation with old bungalow
Potential for pollution from litter,
potential for environmental
degradation from exceeding carrying
capacity if large numbers of tourists
visit
-
Rose
Garden
Currently being developed. Ensure proper
amenities are available in the vicinity;
mitigate impacts of development, such as
soil erosion; infrastructure such as lighting;
dining areas; safe children's playground;
re-introduce native plant species/restore
forest
Pollution from litter and poor waste
management; impacts from
development such as soil erosion
Drinking - rowdy, lewd,
rude, unsafe behaviour
Children's
Seat
Safer viewing platforms and fences; more
child friendly and aesthetics should be
orientated towards children; maintenance
of grounds; improve infrastructure and
amenities; child orientated attractions
Pollution and waste management;
loss of natural beauty and charm from
poorly planned development
-
Gents Seat Maintain grounds; develop more
aesthetically pleasing seating and shelter;
develop/create better secondary attraction
Pollution and waste management;
loss of natural beauty and charm from
poorly planned development
-
Lake Park Ensure safety - barrier between park edge
and lake
Pollution and waste management;
degraded shola forest nearby
-
Anna Park Maintain grounds; improve infrastructure
and amenities available in area
Pollution and waste management;
degraded shola forest nearby
-
Deer Park Maintain grounds and facilities; improve
animal welfare; improve waste
management in area; improve safety -
reinforce bridge and replace broken
platform and barrier
Surrounding lake at risk of pollution
from activity in park; banks are not
maintained leading to soil and
concrete eroding into water - can lead
to sedimentation and pollution of lake
environment
-

147
Small Lake
(Ornamental
Lake)
Prevent pollution of lake from garbage,
road run-off and faeces by planting riparian
strip or similar/restricting nearby activity;
improve water quality by improving flushing
of system/introducing aquatic plants to filter
water; clean lake of garbage; separate
road from lake edge by creating a
boundary; locate and repair fissure
Lake system heavily polluted and
poor ecosystem health from lack of
maintenance and mitigation of human
activities in the area. A fissure has
come into existence maybe due to
intensive heavy machinery employed
in nearby construction through which
the water leaks out downhill
Kiliyur Falls Improve accessibility by making natural
steps down to waterfall; ban plastics from
area; improve infrastructure and amenities;
improve signage; maintain area free of
garbage
Pollution and waste management;
degraded forest and shrub land;
contamination of water source
Drinking - rowdy, lewd,
rude, unsafe behaviour
Karadiur
Viewpoint
improve infrastructure, provide lighting,
amenities; proper waste management;
develop Karadiur village as a secondary
attraction; conserve surrounding shola
forest and restore
Located in a degraded shola forest
which would be sensitive to pollution
and poor waste management
Potential disruption of
village life from large
numbers of visiting
tourists; increased traffic
poses risk to children;
increased male tourist
population could expose
women and children to
harassment
Heaven's
Ledge
Camping experience could be even more
'closer to nature'
Vulnerable shola forest, could be
threatened by high density of tourists
-
Kottachedu
Teak Forest
Trekking paths Vulnerable and degraded forest
susceptible to further degradation with
tourist presence or poor management;
pollution of water ways and
environment from poor environmental
behaviours
Disturbance to locals
Butterfly
Swarms
Improve habitat to encourage more
butterflies to breed in the area; introduce
temporary butterfly corridors to reduce
population death from upcoming hill traffic
when butterflies are migrating
Butterflies sensitive to poor
environment - environmental
disturbance in the area can lead to
poor breeding and thus poor
reproduction
-
Ghat Road Reduce traffic flow e.g. by enforcing one
way vehicular traffic on designated ghat
road; implement safer driving practices
Large amounts of traffic; road run-off
could be harming vulnerable
degraded forest
Shevaroy
Temple
Investigate and re-implement old traditions
and practices where feasible; improve
waste management; improve facilities and
amenities available; maintain and look after
Surrounding environment badly
degraded from bauxite mining; fragile
and in need of restoration

148
sacred spring
Bus Stand Improve and provide proper facilities and
amenities for tourists; develop a Tourist
information point for information regarding
accommodation options; activities and
attractions in the vicinity - might require
shifting of some services from Hotel Tamil
Nadu to a new centre specifically for
providing information
Pollution of surrounding environment
from poor waste management and
animals being allowed to roam freely;
no sewage system and there is a
poor dense settlement nearby
Potential conflict
between nearby poor
settlement and tourists
The Grange Improve facilities for tourists; include
activities for tourists; include guides;
develop the original fortress building into a
historical attraction
Some shola trees remaining - highly
degraded and risk of trees
disappearing completely
6.2 Supply
Using multiple sources, this research has identified two potential supply sources,
from both the environment and community. These are based on existing resources
and those which are undeveloped. Existing attractions are discussed while
potential general attractions are described briefly to highlight features and
possible development options.
The greatest supply potential exists in product development of a natural and
cultural experience outside of Yercaud town in the form of village visits. These
would provide tourists the opportunity to engage in nature-based activities and
participate in or observe traditional practices. Novel cultural community practices
would act as a potential new-visitor draw, while developing nature activities and
relaxation activities could serve as potential repeat-visitor draws.
6.2.1 Environment
Despite widespread environmental degradation on the Shevaroyan Hills, the Taluk
has several attractive qualities, predominantly in the form of scenic value. Over the
years Yercaud town has lost this quality, which can still be found in the
surrounding areas. Road routes are picturesque: they pass through dense
plantations offering a closer nature experience; good quality landscape views;
cooler climate through forested areas; opportunities for wildlife spotting, in

149
particular birds and colourful butterfly swarms (Figure 47); opportunities to see
some native tree species and stands of original shola forest.
Figure 47: Papilio polymnestor (Blue peacock) observed near Asambur.
Villages offer a unique experience with several attractivity factors: most villages
are set amongst appealing natural landscapes that offer natural experiences and
landscape viewing opportunities; the village and surrounding landscape also offers
several relaxation and nature activities, such as walking and trekking (Figure 48).
Figure 48: Walking path to Keeraikkadu.

150
Table 35 provides an overview of what each attraction provides in terms of
current and potential uses. Only three of the following attractions provide a
suitable overnight experience. In the case of Karadiur viewpoint, this would have
to be developed sustainably. The other two, Heaven’s ledge and the Grange, are
developed resorts. These three attractions also rated the highest for a number of
factors. The resorts rated the highest as they already had multiple activities within
their core attraction to provide tourists.
Table 35: Tourist attractions and their assessed current and potential use for tourism.
Name Potential Uses Potential Market Draw
Lady's Seat Day and night viewpoint Day trip
Pagoda Point Day viewpoint, sunbathing, picnicking,
trekking to nearby by village of Kakkampady,
use as a draw to Kakkampady village for
secondary attractions
Day trip
Big Lake (Emerald Lake) Boating, swimming, children's entertainment;
market and food stalls/vendors; lake walk;
bird watching, Picnicking; relaxation activities;
fishing
Day trip
Botanical Survey of India Nature experience, view unique and rare
plants, tour of unique and interesting plants,
sale of plants
Day trip
Cauvery Peak Picnicking, day and night viewpoint, relaxation
spot, market and food stalls/vendors, kite
flying, biking, recreational field
Day trip
Shevaroy Bombax Viewing of unique and rare plant specimen Day trip
Rose Garden Children's entertainment, relaxation activities,
theatrical shows, walking, plant viewing, bird
watching
Day trip
Children's Seat Day and night viewpoint, children's
entertainment, relaxation activities, picnicking
Day trip
Gents Seat Day and night viewpoint, relaxation spot,
picnicking
Day trip
Lake Park Relaxation activities, lake viewing spot,
picnicking,
Day trip

151
Anna Park Relaxation activities, picnicking, walking, plant
viewing
Day trip
Deer Park Relaxation activities, picnicking, walking,
animal watching, bird watching, children's
entertainment
Day trip
Small Lake (Ornamental Lake) Fishing; toy boating Day trip
Kiliyur Falls Nature experience, trekking, Day trip
Karadiur Viewpoint Day viewpoint, picnicking, forest trekking,
draw to visit nearby village of Karadiur,
relaxation activities, potential wildlife viewing
Day trip; overnight stay
Heaven's Ledge Viewpoint; camping grounds; relaxation
activities; picnicking; bird watching; trekking;
nature experience
Day trip; overnight stay
Kottachedu Teak Forest Nature experience, trekking, picnicking Day trip
Silk Farm Educational experience; nature experience;
children's entertainment, novelty shop
Day trip
Bears Cave Experience nature, trekking, adventure activity Day trip
Butterfly Swarms Nature experience; leisure and relaxation
activity; educational for family
Day trip
Ghat Road Leisure and relaxation activity; viewpoints;
nature viewing
Day trip
Shevaroy Temple Spiritual, cultural and historical experience Day trip
Bus Stand Viewpoint and information centre for new
tourists
Day trip
The Grange Historical experience; plantation experience;
leisure activities; walking; picnicking
Day trip; overnight stay
Unfortunately, existing wildlife on the Shevaroyan Hills is scarce despite many
residents identifying multiple animal species they believed could be viewed in the
area. However, it should be noted that the existence of these animals has not been
properly substantiated and residents did not believe these animals offered any
tourist viewing opportunities. Many residents did not recognise the attractive

152
factors of their village instead believing that only the tourist developed town of
Yercaud had anything of value for tourism. However, it is just these less developed
and pristine villages that are attractive for ecotourism rather than the more
developed Yercaud.
6.2.2 Community
Villages offer a novel cultural experience previously unexplored as a tourist
attraction in Yercaud Taluk. Attractivity features include: interaction with friendly
locals which provides a pleasant cultural experience; an opportunity to observe
remnant traditional practices; and opportunities to observe and participate in
daily village life.
The most common tourist areas that residents believed they could apply
themselves to, were: wildlife tour guides, nature tour guides, environmental
conservation projects, and hosts or participants in cultural or religious events.
While a few resorts and hotels use locals as trekking guides, it is not a common
occurrence. This is likely due to a lack of development of these areas. However,
both the environment and community are available for these products to be
developed. The population is quite young; more than 50% were under the age of
45 and had received at least 10 years of schooling. Thus, residents are young,
educated and in a good position to participate in ecotourism activities after
receiving some training.
In general, Malaiyali culture does not differ significantly to what domestic tourists
are accustomed to. However, they still exercise traditional practices (primarily
because there are no alternatives) which could be of interest to tourists. There are
several potential points of cultural interest to tourists and these include, but are
not limited to: the cultivation and preparation of natural grains - chamai and ragi -
using traditional tools (Figure 49); traditional practices, such as the collection of
rock honey; traditional trades, such as blacksmiths (Figure 50); traditional
methods not in use by others due to modern technology (Figure 51); traditional
tattoos which adorn the tribal women only (now only found among the older

153
generation) (Figure 52). This tattooed woman said, once she died the only thing
she could take with her were her tattoos.
Figure 49: Traditional implement used to remove husks from grains like chamai.

154
Figure 50: Traditional blacksmith at work with products in foreground.

155
Figure 51: Traditional method of cleaning pulping coffee.

156
Figure 52: Traditional tribal tattoos worn only by women.

157
6.3 Demand
To determine demand for tourism and ecotourism, several features were assessed.
These included demographic characteristics, destination attractivity (alternatively
destination image that tourists had and which drew them to Yercaud), importance
of different activities and services, and experience satisfaction of their stay in
Yercaud.
6.3.1 Current Tourist Trends
Surveys showed that Yercaud is a popular destination among a younger tourist
population. Furthermore, 55-73% of tourists were from middle class families.
According to India’s National Council of Applied Economic Research (NCAER),
middle class in India are made up of two sub-groups. The first sub-group, ‘seekers’,
earn an annual household income between Rs 200,000 - 500,000. The second sub-
group, ‘strivers’ earned between Rs 500,000 - 1,000,000 (Meyer & Birdsall, 2012).
Converting into implied 2011 PPP dollar (using a 19.129 conversion rate), this
equates to about $29 to $72 per day, per household for seekers, and $72 to $143
per household for strivers. Using the NCAER definition, 29-47% of tourists who
visited Yercaud were seekers and 26% were strivers. For an average length of stay
(2-3 days) tourists spent between Rs 2,950 and Rs 6,000 for below average
spenders; and Rs 6,000 and Rs 11,700 for above average spenders.
Additionally, groups were predominantly from large cities and travelled with
friends or family in groups of 1-5 people in size. They are also most likely to use
personal vehicles for transport, both to reach Yercaud and within Yercaud. Tourist
visitation patterns also showed that tourists visited the main attractions in
Yercaud, with the occasional tourist visiting less popular attractions such as
Karadiur viewpoint.
6.3.1.1 Destination Attractivity
Completing a correlation analysis of destination attractivity factors revealed three
different tourist groups. Each group is characterised by placing importance on a
different set of factors which drew them to Yercaud. Correlation did not show any

158
significant trends between demographic data, attractivity factors, activity and
services preferences, and experience satisfaction.
The first tourist group are those interested in natural features. Principally, good
weather conditions, quality of natural scenery and landscape, and opportunities to
experience nature. The second group were interested in the quality and range of
services provided, with regards to accommodation and restaurants. The final
group were attracted by infrastructure features which were interrelated: ease of
access to Yercaud, easily reached tourist sites, good roads and safe tourist sites.
Thus, these three areas are important features of Yercaud and should be preserved
and improved upon.
6.3.1.2 Tourist Preferences
The most important tourist activities were hiking/trekking/camping and
entertainment for children. These are two areas which are poorly developed in
Yercaud and which have the potential to be sustainably developed. Furthermore,
there is the potential for local involvement in these activities, particularly
hiking/trekking/camping.
In particular, two isolated groups were observed, those interested in recreational
activities, and those interested in cultural/natural activities. Within the latter
tourist group, there are many activities which are related and form a spectrum of
cultural to natural activities. There was no clear boundary between these two
groups, and thus at one end of the spectrum, there are those who are primarily
interested in natural activities, and at the other end there are those primarily
interested in cultural activities. It should be noted that at either end of these
spectrums, that some activities have elements of the other in them, for example,
‘harvesting your own fruit/vegetables’ could also be considered natural.
6.3.1.3 Tourist Satisfaction
Tourists responded with “NA” regarding satisfaction viewing wildlife. This reflects
the fact that there aren’t many (or possibly any) animals of tourist interest.
However, this could also be reflective of the fact that this has not been properly

159
developed. Yercaud has over 100 bird species which could be developed into a
successful bird watching activity in the area.
Tourists identified two areas which were unsatisfactory - adventure sports and
shopping activities. This reflects the lack of these activities and services on the
Shevaroyan Hills. Shopping opportunities that would are in keeping with
ecotourism principles and Yercaud’s image would ideally offer the best
development potential, particularly for its uniqueness to the destination. Surveys
and interviews identified a few products which could be developed towards
tourists. These were primarily natural products, such as coffee, rock honey,
pepper, and a variety of fruits. In one instance, a unique product was observed
which was made from coffee plant trunks. They were fashioned into various
household items of furniture, but were made primarily as a hobby and for personal
use (Figure 53).
Figure 53: Example of locally made product. Made from coffee plant trunks and unique to the area.

160
Overall results showed a greater number of satisfied tourists than dissatisfied,
however, in some cases only a slightly larger proportion were satisfied in
comparison to unsatisfied tourists. This trend is observed when comparing
combined ‘unsatisfactory’ and ‘very unsatisfactory’ responses against the
combined responses for ‘satisfactory’ and ‘very satisfactory’. These areas were
largely reported to be ‘satisfactory’ by tourists, but have a higher number of
unsatisfied tourists than other factors: viewing and learning about local wild
animals; local cuisine and drinks; traditional ways of life in the community;
facilities and entertainment for children; and local environmental conservation
efforts.
In general, many tourists are happy with their experience in Yercaud, primarily
because the destination is better than surrounding areas. However, Yercaud is not
a pioneer in ecotourism or environmentally friendly ways.
161
CHAPTER 7: CONCLUSIONS &
RECOMMENDATIONS The aim of this research was to highlight the need for a joint conservation and
poverty alleviation strategy in the form of ecotourism. This also included
identifying supply and demand for this form of tourism to assess feasibility of this
development route. Data gathering has revealed that the state of the environment
is in poor quality and that the community, while not in absolute poverty are in
relative poverty and face many difficulties. Tourist surveys revealed that tourists
were particularly drawn by the environment of Yercaud - the good climate, natural
scenery and landscapes - and natural activities such as trekking. As such, there is
potential to develop and invest in ecotourism to encourage tourism trends that
benefit the environment and community.
The first section of this chapter outlines issues and recommended options to
mitigate the impacts. The second section makes conclusions regarding the
environment, community, and the potential for ecotourism development to benefit
these two areas. The third section identifies further research necessary for the
successful implementation of ecotourism.
7.1 Issues and Recommendations
Issues identified in the three areas investigated in this research are outlined with
corresponding recommendations.
7.1.1 Environment
Extensive environmental degradation has been observed, predominantly from
anthropogenic pressures. Some of the most damaging current trends include
excessive development which poses a risk to all three research areas. These have
been outlined in the table below.

162
Table 36: Environmental issues and recommendations.
Observed Issue Impacts Anthropogenic Factors Recommended options
Forest degradation and
deforestation Reduction in ecosystem services
- Reduction in availability of non-timber products (fruits, flowers honey etc.)
- Water shortage/water table lowered
- Reduced waste assimilation
Changing microclimate
- Reduction in tourist interest
- Reduction in crop yields, such as coffee
Habitat degradation and fragmentation
- Human-animal conflicts
- Inability to support fauna
Biodiversity loss
Loss of unique ecosystems
- Reduced forest regeneration and succession
Poor enforcement of environmental protection rules
Illegal tree felling
Grazing of animals, such as goats
Lack of communication between coordinators of poverty alleviation and
conservation programmes
Lack of understanding of forest dynamics
Intentional and spontaneous forest fires
Garner local resident support for environmental conservation efforts
Educational programmes
Stop grazing of animals in regenerating forest
Proper enforcement
Community led conservation programmes
Restoration projects with a focus on imitating original forest dynamics
Proper communication between relevant organisations
Use of ecotourism to increase support of environment projects
Land conversion and unsustainable
development Monocultures result in reduced biodiversity
Loss of productive land
Loss of biodiversity
Loss of agricultural biodiversity
Land degradation
Pollution
Excessive development
Microclimate change
Reduction in natural quality of scenery and landscape
Habitat loss
Residents selling their land
- Rising costs associated with running plantations
- Insufficient funds and lack of financial security for needs and
expenses
Corruption and dishonesty
Ensure policies to safeguard environment from excessive development
Proper enforcement of rules during development
Effective implementation of poverty alleviation programmes
Use ecotourism/tourism to support maintenance of natural scenery and
landscapes
Create stable jobs, such as through ecotourism development to reduce
the need to sell land
Seek outside funding to create conservation projects to maintain
landscape
Water shortages Lack of water for crops - reduced crop yields
Lack of water for humans and animals
Environmental stress
Deforestation
Global climate change
Improve forest health
Implement effective afforestation schemes with aid of residents
Implement development projects to capture rain water
Pollution (Air, water, noise) Environmental degradation
Reduction in quality of natural scenery and landscape
Disruption to fauna
Poor water quality is a health hazard for tourists, residents and animals
Heavy vehicular traffic
Lack of proper waste management - rubbish dumps in close vicinity to
water bodies
Faecal contamination from lack of proper infrastructure and sewage
treatment facilities
Road run-off from close proximity to heavily used roads
Sedimentation from soil erosion caused by development
Bauxite and granite mining
Lack of enforcement of environmental rules
Enforce one way traffic on Ghat roads during weekends
Enforce safe driving
Encourage use of public transport to reduce number of private vehicles
Create safe public transport options that are not overcrowded
Raise the fee to enter Yercaud to contribute to carbon emission offset
programmes
Construct proper infrastructure and waste/sewage management
Plant riparian or similar strips on lake edge to reduce contamination of
lake water from road runoff
Enforce reclamation and restoration of mined area

163
7.1.2 Community
Various community issues have arisen due to unsustainable development in the
area. Additionally, some conflicts have been identified between conservation and
poverty alleviation efforts. Ecotourism would encourage better communication
between coordinators of these two programmes. Furthermore, it would provide
incentives for residents to aid in conservation efforts and potentially provide
alternative sources of income. Additionally, other recommendations are made
outside of those that ecotourism could provide in the following table.

164
Table 37: Social issues and recommendations.
Observed Issue Consequences Factors Recommended potential solutions/options
Lack of proper infrastructure and
housing Impacted health
Poor sanitation
Poor living conditions
Cramped living quarters
Indoor air pollution
Pollution
Lack of planning
Poverty
Poor infrastructure
Rural-urban migration for jobs
Lack of electricity (requires burning of fuels)
and ventilation
Lack of proper waste management
Poverty alleviation and aid schemes to improve housing
Build proper housing and amenity facilities
Build proper infrastructure and sewage treatment
Educational programmes
Ventilation in houses
Provide alternative fuels that are cleaner burning
Ineffective government schemes and
corruption Government loses money through lack of planning and corruption. Those in need are still left in
need
Government schools fail to distribute school equipment
Government schools have insufficient teachers willing to work in rural areas
Only one higher secondary school which is distant to many villages
Parents still have to buy school supplies despite children attending Government schools
Unfair distribution of subsidies
Time and money lost waiting for distribution of subsidies
Lack of doctors and nurses at government clinics and they fail to provide proper care
Lack of planning and proper development
Corruption - bribery and threats - fear of
those with political power
Improper policing of schemes
Self-preservation - fear of repercussions for
not complying to threats
Medical and teaching staff lack motivation
due to distance to their respective stations
Proper policing of schemes to ensure
- Fair distribution of benefits
- Staff complete their jobs well
- Adequate staff are stationed at clinics and schools
- Government employees are honest in carrying out their duties.
Poor transportation Unsafe for girls travelling long distance to school
Children in distant villages face a daily struggle to attend school
Costs of privately arranged transportation mean children have to walk
Children unable to receive a proper education due to costs and time associated with travel
Poor transportation to many villages makes reaching work,, medical facilities, or career training
courses difficult.
Lack of buses running at appropriate times
Poor infrastructure (roads)
Lack of buses travelling to more remote
villages
Increase and improve bus services
Introduce school bus services
Improve infrastructure
Low incomes Poverty
Debt
Forced into illegal activities
Forced to take up additional work
Forced to borrow money
Unable to properly educate children (unable to pay fees, provide transport, or buy school
equipment)
Selling of land
- Graze animals in forest
- Loss of self-sufficiency
- Loss of livelihood sustainability
Lack of education and skill set
Shortage of jobs, except for lower paying
labour positions (e.g. coolies)
Increasing costs
Lack of job security
Poverty alleviation schemes
Training schemes
Jobs with better wages
Alternate income sources to supplement jobs
Subsidies and support for low income earners
Improve infrastructure and technology to improve job conditions

165
Land conversion and unsustainable
development Development of slums
Environmental degradation which affects health and livelihood
Increasing land prices
Unsustainable and excessive development
Poverty
Lack of financial security
Debt
Poor planning
Corruption
Policies to safeguard environment from excessive development
Proper enforcement of rules during development
Effective implementation of poverty alleviation programmes
Create stable jobs, such as through ecotourism/conservation development to reduce the
need to sell land
Human-animal conflict Human injuries
Property and crop damage
Financial losses
Increased animosity towards conflicting animal species
Habitat loss and degradation
Lack of available water
Habitat encroachment
Improve habitat, restoration projects
Education and awareness
Fencing or other deterrents to keep Gaur away from properties
Water shortages and pollution Villages must buy water from town
Increased costs
Deforestation
Climate change
Improve forest health
Implement effective afforestation schemes with aid of residents
Implement development projects to capture rain water
Pollution Reduced health
Poor sanitation
Lack of proper infrastructure
Lack of proper waste management system
Lack of sewage treatment system
Improve infrastructure, waste management, and sewage treatment
Conflict between conservation and
poverty alleviation Loss of income
Increased feelings of animosity towards environmental rules
Failed conservation efforts
Restrictions introduced without community
consultation and mediation
Proper integration between the two programmes
Education regarding environmental importance
Alternative income sources
Environmental ignorance or
indifference Can result in:
- Environmental degradation
- Pollution
- Human-animal conflicts
- Unsustainable development and practices
Self-preservation (meeting own needs) over
environment
Lack of education and awareness
Educational programmes
Improving living conditions and poverty
Loss of tribal culture Loss of unique culture and knowledge
Loss of potential cultural attractions
Feelings of inferiority
Restrictions which make following of
traditions difficult
Influence from other residents in town and
TV
Education about uniqueness and importance of tribal culture
Ecotourism to promote sense of pride in tribal culture
Programmes to revive old traditions
Differing social perceptions of
community groups Social friction and conflict
Distrust
Changing trends
More modern behaviour among tribals
Facilitation process to increase understanding and tolerance

166
7.1.3 Tourism
Unsustainable tourism development is affecting the major attractivity qualities of
Yercaud. There are several issues related to this and with the current mass tourism
trend, which are outlined in the following table.

167
Table 38: Tourism related issues and recommendations.
Observed Issue Consequences Factors Recommended options
Pollution (Air, water, noise) Health Hazards
Loss of tourist interest as natural attractivity of destination is reduced
Lack of planning
Poor infrastructure
Lack of proper waste management
Large numbers of tourists
Build proper infrastructure and sewage treatment
Manage traffic flow, provide alternative transport up ghat road
Unsustainable development Environmental degradation reduces tourist interest
Overdevelopment
Loss of natural scenery and landscape which attract tourists
Unequal development - some areas overdeveloped, other underdeveloped
Excessive development
Intensive tourism development
Proper policies and policing of development
Proper planning with environmental and community
consideration
Reduce and implement development which is more suitable for
destination features
Predominantly weekend tourists during off-peak
season Reduced income as most tourists only visit for 2-3 days Lack of attractions for longer tourism consumption Develop sustainable attractions which engage tourists for
longer
Attract a different tourist market during the week to reduce
effect of seasonality
Marketing to attract ecotourists who might spend longer and
more in destination
Excessive tourists in Yercaud town Environmental degradation and pollution
Loss of natural attractivity
Over-crowding
Excessive tourism development in town
Lack of development of alternative tourist attractions (ecotourism in
surrounding areas)
Sustainable development of surrounding attractions to attract
tourists away from town
Improve infrastructure to deal with high density of tourists
Competition from more and less developed hill
stations (Ooty and Yelagiri) Loss of tourists to more appealing hill stations
Reduced income from tourism
Reduced destination attractivity
Unsustainable development
Lack of innovative tourism development (such as ecotourism)
Lack of directed tourism development, which is inappropriate for destination
features
Utilise ecotourism to gain a competitive edge in tourism market
Directed and sustainably planned development
Safety Tourists feel unsafe at attractions, in particular female tourists Lack of lighting and infrastructure
Drinking and inappropriate behaviour
Lack of presence of authorities
Watch guards/security at remote or potentially unsafe
attractions (e.g. Kiliyur falls)
Predominantly domestic market Lower spending than international tourists, including shorter stays - less profit
Environmental degradation and unsustainable development
Opinion that area/attraction must be developed to obtain entertainment and
satisfaction
Some attractions and activities (Cultural, historical and natural) not as
appealing as they might be to international tourists
Different discriminations and attractivity factors for domestic tourists
Development geared towards domestic tourist tastes (development not
suitable for destination features)
Lack of quality control and examples of quality domestic tourist destinations
to create a discriminative comparison of destination deficiencies
Marketing and development towards international market
Sustainable ecotourism development
Pioneer quality attractions and activities to innovate tourism
and create beneficial competition

168
7.2 Conclusions
Extensive environmental and social issues require immediate attention. In some
cases, poverty alleviation and conservation efforts are insufficient or in some cases
at odds with each other. As such, there is a need for a strategy which can jointly aid
in both issues. Furthermore, the tourism industry in the area has been observed to
have several unsustainable aspects. Ecotourism would offer a unique solution by
contributing towards reducing the impacts of issues associated with these three
areas. In particular, ecotourism could create more sustainable development.
Currently, as a tourist destination, Yercaud is both overdeveloped and
underdeveloped. Furthermore, as a predominantly nature orientated destination,
much of the development is inappropriate for the destination features and does
not make it unique or provide a competitive edge against competition.
Furthermore, investigating tourist demand for ecotourism reveals a high
orientation towards nature. Thus environmental preservation is important not just
for promoting ecotourism but for maintaining current tourism trends. Sustainable
development of cultural and natural attractions might provide opportunities to
enter the international tourist market. However, current development trends are
counterproductive to this goal.
7.3 Further Research
This research investigated the beginning stages required to implement ecotourism
in the region. As such, there is further work and research required in order to
ensure that ecotourism is implemented successfully and sustainably. This includes
further talks/interactions with stakeholders, investigations into local and national
policy that either hinders or furthers the opportunity for ecotourism
implementation; more in depth investigations into infrastructure and services
currently available as well as competitiveness of the destination; the biodiversity
footprint of the area should be assessed for conservation and potential ecotourism
uses; carrying capacity assessments should be carried out to determine suitable
tourist densities. Additionally, more detailed tourism research could be conducted
for efficient development of tourism products, including research which takes into

169
account the impact of climate change on tourist trends. Long terms environment
and community studies should be completed to ensure development continues to
be sustainable.

170
REFERENCES Acott, T. G., Trobe, H. L. L., & Howard, S. H. (1998). An Evaluation of Deep
Ecotourism and Shallow Ecotourism. Journal of Sustainable Tourism, 6(3), 238–253. doi:10.1080/09669589808667314
Adams, W. M. (2004). Biodiversity Conservation and the Eradication of Poverty. Science, 306(5699), 1146–1149. doi:10.1126/science.1097920
Al-Oun, S., & Al-Homoud, M. (2008). The Potential for Developing Community-based Tourism among the Bedouins in the Badia of Jordan. Journal of Heritage Tourism, 3(1), 36–54. doi:10.1080/1743873X.2008.9701249
Allen, L. R., Hafer, H. R., Long, P. T., & Perdue, R. R. (1993). Rural Residents’ Attitudes Toward Recreation and Tourism Development. Journal of Travel Research, 31(4), 27–33. doi:10.1177/004728759303100405
Anonymous. (2003). Tourist Guide to South India. Chennai: Sura Books. Retrieved from http://books.google.co.nz/books?id=ta6AD7MNFioC
Appiah-Opoku, S. (2011). Using Protected Areas as a Tool for Biodiversity Conservation and Ecotourism: A Case Study of Kakum National Park in Ghana. Society & Natural Resources, 24(5), 500–510. doi:10.1080/08941920.2010.495108
Ashcroft, S. J. H., & Pereira, C. (2003). Practical Statistics for the Biological Sciences: Simple Pathways to Statistical Analyses. Palgrave Macmillan Limited.
Badrudin, R., & Warokka, A. (2012). Poverty Measurement and Choice of Poverty Reduction Strategy: The Importance of Poverty Measurement in Determining the Right Strategy. Journal of Economics and Behavioral Studies, 4(10), 595–602.
Baker, K. (2009). The Changing Tourist Gaze in India’s Hill Stations: From the Early Nineteenth Century to the Present (No. 25). Department of Geography, King’s College London.
Balaguru, B., John Britto, S. J. S., Nagamurugan, N., Natarajan, D., & Soosairaj, S. (2006). Identifying Conservation Priority Zones for Effective Management of Tropical Forests in Eastern Ghats of India. Biodiversity and Conservation, 15(4), 1529–1543. doi:10.1007/s10531-004-6678-1
Banerjee, A. V., Benabou, R., & Mookherjee, D. (2006). Understanding Poverty. Oxford University Press.
Barker, C. (1996). Chapter 9: Poverty. In The Health Care Policy Process (pp. 104–117). SAGE Publications Ltd. Retrieved from

171
http://knowledge.sagepub.com.ezproxy.massey.ac.nz/view/the-health-care-policy-process/n9.xml?rskey=NrO9L4&row=3
Belisle, F. J., & Hoy, D. R. (1980). The perceived impact of tourism by residents a case study in Santa Marta, Colombia. Annals of tourism research, 7(1), 83–101.
Blackwood, D. L., & Lynch, R. G. (1994). The measurement of inequality and poverty: A policy maker’s guide to the literature. World Development, 22(4), 567–578.
Bradburn, N. M., Sudman, S., & Wansink, B. (2004). Asking Questions: The Definitive Guide to Questionnaire Design -- For Market Research, Political Polls, and Social and Health Questionnaires. Wiley. Retrieved from http://books.google.co.nz/books?id=YXKbTx2j9i4C
Brick, J. M., & Kalton, G. (1996). Handling missing data in survey research. Statistical Methods in Medical Research, 5, 215–238.
Brunt, P., & Courtney, P. (1999). Host perceptions of sociocultural impacts. Annals of tourism Research, 26(3), 493–515.
Butler, R. W. (1980). The concept of a tourist area cycle of evolution: implications for management of resources. The Canadian Geographer/Le Géographe canadien, 24(1), 5–12.
Campbell, W. (1839). British India in its relation to the decline of Hindooism, and the progress of Christianity: containing remarks on the manners, customs, and literature of the people... J. Snow.
Capenerhurst, J. (1994). Community Tourism. In Community Leisure and Recreation (pp. 144–171). Oxford: Butterworth Heinemann. Retrieved from http://www.sciencedirect.com/science/article/pii/016073839490121X
Chapin III, F. S., Zavaleta, E. S., Eviner, V. T., Naylor, R. L., Vitousek, P. M., Reynolds, H. L., … Hobbie, S. E. (2000). Consequences of changing biodiversity. Nature, 405(6783), 234–242.
Churchill, G. (1979). A paradigm for developing better measures of marketing constructs.pdf. Journal of Marketing Research, 16, 64–73.
Churchill, G. (2009). Marketing Research: Methodological Foundations. Chicago: Dryden Press.
CIA. (2013). The World Factbook. Retrieved from https://www.cia.gov/library/publications/the-world-factbook/geos/in.html

172
Coccossis, H., & Mexa, A. (2004). The Challenge of Tourism Carrying Capacity Assessment: Theory and Practice. Ashgate Pub Limited.
Cohen, E. (1979). A Phenomenology of Tourist Experiences. Sociology, 13(2), 179–201. doi:10.1177/003803857901300203
conservation. (2013). In Encyclopaedia Britannica. Retrieved from http://www.britannica.com/EBchecked/topic/133385/conservation
Costanza, R., d’ Arge, R., De Groot, R., Farber, S., Grasso, M., Hannon, B., … Paruelo, J. (1997). The value of the world’s ecosystem services and natural capital. nature, 387(6630), 253–260.
Department of Economic and Social Affairs. (2008). International Recommendations for Tourism Statistics. New York: UNWTO.
Durrant, G. B. (2005). Imputation methods for handling item-nonresponse in the social sciences: a methodological review. ESRC National Centre for Research Methods and Southampton Statistical Sciences Research Institute. NCRM Methods Review Papers NCRM/002. Retrieved from http://missingdata.lshtm.ac.uk/preprints/durrantOct05.pdf
Fennell, D. A. (2001). A Content Analysis of Ecotourism Definitions. Current Issues in Tourism, 4(5), 403–421. doi:10.1080/13683500108667896
Florence, P. L., Paulraj, A., & Ramachandramoorthy, T. (2012). Water Quality Index and Correlation Study for the Assessment of Water Quality and its Parameters of Yercaud Taluk, Salem District, Tamil Nadu, India. Chemical Science Transactions, 1(1), 139–149. doi:10.7598/cst2012.100
Formica, S. (2006). Destination Attractiveness Based on Supply and Demand Evaluations: An Analytical Framework. Journal of Travel Research, 44(4), 418–430. doi:10.1177/0047287506286714
Gamfeldt, L., Hillebrand, H., & Jonsson, P. R. (2008). Multiple functions increase the importance of biodiversity for overall ecosystem functioning. Ecology, 89(5), 1223–1231.
Gee, C. y, Organization, W. T., & Network, W. E. (1997). International Tourism: A Global Perspective. World Tourism Organization.
Geological Survey (U.S.). (1986). Geological Survey Professional Paper. U.S. Government Printing Office. Retrieved from http://books.google.co.nz/books?id=bMVUAAAAYAAJ
Goeldner, C. R., & Ritchie, J. R. B. (2006). Tourism: Principles, Practices, Philosophies (Tenth.). John Wiley & Sons.
173
Gordon, D. (2005). Indicators of Poverty & Hunger. In Expert group meeting on youth development indicators (pp. 12–14).
Government of India. (2001). Census of India.
Government of India. (2011). Census of India.
Government School. (2012, September 18). Government School Education Officer and staff.
Green, M., & Hulme, D. (2005). From correlates and characteristics to causes: thinking about poverty from a chronic poverty perspective. World Development, 33(6), 867–879. doi:10.1016/j.worlddev.2004.09.013
Gursoy, D., Chi, C., & Dyer, P. (2009). An Examination of Local’s Attitudes. Annals of tourism research, 36(4), 723–726.
Gursoy, D., Jurowski, C., & Uysal, M. (2002). Resident attitudes: A structural modeling approach. Annals of Tourism Research, 29(1), 79–105.
Gutierrez, E., Lamoureux, K., Matus, S., & Sebunya, K. (2005). Linking Communities, Tourism and Conservation: A Tourism Assessment Process. Conservation International and The George Washington University.
Harrill, R. (2004). Residents’ attitudes toward tourism development: A literature review with implications for tourism planning. Journal of Planning Literature, 18(3), 251–266.
Harrill, R., & Potts, T. (2003). Tourism planning in historic districts: Attitudes toward tourism development in Charleston. Journal of American Planning and Association, 69(3), 233–244.
Horn, C., & Simmons, D. (2002). Community adaptation to tourism: comparisons between Rotorua and Kaikoura, New Zealand. Tourism Management, 23(2), 133–143.
Hunter, M. L., & Gibbs, J. P. (2009). Fundamentals of Conservation Biology. Wiley. Retrieved from http://books.google.co.nz/books?id=8YhpzXKOJF8C
Iarossi, G. (2006). The Power of Survey Design: A User’s Guide for Managing Surveys, Interpreting Results, and Influencing Respondents. World Bank Publications.
India. (2013). In Encyclopaedia Britannica. Retrieved from http://www.britannica.com/EBchecked/topic/285248/India
IUCN. (2012). The IUCN Red List of Threatened Species. Version 2012.2. Retrieved May 8, 2013, from http://www.iucnredlist.org/about/citation
Jafari, J. (2003). Encyclopedia of tourism. Routledge.

174
Jamieson, S. (2004). Likert scales: how to (ab) use them. Medical education, 38(12), 1217–1218.
Jayakumar, S., Ramachandran, A., Bhaskaran, G., & Heo, J. (2009). Forest Dynamics in the Eastern Ghats of Tamil Nadu, India. Environmental Management, 43(2), 326–345. doi:10.1007/s00267-008-9219-y
Jayaprakash. (2012, September 9). CReNIO Team Leader and staff.
Jurowski, C., & Gursoy, D. (2004). Distance effects on residents’ attitudes towards tourism. Annals of Tourism Research, 31(2), 296–312. doi:10.1016/j.annals.2003.12.005
Kadavul, K., & Parthasarathy, N. (1999). Plant biodiversity and conservation of tropical semi-evergreen forest in the Shervarayan hills of Eastern Ghats, India. Biodiversity and Conservation, 8(3), 419–437.
Kalton, G. (2001). Practical methods for sampling rare and mobile populations. In Proceedings of the Annual Meeting of the American Statistical Association (pp. 5–9). Retrieved from https://www.amstat.org/Sections/Srms/Proceedings/y2001/Proceed/00454.pdf
Khatri, U. (n.d.). Sustainable Development and Ecotourism: Theory and Application Defining sustainable development.
Kozak, M., & Rimmington, M. (1999). Measuring tourist destination competitiveness: conceptual considerations and empirical findings. International Journal of Hospitality Management, 18(3), 273–283.
Lawson, R. W., Williams, J., Young, T., & Cossens, J. (1998). A comparison of residents’ attitudes towards tourism in 10 New Zealand destinations. Tourism Management, 19(3), 247–256.
Layne, B. H., & Thompson, D. N. (1981). Questionnaire page length and return rate. The Journal of Social Psychology, 113(2), 291–292.
Lepage, D. (2012). Checklist of the birds of Yercaud, Shevaroys. Avibase, the world bird database. Retrieved June 20, 2012, from http://avibase.bsceoc.org/checklist.jsp?lang=EN®ion=insetn03&list=howardmoore
Lilieholm, R. J., & Romney, L. R. (2000). Tourism, national parks and wildlife. In R. W. Butler & S. W. Boyd (Eds.), Tourims and National Parks: Issues and Implications (pp. 137–151). Chichester: John Wiley & Sons Ltd.
Lüsted, M. A. (2010). Poverty. ABDO.

175
Market Research Division, Ministry of Tourism, Govt. of India. (2012). India Tourism Statistics 2011 at a glance. New Delhi.
Mason, P., & Cheyne, J. (2000). Residents’ attitudes to proposed tourism development. Annals of tourism research, 27(2), 391–411.
McMinn, S., & Cater, E. (1998). Tourist typology observations from Belize. Annals of Tourism Research, 25(3), 675–699.
Meganathan, N., Selvakumar, K. N., Prabu, M., Pandian, A. S. S., & Kumar, G. S. (2009). Sources of Income Inequality and Equity: A study in Tribal Areas of Tamil Nadu. The Indian Journal of Field Veterinarians, 5(1), 48–51.
Meyer, C., & Birdsall, N. (2012). New Estimates of India’s Middle Class. Technical Note. Washington DC: Center for Global Development.
Miller, D. (2009). New Views of the Tibetan Plateau and Himalaya for Conserving Biodiversity. In Mountain Forum Bulletin (Vol. 9, pp. 58–59).
Milman, A., & Pizam, A. (1988). Social impacts of tourism on central Florida. Annals of Tourism Research, 15(2), 191–204.
Ministry of Finance. (2013). Economic Survey 2012-13. India: Government of India. Retrieved from http://indiabudget.nic.in/index.asp
Mother Louis. (2012, August 29). Mother Louis from the Social Service Guild of Yercaud.
Mozumder, S., & Tuck, M. (2008, August 26). New data show 1.4 billion live on less than $1.25 a day, but progress against poverty remains strong. The World Bank. Retrieved from http://archive.is/DFrZ
Murray, M., & Marks, D. F. (2008). Chapter 19: Challenging Social Inequalities in Health. In D. R. Crane & T. B. Heaton (Eds.), Handbook of Families & Poverty (pp. 334–350). SAGE Publications, Inc.
Newmark, W. (2002). Importance of Biodiversity. In Conserving Biodiversity in East African Forests (Vol. 155, pp. 39–68). Springer Berlin Heidelberg. Retrieved from http://dx.doi.org/10.1007/978-3-662-04872-6_3
Nicholas and Company. (1875).
O’Reilly, A. M. (1986). Tourism carrying capacity: concepts and issues. Tourism Management, 8, 254–258.
Pearce, P., Moscardo, G., & Ross, G. (1996). Tourism Community Relationships. Oxford: Pergamon. Retrieved from http://www.sciencedirect.com/science/article/pii/016073839490121X
Peter, J. (2012). View of Big Lake from Arthurs Seat.
176
Pizam, A. (1978). Tourism’s impacts: The social costs to the destination community as perceived by its residents. Journal of travel research, 16(4), 8–12.
poverty. (2013). In Encyclopaedia Britannica. Retrieved from http://www.britannica.com/EBchecked/topic/473136/poverty
Price, L. L. (2010). Personal Observation. In Wiley International Encyclopedia of Marketing. John Wiley & Sons, Ltd. Retrieved from http://dx.doi.org/10.1002/9781444316568.wiem02050
Rajakumar, S., Velmurugan, P., Shanthi, K., Ayyasamy, P. M., & Lakshmanaperumalsamy, P. (2006). Prevalence of Coliform Bacteria in Kodaikanal and Yeraud Lake, Tamilnadu, South India. Research Journal of Microbiology, 1(6), 527–533.
Rajannan, B. (1992). Salem cyclopedia: a cultural and historical dictionary of Salem District, Tamil Nadu. Institute of Kongu Studies. Retrieved from http://books.google.co.nz/books?id=Ez9uAAAAMAAJ
Rajendran. (2012, August 24). Deepam’s People Society Director.
Rajes, M. (n.d.). History of the Shevaroys. In Yercaud Tourist Guide.
Rajes, M., & Sadanandan, S. (n.d.). Places of Tourist Interest. In Yercaud Tourist Guide.
Ramesh, R. (2013). Neolithic and Iron Age Culture in Salem Region, Tamil Nadu. Heritage and Us, 2(1), 25–31.
Rao, N., & Suresh, K. T. (2001). Domestic Tourism in India. In K. B. Ghimire (Ed.), The native tourist: mass tourism within developing countries. Earthscan Publications Ltd.
Rotary Yercaud. (n.d.). Yercaud Tourist Guide.
Ryan, C., & Cooper, C. (2004). Residents’ perceptions of tourism development: The case of Raglan, New Zealand. Tourism Review International, 8(1), 1–15.
Sandelowski, M. (2000). Combining qualitative and quantitative sampling, data collection, and analysis techniques in mixed-method studies. Research in Nursing & Health, 23, 246–255.
Saravanan, A., & Rao, Y. V. (2012). Equitable Tourism Development: Need For Strategic Partnership. International Journal of Multidisciplinary Research, 2(3), 344–356.
Sheldon, P. J., & Var, T. (1984). Resident attitudes to tourism in North Wales. Tourism Management, 5(1), 40–47.

177
Shevaroy Hills. (2013). In Encyclopaedia Britannica. Retrieved from http://www.britannica.com/EBchecked/topic/1574305/Shevaroy-Hills
Smith, S. L. (1994). The tourism product. Annals of tourism research, 21(3), 582–595.
Special Correspondent. (2011, January 25). Eco activists want ban on bauxite mining in Shevaroyan Hills. The Hindu, p. 7.
Spencer, J. E., & Thomas, W. L. (1948). The Hill Stations and Summer Resorts of the Orient. Geographical Review, 38(4), 637–651.
Statistic Brain Research Institute. (2012). World Poverty Statistics - Statistic Brain. Retrieved June 12, 2013, from http://www.statisticbrain.com/world-poverty-statistics/
Sugirtharaj. (2012, July 23). Yercaud Forest Officer.
Thurston, E. (2004). dirs of Anaimarais : Malai lis of Shevaroys The Dravidian head Dravidian problem (Vol. 2, No. 3). Asian Educational Services.
Times of India. (2011, November). Illegal mining destroying Yercaud hills, says plea. The Times Of India. Retrieved May 19, 2013, from http://articles.timesofindia.indiatimes.com/2011-11-15/chennai/30401272_1_illegal-mining-bauxite-yercaud
Times of India. (2012, October). Rain triggers start of second season in Yercaud. The Times Of India. Retrieved May 5, 2013, from http://articles.timesofindia.indiatimes.com/2012-10-22/coimbatore/34652693_1_yercaud-rain-triggers-shop-owners
Um, S., & Crompton, J. L. (1990). Attitude determinants in tourism destination choice. Annals of Tourism Research, 17(3), 432–448.
United Nations General Assembly. (1987). UN Documents: Gathering a Body of Global Agreements. In Chapter 2: Towards Sustainable Development.
United Nations Statistical Division, & National Household Survey Capability Programme. (2005). Household Sample Surveys in Developing and Transition Countries (Vol. 96). United Nations Publications.
UNWTO. (2013). UNWTO World Tourism Barometer and Statistical Annex, 11, 1–64.
Vashakmadze, V. (2008). Assessment of Ecotourism Potential in Georgia. IUCN. Retrieved from http://www.greengeorgia.ge/sites/default/files/Ecotourism%20Assessment%20in%20Georgia.pdf

178
Walpole, M., & Wilder, L. (2008). Disentangling the links between conservation and poverty reduction in practice. Oryx, 42(04), 539. doi:10.1017/S0030605308000744
Weather2. (2013). Yercaud Climate History. Weather2. Retrieved from http://www.myweather2.com/City-Town/India/Yercaud/climate-profile.aspx
Weaver, D. B. (2001). The encyclopedia of ecotourism. Oxon, UK; New York, NY: CABI Pub.
Wickens, E. (2002). The sacred and the profane: A tourist typology. Annals of tourism research, 29(3), 834–851.
Wilson, F. H. (1888). The Shevaroys, a Story of Their Past, Present, and Prospective Future. Higginbotha & Company.
Wood, A., Stedman-Edwards, P., & Johanna, M. (Eds.). (2000). The root causes of biodiversity loss. Earthscan.
World Bank. (2003). World Development Report 2003: Sustainable Development in a Dynamic World. New York: Oxford University Press.
World Bank. (2011). Perspectives on Poverty in India: Stylized Facts from Survey Data. World Bank. Retrieved from https://openknowledge.worldbank.org/handle/10986/2299
World Bank. (2013). World Development Indicators 2013. Washington, DC. Retrieved from https://openknowledge.worldbank.org/handle/10986/13191
World Bank Institute. (2005). Poverty manual (JH Revision of August 8, 2005.). Washington, DC.
World Tourism Organization. (2005). Definition: Sustainable Development of Tourism. World Tourism Organisation. Retrieved August 19, 2013, from http://sdt.unwto.org/en/content/about-us-5

179
APPENDICES Appendix 1: Panchayats and Villages
Panchayat Villages Manjakuttai Manjakuttai Old Manjakuttai Athiyur Kommakadu
Asambur Semmaduvu Maruthayankadu Mailapatti
Yercaud Jarinakadu Mundugampadi Gundur Yercaud
Murugan Nagar Theppakadu Karungali Koilmedu
Tank pudur Vasambadi Kasikal Ondikadai
Kiliyur
Nagalur Kolagur Puliyampatty Chettiyapatti Puliyamarathur
Annanagar Suraikkayapatti Elavadi S.t.nagar
Nagalur Thalurkadu Karadiur Kotadiyar
Jayalalitha nagar Veppadi Melkaradiyur Puthur
Borderkadu Melkolagur Muluvi
Velur Pattipadi Nadur Kondayanur Thalurkadu
Akkaraiyur Sonapadi Velur Thennamarakadu
Ilayaramankadu Thalur
Vazhavanthi Vazhavanthi Mottukadu Keeraikadu Settukadu
Aranmanaikadu Parakadai Kumbipadi Thenkadakadu
K. puthur Puliankadai
Semmanatham Semmanatham Poolakkadu Mangalam Senkalathupadi
Arasamarathur Pudur Northenchedu Solur
Kadukkamarathur S. puthur Olakkodu Mundasedu
Periyakadu
Thalaisolai Thalaisolai Pilleri Pasipallam Sengadu
Kakkampadi Pottukadu Palathur Thekkampadi
Kedakadu Samutharakadu
Vellakkadai Piliyur Nallur Melur Piliyur tankpadi
Anaikadu Periyerikadu Mottur Salapari
Karaparai Vellakkadai
Maramangalam Maramangalam Kovilur Kelaiyur Northanchedu.k
Arangam Kuttamathikadu Kombuthuki Pelakkadu
Chinnamadhur Madhur Koothumuthal Senthittu
Kalikadu Mavoothu Kottachedu
Unknown Nadavoor Palakadiur Cauvery peak

180
Appendix 2: 2001 Census Yercaud Taluk

181

182
Appendix 3: Birdlist Yercaud (Lepage, 2012)
Common name Scientific name Common name Scientific name
Phasianidae Monarchidae
*Painted Bush Quail Perdicula erythrorhyncha Asian Paradise-flycatcher Terpsiphone paradisi
*Red Spurfowl Galloperdix spadicea Corvidae
*Painted Spurfowl Galloperdix lunulata Rufous Treepie Dendrocitta vagabunda
*Grey Junglefowl Gallus sonneratii Large-billed Crow/Jungle Crow Corvus macrorhynchos
Ardeidae Paridae
Indian Pond Heron Ardeola grayii Great Tit Parus major
Falconidae Hirundinidae
Common Kestrel Falco tinnunculus Barn Swallow Hirundo rustica
Accipitridae Dusky Crag Martin Ptyonoprogne concolor
Oriental Honey Buzzard Pernis ptilorhynchus Red-rumped Swallow Cecropis daurica
Black-winged Kite Elanus caeruleus Cisticolidae
Black Kite Milvus migrans Grey-breasted Prinia Prinia hodgsonii
Brahminy Kite Haliastur indus Jungle Prinia Prinia sylvatica
Short-toed Eagle Circaetus gallicus Genera Incertae Sedis
Crested Serpent Eagle Spilornis cheela Common Tailorbird Orthotomus sutorius
Shikra Accipiter badius Pycnonotidae
White-eyed Buzzard Butastur teesa Red-whiskered Bulbul Pycnonotus jocosus
Indian Black Eagle Ictinaetus malayensis Red-vented Bulbul Pycnonotus cafer
Bonelli's Eagle Hieraaetus fasciatus White-browed Bulbul Pycnonotus luteolus
Booted Eagle Hieraaetus pennatus Yellow-browed Bulbul Acritillas indica
Columbidae Black Bulbul Hypsipetes
leucocephalus
Spotted-necked Dove Streptopelia chinensis Sylviidae
Emerald Dove Chalcophaps indica Blyth's Reed Warbler Acrocephalus
dumetorum
Psittacidae Greenish Warbler Phylloscopus trochiloides
Plum-headed Parakeet Psittacula cyanocephala Large-billed Leaf Warbler Phylloscopus
magnirostris
Blossom-headed Parakeet Psittacula roseata Timaliidae
Cuculidae Puff-throated Babbler Pellorneum ruficeps
Common Hawk-Cuckoo Cuculus varius Indian Scimitar Babbler Pomatorhinus horsfieldii
Common Cuckoo Cuculus canorus Tawny-bellied Babbler Dumetia hyperythra
Blue-faced Malkoha Rhopodytes viridirostris *Rufous Babbler Turdoides subrufa
Sirkeer Malkoha Taccocua leschenaultii Jungle Babbler Turdoides striata
Greater Coucal Centropus sinensis Brown-cheeked Fulvetta Alcippe poioicephala
Strigidae Zosteropidae
Collared Scops Owl Otus bakkamoena Oriental White-eye Zosterops palpebrosus
Mottled Wood Owl Strix ocellata Irenidae
Jungle Owlet Glaucidium radiatum Asian Fairy-bluebird Irena puella
Caprimulgidae Sittidae
Grey Nightjar Caprimulgus indicus Velvet-fronted Nuthatch Sitta frontalis
Apodidae Sturnidae
Asian Palm Swift Cypsiurus balasiensis Jungle Myna Acridotheres fuscus

183
Hemiprocnidae Bank Myna Acridotheres ginginianus
Crested Treeswift Hemiprocne coronata Common Myna Acridotheres tristis
Coraciidae Purple-backed Starling/Daurian
Starling
Sturnus sturninus
Indian Roller Coracias benghalensis Chestnut-tailed Starling Sturnus malabaricus
Alcedinidae Brahminy Starling Sturnus pagodarum
White-throated Kingfisher Halcyon smyrnensis Turdidae
Common Kingfisher Alcedo atthis Pied Thrush Zoothera wardii
Meropidae Orange-headed Thrush Zoothera citrina
Blue-bearded Bee-eater Nyctyornis athertoni Eurasian Blackbird Turdus merula
Green Bee-eater Merops orientalis Muscicapidae
Upupidae Oriental Magpie-Robin Copsychus saularis
Common Hoopoe Upupa epops White-rumped Shama Copsychus malabaricus
Ramphastidae Indian Robin Saxicoloides fulicatus
Brown-headed Barbet Megalaima zeylanica Blue Rock Thrush Monticola solitarius
*White-cheeked Barbet Megalaima viridis Blue-capped Rock Thrush Monticola cinclorhynchus
Coppersmith Barbet Megalaima
haemacephala
Asian Brown Flycatcher Muscicapa dauurica
Picidae Rusty-tailed Flycatcher Muscicapa ruficauda
Brown-capped Woodpecker Dendrocopos
moluccensis
Red-breasted Flycatcher Ficedula parva
Rufous Woodpecker Celeus brachyurus Asian Verditer Flycatcher Eumyias thalassinus
Lesser Yellow-naped
Woodpecker
Picus chlorolophus Tickell's Blue Flycatcher Cyornis tickelliae
Black-rumped Woodpecker Dinopium benghalense Chloropseidae
Pittidae Blue-winged Leafbird Chloropsis
cochinchinensis
Indian Pitta Pitta brachyura Golden-fronted Leafbird Chloropsis aurifrons
Genera Incertae sedis Dicaeidae
Common Woodshrike Tephrodornis
pondicerianus
Thick-billed Flowerpecker Dicaeum agile
Artamidae Pale-billed Flowerpecker Dicaeum
erythrorhynchos
Ashy Woodswallow Artamus fuscus Plain Flowerpecker Dicaeum concolor
Aegithinidae Nectariniidae
Common Iora Aegithina tiphia Purple Sunbird Cinnyris asiaticus
Campephagidae Loten's Sunbird Cinnyris lotenius
Large Cuckoo-shrike Coracina macei Estrildidae
Black-headed Cuckoo-shrike Coracina melanoptera Indian Silverbill Lonchura malabarica
Scarlet Minivet Pericrocotus flammeus Scaly-breasted Munia Lonchura punctulata
Bar-winged Flycatcher-shrike Hemipus picatus Black-throated Munia Lonchura kelaarti
Laniidae Motacillidae
Brown Shrike Lanius cristatus Grey Wagtail Motacilla cinerea
Oriolidae White-browed Wagtail Motacilla
maderaspatensis
Eurasian Golden Oriole Oriolus oriolus Olive-backed Pipit Anthus hodgsoni
Black-hooded Oriole Oriolus xanthornus

184
Dicruridae Fringillidae
Black Drongo Dicrurus macrocercus Common Rosefinch Carpodacus erythrinus
Ashy Drongo Dicrurus leucophaeus
White-bellied Drongo Dicrurus caerulescens
Bronzed Drongo Dicrurus aeneus
Greater Racket-tailed Drongo Dicrurus paradiseus
*Endemic (country/region)

185
Appendix 4: Tourist Survey

186
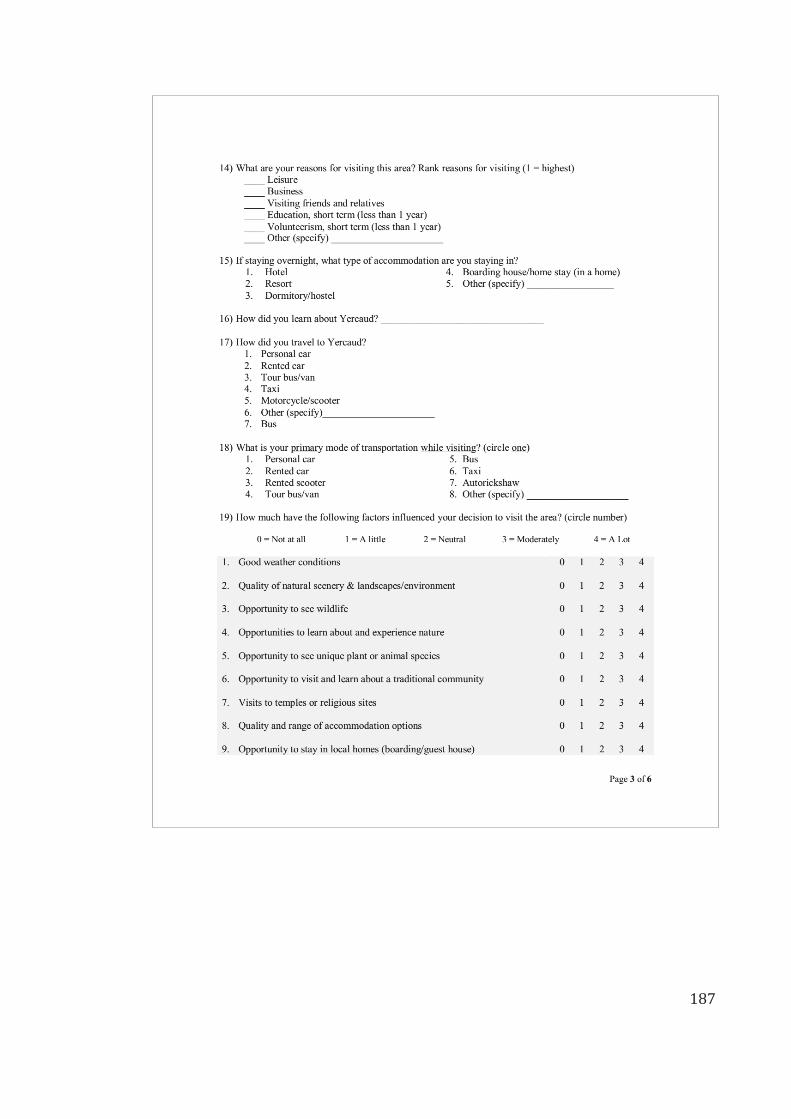
187

188

189

190

191
Appendix 4a: Resident Survey

192

193

194

195

196

197

198