Embed Size (px)
Citation preview
doi.org/10.26434/chemrxiv.9894437.v2
The Potential Economic Feasibility of Direct Electrochemical NitrogenReduction as a Route to AmmoniaGal Hochman, Alan Goldman, Frank A. Felder, James Mayer, Alexander Miller, Patrick L. Holland, LeoGoldman, Pritricia Manocha, Ze Song, Saketh Aleti
Submitted date: 03/10/2019 • Posted date: 04/10/2019Licence: CC BY-NC-ND 4.0Citation information: Hochman, Gal; Goldman, Alan; Felder, Frank A.; Mayer, James; Miller, Alexander;Holland, Patrick L.; et al. (2019): The Potential Economic Feasibility of Direct Electrochemical NitrogenReduction as a Route to Ammonia. ChemRxiv. Preprint.
The Haber-Bosch synthesis produces ammonia from hydrogen and nitrogen gases in a globally importantenergy-intensive process that uses coal or natural gas as a fuel and as a hydrogen source. Directelectrochemical ammonia synthesis from nitrogen and water using renewable energy sources presents analternative to the Haber-Bosch process that would be sustainable and environmentally benign. Additionally,the different production structure of direct electrochemical nitrogen reduction technology suggests a supplychain alternative to the ammonia industry, and a method for load-leveling of the electrical grid. This alternativeroute to ammonia from dinitrogen would not require the same large capital investments as does theHaber-Bosch process, nor would it require access to a fossil fuel supply. We show that under certainscenarios, at feasibly achievable levels of energy efficiency with a future electrocatalyst, direct nitrogenreduction would be economically competitive or advantageous compared with Haber-Bosch-based ammoniaproduction.
File list (1)
download fileview on ChemRxivENR-23Sep2019-ChemRxiv.pdf (1.78 MiB)
[DRAFT]
The potential economic feasibility of direct electrochemical nitrogen reduction as a route to ammonia
Gal Hochman,*a Alan S. Goldman,*b Frank A. Felder,c James M. Mayer,d Alexander J. M. Miller,e Patrick L. Holland,d Leo A. Goldman,a Patricia Manocha,a Ze Song,a Saketh Aleti a aDepartment of Agriculture, Food & Resource Economics, Rutgers, The State University of New Jersey, New Brunswick, New Jersey 08901, USA; Email: [email protected] bDepartment of Chemistry and Chemical Biology, Rutgers, The State University of New Jersey, New Brunswick, New Jersey 08903, USA; Email: [email protected] cCenter for Energy, Economic & Environmental Policy, Edward J. Bloustein School of Planning and Public Policy, Rutgers, The State University of New Jersey, 33 Livingston Avenue, New Brunswick, New Jersey 08901, USA Email: [email protected] dDepartment of Chemistry, Yale University, New Haven, Connecticut 06511, USA. E-mail: [email protected], [email protected] eDepartment of Chemistry, University of North Carolina at Chapel Hill, Chapel Hill, North Carolina 27599-3290, USA. E-mail: [email protected] *Corresponding authors
Abstract
The Haber-Bosch synthesis produces ammonia from hydrogen and nitrogen gases in a globally important energy-intensive process that uses coal or natural gas as a fuel and as a hydrogen source. Direct electrochemical ammonia synthesis from nitrogen and water using renewable energy sources presents an alternative to the Haber-Bosch process that would be sustainable and environmentally benign. Additionally, the different production structure of direct electrochemical nitrogen reduction technology suggests a supply chain alternative to the ammonia industry, and a method for load-leveling of the electrical grid. This alternative route to ammonia from dinitrogen would not require the same large capital investments as does the Haber-Bosch process, nor would it require access to a fossil fuel supply. We show that under certain scenarios, at feasibly achievable levels of energy efficiency with a future electrocatalyst, direct nitrogen reduction would be economically competitive or advantageous compared with Haber-Bosch-based ammonia production.
2
1. Introduction
The world’s crop production, which amounted to about 9.5 × 10¹⁵ calories in 2006, is projected to increase by 70% to 1.6 × 10¹⁶ calories by 2050.1 To meet this growing demand, an increased input of nutrients, particularly nitrogen, is needed to support the intensification of agricultural production.2 Specifically, ammonia (NH3) is produced industrially either for direct use as fertilizer or as the feedstock from which other nitrogen-containing nutrients for plant growth are made.3-4 Ammonia is currently synthesized from nitrogen (N2) and hydrogen (H2) using the Haber-Bosch process (H-B) (eq 1).
N2 + 3 H2 2 NH3 (1)
Haber discovered the underlying catalytic process for H-B around 19085 and it currently provides the nitrogen for virtually all synthetic fertilizer. Fertilizer synthesis from the H-B process led to huge increases in crop production in the 20th century5-6 and is projected to support half of the world’s food production by 2025, with the share further increasing in subsequent decades.2 Current ammonia production is ca. 180 million metric tons (mt) per year7 with a growth rate of ca. 4% projected through 2022.8
H-B is energy-intensive as currently applied. Natural gas or coal are typically used as fuel and as the source of hydrogen (via steam reforming). The chemical equilibrium of eq 1 lies far to the left side at temperatures required by the current catalytic system; thus, very high pressures (150-300 bar9) are used to drive the reaction to the right. Even at such pressures, however, at chemical equilibrium the conversion to NH3 is only ca. 12-30%.9-11 The process is also capital-intensive, requiring large centralized plants to be economical, and a significant input of energy above that of the actual product. It is estimated that about 2% of the world's fossil fuel is consumed by the process,12 with the carbon released as CO2. It is therefore critical to develop a sustainable route to ammonia that is not dependent on fossil fuel. An ideal alternative to H-B would also be a decentralized or distributed method, reducing transportation costs and enabling deployment in locations remote from current ammonia infrastructure.13
Ammonia has also received much attention as a medium for storage and transportation of energy.14-22 Energy sources in remote locations could be used for the production of ammonia which is relatively easy to ship or transport by pipeline. The ammonia could then be used in fuel cells or combusted for mechanical or electrical energy.
Electrolysis of water followed by H-B (hereinafter E/H-B), and direct electrochemical nitrogen reduction (hereinafter ENR)23-27, represent two methods that can use electricity, potentially from renewable energy sources, as the source of energy required for ammonia synthesis. Such processes could significantly reduce or even virtually eliminate the need for fossil fuel and the commensurate emissions of CO2. E/H-B would still require centralized production, because the electrolysis-generated H2 would be fed into a an H-B plant of the type currently in use. ENR, in contrast, could be more readily decentralized as it obviates the need for H-B. It would thus save the energy and capital costs of running H-B, and would permit the use of decentralized facilities and distributed
3
sources of electricity, thereby reducing the cost of transportation of ammonia to agricultural regions.
The discovery of active electrocatalysts for ENR has proceeded rapidly over the last few years although there are still no reported examples that approach a practical level of efficiency. Reported catalysts have a wide range of different chemical compositions, containing Bi, Au, Mo, Ag, Pd, Fe, and numerous other metals,28-51 implying that there is promise for even more reactive and selective catalysts. Very low cathodic overpotentials (as low as 50 mV48) have been reported. A representative leading catalyst uses molybdenum carbide nanorods to yield up to 95 micrograms NH3 per hour per milligram of catalyst at a cathodic potential of -0.30 V.52 This catalyst system, like others recently reported, achieves a Faradaic efficiency of about 10% and at -0.30 V vs. RHE, a current density of ~25 mA/cm2. It seems possible that higher current density and selectivity could be achieved at greater driving force using the flow cell strategy recently published by Robert and Berlinguette53 for CO2 reduction, enabling ENR to reach industrially relevant current densities above 150 mA/cm2.
Technoeconomic aspects of ENR have been analyzed from several perspectives.10, 22, 41, 54-60 In this article we analyze the conditions that affect the potential economics of ENR, particularly relative to H-B-based ammonia production through either the conventional fossil-fuel based route or via H2 derived from the electrolysis of water (E/H-B). In particular, we estimate costs using micro-level dynamic electricity pricing data61 to examine how current real-world price fluctuations could affect the costs of ammonia obtained by ENR and by E/H-B. Both ENR and E/H-B are complementary with renewable energy sources such as wind and solar which, due to their intermittency, lead to high variability in pricing due to mismatches between electrical output and demand. By selectively operating when pricing is favorable, such electrochemical processes can take advantage of these supply-demand mismatches. This not only favors their economic potential, but also allows them to act in a "load-leveling" capacity for an electric grid that is significantly based on renewables, thereby favoring the transition to a renewables-based energy system.62-63
2. Ammonia produced via the Haber-Bosch process based on fossil fuel: current practices
2a. Overview
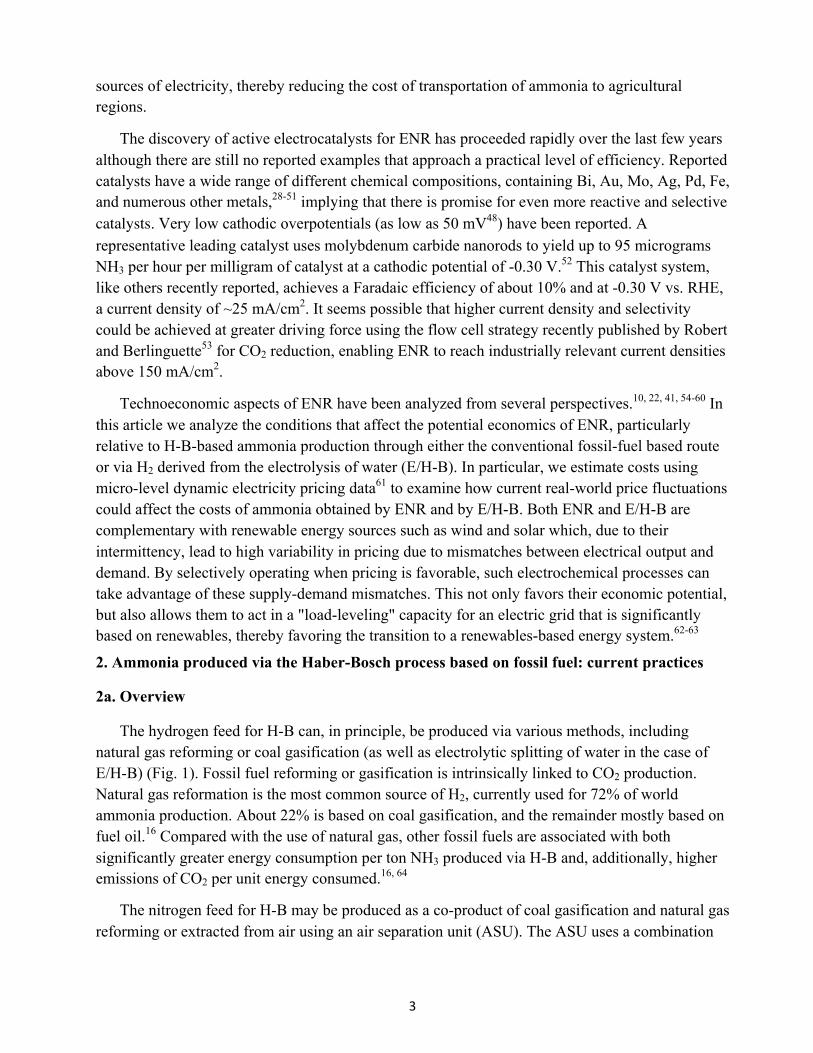
The hydrogen feed for H-B can, in principle, be produced via various methods, including natural gas reforming or coal gasification (as well as electrolytic splitting of water in the case of E/H-B) (Fig. 1). Fossil fuel reforming or gasification is intrinsically linked to CO2 production. Natural gas reformation is the most common source of H2, currently used for 72% of world ammonia production. About 22% is based on coal gasification, and the remainder mostly based on fuel oil.16 Compared with the use of natural gas, other fossil fuels are associated with both significantly greater energy consumption per ton NH3 produced via H-B and, additionally, higher emissions of CO2 per unit energy consumed.16, 64
The nitrogen feed for H-B may be produced as a co-product of coal gasification and natural gas reforming or extracted from air using an air separation unit (ASU). The ASU uses a combination
4
of compression, cooling, and expansion to separate the nitrogen from oxygen and other compounds in air, and therefore requires additional energy input.4, 65
Figure 1: Ammonia synthesis based on Haber-Bosch synthesis using different energy sources
2.b. Energy requirements of H-B based on natural gas
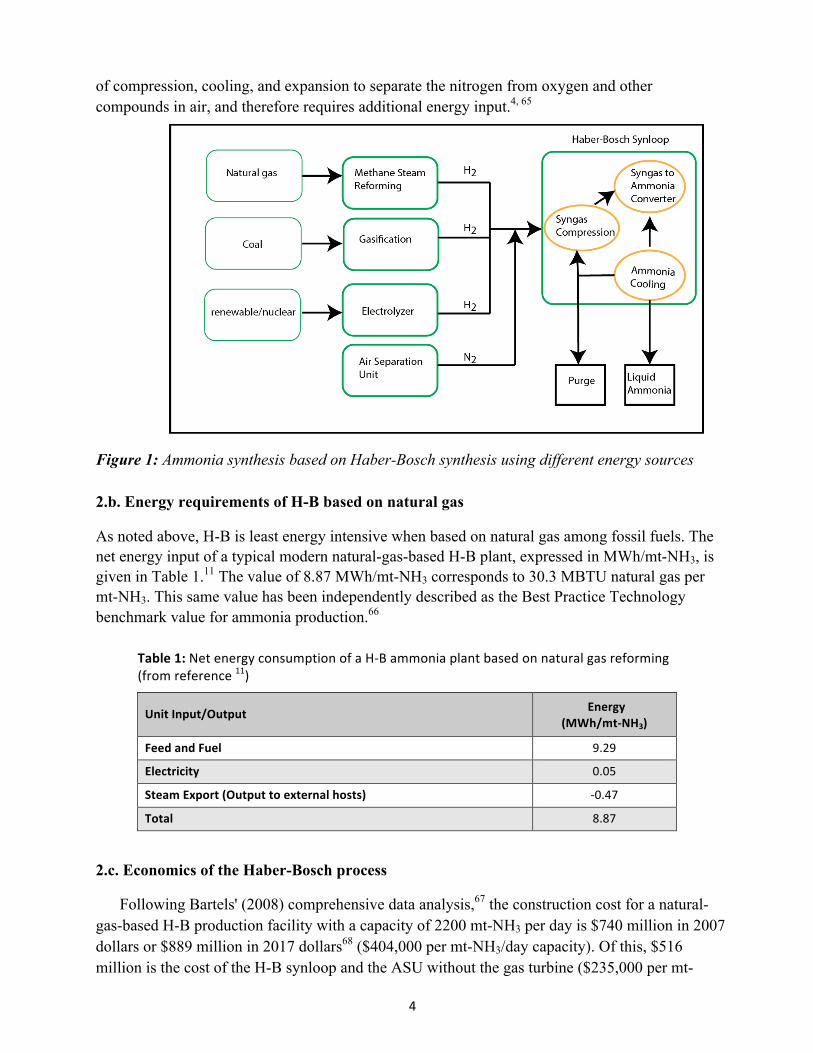
As noted above, H-B is least energy intensive when based on natural gas among fossil fuels. The net energy input of a typical modern natural-gas-based H-B plant, expressed in MWh/mt-NH3, is given in Table 1.11 The value of 8.87 MWh/mt-NH3 corresponds to 30.3 MBTU natural gas per mt-NH3. This same value has been independently described as the Best Practice Technology benchmark value for ammonia production.66
Table 1: Net energy consumption of a H-‐B ammonia plant based on natural gas reforming (from reference 11)
Unit Input/Output Energy (MWh/mt-‐NH3)
Feed and Fuel 9.29
Electricity 0.05
Steam Export (Output to external hosts) -‐0.47
Total 8.87
2.c. Economics of the Haber-Bosch process
Following Bartels' (2008) comprehensive data analysis,67 the construction cost for a natural-gas-based H-B production facility with a capacity of 2200 mt-NH3 per day is $740 million in 2007 dollars or $889 million in 2017 dollars68 ($404,000 per mt-NH3/day capacity). Of this, $516 million is the cost of the H-B synloop and the ASU without the gas turbine ($235,000 per mt-
5
NH3/day capacity). The cost of the H-B synloop alone is $294 million ($134,000 per mt-NH3/day capacity). Smaller H-B plants (100 to 600 mt-NH3/day) have recently been constructed at costs corresponding to ca. $700,000 per mt-NH3/day.69
Based on the value of 30.3 MBTU natural gas per mt-NH3,11, 66 and using the average Henry Hub natural gas price of $3.08/MBTU for January, 2017 through December, 2018, (with annual averages of $2.99 and $3.17 respectively)70 the cost for the natural gas required by a plant of the type considered in Table 1 is $93 per mt-NH3 produced.
Using the above construction costs, we estimate the capital cost. We use the assumptions made in the U.S. Department of Energy H2A Distributed Hydrogen Production Model (Version 3),71 and considered a capital cost of 5.00% per year (corresponding to an interest rate of 4.00% per year repaid over 40 years). At this rate the construction cost of $404,000 per mt-NH3/day capacity corresponds to $20,200/year per mt-NH3/day capacity, corresponding to $55/mt-NH3. To approximate operation and maintenance (O&M) costs we use employment values reported for the recently built Yara/BASF ammonia plant (2018 start-up) in Freeport, TX, with a capacity of 2055 mt-NH3/day with 35 full-time employees.72 We use DOE H2A73 estimates of salary, administrative costs, and insurance costs, obtaining yearly expenses of $16.6 million, or $22/mt-NH3.
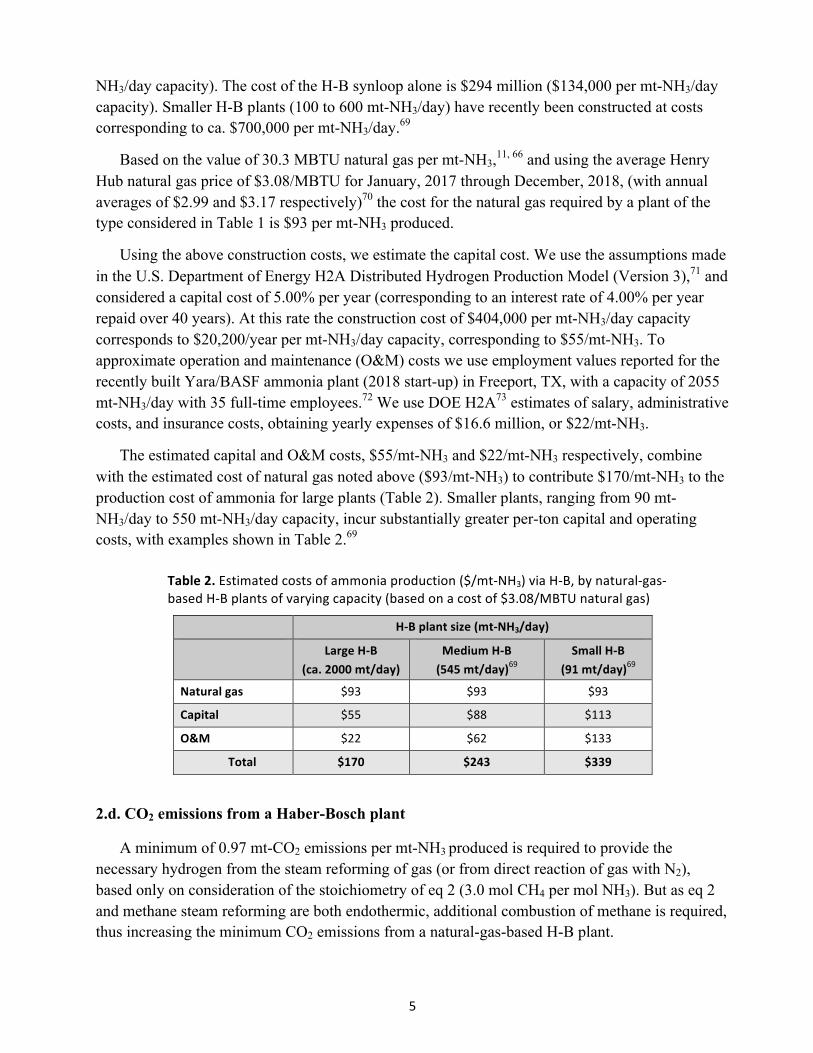
The estimated capital and O&M costs, $55/mt-NH3 and $22/mt-NH3 respectively, combine with the estimated cost of natural gas noted above ($93/mt-NH3) to contribute $170/mt-NH3 to the production cost of ammonia for large plants (Table 2). Smaller plants, ranging from 90 mt-NH3/day to 550 mt-NH3/day capacity, incur substantially greater per-ton capital and operating costs, with examples shown in Table 2.69
Table 2. Estimated costs of ammonia production ($/mt-‐NH3) via H-‐B, by natural-‐gas-‐based H-‐B plants of varying capacity (based on a cost of $3.08/MBTU natural gas)
H-‐B plant size (mt-‐NH3/day)
Large H-‐B (ca. 2000 mt/day)
Medium H-‐B (545 mt/day)69
Small H-‐B (91 mt/day)69
Natural gas $93 $93 $93
Capital $55 $88 $113
O&M $22 $62 $133
Total $170 $243 $339
2.d. CO2 emissions from a Haber-Bosch plant
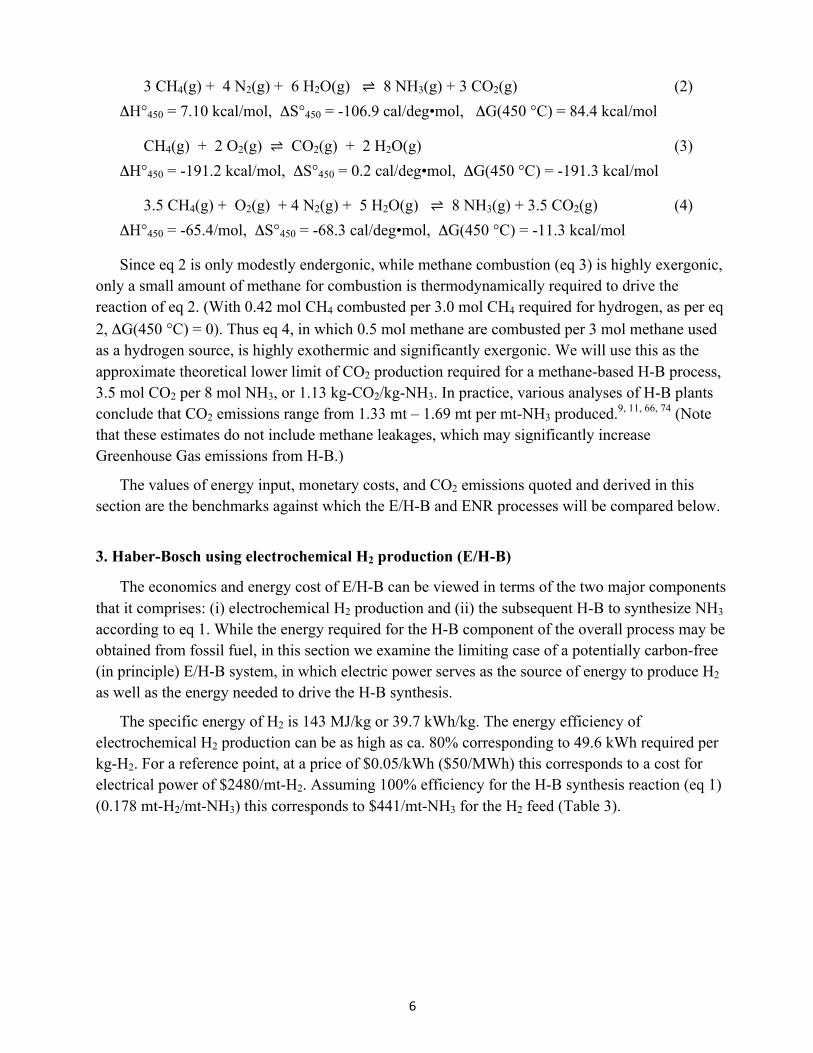
A minimum of 0.97 mt-CO2 emissions per mt-NH3 produced is required to provide the necessary hydrogen from the steam reforming of gas (or from direct reaction of gas with N2), based only on consideration of the stoichiometry of eq 2 (3.0 mol CH4 per mol NH3). But as eq 2 and methane steam reforming are both endothermic, additional combustion of methane is required, thus increasing the minimum CO2 emissions from a natural-gas-based H-B plant.
6
3 CH4(g) + 4 N2(g) + 6 H2O(g) ⇌ 8 NH3(g) + 3 CO2(g) (2) ΔH°450 = 7.10 kcal/mol, ΔS°450 = -106.9 cal/deg•mol, ΔG(450 °C) = 84.4 kcal/mol
CH4(g) + 2 O2(g) ⇌ CO2(g) + 2 H2O(g) (3) ΔH°450 = -191.2 kcal/mol, ΔS°450 = 0.2 cal/deg•mol, ΔG(450 °C) = -191.3 kcal/mol
3.5 CH4(g) + O2(g) + 4 N2(g) + 5 H2O(g) ⇌ 8 NH3(g) + 3.5 CO2(g) (4) ΔH°450 = -65.4/mol, ΔS°450 = -68.3 cal/deg•mol, ΔG(450 °C) = -11.3 kcal/mol
Since eq 2 is only modestly endergonic, while methane combustion (eq 3) is highly exergonic, only a small amount of methane for combustion is thermodynamically required to drive the reaction of eq 2. (With 0.42 mol CH4 combusted per 3.0 mol CH4 required for hydrogen, as per eq 2, ΔG(450 °C) = 0). Thus eq 4, in which 0.5 mol methane are combusted per 3 mol methane used as a hydrogen source, is highly exothermic and significantly exergonic. We will use this as the approximate theoretical lower limit of CO2 production required for a methane-based H-B process, 3.5 mol CO2 per 8 mol NH3, or 1.13 kg-CO2/kg-NH3. In practice, various analyses of H-B plants conclude that CO2 emissions range from 1.33 mt – 1.69 mt per mt-NH3 produced.9, 11, 66, 74 (Note that these estimates do not include methane leakages, which may significantly increase Greenhouse Gas emissions from H-B.)
The values of energy input, monetary costs, and CO2 emissions quoted and derived in this section are the benchmarks against which the E/H-B and ENR processes will be compared below.
3. Haber-Bosch using electrochemical H2 production (E/H-B)
The economics and energy cost of E/H-B can be viewed in terms of the two major components that it comprises: (i) electrochemical H2 production and (ii) the subsequent H-B to synthesize NH3 according to eq 1. While the energy required for the H-B component of the overall process may be obtained from fossil fuel, in this section we examine the limiting case of a potentially carbon-free (in principle) E/H-B system, in which electric power serves as the source of energy to produce H2 as well as the energy needed to drive the H-B synthesis.
The specific energy of H2 is 143 MJ/kg or 39.7 kWh/kg. The energy efficiency of electrochemical H2 production can be as high as ca. 80% corresponding to 49.6 kWh required per kg-H2. For a reference point, at a price of $0.05/kWh ($50/MWh) this corresponds to a cost for electrical power of $2480/mt-H2. Assuming 100% efficiency for the H-B synthesis reaction (eq 1) (0.178 mt-H2/mt-NH3) this corresponds to $441/mt-NH3 for the H2 feed (Table 3).
7
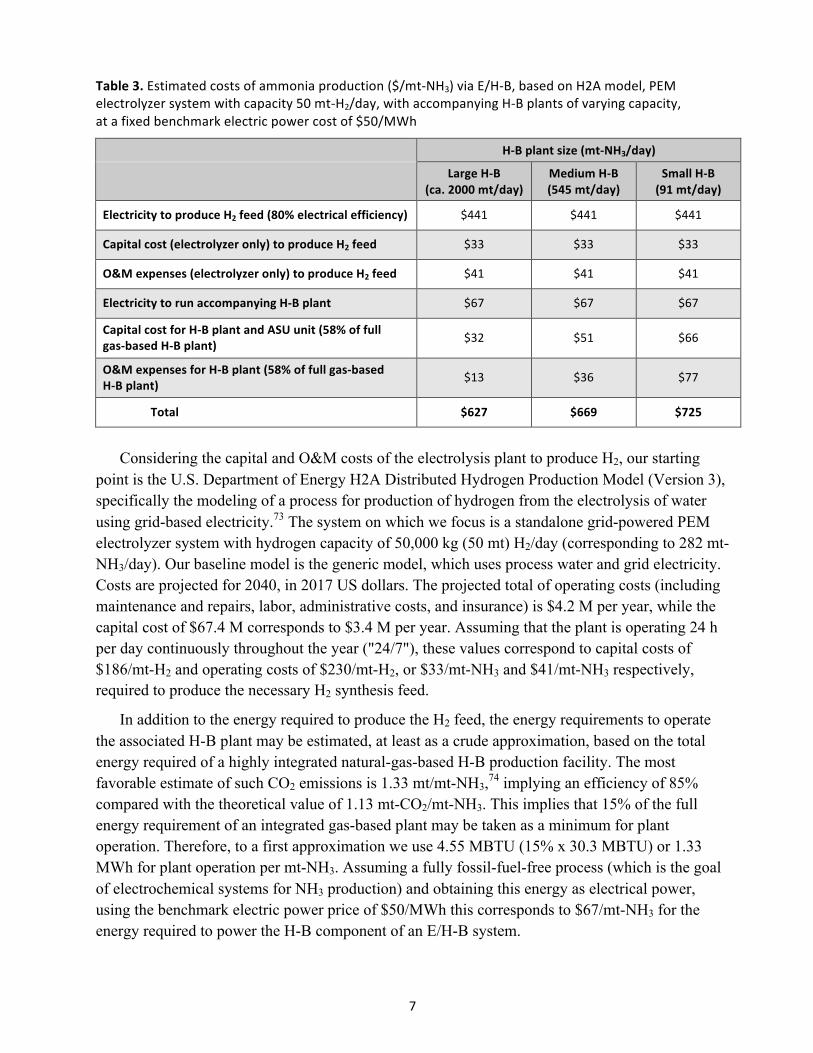
Table 3. Estimated costs of ammonia production ($/mt-‐NH3) via E/H-‐B, based on H2A model, PEM electrolyzer system with capacity 50 mt-‐H2/day, with accompanying H-‐B plants of varying capacity, at a fixed benchmark electric power cost of $50/MWh
H-‐B plant size (mt-‐NH3/day)
Large H-‐B (ca. 2000 mt/day)
Medium H-‐B (545 mt/day)
Small H-‐B (91 mt/day)
Electricity to produce H2 feed (80% electrical efficiency) $441 $441 $441
Capital cost (electrolyzer only) to produce H2 feed $33 $33 $33
O&M expenses (electrolyzer only) to produce H2 feed $41 $41 $41
Electricity to run accompanying H-‐B plant $67 $67 $67
Capital cost for H-‐B plant and ASU unit (58% of full gas-‐based H-‐B plant) $32 $51 $66
O&M expenses for H-‐B plant (58% of full gas-‐based H-‐B plant)
$13 $36 $77
Total $627 $669 $725
Considering the capital and O&M costs of the electrolysis plant to produce H2, our starting point is the U.S. Department of Energy H2A Distributed Hydrogen Production Model (Version 3), specifically the modeling of a process for production of hydrogen from the electrolysis of water using grid-based electricity.73 The system on which we focus is a standalone grid-powered PEM electrolyzer system with hydrogen capacity of 50,000 kg (50 mt) H2/day (corresponding to 282 mt-NH3/day). Our baseline model is the generic model, which uses process water and grid electricity. Costs are projected for 2040, in 2017 US dollars. The projected total of operating costs (including maintenance and repairs, labor, administrative costs, and insurance) is $4.2 M per year, while the capital cost of $67.4 M corresponds to $3.4 M per year. Assuming that the plant is operating 24 h per day continuously throughout the year ("24/7"), these values correspond to capital costs of $186/mt-H2 and operating costs of $230/mt-H2, or $33/mt-NH3 and $41/mt-NH3 respectively, required to produce the necessary H2 synthesis feed.
In addition to the energy required to produce the H2 feed, the energy requirements to operate the associated H-B plant may be estimated, at least as a crude approximation, based on the total energy required of a highly integrated natural-gas-based H-B production facility. The most favorable estimate of such CO2 emissions is 1.33 mt/mt-NH3,74 implying an efficiency of 85% compared with the theoretical value of 1.13 mt-CO2/mt-NH3. This implies that 15% of the full energy requirement of an integrated gas-based plant may be taken as a minimum for plant operation. Therefore, to a first approximation we use 4.55 MBTU (15% x 30.3 MBTU) or 1.33 MWh for plant operation per mt-NH3. Assuming a fully fossil-fuel-free process (which is the goal of electrochemical systems for NH3 production) and obtaining this energy as electrical power, using the benchmark electric power price of $50/MWh this corresponds to $67/mt-NH3 for the energy required to power the H-B component of an E/H-B system.
8
As noted in Section 2.c., the total capital for a 2200-mt/day ammonia plant, including H-B synloop and ASU, but without the gas turbine, is about $516 million or 58% of the cost of a full H-B plant of the same capacity. This would contribute a capital cost of $25.8 million/year, corresponding to $32/mt-NH3 assuming 24/7 operation. We will crudely approximate that O&M costs for this natural-gas-free (H2-based) H-B plant will be of the same proportion to capital cost, i.e. 58% that of a full natural-gas-based H-B plant. Using the values estimated for the aforementioned Yara/BASF plant yields an O&M cost of $13/mt-NH3 for this H2-based H-B plant. For smaller H2-based H-B plants, which are of a size more commensurate with the 50-mt-H2/day capacity of the electrolyzer for H2 production under consideration, we will also estimate the capital cost and O&M costs to be of the same proportion (58%) to that of a natural-gas-based H-B plant of the same lower capacity. Specifically, we use the costs obtained for the same representative 545-mt-NH3/day and 91-mt-NH3/day plants considered in Section 2.c.
The total costs of ammonia production from E/H-B plants that use electrochemically produced H2 for feed and fuel can now be estimated. The values obtained, based on the benchmark electric power price of $50/MWh and other conditions assumed above, are summarized in Table 3. At the largest economy of scale, the total cost is estimated as $627/mt-NH3, with higher costs incurred with smaller-scale accompanying H-B plants.
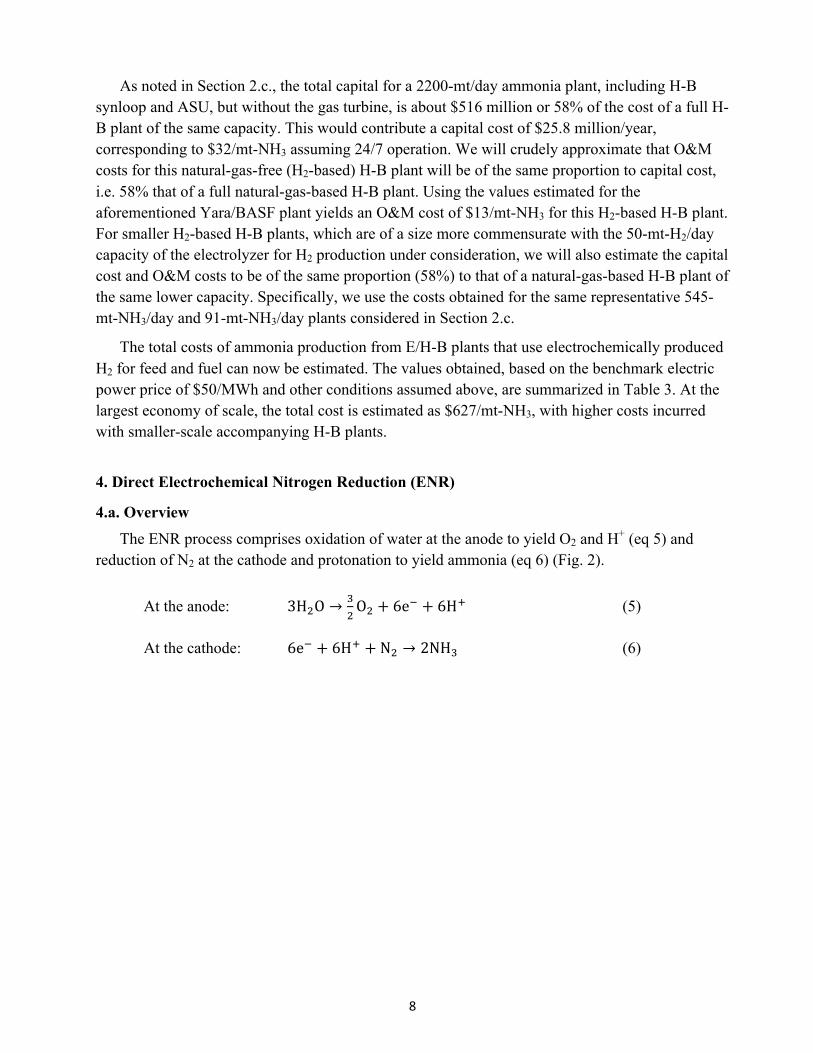
4. Direct Electrochemical Nitrogen Reduction (ENR)
4.a. Overview
The ENR process comprises oxidation of water at the anode to yield O2 and H+ (eq 5) and reduction of N2 at the cathode and protonation to yield ammonia (eq 6) (Fig. 2).
At the anode: 3H!O →!!O! + 6e! + 6H! (5)
At the cathode: 6e! + 6H! + N! → 2NH! (6)
9
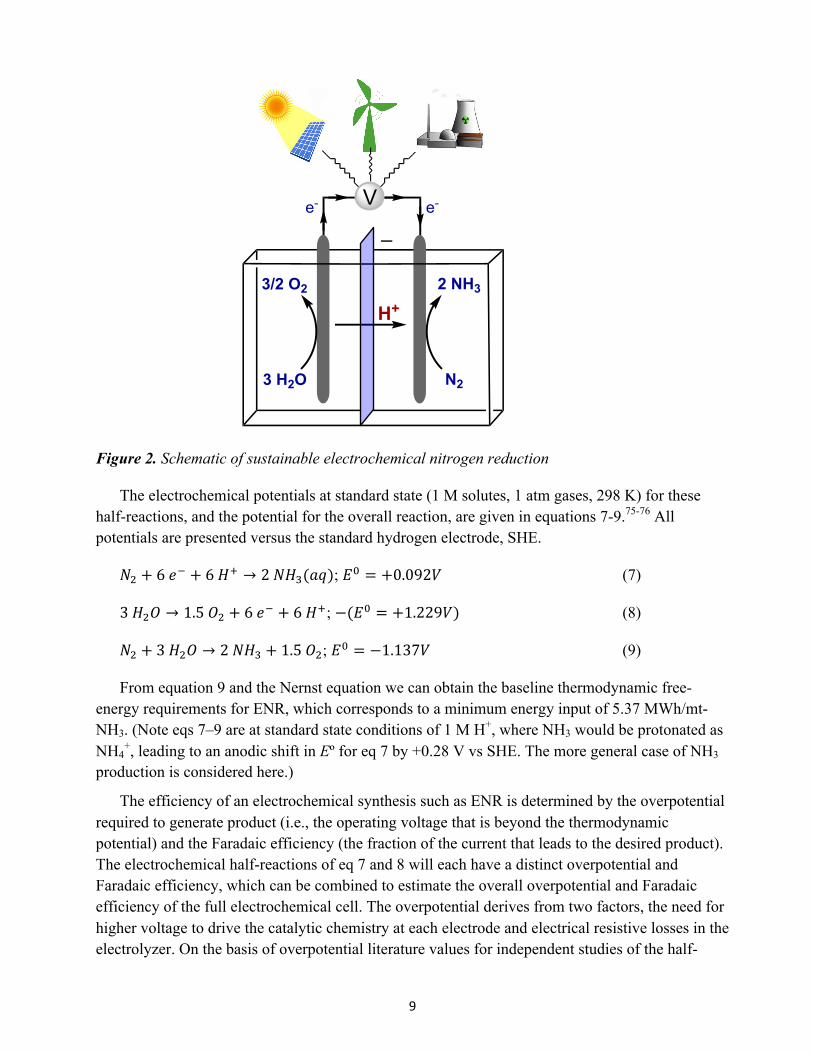
Figure 2. Schematic of sustainable electrochemical nitrogen reduction
The electrochemical potentials at standard state (1 M solutes, 1 atm gases, 298 K) for these half-reactions, and the potential for the overall reaction, are given in equations 7-9.75-76 All potentials are presented versus the standard hydrogen electrode, SHE.
𝑁! + 6 𝑒! + 6 𝐻! → 2 𝑁𝐻!(𝑎𝑞); 𝐸! = +0.092𝑉 (7)
3 𝐻!𝑂 → 1.5 𝑂! + 6 𝑒! + 6 𝐻!; −(𝐸! = +1.229𝑉) (8)
𝑁! + 3 𝐻!𝑂 → 2 𝑁𝐻! + 1.5 𝑂!; 𝐸! = −1.137𝑉 (9)
From equation 9 and the Nernst equation we can obtain the baseline thermodynamic free-energy requirements for ENR, which corresponds to a minimum energy input of 5.37 MWh/mt-NH3. (Note eqs 7–9 are at standard state conditions of 1 M H+, where NH3 would be protonated as NH4
+, leading to an anodic shift in Eº for eq 7 by +0.28 V vs SHE. The more general case of NH3 production is considered here.)
The efficiency of an electrochemical synthesis such as ENR is determined by the overpotential required to generate product (i.e., the operating voltage that is beyond the thermodynamic potential) and the Faradaic efficiency (the fraction of the current that leads to the desired product). The electrochemical half-reactions of eq 7 and 8 will each have a distinct overpotential and Faradaic efficiency, which can be combined to estimate the overall overpotential and Faradaic efficiency of the full electrochemical cell. The overpotential derives from two factors, the need for higher voltage to drive the catalytic chemistry at each electrode and electrical resistive losses in the electrolyzer. On the basis of overpotential literature values for independent studies of the half-
N2
2 NH33/2 O2
3 H2O
V
H+
e- e-
10
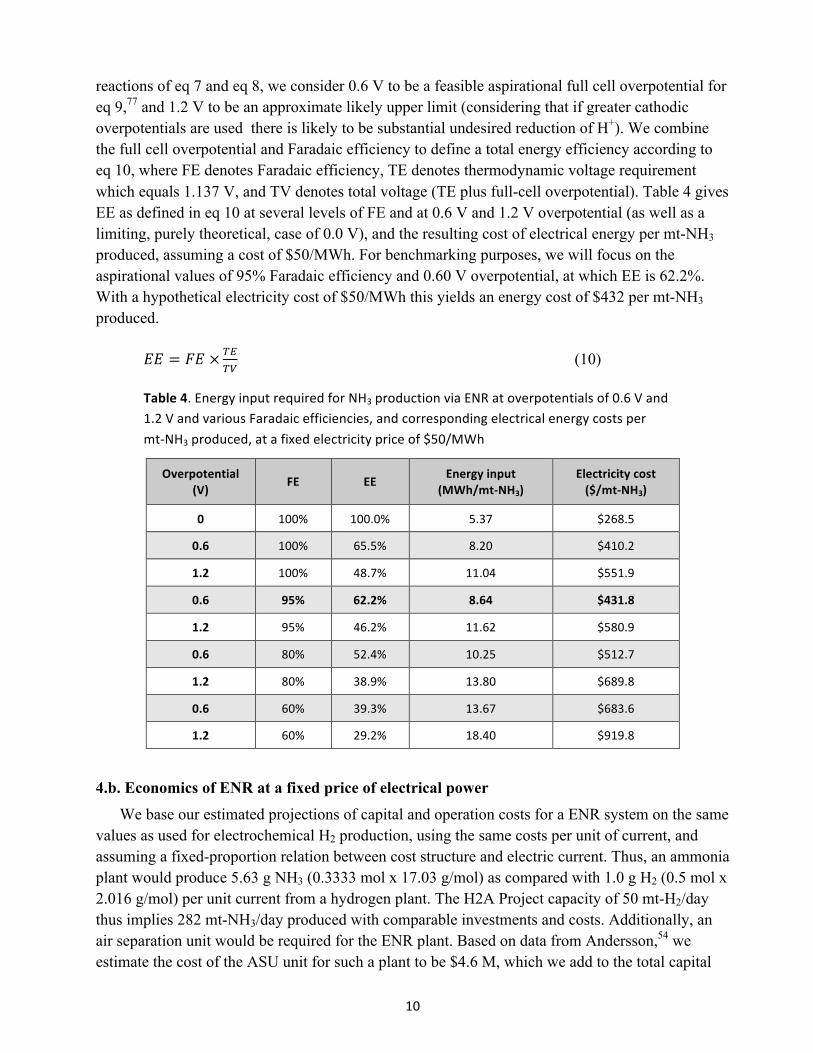
reactions of eq 7 and eq 8, we consider 0.6 V to be a feasible aspirational full cell overpotential for eq 9,77 and 1.2 V to be an approximate likely upper limit (considering that if greater cathodic overpotentials are used there is likely to be substantial undesired reduction of H+). We combine the full cell overpotential and Faradaic efficiency to define a total energy efficiency according to eq 10, where FE denotes Faradaic efficiency, TE denotes thermodynamic voltage requirement which equals 1.137 V, and TV denotes total voltage (TE plus full-cell overpotential). Table 4 gives EE as defined in eq 10 at several levels of FE and at 0.6 V and 1.2 V overpotential (as well as a limiting, purely theoretical, case of 0.0 V), and the resulting cost of electrical energy per mt-NH3 produced, assuming a cost of $50/MWh. For benchmarking purposes, we will focus on the aspirational values of 95% Faradaic efficiency and 0.60 V overpotential, at which EE is 62.2%. With a hypothetical electricity cost of $50/MWh this yields an energy cost of $432 per mt-NH3 produced.
𝐸𝐸 = 𝐹𝐸 × !"!"
(10)
Table 4. Energy input required for NH3 production via ENR at overpotentials of 0.6 V and 1.2 V and various Faradaic efficiencies, and corresponding electrical energy costs per mt-‐NH3 produced, at a fixed electricity price of $50/MWh
Overpotential (V)
FE EE Energy input (MWh/mt-‐NH3)
Electricity cost ($/mt-‐NH3)
0 100% 100.0% 5.37 $268.5
0.6 100% 65.5% 8.20 $410.2
1.2 100% 48.7% 11.04 $551.9
0.6 95% 62.2% 8.64 $431.8
1.2 95% 46.2% 11.62 $580.9
0.6 80% 52.4% 10.25 $512.7
1.2 80% 38.9% 13.80 $689.8
0.6 60% 39.3% 13.67 $683.6
1.2 60% 29.2% 18.40 $919.8
4.b. Economics of ENR at a fixed price of electrical power
We base our estimated projections of capital and operation costs for a ENR system on the same values as used for electrochemical H2 production, using the same costs per unit of current, and assuming a fixed-proportion relation between cost structure and electric current. Thus, an ammonia plant would produce 5.63 g NH3 (0.3333 mol x 17.03 g/mol) as compared with 1.0 g H2 (0.5 mol x 2.016 g/mol) per unit current from a hydrogen plant. The H2A Project capacity of 50 mt-H2/day thus implies 282 mt-NH3/day produced with comparable investments and costs. Additionally, an air separation unit would be required for the ENR plant. Based on data from Andersson,54 we estimate the cost of the ASU unit for such a plant to be $4.6 M, which we add to the total capital
11
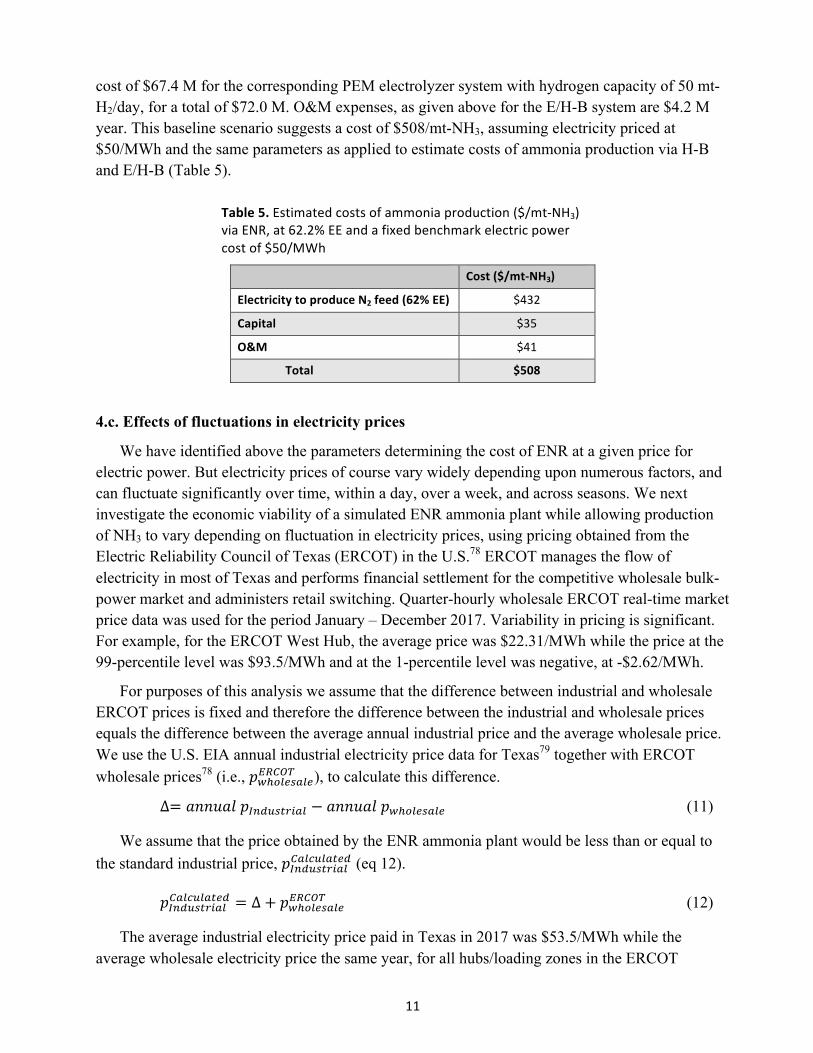
cost of $67.4 M for the corresponding PEM electrolyzer system with hydrogen capacity of 50 mt-H2/day, for a total of $72.0 M. O&M expenses, as given above for the E/H-B system are $4.2 M year. This baseline scenario suggests a cost of $508/mt-NH3, assuming electricity priced at $50/MWh and the same parameters as applied to estimate costs of ammonia production via H-B and E/H-B (Table 5).
Table 5. Estimated costs of ammonia production ($/mt-‐NH3) via ENR, at 62.2% EE and a fixed benchmark electric power cost of $50/MWh
Cost ($/mt-‐NH3)
Electricity to produce N2 feed (62% EE) $432
Capital $35
O&M $41
Total $508
4.c. Effects of fluctuations in electricity prices
We have identified above the parameters determining the cost of ENR at a given price for electric power. But electricity prices of course vary widely depending upon numerous factors, and can fluctuate significantly over time, within a day, over a week, and across seasons. We next investigate the economic viability of a simulated ENR ammonia plant while allowing production of NH3 to vary depending on fluctuation in electricity prices, using pricing obtained from the Electric Reliability Council of Texas (ERCOT) in the U.S.78 ERCOT manages the flow of electricity in most of Texas and performs financial settlement for the competitive wholesale bulk-power market and administers retail switching. Quarter-hourly wholesale ERCOT real-time market price data was used for the period January – December 2017. Variability in pricing is significant. For example, for the ERCOT West Hub, the average price was $22.31/MWh while the price at the 99-percentile level was $93.5/MWh and at the 1-percentile level was negative, at -$2.62/MWh.
For purposes of this analysis we assume that the difference between industrial and wholesale ERCOT prices is fixed and therefore the difference between the industrial and wholesale prices equals the difference between the average annual industrial price and the average wholesale price. We use the U.S. EIA annual industrial electricity price data for Texas79 together with ERCOT wholesale prices78 (i.e., 𝑝!!!"#$%"#!"!"# ), to calculate this difference.
∆= 𝑎𝑛𝑛𝑢𝑎𝑙 𝑝!"#$%&'()* − 𝑎𝑛𝑛𝑢𝑎𝑙 𝑝!!!"#$%"# (11)
We assume that the price obtained by the ENR ammonia plant would be less than or equal to the standard industrial price, 𝑝!"#$%&'()*!"#$%#"&'( (eq 12).
𝑝!"#$%&'()*!"#$%#"&'( = ∆+ 𝑝!!!"#$%"#!"#$% (12)
The average industrial electricity price paid in Texas in 2017 was $53.5/MWh while the average wholesale electricity price the same year, for all hubs/loading zones in the ERCOT
12
system, was $25.4/MWh. Thus, the average value of ∆ is approximately $30/MWh. We will consider this value, but we will also consider the likelihood that an ammonia plant, due to large scale, and especially by choosing a favorable location, might obtain a significantly more favorable price for delivery of electric power.
Based on quarter-hourly rates and Δ we calculate the annual cost of ammonia production by an ENR plant, assuming that production is discontinued when electricity costs rise above various values (“cut-offs”). These values correspond to various pricing percentiles; selected percentiles are shown in Table 6. The total cost per mt-NH3, including electricity, capital, and O&M, is calculated according to eq 13.
total cost/mt-NH3 = 5.37 MWh(PEcut + Δ)/EE + FC/OT (13)
• PEcut: average price paid for electrical energy (per MWh) for operation times (i.e. when price per MWh is below the given cut-off)
• FC: Fixed annual costs (capital cost plus O&M) divided by 24/7 capacity in mt-NH3/year • OT: Operating time as a fraction of full time (equal to the percentile value corresponding to the cut-
off price)
Lower price cut-offs will of course correspond to lower electricity costs per unit ammonia production, but fixed costs (capital and operating) will then be greater when calculated on a per-ton basis. Here we consider the lowest possible total cost per ton at which ammonia can be produced (including capital and O&M costs), at various assumed levels of EE, Δ, and fixed costs. This would allow a potential investor to determine if a plant could be profitable in the scenario of a given distribution of electrical pricing and a given ammonia price. Once the plant is operational, however, under this very simple model scenario, the plant would in principle produce ammonia whenever the cost of electricity (the marginal production cost) is less than the price for which the ammonia could be sold, allowing it to further maximize profit accordingly.
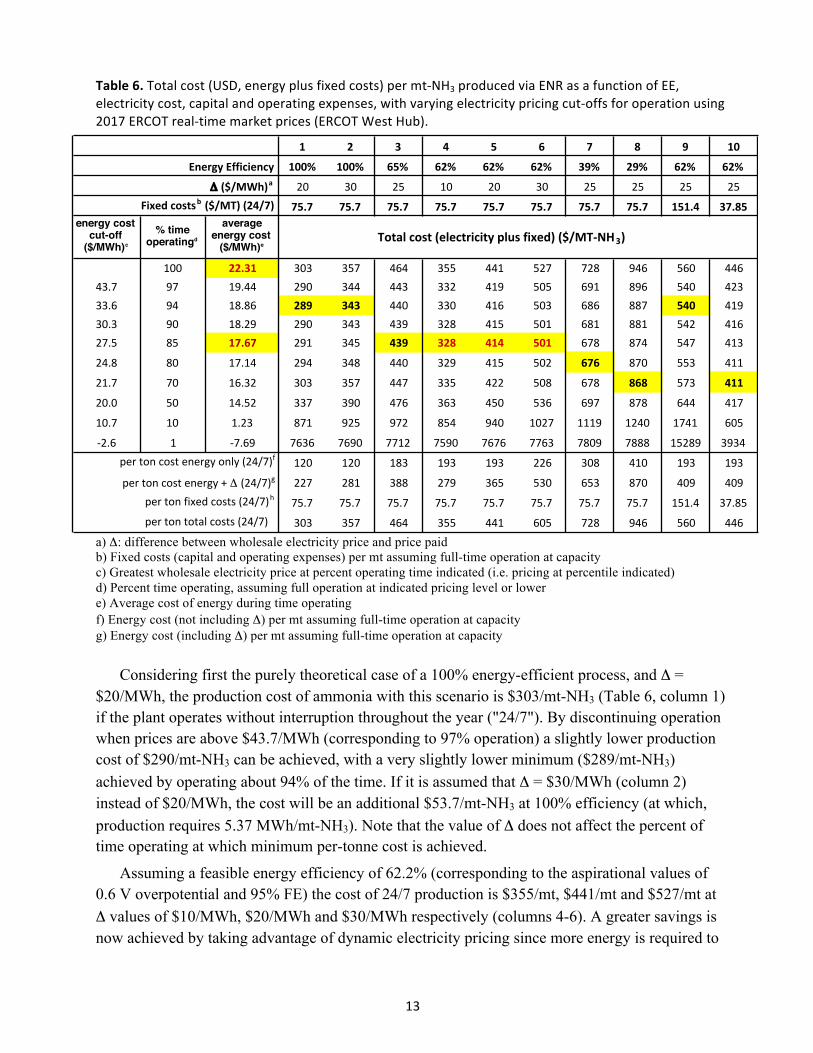
Assuming the various levels of energy efficiency given in Table 4, and various values of Δ, we calculate the annual per-ton cost of ammonia production at various electricity price cut-offs, each corresponding to a certain percentage (OT) of continuous operation. Values obtained using pricing from the ERCOT West Hub, which has the lowest average power cost of ERCOT hubs or loading zones, are shown in Table 6. The minimum per-mt-NH3 production cost for each set of conditions is highlighted, and the minima for the aspirational 62.2% energy efficiency are shown in red.
13
Table 6. Total cost (USD, energy plus fixed costs) per mt-‐NH3 produced via ENR as a function of EE, electricity cost, capital and operating expenses, with varying electricity pricing cut-‐offs for operation using 2017 ERCOT real-‐time market prices (ERCOT West Hub).
1 2 3 4 5 6 7 8 9 10
Energy1Efficiency 100% 100% 65% 62% 62% 62% 39% 29% 62% 62%
Δ1($/MWh)a 20 30 25 10 20 30 25 25 25 25Fixed1costsb1($/MT)1(24/7) 75.7 75.7 75.7 75.7 75.7 75.7 75.7 75.7 151.4 37.85
energy cost cut-off
($/MWh)c
% time operatingd
average energy cost
($/MWh)eTotal1cost1(electricity1plus1fixed)1($/MTJNH3)
100 22.31 303 357 464 355 441 527 728 946 560 44643.7 97 19.44 290 344 443 332 419 505 691 896 540 42333.6 94 18.86 289 343 440 330 416 503 686 887 540 41930.3 90 18.29 290 343 439 328 415 501 681 881 542 41627.5 85 17.67 291 345 439 328 414 501 678 874 547 413
24.8 80 17.14 294 348 440 329 415 502 676 870 553 411
21.7 70 16.32 303 357 447 335 422 508 678 868 573 411
20.0 50 14.52 337 390 476 363 450 536 697 878 644 417
10.7 10 1.23 871 925 972 854 940 1027 1119 1240 1741 605
,2.6 1 ,7.69 7636 7690 7712 7590 7676 7763 7809 7888 15289 3934per0ton0cost0energy0only0(24/7)f 120 120 183 193 193 226 308 410 193 193
per0ton0cost0energy0+0Δ0(24/7)g 227 281 388 279 365 530 653 870 409 409per0ton0fixed0costs0(24/7)h 75.7 75.7 75.7 75.7 75.7 75.7 75.7 75.7 151.4 37.85per0ton0total0costs0(24/7)0. 303 357 464 355 441 605 728 946 560 446
a) Δ: difference between wholesale electricity price and price paid b) Fixed costs (capital and operating expenses) per mt assuming full-time operation at capacity c) Greatest wholesale electricity price at percent operating time indicated (i.e. pricing at percentile indicated) d) Percent time operating, assuming full operation at indicated pricing level or lower e) Average cost of energy during time operating f) Energy cost (not including Δ) per mt assuming full-time operation at capacity g) Energy cost (including Δ) per mt assuming full-time operation at capacity
Considering first the purely theoretical case of a 100% energy-efficient process, and Δ = $20/MWh, the production cost of ammonia with this scenario is $303/mt-NH3 (Table 6, column 1) if the plant operates without interruption throughout the year ("24/7"). By discontinuing operation when prices are above $43.7/MWh (corresponding to 97% operation) a slightly lower production cost of $290/mt-NH3 can be achieved, with a very slightly lower minimum ($289/mt-NH3) achieved by operating about 94% of the time. If it is assumed that Δ = $30/MWh (column 2) instead of $20/MWh, the cost will be an additional $53.7/mt-NH3 at 100% efficiency (at which, production requires 5.37 MWh/mt-NH3). Note that the value of Δ does not affect the percent of time operating at which minimum per-tonne cost is achieved.
Assuming a feasible energy efficiency of 62.2% (corresponding to the aspirational values of 0.6 V overpotential and 95% FE) the cost of 24/7 production is $355/mt, $441/mt and $527/mt at Δ values of $10/MWh, $20/MWh and $30/MWh respectively (columns 4-6). A greater savings is now achieved by taking advantage of dynamic electricity pricing since more energy is required to
14
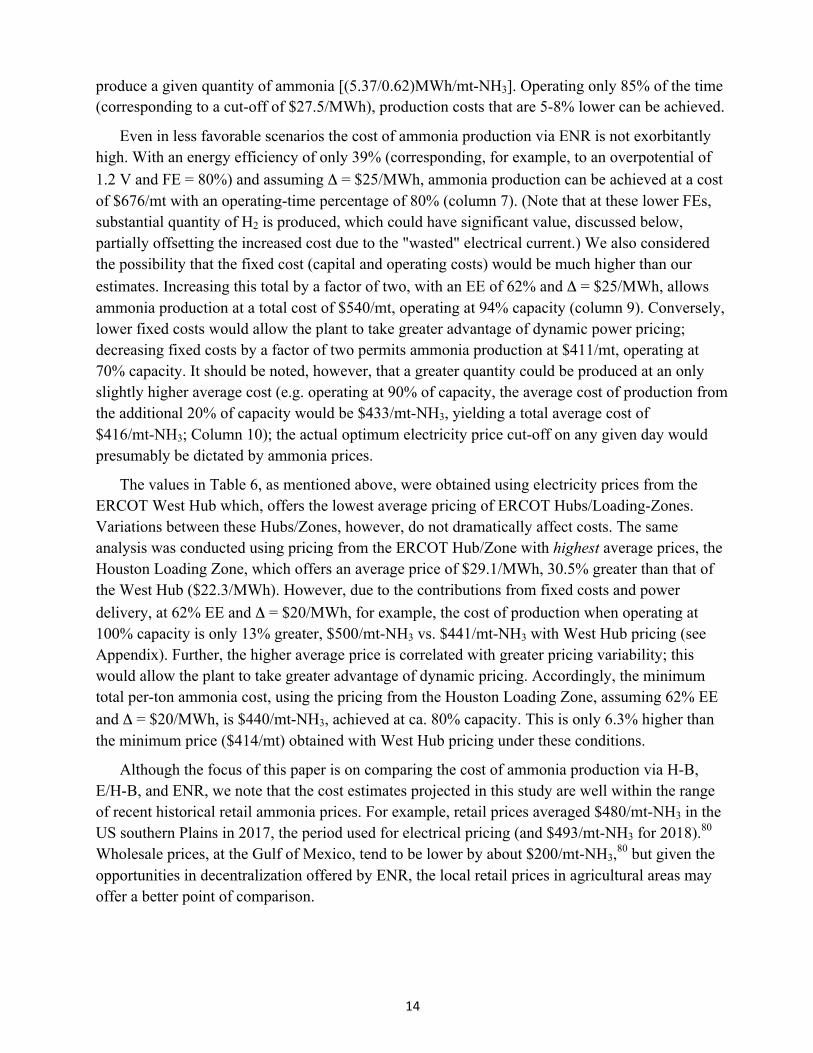
produce a given quantity of ammonia [(5.37/0.62)MWh/mt-NH3]. Operating only 85% of the time (corresponding to a cut-off of $27.5/MWh), production costs that are 5-8% lower can be achieved.
Even in less favorable scenarios the cost of ammonia production via ENR is not exorbitantly high. With an energy efficiency of only 39% (corresponding, for example, to an overpotential of 1.2 V and FE = 80%) and assuming Δ = $25/MWh, ammonia production can be achieved at a cost of $676/mt with an operating-time percentage of 80% (column 7). (Note that at these lower FEs, substantial quantity of H2 is produced, which could have significant value, discussed below, partially offsetting the increased cost due to the "wasted" electrical current.) We also considered the possibility that the fixed cost (capital and operating costs) would be much higher than our estimates. Increasing this total by a factor of two, with an EE of 62% and Δ = $25/MWh, allows ammonia production at a total cost of $540/mt, operating at 94% capacity (column 9). Conversely, lower fixed costs would allow the plant to take greater advantage of dynamic power pricing; decreasing fixed costs by a factor of two permits ammonia production at $411/mt, operating at 70% capacity. It should be noted, however, that a greater quantity could be produced at an only slightly higher average cost (e.g. operating at 90% of capacity, the average cost of production from the additional 20% of capacity would be $433/mt-NH3, yielding a total average cost of $416/mt-NH3; Column 10); the actual optimum electricity price cut-off on any given day would presumably be dictated by ammonia prices.
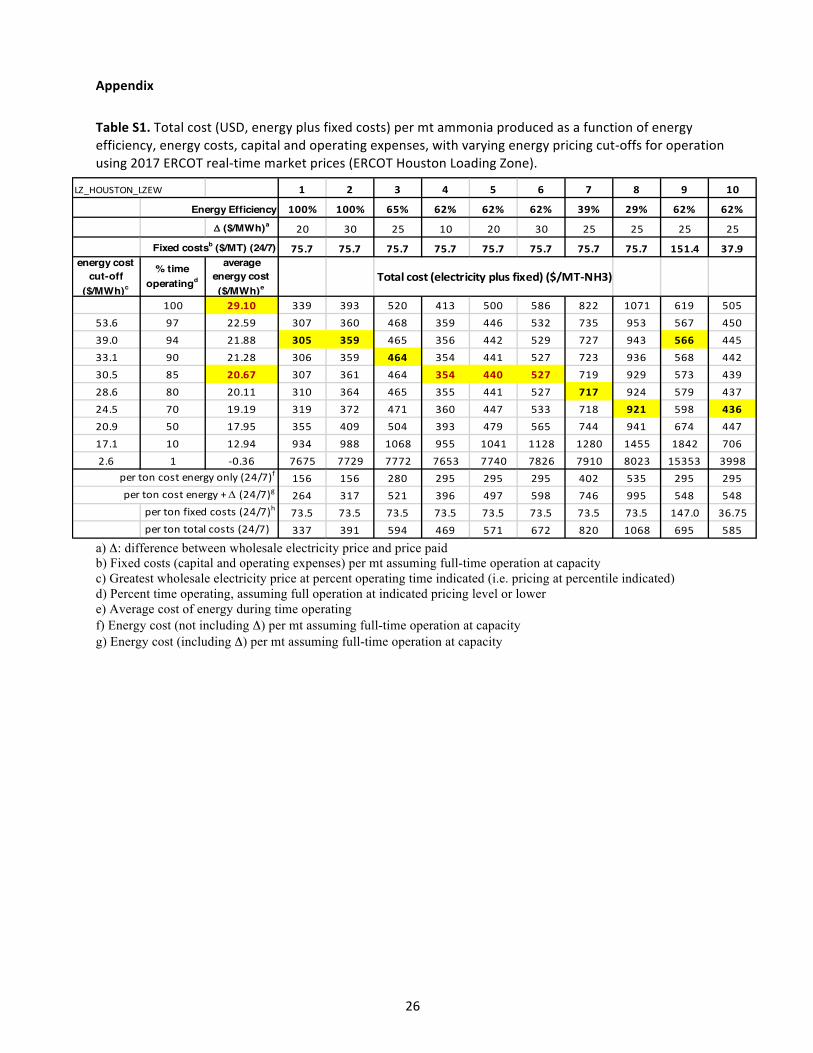
The values in Table 6, as mentioned above, were obtained using electricity prices from the ERCOT West Hub which, offers the lowest average pricing of ERCOT Hubs/Loading-Zones. Variations between these Hubs/Zones, however, do not dramatically affect costs. The same analysis was conducted using pricing from the ERCOT Hub/Zone with highest average prices, the Houston Loading Zone, which offers an average price of $29.1/MWh, 30.5% greater than that of the West Hub ($22.3/MWh). However, due to the contributions from fixed costs and power delivery, at 62% EE and Δ = $20/MWh, for example, the cost of production when operating at 100% capacity is only 13% greater, $500/mt-NH3 vs. $441/mt-NH3 with West Hub pricing (see Appendix). Further, the higher average price is correlated with greater pricing variability; this would allow the plant to take greater advantage of dynamic pricing. Accordingly, the minimum total per-ton ammonia cost, using the pricing from the Houston Loading Zone, assuming 62% EE and Δ = $20/MWh, is $440/mt-NH3, achieved at ca. 80% capacity. This is only 6.3% higher than the minimum price ($414/mt) obtained with West Hub pricing under these conditions.
Although the focus of this paper is on comparing the cost of ammonia production via H-B, E/H-B, and ENR, we note that the cost estimates projected in this study are well within the range of recent historical retail ammonia prices. For example, retail prices averaged $480/mt-NH3 in the US southern Plains in 2017, the period used for electrical pricing (and $493/mt-NH3 for 2018).80 Wholesale prices, at the Gulf of Mexico, tend to be lower by about $200/mt-NH3,80 but given the opportunities in decentralization offered by ENR, the local retail prices in agricultural areas may offer a better point of comparison.
15
4.d. Comparison of ENR and E/H-B economics.
A comparison of Tables 3 and 5 reveals the differences in ammonia production costs between ENR and E/H-B assuming a fixed electricity price of $50/MWh.
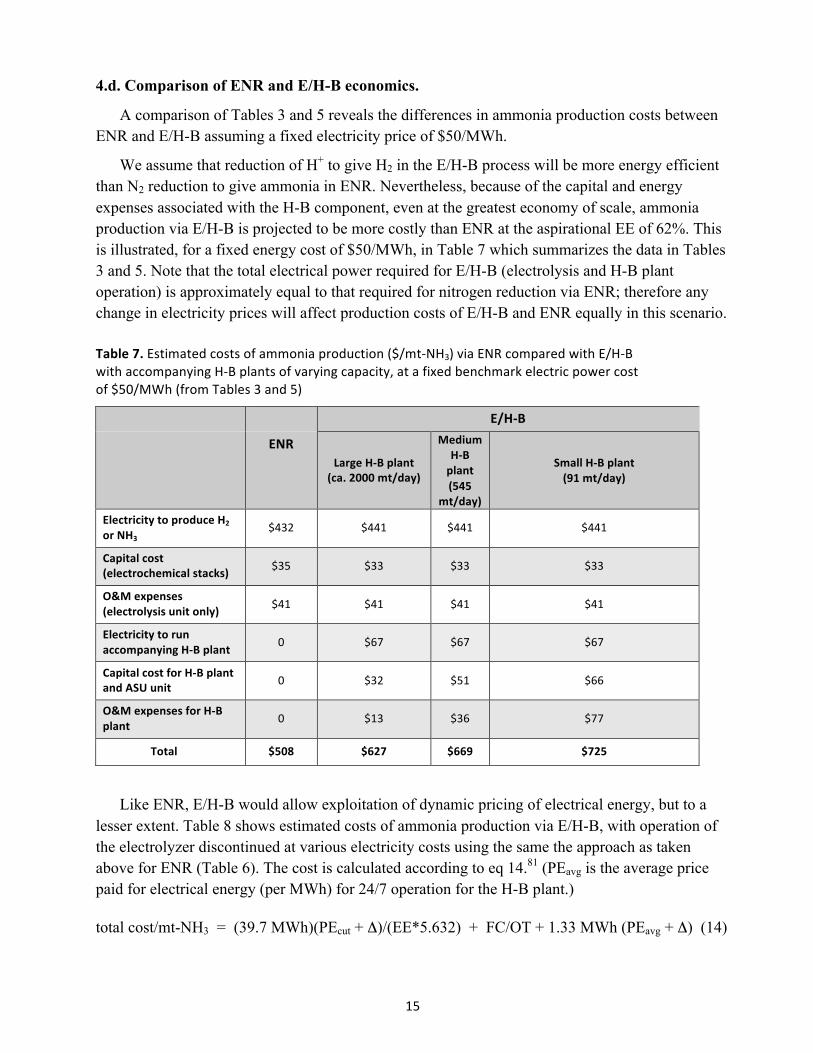
We assume that reduction of H+ to give H2 in the E/H-B process will be more energy efficient than N2 reduction to give ammonia in ENR. Nevertheless, because of the capital and energy expenses associated with the H-B component, even at the greatest economy of scale, ammonia production via E/H-B is projected to be more costly than ENR at the aspirational EE of 62%. This is illustrated, for a fixed energy cost of $50/MWh, in Table 7 which summarizes the data in Tables 3 and 5. Note that the total electrical power required for E/H-B (electrolysis and H-B plant operation) is approximately equal to that required for nitrogen reduction via ENR; therefore any change in electricity prices will affect production costs of E/H-B and ENR equally in this scenario.
Table 7. Estimated costs of ammonia production ($/mt-‐NH3) via ENR compared with E/H-‐B with accompanying H-‐B plants of varying capacity, at a fixed benchmark electric power cost of $50/MWh (from Tables 3 and 5)
E/H-‐B
ENR Large H-‐B plant
(ca. 2000 mt/day)
Medium H-‐B plant (545
mt/day)
Small H-‐B plant (91 mt/day)
Electricity to produce H2 or NH3
$432 $441 $441 $441
Capital cost (electrochemical stacks) $35 $33 $33 $33
O&M expenses (electrolysis unit only) $41 $41 $41 $41
Electricity to run accompanying H-‐B plant 0 $67 $67 $67
Capital cost for H-‐B plant and ASU unit 0 $32 $51 $66
O&M expenses for H-‐B plant 0 $13 $36 $77
Total $508 $627 $669 $725
Like ENR, E/H-B would allow exploitation of dynamic pricing of electrical energy, but to a lesser extent. Table 8 shows estimated costs of ammonia production via E/H-B, with operation of the electrolyzer discontinued at various electricity costs using the same the approach as taken above for ENR (Table 6). The cost is calculated according to eq 14.81 (PEavg is the average price paid for electrical energy (per MWh) for 24/7 operation for the H-B plant.)
total cost/mt-NH3 = (39.7 MWh)(PEcut + Δ)/(EE*5.632) + FC/OT + 1.33 MWh (PEavg + Δ) (14)
16
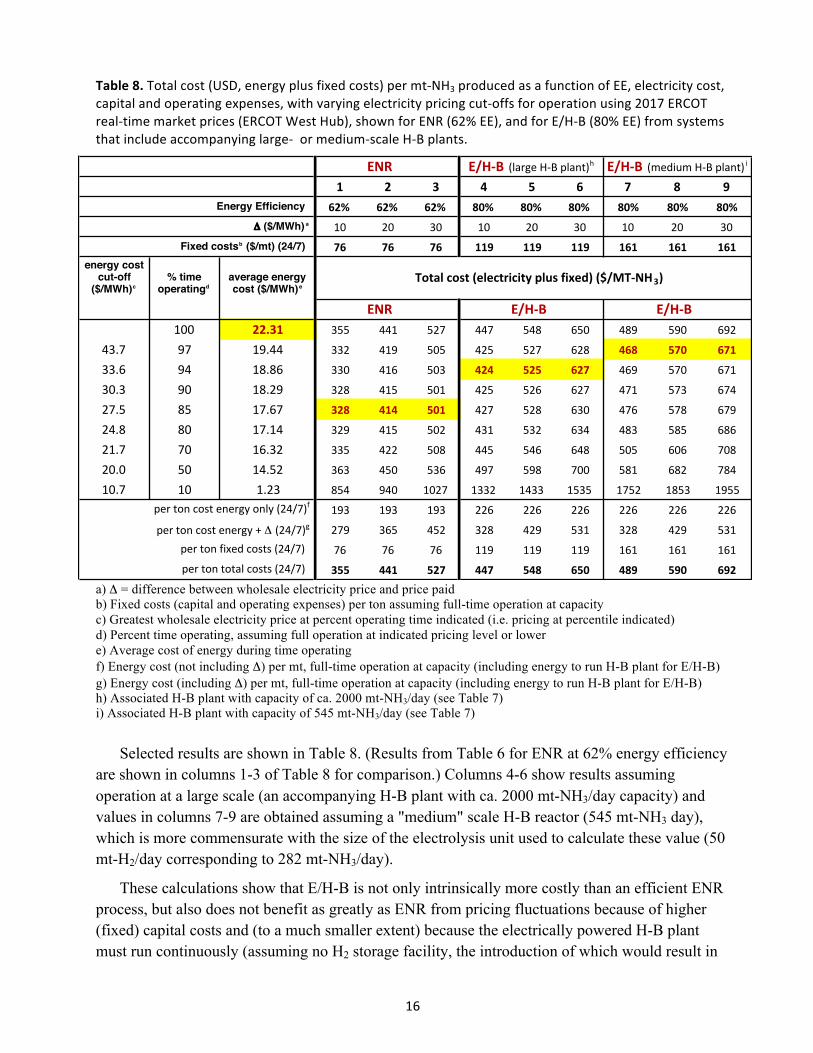
Table 8. Total cost (USD, energy plus fixed costs) per mt-‐NH3 produced as a function of EE, electricity cost, capital and operating expenses, with varying electricity pricing cut-‐offs for operation using 2017 ERCOT real-‐time market prices (ERCOT West Hub), shown for ENR (62% EE), and for E/H-‐B (80% EE) from systems that include accompanying large-‐ or medium-‐scale H-‐B plants.
ENR E/H-B(largeH-Bplant)h E/H-B(mediumH-Bplant) i
1 2 3 4 5 6 7 8 9
Energy Efficiency . 62% 62% 62% 80% 80% 80% 80% 80% 80%
Δ ($/MWh) a . 10 20 30 10 20 30 10 20 30Fixed costsb ($/mt) (24/7) . 76 76 76 119 119 119 161 161 161
energy cost cut-off
($/MWh)c% time
operatingdaverage energy cost ($/MWh)e
Totalcost(electricityplusfixed)($/MT-NH3)
ENR E/H-B E/H-B
100 22.31 355 441 527 447 548 650 489 590 692
43.7 97 19.44 332 419 505 425 527 628 468 570 671
33.6 94 18.86 330 416 503 424 525 627 469 570 671
30.3 90 18.29 328 415 501 425 526 627 471 573 674
27.5 85 17.67 328 414 501 427 528 630 476 578 679
24.8 80 17.14 329 415 502 431 532 634 483 585 686
21.7 70 16.32 335 422 508 445 546 648 505 606 708
20.0 50 14.52 363 450 536 497 598 700 581 682 784
10.7 10 1.23 854 940 1027 1332 1433 1535 1752 1853 1955pertoncostenergyonly(24/7)f. 193 193 193 226 226 226 226 226 226
pertoncostenergy+Δ(24/7)g. 279 365 452 328 429 531 328 429 531pertonfixedcosts(24/7). 76 76 76 119 119 119 161 161 161pertontotalcosts(24/7). 355 441 527 447 548 650 489 590 692
a) Δ = difference between wholesale electricity price and price paid b) Fixed costs (capital and operating expenses) per ton assuming full-time operation at capacity c) Greatest wholesale electricity price at percent operating time indicated (i.e. pricing at percentile indicated) d) Percent time operating, assuming full operation at indicated pricing level or lower e) Average cost of energy during time operating f) Energy cost (not including Δ) per mt, full-time operation at capacity (including energy to run H-B plant for E/H-B) g) Energy cost (including Δ) per mt, full-time operation at capacity (including energy to run H-B plant for E/H-B) h) Associated H-B plant with capacity of ca. 2000 mt-NH3/day (see Table 7) i) Associated H-B plant with capacity of 545 mt-NH3/day (see Table 7)
Selected results are shown in Table 8. (Results from Table 6 for ENR at 62% energy efficiency are shown in columns 1-3 of Table 8 for comparison.) Columns 4-6 show results assuming operation at a large scale (an accompanying H-B plant with ca. 2000 mt-NH3/day capacity) and values in columns 7-9 are obtained assuming a "medium" scale H-B reactor (545 mt-NH3 day), which is more commensurate with the size of the electrolysis unit used to calculate these value (50 mt-H2/day corresponding to 282 mt-NH3/day).
These calculations show that E/H-B is not only intrinsically more costly than an efficient ENR process, but also does not benefit as greatly as ENR from pricing fluctuations because of higher (fixed) capital costs and (to a much smaller extent) because the electrically powered H-B plant must run continuously (assuming no H2 storage facility, the introduction of which would result in
17
higher capital/fixed costs), regardless of electricity prices.82 Moreover, we note that the conclusion that E/H-B is not as potentially economical as ENR is reached in spite of two simplifying assumptions we have made that favor the assessment of E/H-B: (i) a 100% yield of NH3 from the synthesis process and (ii) the assumption that the smaller H-B plants operate with the same energy efficiency as the largest plants.
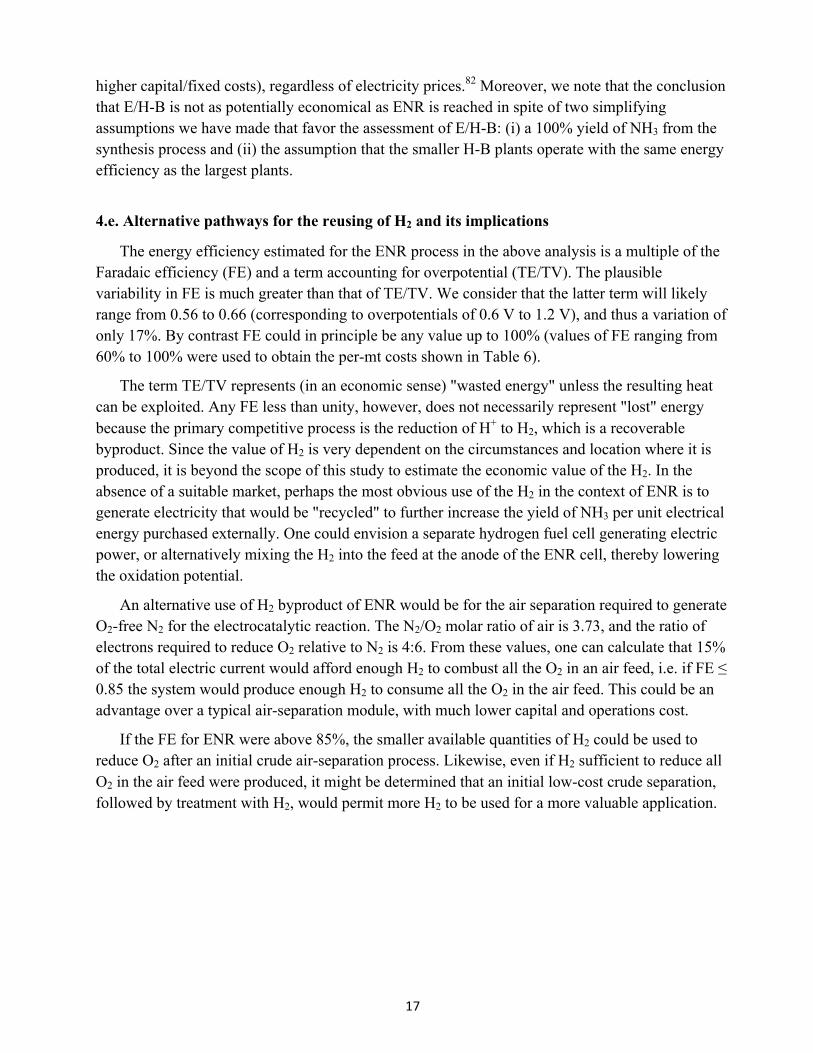
4.e. Alternative pathways for the reusing of H2 and its implications
The energy efficiency estimated for the ENR process in the above analysis is a multiple of the Faradaic efficiency (FE) and a term accounting for overpotential (TE/TV). The plausible variability in FE is much greater than that of TE/TV. We consider that the latter term will likely range from 0.56 to 0.66 (corresponding to overpotentials of 0.6 V to 1.2 V), and thus a variation of only 17%. By contrast FE could in principle be any value up to 100% (values of FE ranging from 60% to 100% were used to obtain the per-mt costs shown in Table 6).
The term TE/TV represents (in an economic sense) "wasted energy" unless the resulting heat can be exploited. Any FE less than unity, however, does not necessarily represent "lost" energy because the primary competitive process is the reduction of H+ to H2, which is a recoverable byproduct. Since the value of H2 is very dependent on the circumstances and location where it is produced, it is beyond the scope of this study to estimate the economic value of the H2. In the absence of a suitable market, perhaps the most obvious use of the H2 in the context of ENR is to generate electricity that would be "recycled" to further increase the yield of NH3 per unit electrical energy purchased externally. One could envision a separate hydrogen fuel cell generating electric power, or alternatively mixing the H2 into the feed at the anode of the ENR cell, thereby lowering the oxidation potential.
An alternative use of H2 byproduct of ENR would be for the air separation required to generate O2-free N2 for the electrocatalytic reaction. The N2/O2 molar ratio of air is 3.73, and the ratio of electrons required to reduce O2 relative to N2 is 4:6. From these values, one can calculate that 15% of the total electric current would afford enough H2 to combust all the O2 in an air feed, i.e. if FE ≤ 0.85 the system would produce enough H2 to consume all the O2 in the air feed. This could be an advantage over a typical air-separation module, with much lower capital and operations cost.
If the FE for ENR were above 85%, the smaller available quantities of H2 could be used to reduce O2 after an initial crude air-separation process. Likewise, even if H2 sufficient to reduce all O2 in the air feed were produced, it might be determined that an initial low-cost crude separation, followed by treatment with H2, would permit more H2 to be used for a more valuable application.

18
4.f. Comparison of economics of ENR with fossil-fuel-based H-B
The projected costs for ammonia production by ENR shown in Table 6 (as well as those for E/H-B in Table 8) are based on prices for electrical power that is obtained in part from renewable sources, but primarily from fossil fuels. The primary energy mix for ERCOT in 2017 consisted of natural gas (39%), coal (32%), wind (17%), and nuclear (11%).83-84
The high capital cost of a H-B plant notwithstanding, if the source of electrical power for ENR (or any other electrochemical process) is primarily natural gas, the cost of such ammonia production will presumably always be greater than that of large-scale natural-gas-based H-B production. The energy loss involved in the overall ENR process in generating electricity from natural gas, and then in using that electrical power to reduce N2, will presumably outweigh both capital costs and energy loss of a modern H-B plant. This is reflected in the estimated production costs for ENR and H-B for the same time period (and thus at the same price of natural gas); ENR production costs, using ERCOT pricing and taking advantage of fluctuating prices (Table 6), are estimated to be at least $150 per mt-NH3 above H-B costs in the case of a large-scale H-B plant (Table 2).
The low cost, to the producer, of ammonia via natural-gas-based H-B notwithstanding, this process has major implications for global greenhouse gas (GHG) emissions (section 2).85 As noted above, production based on natural gas feedstock results in at least 1.33 mt-CO2 produced per mt-NH3. Including the cost of this negative externality yields a significant increase in the total (social and private) cost of ammonia produced via a natural-gas-based H-B process relative to production via ENR based on carbon-free electricity. The magnitude of this effect of course depends on the social cost of carbon, estimates of which vary greatly. A detailed survey by Pindyck yields a mean value of $174/mt-CO2 based on responses from economists, and $316/mt-CO2 based on responses from climate scientists (corresponding to $231/mt-NH3 and $421/mt-NH3, respectively) with an overall value of $291/mt-CO2 ($387/mt-NH3) based on responses from all experts surveyed.86 Ricke et al. in a recent extensive study determined the median estimated social cost to be $417/mt-CO2 ($555/mt-NH3), with $177-$805 ($235-$1070/mt-NH3) representing 66% confidence intervals.87 Additionally, natural gas use is associated with methane emissions (primarily from natural gas extraction). Emissions of methane associated with H-B ammonia production equal 0.35% of CO2 emissions, and the 100-year Global Warming Potential of methane is 28 times that of CO2;88 thus associated methane emissions may be considered to have an additional social cost equal to 10% that of the CO2 emissions.
ENR would therefore become increasingly cost competitive with H-B as the externalities of CO2 emissions are incorporated (directly or indirectly) into the cost of ammonia produced from natural gas. This may occur most directly in the form of a carbon tax or a cap-and-trade system. Alternatively, renewably produced ammonia could be favored by subsidies or other measures commensurate with the value of avoided CO2 emissions. More extreme measures are also possible such as legislation requiring a carbon-free or low-carbon economy; the state of New York, for example, has recently passed a legal resolution to achieve the former goal by 2050.89
19
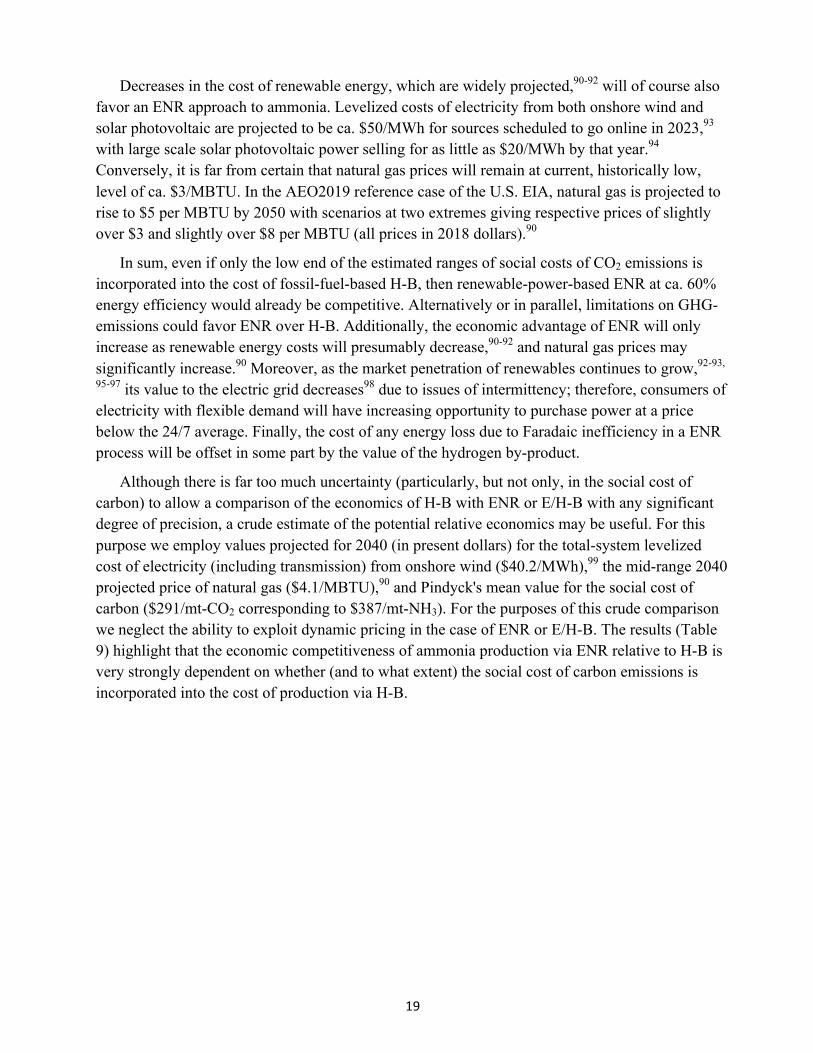
Decreases in the cost of renewable energy, which are widely projected,90-92 will of course also favor an ENR approach to ammonia. Levelized costs of electricity from both onshore wind and solar photovoltaic are projected to be ca. $50/MWh for sources scheduled to go online in 2023,93 with large scale solar photovoltaic power selling for as little as $20/MWh by that year.94 Conversely, it is far from certain that natural gas prices will remain at current, historically low, level of ca. $3/MBTU. In the AEO2019 reference case of the U.S. EIA, natural gas is projected to rise to $5 per MBTU by 2050 with scenarios at two extremes giving respective prices of slightly over $3 and slightly over $8 per MBTU (all prices in 2018 dollars).90
In sum, even if only the low end of the estimated ranges of social costs of CO2 emissions is incorporated into the cost of fossil-fuel-based H-B, then renewable-power-based ENR at ca. 60% energy efficiency would already be competitive. Alternatively or in parallel, limitations on GHG-emissions could favor ENR over H-B. Additionally, the economic advantage of ENR will only increase as renewable energy costs will presumably decrease,90-92 and natural gas prices may significantly increase.90 Moreover, as the market penetration of renewables continues to grow,92-93,
95-97 its value to the electric grid decreases98 due to issues of intermittency; therefore, consumers of electricity with flexible demand will have increasing opportunity to purchase power at a price below the 24/7 average. Finally, the cost of any energy loss due to Faradaic inefficiency in a ENR process will be offset in some part by the value of the hydrogen by-product.
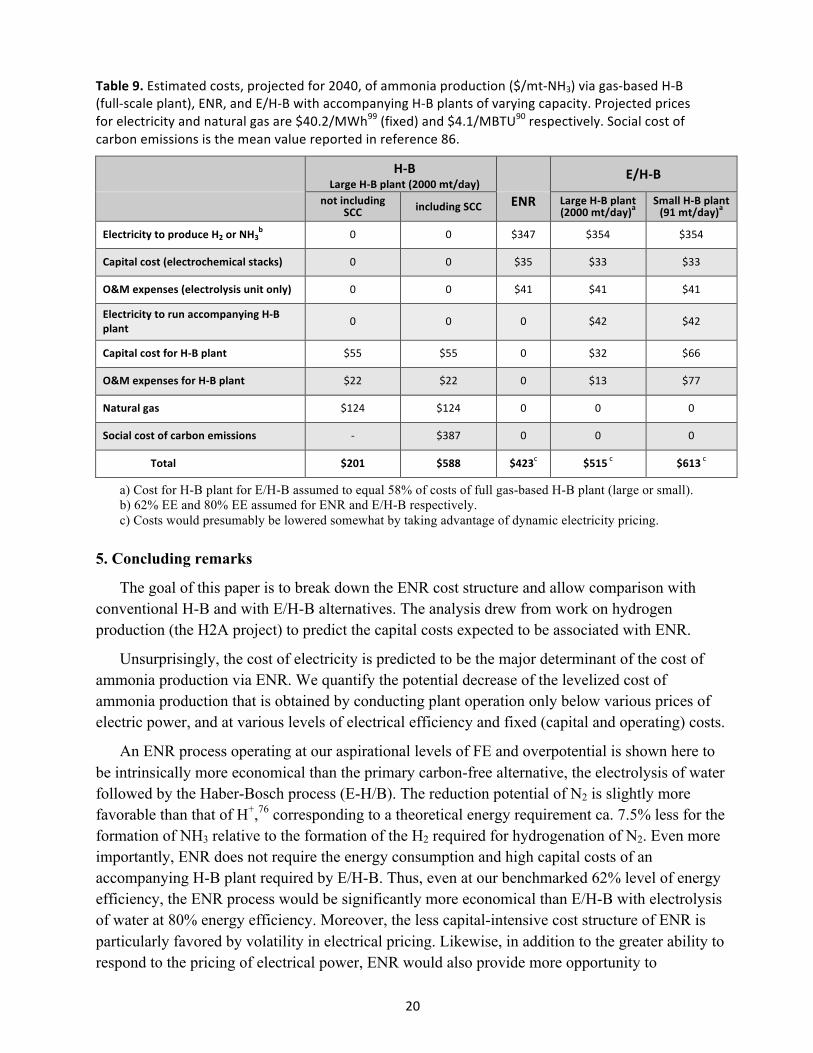
Although there is far too much uncertainty (particularly, but not only, in the social cost of carbon) to allow a comparison of the economics of H-B with ENR or E/H-B with any significant degree of precision, a crude estimate of the potential relative economics may be useful. For this purpose we employ values projected for 2040 (in present dollars) for the total-system levelized cost of electricity (including transmission) from onshore wind ($40.2/MWh),99 the mid-range 2040 projected price of natural gas ($4.1/MBTU),90 and Pindyck's mean value for the social cost of carbon ($291/mt-CO2 corresponding to $387/mt-NH3). For the purposes of this crude comparison we neglect the ability to exploit dynamic pricing in the case of ENR or E/H-B. The results (Table 9) highlight that the economic competitiveness of ammonia production via ENR relative to H-B is very strongly dependent on whether (and to what extent) the social cost of carbon emissions is incorporated into the cost of production via H-B.
20
Table 9. Estimated costs, projected for 2040, of ammonia production ($/mt-‐NH3) via gas-‐based H-‐B (full-‐scale plant), ENR, and E/H-‐B with accompanying H-‐B plants of varying capacity. Projected prices for electricity and natural gas are $40.2/MWh99 (fixed) and $4.1/MBTU90 respectively. Social cost of carbon emissions is the mean value reported in reference 86.
H-‐B Large H-‐B plant (2000 mt/day)
E/H-‐B
not including SCC including SCC ENR Large H-‐B plant
(2000 mt/day)a Small H-‐B plant (91 mt/day)a
Electricity to produce H2 or NH3b 0 0 $347 $354 $354
Capital cost (electrochemical stacks) 0 0 $35 $33 $33
O&M expenses (electrolysis unit only) 0 0 $41 $41 $41
Electricity to run accompanying H-‐B plant 0 0 0 $42 $42
Capital cost for H-‐B plant $55 $55 0 $32 $66
O&M expenses for H-‐B plant $22 $22 0 $13 $77
Natural gas $124 $124 0 0 0
Social cost of carbon emissions -‐ $387 0 0 0
Total $201 $588 $423c $515 c $613 c
a) Cost for H-B plant for E/H-B assumed to equal 58% of costs of full gas-based H-B plant (large or small). b) 62% EE and 80% EE assumed for ENR and E/H-B respectively. c) Costs would presumably be lowered somewhat by taking advantage of dynamic electricity pricing.
5. Concluding remarks
The goal of this paper is to break down the ENR cost structure and allow comparison with conventional H-B and with E/H-B alternatives. The analysis drew from work on hydrogen production (the H2A project) to predict the capital costs expected to be associated with ENR.
Unsurprisingly, the cost of electricity is predicted to be the major determinant of the cost of ammonia production via ENR. We quantify the potential decrease of the levelized cost of ammonia production that is obtained by conducting plant operation only below various prices of electric power, and at various levels of electrical efficiency and fixed (capital and operating) costs.
An ENR process operating at our aspirational levels of FE and overpotential is shown here to be intrinsically more economical than the primary carbon-free alternative, the electrolysis of water followed by the Haber-Bosch process (E-H/B). The reduction potential of N2 is slightly more favorable than that of H+,76 corresponding to a theoretical energy requirement ca. 7.5% less for the formation of NH3 relative to the formation of the H2 required for hydrogenation of N2. Even more importantly, ENR does not require the energy consumption and high capital costs of an accompanying H-B plant required by E/H-B. Thus, even at our benchmarked 62% level of energy efficiency, the ENR process would be significantly more economical than E/H-B with electrolysis of water at 80% energy efficiency. Moreover, the less capital-intensive cost structure of ENR is particularly favored by volatility in electrical pricing. Likewise, in addition to the greater ability to respond to the pricing of electrical power, ENR would also provide more opportunity to
21
discontinue and resume production according to fluctuations in ammonia pricing or demand. Lastly, removing the need for a H-B plant also allows a much greater degree of decentralization which potentially has benefits for farming even in areas that are well connected to infrastructure, and much more so for those that are not.
Nitrogen fixation is critical to the agricultural production necessary to feed humanity and is potentially of tremendous value for the storage, transportation, and consumption of renewable energy. But while the cost to the producer of conventional natural-gas-based H-B production is generally quite low, its combined social and private cost is very high if typical estimates of social costs of GHG emission are taken into account. These costs are expected to be increasingly reflected in taxes and/or regulations on emissions. In addition to the social cost of GHG emissions, the reliance on fossil fuels also results in vulnerability to volatility in global market prices and a complex intersection with the geo-political landscape.100 Conversely, as the cost of renewable (carbon-free) energy continues to decline, methods based on it for ammonia production become economically more attractive.
At this time, E/H-B is the only technology that is efficient enough to feasibly replace H-B on the scale necessary for fertilizer production. The results of this study, however, indicates that the development of a feasibly efficient ENR process is the more desirable solution to this long-term need. The potentially lower production cost via ENR may suggest that it is also the only process that could take practical advantage of the opportunities that nitrogen reduction offers for the storage and transportation of energy. It must be emphasized that the current state of ENR technology is still far from economically feasible for fertilizer production, and even less so for economically viable energy storage. Based on fundamental considerations illuminated in this work, however, we conclude that development of an efficient ENR technology is a goal with enormous potential reward.
References (1) Searchinger, T.; Hanson, C.; Ranganathan, J.; Lipinski, B.; Waite, R.; Winterbottom, R.; Dinshaw, A.; Heimlich, R., The great balancing act: installment 1 of creating a sustainable food future. World Resources Institute 2013. (2) "The future of food and agriculture – Trends and challenges." Food and Agriculture Organization of the United Nations (FAO). Rome, 2017 http://www.fao.org/3/a-i6583e.pdf (3) Smil, V., Nitrogen cycle and world food production. World Agriculture 2011, 2, 9-13. (4) Catalytic Ammonia Synthesis, Fundamentals and Practice; Jennings, J. R., Ed. Springer US: 1991. (5) Smil, V., Enriching the Earth: Fritz Haber, Carl Bosch, and the Transformation of World Food Production. MIT Press: Cambridge, MA, 2004. (6) Erisman, J. W.; Sutton, M. A.; Galloway, J.; Klimont, Z.; Winiwarter, W., How a century of ammonia synthesis changed the world Nat. Geosci. 2008, 1, 636-639. (7) Pattabathula, V.; Richardson, J., Introduction to Ammonia Production. CEP Magazine September, 2016, 2016. (8) "Ammonia Market 2018 Outlook to 2022" Reuters VCNewsNetwork, 5 September 2018 https://www.reuters.com/brandfeatures/venture-capital/article?id=49951 (retrieved June 30, 2019) (9) Morgan, E. R. Techno-Economic Feasibility Study of Ammonia Plants Powered by Offshore Wind. PhD, University of Massachusetts Amherst, Open Access Dissertations. 697, 2013. (10) Frattini, D.; Cinti, G.; Bidini, G.; Desideri, U.; Cioffi, R.; Jannelli, E., A system approach in energy evaluation of different renewable energies sources integration in ammonia production plants Renewable Energy 2016, 99, 472-482. (11) Noelker, K.; Ruether, J., Low Energy Consumption Ammonia Production: Baseline Energy Consumption, Options for Energy Optimization. In Nitrogen + Syngas Conference, Duesseldorf, 2011.
22
(12) Rafiqul, I.; Weber, C.; Lehmann, B.; Voss, A., Energy efficiency improvements in ammonia production—perspectives and uncertainties Energy 2005, 30, 2487-2504. (13) Tallaksen, J.; Bauer, F.; Hulteberg, C.; Reese, M.; Ahlgren, S., Nitrogen fertilizers manufactured using wind power: greenhouse gas and energy balance of community-scale ammonia production J. Clean. Prod. 2015, 107, 626-635. (14) Churchard, A. J.; Banach, E.; Borgschulte, A.; Caputo, R.; Chen, J.-C.; Clary, D.; Fijalkowski, K. J.; Geerlings, H.; Genova, R. V.; Grochala, W.; Jaroń, T.; Juanes-Marcos, J. C.; Kasemo, B.; Kroes, G.-J.; Ljubić, I.; Naujoks, N.; Nørskov, J. K.; Olsen, R. A.; Pendolino, F.; Remhof, A.; Románszki, L.; Tekin, A.; Vegge, T.; Zäch, M.; Züttel, A., A multifaceted approach to hydrogen storage Phys. Chem. Chem. Phys. 2011, 13, 16955-16972. (15) Aziz, M.; Oda, T.; Morihara, A.; Kashiwagi, T., Combined nitrogen production, ammonia synthesis, and power generation for efficient hydrogen storage Energy Procedia 2017, 143, 674-679. (16) Giddey, S.; Badwal, S. P. S.; Munnings, C.; Dolan, M., Ammonia as a Renewable Energy Transportation Media ACS Sustain. Chem. Eng. 2017, 5, 10231-10239. (17) Valera-Medina, A.; Xiao, H.; Owen-Jones, M.; David, W. I. F.; Bowen, P. J., Ammonia for power Progress in Energy and Combustion Science 2018, 69, 63-102. (18) Service, R. F., Liquid sunshine Science (Washington, DC, U. S.) 2018, 361, 120-123. (19) Yapicioglu, A.; Dincer, I., A review on clean ammonia as a potential fuel for power generators Renew. Sust. Energy Rev. 2019, 96-108. (20) Juangsa, F. B.; Aziz, M., Integrated system of thermochemical cycle of ammonia, nitrogen production, and power generation Int. J. Hydrog. Energy 2019, 44, 17525-17534. (21) Bicer, Y.; Dincer, I., Exergoeconomic analysis and optimization of a concentrated sunlight-driven integrated photoelectrochemical hydrogen and ammonia production system Int. J. Hydrog. Energy 2019, 44, 18875-18890. (22) Bargiacchi, E.; Antonelli, M.; Desideri, U., A comparative assessment of Power-to-Fuel production pathways Energy 2019, 183, 1253-1265. (23) Suryanto, B. H. R.; Du, H.-L.; Wang, D.; Chen, J.; Simonov, A. N.; MacFarlane, D. R., Challenges and prospects in the catalysis of electroreduction of nitrogen to ammonia Nat. Catal. 2019, 2, 290-296. (24) Foster, S. L.; Bakovic, S. I. P.; Duda, R. D.; Maheshwari, S.; Milton, R. D.; Minteer, S. D.; Janik, M. J.; Renner, J. N.; Greenlee, L. F., Catalysts for nitrogen reduction to ammonia Nat. Catal. 2018, 1, 490-500. (25) Chen, J. G.; Crooks, R. M.; Seefeldt, L. C.; Bren, K. L.; Bullock, R. M.; Darensbourg, M. Y.; Holland, P. L.; Hoffman, B.; Janik, M. J.; Jones, A. K.; Kanatzidis, M. G.; King, P.; Lancaster, K. M.; Lymar, S. V.; Pfromm, P.; Schneider, W. F.; Schrock, R. R., Beyond fossil fuel–driven nitrogen transformations Science 2018, 360, eaar6611. (26) Singh, A. R.; Rohr, B. A.; Schwalbe, J. A.; Cargnello, M.; Chan, K.; Jaramillo, T. F.; Chorkendorff, I.; Nørskov, J. K., Electrochemical Ammonia Synthesis—The Selectivity Challenge ACS Catal. 2017, 7, 706-709. (27) Montoya, J. H.; Tsai, C.; Vojvodic, A.; Nørskov, J. K., The Challenge of Electrochemical Ammonia Synthesis: A New Perspective on the Role of Nitrogen Scaling Relations ChemSusChem 2015, 8, 2180-2186. (28) Yang, D.; Chen, T.; Wang, Z., Electrochemical reduction of aqueous nitrogen (N2) at a low overpotential on (110)-oriented Mo nanofilm J. Mater. Chem. A 2017, 5, 18967-18971. (29) Zhang, L.; Ji, X.; Ren, X.; Ma, Y.; Shi, X.; Tian, Z.; Asiri, A. M.; Chen, L.; Tang, B.; Sun, X., Electrochemical Ammonia Synthesis via Nitrogen Reduction Reaction on a MoS2 Catalyst: Theoretical and Experimental Studies Adv. Mater. 2018, 30, 1800191. (30) Han, J.; Ji, X.; Ren, X.; Cui, G.; Li, L.; Xie, F.; Wang, H.; Li, B.; Sun, X., MoO3 nanosheets for efficient electrocatalytic N2 fixation to NH3 J. Mater. Chem. A 2018, 6, 12974-12977. (31) Ren, X.; Cui, G.; Chen, L.; Xie, F.; Wei, Q.; Tian, Z.; Sun, X., Electrochemical N2 fixation to NH3 under ambient conditions: Mo2N nanorod as a highly efficient and selective catalyst Chem. Commun. 2018, 54, 8474-8477. (32) Zhang, L.; Ji, X.; Ren, X.; Luo, Y.; Shi, X.; Asiri, A. M.; Zheng, B.; Sun, X., Efficient Electrochemical N2 Reduction to NH3 on MoN Nanosheets Array under Ambient Conditions ACS Sustain. Chem. Eng. 2018, 6, 9550-9554. (33) Suryanto, B. H. R.; Kang, C. S. M.; Wang, D.; Xiao, C.; Zhou, F.; Azofra, L. M.; Cavallo, L.; Zhang, X.; MacFarlane, D. R., Rational Electrode–Electrolyte Design for Efficient Ammonia Electrosynthesis under Ambient Conditions ACS Energy Lett. 2018, 3, 1219-1224. (34) Li, X.; Li, T.; Ma, Y.; Wei, Q.; Qiu, W.; Guo, H.; Shi, X.; Zhang, P.; Asiri, A. M.; Chen, L.; Tang, B.; Sun, X., Boosted Electrocatalytic N2 Reduction to NH3 by Defect-Rich MoS2 Nanoflower Adv. Energy Mater. 2018, 8, 1801357. (35) Lv, C.; Yan, C.; Chen, G.; Ding, Y.; Sun, J.; Zhou, Y.; Yu, G., An Amorphous Noble‐Metal‐Free Electrocatalyst that Enables Nitrogen Fixation under Ambient Conditions Angew. Chem., Intl. Ed. 2018, 6073-6076. (36) Shi, M.-M.; Bao, D.; Wulan, B.-R.; Li, Y.-H.; Zhang, Y.-F.; Yan, J.-M.; Jiang, Q., Au Sub-Nanoclusters on TiO2 toward Highly Efficient and Selective Electrocatalyst for N2 Conversion to NH3 at Ambient Conditions Adv. Mater. 2017, 29, 1606550.
23
(37) Li, S.-J.; Bao, D.; Shi, M.-M.; Wulan, B.-R.; Yan, J.-M.; Jiang, Q., Amorphizing of Au Nanoparticles by CeOx–RGO Hybrid Support towards Highly Efficient Electrocatalyst for N2 Reduction under Ambient Conditions Adv. Mater. 2017, 29, 1700001. (38) Bao, D.; Zhang, Q.; Meng, F.-L.; Zhong, H.-X.; Shi, M.-M.; Zhang, Y.; Yan, J.-M.; Jiang, Q.; Zhang, X.-B., Electrochemical Reduction of N2 under Ambient Conditions for Artificial N2 Fixation and Renewable Energy Storage Using N2/NH3 Cycle Adv. Mater. 2017, 29, 1604799. (39) Kong, J.; Lim, A.; Yoon, C.; Jang, J. H.; Ham, H. C.; Han, J.; Nam, S.; Kim, D.; Sung, Y.-E.; Choi, J.; Park, H. S., Electrochemical Synthesis of NH3 at Low Temperature and Atmospheric Pressure Using a γ-Fe2O3 Catalyst ACS Sustain. Chem. Eng. 2017, 5, 10986-10995. (40) Chen, S.; Perathoner, S.; Ampelli, C.; Mebrahtu, C.; Su, D.; Centi, G., Electrocatalytic Synthesis of Ammonia at Room Temperature and Atmospheric Pressure from Water and Nitrogen on a Carbon-Nanotube-Based Electrocatalyst Angew. Chem., Intl. Ed. 2017, 56, 2699-2703. (41) Kyriakou, V.; Garagounis, I.; Vasileiou, E.; Vourros, A.; Stoukides, M., Progress in the Electrochemical Synthesis of Ammonia Catal. Today 2017, 286, 2-13. (42) Liu, Q.; Zhang, X.; Zhang, B.; Luo, Y.; Cui, G.; Xie, F.; Sun, X., Ambient N2 fixation to NH3 electrocatalyzed by a spinel Fe3O4 nanorod Nanoscale 2018, 10, 14386-14389. (43) Han, J.; Liu, Z.; Ma, Y.; Cui, G.; Xie, F.; Wang, F.; Wu, Y.; Gao, S.; Xu, Y.; Sun, X., Ambient N2 fixation to NH3 at ambient conditions: Using Nb2O5 nanofiber as a high-performance electrocatalyst Nano Energy 2018, 52, 264-270. (44) Liu, Y.; Su, Y.; Quan, X.; Fan, X.; Chen, S.; Yu, H.; Zhao, H.; Zhang, Y.; Zhao, J., Facile Ammonia Synthesis from Electrocatalytic N2 Reduction under Ambient Conditions on N-Doped Porous Carbon ACS Catal. 2018, 8, 1186-1191. (45) Lee, H. K.; Koh, C. S. L.; Lee, Y. H.; Liu, C.; Phang, I. Y.; Han, X.; Tsung, C.-K.; Ling, X. Y., Favoring the unfavored: Selective electrochemical nitrogen fixation using a reticular chemistry approach Science Advances 2018, 4, eaar3208. (46) Kugler, K.; Luhn, M.; Schramm, J. A.; Rahimi, K.; Wessling, M., Galvanic deposition of Rh and Ru on randomly structured Ti felts for the electrochemical NH3 synthesis Phys. Chem. Chem. Phys. 2015, 17, 3768-3782. (47) Kordali, V.; Kyriacou, G.; Lambrou, C., Electrochemical synthesis of ammonia at atmospheric pressure and low temperature in a solid polymer electrolyte cell Chem. Commun. 2000, 1673-1674. (48) Wang, J.; Yu, L.; Hu, L.; Chen, G.; Xin, H.; Feng, X., Ambient ammonia synthesis via palladium-catalyzed electrohydrogenation of dinitrogen at low overpotential Nat. Commun. 2018, 9, 1795. (49) Song, Y.; Johnson, D.; Peng, R.; Hensley, D. K.; Bonnesen, P. V.; Liang, L.; Huang, J.; Yang, F.; Zhang, F.; Qiao, R.; Baddorf, A. P.; Tschaplinski, T. J.; Engle, N. L.; Hatzell, M. C.; Wu, Z.; Cullen, D. A.; Meyer, H. M.; Sumpter, B. G.; Rondinone, A. J., A physical catalyst for the electrolysis of nitrogen to ammonia Science Advances 2018, 4, e1700336. (50) Qiu, W.; Xie, X.-Y.; Qiu, J.; Fang, W.-H.; Liang, R.; Ren, X.; Ji, X.; Cui, G.; Asiri, A. M.; Cui, G.; Tang, B.; Sun, X., High-performance artificial nitrogen fixation at ambient conditions using a metal-free electrocatalyst Nat. Commun. 2018, 9, 3485. (51) Abghoui, Y.; Garden, A. L.; Hlynsson, V. F.; Bjoergvinsdottir, S.; Olafsdottir, H.; Skulason, E., Enabling electrochemical reduction of nitrogen to ammonia at ambient conditions through rational catalyst design Phys. Chem. Chem. Phys. 2015, 17, 4909-4918. (52) Ren, X.; Zhao, J.; Wei, Q.; Ma, Y.; Guo, H.; Liu, Q.; Wang, Y.; Cui, G.; Asiri, A. M.; Li, B.; Tang, B.; Sun, X., High-Performance N2-to-NH3 Conversion Electrocatalyzed by Mo2C Nanorod ACS Cent. Sci. 2019, 5, 116-121. (53) Ren, S.; Joulié, D.; Salvatore, D.; Torbensen, K.; Wang, M.; Robert, M.; Berlinguette, C. P., Molecular electrocatalysts can mediate fast, selective CO2 reduction in a flow cell Science 2019, 365, 367. (54) Andersson, J.; Lundgren, J., Techno-economic analysis of ammonia production via integrated biomass gasification Applied Energy 2014, 130, 484-490. (55) Bañares-Alcántara, R.; III, G. D.; Fiaschetti, M.; Grünewald, P.; Lopez, J. n. M.; Tsang, E.; Yang, A.; Ye, L.; Zhao, S. Analysis of Islanded Ammonia-based Energy Storage Systems; University of Oxford: 2015. (56) Dana, A. G.; Elishav, O.; Bardow, A.; Shter, G. E.; Grader, G. S., Nitrogen-Based Fuels: A Power-to-Fuel-to-Power Analysis Angew. Chem., Intl. Ed. 2016, 55, 8798-8805. (57) Elishav, O.; Lewin, D. R.; Shter, G. E.; Grader, G. S., The nitrogen economy: Economic feasibility analysis of nitrogen-based fuels as energy carriers Applied Energy 2017, 185, Part 1, 183-188. (58) Wang, L.; Xia, M.; Wang, H.; Huang, K.; Qian, C.; Maravelias, C. T.; Ozin, G. A., Greening Ammonia toward the Solar Ammonia Refinery Joule 2018, 2, 1055-1074. (59) Ikäheimo, J.; Kiviluoma, J.; Weiss, R.; Holttinen, H., Power-to-ammonia in future North European 100 % renewable power and heat system Int. J. Hydrog. Energy 2018, 43, 17295-17308. (60) Andersson, J.; Grönkvist, S., Large-scale storage of hydrogen Int. J. Hydrog. Energy 2019, 44, 11901-11919.
24
(61) Dutta, G.; Mitra, K., A literature review on dynamic pricing of electricity J. Oper. Res. Soc. 2017, 68, 1131-1145. (62) Denholm, P.; Hand, M., Grid flexibility and storage required to achieve very high penetration of variable renewable electricity Energy Policy 2011, 39, 1817-1830. (63) Lund, P. D.; Lindgren, J.; Mikkola, J.; Salpakari, J., Review of energy system flexibility measures to enable high levels of variable renewable electricity Renew. Sust. Energy Rev. 2015, 45, 785-807. (64) "Feeding the Earth, Energy Efficiency and CO2 emissions in ammonia production. Dec 2009" International Fertilizer Industry Association. https://www.fertilizer.org/images/Library_Downloads/2009_IFA_energy_efficiency.pdf (65) Smith, A. R.; Klosek, J., A review of air separation technologies and their integration with energy conversion processes Fuel Process. Technol. 2001, 70, 115-134. (66) Industrial Efficiency Technology Database, Ammonia Benchmarks, http://ietd.iipnetwork.org/content/ammonia - benchmarks (downloaded 2 June, 2019) (67) Bartels, J. R. “A feasibility study of implementing an Ammonia Economy” Iowa State University – Digital Repository, 2008. http://lib.dr.iastate.edu/etd/11132/ (68) Producer Price Index, Construction machinery mfg - PCU333120333120, Bureau of Labor Statistics, annual average prices 2007-2017) https://data.bls.gov/cgi-bin/surveymost?pc (retrieved June 30, 2019) (69) For examples of smaller plants: (a) A 600 short-ton-per-day plant was reported to be built in Rock Springs, WY for a cost of $350 M, or $643,000 per MT-NH3/day capacity. Brown, T. Ammonia Industry "Rock Springs, WY - Simplot" 13 January, 2014: https://ammoniaindustry.com/rock-springs-wy-simplot/ (b) A 331-short-ton-per-day plant is planned for completion in Iowa in 2020 at a cost of $220 M or $730,000 per MT-NH3/day capacity. Brown, T. Ammonia Industry "Garner, IA — Greenfield Nitrogen" 14 May, 2018: https://ammoniaindustry.com/garner-ia-greenfield-nitrogen/ (c) A 100 short-ton-per-day plant was completed in Nebraska in 2018 at a cost of $75 M or $826,000 per MT-NH3/day capacity. Brown, T. Ammonia Industry "Geneva, NE – Fortigen" https://ammoniaindustry.com/geneva-ne-fortigen/ (70) U.S. Energy Information Administration, Henry Hub Natural Gas Spot Price https://www.eia.gov/dnav/ng/hist/rngwhhdm.htm (71) Project documentations available at http://www.hydrogen.energy.gov/h2a_production.html (72) A 750,000 MT-NH3/year (2055 MT-NH3/day) plant (Yara/BASF) built in Freeport, TX, at a cost of $600M, is reported to employ 35 permanent workers. Brown, T. Ammonia Industry "Freeport, TX — Yara/BASF" 31 July, 2018: https://ammoniaindustry.com/freeport-tx-yara-basf/ (73) Saur, G.; Ramsden, T.; James, B.; Colella, W. Future Distributed Hydrogen Production from Grid PEM Electrolysis NREL, 2018 https://www.nrel.gov/hydrogen/h2a-production-case-studies.html (74) Makhlouf, A.; Serradj, T.; Cheniti, H., Life cycle impact assessment of ammonia production in Algeria: A comparison with previous studies Environmental Impact Assessment Review 2015, 50, 35-41. (75) Kugler, K.; Ohs, B.; Scholz, M.; Wessling, M., Towards a carbon independent and CO2-free electrochemical membrane process for NH3 synthesis Phys. Chem. Chem. Phys. 2014, 16, 6129-6138. (76) Lindley, B. M.; Appel, A. M.; Krogh-Jespersen, K.; Mayer, J. M.; Miller, A. J. M., Evaluating the Thermodynamics of Electrocatalytic N2 Reduction in Acetonitrile ACS Energy Lett. 2016, 698-704. (77) Xue, X.; Chen, R.; Yan, C.; Zhao, P.; Hu, Y.; Zhang, W.; Yang, S.; Jin, Z., Review on photocatalytic and electrocatalytic artificial nitrogen fixation for ammonia synthesis at mild conditions: Advances, challenges and perspectives Nano Research 2019, 12, 1229-1249. (78) ERCOT Market Prices, Historical Real-Time Market Load Zone and Hub Prices http://www.ercot.com/mktinfo/prices . For more detailed information about ERCOT see http://www.ercot.com/about (79) U.S. Energy Information Administration, "Electricity. Average Price by State by Provider" (1990-2017) https://www.eia.gov/electricity/data/state/ Electricity Price and Expenditure Estimates, 2017 https://www.eia.gov/state/seds/data.php?incfile=/state/seds/sep_fuel/html/fuel_pr_es.html&sid=US (downloaded June 30, 2019) (80) Farm Futures https://www.farmprogress.com/story-weekly-fertilizer-review-0-30765 (81) Coefficients in eq 14: 39.7 MWh is the theoretical energy required to produce 1 mt-H2; 5.632 is the ratio of mass of NH3 produced per unit mass of H2 assuming 100% efficiency of the H-B synthesis; 1.33 MWh is the energy required to run the H-B plant per mt-NH3 produced. (82) This consideration also implies (although not added to the total costs shown in Table 8) the need for additional H2 storage capacity for times when H2 is not being produced by the electrolyzer. (83) St. John, Jeff "Texas Grid Operator Reports Fuel Mix Is Now 30% Carbon-Free" , Greentechmedia, January 23, 2019, https://www.greentechmedia.com/articles/read/a-snapshot-of-texas-growing-appetite-for-wind-and-solar-power - gs.1krpiy (84) Popovich, N., How Does Your State Make Electricity? New York Times December 24, 2018. (85) Pfromm, P. H., Towards sustainable agriculture: Fossil-free ammonia J. Renew. Sustain. Energy 2017, 9, 034702.
25
(86) Pindyck, R. S., The social cost of carbon revisited J. Environ. Econ. Manage. 2019, 94, 140-160. (87) Ricke, K.; Drouet, L.; Caldeira, K.; Tavoni, M., Country-level social cost of carbon Nature Clim. Change 2018, 8, 895-900. (88) IPCC, 2014: Climate Change 2014: Synthesis Report. Contribution of Working Groups I, II and III to the Fifth Assessment Report of the Intergovernmental Panel on Climate Change [Core Writing Team, R.K. Pachauri and L.A. Meyer (eds.)]. IPCC, Geneva, Switzerland, p 87. (89) McKinley, J.; Plumer, B., New York to Approve One of the World’s Most Ambitious Climate Plans. New York Times June 18, 2019, 2019. (90) Annual Energy Outlook 2019 With Projections to 2050, U. S. Energy Information Administration, https://www.eia.gov/outlooks/aeo/pdf/aeo2019.pdf (91) Creutzig, F.; Agoston, P.; Goldschmidt, J. C.; Luderer, G.; Nemet, G.; Pietzcker, R. C., The underestimated potential of solar energy to mitigate climate change Nat. Energy 2017, 2, 17140. (92) Gilbert, A. Q.; Sovacool, B. K., Looking the wrong way: Bias, renewable electricity, and energy modelling in the United States Energy 2016, 94, 533-541. (93) Levelized Cost and Levelized Avoided Cost of New Generation Resources in the Annual Energy Outlook 2019, U. S. Energy Information Administration, February 2019 https://www.eia.gov/outlooks/aeo/pdf/electricity_generation.pdf (94) Service, R. F., Solar plus batteries is now cheaper than fossil power Science 2019, 365, 108. (95) Audoly, R.; Vogt-Schilb, A.; Guivarch, C.; Pfeiffer, A., Pathways toward zero-carbon electricity required for climate stabilization Applied Energy 2018, 225, 884-901. (96) Sachs, J. D.; Schmidt-Traub, G.; Williams, J., Pathways to zero emissions Nat. Geosci. 2016, 9, 799. (97) Meckling, J.; Sterner, T.; Wagner, G., Policy sequencing toward decarbonization Nat. Energy 2017, 2, 918-922. (98) Sivaram, V.; Kann, S., Solar power needs a more ambitious cost target Nat. Energy 2016, 1, 16036. (99) Levelized Cost and Levelized Avoided Cost of New Generation Resources in the Annual Energy Outlook 2019, U.S. Energy Information Administration, Appendix B, Table B3 https://www.eia.gov/outlooks/aeo/pdf/electricity_generation.pdf (100) Grigas, A., The New Geopolitics of Natural Gas. Harvard University Press: Cambridge, MA, 2017.
Acknowledgements
We thank the NSF Chemical Catalysis Program of the Chemistry Division for funding this collaborative project through Grants CHE-1665146 (GH and ASG), CHE-1665137 (JMM and PLH), and CHE-1665135 (AJMM).
Competing interests
The authors declare no competing interests.
26
Appendix
Table S1. Total cost (USD, energy plus fixed costs) per mt ammonia produced as a function of energy efficiency, energy costs, capital and operating expenses, with varying energy pricing cut-‐offs for operation using 2017 ERCOT real-‐time market prices (ERCOT Houston Loading Zone).
LZ_HOUSTON_LZEW 1 2 3 4 5 6 7 8 9 10
Energy Efficiency 100% 100% 65% 62% 62% 62% 39% 29% 62% 62%D ($/MWh)a 20 30 25 10 20 30 25 25 25 25
Fixed costsb ($/MT) (24/7) 75.7 75.7 75.7 75.7 75.7 75.7 75.7 75.7 151.4 37.9energy cost
cut-off ($/MWh)c
% time operatingd
average energy cost ($/MWh)e
Total cost (electricity plus fixed) ($/MT-NH3)
100 29.10 339 393 520 413 500 586 822 1071 619 50553.6 97 22.59 307 360 468 359 446 532 735 953 567 45039.0 94 21.88 305 359 465 356 442 529 727 943 566 44533.1 90 21.28 306 359 464 354 441 527 723 936 568 44230.5 85 20.67 307 361 464 354 440 527 719 929 573 43928.6 80 20.11 310 364 465 355 441 527 717 924 579 43724.5 70 19.19 319 372 471 360 447 533 718 921 598 43620.9 50 17.95 355 409 504 393 479 565 744 941 674 44717.1 10 12.94 934 988 1068 955 1041 1128 1280 1455 1842 7062.6 1 -0.36 7675 7729 7772 7653 7740 7826 7910 8023 15353 3998
per ton cost energy only (24/7)f 156 156 280 295 295 295 402 535 295 295per ton cost energy + D (24/7)g 264 317 521 396 497 598 746 995 548 548
per ton fixed costs (24/7)h 73.5 73.5 73.5 73.5 73.5 73.5 73.5 73.5 147.0 36.75per ton total costs (24/7) . 337 391 594 469 571 672 820 1068 695 585
a) Δ: difference between wholesale electricity price and price paid b) Fixed costs (capital and operating expenses) per mt assuming full-time operation at capacity c) Greatest wholesale electricity price at percent operating time indicated (i.e. pricing at percentile indicated) d) Percent time operating, assuming full operation at indicated pricing level or lower e) Average cost of energy during time operating f) Energy cost (not including Δ) per mt assuming full-time operation at capacity g) Energy cost (including Δ) per mt assuming full-time operation at capacity

download fileview on ChemRxivENR-23Sep2019-ChemRxiv.pdf (1.78 MiB)