Embed Size (px)
Citation preview
Kevin D. Christensen, PE (WI, SC, MD)Senior Project Engineer/Business Relationship Manager
Short Elliot Hendrickson Inc.May 23, 2018
Wisconsin Energy Innovation Summit
The Potential Biogas Value of Industrial Wastewater
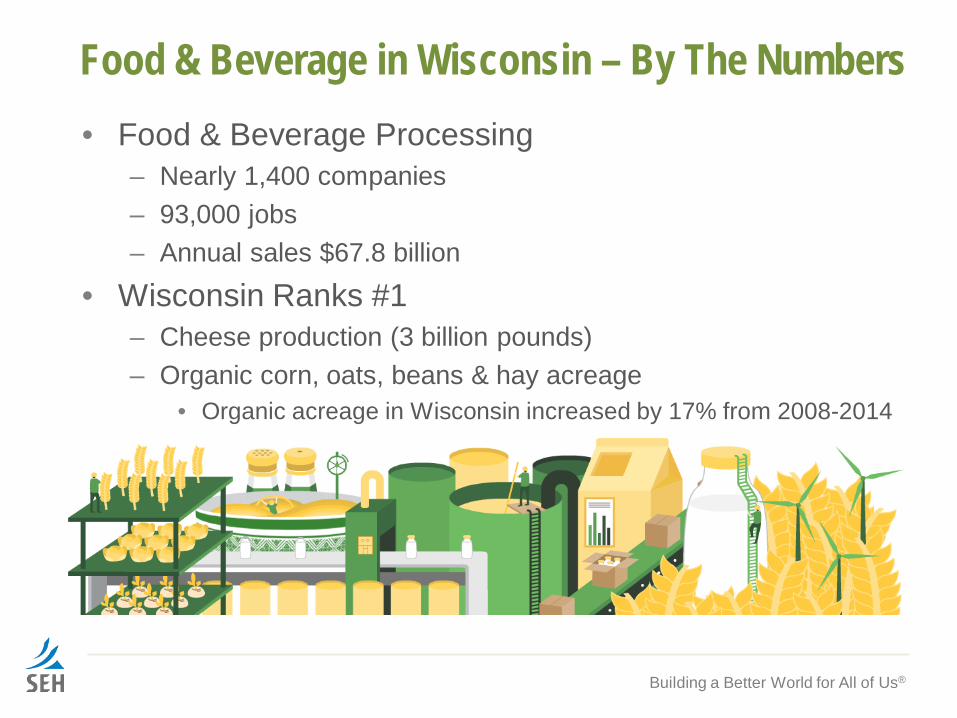
Food & Beverage in Wisconsin – By The Numbers• Food & Beverage Processing
– Nearly 1,400 companies– 93,000 jobs– Annual sales $67.8 billion
• Wisconsin Ranks #1 – Cheese production (3 billion pounds)– Organic corn, oats, beans & hay acreage
• Organic acreage in Wisconsin increased by 17% from 2008-2014
Building a Better World for All of Us®
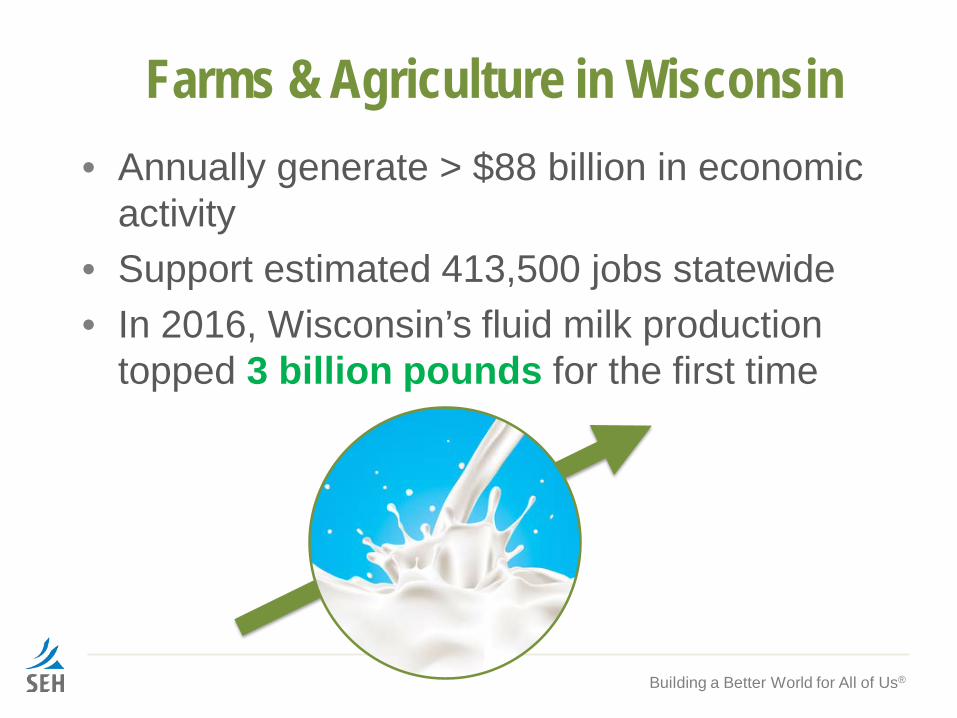
Farms & Agriculture in Wisconsin• Annually generate > $88 billion in economic
activity• Support estimated 413,500 jobs statewide• In 2016, Wisconsin’s fluid milk production
topped 3 billion pounds for the first time
Building a Better World for All of Us®
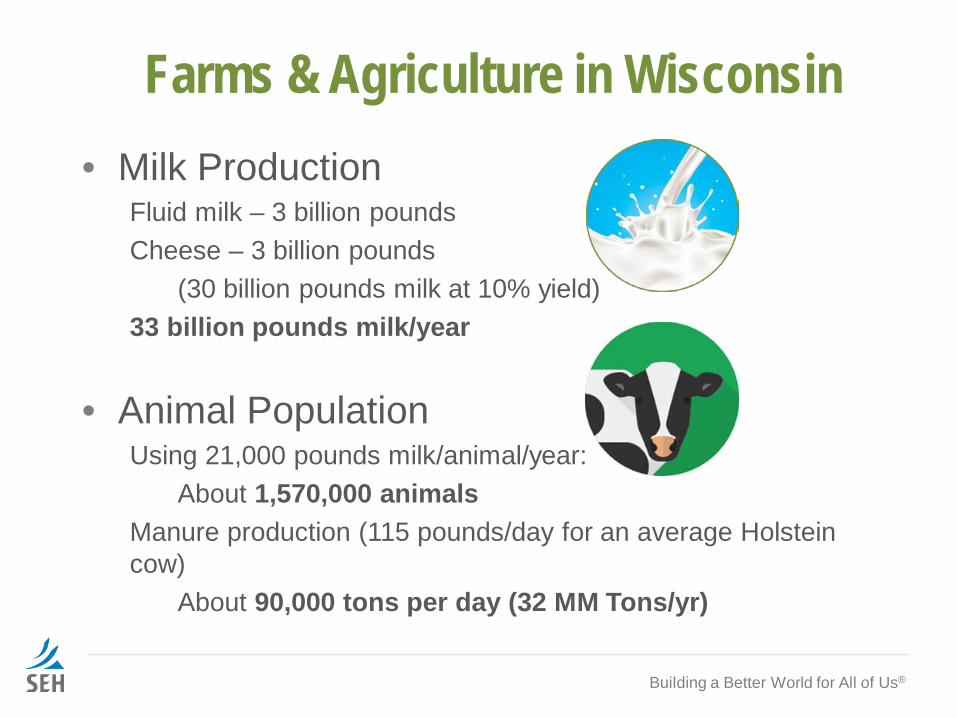
Farms & Agriculture in Wisconsin• Milk Production
Fluid milk – 3 billion poundsCheese – 3 billion pounds
(30 billion pounds milk at 10% yield)33 billion pounds milk/year
• Animal PopulationUsing 21,000 pounds milk/animal/year:
About 1,570,000 animalsManure production (115 pounds/day for an average Holstein cow)
About 90,000 tons per day (32 MM Tons/yr)
Building a Better World for All of Us®
Farms & Agriculture in Wisconsin
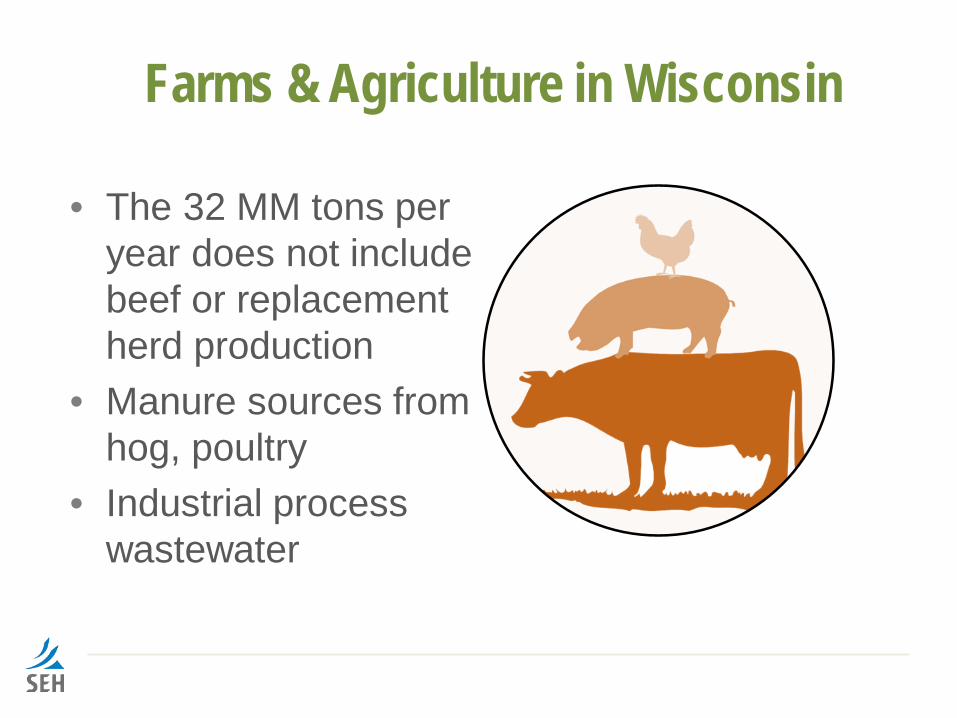
• The 32 MM tons per year does not include beef or replacement herd production
• Manure sources from hog, poultry
• Industrial process wastewater
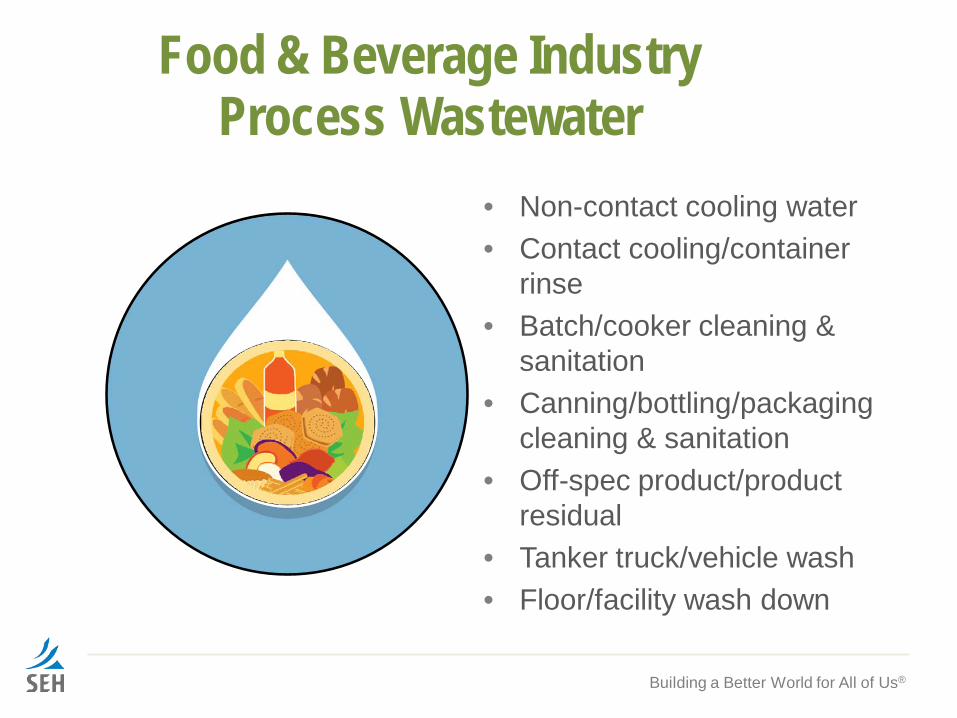
Food & Beverage Industry Process Wastewater
• Non-contact cooling water• Contact cooling/container
rinse• Batch/cooker cleaning &
sanitation• Canning/bottling/packaging
cleaning & sanitation• Off-spec product/product
residual• Tanker truck/vehicle wash• Floor/facility wash down
Building a Better World for All of Us®
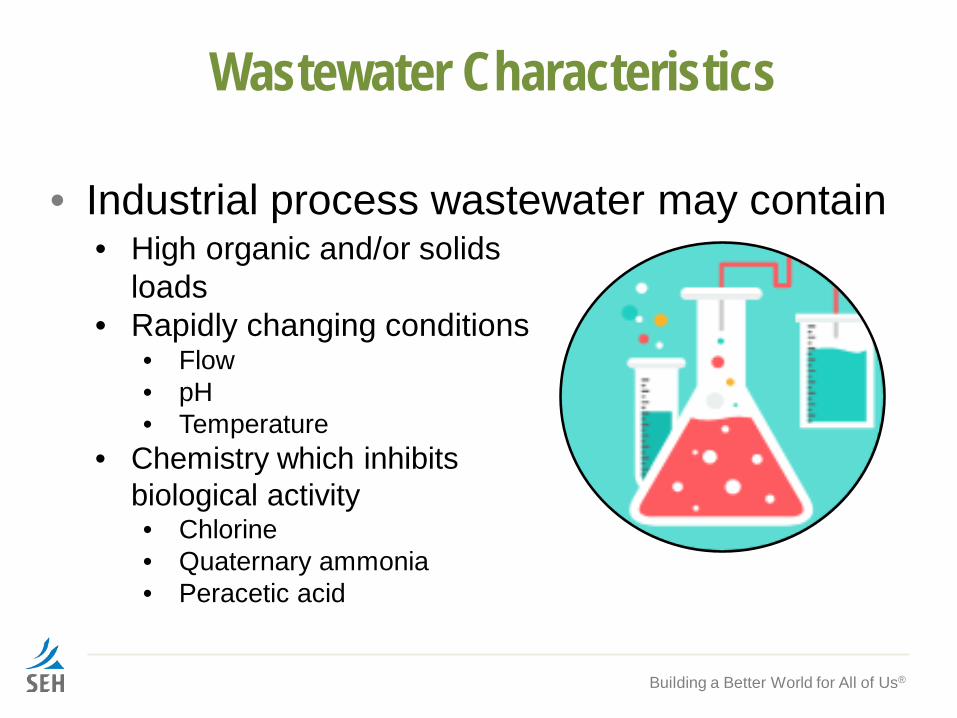
Wastewater Characteristics
• Industrial process wastewater may contain
Building a Better World for All of Us®
• High organic and/or solids loads
• Rapidly changing conditions• Flow• pH• Temperature
• Chemistry which inhibits biological activity• Chlorine• Quaternary ammonia• Peracetic acid
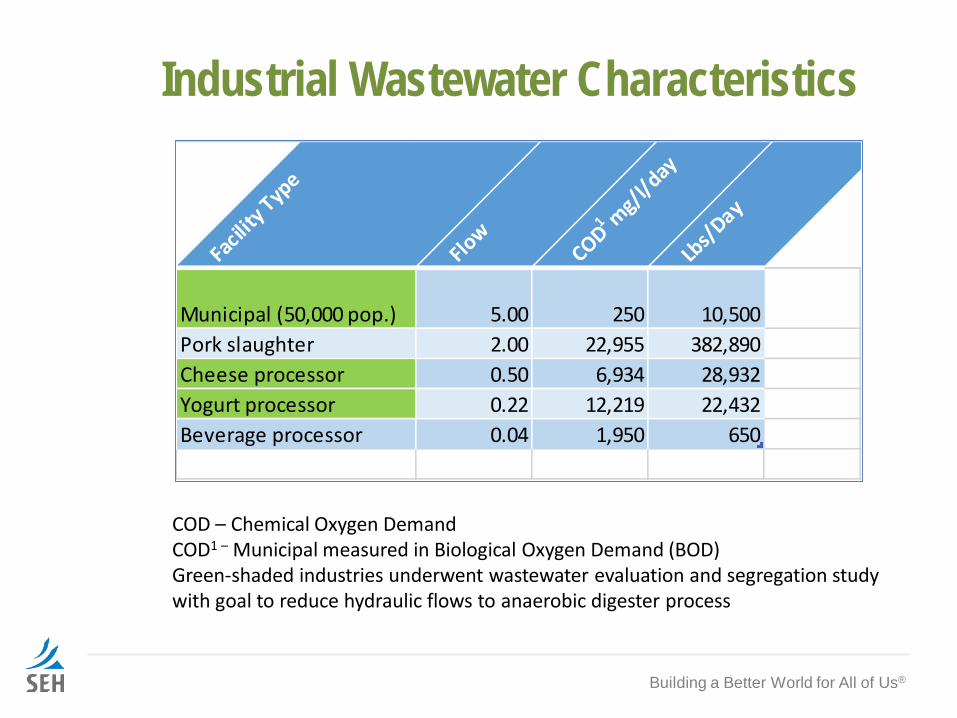
Industrial Wastewater Characteristics
Building a Better World for All of Us®
COD – Chemical Oxygen DemandCOD1 – Municipal measured in Biological Oxygen Demand (BOD)Green-shaded industries underwent wastewater evaluation and segregation study with goal to reduce hydraulic flows to anaerobic digester process
Facil
ity Typ
e
Flow
COD1 mg/
l/day
Lbs/D
ay
Municipal (50,000 pop.) 5.00 250 10,500Pork slaughter 2.00 22,955 382,890Cheese processor 0.50 6,934 28,932Yogurt processor 0.22 12,219 22,432Beverage processor 0.04 1,950 650
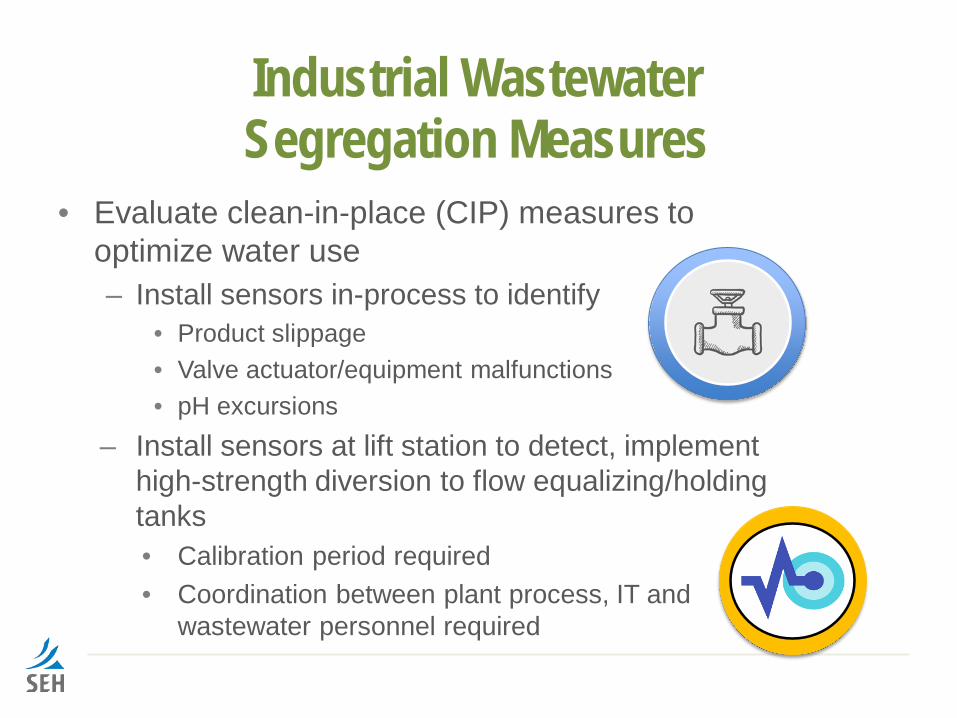
Industrial Wastewater Segregation Measures
• Evaluate clean-in-place (CIP) measures to optimize water use– Install sensors in-process to identify
• Product slippage• Valve actuator/equipment malfunctions• pH excursions
– Install sensors at lift station to detect, implement high-strength diversion to flow equalizing/holding tanks• Calibration period required• Coordination between plant process, IT and
wastewater personnel required
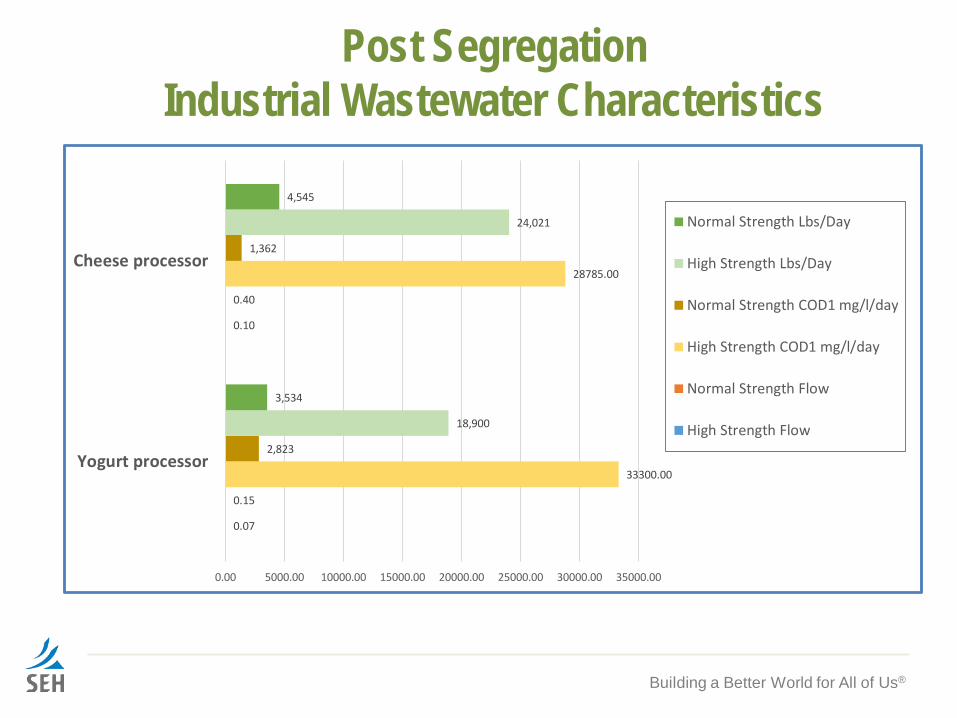
Post Segregation Industrial Wastewater Characteristics
Building a Better World for All of Us®
0.07
0.10
0.15
0.40
33300.00
28785.00
2,823
1,362
18,900
24,021
3,534
4,545
0.00 5000.00 10000.00 15000.00 20000.00 25000.00 30000.00 35000.00
Yogurt processor
Cheese processor
Normal Strength Lbs/Day
High Strength Lbs/Day
Normal Strength COD1 mg/l/day
High Strength COD1 mg/l/day
Normal Strength Flow
High Strength Flow
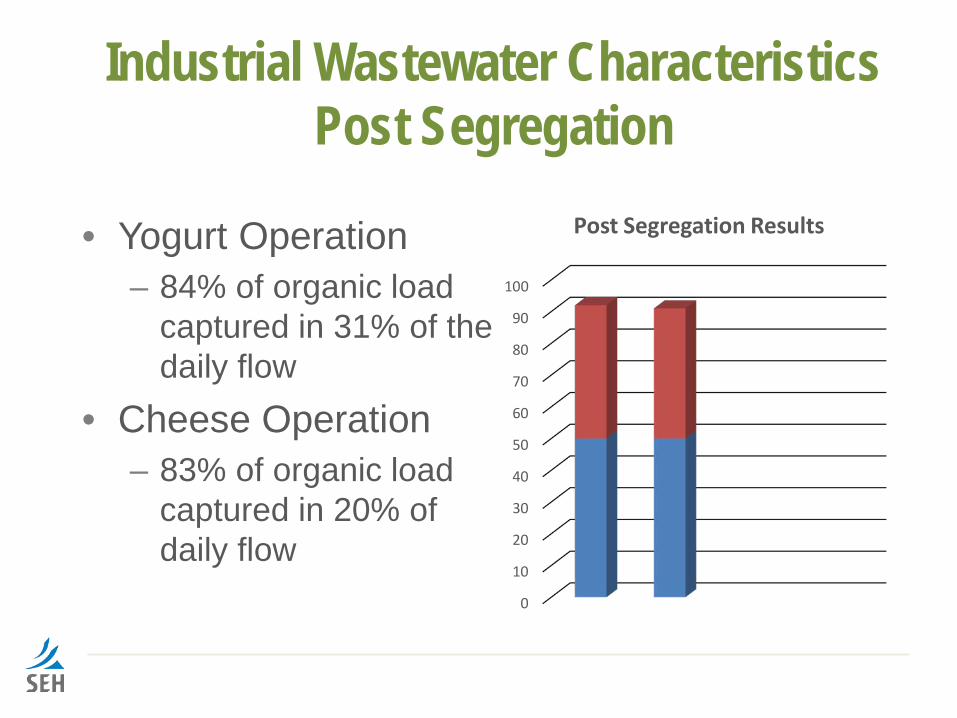
Industrial Wastewater CharacteristicsPost Segregation
• Yogurt Operation– 84% of organic load
captured in 31% of the daily flow
• Cheese Operation– 83% of organic load
captured in 20% of daily flow
0
10
20
30
40
50
60
70
80
90
100
Post Segregation Results
Economics – Cost Avoidance• Flow• BOD• TSS• Phosphorus
Building a Better World for All of Us®
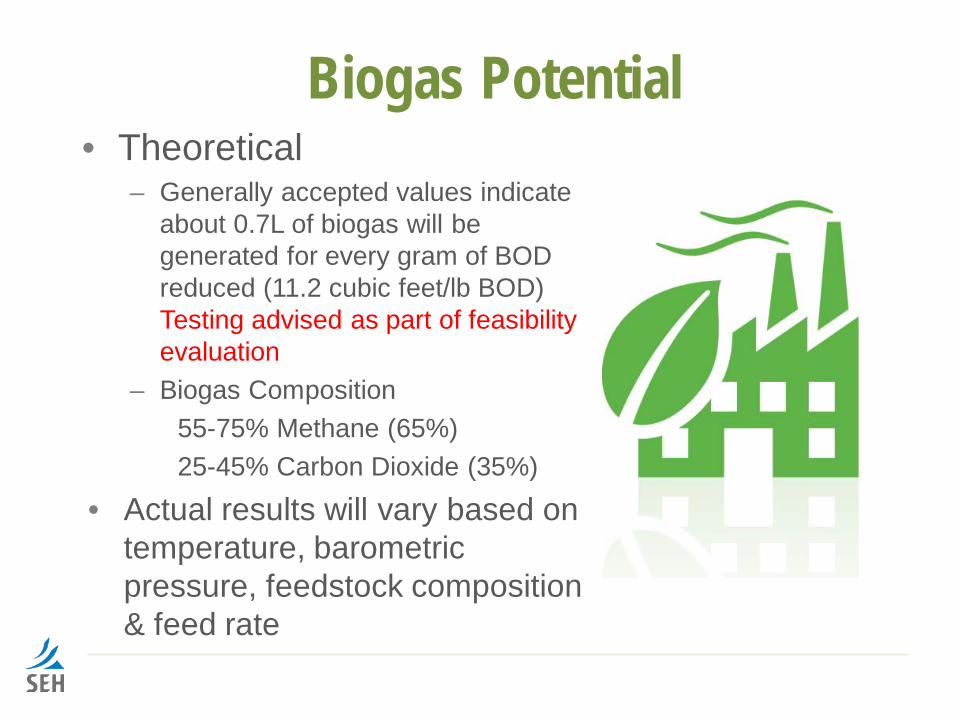
Biogas Potential• Theoretical
– Generally accepted values indicate about 0.7L of biogas will be generated for every gram of BOD reduced (11.2 cubic feet/lb BOD) Testing advised as part of feasibility evaluation
– Biogas Composition55-75% Methane (65%)25-45% Carbon Dioxide (35%)
• Actual results will vary based on temperature, barometric pressure, feedstock composition & feed rate
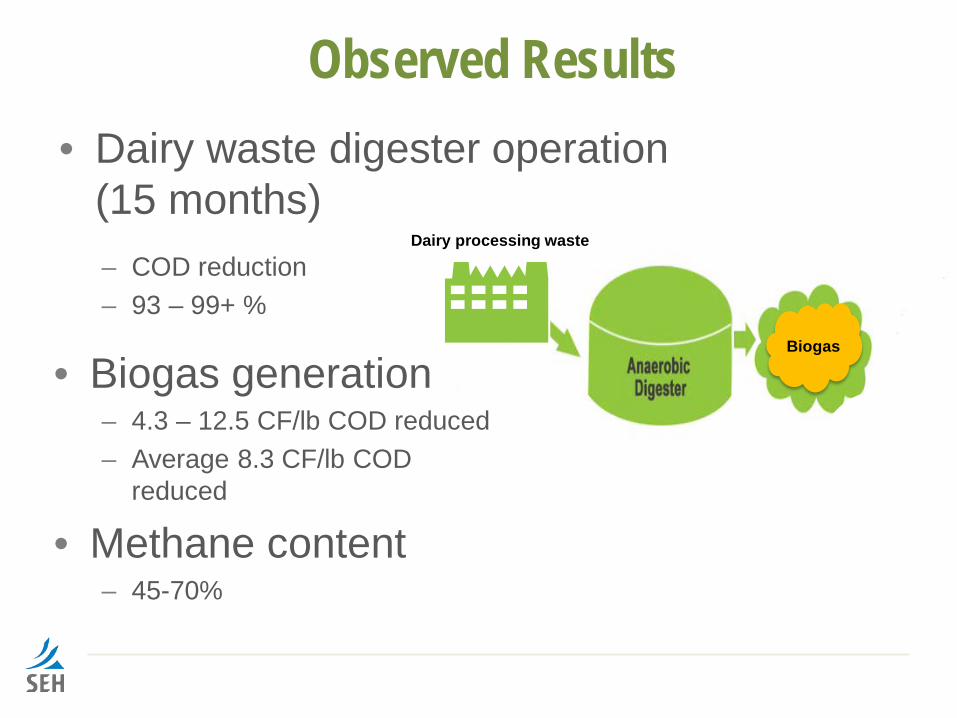
Observed Results
– COD reduction– 93 – 99+ %
• Biogas generation– 4.3 – 12.5 CF/lb COD reduced– Average 8.3 CF/lb COD
reduced
• Methane content– 45-70%
• Dairy waste digester operation (15 months)
Biogas
Dairy processing waste
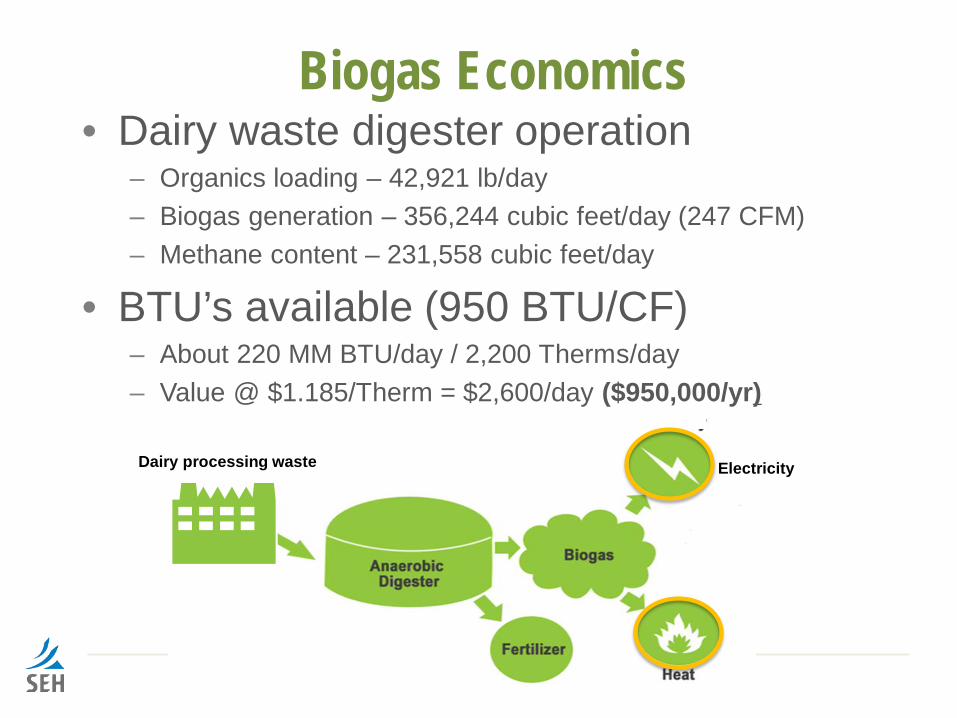
Biogas Economics• Dairy waste digester operation
– Organics loading – 42,921 lb/day– Biogas generation – 356,244 cubic feet/day (247 CFM)– Methane content – 231,558 cubic feet/day
• BTU’s available (950 BTU/CF)– About 220 MM BTU/day / 2,200 Therms/day– Value @ $1.185/Therm = $2,600/day ($950,000/yr)
ElectricityDairy processing waste
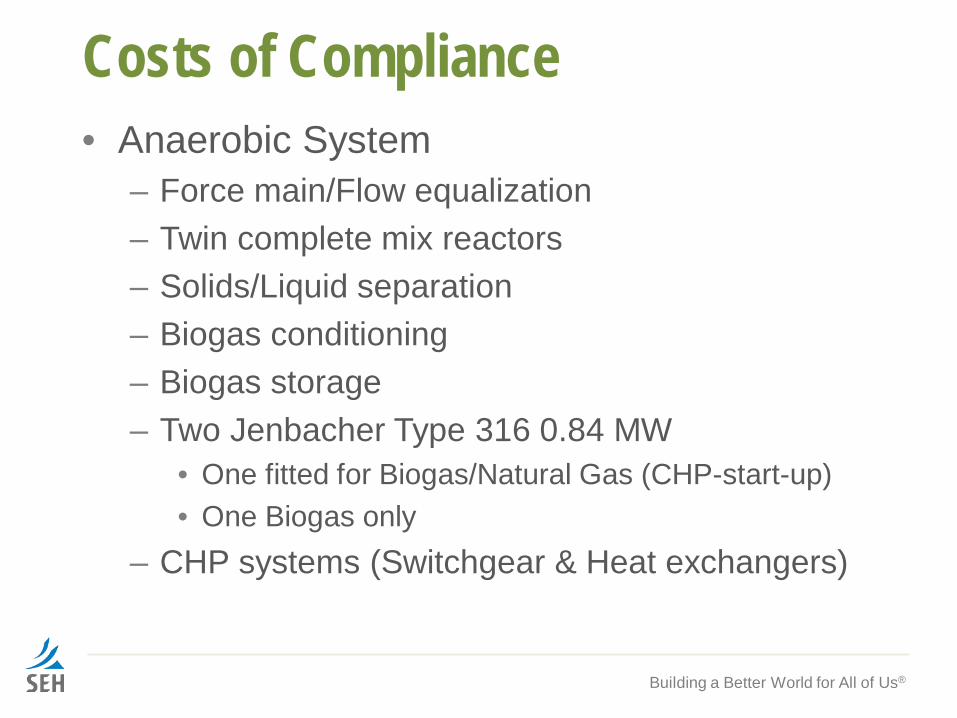
Costs of Compliance• Anaerobic System
– Force main/Flow equalization– Twin complete mix reactors– Solids/Liquid separation– Biogas conditioning– Biogas storage– Two Jenbacher Type 316 0.84 MW
• One fitted for Biogas/Natural Gas (CHP-start-up)• One Biogas only
– CHP systems (Switchgear & Heat exchangers)
Building a Better World for All of Us®
Costs of Compliance - Continued• Aerobic System
– Anoxic contact basin– Activated sludge process– Clarifier– Sludge thickening/dewatering– Phosphorus removal
• Operations & Maintenance• Annual operating expenses
– Operations labor

Questions
?Building a Better World for All of Us®
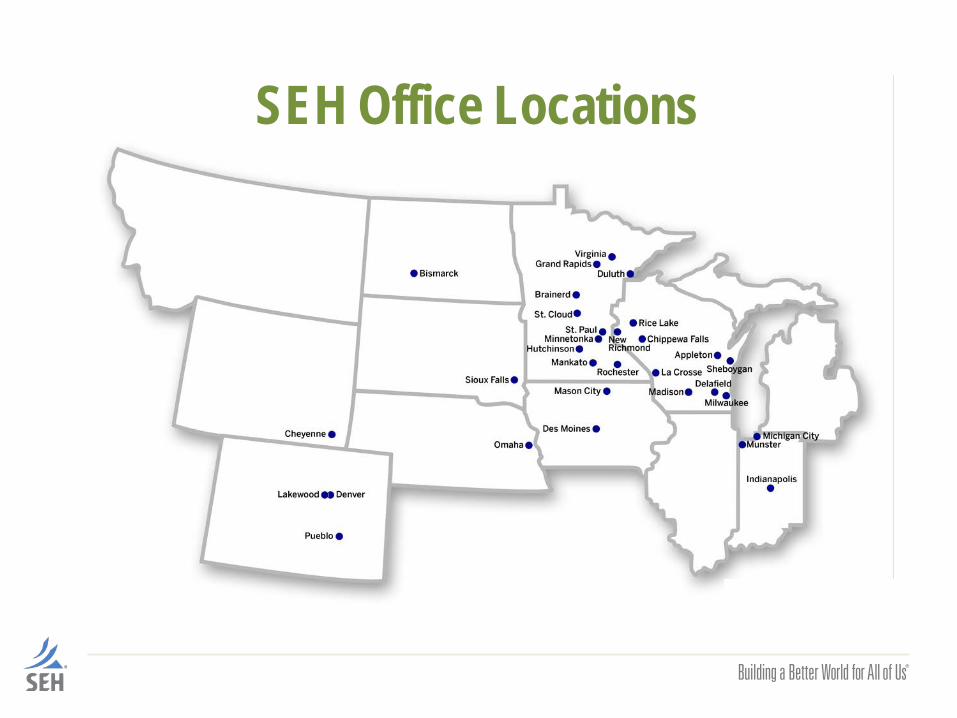
SEH Office Locations

• Kevin Christensen, [email protected]
• Visit us at www.sehinc.com• Interact with us on social media
Thank You, and Let’s Stay in Touch!