Embed Size (px)
Citation preview
This PDF is a selection from an out-of-print volume from the NationalBureau of Economic Research
Volume Title: The Postwar Residential Mortgage Market
Volume Author/Editor: Saul B. Klaman
Volume Publisher: Princeton University Press
Volume ISBN: 0-870-14106-6
Volume URL: http://www.nber.org/books/klam61-1
Publication Date: 1961
Chapter Title: The Postwar Rise of Mortgage Companies
Chapter Author: Saul B. Klaman
Chapter URL: http://www.nber.org/chapters/c2345
Chapter pages in book: (p. 239 - 280)
CHAPTER 8
The Postwar Rise of Mortgage Companies
AMONG the most striking developments in the postwar mortgage markethas been the extraordinary growth of mortgage companies. This growthhas been closely associated with basic changes in the institutional frame-work of the market and with the development of new lending techniquesand characteristics. The unique and increasingly important role of mort-gage companies in the capital market has not been adequately recognizedmainly because of the lack of information upon which to base a descriptionand analysis of their activities. In an effort to fill this gap in our knowledgeof financial institutions, a major segment of this study was devoted to aninvestigation of the operations and financial structure of mortgage com-panies, including the development of new data. This chapter summarizesthe results of this investigation, being a shortened version of the more com-plete report, The Postwar Rise of Mortgage Companies. Most of the tablesincluded in that publication have not been reproduced here and the readerinterested in more detail may, therefore, prefer to read the OccasionalPaper. The appendix of that paper includes a detailed description ofsources of data, techniques of analysis, and several base tables.
Nature and Characteristics of Mortgage CompaniesThe modern mortgage company is typically a closely held, private cor-poration, whose principal activity is originating and servicing residentialmortgage loans for institutional investors. It is subject to a minimumdegree of federal or state supervision, has a comparatively small capitalinvestment relative to its volume of business, and relies largely on commer-cial bank credit to finance its operations and mortgage inventory. Suchinventory is usually held for a short interim between closing mortgage loansand their delivery to ultimate investors.
More than any other type of institution active in mortgage markets,mortgage companies owe their present structure and method of operation,as well as their extraordinarily rapid postwar growth, to the introductionand later expansion of federal mortgage insurance and guaranty. TheFederal Housing Administration and Veterans Administration mortgageunderwriting programs, with their standardized mortgage contracts, uni-form and improved property and borrower appraisal techniques, andminimization of risk, have reduced geographic barriers to mortgage invest-ment and enhanced negotiability of contracts. In the broadened national
239
POSTWAR RISE OF MORTG.AGE COMPANIES
mortgage market that developed, accompanying the marked postwarexpansion in residential building and financing, mortgage companies grewrapidly in response to the increased need by out-of-state investors for localinstitutions to originate and service mortgages.
In its postwar operations and growth, the mortgage company has pro-vided a bridge between primary and secondary mortgage markets and achannel for the flow of both short- and long-term funds, often from capitalsurplus to capital deficit areas. The mortgage company has been a keyfactor in the expanded use of short-term bank credit in mortgage operations,as it has adapted its operations to new commitment and lending techniquesand used such credit more intensively to supplement long-term funds inperiods of capital market stringency. Today's mortgage company differsradically from its predecessors, both in organization and operations.
In its various stages of development from the early nineteenth centuryto the 1930's, mortgage banking was represented by four distinct types ofinstitutions and operations:
1. Mortgage banks originating mortgages and issuing to thepublic their own obligations secured by these mortgages
2. Mortgage guarantee companies originating mortgages andselling them and mortgage bonds, guaranteed for principaland interest to institutions and individuals
3. Mortgage loan companies originating and selling mortgagesdirectly to investors
4. Mortgage brokers arranging transactions between borrowersand lenders without direct ownership of the mortgages
For all types of organization, the chief investor in mortgages was the indi-vidual. In the legal sense three parties had an interest in types 1 and 2 andtwo in types 3 and 4. Both the mortgage bank and mortgage guaranteecompany had direct obligations to the general public, either through deben-tures or guarantees, in addition to their relation to mortgage borrowers andlenders. Neither the mortgage loan company nor the broker, on the otherhand, had direct obligations outstanding to anyone as a result of the trans-actions each arranged.
Introduction of the FHA mortgage insurance program in the midst ofthe depression in 1934 set the stage for the appearance of the modern mort-gage company, whose further growth was sharply stimulated by the VAmortgage guarantee program established in 1944. These federal programs,providing for the underwriting of mortgages on very liberal terms toborrowers, minimizing risk to lenders, and facilitating mortgage arrange-ments for builders, were basic to the accelerated postwar demand for home
240
POSTWAR RISE OF MORTGAGE COMPANIES
mor.tgage loans, to the flow of funds from institutional investors across stateborders, and to the growth of large-scale home builders and mass merchan-dising programs. The profitable and specialized task of arranging for andchanneling the flow of mortgage funds from investors to merchant buildersand ultimately to home purchasers became the province of the mortgagecompany, and the process entailed marked changes in its structure andmethods of operation.
Among institutional investors, life insurance companies, legally leastbound to local investments, became strongly attracted to a national mort-gage investment program. For most of these companies, the problem ofacquiring and servicing out-of-state mortgage investments was resolved byappointment of locally owned and operated mortgage correspondentsrather than by establishment of branch offices or subsidiaries of the parentcompany. The mortgage banking industry undoubtedly owes a large partof its growth and character to this basic decision of the life insurance com-panies. Later, when legal barriers to out-of-state investments in FHA andVA loans were removed for other institutions, the pattern of mortgageacquisitions established by insurance companies was followed, particularlyby many mutual savings banks.
Because, at the beginning of the federal mortgage insurance program inthe early thirties, there were few mortgage companies relative to the in-creased demand for their services, the life insurance companies selected asmortgage correspondents, real estate companies, brokers, attorneys, andothers connected with the real estate industry. Thus many of today'smortgage companies have predecessors that operated for a shorter or longerperiod in one or another phase of the real estate business. The few pre-FHA mortgage companies shifted the focus of their activity from individualsto institutional investors because individuals are not permitted to holdFHA-insured mortgages and the long-term amortized mortgage is not wellsuited to their investment needs.
Thus, the FHA mortgage insurance and VA guaranty programs and thewidespread adoption of the long-term amortized mortgage materiallyaltered the organization and structure of the mortgage banking industry.At one and the same time the new type of mortgage instrument attractedlarge-scale institutional investors to a national mortgage market and dis-couraged the participation of the individual investor. Many mortgagecompanies, formerly engaged in initiating mortgage transactions largelyon their own responsibility for sale to individuals, became the direct rep-resentatives of institutional investors in local markets. The bulk of thebusiness of most mortgage companies shifted from conventional residential
241
POSTWAR RISE OF MORTGAGE COMPANIES
and nonresidential mortgages, in the prefederal mortgage underwritingdays, to federally underwritten home mortgages. Finally, a new type ofprofitable activity—mortgage servicing—required by the monthly amor-tization of mortgages and the escrow of funds for tax and insurance pay-ments became the source of the basic and generally largest componentof net income of mortgage companies.
Essentially, then, the business of the modern mortgage company (unlikethat of mortgage lenders who originate or acquire mortgage loans with theintention of holding them in their own portfolios) is to originate and servicemortgage loans for the accounts of institutional investors. Most mortgagecompanies, so defined, engaged in one or more related activities, includingreal estate management, brokerage, and insurance, construction, and landdevelopment. Conversely, many real estate firms also originate and servicemortgage loans for principal investors. Some financial intermediaries,moreover, notably commercial banks, carry on this type of business, origi-nating mortgages expressly for sale to other institutions. The distinguishingcharacteristic of the mortgage company, as classified for purposes of thisstudy, and following criteria of the Standard Industrial Class jfication manualof the federal government, is that its principal activity is the origination andservicing of mortgages.
In relation to their volume of mortgage lending and servicing, present-day mortgage companies in the main are characterized by small capitalinvestments, just as were those in earlier decades. According to one earlywriter, "The first feature of mortgage banking in America which strikesthe observer is that the mortgage companies are many in number, thecapital of each, with a few exceptions, being small." Whether mortgagecompanies in operation in 1955 would be considered "many in number"is a relative matter. The number is, unfortunately, not precisely knownbut may be estimated closely enough for comparison with the numbers ofother types of financial institutions. The membership of the MortgageBankers Association of America includes a little over 1,000 institutionsclassified as mortgage companies, but their number undoubtedly includessome organizations whose principal activity is not mortgage banking.Mortgage companies that were FHA-approved mortgagees2 in 1955 num-bered some 865. The true number probably lies somewhere between the
1 D. M. Frederikscn, "Mortgage Banking in America," Journal of Political Economy,March 1894, p. 213.
2 These are institutions approved by the Federal Housing Administration to deal inFRA-insured mortgages. For a discussion of requirements to qualify as an FHA-approvcdmortgagee, see the Appendix of Saul B. Kiaman, The Postwar Rise of Mortgage Companies,Occasional Paper 60, New York, National Bureau of Economic Research, 1959.
242
POSTWAR RISE OF MORTGAGE COMPANIES
two. Thus the number of mortgage companies is much smaller than thatof commercial banks or savings and loan associations, but considerablymore than mutual savings banks, and almost equal to that of life insurancecompanies.
REGULATION OF ACTIVITIES
Unlike other institutions in the mortgage market, mortgage companiesare subject to little direct regulation or supervision. Most of them, asprivate corporations, are regulated only by the general corporation laws ofthe states in which they are incorporated. They are not subject to therigorous supervision and control of state or federal financial authorities, asare banks, savings and loan associations, and insurance companies. FHA-approved mortgagees, however—the bulk of all mortgage companies—areliable to periodic examination and audit by the Federal Housing Adminis-tration. Following initial approval, such examination Consists principallyof an audit of financial statements filed annually with FHA, and irregularsight inspection of company records by FHA auditors. Within broad limi-tations of financial soundness, FHA-approved mortgage companies are notrestricted to certain investments or assets. The Veterans Administrationmakes no special requirements of mortgage companies originating VA-guaranteed mortgage loans, which include practically all FHA-approvedmortgage companies. The comparatively limited supervision of mortgagecompanies may perhaps be explained on the grounds that they do not holddeposits or other large reservoirs of funds of the general public as dofinancial intermediaries.
Mortgage companies are, also, far less restricted in geographic area ofactivity and branch office operation than most other types of financialinstitutions are. Here, again, restrictions are limited to FHA-approvedmortgagees and are at present based on policy decisions of the FederalHousing Administration rather than on administrative or statutory require-ments. Current FHA policy allows approved mortgage companies tooriginate and service loans anywhere in their states of residence and tooriginate loans in other states where they have servicing arrangements withlocal FHA-approved mortgagees. In order both to originate and serviceout-of-state loans, FHA-approved mortgage companies must establishbranch offices in the chosen localities. All independent mortgagees3 arepermitted to establish such branch offices, subject to FHA approval, withintheir own and contiguous states. Only the larger approved independent
Loan correspondents are not permitted to establish branch offices. (See Ibid.,Appendix footnote 31, for distinction between independent mortgagees and loancorrespondents.)
243
POSTWAR RISE OF MORTGAGE COMPANIES
mortgagees may establish offices in noncontiguous states since the mini-mum net worth requirement is $250,000 compared with $100,000 toqualify as an FHA-approved independent mortgagee.
But the typical mortgage company, small in size and volume of business,operates in a single office and confines the bulk of its activity to the metro-politan area in which it is located. In recent years, however, several of thelarger companies have developed intercity branch office systems coveringan entire state, and a few of the largest have expanded their operationsbeyond state lines. Within the broad limitations established by the FederalHousing Administration for out-of-state and branch office operations of itsapproved mortgagees, it is conceivable that a few mortgage companiesmay eventually establish nationwide mortgage operations.
SOURCES OF INCOME
The chief regular sources of gross income for mortgage companies arefees derived from their principal activities, mortgage origination and ser-vicing. In recent years, fees for servicing mortgages secured by small resi-dential properties have become fairly standardized at of 1 per cent of theoutstanding balance of the loan. For loans on large scale rental housingand commercial properties, however, servicing fees are far less standardizedand considerably smaller, ranging usually from to * of 1 per cent. The feerate varies inversely with the amount of the loan because costs of servicingindividual loans are similar, regardless of the amounts involved. Mortgagecompanies sometimes make concessions in fees in order to place large loanson their servicing accounts.
Maximum rates for origination fees on FHA and VA loans are fixed bythe respective administrative agencies at between 1 and 2.5 per cent.4There are, of course, no established maximum fees for conventional loans.For conventional construction loans, origination fees have varied withmarket conditions but have seldom gone below 1 per cent or exceeded 2 percent. For other conventional loans of good quality, origination fees haveseldom been charged borrowers, but instead have been collected in theform of a premium price of around of I per cent above par from principalinvestors anxious to acquire them.
Another important source of gross income for mortgage companies isinterest earned on mortgages held in inventory. Such interest income is,
Statutory and administrative regulations have varied, but in nearly all recent yearsorigination fees for FHA home loans have been established at $20 or I per cent of theamount of the loan, whichever is greater; and for loans to lot owners to build homes,at $50 or 2.5 per cent, whichever is greater. On FHA multifamily loans, the maximumorigination fee is 1.5 per cent; on VA loans the maximum origination fee is 1 per cent.
244
POSTWAR RISE OF MORTGAGE COMPANIES
however, largely offset by interest payments to commercial banks onshort-term loans necessary to finance mortgage inventory. On balance,therefore, net income attributable to interest on mortgage holdings isrelatively small. Companies occasionally earn income from the sale ofmortgages at prices above their origination or purchase price, but fewengage in such speculative activity. Typically they originate mortgagesunder prior arrangements with investors at agreed prices, so that for theindustry as a whole such gains on a net basis are relatively small. Theparticipation of mortgage companies in related supplementary activities isreflected in earnings from insurance commissions, real estate brokerage andmanagement, land acquisition and development, and occasionally frombuilding operations.
There are no industry-wide data on the relative contributions to grossrevenues of the various sources of income discussed above. Income state-ments for each of the three years—1951, 1953, and 1955—obtained by theauthor from a few mortgage companies of varying size in the Washington,D.C. area, however, are suggestive of the income composition. These state-ments indicate that income from servicing and origination fees accountedfor between two-fifths and two-thirds of gross income in each of the threeyears. Servicing fees alone typically contributed between one-third andtwo-fifths of gross income. Relative income from origination fees varied,expectably, more widely between companies and between years, from alow of one-eighth to a high of one-third. Reflecting the varying partici-pation of companies in related activities, income from other sources fluctu-ated widely, from 5 to 10 per cent in insurance commissions, 3 to 26 percent in real estate sales and management fees, and 12 to 25 per cent ininterest received on mortgage holdings.
The bulk of mortgage company expenses consists of employee and officerwages and salaries, and interest paid to banks, which, according to the fewstatements at hand, accounted for between one-half and over two-thirdsof gross expenses in the years 1951, 1953, and 1955. Other importantexpense items include taxes, rent, and advertising.
RELATIONSHIP TO INVESTORS AND BORROWERS
Mortgage companies act as intermediaries between borrowers (bothbuilders and home purchasers) and institutional investors, usually locatedin different parts of the country. In generating and holding business, there-fore, mortgage companies must maintain close and continuing contactswith both potential sources of demand for and supply of mortgage funds.5
For administrative details of mortgage company operations, see Robert H. Pease andHomer V. Cherrington, Mortgage Banking, New York, 1953, especially Chapters 14 to 18.
245
POSTWAR RISE OF MORTGAGE COMPANIES
Because of their dependence on external short-term financing to operatesuccessfully their business, they must also maintain a close relationshipwith commercial banks. This dependence on commercial bank credits isone of the main distinguishing features between modern mortgage com-panies and earlier mortgage banks and guarantee companies, whichfinanced their operations through the issuance of debentures or mortgageparticipation certificates.
Mortgage companies in the postwar decade have tended to concentratetheir activities in FHA and VA home mortgage loans, often in connectionwith new large-scale housing projects in metropolitan areas. They negotiateand close the bulk of these and of conventional mortgage loans on the basisof prior allocations of funds and advance commitments to buy mortgagesfrom principal investors. Few loans in recent years have been originatedby mortgage companies on their own responsibility for unknown investors(see section on "Loan closings and investor commitments"). On the basisof firm commitments from institutional investors to purchase completedmortgages (subject to the satisfaction of stated conditions), the mortgagecompany is able to arrange construction financing from a commercial bankfor his builder customers and, at a later point, interim financing for itself.The latter type of financing is necessary to enable mortgage companies toclose mortgages and carry them in inventory pending the processing ofpapers and delivery to ultimate investors.
Clearly, then, modern mortgage companies, unlike their predecessors,look chiefly to financial institutions rather than to individuals as outlets formortgage loans and, among the institutions, depend most heavily upon lifeinsurance companies. The policy of most insurance companies to acquirenonlocal loans through mortgage correspondents has been basic to thedevelopment and growth of the mortgage banking industry. In recentyears, mutual savings banks have become an increasingly important outletfor mortgage company loans. Commercial banks and savings and loanassociations, however, rarely acquire mortgages from mortgage companies.Some mortgage companies, reflecting their early background and history,Continue to sell an important proportion of their loans to individuals. Salesof mortgages to individuals, however, amounted to much less than 5 percent of all mortgage company sales in 1955.6
There are wide variations and gradations of arrangements, contractualand otherwise, existing between mortgage companies and institutionalinvestors for the acquisition of mortgage loans. One common arrangement
8 See section on "Principal purchasers of mortgage company loans" and Table 35 forinformation on types of purchasers of mortgage loans originated by mortgage companies.
246
POSTWAR RISE OF MORTGAGE COMPANIES
is the contractual correspondent-investor relationship in which a mortgagecompany acts as the sole representative of a financial institution in theorigination and servicing of mortgage loans in a designated area. Theinvestor generally allocates funds or otherwise commits itself to purchasemortgages on a continuing basis from the correspondent, the amount vary-ing with conditions in capital markets, portfolio needs, and volume ofrepayments on loans serviced for the investor. Mortgage companies gener-ally maintain this kind of relationship with large life insurance companiesand with some large savings banks.
Typically, under this arrangement, correspondents may receive allo-cations of funds from principals twice a year for six-month periods. Thekinds of loans desired by investors under these allocations are generallyindicated or known to the mortgage company through continuously closecontact. Armed with a specified fund allocation and knowledge of in-vestors' loan preferences, the correspondent proceeds to arrange formortgage loans through builders, land developers, realtors, architects, otherregular customers, or prospective new borrowers. The mortgage companywill generally not firmly commit itself to make these loans, however, until ithas submitted them to the principal investor for prior approval and receivedfirm commitments to purchase them at a stated price and under otherstated particulars. The investors' commitments may be either for immedi-ate purchase of loans when completed and ready for delivery, or with somestated period in the future regardless of when the loans may be ready.Under the latter or forward type of commitment, described earlier, it is, ofcourse, necessary for the mortgage correspondent to arrange for appro-priate commercial bank warehousing credits. Some mortgage companiesoriginate loans entirely for one investor, usually so large that the exclusivearrangement provides an advantageous volume of business for the corre-spondent. Other companies, dealing with investors of various types, per-haps have the advantage of somewhat greater flexibility in being able tonegotiate a wider diversity of loans, each acceptable to at least one of theirprincipal investors.
Another type of mortgage company-investor relationship is character-ized, in effect, by the absence of a continuing contractual arrangement.Such a relationship is often preferred by smaller investors who come intothe mortgage market from time to time as they desire mortgage invest-ments. Such investors seldom make allocations of funds to correspondents;they may acquire loans from one or more mortgage companies in the samegeneral area and enter into servicing contracts on the basis of individualtransactions. In dealing with these investors, mortgage originators with
247
POSTWAR RISE OF MORTGAGE COMPANIES
limited capital more commonly submit prospective loans for prior approvaland commitment than originate them on their own financial responsibility.
AGE, GROWTH, AND GEOGRAPHIC DISTRIBUTION
Modern mortgage banking in this country, as it operates today, is arelatively young industry. It has had a spectacular growth in the postwardecade, far greater than that of other financial institutions active in theexpanding real estate and mortgage markets. Growth in number andassets of mortgage companies has been greatest in those areas that haveexperienced a particularly sharp expansion in residential building andsales and are generally removed from financial centers. The greater growthof companies located in areas where other financing institutions are notnumerous reflects the importance of one basic economic function the com-panies perform, that of channeling funds from capital surplus to capitaldeficit areas.
Age
The youth of the mortgage banking industry is affirmed by the fact thatof 854 companies operating as FHA-approved mortgagees in 1954, 445, ormore than one-half, were incorporated in the postwar decade. Nearly one-fourth of these, moreover, were incorporated in the five years beginning in1950. The stimulus given to the mortgage banking industry by the FHAis indicated in part by the number of companies incorporated in the five-year period following that agency's organization in 1934, a larger per-centage—15 per cent—than in any other five-year period before 1945;more of those now in the larger asset-size groups were incorporated from1935 to 1939 than in any other period. The median age of FHA-approvedmortgage companies in 1954 was less than nine years and less than one infive could trace their lineage from before the Great Depression.
Logically enough, there is a close relationship between asset size of com-pany and year of incorporation, proportionately more of the smaller thanlarger companies having been incorporated in recent years. Of the 194companies incorporated in the last half of the postwar decade, 156 or four-fifths still had assets of less than $1 million at the end of 1954. Further,three-fifths of these and about one-half of the $1 to $2 million asset-sizecompanies were incorporated in the postwar decade, whereas less than one-third of the larger companies are of such recent origin. Above the $2million assets line, the relationship between size and age is less directsuggesting that, at this point, factors more important than age—manage-ment, area of operation, and policies of principal associated investors—
248
POSTWAR RISE OF MORTGAGE COMPANIES
influence growth. (For greater detail on age of mortgage companies byasset size, see Table 1 of The Postwar Rise of Mortgage Companies.)
Growth
For financial enterprises, as for other industries, increases in the numberof institutions, in amount of assets, and in volume of business are commonmeasures of growth. By any of these criteria, mortgage banking has had anextraordinarily rapid growth in the postwar decade. This period, in whichfederally underwritten mortgage lending expanded rapidly and large-scaleinstitutional investors widened their mortgage horizons to areas not pre-viously explored, was especially propitious for the establishment of manynew mortgage companies, the number nearly doubling in ten years.7During this same period the number of commercial banks, savings banks,and savings and loan associations, each far greater than mortgage com-panies, was declining slightly. Although life insurance companies alsodoubled in number and were about as numerous as mortgage companiesat the end of 1955, the newcomers in the postwar decade were much smallerin size compared with the old established companies than were the newcrop of mortgage companies compared with the old.
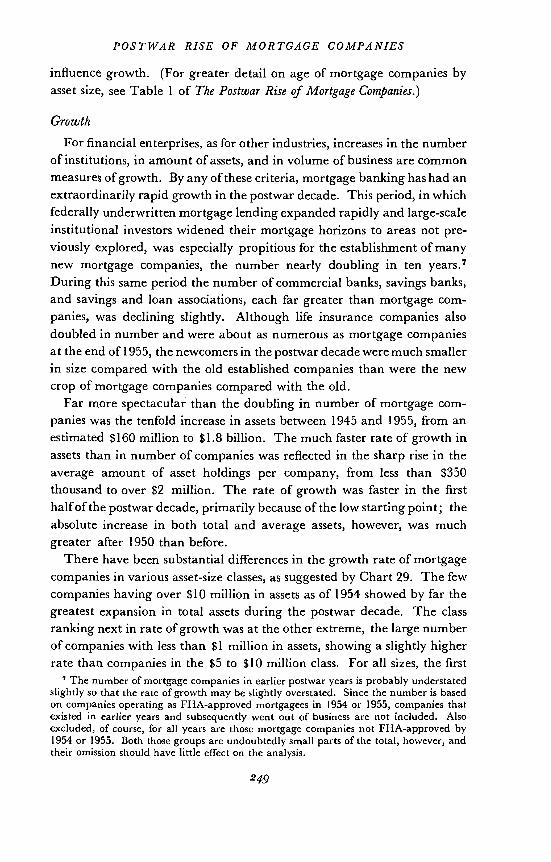
Far more spectacular than the doubling in number of mortgage com-panies was the tenfold increase in assets between 1945 and 1955, from anestimated $160 million to $1.8 billion. The much faster rate of growth inassets than in number of companies was reflected in the sharp rise in theaverage amount of asset holdings per company, from less than $350thousand to over $2 million. The rate of growth was faster in the firsthalf of the postwar decade, primarily because of the low starting point; theabsolute increase in both total and average assets, however, was muchgreater after 1950 than before.
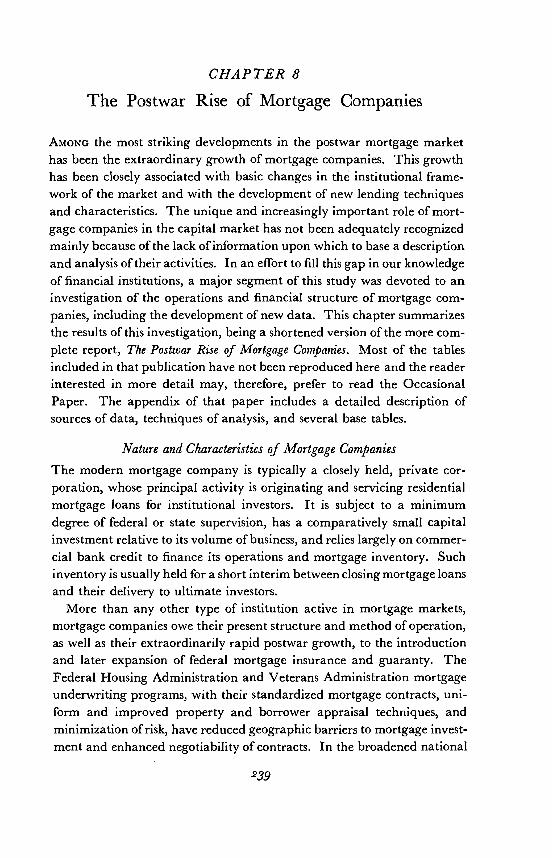
There have been substantial differences in the growth rate of mortgagecompanies in various asset-size classes, as suggested by Chart 29. The fewcompanies having over $10 million in assets as of 1954 showed by far thegreatest expansion in total assets during the postwar decade. The classranking next in rate of growth was at the other extreme, the large numberof companies with less than $1 million in assets, showing a slightly higherrate than companies in the $5 to $10 million class. For all sizes, the first
The number of mortgage companies in earlier postwar years is probably understatedslightly so that the rate of growth may be slightly overstated. Since the number is basedon companies operating as FHA-approved mortgagees in 1954 or 1955, companies thatexisted in earlier years and subsequently went out of business are not included. Alsoexcluded, of course, for all years are those mortgage companies not FHA-approved by1954 or 1955. Both those groups are undoubtedly small parts of the total, however, andtheir omission should have little effect on the analysis.
249
POSTWAR RISE OF MORTGAGE COMPANIES
CHART 29
Asset Growth of Mortgage Companies, by 1954 Asset-Size Class, 1945—1955
250
Militons oi doflors2,000
1,000900800
700
600
1945 '46 '47 '48 '49 '50 '51 '52 '53 '54 '55
SOURCE: Kiaman, Postwar Rise of Mortgage Companies, Tables 9 and A-i through A—9.
POSTWAR RISE OF MORTGAGE COMPANIES
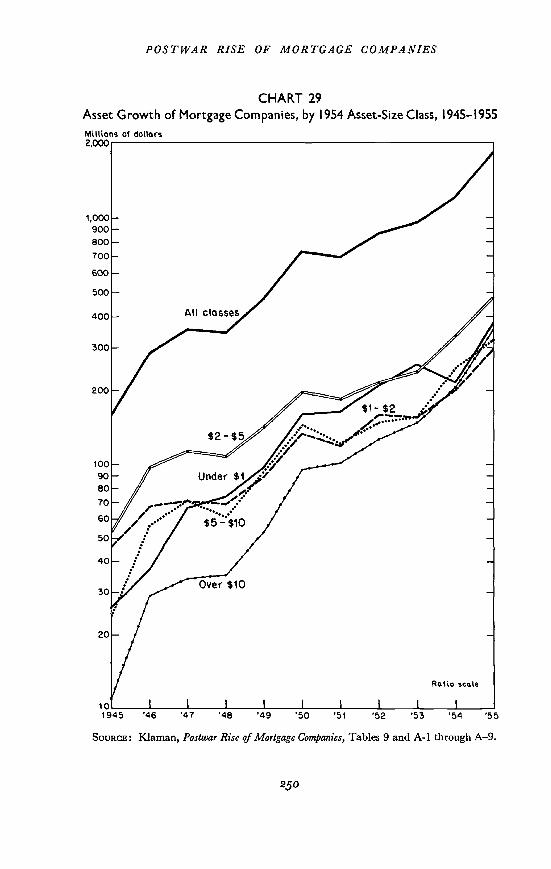
half-decade's expansion rate was substantially greater than the second half-decade's, but the rates of growth were much more even among size classesin the second half of the decade than in the first. The sharp increase intotal assets held by the smallest companies was, in part, the result of theirmore than doubling in number; but for the largest companies the greatincrease in total assets was due more to growth of individual companiesthan to the increase in their number.
TABLE 34Mortgage Companies Classified by Asset Size in 1946 and 1954
(millions of dollars)
1954 Asset Size
1946 Total
Asset Under Over Corn-Size 1 1—2 2—3 3—4 4—5 5—6 6—7 7—8 8—10 10—15 15 panies
Under 1 302 80 24 13 7 5 2 1 1 — 435
1—2 13 8 11 3 5 4 3 2 492—3 — 4 5— 6 2 4 1 1 2 1 263—4 — 3— 4 1 1 — 1 — 3 134—5 — — — 1 I 1 — 3
5—9 — — — — — — i i
Companiesnot inoperationin 1946 254 41 15 4 4 4 2 2 1 327
Total
companies 556 141 52 32 22 17 11 7 4 6 6 854
SOURCE: Records of the Federal Housing Administration. Data for companies havingunder $1 million in assets are based on a 10 per cent sample.
Another and perhaps more instructive way of looking at asset growth ofmortgage companies in the postwar decade is by the extent of upward shiftin asset holdings of individual companies. The sharp shift which occurredbetween 1946 and 1954 is shown graphically in Table 34. In the verysmall companies this upward shift in assets is much less pronounced than inthe others. Of the 435 companies with less than $1 million in assets in 1946,over two-thirds were still in the same group in 1954—though, of course,the relative rate of asset growth of some must have been very high. By con-trast only 23 or one-fourth of the 92 companies having assets of more than$1 million in 1946 were still in the same size class in 1954, and about half ofthem had at least doubled their assets.
Only a handful of companies moved counter to the trend, to higher asset-size classes in 1946 than in 1954. For example, of the 141 companies
251
POSTWAR RISE OF MORTGAGE COMPANIES
holding between $1 and $2 million in 1954, 121, or 86 per cent, either hadheld less than $1 million or were not in operation during 1946. Of 22 com-panies having between $4 and $5 million of assets in 1954, half had lessthan $1 million or were not operating, and another two-fifths held between$1 and $3 million in 1946. In the top of the asset-size class, only I of the 12companies holding more than $10 million in 1954 had approached thisamount in 1946, while the remaining 11 companies had less than $4 millionor were not in operation during 1946.
The postwar growth of mortgage companies is not adequately measuredby their increasing number and assets alone. Consideration must especiallybe the volume of business done, which in the mortgage bankingindustry is generally measured by the amount of mortgage loans servicedfor investors. Data on mortgage servicing, unfortunately, are availableonly for a few recent postwar years and are based chiefly on estimatesdeveloped in this study. These estimates rely on the special survey of mort-gage companies made for this study and on data obtained earlier in regis-tration statements under Regulation X when this selective real estate creditregulation was in effect.
According to these sources, the estimated volume of mortgages beingserviced by mortgage companies had grown to $20 billion by the end of1955, more than half again the estimated 1953 volume of about $12 billion,and more than three times the mid-1951 volume of $6 billion. This growthin servicing was considerably faster than in total home mortgage debt, sothat by the end of 1955 mortgage companies were servicing between one-fifth and one-fourth of the one- to four-family mortgage debt comparedwith about one-eighth in 195 1,8 (see Table 5 of Klaman, The Postwar Riseof Mortgage Companies). The marked and increasing significance of mort-gage companies in the home mortgage market reflects mainly theiractivity in federally underwritten mortgages. The estimated volume ofFHA and VA loans being serviced by them was approaching one-half ofthe total outstanding by the end of 1955, compared with one-fourth inmid-i 951. Finally, comparison of this volume with the home mortgageholdings of investors that are their chief servicing clients—life insurancecompanies, mutual savings banks, and the Federal National MortgageAssociation—indicates that these institutions were having almost two-thirds of their total home mortgages and about four-fifths of those federally
8 Comparison is made with one- to four-family mortgage debt rather than with totalmortgage debt, because the bulk of all mortgage company activity is in the home mortgagemarket. Compared to total mortgage debt outstanding, the ratio of mortgage loansserviced by mortgage companies is, of course, smaller, but the relative growth is equallyimpressive, from less than 8 per cent in mid-1951 to 15 per cent dy the end of 1955.
252
POSTWAR RISE OF MORTGAGE COMPANIES
underwritten serviced by mortgage companies, compared with one-thirdand two-fifths respectively in 1951.
The profitability of mortgage banking, reflected in the increasing volumeof business, was undoubtedly a basic factor contributing to the attractionof new firms to the industry and the expansion of older firms, and hence tocontinued growth. Data on actual mortgage company earnings, eithergross or net, are unfortunately not available. Some rough approximationsmay be suggested, however, from related information on volume of mort-gage servicing and servicing fees and on income composition.
Gross income from mortgage servicing apparently increased from about$27 million in 1951 to $88 million in 1955, if we assume a weighted averageservicing rate for the industry of about 0.45 per cent and apply this toestimates of servicing volume previously discussed. With the further as-sumption, on the basis of evidence from a few companies cited earlier, thatservicing income contributed between one-third and two-fifths of totalgross income of the mortgage banking business, it appears that gross incomeincreased from between $68 and $83 million in 1951 to between $200 and$265 million in 1955, or more than threefold. During this same period thenumber of companies increased by only about 11 per cent so that grossincome per company increased by more than times.
Because ratios of gross expense to gross income vary widely throughoutthe industry, it is possible to make only the roughest sort of guess about netincome. A few companies in Washington, D.C., in special reports for thisstudy, had ratios of gross expense to gross income between just under 80 tojust over 90 per cent. If these ratios were representative, net income aftertaxes for the mortgage banking industry in 1955 would have been around$35 million, with a range of somewhere between $25 to $50 million, com-pared with a range of between $8 and $17 million in 1951. When relatedto average reported net worth in 1955 of about $226 million, the 1955 netincome range suggests a rate of return for the industry in that year ofbetween 11 and 22 per cent. At the lower boundary, this return is a littlesmaller than the 13.5 and 14.1 per cent returns reported in 1955 for salesfinance and consumer finance companies, respectively. At the upperboundary, it is substantially greater than in these financial enterprises, or incommercial banking with an 8.1 per cent return.9 In either case, the mort-gage banking industry appears to rank among the more profitable groupsof financial enterprises.
Consumer instalment Credit, Board of Governors of the Federal Reserve System, Part I,Vol. 2, Growth and Import, Chapter 1, "Financial Characteristics of Principal ConsumerLenders," 1957, Table 16, p. 31.
253
POSTWAR RISE OF MORTGAGE COMPANiES
Geographic Distribution
Mortgage companies may be found in most states of the Union, but innumber and amount of assets held there is a high degree of concentrationin a few states and regions. In 1954, the last year for which comprehensivegeographic data were available, well over one-half of mortgage companyassets and two-fifths of the number of mortgage companies were located inthe Pacific, East North Central, and West South Central states. Concen-tration was even more marked in 1945, but in different regions. Only theEast North Central region maintained its leading ranking in 1954 but theproportion of mortgage companies and assets in this region was well underthat of 1945. Partly, this reflected the great growth in mortgage companiesin the Pacific and West South Central regions between 1945 and 1954,paralleling the marked expansion in population, residential building, andeconomic activity generally in these areas. Equally important perhaps,are the twin facts that these areas are far from the capital market centers ofthe East and that the local mortgage originating institutions, primarilycommercial banks and savings and loan associations, were unable to supplyall the funds needed. In this situation many new mortgage companiesgained a foothold and rapidly expanded, together with older companies, asthey placed and serviced an increasing volume of mortgage loans for large-scale eastern institutional investors entering these growing and profitablemarkets. In sharp contrast, the older industrialized New England regionthat experienced little increase in population and relatively modest gains inresidential building and general economic activity, and is noted for its con-centration of local thrift institutions having ample funds for local mort-gages, offered no advantages for mortgage company location. The smallestfraction of all mortgage companies were located in New England—inConnecticut and Massachusetts only—and they held less than 1 per cent ofall assets in both 1945 and 1954.
The great growth in mortgage companies in the Pacific and West SouthCentral regions reflects principally developments in two leading states,California and Texas, where growth of assets in the postwar decade ex-ceeded that of other important states by a wide margin. By 1954 one-seventh of all mortgage companies having nearly one-fourth of all industryassets were located in these two states alone.
Many of the states and regions that lead in mortgage company locationare also among the most important in federally underwritten and totalhome mortgage lending. For example, three of the leading mortgage com-pany regions—the East North Central, Pacific, and South Atlantic—have
254
POSTWAR RISE OF MORTGAGE COMPANiES
similar proportions of mortgage company assets and of federally under-written and total home mortgage activity. On the other hand, there is awide divergence between the importance of mortgage companies and ofmortgage lending activity in the Middle Atlantic and New England states.The former region is the most important in federally underwritten lendingbut is pulled down to fifth in mortgage company assets by New York Statewhere few mortgage companies are located because of the concentrationthere of local lending institutions. Partly for the same reason, only a fewmortgage companies are located in New England, although this region ismore important than several others in VA and conventional mortgagelending especially.
Among the six leading mortgage company states, four—California,Pennsylvania, Texas, and Michigan (in that order) —rank among the firstsix in federally underwritten mortgage activity, and three—California,Illinois, and Pennsylvania—rank among the first six in total home mort-gage lending activity.'0 For both federally underwritten and total homemortgage lending activity New York ranks second and third, respectively,but ranks nineteenth in total mortgage company assets. (See Tables 6, 7,A- 13 and A- 14 of Kiaman, The Postwar Rise of Mortgage Companie5 for detailsof geographic distribution of mortgage companies and mortgage lendingactivity.)
Mortgage OperationsAs outlined in preceding sections, the mortgage company's chief function isto originate and service mortgage loans for institutional investors, holdingthese loans in inventory for a short term in the period between mortgageorigination and sale to institutions. Little quantitative information hasbeen available, unfortunately, on the characteristics of mortgage companyactivities; on the types of mortgage loans they handle; on the distributionof mortgage sales among mortgage investors; or on the dependence ofmortgage companies on investors' firm commitments or fund allocations.Some useful information on these activities, as well as quarterly balancesheet data, for the years 1953—1955 was obtained in the special survey ofmortgage companies made for this study. In interpreting the findings ofthis survey, the limitations of the data should be borne in mind. Theselimitations, discussed in the appendix of Klaman, The Postwar Rise ofMortgage Companies, result chiefly from the small number of reportingcompanies relative to the universe, and from the disproportionate numberof large companies included among respondents. The data are generally
10 It is likely that Texas would also be a leading state in nonfarm mortgage recordings,but data are not available for this state.
255
POSTWAR RISE OF MORTGAGE COMPANIES
of a lower order of dependability, therefore, than the data on financialstructure obtained from FHA records which are discussed in the followingSection.
MORTGAGE AND CONSTRUCTION LOANS
In the postwar decade, mortgage companies typically were more activein arranging permanent financing for new than for existing properties.Arrangements for short-term financing of construction are also frequentlymade by mortgage companies for builder clients. Such financing is usuallyarranged directly through a commercial bank, but it is not uncommon forthe mortgage company to advance the construction funds and to replenishits cash through a commercial bank loan. Either way, the ultimate sourceof construction funds is the commercial bank. The chief advantage to themortgage company in making construction loans directly to builders is thefee (between I and 2 per cent of the loan amount depending on marketconditions), but the many problems and risks entailed deter most com-panies from such direct financing. To attain and support a significantvolume of activity, a highly trained staff is usually required to observeclosely construction progress and minimize delays, to supervise loan pay-ments at various stages of construction, and to guard against the establish-ment of prior liens.
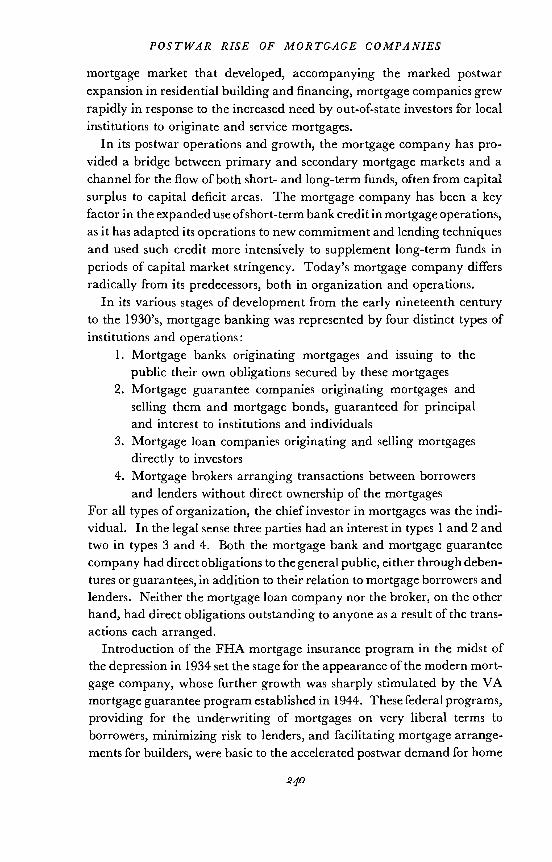
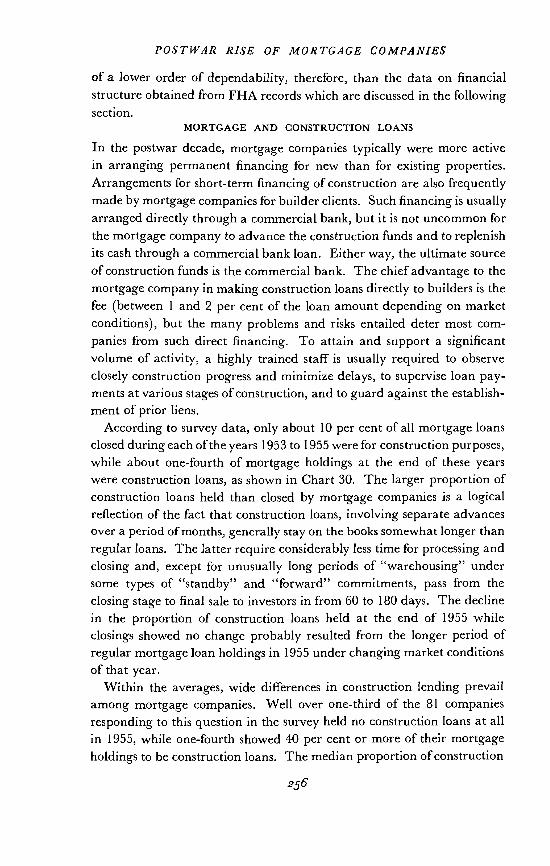
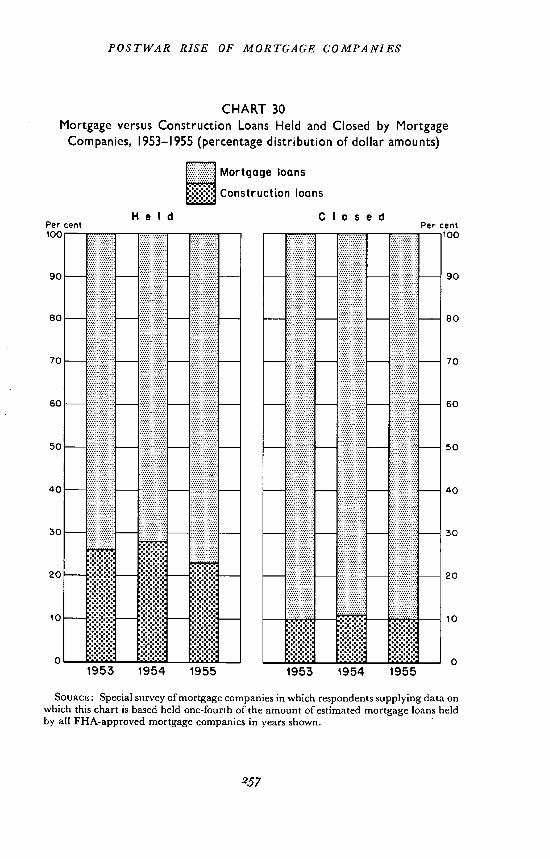
According to survey data, only about 10 per cent of all mortgage loansclosed during each of the years 1953 to 1955 were for construction purposes,while about one-fourth of mortgage holdings at the end of these yearswere construction loans, as shown in Chart 30. The larger proportion ofconstruction loans held than closed by mortgage companies is a logicalreflection of the fact that construction loans, involving separate advancesover a period of months, generally stay on the books somewhat longer thanregular loans. The latter require considerably less time for processing andclosing and, except for unusually long periods of "warehousing" undersome types of "standby" and "forward" commitments, pass from theclosing stage to final sale to investors in from 60 to 180 days. The declinein the proportion of construction loans held at the end of 1955 whileclosings showed no change probably resulted from the longer period ofregular mortgage loan holdings in 1955 under changing market conditionsof that year.
Within the averages, wide differences in construction lending prevailamong mortgage companies. Well over one-third of the 81 companiesresponding to this question in the survey held no construction loans at allin 1955, while one-fourth showed 40 per cent or more of their mortgageholdings to be construction loans. The median proportion of construction
256
POSTWAR RISE OF MORTGAGE COMPANIES
CHART 30
Mortgage versus Construction Loans Held and Closed by MortgageCompanies, 1953—1955 (percentage distribution of dollar amounts)
Mortgage loans
Construction loans
Held ClosedPer cent Per cent100———————
90
80— —80
70— . . 70
60— 60
50 •.:. —50
40 —40
. . . 30
20: —20
10 — — .; — — 10
01953 1954 1955 1953 1954 1955
SOURCE: Special survey of mortgage companies in which respondents supplying data onwhich this chart is based held one-fourth of the amount of estimated mortgage loans heldby all FHA-approved mortgage companies in years shown.
257
POSTWAR RISE OF MORTGAGE COMPANIES
loan holdings was one-seventh compared to a mean of nearly one-fourth.The data by size of company must be interpreted with caution because ofthe small number reporting, although it may be broadly indicative ofdifferences among companies. In general a higher proportion of thelargest companies (over $5 million in assets) make construction loans thanof the smallest companies, but among the companies with over $1 millionin assets making such loans there seems to be little relationship betweensize of company and proportion of construction loan holdings.
TYPES OF MORTGAGE LOANS
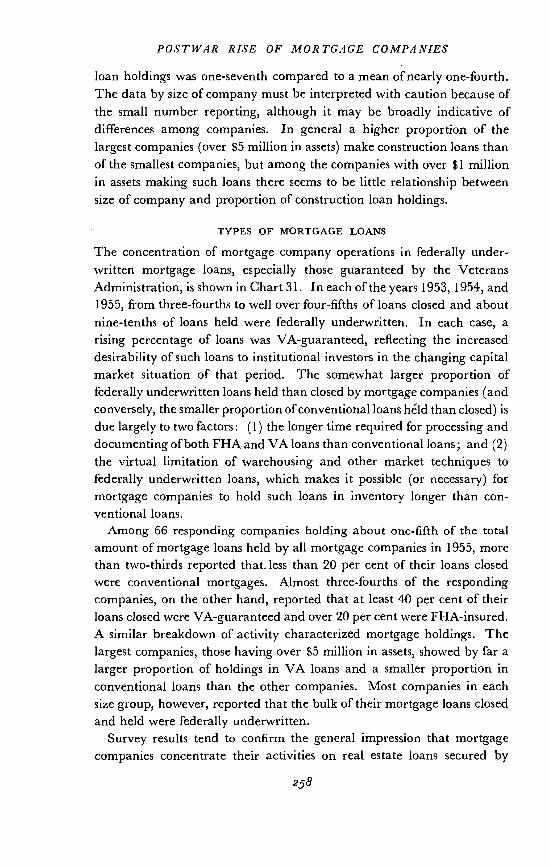
The concentration of mortgage company operations in federally under-written mortgage loans, especially those guaranteed by the VeteransAdministration, is shown in Chart 31. In each of the years 1953, 1954, and1955, from three-fourths to well over four-fifths of loans closed and aboutnine-tenths of loans held were federally underwritten. In each case, arising percentage of loans was VA-guaranteed, reflecting the increaseddesirability of such loans to institutional investors in the changing capitalmarket situation of that period. The somewhat larger proportion offederally underwritten loans held than closed by mortgage companies (andconversely, the smaller proportion of conventional loans held than closed) isdue largely to two factors: (1) the longer time required for processing anddocumenting of both FHA and VA loans than conventionalloans; and (2)the virtual limitation of warehousing and other market techniques tofederally underwritten loans, which makes it possible (or necessary) formortgage companies to hold such loans in inventory longer than con-ventional loans.
Among 66 responding companies holding about one-fifth of the totalamount of mortgage loans held by all mortgage companies in 1955, morethan two-thirds reported that. less than 20 per cent of their loans closedwere conventional mortgages. Almost three-fourths of the respondingcompanies, on the other hand, reported that at least 40 per cent of theirloans closed were VA-guaranteed and over 20 per cent were FHA-insured.A similar breakdown of activity characterized mortgage holdings. Thelargest companies, those having over $5 million in assets, showed by far alarger proportion of holdings in VA loans and a smaller proportion inconventional loans than the other companies. Most companies in eachsize group, however, reported that the bulk of their mortgage loans closedand held were federally underwritten.
Survey results tend to confirm the general impression that mortgagecompanies concentrate their activities on real estate loans secured by
258
POSTWAR RISE OF MORTGAGE COMPANIES
CHART 31Types of Mortgage Loans Held and Closed by Mortgage Companies,
1953—1955
(percentage distribution of dollar amounts)
_______
ConventionalFHAVA
SOURCE: Special survey of mortgage companies in which respondents supplying data onwhich this chart is based held over one-fifth of the amount of estimated mortgage loansheld by all FHA approved mortgage companies in the years shown.
Held ClosedPer cent Per cent100 100
90
80
70
60
50
40
30
20
10
0
90
80
70
60
50
40
30
20
10
01953 1954 1955 1953 1954 1955
259
POSTWAR RISE OF MORTGAGE COMPANIES
one- to four-family properties. In addition to VA and FHA loans which arealmost entirely on one- to four-family houses," the bulk of conventionalmortgage loans closed and held by mortgage companies are on suchproperties. But companies that reported a breakdown of their conventionalloans were only about half as many as reported other data, and theresulting figures are too thin to present in detail. As a broad indication ofthe pattern of conventional loans handled by mortgage companies, how-ever, over four-fifths of the conventional loans closed by 40 companieswere on one- to four-family properties. One-half of the companies report-ing indicated that their conventional mortgage lending activity in 1955—both loans closed and held—was limited exclusively to loans on one- to four-family properties. Most of the remaining companies showed, with littlevariation by size of company, well over one-half of their conventional loansto be on small homes.
The small proportion of conventional loans made on income-producingproperties by mortgage companies is readily explained by the fact thatmany institutional investors find it expedient to originate most such loansdirectly. A large percentage of these loans are made on multifamily andcommercial properties located in industrialized eastern cities, where lifeinsurance companies and savings banks most active in this type of lendingare. Moreover, most of these loans involve much larger sums of moneythan home mortgage loans, require specialized knowledge of appraisal andlending techniques, and justify the time and effort spent on direct negotia-tions by institutional lenders.
PRINCIPAL PURCHASERS OF MORTGAGE COMPANY LOANS
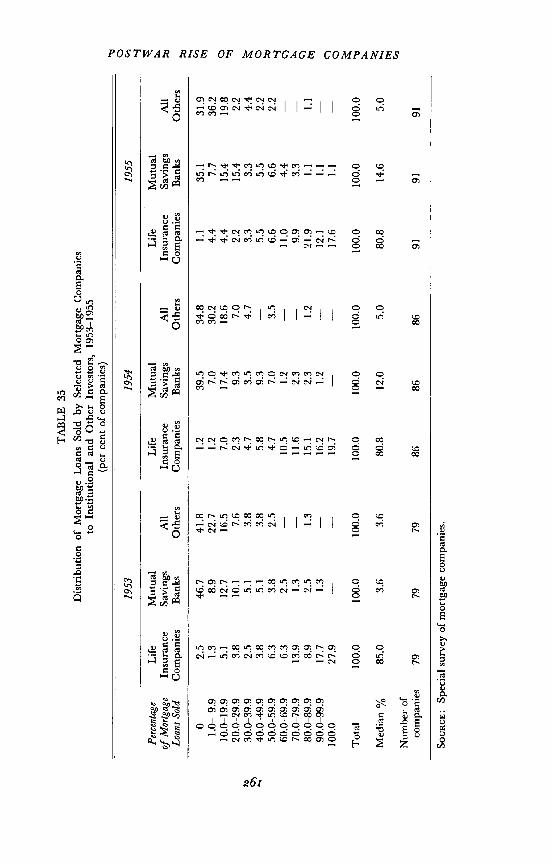
The growth of mortgage companies has been closely related to the increasedparticipation of life insurance companies in the postwar mortgage market.Most life insurance companies acquire the bulk of their FHA and VAloans in out-of-state markets through mortgage company correspondents.Results of the special survey made in this study confirm the generalimpression that this type of institutional investor is the dominant purchaserof mortgage company loans, but suggest there also that this dominance hasdeclined somewhat in recent years.
As shown in Table the proportion of reporting mortgage companiesthat depend exclusively on life insurance companies for their sales hasdeclined from well over one-fourth in 1953 to somewhat over one-sixth in
11 Only a small fraction of all VA loans originated since the inception of the programare on multifamily properties, and data from the Federal Housing Administrationindicate that the bulk of FHA loans closed by mortgage companies are on one- to four-family properties.
260
TA
BLE
35
0 C,) hi 0 0 hi
Dis
tribu
tion
of M
ortg
age
Loan
s Sol
d by
Sel
ecte
d M
ortg
age
Com
pani
esto
Inst
itutio
nal a
nd O
ther
Inve
stor
s, 19
53—
1955
(per
cen
t of c
ompa
nies
)
2"
1953
1954
1955
Perc
enta
geLi
feM
utua
lLi
feM
utua
lLi
feM
utua
lof
Mor
tgag
eIn
sura
nce
Savi
ngs
All
Insu
ranc
eSa
ving
sA
llIn
sura
nce
Savi
ngs
All
Loan
s Sol
dC
ompa
nies
Ban
ksO
ther
sC
ompa
nies
Ban
ksO
ther
sC
ompa
nies
Ban
ksO
ther
s
02.
546
.741
.81.
239
.534
.81.
135
.131
.91.
0— 9
.91.
38.
922
.71.
27.
030
.24.
47.
736
.210
.0—
19.9
5.1
12.7
16.5
7.0
17.4
18.6
4.4
15.4
19.8
20.0
—29
.93.
810
.17.
62.
39.
37.
02.
215
.42.
230
.0—
39.9
2.5
5.1
3.8
4.7
3.5
4.7
3.3
3.3
4.4
40.0
—49
.93.
85.
13.
85.
89.
35.
55.
52.
250
.0—
59.9
6.3
3.8
2.5
4.7
7.0
3.5
6.6
6.6
2.2
60.0
—69
.96.
32.
510
.51.
211
.04.
4—
70.0
—79
.913
.91.
311
.62.
39.
93.
380
.0—
89.9
8.9
2.5
1.3
15.1
2.3
1.2
21.9
1.1
1.1
90.0
—99
.917
.71.
316
.21.
2—
12.1
1.1
100.
027
.9—
19.7
—17
.61.
1—
Tota
l10
0.0
100.
010
0.0
100.
010
0.0
100.
010
0.0
100.
010
0.0
Med
ian
%85
.03.
63.
680
.812
.05.
080
.814
.65.
0
Num
ber o
fco
mpa
nies
7979
7986
8686
9191
91
SouR
cE: S
peci
al su
rvey
of m
ortg
age
com
pani
es.
POSTWAR RISE OF MORTGAGE COMPANIES
1955. A similarly proportionate reduction occurred in the share of com-panies selling over 90 per cent of their loans to life insurance companies.During these years mutual savings banks substantially increased their out-of-state mortgage activities, particularly in VA loans, providing animportant supplementary outlet for mortgage company sales. Whcreas in1953 almost one-half of all reporting mortgage companies sold no mort-gages at all to savings banks, by 1955 the comparable proportion wasreduced to slightly over one-third. Moreover, one-sixth of the mortgagecompanies reported that at least 50 per cent of their sales went to savingsbanks in 1955, compared with one-ninth in 1953 (Table 35). Moremortgage companies sold some mortgages to other investors, includingsavings and loan associations, commercial banks, and the Federal NationalMortgage Association, in 1955 than in 1953 but the proportion of suchsales to total sales continued to be very small and even decreased. Thepercentage of companies selling over 20 per cent of their loans to otherinvestors declined sharply between 1953 and 1955, from almost one-fifthto one-eighth, as a reflection chiefly of decreased reliance on FNMA underchanging market conditions.
The survey suggests that the larger mortgage companies depend less onlife insurance companies or have more diversified sales outlets than smallercompanies. A distinctly inverse relationship was reported between size ofcompany and percentage of mortgage sales to life insurance companies,for each of the years 1953 through 1955. The largest companies, inaddition, show a wide variation in the percentage of their sales to lifeinsurance companies, with about an equal number selling over 80 per centand less than 60 per cent to these investors. Over two-fifths of these largemortgage companies, compared with from one-eighth to one-fourth of allthe others, sold less than 60 per cent of their loans to life insurance com-panies. It is not possible to determine from these data whether the largecompanies became large because of their ability to develop diversifiedsales outlets, or were able to attract new types of investors because theywere already large. It is, of course, known that some of the country'slargest mortgage companies are correspondents for only one investor, letalone one type of investor—-but these are exceptional.
LOAN CLOSINGS AND INVESTOR COMMITMENTS
As noted several times, few mortgage companies undertake to close andsell loans on their own financial responsibility. They are able to originatea volume of mortgage loans much larger than their own resources permitbecause loan closings are typically based on firm investor commitments to
262
POSTWAR RISE OF MORTGAGE COMPANIES
purchase, and are financed by bank loans. In providing interim financingto mortgage companies, commercial banks prefer (and some insist) thatmortgages offered as collateral be backed by investors' take-out commit-ments. In recent periods of tight credit the standby, rather than theregular take-out commitment, has frequently been the basis for mortgagecompany loan closings and for commercial bank interim financing.
An approximation of the degree of mortgage company dependence oninvestor commitments was determined from answers to a survey questionwhich asked: "In the normal course of your business operations, aboutwhat percentage of your mortgage loans do you close only after receivinga firm commitment to purchase, or an allocation of funds, from an insti-tutional investor, and what percentage do you close without a prior com-mitment or allocation of funds ?" Of 90 companies responding to thequestion, 70 or nearly four-fifths closed 90 per cent or more of their loansonly after receiving an allocation of funds or firm commitment from aninstitutional investor to purchase. A few of the largest companies, thosehaving over $5 million in assets, were able and willing to close a significantproportion of loans on their own responsibility. These companies con-stituted one-third of all those reporting yet they accounted for seven-tenthsof the number closing less than 90 per cent of their loans on the basis offirm commitments. Even these large companies, however, closed the bulkof their loans on firm commitments (see Table 17 of Klaman, The PostwarRise of Mortgage Companies).
The technique of originating mortgage loans on the basis of fund allo-cation or firm commitments came into wide use early in 1950. Before thewar, operating on a much more limited scale, mortgage companiesgenerally closed loans on their own responsibility, and financed a largeportion of the loans so acquired through commercial bank lines of creditwhile seeking permanent buyers for their inventories. After the war untilthe spring of 1950, when institutional investors were actively seeking agreater volume of loans than was available, mortgage companies had littledifficulty in marketing all the loans they could originate, and hence theyoperated extensively without prior commitments. The change in marketconditions following the Federal Reserve-Treasury "accord" and theintermittent stringency that has been a part of the capital market sceneever since have resulted in widespread adoption of the prior commitmenttechnique. At the risk of oversimplification, the situation may be sum-marized as follows: the tighter the capital market, the greater thedependence of mortgage company operations on investor commitments;the easier the market, the less the dependence.
263
POSTWAR RISE OF MORTGAGE COMPANIES
Financial StructurePerhaps the outstanding characteristic of the financial structure of mort-gage companies is its relative simplicity. In originating and servicingmortgage loans for institutional investors, mortgage companies use fundsprincipally for closing mortgages and carrying them temporarily ininventory. The chief source of funds to finance this activity is commercialbank loans. This financial pattern is typical for mortgage companies inall asset size classes, with a somewhat greater specialization of uses andsources of funds among larger than smaller companies. Moreover, thefinancial structure in its broad outline remained largely unchanged overmost of a postwar decade of rapid and uneven growth in total mortgagecompany resources. The asset-size distribution of the mortgage bankingindustry, however, has shown a marked upward shift as asset growth hasmore than offset the establishment of many small new companies sinceWorld War II.
ASSET-SIZE DISTRIBUTION
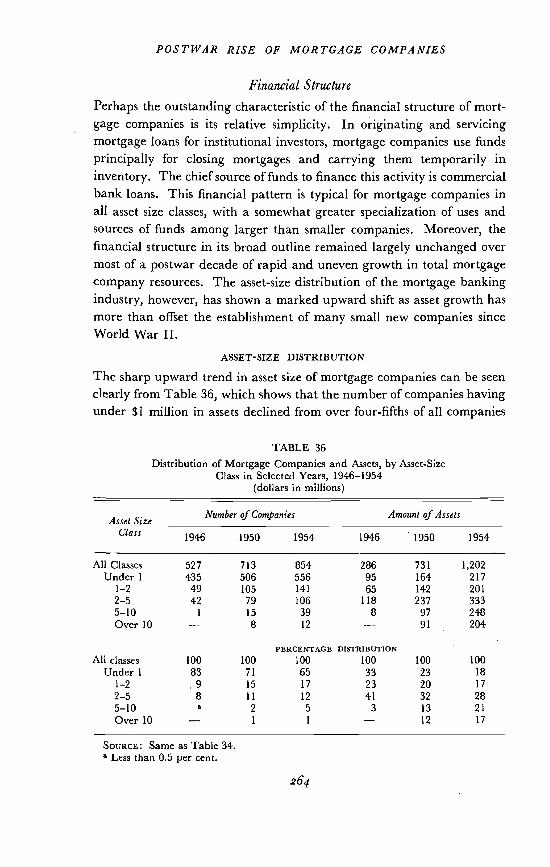
The sharp upward trend in asset size of mortgage companies can be seenclearly from Table 36, which shows that the number of companies havingunder $1 million in assets declined from over four-fifths of all companies
TABLE 36Distribution of Mortgage Companies and Assets, by Asset-Size
Class in Selected Years, 1946—1954(dollars in millions)
Asset SizeClass
Number of Companies Amount of Assets
1946 1950 1954 1946 1950 1954
All Classes 527 713 854 286 731 1,202
Under 1 435 506 556 95 164 217
1—2 49 105 141 65 142 2012—5 42 79 106 118 237 3335—10 1 15 39 8 97 248
Over 10 — 8 12 — 91 204
All classes 100 100PERCENTAGE
100DISTRIBUTION
100 100 100Under 1 83 71 65 33 23 18
1—2 .9 15 17 23 20 172—5 8 11 12 41 32 285—10 a 2 5 3 13 21
Over 10 — 1 1 — 12 17
SouRcE: Same as Table 34.Less than 0.5 per cent.
264
POSTWAR RISE OF MORTGAGE COMPANIES
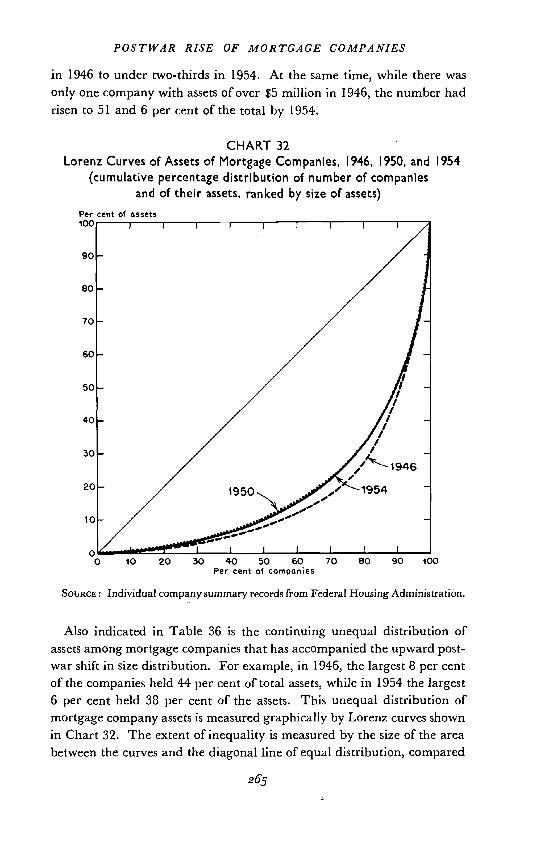
in 1946 to under two-thirds in 1954. At the same time, while there wasonly one company with assets of over $5 million in 1946, the number hadrisen to 51 and 6 per cent of the total by 1954.
CHART 32
Lorenz Curves of Assets of Mortgage Companies, 1946, 1950, and 1954(cumulative percentage distribution of number of companies
Per100
90
80
70
60
50
40
30
20
10
0
and of their assets, ranked by size of assets)
cent of assets
0 10 20 30 40 50 60 70 80 90 100Per cent of
SOURCE: Individual company summary records from Federal Housing Administration.
Also indicated in Table 36 is the continuing unequal distribution ofassets among mortgage companies that has accompanied the upward post-war shift in size distribution. For example, in 1946, the largest 8 per centof the companies held 44 per cent of total assets, while in 1954 the largest6 per cent held 38 per cent of the assets. This unequal distribution ofmortgage company assets is measured graphically by Lorenz curves shownin Chart 32. The extent of inequality is measured by the size of the areabetween the curves and the diagonal line of equal distribution, compared
265
POSTWAR RISE OF MORTGAGE COMPANIES
to the entire triangular area traced by the diagonal line and the horizontaland vertical axes of the chart.'2
The chart indicates that there was very little change in the degree ofasset concentration among mortgage companies over the postwar decadealthough that decade witnessed such marked over-all asset growth andshifts within size groups. Compared with the asset-size distribution amongother types of financial institutions, that of mortgage companies is far moreeven than that of insurance companies (both life and property), somewhatmore even than that of commercial and mutual savings banks, and aboutthe same as the asset-size distribution of savings and loan associations.'3
USES AND SOURCES OF FUNDS
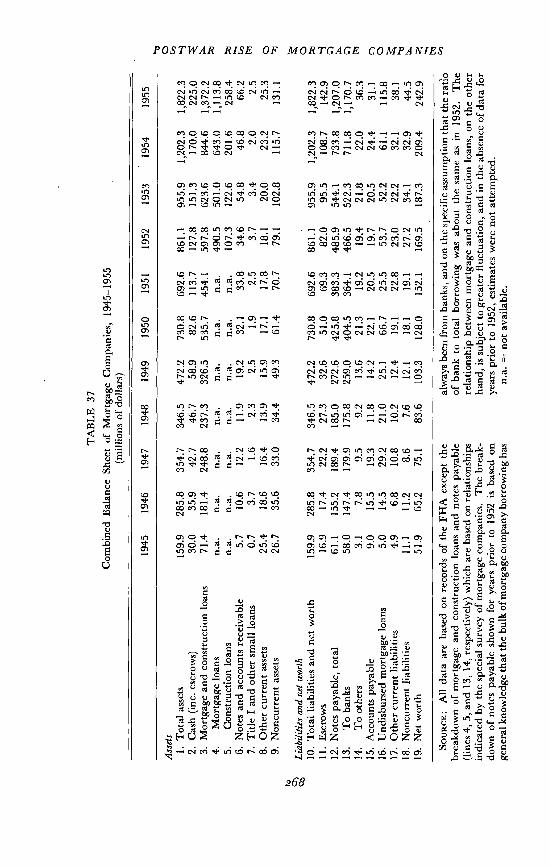
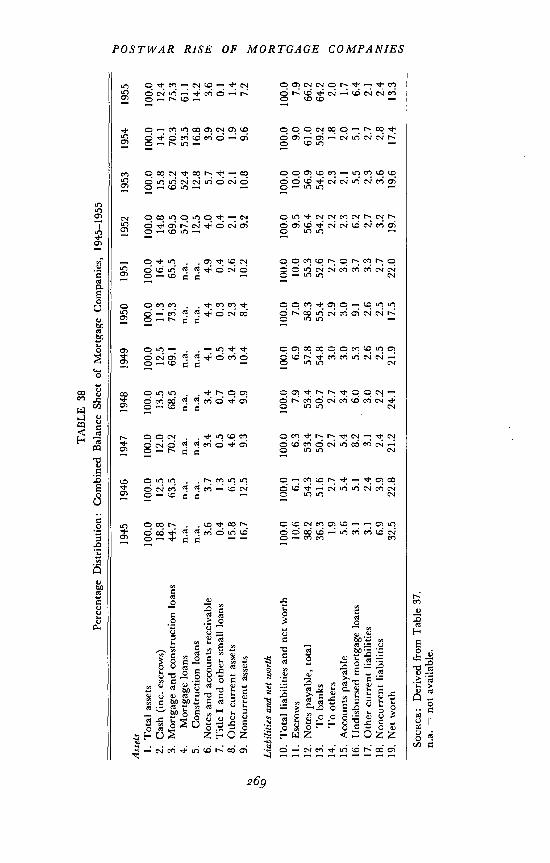
Mortgage company uses and sources of funds over the postwar decade, asreflected in assets and in liabilities and net worth, respectively, are shownin the combined balance sheets summarized in Tables 37 and 38. (Severaladditional combined balance sheets by asset-size class of company aregiven in Tables A-I through A-l0 of Kiaman, The Postwar Rise ofMortgage Companies.)
For the decade as a whole, growth in mortgage and construction loanswas markedly greater than in other components or total assets and increasedas a proportion of total assets from less than one-half to over three-fourthsbetween 1945 and 1955. This sharp growth reflects in part the unusualcharacter of the beginning and terminal years of the decade, the first ayear of transition from war to peace with little mortgage activity, the lasta year of great prosperity and unusually rapid expansion in mortgagelending. Through most of the period under review, mortgage loansaccounted for between two-thirds and three-fourths of mortgage companyassets.
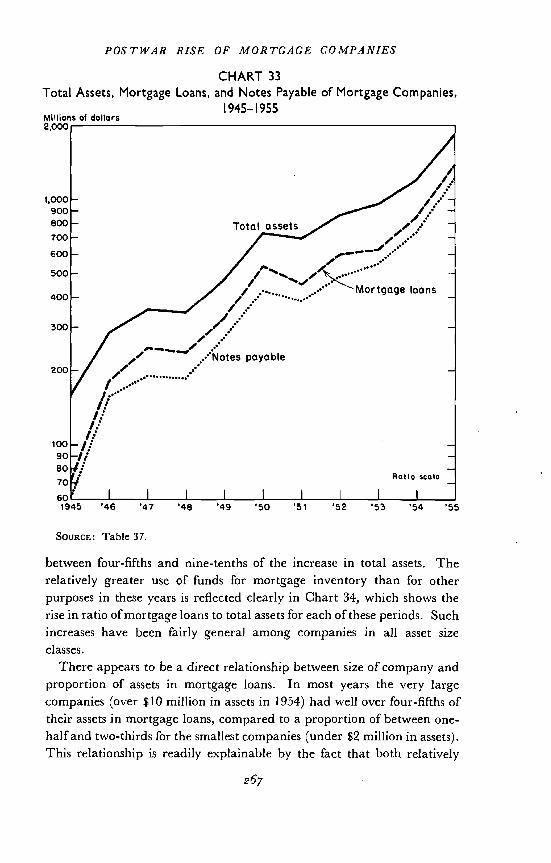
While mortgage companies are not engaged in the business of makingmortgage loans as permanent investment of their own funds, their mortgageholdings rise in years of increased mortgage activity because of an increasedvolume of loan closings held in temporary inventory for ultimate sale.Without exception, sharp year-to-year. gains in total assets have reflectedeven sharper relative gains in mortgage as shown in Chart 33.In the three annual periods of most rapid asset growth—1945—1946, 1949—1950, and 1954—1955—the rise in mortgage inventory accounted for
12 For a fuller discussion of size distribution among financial intermediaries, seeRaymond W. Goldsmith, Appendix C in mimeographed Supplementary Appendixesto Financial Intermediaries in the American Economy since 1900, New York, National Bureau ofEconomic Research, 1958 (available for reference in the NBER library).
13 Ibid., Appendix C, Chart C-i.
266
POSTWAR RISE OF MORTGAGE COMPANIES
CHART 33
Total Assets, Mortgage Loans, and Notes Payable of Mortgage Companies,
1,000900800700600
500
400
300
200
10090807060
SOURCE: Table 37.
1945—1955
between four-fifths and nine-tenthsrelatively greater use of funds for
of the increase in total assets. Themortgage inventory than for other
purposes in these years is reflected clearly in Chart 34, which shows therise in ratio of mortgage loans to total assets for each of these periods. Suchincreases have been fairly general among companies in all asset sizeclasses.
There appears to be a direct relationship between size of company andproportion of assets in mortgage loans. In most years the very largecompanies (over $10 million in assets in 1954) had well over four-fifths oftheir assets in mortgage loans, compared to a proportion of between one-half and two-thirds for the smallest companies (under $2 million in assets).This relationship is readily explainable by the fact that both relatively
267
Millions of dollars2,000
1945 '46 '47 '48 '49 '50 '51 '52 '53 '54 '55
SOU
RC
E: A
ll da
ta a
re b
ased
on
reco
rds o
f the
FH
A e
xcep
t the
brea
kdow
n of
mor
tgag
e an
d co
nstru
ctio
n lo
ans a
nd n
otes
pay
able
(line
s 4, 5
, and
13,
14,
resp
ectiv
ely)
whi
ch a
re b
ased
on
rela
tions
hips
indi
cate
d by
the
spec
ial s
urve
y of
mor
tgag
e co
mpa
nies
. The
bre
ak-
dow
n of
not
es p
ayab
le sh
own
for y
ears
prio
r to
1952
is b
ased
on
gene
ral k
now
ledg
e th
at th
e bu
lk o
f mor
tgag
e co
mpa
ny b
orro
win
g ha
s
alw
ays b
een
from
ban
ks, a
nd o
n th
e sp
ecifi
c as
sum
ptio
n th
at th
e ra
tioof
ban
k to
tota
l bor
row
ing
was
abo
ut th
e sa
me
as in
195
2. T
here
latio
nshi
p be
twee
n m
ortg
age
and
cons
truct
ion
loan
s, on
the
othe
rha
nd, i
s sub
ject
to g
reat
er fl
uctu
atio
n, a
nd in
the
abse
nce
of d
ata
for
year
s prio
r to
1952
, est
imat
es w
ere
not a
ttem
pted
.n.
a.no
t ava
ilabl
e.
Com
bine
d B
alan
ceTA
BLE
37
Shee
t of M
ortg
age
Com
pani
es, 1
945—
1955
(mill
ions
of d
olla
rs)
1945
1946
1947
1948
1949
1950
1951
1952
1953
1954
1955
Ass
ets
1. T
otal
ass
ets
159.
928
5.8
354.
734
6.5
472.
273
0.8
692.
686
1.1
955.
91,
202.
31,
822.
32.
Cas
h (in
c. e
scro
ws)
30.0
35.9
42.7
46.7
58.9
82.6
113.
712
7.8
151.
317
0.0
225.
03.
Mor
tgag
e an
d co
nstru
ctio
n lo
ans
71.4
181.
424
8.8
237.
332
6.5
535.
745
4.1
597.
862
3.6
844.
61,
372.
24.
Mor
tgag
e lo
ans
n.a.
n.a.
na.
n.a.
n.a.
n.a.
n.a.
490.
550
1.0
643.
01,
113.
85.
Con
stru
ctio
n lo
ans
n.a.
n.a.
n.a.
n.a.
n.a.
n.a.
n.a.
107.
312
2.6
201.
625
8.4
6. N
otes
and
acc
ount
s rec
eiva
ble
5.7
10.6
12.2
11.9
19.2
32.1
33.8
34.6
54.8
46.8
66.2
7. T
itle
I and
oth
er sm
all l
oans
0.7
3.7
1.6
2.3
2.5
1.9
2.5
3.7
3.4
2.0
2.5
8. O
ther
cur
rent
ass
ets
25.4
18.6
16.4
13.9
15.9
17.1
17.8
18.1
20.0
23.2
25.3
9. N
oncu
rren
t ass
ets
26.7
35.6
33.0
34.4
49.3
61.4
70.7
79.1
102.
811
5.7
131.
1
Liab
ilitie
s and
net
wor
th10
. Tot
al li
abili
ties a
nd n
et w
orth
159.
928
5.8
354.
734
6.5
472.
273
0.8
692.
686
1.1
955.
91,
202.
31,
822.
311
. Esc
row
s16
.917
.422
.227
.332
.651
.069
.382
.095
.510
8.7
142.
912
. Not
es p
ayab
le, t
otal
61.1
155.
218
9.4
185.
027
2.6
425.
838
3.3
485.
954
4.1
733.
81,
207.
013
.To
ban
ks58
.014
7.4
179.
917
5.8
259.
040
4.5
364.
146
6.5
522.
371
1.8
1,17
0.7
14.
To o
ther
s3.
17.
89.
59.
213
.621
.319
.219
.421
.822
.036
.315
. Acc
ount
s pay
able
9.0
15.5
19.3
11.8
14.2
22.1
20.5
19.7
20.5
24.4
31.1
16. U
ndis
burs
ed m
ortg
age
loan
s5.
014
.529
.221
.025
.166
.725
.553
.752
.261
.111
5.8
17. O
ther
cur
rent
liab
ilitie
s4.
96.
810
.810
.212
.419
.122
.823
.022
.232
.138
.118
. Non
curr
ent l
iabi
litie
s11
.111
.28.
67.
612
.118
.119
.127
.234
.132
.944
.519
. Net
wor
th51
.965
.275
.183
.610
3.3
128.
015
2.1
169.
518
7.3
209.
424
2.9
0 0 0 c.) 0 0 0
SOU
RC
E: D
eriv
ed fr
om T
able
37.
na. =
not
avai
labl
e.
1945
1946
1947
1948
1949
1950
1951
1952
1953
1954
1955
0
100.
0100.0
100.0
100.0
100.0
100.0
100.
010
0.0
100.
010
0.0
100.
018
.812
.512
.013
.512
.511
.316
.414
.815
.814
.112
.444
.763
.570
.268
.569
.173
.365
.569
.565
.270
.375
.3n.
a.n.
a.n.
a.n.
a.n.
a.n.
a.n.
a.57
.052
.453
.561
.1n.
a.n.
a.n.
a.n.
a.n.
a.n.
a.n.
a.12
.512
.816
.814
.23.
63.
73.
43.
44.
14.
44.
94.
05.
73.
93.
6ts
j0.
41.
30.
50.
70.
50.
30.
40.
40.
40.
20.
115
.86.
54.
64.
03.
42.
32.
62.
12.
11.
91.
416
.712
.59.
39.
910
.48.
410
.29.
210
.89.
67.
2
100.
010
0.0
100.
010
0.0
100.
010
0.0
100.
010
0.0
100.
010
0.0
100.
010
.66.
16.
37.
96.
97.
010
.09.
510
.09.
07.
938
.254
.353
.453
.457
.858
.355
.356
.456
.961
.066
.236
.351
.650
.750
.754
.855
.452
.654
.254
.659
.264
.21.
92.
72.
72.
73.
02.
92.
72.
22.
31.
82.
05.
65.
45.
43.
43.
03.
03.
02.
32.
12.
01.
73.
15.
18.
26.
05.
39.
13.
76.
25.
55.
16.
43.
12.
43.
13.
02.
62.
63.
32.
72.
32.
72.
16.
93.
92.
42.
22.
52.
52.
73.
23.
62.
82.
432
.522
.821
.224
.121
.917
.522
.019
.719
.617
.413
.3
TAB
LE 3
8Pe
rcen
tage
Dis
tribu
tion:
Com
bine
d B
alan
ce S
heet
of M
ortg
age
Com
pani
es, 1
945—
1955
Ass
ets
1.Total assets
2.
Cas
h (in
c. e
scro
ws)
3. M
ortg
age
and
cons
truct
ion
loan
s4.
Mor
tgag
e lo
ans
5.C
onst
ruct
ion
loan
s6.
Not
es a
nd a
ccou
nts r
ecei
vabl
e7.
Titl
e I a
nd o
ther
smal
l loa
ns8.
Oth
er c
urre
nt a
sset
s9.
Non
curr
ent a
sset
s
Lzab
zlzt
res
and
net w
orth
10. T
otal
liab
ilitie
s and
net
wor
th11
. Esc
row
s12
. Not
es p
ayab
le, t
otal
13.
To b
anks
14.
To o
ther
s15
. Acc
ount
s pay
able
16. U
ndis
burs
ed m
ortg
age
loan
s17
. Oth
er c
urre
nt li
abili
ties
18. N
oncu
rren
t lia
bilit
ies
19. N
et w
orth
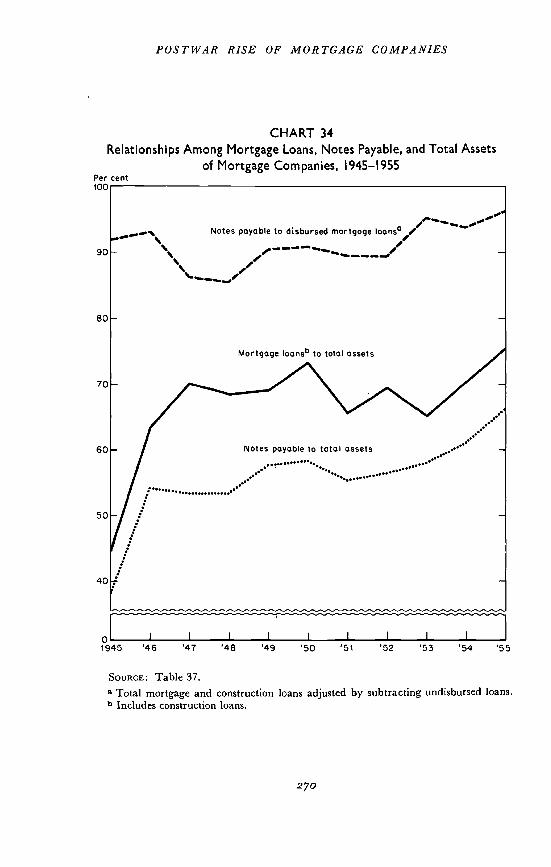
POSTWAR RISE OF MORTGAGE COMPANIES
CHART 34Relationships Among Mortgage Loans, Notes Payable, and Total Assets
Per cent100
90
eQ
70
60
50
40
of Mortgage Companies, 1945—1955
1945 '46 '47 '49 '50
SOURCE: Table 37.a Total mortgage and construction loans adjusted by subtracting undisbursed loans.b Includes construction loans
270
/Notes payable to disbursed mortgage
— —— — /— — —/
Mortgage loansb to total assets
Notes payable to total assets
••••••••••
'51 '52 '53 '54 '55
POSTWAR RISE OF MORTGAGE COMPANIES
small and relatively large mortgage operations can be accommodated inminimum physical facilities. The small company consequently devotes alarger proportion of its assets to fixed plant and equipment than does thelarge company. Further, smaller mortgage companies may choose toengage more extensively in mortgage related activities in order to use theirfacilities more effectively.
Several mortgage companies, moreover, although originating and ser-vicing a large volume of loans, show little or no mortgages in their financialstatements. These companies may be either FHA loan correspondents14not privileged to close FHA-insured mortgages in their own names orcompanies using accounting procedures in which mortgage inventory isnot considered an asset. Among the latter are companies, technicallywithout mortgage inventories, that prefer their loans, originated for insti-tutional investors, to be closed directly by commercial banks and held bythem until ready for delivery to the permanent mortgagees. This pro-cedure would, of course, eliminate mortgages and notes payable to banksfrom balance sheets. Companies operating in this manner are, however,in the distinct minority.
The operating procedure for the great majority of mortgage companies,as suggested earlier, is to close and hold mortgages with borrowed bankfunds pending sale to investors. Thus, paralleling mortgage loans as thechief use of mortgage company funds, notes payable to banks constitutethe chief source of funds. Mortgage companies borrow small amounts
nonbank sources, but these have been typically less than 5 per cent ofnotes payable. Total notes payable increased from $61 million in 1945 to$426 million in 1950 and to over $1.2 billion in 1955. The increase inbank borrowing accounted for over two-thirds of the total sources ofmortgage company funds over the postwar decade.
That bank borrowing'5 and mortgage inventory are closely related inamount and importance in the financial structure of mortgage companies,irrespective of company size, is indicated in Charts 33 through 35. Thefact that bank borrowing accounts for a somewhat smaller proportion oftotal assets than do mortgage loans (Chart 35) is owing to two factors: (1)significant amounts of undisbursed loans included in the mortgage totaland reported separately among liabilities but not included among notespayable; and (2) to the appreciable net worth of mortgage companies.
See the Appendix of Kiaman, The Postwar Rise of Mortgage Companies, for the distinc-tion between loan and independent mortagees.
In the subsequent discussion, "bank borrowing" and "notes payable" will be usedinterchangeab]y, for, while not precisely the same, upwards of 95 per cent of notes payableare owed to banks.
271
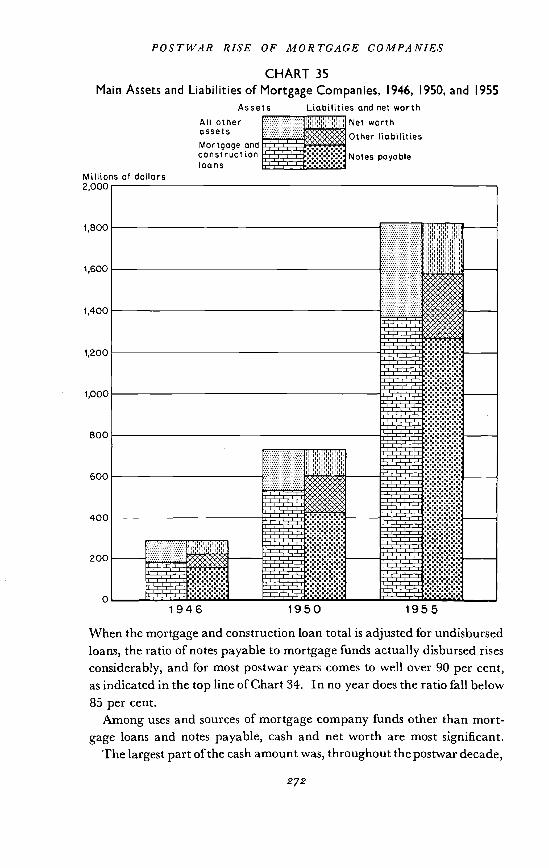
POSTWAR RISE OF MORTGAGE COMPANIES
CHART 35
Main Assets and Liabilities of Mortgage Companies, 1946, 1950, and 1955Assets and net worth
1,800
1,600
1,400
1,200
1,000
800
600
400
200
0
Mortgage andconstructloans
Other
When the mortgage and construction loan total is adjusted for undisbursedloans, the ratio of notes payable to mortgage funds actually disbursed risesconsiderably, and for most postwar years comes to well over 90 per cent,as indicated in the top line of Chart 34. In no year does the ratio fall below85 per cent.
Among uses and sources of mortgage company funds other than mort-gage loans and notes payable, cash and net worth are most significant.
The largest part of the cash amount was, throughout the postwar decade,
272
All otherassets
Millions of dollars2,000
Net worth
Notes payable
1946 1950 1955
POSTWAR RISE OF MORTGAGE COMPANIES
escrow funds as shown in Tables 37 and 38, other cash constituting alimited use of mortgage company funds. The bulk of escrow funds repre-sents payments received from mortgagors during the year and held intrust, pending ultimate disbursement for taxes, insurance premiums, andother purposes, usually in separate bank accounts where they are notavailable for general mortgage company operations. Administrative regu-lations of FHA specifically require FHA-approved mortgagees to maintainseparate accounting for escrow funds collected on FHA loans and prohibittheir use in any way other than for the contracted purpose. VA regula-tions, however, make no similar requirements, and for conventionalmortgage loan escrow funds there are no regulations on supervision andhandling. Thus, while escrow accounts are a substantial item in thefinancial statements of mortgage companies, they are not utilized forfinancing the companies' activities.
Net worth of mortgage companies relative to total assets declined sharplyover the postwar decade from nearly one-third in 1945 to less than one-seventh in 1955, reflecting the rapid postwar asset growth of these insti-tutions. Year-to-year relative declines between 1945 and 1946, 1949 and1950, and 1954 and 1955 were particularly marked, in line with the sharpincrease in mortgage inventory in these periods. In absolute amount,however, net worth has increased almost fourfold in ten years from about$50 million to $240 million. Most of this increase undoubtedly reflectsretained earnings rather than newly invested capital, although availabledata do not permit the separation of these two components of net worthchanges.
Relative to their total assets, net worth of smaller companies is muchgreater than that of larger companies (see Tables A-6 through A-b ofKiaman, The Postwar Rise of Mortgage Companies). There is also a muchgreater variation in ratios among smaller companies than larger ones.For companies with assets of less than $1 million, for example, the propor-tion that had a net worth to assets of less than 25 per cent and of over60 per cent was not much different. For companies with over $5 millionin assets, on the other hand, none showed a net worth to assets ratio of over40 per cent and for the bulk of companies the ratio was less than 10 percent. Median ratios of net worth to assets ranged from 40 per cent forthe smallest companies to 8 per cent for the largest companies.
It is difficult to compare the significance of net worth in the financialstructure of mortgage companies with that of other financial institutionsbecause of the different nature of mortgage company operations. Thesecompanies earn most of their income from mortgage servicing fees rather
273
POSTWAR RISE OF MORTGAGE COMPANIES
than from interest on mortgage holdings or other assets, the chief incomesource for financial intermediaries. When net worth of mortgage com-panies is compared with the volume of mortgages they serviced in recentyears, the ratio drops sharply to between 1 and 2 per cent. Relative toearnings, therefore, it is undoubtedly true that mortgage companies haveand require a much smaller net worth than do other types of financialinstitutions.
Short- Term Movements in Uses and Sources of Funds, 1953—1955Quarterly data on the financial structure of selected mortgage companieswere obtained in a special survey made for this study (see the second partof the Appendix to Klaman, The Postwar Rise of Mortgage Companies).While subject to some short-comings inevitable in a small questionnairesurvey, the data are nonetheless useful as guideposts to short-run changesin uses and sources of funds during a period encompassing both stringencyand ease in capital markets. The dollar volume and composition of assetsand liabilities of responding mortgage companies is shown in Table 39.The substantial agreement in the composition of resources for correspond-ing dates between the selected mortgage companies that reported quarterlydata and the much larger number reporting annual data to FHA is seenby comparing Tables 38 and 39•16 The close relationship betweenmortgage loans, notes payable, and total assets for both groups of com-panies is apparent also from a comparison of Charts 33 and 36.
The quarterly movements shown in Chart 36 reflect both changes incapital market conditions and the basic nature of mortgage companyoperations. During the first two quarters of 1953, the volume of mortgageinventory changed little as capital markets were under strong pressure fromFederal Reserve restrictive actions and from persistent private demandsfor capital. The level of holdings showed little further change in the secondhalf of 1953, when the market eased slightly and interest rates generallydeclined. From the beginning of 1954 on, as investors became increasinglyactive in mortgage markets in a framework of continuing credit ease anddeclines in competitive interest rates, the growth in mortgage inventoriesheld by companies was sharp and continued without interruption throughthe third quarter of 1955. The leveling off in the last quarter of 1955reflected an earlier reduction in the rate of new investor commitments in atightening capital market and the sale of completed mortgages frominventory.
16 For reasons noted in the Appendix of Kiaman, The Postwar Rise of Mortgage Companies,the most appropriate comparison is between the September 30th figures for each year inTable 39 with the corresponding annual figures shown in Table 38.
274
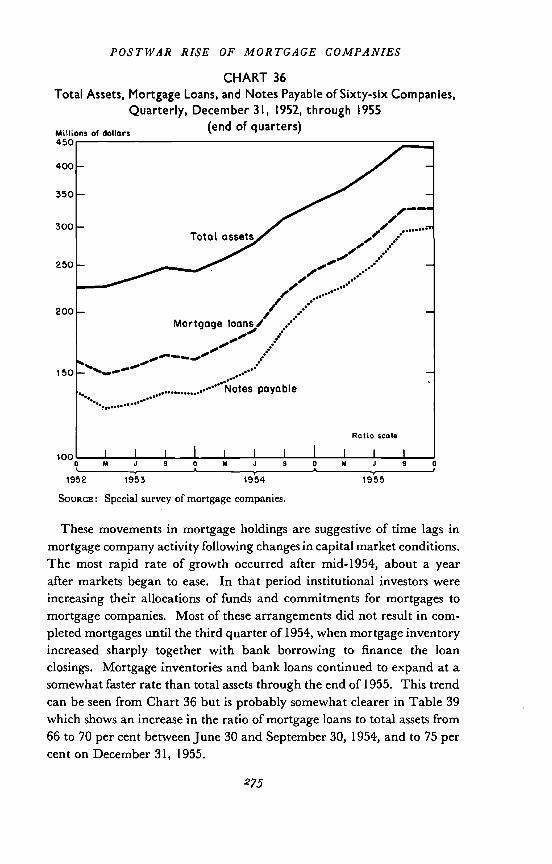
POSTWAR RISE OF MORTGAGE COMPANIES
CHART 36
Total Assets, Mortgage Loans, and Notes Payable of Sixty-six Companies,
of dollars450
400
350
300
250
200
150
100
SOURCE: Special survey of mortgage companies.
N
1955
These movements in mortgage holdings are suggestive of time lags inmortgage company activity following changes in capital market conditions.The most rapid rate of growth occurred after mid-1954, about a yearafter markets began to ease. In that period institutional investors wereincreasing their allocations of funds and commitments for mortgages tomortgage companies. Most of these arrangements did not result in com-pleted mortgages until the third quarter of 1954, when mortgage inventoryincreased sharply together with bank borrowing to finance the loanclosings. Mortgage inventories and bank loans continued to expand at asomewhat faster rate than total assets through the end of 1955. This trendcan be seen from Chart 36 but is probably somewhat clearer in Table 39which shows an increase in the ratio of mortgage loans to total assets from66 to 70 per cent between June 30 and September 30,cent on December 31, 1955
275
1954, and to 75 per
Quarterly, December 31, 1952, through(end of quarters)
1955
1952 1953
0 N .1 S 0 N J S 0 N J S 0S
1954
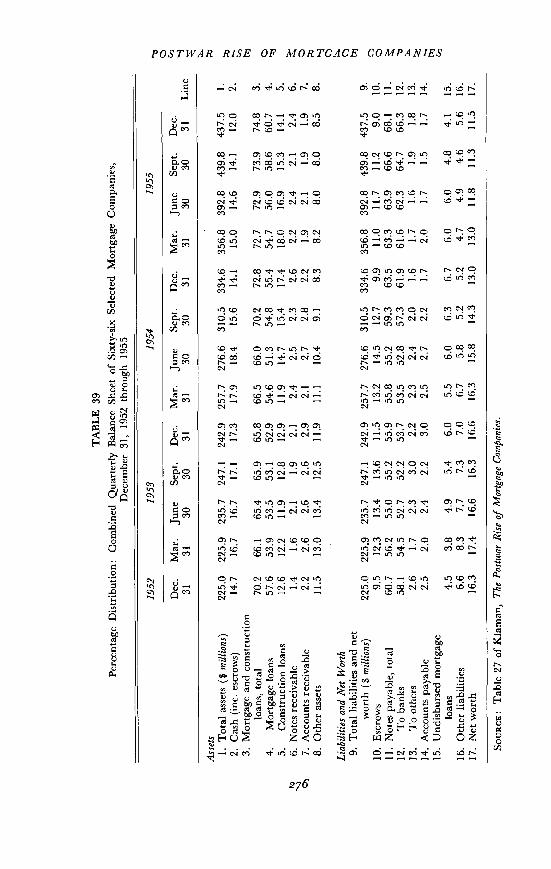
TAB
LE 3
9Percentage
Dis
tribu
tion:
Com
bine
d Q
uarte
rly B
alan
ce S
heet
of S
ixty
-six
Sel
ecte
d M
ortg
age
Com
pani
es,
Dec
embe
r 31,
1952
thro
ugh
1955
0D
ec.
Mar
.Ju
neSe
pt.
Dec
.M
ar.
June
Sept
.D
ec.
Mar
.Ju
neSe
pt.
Dec
.31
3130
3031
3130
3031
3130
3031
Line
225.0
225.9
235.7
247.1
242.9
257.7
276.6
310.5
334.6
356.8
392.8
439.8
437.5
1.
14.7
16.7
16.7
17.1
17.3
17.9
18.4
15.6
l4J
15.0
14.6
14.1
12.0
2.
70.2
66.1
65.4
65.9
65.8
66.5
66.0
70.2
72.8
72.7
72.9
73.9
74.8
3.
57.6
53.9
53.5
53.1
52.9
54.6
51.3
54.8
55.4
54.7
56.0
58.6
60.7
4.12
.612
.211
.912
.812
.911
.914
.715
.417
.418
.016
.915
.314
.15.
1.4
1.6
2.1
1.9
2.1
2.4
2.5
2.3
2.6
2.2
2.4
2.1
2.4
6.
2.2
2.6
2.6
2.6
2.9
2.1
2.7
2.8
2.2
1.9
2.1
1.9
1.9
7.
11.5
13.0
13.4
12.5
11.9
11.1
10.4
9.1
8.3
8.2
8,0
8.0
8.5
8.
225.0
225.9
235.7
247.1
242.9
257.7
276.6
310.5
334.6
356.8
392.8
439.8
437.5
9.
9.5
12.3
13.4
13.6
11.5
13.2
14.5
12.7
9.9
11.0
11.7
11.2
9.0
10.
60.7
56.2
55.0
55.2
55.9
55.8
55.2
59.3
63.5
63.3
63.9
66.6
68.1
11.
58.1
54.5
52.7
52.2
53.7
53.5
52.8
57.3
61.9
61.6
62.3
64.7
66.3
12.
2.6
1.7
2.3
3.0
2.2
2.3
2.4
2.0
1.6
1.7
1.6
1.9
1.8
13.
2.5
2.0
2.4
2.2
3.0
2.5
2.7
2.2
1.7
2.0
1.7
1.5
1.7
14.
Os
4.5
3.8
4.9
5.4
6.0
5.5
6.0
6.3
6.7
6.0
6.0
4.8
4.1
15.
6.6
8.3
7.7
7.3
7.0
6.7
5.8
5.2
5.2
4.7
4.9
4.6
5.6
16.
16.3
17.4
16.6
16.3
16.6
16.3
15.8
14.3
13.0
13.0
11.8
11.3
11.5
17.
SouRcE:
Tabl
e 27
of K
iam
an,
The
Post
war
Ris
e of
Mor
tgag
e C
ompa
nies
.
1952
1953
1954
1955
Ass
ets
1. T
otal
ass
ets (
$m
illio
ns)
2. C
ash
(inc.
esc
row
s)3.
Mortgage and construction
loans,
tota
l4.
Mor
tgag
e lo
ans
5.C
onst
ruct
ion
loan
s6.
Not
es re
ceiv
able
7. A
ccou
nts r
ecei
vabl
e8.
Oth
er a
sset
s
Liab
ilitie
s and
Net
Wor
th9.
Tot
al li
abili
ties a
nd n
etw
orth
($m
illio
ns)
10.Escrows
11.
Not
es p
ayab
le, t
otal
12.
To banks
13.
To others
14.
Acc
ount
s pay
able
15. U
ndis
burs
ed m
ortg
age
loan
s16
. Oth
er li
abili
ties
17. N
et w
orth
POSTWAR RISE OF MORTGAGE COMPANIES
While the rates of change in mortgage company assets and mortgageinventories varied considerably between quarters, a rather definite seasonalpattern of operations is suggested by the data, with the rate of growth intotal assets, mortgage loans, and notes payable successively larger throughthe first three quarters of each year and declining in the fourth quarter(see Table 29 of Kiaman, The Postwar Rise of Mortgage Companies). Thesubstantially greater rate of increase in the third quarter of 1954 comparedwith the other years is a reflection of the abrupt change in capital marketsbetween mid-1953 and mid-1954, noted above. Further, the continuedlarge increase in the fourth quarter of 1954 was undoubtedly the result ofthe usually heavy buildup of commitments in earlier months of that year.
The peaking of growth in mortgage inventory in the third quarter ofeach year results from the nature of the relationship between mortgagecompanies and institutional investors and from the seasonal nature ofbuilding activity. Financial institutions, especially life insurance com-panies dealing regularly with mortgage companies, usually make theirallocations and commitments for mortgages early in each calendar year.Arrangements to finance residential construction and sales are then madeby mortgage companies. The houses and permanent mortgages are notcompleted or delivered until several months later. As mortgages are closedon houses finished and sold, the temporary mortgage inventories held bymortgage companies increase at an accelerating rate to a peak rate in thethird quarter. By the fourth quarter of the year, the rate of building andof completing new mortgages slows down, while mortgages already com-pleted and processed are taken up by permanent investors, with a resultingdecline or a slowing down in the rate of increase in mortgage companies'inventories. The close relationship between quarterly rates of growth inmortgage inventory and bank borrowing to finance such inventory isevident in Table 39.
There is little reason to expect any similarity of movement during theyear or a consistent relationship between total home mortgage debt andmortgage debt held by mortgage companies, and none seems to be indi-cated by a comparison of columns 1 and 2 of Table 40. Changes in totalhome mortgage debt reflect the combined actions of several different typesof institutions and of individuals acquiring mortgages generally for per-manent investment rather than short-term inventory. As market con-ditions changed, the quarterly peak rate of growth in total home mortgagedebt shifted from the second quarter in 1953 to the fourth quarter in 1954,and back to the second quarter in 1955; but this did not alter the seasonalpattern of mortgage companies' inventory holdings.
277

POSTWAR RISE OF MORTGAGE COMPANIES
There does, however, appear to be a definite complementary relation-ship between growth in mortgage company inventories and in mortgageholdings of life insurance companies, which predominate in purchases ofmortgage loans from mortgage companies. As indicated in columns 3 and4 of Table 40, the greatest increase in life insurance company mortgageholding occurs consistently in the fourth quarter of each year, reflectingchiefly acquisitions of VA-guaranteed mortgages. The clear implication
TABLE 40Percentage Changes in Mortgage Inventory of Mortgage Companies and
One- to Four-Family Mortgage Debt Outstanding, 1953—1955
End of
MortgageHoldings of
Mortgage
1- TO 4-FAMILY MOR TOAGE DEBT
Total Held by Ljfe Insurance CompaniesQuarter Companies
(1) (2)Total
(3)VA-guaranteed
(4)
1953 Mar. 31 —5.4 2.7 2,9 0.7June 30 3.1 3.7 2:9 0.9Sept. 30 5.7 3.3 2.8 1.6Dec. 31 —1.9 2.7 3.2 3.2
1954 Mar. 31 7.2 2.2 2.7 3.6June 30 6.5 3.4 3.3 5.5Sept. 30 19.5 4.0 3.5 7.8Dcc. 31 11.7 4.2 4.6 10.7
1955 Mar. 31 6.5 3.8 3.6 7.3June 30 10.5 4.7 3.5 6.3Sept. 30 13.5 4.1 3.5 5.2Dec. 31 0.7 3.3 5.4 9.0
SOURCE: Col. 1: From Kiaman, The Postwar Rise of Mortgage Companies, Table 29.Cols. 2, 3, and 4: Derived from quarterly figures shown in various issues of the Federal
Reserve Bulletin, for example, May 1956, pp. 490 and 491.
is that the rate of growth in mortgage company inventories declines sharplyin the fourth quarter of each year as life insurance companies increase therate of their acquisitions of mortgages, especially federally underwrittenmortgages, the chief market interest of mortgage companies.'7
Concluding CommentsThe modern mortgage company is a financial institution not quite like anyother on the American capital market scene. Its functions are similar, in
17 Figures on gross mortgage acquisitions by life insurance companies are, of course,a more direct measure of market activity but were not used in Table 40 because nocomparable quarterly figures exist for other institutions. Actually, examination of thegross acquisitions figures for the years 1953—1955 indicates that the largest volume ofmortgages was acquired by life insurance companies in the fourth quarter of each year,bearing out the above analysis based on net acquisitions data.
278
POSTWAR RISE OF MORTGAGE COMPANIES
a way, to those of municipal bond dealers and securities underwriters whoact as intermediaries between borrowers and lenders and carry temporaryinventories with the help of short-term bank credit. They are similar, inother ways, to those of sales finance companies that rely heavily on com-mercial bank and other external financing to extend consumer credit andcarry large inventories of net receivables. The mortgage company isunlike these institutions, however, in that it operates largely on the basisof prior commitments from financial intermediaries and originates loansprimarily to obtain accounts for servicing mortgages. It thus maintains aclose and continuing relationship with institutional investors that has nocounterpart among other types of institutions.
The study establishes that the remarkably rapid postwar growth ofmortgage companies has been associated with the introduction and expan-sion of federal mortgage insurance and guaranty programs. Betweenthree-fourths and nine-tenths of mortgage loans closed by mortgage com-panies in each of the years 1953 through 1955 were VA-guaranteed orFHA-insured. Clearly, the future pattern of mortgage company develop-ment and growth will depend heavily on the future course of these federalcredit aid programs. Efforts by mortgage companies to expand theirconventional loan business might be blunted by legal restrictions on out-of-state operations by financial intermediaries, by competition from locallenders traditionally engaged in this type of operation, and by numerousproblems in conducting a conventional loan business for investors at adistance and in attracting investors to it.
Among major types of financial intermediaries, only life insurance com-panies and mutual savings banks deal extensively with mortgage companies,and the banks are subject to geographic restrictions on their conventionalmortgage lending activities. The already great dependence of mortgagecompanies on life insurance companies, therefore, would undoubtedlyincrease with an increased proportion of conventional lending. It is unlikelythat mortgage companies could find increased outlets for conventional loansamong commercial banks and savings and loan associations, which typi-cally compete in origination of loans, instead of purchasing them frommortgage companies. In any case, savings and loan associations are alsosubject to geographic lending restrictions. Even among life insurance com-panies, many might be reluctant to expand their out-of-state conventionalmortgage investments materially because of the lack of uniformity in mort-gage contracts and in state statutes, the generally greater exposure to lossin case of default or foreclosure, and the need for closer examination andsupervision of properties pledged. On the other hand, the experience and
POSTWAR RISE OF MORTGAGE COMPANIES
techniques developed by mortgage bankers in the origination of federallyunderwritten mortgages may be successfully adapted to conventional mort-gage lending. A few mortgage companies already carry on a large volumeof conventional mortgage origination and servicing for investors. In thefinal analysis, any significant expansion of conventional mortgage businessby mortgage companies will depend on the ability and willingness ofinvestors to increase their activity in this area and of borrowers to adjustto the more restrictive conventional mortgage loan terms.
In any event, the likelihood that the role of the federal government inmortgage and housing markets will diminish significantly in the yearsahead is not very great. Recent counter-cyclical policy has relied heavilyon adjustments in federal housing and mortgage programs. Mortgageinsurance under FHA is among the earliest and most basic federal aids inthe field of real estate finance. It is now deeply entrenched in the Americanreal estate scene and is likely to continue as a basic part of domestic eco-nomic policy independent of political events.
The more recently introduced VA-guaranty program for veterans ofWorld War II has already been extended twice beyond its original expira-tion date of July 1957. When it may be allowed to terminate—if at all—will depend mainly upon prevailing economic and political conditions.Moreover, the Korean VA loan program is established until early 1965.Several million veterans remain eligible for loans under both programs.
While it is clear that the potential flow of mortgage funds under federallyunderwritten programs is large, it seems equally clear that this flow willcontinue to fluctuate widely so long as the federal government continuesits policy of maintaining relatively inflexible interest rates on VA and FHAmortgages. The postwar record plainly indicates that alternate shiftsbetween ease and stringency in Federal Reserve monetary policy and incapital market conditions have been accompanied by exaggerated swingsin federally underwritten mortgage flows. These swings have been coinci-dent with a widening and narrowing of the spread between relativelystringent interest rates of VA and FHA contracts and the flexible yields ofcorporate bonds. The flow of conventional mortgage funds, on the otherhand, has fluctuated only narrowly as private lenders have been free toadjust interest rates to changing financial conditions.
So long, therefore, as mortgage companies continue to concentrate theiractivities in federally sponsored mortgages, they will be particularly vul-nerable, compared with other types of financial institutions, to changingfinancial conditions and to unpredictable federal statutory and adminis-trative changes.
280