Embed Size (px)
Citation preview
i
The Possible Contribution of Photovoltaic Systems to the Electricity Supply in some
Districts in Palestine
Mohammed Mahmud Ehmidat
Supervisor Professor Hans Georg Beyer
This Master’s Thesis is carried out as a part of the education at the University of Agder and is therefore approved as a part of this education. However, this does not imply that the University answers for the methods that are used or the conclusions that are drawn.
University of Agder Faculty of Engineering and Science
Department of Engineering
2013
ii
Abstract
This thesis discusses the potential of solar energy to support and partly cover the energy demand in the medium voltage level electric supply grid in four cities in the West Bank, Palestine. The load profile for two days in the year (summer day and winter day) from four line sections (feeders) that feeds these districts in these cities has been taken from JEDCO. These cities are Ramallah, Jerusalem, Bethlehem and Jericho. This thesis provides information on the solar power profile such as solar flux, energy yield and performance ratio on fixed tilted surface and different orientations. Different tools (applied here are the PVGIS data base and the WetSyn scheme) have been used to set up a data base for the meteorological input data for the estimation of the profile of output power of the PV system for the selected districts. The method that has been used to model the output power of a 2 kWP generator shows that this PV system can produce an average yield of 1902 kWh/kWp with horizontal orientation and 2009 kWh/kWp with an 18 degree tilt.
A MW-size grid-connected system has been designed to cover the load in each selected district, where the percentages of the penetration levels for a MW PV system on distribution feeders at peak load in the summer day are 18.2, 8, 6.9, and 7 for the districts Ramallah, Jerusalem, Bethlehem and Jericho respectively. While in the winter day the values are 13, 14.6, 5.93 and 9.8 for the same districts respectively. The system has been designed for two cases according to the land area available in these cities, where the land area that is needed is 17 500 for Case1 and 3500 for each subsystem in Case 2 and the expected energy gain is between 1980 – 2153 MWh/year. For this capacity value of PV system a total investment between 3500000 - 3820000 US$ is required depending on the location and the installation type. Cost analysis for a 200 kW ground mounted grid-connected PV system with subsidy to initial investment of 64 % shows that the investment period payback is about 9 years with annual saving 45000 US$.

iii
Acknowledgments The Author of this thesis is deeply grateful to supervisor prof. Hans Beyer for his guidance along the way of this work. The author also would like to thank study program coordinator Stein Bergsmark for his useful notes in writing of this thesis. I also would like to thank all who send me the information that I needed to write this thesis. Finally, I would like to thank my parents and my wife Fatma for their support.
iv
CONTENTS
Abstract
ii
Acknowledgements
iii
Contents
iv
List of Figures
vii
List of Tables
ix
Abbreviations
x
Nomenclature
xi
1 INTRODUCTION 1
1.1 Background and Motivation
1
1.2 Research Objectives
3
1.3 Thesis Outline
3
2 PROFILE OF THE ENERGY USE IN PALESTINE 6
2.1 Introduction
6
2.2 Palestine Country Overview
7
2.3 Current Energy Situation in Palestine
9
2.3.1 Electricity Production
10
2.3.2 Electricity Consumption
11
2.3.3 Electricity Consumption by the Non-Residential Sectors
12
2.3.4 Electricity Daily Load in WB
13
2.3.5 Peak and Electricity Demand
13
2.3.6 Electricity Prices
14
2.4 The Structure of the Electricity Supply in Palestine
15
2.5 Status and Prospects of Renewable Energy in Palestine
15
2.5.1 Status of Renewable Energy in Palestine
15
2.5.2 Prospective of Renewable Energy in Palestine
18
2.6 Recommended Solar PV application in Palestine
18
2.7 Summary
19
v
3 PHOTOVOLTAIC SYSTEM 20
3.1 Introduction
20
3.2 The Photovoltaic Cell
20
3.2.1 Type of Cell
20
3.2.2 Semiconductor
21
3.2.3 The Concept of Cells
22
3.2.4 Principle of Operation of Solar Cells
23
3.2.5 Spectral Sensitivity of Solar Cell
23
3.2.6 PV Cell Characteristic and I–V Curves
24
3.3 The Photovoltaic Module
26
3.3.1 Performance Analysis of Photovoltaic Modules
28
3.3.2 Efficiency Characteristics of the PV Cell and PV module
29
3.3.3 Standard Test Conditions
30
3.4 PV Arrays
31
3.5 The Power Conditioning Unit
32
3.6 Connection Topologies of PV Systems
33
3.7 Grid-Connected Systems
34
3.8 Summary
35
4 SYSTEM MODEL AND EVALUATION METHOD 36
4.1 Introduction
36
4.2 Modeling Solar Irradiation Data
36
4.3 Data Sources
36
4.4 Estimation of Hourly Solar Flux on Inclined Surfaces
38
4.4.1 Definitions
38
4.4.2 Ground Reflection
43
4.5 Modeling Solar Irradiation Data in the locations
43
4.5.1 Resulting Sets for the Fourth Locations
44
4.6 Optimum Angel of Inclination Calculation
46
4.7 Modeling the Output Power of a Photovoltaic System
47
4.7.1 Calculation of the DC Output Power of the PV Generator
47
4.7.2 Calculation of the AC Output Power of the PV Generator
50
4.8 Summary
52
5 PV- NETWORK MATCHING 53
5.1 Introduction
53
5.2 PV output
53
vi
5.2.1 PV output for the Selected Days
53
5.2.2 Monthly PV-Yield in Dependence of PV Module Tilt
55
5.2.3 Annual Energy Gain of the PV Generator
56
5.2.4 Performance Ratio
57
5.3 Load Profile
58
5.3.1 Summer to Winter Peak – Load Ratio
60
5.4 Summary
61
6 DESIGN OF GRID - CONNECTED PV SYSTEM 62
6.1 Introduction
62
6.2 Requirements Grid Interconnection
63
6.3 Design of Larger Grid-Connected with
65
6.3.1 Components of Grid-Connected PV Systems
65
6.3.2 Power Conditioning Units
66
6.3.3 Centralized Topology
67
6.3.4 Configuration of the PV array
68
6.3.5 Requirements for Land Area
69
6.3.6 Transformer
70
6.3.7 Grid – Connected System Sizing Summary
71
6.3 Expected Annual Energy Gain of the Grid-Connected System
71
6.4 PV Penetration Level
72
6.5 Cost
72 6.6 Summary
76
7 CONCLUSION AND FURTHER WORK 77
8 BIBLIOGRAPHY 78
9 APPENDICES 82
vii
List of Figures
1.1 World energy consumption, 1990-2035 1 1.2 Global carbon dioxide emissions from fossil-fuels between 1990 – 2008 2
1.3 Average system price (Residential, non-residential and utility) 3
1.4 Overview of the work organization of the different tools 5
2.1 Palestinian loss of land 1946 – 2005 7
2.2 Map over the West Bank and Gaza 8
2.3 Primary energy sources in Palestine, 2011 9
2.4 Breakdown of fossil fuels imports in Palestine, 2011 9
2.5 Breakdown of renewable energy sources in Palestine, 2011 10
2.6 Quantity and country of electricity purchases in the Palestinian Territory, 2011 10
2.7 Electricity consumption in the PT (GWh):2007-2011 11
2.8 Breakdown of energy consumption in Middle East, 2005 12
2.9 Electrical consumption per capita (MWh) 12
2.10 Electricity daily load curve in WB 13
2.11 Evolution of the peak demand in the Palestinian Territories from 1995 to 2015 14
2.12 Average electricity prices (cents of dollars): 2010-2013 15
2.13 Monthly averages of daily radiation sums in different cities in Palestine 16
2.14 Monthly average wind velocity in different cities in Palestine 17
3.1 PV Technology Classes 21
3.2 Schematic of the energy bands for electrons in a solid 21
3.3 Doping of silicone with :a) Pentavalent atom b) Trivalent atom 22
3.4 Functional principle of photovoltaic 23
3.5 Spectral sensitivity of different solar cell types 24
3.6 I-V Curve and simplified equivalent circuit model for a photovoltaic cell 25
3.7 I-V curve for a PV cell 26
3.8 Structure of a PV module with 36 cells connected in series 27
3.9 Connection of identical PV cells 27
3.10 Influence of irradiation on PV cell characteristic 28
3.11 Influence of temperature on PV cell characteristic 29
3.12 Efficiency characteristics of a module 30
3.13 PV cells are combined to create PV modules which are linked to create PV arrays 31
3.14 Layout of a PV array 32
3.15 Some common PV systems topologies according to the connection of 33
the PV modules with the PCU
3.16 Schematic diagram of a Grid-connected system 34
viii
4.1 Web application to estimate the irradiation included in PVGIS web site 37
4.2 Fraction of global radiation on the ground as received by a tilted plane 38
4.3 Solar position viewed from a point P on the earth's surface 40
4.4 Definition of latitude, hour angle, zenith angle and solar 40
4.5 Beam radiation on horizontal and tilted surface 41 4.6 Topography map of Palestine 44
4.7 Global solar irradiance in the location of Ramallah 45
4.8 Optimum angle calculation 46
4.9 Typical representation of an I-V curve 47
4.10 Manufacturer’s efficiency curve for Q.PEAK S 200 solar module 49
4.11 Manufacturer’s efficiency curve for the inverter 51
5.1 Daily generation profile of a fixed tilt (18°) 2 kW PV-generator for Ramallah distracts 54
5.2 Daily generation profile of a fixed tilt (18°) 2 kW PV-generator for Bethlehem distracts 54
5.3 Daily generation profile of a fixed tilt (18°) 2 kW PV-generator for Jerusalem distracts 54
5.4 Daily generation profile of a fixed tilt (18°) 2 kW PV-generator for Jericho distracts 55
5.5 Effect of module orientation on monthly gain 55
5.6 Monthly energy gain of a 2 kWp-generators for different location and with horizontal 56
5.7 Monthly energy gain of a 2 kWp-generator for different location and
with 18 degree orientations 56
5.8 Hourly power demand at medium voltage level for Ramallah district 58
5.9 Hourly power demand at medium voltage level for Bethlehem district 59
5.10 Hourly power demand at medium voltage level for Jerusalem district 59
5.11 Hourly power demand at medium voltage level for Jericho district 59
6.1 Main components of grid-connected photovoltaic systems 66
6.2 Electric scheme of a configuration for the system 69
6.3 Grid connected pre-feasibility analysis 75
ix
List of Tables
2.1 The west Bank and Gaza in numbers
8
2.2 Main indicators of household energy use in the PT
11
2.3 Peak and electricity demand in WB & GS
14
2.4 RE potential in Palestine
18
3.1 Characteristics of various PV technologies
21
4.1 Albedo values for different environments
43 4.2 Locations description
43
4.3 The global solar radiation in different location during the day of 17.June
45 4.4 The global solar irradiation in different location during the day of 17.January 46 4.5 Solar module parameters
49
4.6 Parameter c in dependence of the system’s assembly
50
4.7 Inverter’s data sheet efficiency curve parameters
51
4.8 Inverter parameter
51
5.1 Annual irradiation at different location for different orientations (kW/ ) 57
5.2 Output of a 2kWp PV- generator (kWh/year)
57
5.3 Performance ratio for different region and orientation of a 2kWp – generator 58
5.4 Summer to winter peak ratio
60
6.1 IEC standers for PV system
63
6.2 Voltage operating range
64
6.3 Harmonic current limits
65
6.4 Power factor limits
65
6.5 Inverters specification
67
6.6 Solar module specification at STC
68
6.7 Modules arrangement in the system
69
6.8 Main electrical characteristics in STC of the PV generator in case 1 and case 2 69
6.9 Required surface area for a 1-kWp
70
6.10 Transformer specification
71
6.11 System sizing summary
71
6.12 Expected energy gain of ~ 1MWp generator with panel’s orientation 71
6.13 Penetration levels (%) on distribution feeders for 1MWp PV system at the Peak load 72
6.14 The mean elements cost of Grid - connected system
73
6.15 LCOE result of PV grid connected
75
x
Abbreviations
ANNU = An-Najah National University CM-SAF = The Satellite Application Facility on Climate Monitoring. CIA = Central Intelligence Agency EIA = U.S Energy Information Administration EPA = U.S Environmental Protection Agency GS = Gaza Strip IEC = Israel Electric Company IEC = International Electrotechnical Commission JEDCO = Jerusalem District Electricity Company LCOE = Levelized Cost of Electricity LPG = liquid petroleum gas MV = medium voltage MENA = Mediterranean and North Africa ME = Middle East MEDA = The Euro-Mediterranean Partnership PA = Palestine Authority PT = Palestinian Territories PEA = The Palestinian Energy Authority PEC = The Palestinian Energy & Environment Research Centre PCBS = The Palestinian Central Bureau of Statistics PENERA = Palestinian energy and natural reassures authority PCU = power condtion unit PV = Photovoltaic PVGIS = PV-Geographical information System RE = renewable energy SEIA = Solar Energy Industrial Association STC = standard testing conditions WB = West Bank
xi
Nomenclature
AM = air mass A = area AC = alternating current °C = degree celsius DC = direct current E = east eV = electron - volt = photon energy = gab energy
G = Irradiance W/ = Direct normal irradiance on horizontal surface = Diffuse solar distributed on a horizontal surface = Global solar irradiance on horizontal surface = Direct irradiance from the sun on a surface = Beam irradiance on a tilted surface = Diffuse irradiance on a tilted surface = Ground-reflected irradiance on a tilted surface = Global solar irradiance on tilted surface GWh = Giga Watt hour GW = Giga Watt h = time of the day (solar time) in hours I = current J/K = joul per kilven = kilometer square Kw = kilowatt hour kWh/ = kilowatt hour per meter square KVA = kilovolt-amps KV = kilovolt kWp = kilowatt peak kWh/year = kilowatt hour per year MWp = Megawatt peak MPP = maximum power point MW = megawatt [W = J/s] m/s = meter per second n = The day of the year N = North Nm = nanometer P = power = power at MPP PR = performance ratio

xii
= The hourly geometric factor and the term SWP = summer to winter Peak - load = local latitude T = temperture TWh = Terra Watt hour TJ = Terra Joule THD = total harmonic distortion w = hour angle W = watt W/m² = watt per meter square Wp = watt peak Watt hour per meter square V = voltage Z = solar azimuth angle
Greek letters
= efficiency = efficiency at MPP
= solar altitude = temperature coefficient = zenith angle = declination = incidence Angle = declination = ground reflectance ‘’albedo’’
= the angle the surface makes with the horizontal
Chapter 1 Introduction
1
1 Introduction
This chapter gives the motivations for using the renewable energy, the objectives of the research and describes the organization of the thesis. 1.1 Background and Motivation
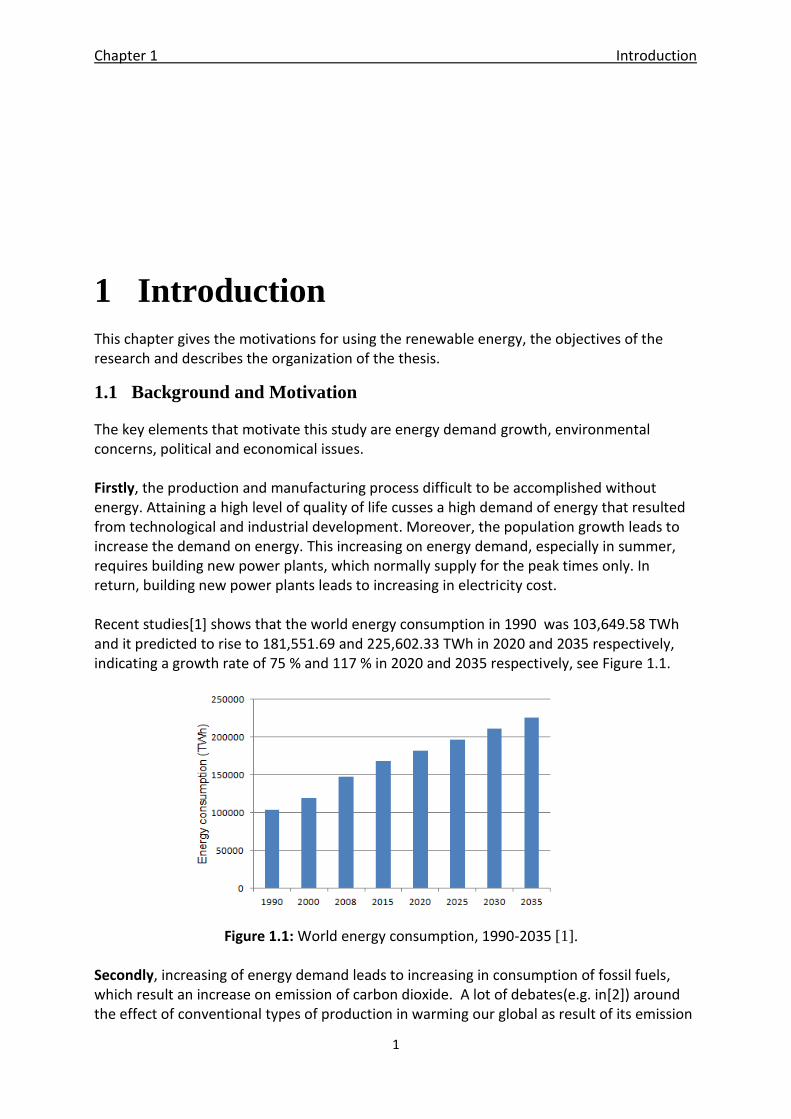
The key elements that motivate this study are energy demand growth, environmental concerns, political and economical issues. Firstly, the production and manufacturing process difficult to be accomplished without energy. Attaining a high level of quality of life cusses a high demand of energy that resulted from technological and industrial development. Moreover, the population growth leads to increase the demand on energy. This increasing on energy demand, especially in summer, requires building new power plants, which normally supply for the peak times only. In return, building new power plants leads to increasing in electricity cost. Recent studies[1] shows that the world energy consumption in 1990 was 103,649.58 TWh and it predicted to rise to 181,551.69 and 225,602.33 TWh in 2020 and 2035 respectively, indicating a growth rate of 75 % and 117 % in 2020 and 2035 respectively, see Figure 1.1. Figure 1.1: World energy consumption, 1990-2035 [1]. Secondly, increasing of energy demand leads to increasing in consumption of fossil fuels, which result an increase on emission of carbon dioxide. A lot of debates(e.g. in[2]) around the effect of conventional types of production in warming our global as result of its emission
Chapter 1 Introduction
2
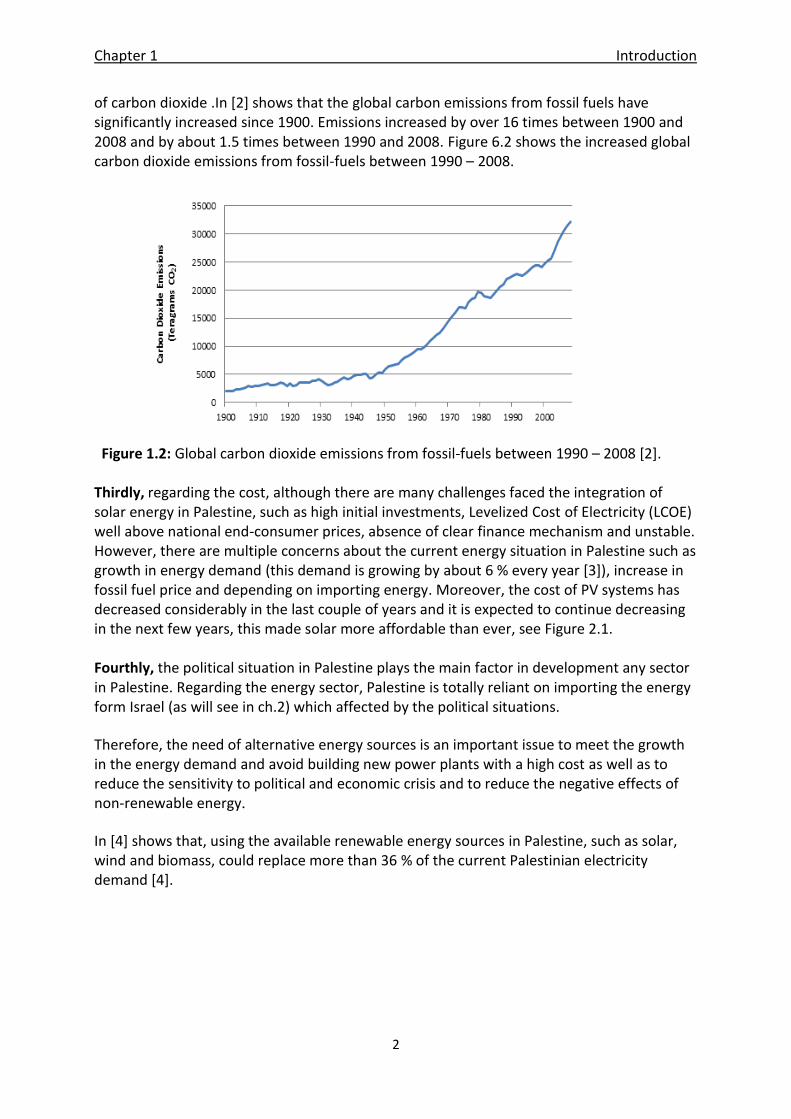
of carbon dioxide .In [2] shows that the global carbon emissions from fossil fuels have significantly increased since 1900. Emissions increased by over 16 times between 1900 and 2008 and by about 1.5 times between 1990 and 2008. Figure 6.2 shows the increased global carbon dioxide emissions from fossil-fuels between 1990 – 2008. Figure 1.2: Global carbon dioxide emissions from fossil-fuels between 1990 – 2008 [2]. Thirdly, regarding the cost, although there are many challenges faced the integration of solar energy in Palestine, such as high initial investments, Levelized Cost of Electricity (LCOE) well above national end-consumer prices, absence of clear finance mechanism and unstable. However, there are multiple concerns about the current energy situation in Palestine such as growth in energy demand (this demand is growing by about 6 % every year [3]), increase in fossil fuel price and depending on importing energy. Moreover, the cost of PV systems has decreased considerably in the last couple of years and it is expected to continue decreasing in the next few years, this made solar more affordable than ever, see Figure 2.1. Fourthly, the political situation in Palestine plays the main factor in development any sector in Palestine. Regarding the energy sector, Palestine is totally reliant on importing the energy form Israel (as will see in ch.2) which affected by the political situations.
Therefore, the need of alternative energy sources is an important issue to meet the growth in the energy demand and avoid building new power plants with a high cost as well as to reduce the sensitivity to political and economic crisis and to reduce the negative effects of non-renewable energy.
In [4] shows that, using the available renewable energy sources in Palestine, such as solar, wind and biomass, could replace more than 36 % of the current Palestinian electricity demand [4].
Chapter 1 Introduction
3
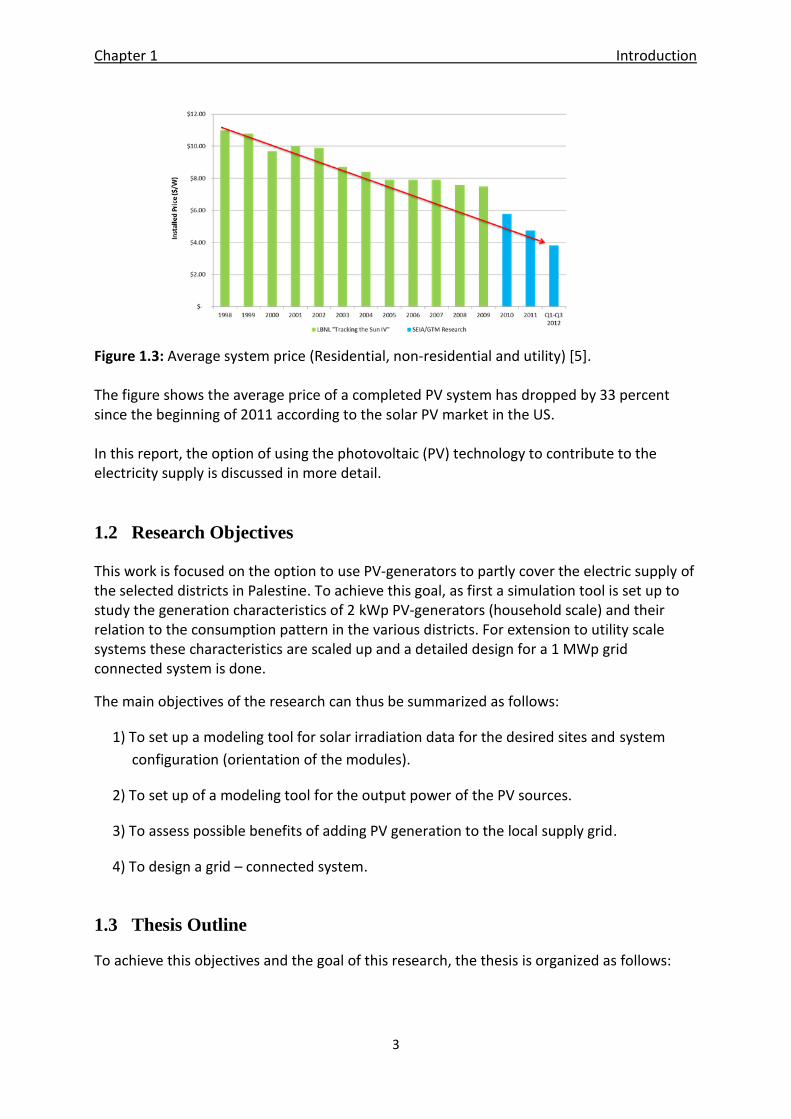
Figure 1.3: Average system price (Residential, non-residential and utility) [5]. The figure shows the average price of a completed PV system has dropped by 33 percent since the beginning of 2011 according to the solar PV market in the US. In this report, the option of using the photovoltaic (PV) technology to contribute to the electricity supply is discussed in more detail.
1.2 Research Objectives
This work is focused on the option to use PV-generators to partly cover the electric supply of the selected districts in Palestine. To achieve this goal, as first a simulation tool is set up to study the generation characteristics of 2 kWp PV-generators (household scale) and their relation to the consumption pattern in the various districts. For extension to utility scale systems these characteristics are scaled up and a detailed design for a 1 MWp grid connected system is done.
The main objectives of the research can thus be summarized as follows:
1) To set up a modeling tool for solar irradiation data for the desired sites and system
configuration (orientation of the modules).
2) To set up of a modeling tool for the output power of the PV sources.
3) To assess possible benefits of adding PV generation to the local supply grid.
4) To design a grid – connected system.
1.3 Thesis Outline
To achieve this objectives and the goal of this research, the thesis is organized as follows:
Chapter 1 Introduction
4
Chapter 2 provides an overview on the energy profile in Palestine. This chapter shows the problems that faces the energy sector in Palestine, makes a review of the current energy situation and it also reviews the statues of renewable energy and it is potential to solve the problems that facing the energy sector.
Chapter 3 provides a general overview on the photovoltaic system which reviews the basic operation of the PV-Cell and the performance analysis of PV- module. This chapter discus the power conditioning unit and it is connection topologies with PV-modules. This chapter looks also at components of the grid-connected system from the solar irradiance received by the PV arrays to the AC power injected into the grid.
Chapter 4 discusses the modeling tools for solar irradiation of the selected locations in Palestine and the method that used to model the output power of the PV generator. It also describes these locations. This chapter also makes a review of the theories beyond the estimation of the solar flux on inclined surfaces and the way that uses to find out the optimum inclination.
Chapter 5 compares the solar electricity profile that resulted from chapter 4 with the power demand of the electrical grid in the selected locations and it disuses on the option to use PV-generators to partly cover the load of the electric supply grid. Chapter 6 focuses on design grid-connected PV system of up to approximately 1MW rated power for two case studies. This chapter presents the specifications of each component of the system and provides an overview on the initial cost investment of the system.
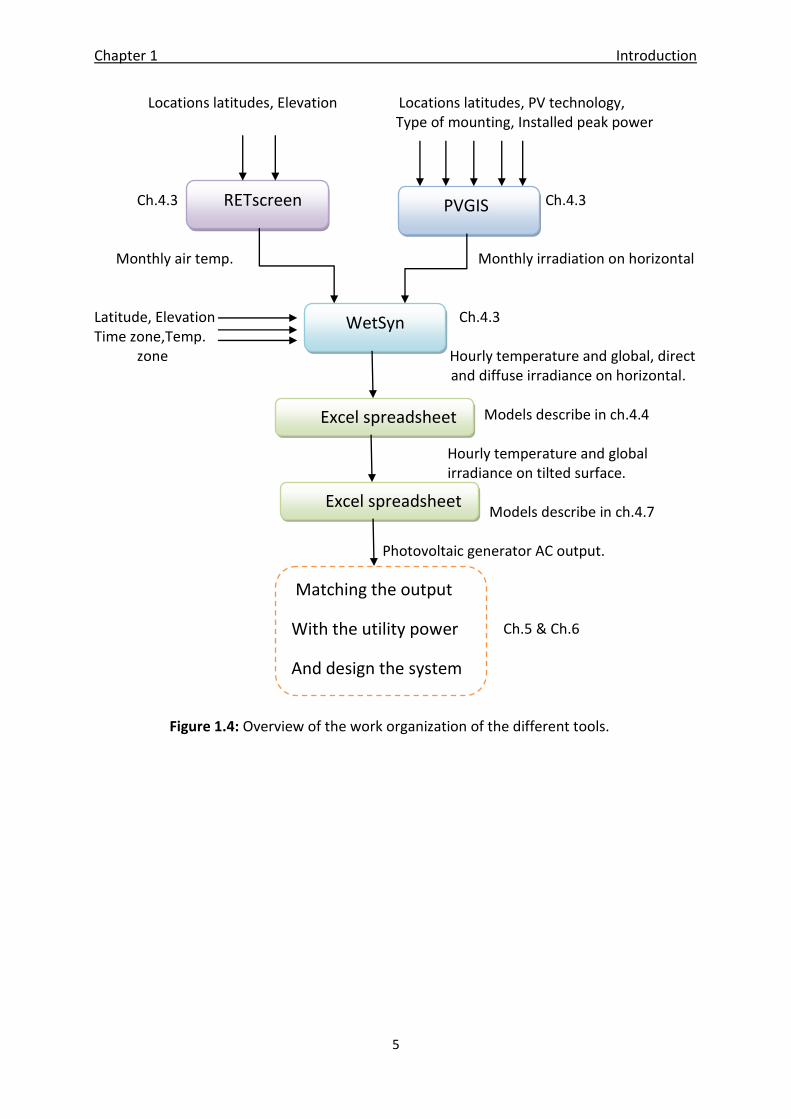
In the last chapter, Chapter 7, conclusions of the thesis are presented. Moreover, this chapter presented some suggestions of topics for future studies. Figure 1.4 gives a graphical presentation the link between the different topics of this thesis.
Chapter 1 Introduction
5
Locations latitudes, Elevation Locations latitudes, PV technology, Type of mounting, Installed peak power
Ch.4.3 Ch.4.3
Monthly air temp. Monthly irradiation on horizontal
Latitude, Elevation Ch.4.3 Time zone,Temp.
zone Hourly temperature and global, direct and diffuse irradiance on horizontal.
Models describe in ch.4.4 Hourly temperature and global irradiance on tilted surface. Models describe in ch.4.7 Photovoltaic generator AC output. Ch.5 & Ch.6 Figure 1.4: Overview of the work organization of the different tools.
PVGIS RETscreen
WetSyn
Excel spreadsheet
Excel spreadsheet
Matching the output
With the utility power
And design the system
Chapter 3 Photovoltaic System
6
2 Profile of the Energy use in Palestine
This chapter gives an overview on the energy sources used in Palestine and shows the potential of using renewable energy.
2.1 Introduction
Palestine’s electricity sector heavily dependent on energy imports from Israeli companies. Almost all petroleum products are imported through Israeli companies, where 100 % of the fossil fuels and 86 % of electricity supply come from Israel, which leads to increase the demand in both countries [6] .The Israel Electric Company (IEC), controls the supply of conventional energy (electricity), which means control the price and the quantity of the energy which are supplied [7]. The total energy consumption in the Palestinian Territories (PT) is the lowest per capita in the region (see Figure 2.9) as well as the breakdown of final energy consumption ( see Figure 2.8) and the consumption tariff is higher than anywhere else in the Middle East (ME) (see Figure 2.12) [6]. According to [8], the energy sector in Palestine (mainly fuel and electricity) cost about 374 million US$ in 2009. In Palestine about 10 % of the average household income spends on electricity which is much higher than the 2 % of neighboring countries like Jordan, Lebanon and Syria [8].
Palestine’s energy sector faces many obstacles due to the natural and political characteristics of the PT and due to the small geographic area. Besides that, parts of the land are separated from each other (Gaza Strip (GS), West Bank (WB) and East Jerusalem). Moreover, Israel imposed a blockade on Gaza since 2006, which impact on all walks of life, including the energy sector [6]. PT is almost devoid of natural fossil resources [7]. Moreover, using the fossil fuels would not be a better option because of its immediate and long term effect on environment due to carbon emission that leads to warms our global. In these situations, going toward renewable energy technologies as solar thermal and solar photovoltaic forms a solution for the Palestinians, especially as Palestine receives a large amount of solar radiation every year [9]. Small- and large-scale renewable energy systems have the potential to meet the growing energy demand in various parts of the PT.
Chapter 3 Photovoltaic System
7
This chapter shows that the main renewable energy sources in Palestine are solar, wind biomass and geothermal. The use of these energy sources can reduce the dependence of the Palestinian energy sector on energy imports and improve the access of Palestinians population to energy. Recent studies [4, 7] shows that the different energy sources have the potential to replace more than 36 % of the current Palestinian electricity demand as stated in ch.1, among these sources, the solar source have the potential to meet 13 % of the electricity demand.
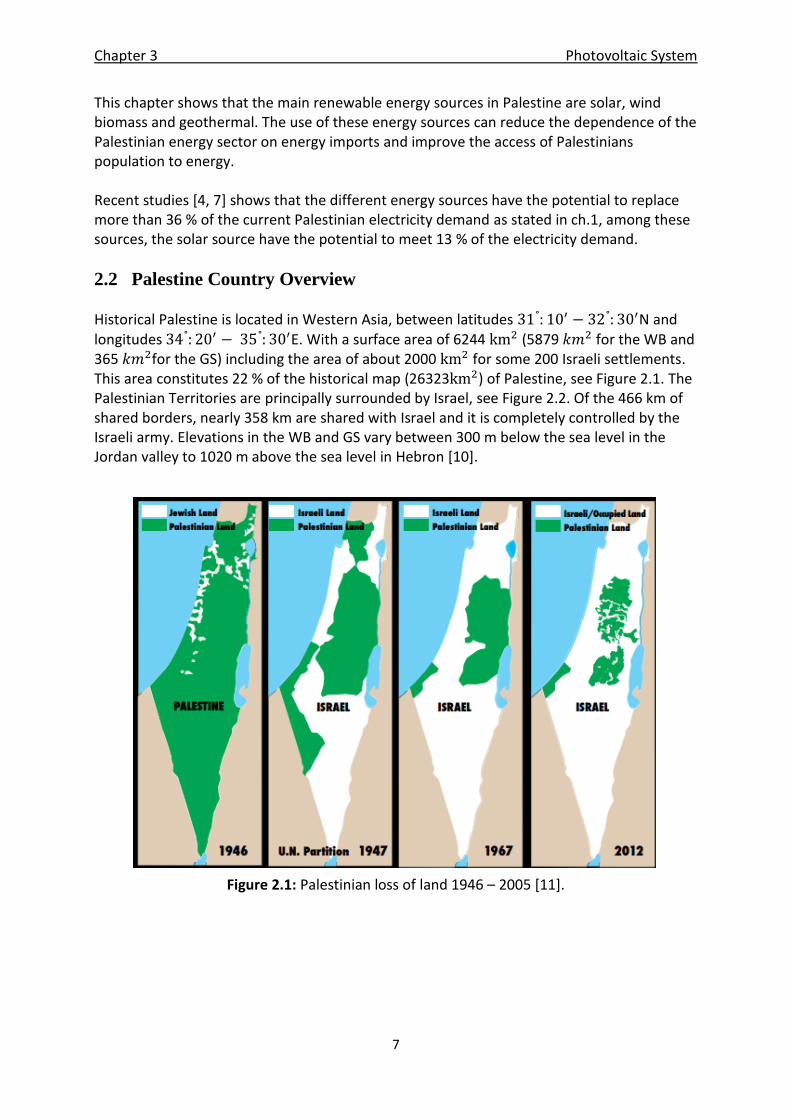
2.2 Palestine Country Overview Historical Palestine is located in Western Asia, between latitudes N and longitudes E. With a surface area of 6244 (5879 for the WB and 365 for the GS) including the area of about 2000 for some 200 Israeli settlements. This area constitutes 22 % of the historical map (26323 ) of Palestine, see Figure 2.1. The Palestinian Territories are principally surrounded by Israel, see Figure 2.2. Of the 466 km of shared borders, nearly 358 km are shared with Israel and it is completely controlled by the Israeli army. Elevations in the WB and GS vary between 300 m below the sea level in the Jordan valley to 1020 m above the sea level in Hebron [10].
Figure 2.1: Palestinian loss of land 1946 – 2005 [11].
Chapter 3 Photovoltaic System
8
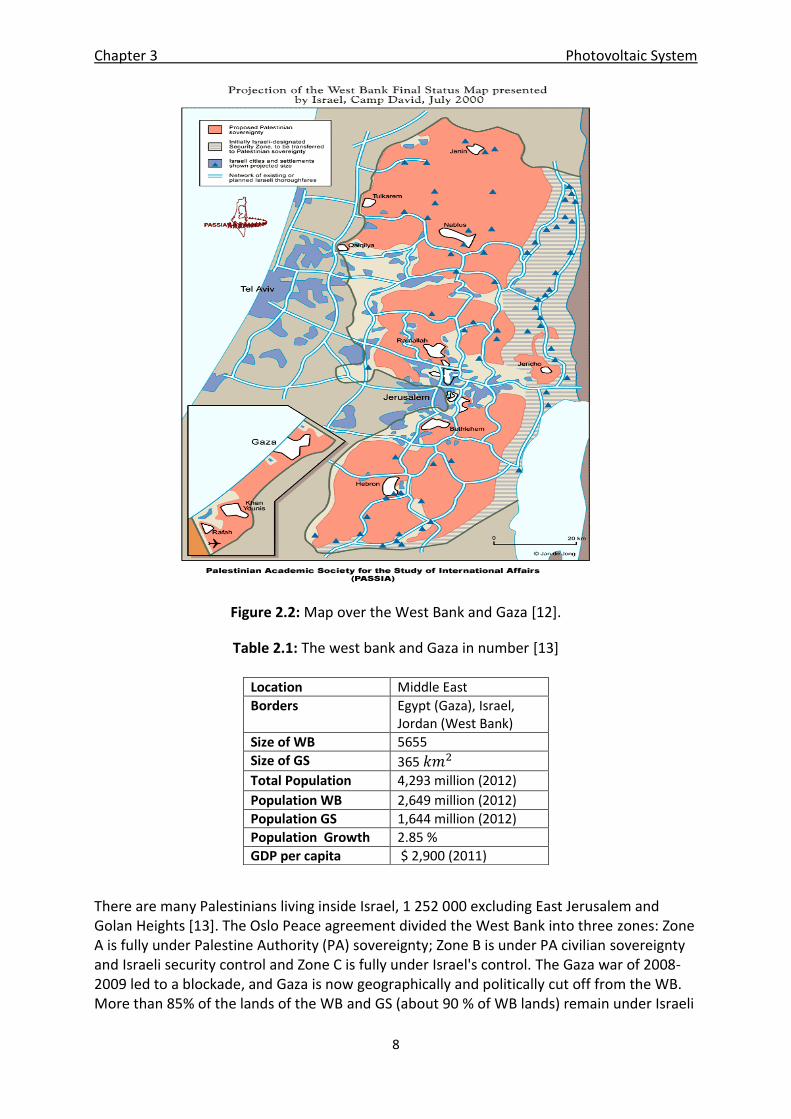
Figure 2.2: Map over the West Bank and Gaza [12].
Table 2.1: The west bank and Gaza in number [13]
There are many Palestinians living inside Israel, 1 252 000 excluding East Jerusalem and Golan Heights [13]. The Oslo Peace agreement divided the West Bank into three zones: Zone A is fully under Palestine Authority (PA) sovereignty; Zone B is under PA civilian sovereignty and Israeli security control and Zone C is fully under Israel's control. The Gaza war of 2008-2009 led to a blockade, and Gaza is now geographically and politically cut off from the WB. More than 85% of the lands of the WB and GS (about 90 % of WB lands) remain under Israeli
Location Middle East
Borders Egypt (Gaza), Israel, Jordan (West Bank)
Size of WB 5655
Size of GS 365
Total Population 4,293 million (2012)
Population WB 2,649 million (2012)
Population GS 1,644 million (2012)
Population Growth 2.85 %
GDP per capita $ 2,900 (2011)
Chapter 3 Photovoltaic System
9
control, and Israel continues to separate the two regions from each other while closing off Jerusalem to both regions. Moreover, Israel has built the apartheid wall in Palestine which is 400 miles long and it separates the land of the WB and included of 50 % of Palestinian land. This gives Israel the ability to control natural resources, including water and natural reserves, which maintains the dependency of the Palestinian economy on the Israeli economy, and prevents the development of an independent Palestinian economy [7, 14].
2.3 Current Energy Situation in Palestine
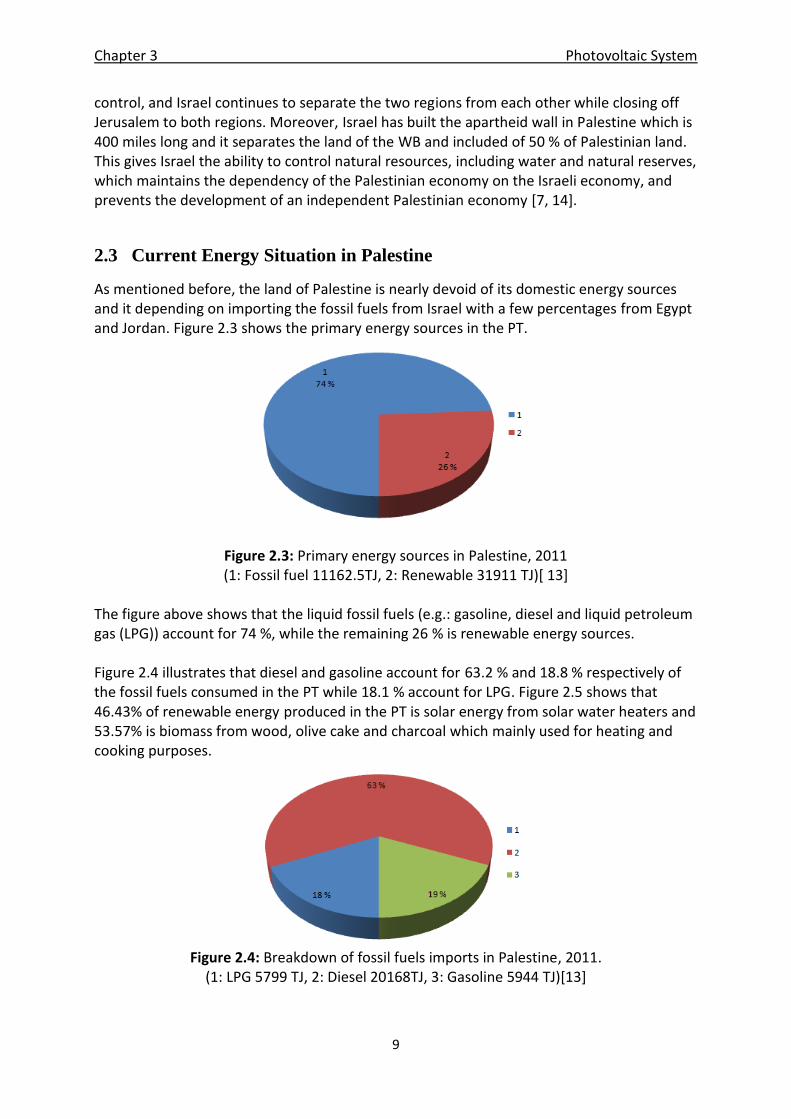
As mentioned before, the land of Palestine is nearly devoid of its domestic energy sources and it depending on importing the fossil fuels from Israel with a few percentages from Egypt and Jordan. Figure 2.3 shows the primary energy sources in the PT.
Figure 2.3: Primary energy sources in Palestine, 2011 (1: Fossil fuel 11162.5TJ, 2: Renewable 31911 TJ)[ 13]
The figure above shows that the liquid fossil fuels (e.g.: gasoline, diesel and liquid petroleum gas (LPG)) account for 74 %, while the remaining 26 % is renewable energy sources. Figure 2.4 illustrates that diesel and gasoline account for 63.2 % and 18.8 % respectively of the fossil fuels consumed in the PT while 18.1 % account for LPG. Figure 2.5 shows that 46.43% of renewable energy produced in the PT is solar energy from solar water heaters and 53.57% is biomass from wood, olive cake and charcoal which mainly used for heating and cooking purposes.
Figure 2.4: Breakdown of fossil fuels imports in Palestine, 2011. (1: LPG 5799 TJ, 2: Diesel 20168TJ, 3: Gasoline 5944 TJ)[13]
Chapter 3 Photovoltaic System
10
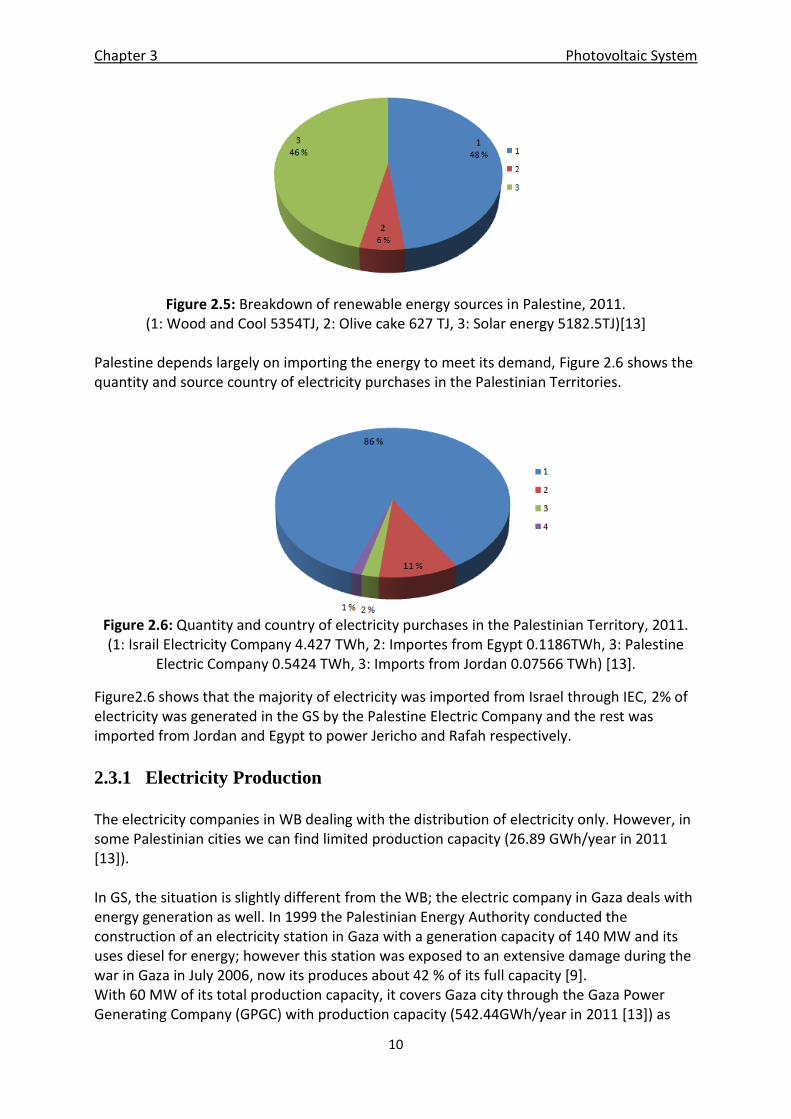
Figure 2.5: Breakdown of renewable energy sources in Palestine, 2011. (1: Wood and Cool 5354TJ, 2: Olive cake 627 TJ, 3: Solar energy 5182.5TJ)[13]
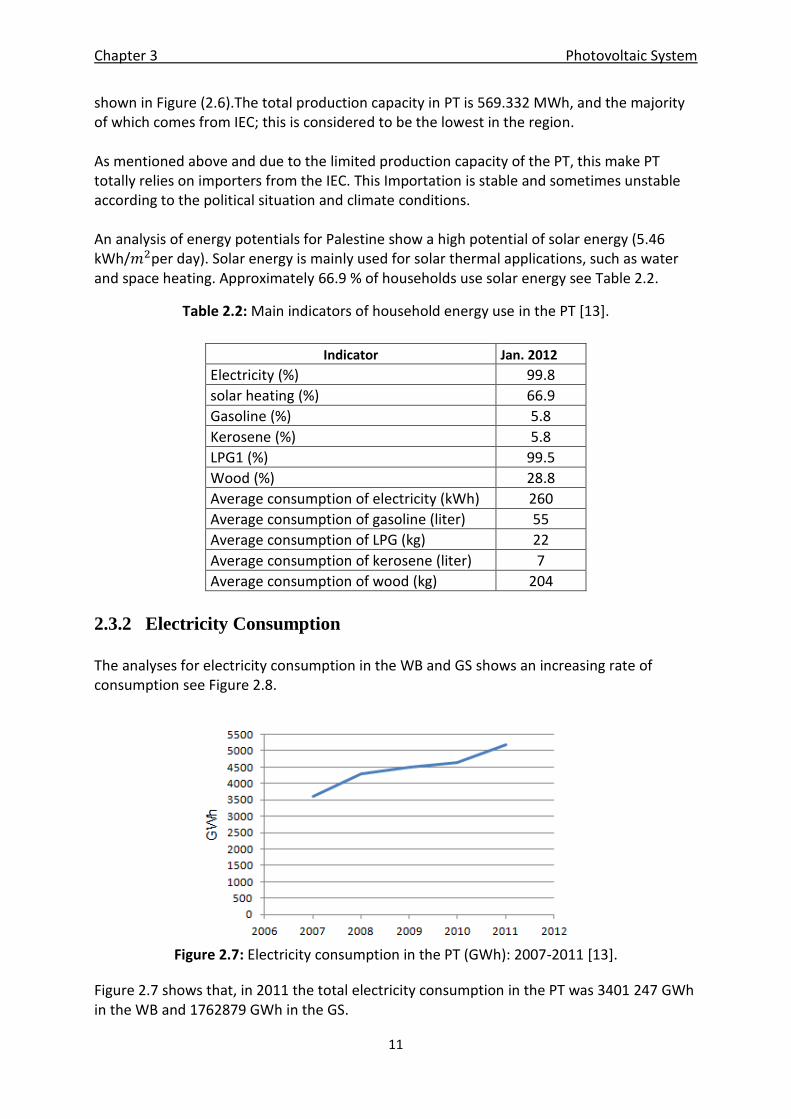
Palestine depends largely on importing the energy to meet its demand, Figure 2.6 shows the quantity and source country of electricity purchases in the Palestinian Territories.
Figure 2.6: Quantity and country of electricity purchases in the Palestinian Territory, 2011. (1: Israil Electricity Company 4.427 TWh, 2: Importes from Egypt 0.1186TWh, 3: Palestine
Electric Company 0.5424 TWh, 3: Imports from Jordan 0.07566 TWh) [13].
Figure2.6 shows that the majority of electricity was imported from Israel through IEC, 2% of electricity was generated in the GS by the Palestine Electric Company and the rest was imported from Jordan and Egypt to power Jericho and Rafah respectively.
2.3.1 Electricity Production
The electricity companies in WB dealing with the distribution of electricity only. However, in some Palestinian cities we can find limited production capacity (26.89 GWh/year in 2011 [13]). In GS, the situation is slightly different from the WB; the electric company in Gaza deals with energy generation as well. In 1999 the Palestinian Energy Authority conducted the construction of an electricity station in Gaza with a generation capacity of 140 MW and its uses diesel for energy; however this station was exposed to an extensive damage during the war in Gaza in July 2006, now its produces about 42 % of its full capacity [9]. With 60 MW of its total production capacity, it covers Gaza city through the Gaza Power Generating Company (GPGC) with production capacity (542.44GWh/year in 2011 [13]) as
Chapter 3 Photovoltaic System
11
shown in Figure (2.6).The total production capacity in PT is 569.332 MWh, and the majority of which comes from IEC; this is considered to be the lowest in the region. As mentioned above and due to the limited production capacity of the PT, this make PT totally relies on importers from the IEC. This Importation is stable and sometimes unstable according to the political situation and climate conditions. An analysis of energy potentials for Palestine show a high potential of solar energy (5.46 kWh/ per day). Solar energy is mainly used for solar thermal applications, such as water and space heating. Approximately 66.9 % of households use solar energy see Table 2.2.
Table 2.2: Main indicators of household energy use in the PT [13].
Indicator Jan. 2012
Electricity (%) 99.8
solar heating (%) 66.9
Gasoline (%) 5.8
Kerosene (%) 5.8
LPG1 (%) 99.5
Wood (%) 28.8
Average consumption of electricity (kWh) 260
Average consumption of gasoline (liter) 55
Average consumption of LPG (kg) 22
Average consumption of kerosene (liter) 7
Average consumption of wood (kg) 204
2.3.2 Electricity Consumption
The analyses for electricity consumption in the WB and GS shows an increasing rate of consumption see Figure 2.8.
Figure 2.7: Electricity consumption in the PT (GWh): 2007-2011 [13].
Figure 2.7 shows that, in 2011 the total electricity consumption in the PT was 3401 247 GWh in the WB and 1762879 GWh in the GS.
Chapter 3 Photovoltaic System
12
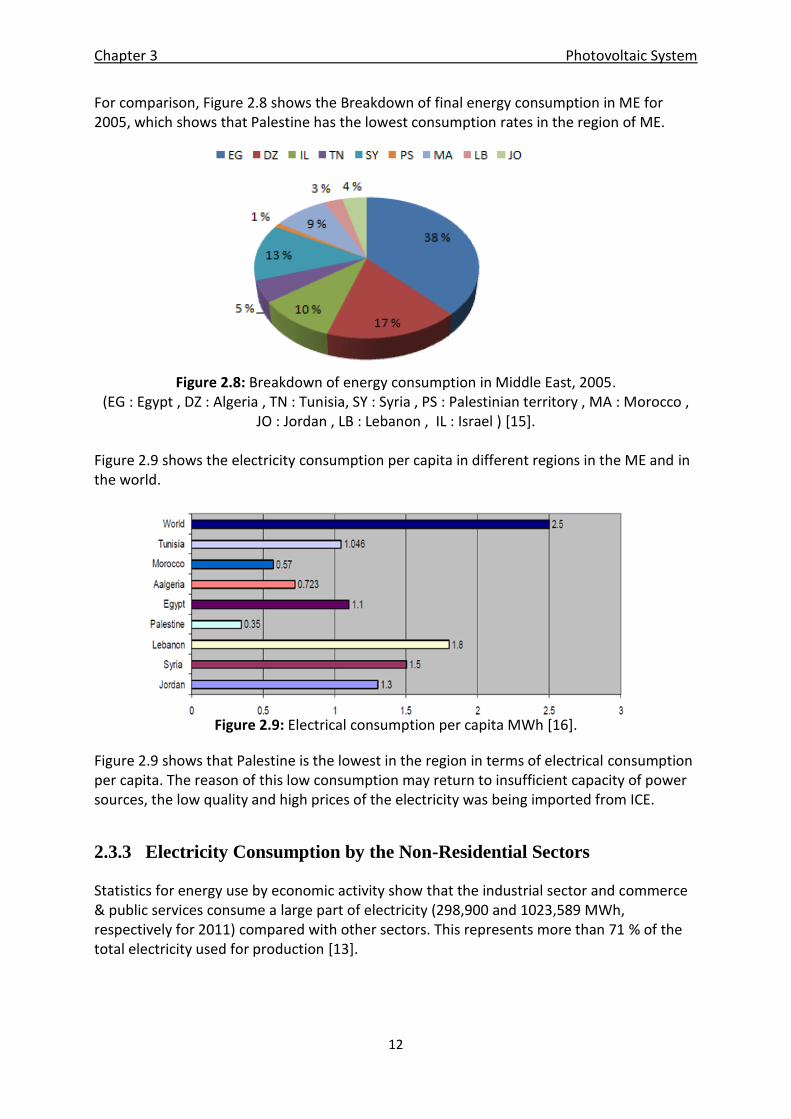
For comparison, Figure 2.8 shows the Breakdown of final energy consumption in ME for 2005, which shows that Palestine has the lowest consumption rates in the region of ME.
Figure 2.8: Breakdown of energy consumption in Middle East, 2005. (EG : Egypt , DZ : Algeria , TN : Tunisia, SY : Syria , PS : Palestinian territory , MA : Morocco ,
JO : Jordan , LB : Lebanon , IL : Israel ) [15]. Figure 2.9 shows the electricity consumption per capita in different regions in the ME and in the world.
Figure 2.9: Electrical consumption per capita MWh [16].
Figure 2.9 shows that Palestine is the lowest in the region in terms of electrical consumption per capita. The reason of this low consumption may return to insufficient capacity of power sources, the low quality and high prices of the electricity was being imported from ICE.
2.3.3 Electricity Consumption by the Non-Residential Sectors
Statistics for energy use by economic activity show that the industrial sector and commerce & public services consume a large part of electricity (298,900 and 1023,589 MWh, respectively for 2011) compared with other sectors. This represents more than 71 % of the total electricity used for production [13].
Chapter 3 Photovoltaic System
13
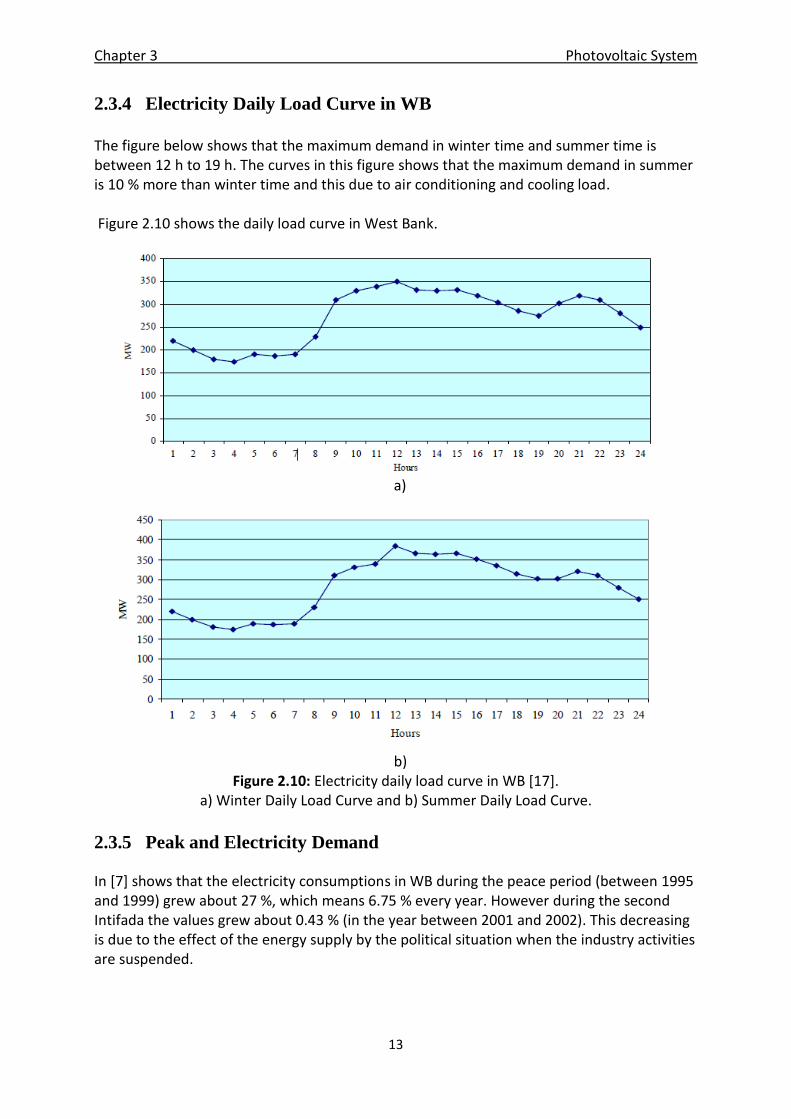
2.3.4 Electricity Daily Load Curve in WB
The figure below shows that the maximum demand in winter time and summer time is between 12 h to 19 h. The curves in this figure shows that the maximum demand in summer is 10 % more than winter time and this due to air conditioning and cooling load. Figure 2.10 shows the daily load curve in West Bank.
a)
b)
Figure 2.10: Electricity daily load curve in WB [17]. a) Winter Daily Load Curve and b) Summer Daily Load Curve.
2.3.5 Peak and Electricity Demand
In [7] shows that the electricity consumptions in WB during the peace period (between 1995 and 1999) grew about 27 %, which means 6.75 % every year. However during the second Intifada the values grew about 0.43 % (in the year between 2001 and 2002). This decreasing is due to the effect of the energy supply by the political situation when the industry activities are suspended.
Chapter 3 Photovoltaic System
14
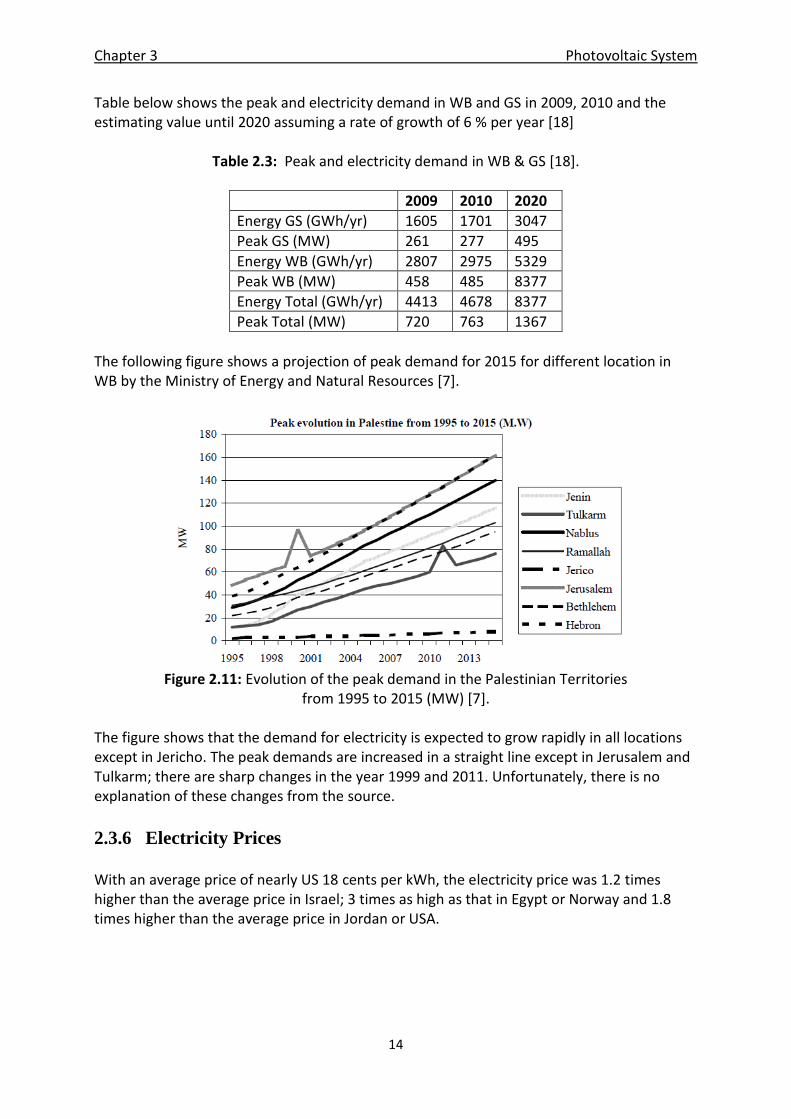
Table below shows the peak and electricity demand in WB and GS in 2009, 2010 and the estimating value until 2020 assuming a rate of growth of 6 % per year [18]
Table 2.3: Peak and electricity demand in WB & GS [18].
2009 2010 2020
Energy GS (GWh/yr) 1605 1701 3047
Peak GS (MW) 261 277 495
Energy WB (GWh/yr) 2807 2975 5329
Peak WB (MW) 458 485 8377
Energy Total (GWh/yr) 4413 4678 8377
Peak Total (MW) 720 763 1367
The following figure shows a projection of peak demand for 2015 for different location in WB by the Ministry of Energy and Natural Resources [7].
Figure 2.11: Evolution of the peak demand in the Palestinian Territories
from 1995 to 2015 (MW) [7]. The figure shows that the demand for electricity is expected to grow rapidly in all locations except in Jericho. The peak demands are increased in a straight line except in Jerusalem and Tulkarm; there are sharp changes in the year 1999 and 2011. Unfortunately, there is no explanation of these changes from the source.
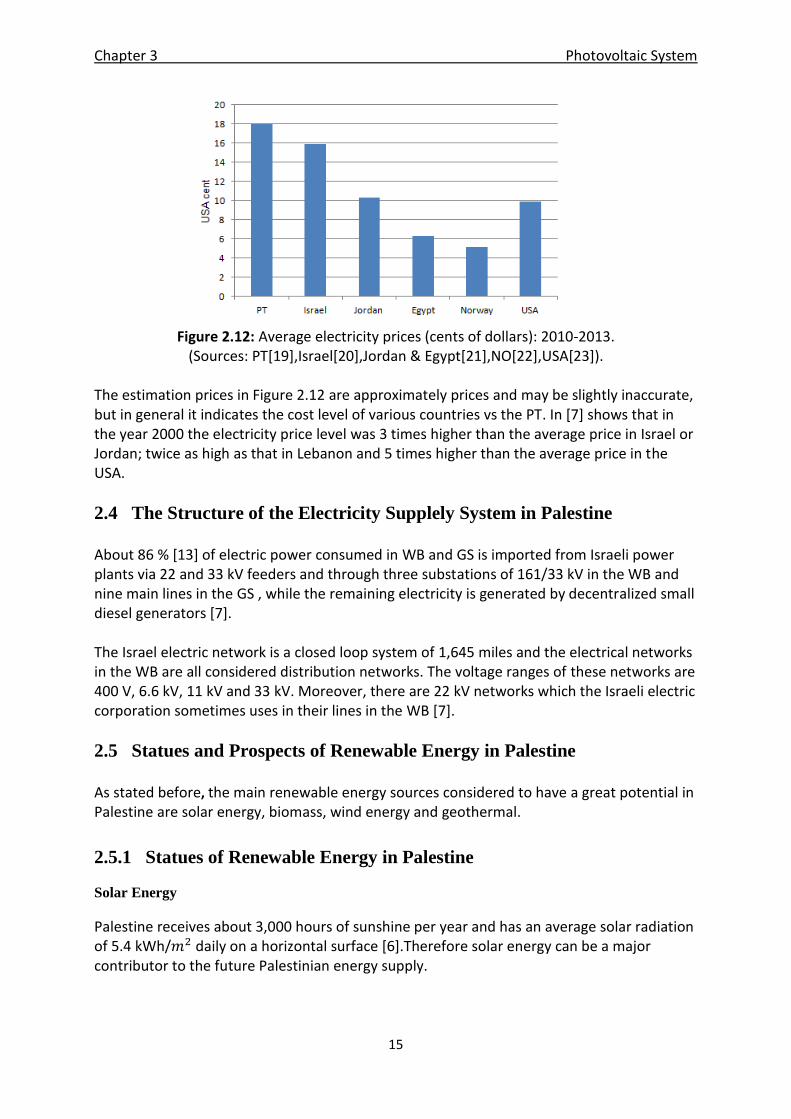
2.3.6 Electricity Prices
With an average price of nearly US 18 cents per kWh, the electricity price was 1.2 times higher than the average price in Israel; 3 times as high as that in Egypt or Norway and 1.8 times higher than the average price in Jordan or USA.
Chapter 3 Photovoltaic System
15
Figure 2.12: Average electricity prices (cents of dollars): 2010-2013. (Sources: PT[19],Israel[20],Jordan & Egypt[21],NO[22],USA[23]).
The estimation prices in Figure 2.12 are approximately prices and may be slightly inaccurate, but in general it indicates the cost level of various countries vs the PT. In [7] shows that in the year 2000 the electricity price level was 3 times higher than the average price in Israel or Jordan; twice as high as that in Lebanon and 5 times higher than the average price in the USA.
2.4 The Structure of the Electricity Supplely System in Palestine
About 86 % [13] of electric power consumed in WB and GS is imported from Israeli power plants via 22 and 33 kV feeders and through three substations of 161/33 kV in the WB and nine main lines in the GS , while the remaining electricity is generated by decentralized small diesel generators [7]. The Israel electric network is a closed loop system of 1,645 miles and the electrical networks in the WB are all considered distribution networks. The voltage ranges of these networks are 400 V, 6.6 kV, 11 kV and 33 kV. Moreover, there are 22 kV networks which the Israeli electric corporation sometimes uses in their lines in the WB [7].
2.5 Statues and Prospects of Renewable Energy in Palestine
As stated before, the main renewable energy sources considered to have a great potential in Palestine are solar energy, biomass, wind energy and geothermal.
2.5.1 Statues of Renewable Energy in Palestine
Solar Energy
Palestine receives about 3,000 hours of sunshine per year and has an average solar radiation of 5.4 kWh/ daily on a horizontal surface [6].Therefore solar energy can be a major contributor to the future Palestinian energy supply.
Chapter 3 Photovoltaic System
16
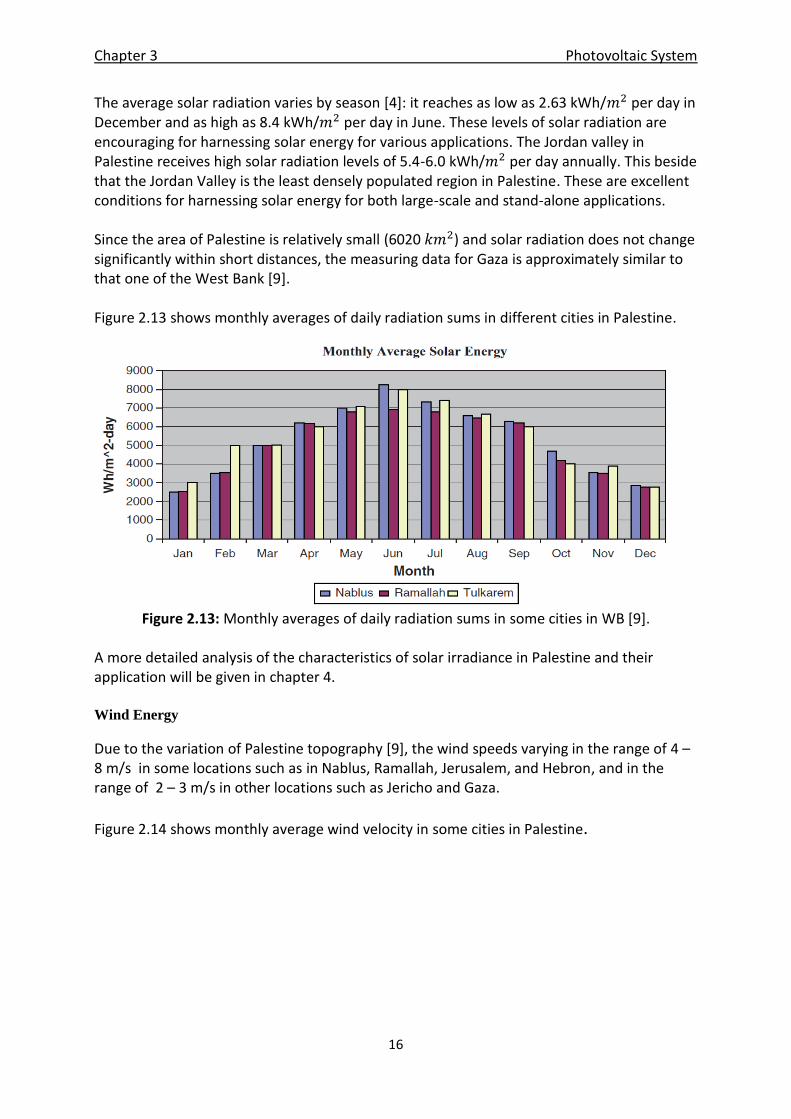
The average solar radiation varies by season [4]: it reaches as low as 2.63 kWh/ per day in December and as high as 8.4 kWh/ per day in June. These levels of solar radiation are encouraging for harnessing solar energy for various applications. The Jordan valley in Palestine receives high solar radiation levels of 5.4-6.0 kWh/ per day annually. This beside that the Jordan Valley is the least densely populated region in Palestine. These are excellent conditions for harnessing solar energy for both large-scale and stand-alone applications. Since the area of Palestine is relatively small (6020 ) and solar radiation does not change significantly within short distances, the measuring data for Gaza is approximately similar to that one of the West Bank [9]. Figure 2.13 shows monthly averages of daily radiation sums in different cities in Palestine.
Figure 2.13: Monthly averages of daily radiation sums in some cities in WB [9]. A more detailed analysis of the characteristics of solar irradiance in Palestine and their application will be given in chapter 4. Wind Energy
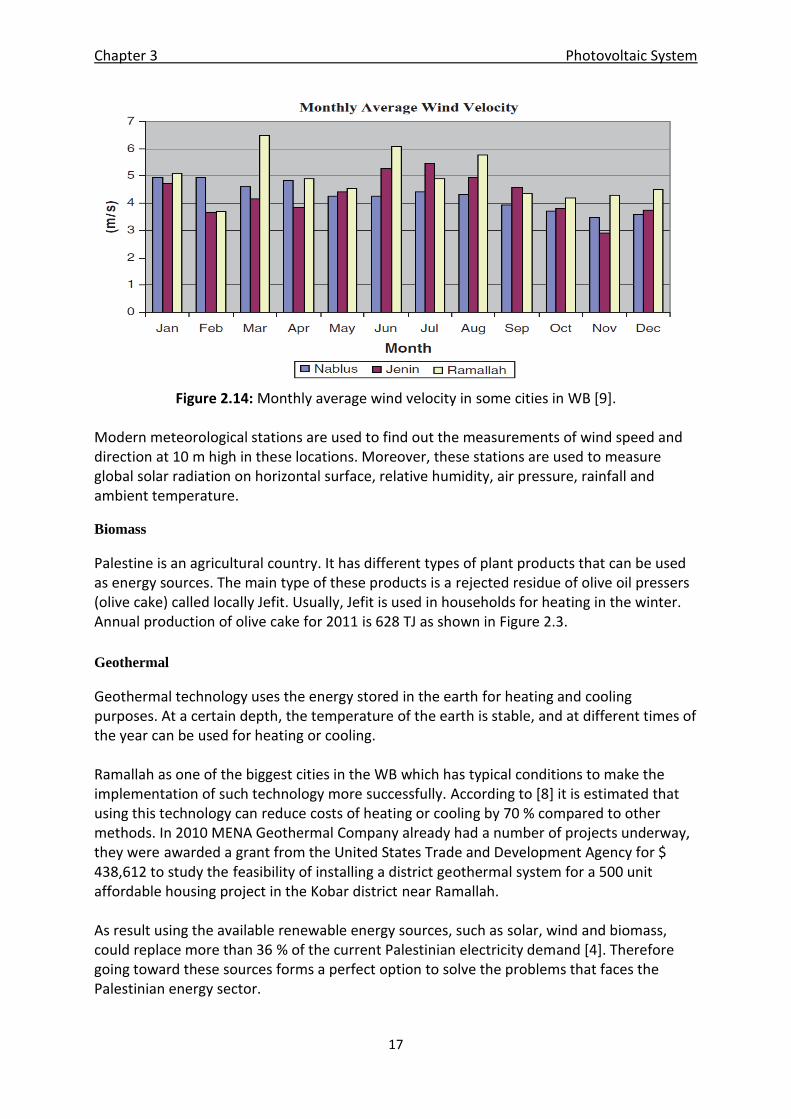
Due to the variation of Palestine topography [9], the wind speeds varying in the range of 4 – 8 m/s in some locations such as in Nablus, Ramallah, Jerusalem, and Hebron, and in the range of 2 – 3 m/s in other locations such as Jericho and Gaza.
Figure 2.14 shows monthly average wind velocity in some cities in Palestine.
Chapter 3 Photovoltaic System
17
Figure 2.14: Monthly average wind velocity in some cities in WB [9].
Modern meteorological stations are used to find out the measurements of wind speed and direction at 10 m high in these locations. Moreover, these stations are used to measure global solar radiation on horizontal surface, relative humidity, air pressure, rainfall and ambient temperature.
Biomass
Palestine is an agricultural country. It has different types of plant products that can be used as energy sources. The main type of these products is a rejected residue of olive oil pressers (olive cake) called locally Jefit. Usually, Jefit is used in households for heating in the winter. Annual production of olive cake for 2011 is 628 TJ as shown in Figure 2.3.
Geothermal
Geothermal technology uses the energy stored in the earth for heating and cooling purposes. At a certain depth, the temperature of the earth is stable, and at different times of the year can be used for heating or cooling. Ramallah as one of the biggest cities in the WB which has typical conditions to make the implementation of such technology more successfully. According to [8] it is estimated that using this technology can reduce costs of heating or cooling by 70 % compared to other methods. In 2010 MENA Geothermal Company already had a number of projects underway, they were awarded a grant from the United States Trade and Development Agency for $ 438,612 to study the feasibility of installing a district geothermal system for a 500 unit affordable housing project in the Kobar district near Ramallah. As result using the available renewable energy sources, such as solar, wind and biomass, could replace more than 36 % of the current Palestinian electricity demand [4]. Therefore going toward these sources forms a perfect option to solve the problems that faces the Palestinian energy sector.
Chapter 3 Photovoltaic System
18
2.5.2 Prospects of Renewable Energy in Palestine
As mentioned, the demand for power is growing. This demand is growing by about 6 % every year and the electrical energy consumption is expected to reach 7300 GWh by 2020 [3].
According to Palestinian energy and natural reassures authority (PENERA), the Palestinian government had set a goal in which 10 % of electricity generated in Palestine is going to be generated through renewable resources by the year 2020.
As part of its RE strategy, PENERE target is to achieve 130 MW through the installation of various RE technologies by 2020 [24]. This amount of capacity distributed as follow:
50 % from different solar sources (on ground, small PV and CSP).
16.2 % from biogas sources (Biogas landfill, Biogas animal).
33.8 % from wind mills and small-scale wind. To achieve this target, PENERA developed the Palestinian solar initiative (PSI) which aims a achieving a target 5 MW generation by 2015 through installing 5 kWp PV panels at rooftops of Palestinians households.
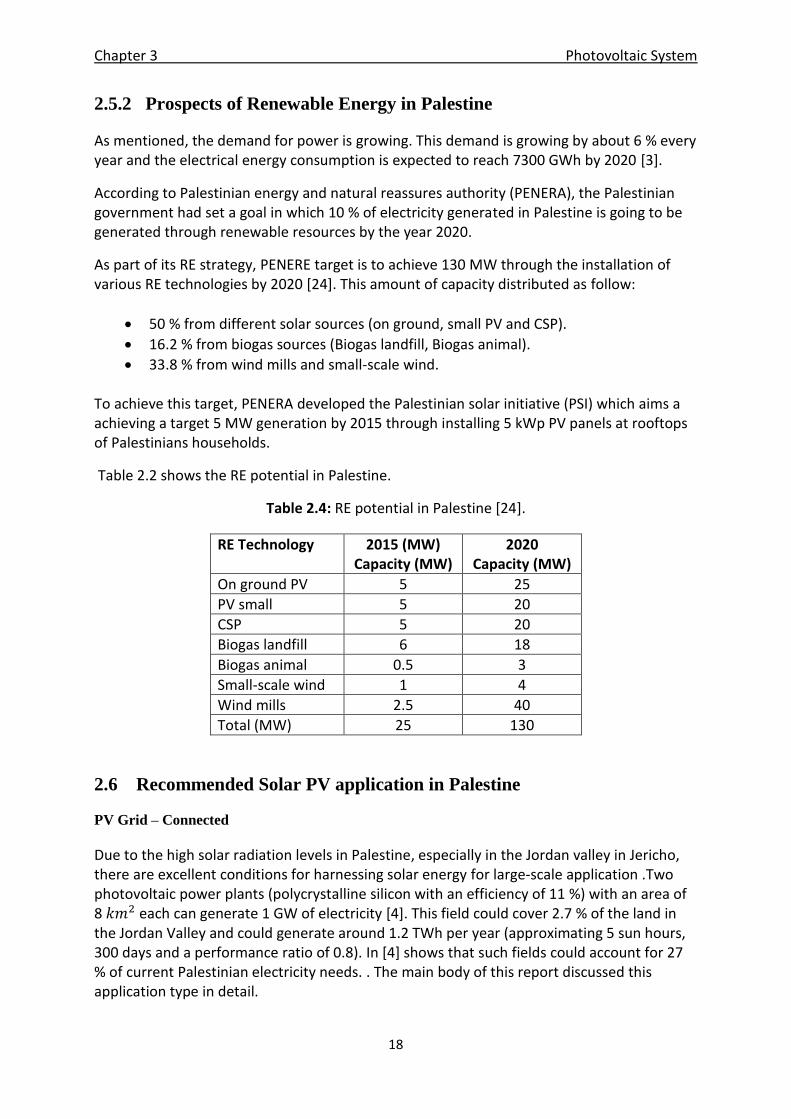
Table 2.2 shows the RE potential in Palestine.
Table 2.4: RE potential in Palestine [24].
RE Technology 2015 (MW) Capacity (MW)
2020 Capacity (MW)
On ground PV 5 25
PV small 5 20
CSP 5 20
Biogas landfill 6 18
Biogas animal 0.5 3
Small-scale wind 1 4
Wind mills 2.5 40
Total (MW) 25 130
2.6 Recommended Solar PV application in Palestine
PV Grid – Connected
Due to the high solar radiation levels in Palestine, especially in the Jordan valley in Jericho, there are excellent conditions for harnessing solar energy for large-scale application .Two photovoltaic power plants (polycrystalline silicon with an efficiency of 11 %) with an area of 8 each can generate 1 GW of electricity [4]. This field could cover 2.7 % of the land in the Jordan Valley and could generate around 1.2 TWh per year (approximating 5 sun hours, 300 days and a performance ratio of 0.8). In [4] shows that such fields could account for 27 % of current Palestinian electricity needs. . The main body of this report discussed this application type in detail.
Chapter 3 Photovoltaic System
19
Rural Electrification
Palestine today still has about 73 villages and small communities that are not electrified [3].The average electrical consumption in these isolated places is usually very low, and may vary from 0.5 to 3 kWh per family per day. The main consumptions are made by illumination, TV and refrigerators. This is of course where small PV system technology can contribute.
Agriculture Applications
Due to the lack of water in many areas of the country, where 23 % of population does not have easy access to water and 13 % of population lives from agriculture, the most of population still uses the traditional way to withdraw water from wells. Therefore, PV system turns out to be an essential application to pump water from the wells [3].
Stand Alone Applications
PV stand-alone such as telecommunications towers, rural clinic or street lighting especially in remote areas is also applications where PV might play an important role. In the recent years many of PV systems were installed in Palestine through many local and international institutions were the most projects was for schools, clinics, Bedouins communities, agricultural animal farms and private homes. Also as mentioned in sec. 2.5.2 the PSI already started it is initiative to set up 5 MWp of PV panels at the rooftops of Palestinians households. The most of applications that have been installed and which expected to be installed are for small PV system (PV stand-alone system). The use of utility scale system is still not widely installed and it’s expected to be installed in the future.
2.7 Summary
This chapter focused on the energy profile in Palestine, where the different renewable and non-renewable energy sources have been discussed. Many obstacles face the energy sector in Palestine because of the major energy that needed for Palestinian is imported from Israel, where it controls the quantity and condition of energy imported. The high price of electricity and the dependence of Palestinian on Israel in the energy, encourage the Palestinian to think about the alternative energy. This chapter has shown that Palestine receives a large amount of solar energy every year; therefore the solution for Palestinian is to go toward the renewable energy, particularly the solar energy.
Chapter 3 Photovoltaic System
20
3 A Photovoltaic System
In this chapter the concepts, principles and structures of photovoltaic cells, modules and arrays are studied as well as of inverters and grid connected system in general.
3.1 Introduction
The solar energy conversion into electricity takes place in a semiconductor device that is called a solar cell. A solar cell is a device that converts the energy of light directly into electricity characterized by an output voltage and current. In order to generate usable power for practical devices, which require a particular voltage or current for their operation, a number of solar cells are connected together to form a solar panel, also called a PV module. For large-scale generation of solar electricity the solar panels are connected together into a solar array. The solar panels are part of a complete PV solar system, which, depending on the application, may comprise batteries for electricity storage, dc/ac inverters that connect a PV system to the electrical grid and mounting elements. These additional parts of the PV solar system form the balance of system (BOS) components [25].
3.2 The Photovoltaic Cell
PV cells are made of semiconducting materials that can convert incident radiation to electric currents. Because solar cells are made of semiconductor materials (usually silicon), it is useful to give a short briefing about such materials and description of: types, operation, structures and characteristics of solar cells it selves.
3.2.1 Type of Cell
PV cells are manufactured from semiconductor materials and most commonly made of silicon (Other materials (e.g.: CIS and CdTe) are under active investigation and may supersede silicon in the long term). It comes in two main types [26], crystalline and amorphous thin-film type, as detailed in Figure 3.1 and Table 3.1. Crystalline type include two types: Mono crystalline and poly crystalline where Thin-film PV technologies include three main families: 1) amorphous (a-Si) and micromorph silicon (a-Si/µc-Si); 2) Cadmium-Telluride (CdTe); and 3) Copper Indium-Selenide (CIS) and Copper-Indium Gallium-Diselenide (CIGS)
Chapter 3 Photovoltaic System
21
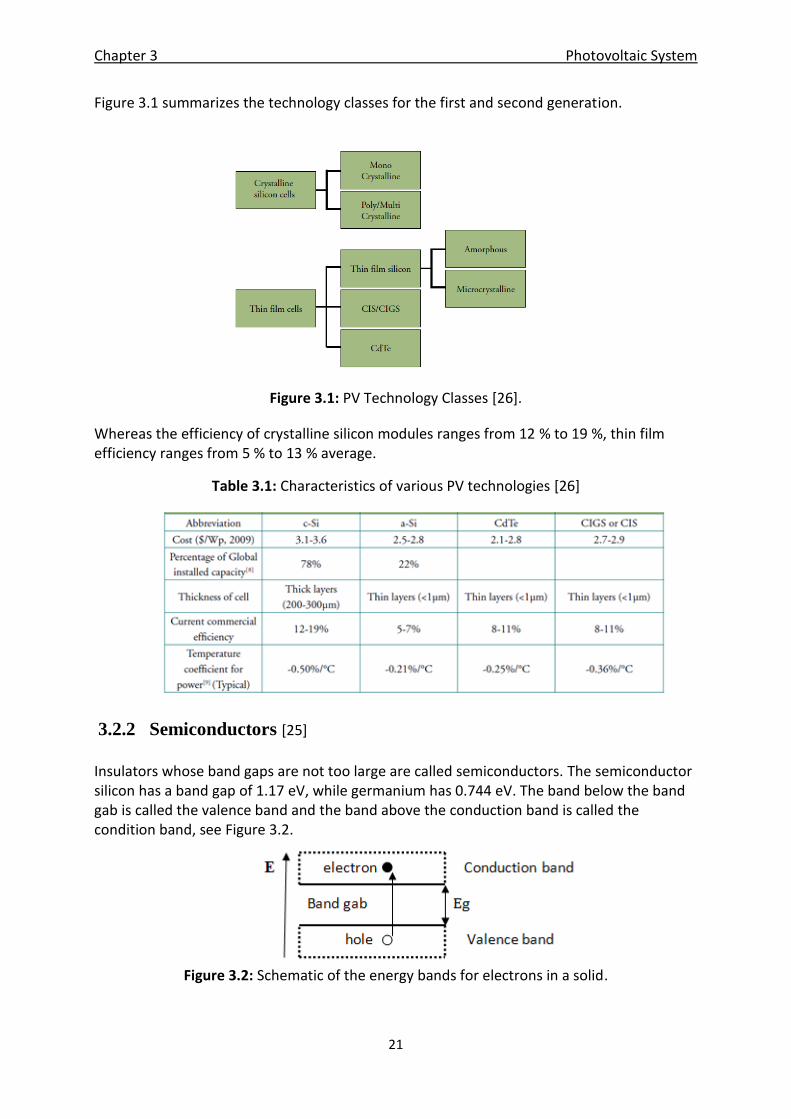
Figure 3.1 summarizes the technology classes for the first and second generation.
Figure 3.1: PV Technology Classes [26].
Whereas the efficiency of crystalline silicon modules ranges from 12 % to 19 %, thin film efficiency ranges from 5 % to 13 % average.
Table 3.1: Characteristics of various PV technologies [26]
3.2.2 Semiconductors [25]
Insulators whose band gaps are not too large are called semiconductors. The semiconductor silicon has a band gap of 1.17 eV, while germanium has 0.744 eV. The band below the band gab is called the valence band and the band above the conduction band is called the condition band, see Figure 3.2.
Figure 3.2: Schematic of the energy bands for electrons in a solid.
Chapter 3 Photovoltaic System
22
The electrical properties of such conductors can be described using band models. This model describes the behavior of semiconductor in terms of energy levels between the two bands.
As temperature increase, the electrons in the valance band will be excited to condition band. In conduction band there are easily accessible empty state that an electron can jump into, thus the electrons are able to flow and carry current. The electrons that movies from the valance band to the conduction band leaves holes in the valence band which act as positive charges and are able to contribute to the electrical current. Photon can also be used to excite the electrons from valence band to the conduction band. When light falls into semiconductor metal, photon with energy greater than the band gab energy ( )
interact with the electron in covalent bonds, using up their energy to break bonds and create electrons-holes pairs.
The photovoltaic energy conversion relies on the quantum nature of light, which carry the energy given by [27, 28]:
(3.1)
where: h : Planck's constant ; c : speed of light ; λ : wavelength of light.
3.2.3 The Cell Concept [25,27]
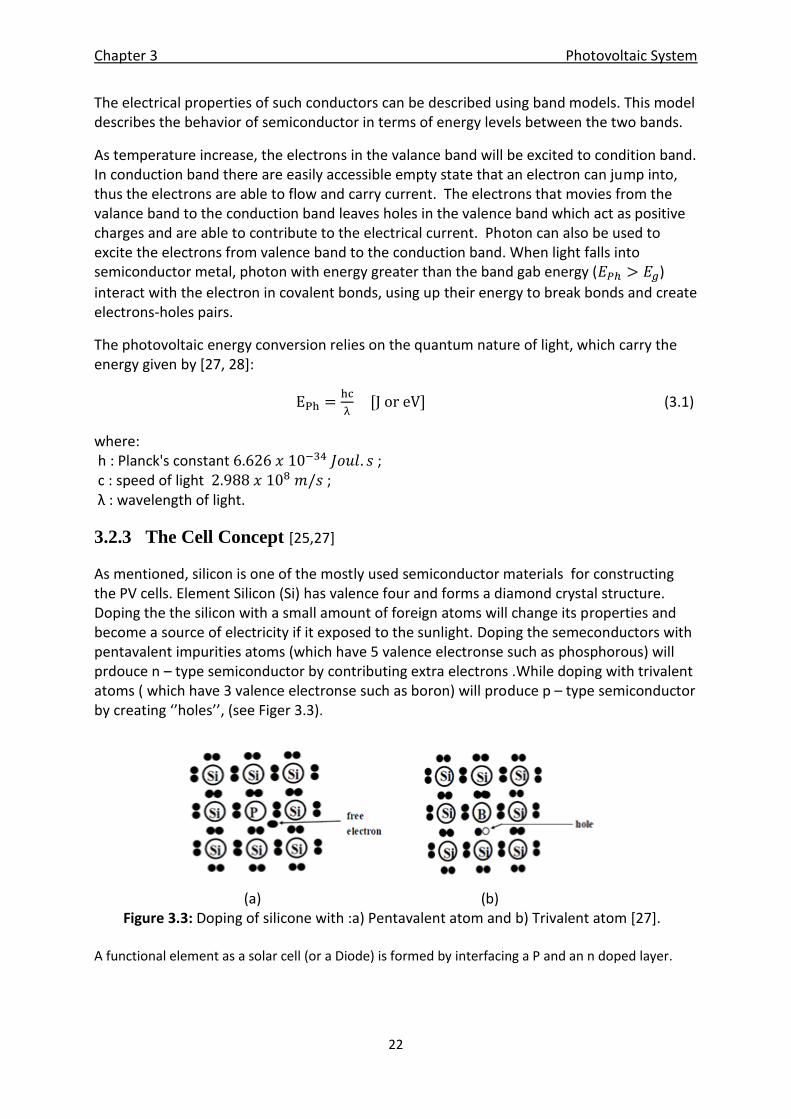
As mentioned, silicon is one of the mostly used semiconductor materials for constructing the PV cells. Element Silicon (Si) has valence four and forms a diamond crystal structure. Doping the the silicon with a small amount of foreign atoms will change its properties and become a source of electricity if it exposed to the sunlight. Doping the semeconductors with pentavalent impurities atoms (which have 5 valence electronse such as phosphorous) will prdouce n – type semiconductor by contributing extra electrons .While doping with trivalent atoms ( which have 3 valence electronse such as boron) will produce p – type semiconductor by creating ‘’holes’’, (see Figer 3.3).
(a) (b) Figure 3.3: Doping of silicone with :a) Pentavalent atom and b) Trivalent atom [27]. A functional element as a solar cell (or a Diode) is formed by interfacing a P and an n doped layer.
Chapter 3 Photovoltaic System
23
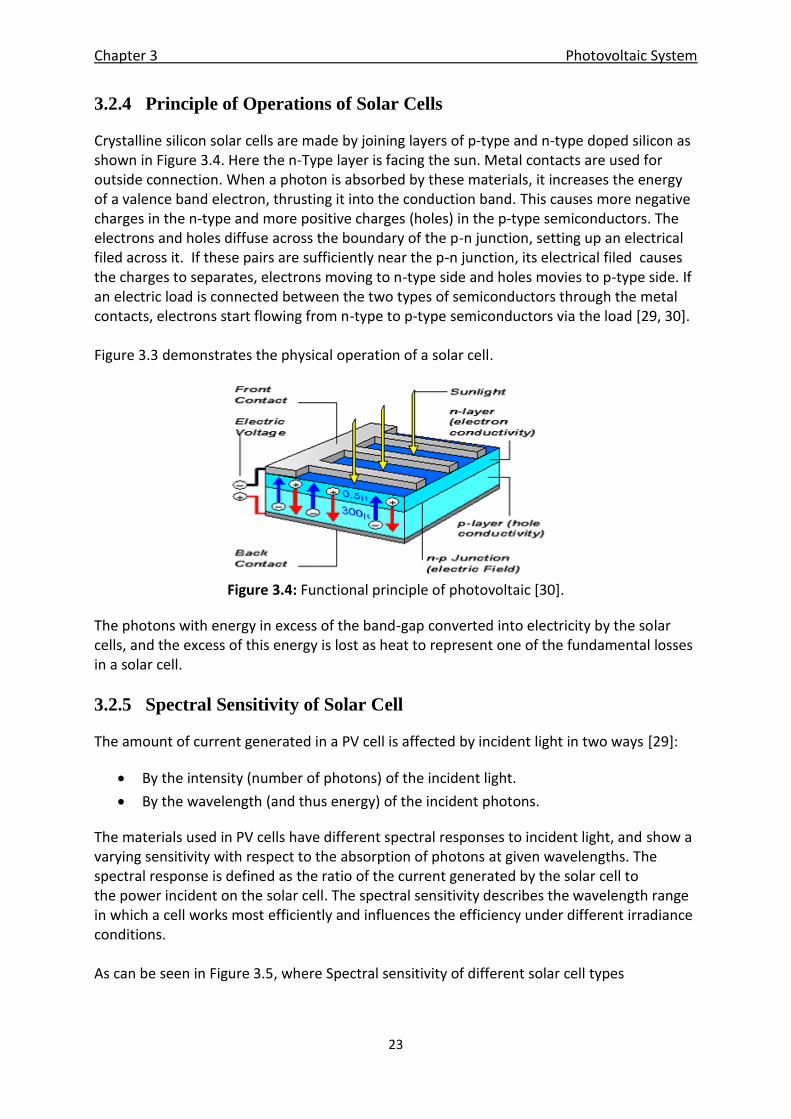
3.2.4 Principle of Operations of Solar Cells
Crystalline silicon solar cells are made by joining layers of p-type and n-type doped silicon as shown in Figure 3.4. Here the n-Type layer is facing the sun. Metal contacts are used for outside connection. When a photon is absorbed by these materials, it increases the energy of a valence band electron, thrusting it into the conduction band. This causes more negative charges in the n-type and more positive charges (holes) in the p-type semiconductors. The electrons and holes diffuse across the boundary of the p-n junction, setting up an electrical filed across it. If these pairs are sufficiently near the p-n junction, its electrical filed causes the charges to separates, electrons moving to n-type side and holes movies to p-type side. If an electric load is connected between the two types of semiconductors through the metal contacts, electrons start flowing from n-type to p-type semiconductors via the load [29, 30]. Figure 3.3 demonstrates the physical operation of a solar cell.
Figure 3.4: Functional principle of photovoltaic [30].
The photons with energy in excess of the band-gap converted into electricity by the solar cells, and the excess of this energy is lost as heat to represent one of the fundamental losses in a solar cell.
3.2.5 Spectral Sensitivity of Solar Cell
The amount of current generated in a PV cell is affected by incident light in two ways [29]:
By the intensity (number of photons) of the incident light.
By the wavelength (and thus energy) of the incident photons.
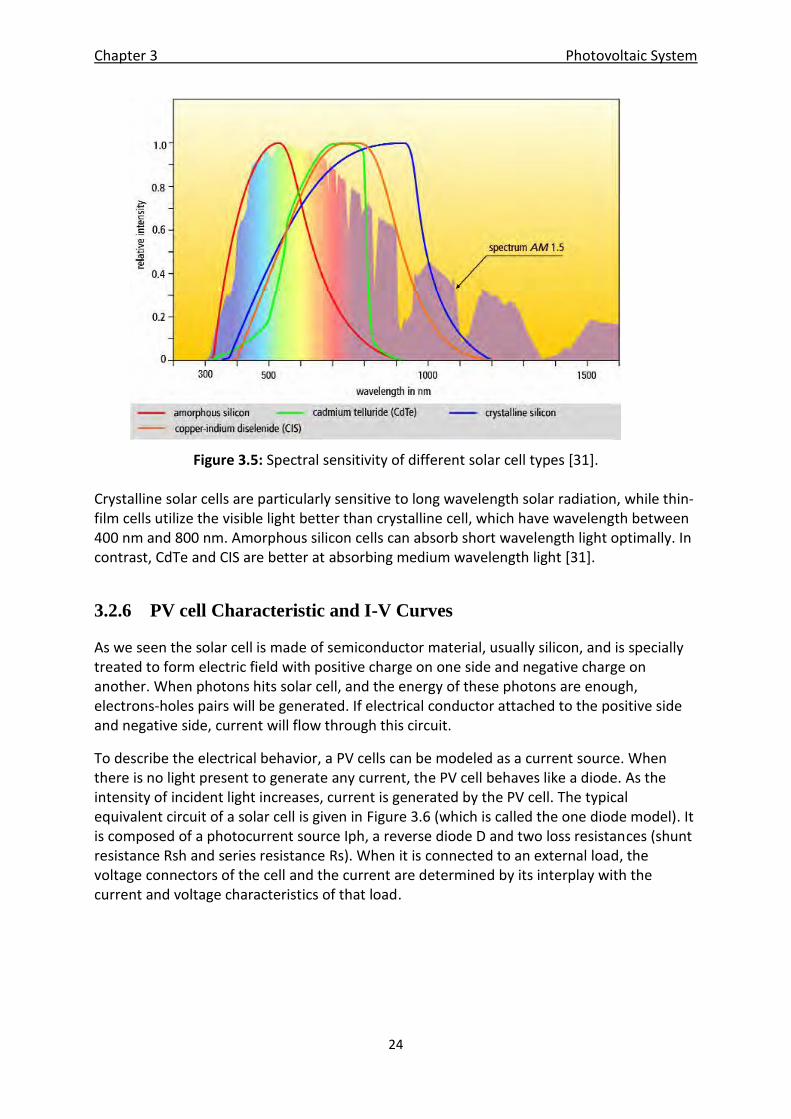
The materials used in PV cells have different spectral responses to incident light, and show a varying sensitivity with respect to the absorption of photons at given wavelengths. The spectral response is defined as the ratio of the current generated by the solar cell to the power incident on the solar cell. The spectral sensitivity describes the wavelength range in which a cell works most efficiently and influences the efficiency under different irradiance conditions. As can be seen in Figure 3.5, where Spectral sensitivity of different solar cell types
Chapter 3 Photovoltaic System
24
Figure 3.5: Spectral sensitivity of different solar cell types [31]. Crystalline solar cells are particularly sensitive to long wavelength solar radiation, while thin-film cells utilize the visible light better than crystalline cell, which have wavelength between 400 nm and 800 nm. Amorphous silicon cells can absorb short wavelength light optimally. In contrast, CdTe and CIS are better at absorbing medium wavelength light [31].
3.2.6 PV cell Characteristic and I-V Curves
As we seen the solar cell is made of semiconductor material, usually silicon, and is specially treated to form electric field with positive charge on one side and negative charge on another. When photons hits solar cell, and the energy of these photons are enough, electrons-holes pairs will be generated. If electrical conductor attached to the positive side and negative side, current will flow through this circuit.
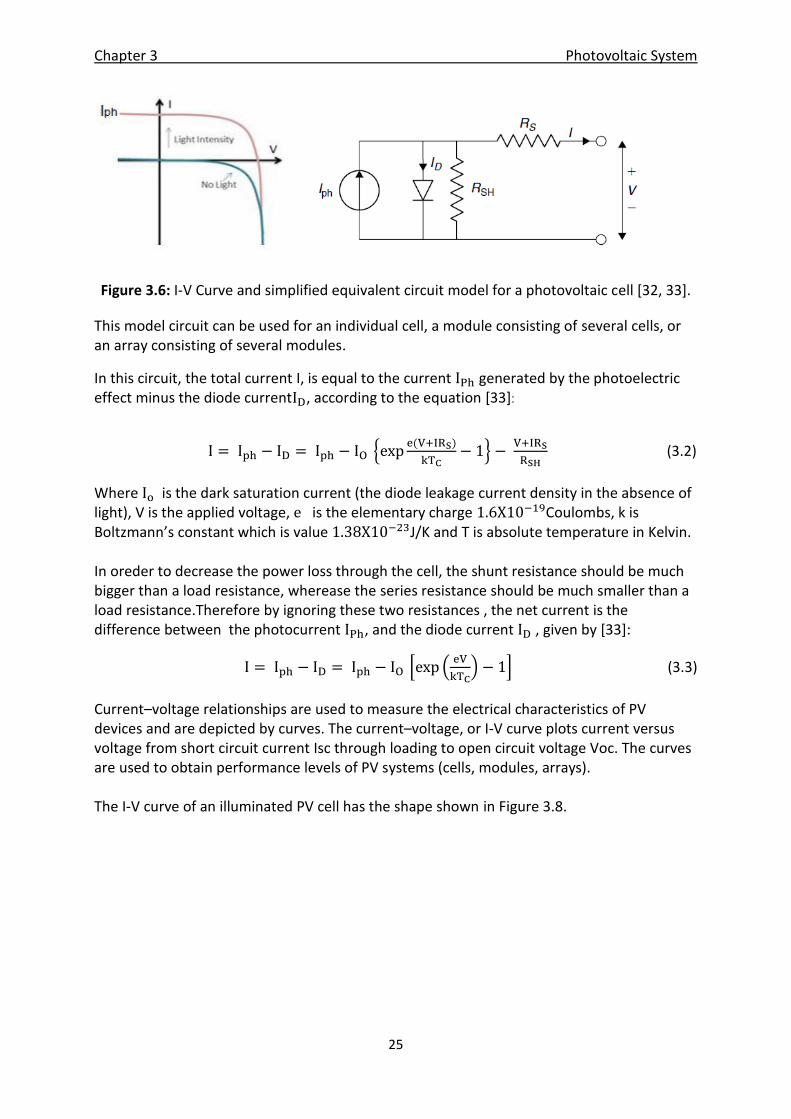
To describe the electrical behavior, a PV cells can be modeled as a current source. When there is no light present to generate any current, the PV cell behaves like a diode. As the intensity of incident light increases, current is generated by the PV cell. The typical equivalent circuit of a solar cell is given in Figure 3.6 (which is called the one diode model). It is composed of a photocurrent source Iph, a reverse diode D and two loss resistances (shunt resistance Rsh and series resistance Rs). When it is connected to an external load, the voltage connectors of the cell and the current are determined by its interplay with the current and voltage characteristics of that load.
Chapter 3 Photovoltaic System
25
Figure 3.6: I-V Curve and simplified equivalent circuit model for a photovoltaic cell [32, 33].
This model circuit can be used for an individual cell, a module consisting of several cells, or an array consisting of several modules.
In this circuit, the total current I, is equal to the current generated by the photoelectric effect minus the diode current , according to the equation [33]:
(3.2)
Where is the dark saturation current (the diode leakage current density in the absence of light), V is the applied voltage, is the elementary charge Coulombs, k is Boltzmann’s constant which is value J/K and T is absolute temperature in Kelvin. In oreder to decrease the power loss through the cell, the shunt resistance should be much bigger than a load resistance, wherease the series resistance should be much smaller than a load resistance.Therefore by ignoring these two resistances , the net current is the difference between the photocurrent , and the diode current , given by [33]:
(3.3)
Current–voltage relationships are used to measure the electrical characteristics of PV devices and are depicted by curves. The current–voltage, or I-V curve plots current versus voltage from short circuit current Isc through loading to open circuit voltage Voc. The curves are used to obtain performance levels of PV systems (cells, modules, arrays). The I-V curve of an illuminated PV cell has the shape shown in Figure 3.8.
Chapter 3 Photovoltaic System
26
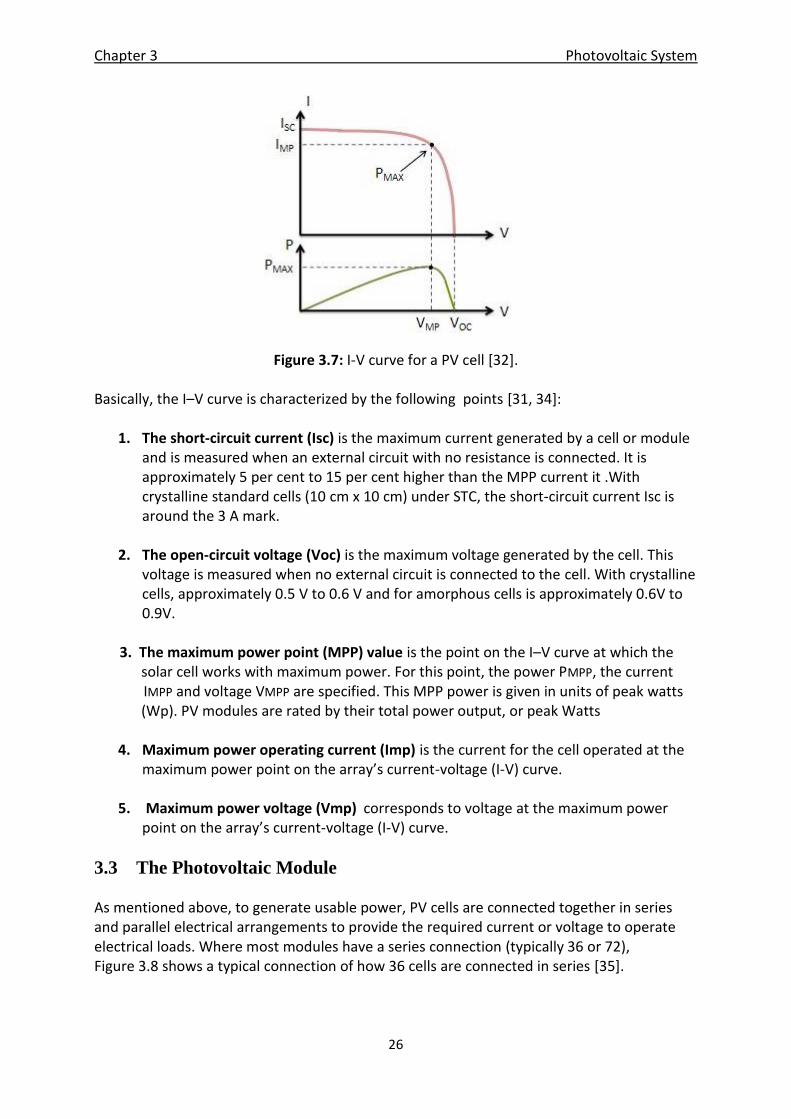
Figure 3.7: I-V curve for a PV cell [32].
Basically, the I–V curve is characterized by the following points [31, 34]:
1. The short-circuit current (Isc) is the maximum current generated by a cell or module and is measured when an external circuit with no resistance is connected. It is approximately 5 per cent to 15 per cent higher than the MPP current it .With crystalline standard cells (10 cm x 10 cm) under STC, the short-circuit current Isc is around the 3 A mark.
2. The open-circuit voltage (Voc) is the maximum voltage generated by the cell. This voltage is measured when no external circuit is connected to the cell. With crystalline cells, approximately 0.5 V to 0.6 V and for amorphous cells is approximately 0.6V to 0.9V.
3. The maximum power point (MPP) value is the point on the I–V curve at which the solar cell works with maximum power. For this point, the power PMPP, the current
IMPP and voltage VMPP are specified. This MPP power is given in units of peak watts (Wp). PV modules are rated by their total power output, or peak Watts
4. Maximum power operating current (Imp) is the current for the cell operated at the
maximum power point on the array’s current-voltage (I-V) curve.
5. Maximum power voltage (Vmp) corresponds to voltage at the maximum power point on the array’s current-voltage (I-V) curve.
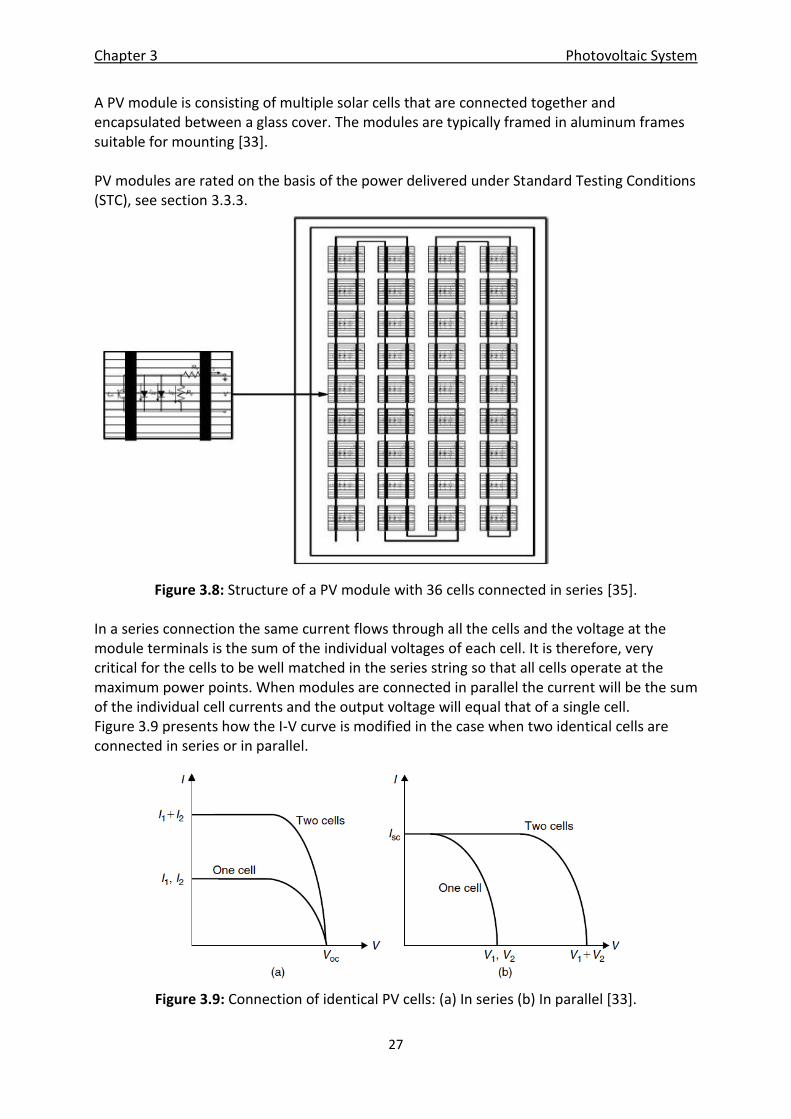
3.3 The Photovoltaic Module As mentioned above, to generate usable power, PV cells are connected together in series and parallel electrical arrangements to provide the required current or voltage to operate electrical loads. Where most modules have a series connection (typically 36 or 72), Figure 3.8 shows a typical connection of how 36 cells are connected in series [35].
Chapter 3 Photovoltaic System
27
A PV module is consisting of multiple solar cells that are connected together and encapsulated between a glass cover. The modules are typically framed in aluminum frames suitable for mounting [33]. PV modules are rated on the basis of the power delivered under Standard Testing Conditions (STC), see section 3.3.3.
Figure 3.8: Structure of a PV module with 36 cells connected in series [35]. In a series connection the same current flows through all the cells and the voltage at the module terminals is the sum of the individual voltages of each cell. It is therefore, very critical for the cells to be well matched in the series string so that all cells operate at the maximum power points. When modules are connected in parallel the current will be the sum of the individual cell currents and the output voltage will equal that of a single cell. Figure 3.9 presents how the I-V curve is modified in the case when two identical cells are connected in series or in parallel.
Figure 3.9: Connection of identical PV cells: (a) In series (b) In parallel [33].
Chapter 3 Photovoltaic System
28
3.3.1 Performance Analysis of Photovoltaic Modules The power produced by a crystalline PV module is affected by several keys factors:
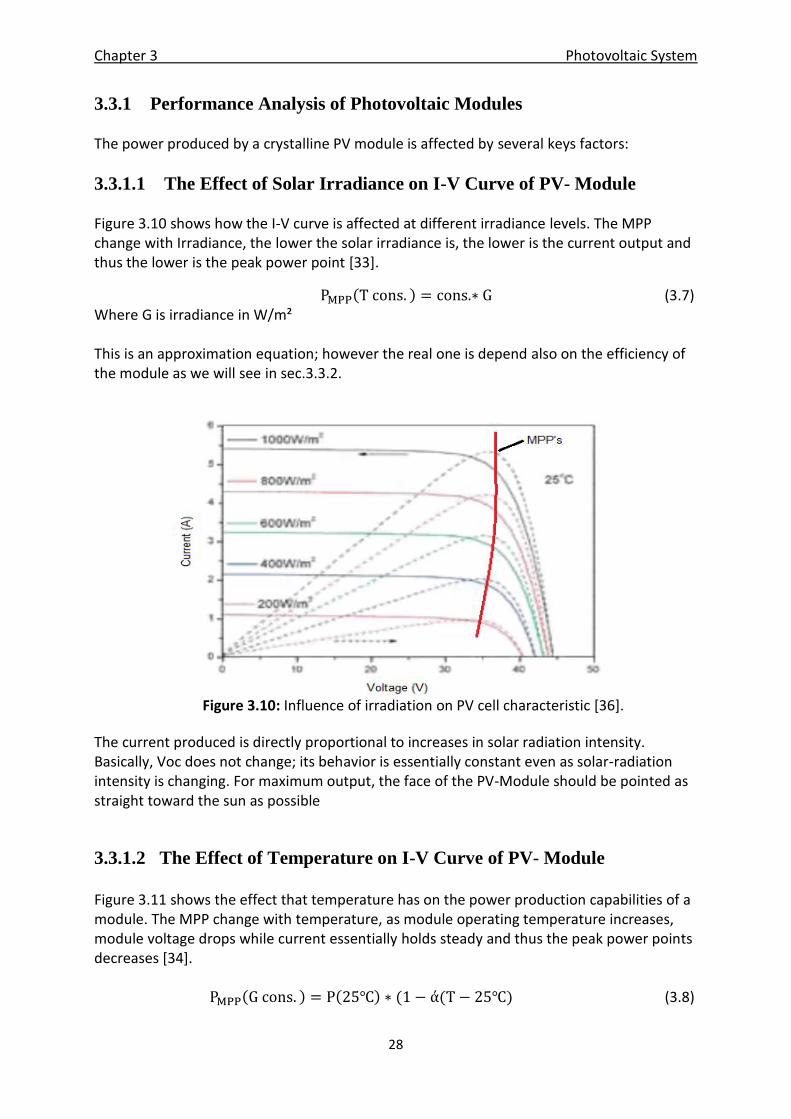
3.3.1.1 The Effect of Solar Irradiance on I-V Curve of PV- Module Figure 3.10 shows how the I-V curve is affected at different irradiance levels. The MPP change with Irradiance, the lower the solar irradiance is, the lower is the current output and thus the lower is the peak power point [33].
(3.7) Where G is irradiance in W/m² This is an approximation equation; however the real one is depend also on the efficiency of the module as we will see in sec.3.3.2.
Figure 3.10: Influence of irradiation on PV cell characteristic [36].
The current produced is directly proportional to increases in solar radiation intensity. Basically, Voc does not change; its behavior is essentially constant even as solar-radiation intensity is changing. For maximum output, the face of the PV-Module should be pointed as straight toward the sun as possible
3.3.1.2 The Effect of Temperature on I-V Curve of PV- Module
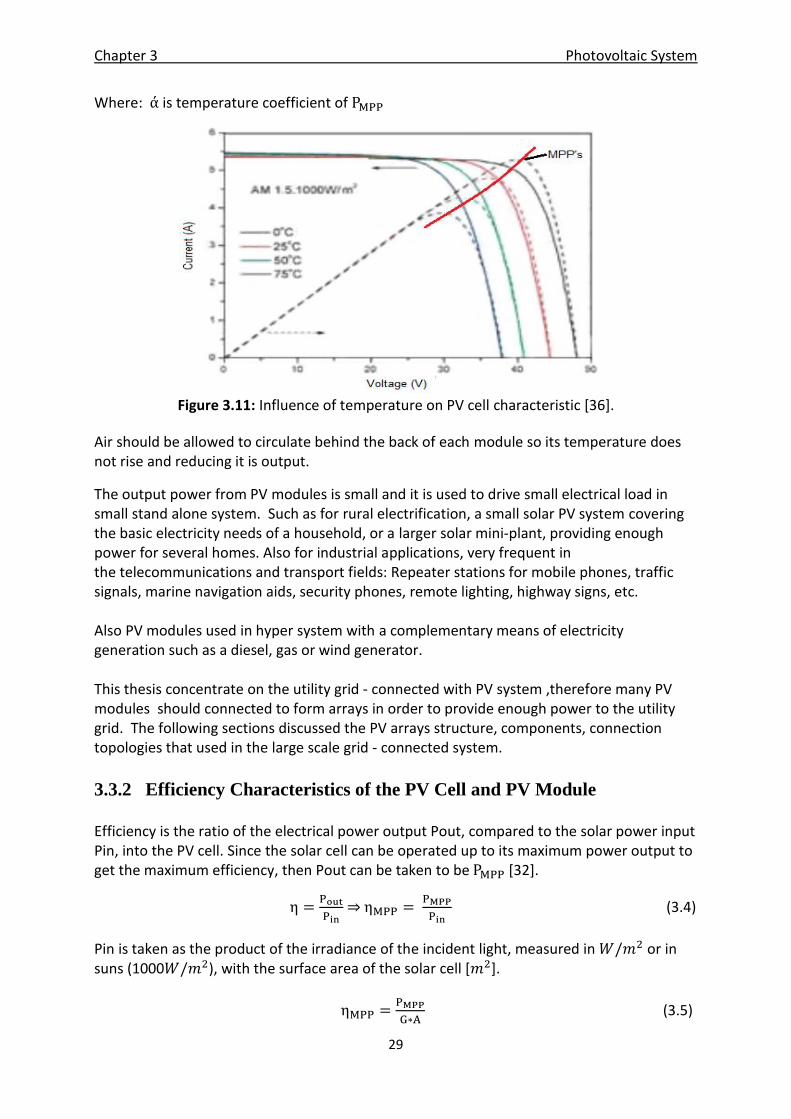
Figure 3.11 shows the effect that temperature has on the power production capabilities of a module. The MPP change with temperature, as module operating temperature increases, module voltage drops while current essentially holds steady and thus the peak power points decreases [34]. (3.8)
Chapter 3 Photovoltaic System
29
Where: is temperature coefficient of
Figure 3.11: Influence of temperature on PV cell characteristic [36].
Air should be allowed to circulate behind the back of each module so its temperature does not rise and reducing it is output.
The output power from PV modules is small and it is used to drive small electrical load in small stand alone system. Such as for rural electrification, a small solar PV system covering the basic electricity needs of a household, or a larger solar mini-plant, providing enough power for several homes. Also for industrial applications, very frequent in the telecommunications and transport fields: Repeater stations for mobile phones, traffic signals, marine navigation aids, security phones, remote lighting, highway signs, etc. Also PV modules used in hyper system with a complementary means of electricity generation such as a diesel, gas or wind generator. This thesis concentrate on the utility grid - connected with PV system ,therefore many PV modules should connected to form arrays in order to provide enough power to the utility grid. The following sections discussed the PV arrays structure, components, connection topologies that used in the large scale grid - connected system.
3.3.2 Efficiency Characteristics of the PV Cell and PV Module
Efficiency is the ratio of the electrical power output Pout, compared to the solar power input Pin, into the PV cell. Since the solar cell can be operated up to its maximum power output to get the maximum efficiency, then Pout can be taken to be [32].
(3.4)
Pin is taken as the product of the irradiance of the incident light, measured in or in suns (1000 ), with the surface area of the solar cell [ ].
(3.5)
Chapter 3 Photovoltaic System
30
Many methods have been used to calculate the efficacy of solar modules based on the ambient conditions. Eq. (3.6) shows one method which is called PV-SAT method [37, 38].
(3.6)
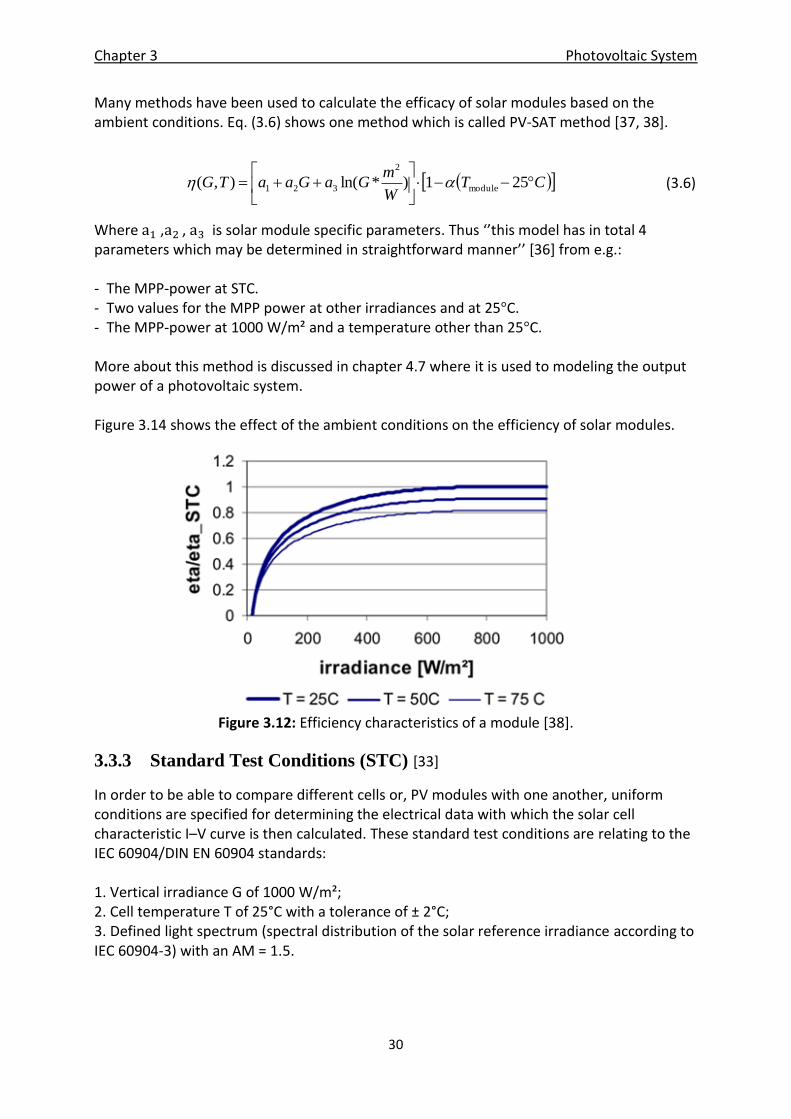
Where , , is solar module specific parameters. Thus ‘’this model has in total 4 parameters which may be determined in straightforward manner’’ [36] from e.g.: - The MPP-power at STC. - Two values for the MPP power at other irradiances and at 25 C. - The MPP-power at 1000 W/m² and a temperature other than 25 C. More about this method is discussed in chapter 4.7 where it is used to modeling the output power of a photovoltaic system. Figure 3.14 shows the effect of the ambient conditions on the efficiency of solar modules.
Figure 3.12: Efficiency characteristics of a module [38].
3.3.3 Standard Test Conditions (STC) [33]
In order to be able to compare different cells or, PV modules with one another, uniform conditions are specified for determining the electrical data with which the solar cell characteristic I–V curve is then calculated. These standard test conditions are relating to the IEC 60904/DIN EN 60904 standards: 1. Vertical irradiance G of 1000 W/m²; 2. Cell temperature T of 25°C with a tolerance of ± 2°C; 3. Defined light spectrum (spectral distribution of the solar reference irradiance according to IEC 60904-3) with an AM = 1.5.
CTW
mGaGaaTG
251)*ln(),( module
2
321
Chapter 3 Photovoltaic System
31
3.4 PV Arrays
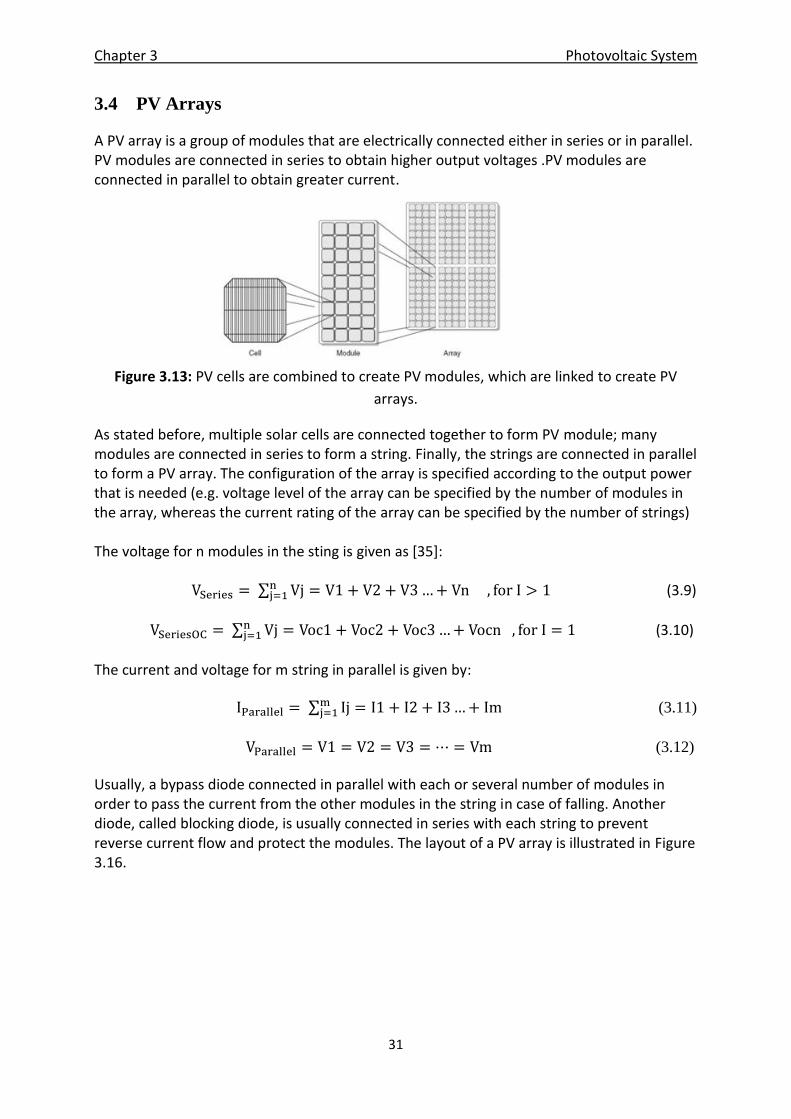
A PV array is a group of modules that are electrically connected either in series or in parallel. PV modules are connected in series to obtain higher output voltages .PV modules are connected in parallel to obtain greater current.
Figure 3.13: PV cells are combined to create PV modules, which are linked to create PV
arrays.
As stated before, multiple solar cells are connected together to form PV module; many modules are connected in series to form a string. Finally, the strings are connected in parallel to form a PV array. The configuration of the array is specified according to the output power that is needed (e.g. voltage level of the array can be specified by the number of modules in the array, whereas the current rating of the array can be specified by the number of strings) The voltage for n modules in the sting is given as [35]:
(3.9)
(3.10)
The current and voltage for m string in parallel is given by:
(3.11)
(3.12)
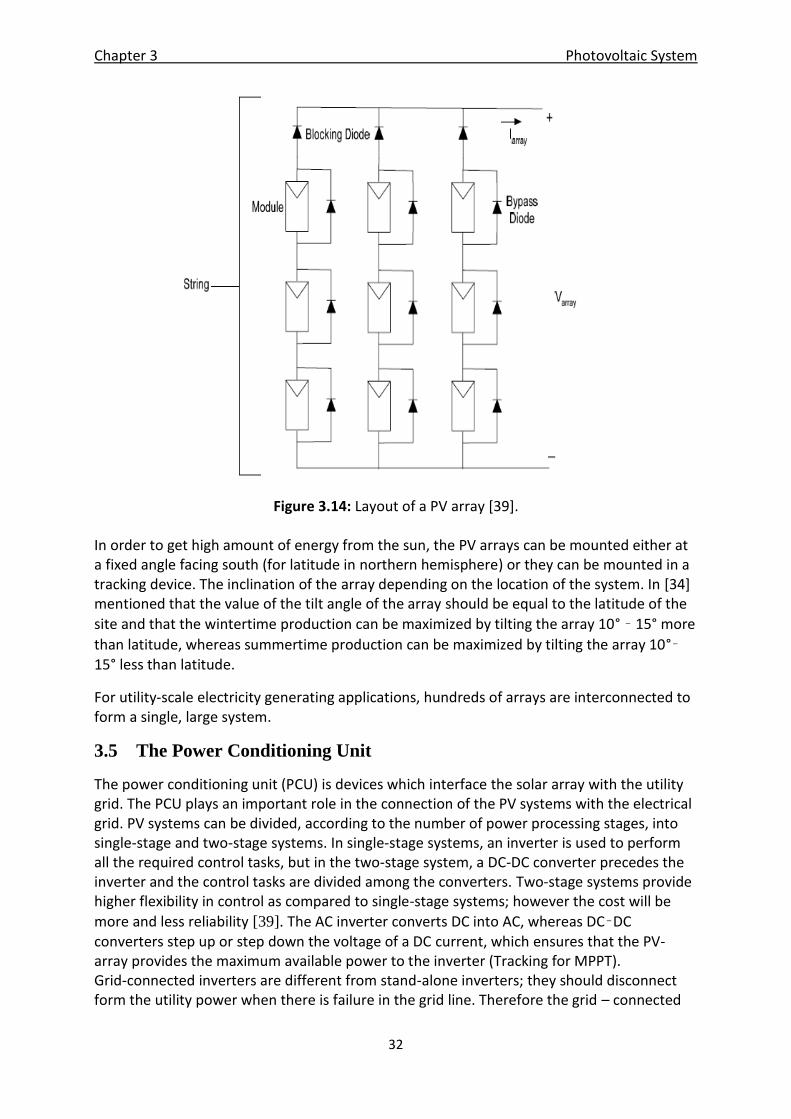
Usually, a bypass diode connected in parallel with each or several number of modules in order to pass the current from the other modules in the string in case of falling. Another diode, called blocking diode, is usually connected in series with each string to prevent reverse current flow and protect the modules. The layout of a PV array is illustrated in Figure 3.16.
Chapter 3 Photovoltaic System
32
Figure 3.14: Layout of a PV array [39]. In order to get high amount of energy from the sun, the PV arrays can be mounted either at a fixed angle facing south (for latitude in northern hemisphere) or they can be mounted in a tracking device. The inclination of the array depending on the location of the system. In [34] mentioned that the value of the tilt angle of the array should be equal to the latitude of the
site and that the wintertime production can be maximized by tilting the array 10° – 15° more
than latitude, whereas summertime production can be maximized by tilting the array 10°–15° less than latitude.
For utility-scale electricity generating applications, hundreds of arrays are interconnected to form a single, large system.
3.5 The Power Conditioning Unit
The power conditioning unit (PCU) is devices which interface the solar array with the utility grid. The PCU plays an important role in the connection of the PV systems with the electrical grid. PV systems can be divided, according to the number of power processing stages, into single-stage and two-stage systems. In single-stage systems, an inverter is used to perform all the required control tasks, but in the two-stage system, a DC-DC converter precedes the inverter and the control tasks are divided among the converters. Two-stage systems provide higher flexibility in control as compared to single-stage systems; however the cost will be
more and less reliability [39]. The AC inverter converts DC into AC, whereas DC–DC converters step up or step down the voltage of a DC current, which ensures that the PV- array provides the maximum available power to the inverter (Tracking for MPPT). Grid-connected inverters are different from stand-alone inverters; they should disconnect form the utility power when there is failure in the grid line. Therefore the grid – connected
Chapter 3 Photovoltaic System
33
inverters use frequency of the line voltage frequency on the utility line as a control signal to ensure that the PV system output is fully synchronized with the grid. Moreover, grid-connected inverters major tasks are to ensure that the PV module(s) is operated at the MPP and to inject a sinusoidal current into the grid [25].
3.6 Connection Topologies of PV Systems [39, 40]
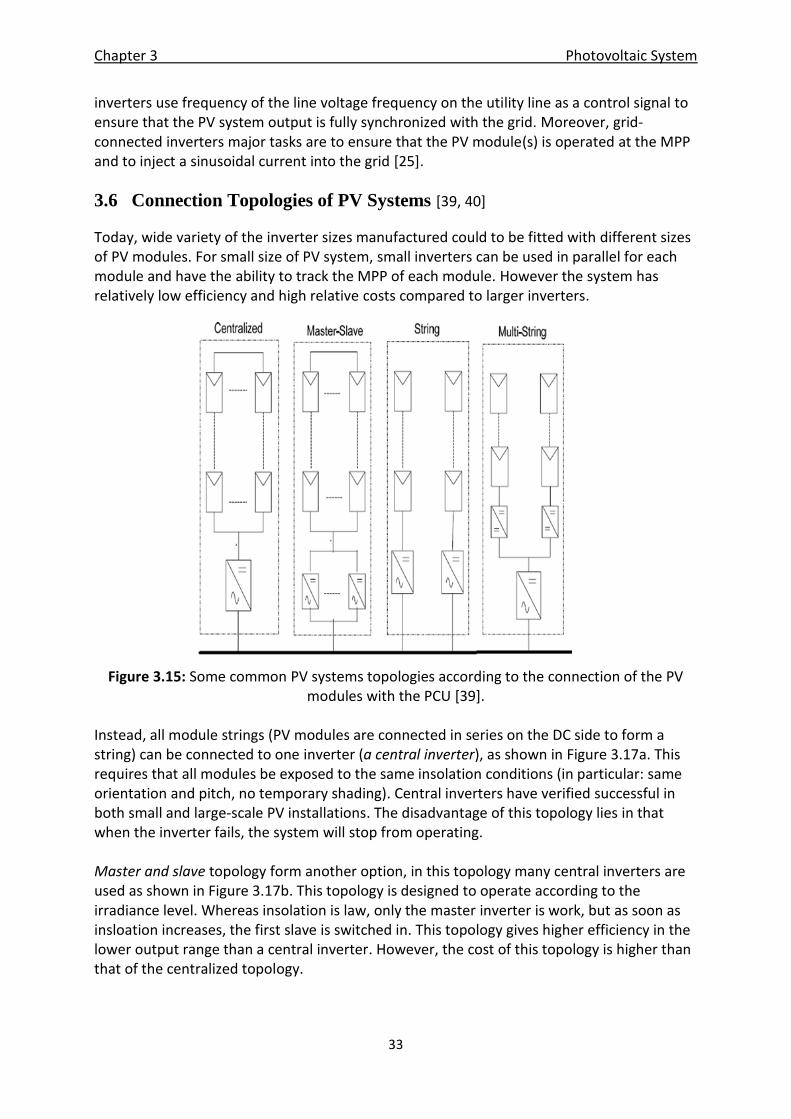
Today, wide variety of the inverter sizes manufactured could to be fitted with different sizes of PV modules. For small size of PV system, small inverters can be used in parallel for each module and have the ability to track the MPP of each module. However the system has relatively low efficiency and high relative costs compared to larger inverters.
Figure 3.15: Some common PV systems topologies according to the connection of the PV modules with the PCU [39].
Instead, all module strings (PV modules are connected in series on the DC side to form a string) can be connected to one inverter (a central inverter), as shown in Figure 3.17a. This requires that all modules be exposed to the same insolation conditions (in particular: same orientation and pitch, no temporary shading). Central inverters have verified successful in both small and large-scale PV installations. The disadvantage of this topology lies in that when the inverter fails, the system will stop from operating. Master and slave topology form another option, in this topology many central inverters are used as shown in Figure 3.17b. This topology is designed to operate according to the irradiance level. Whereas insolation is law, only the master inverter is work, but as soon as insloation increases, the first slave is switched in. This topology gives higher efficiency in the lower output range than a central inverter. However, the cost of this topology is higher than that of the centralized topology.
Chapter 3 Photovoltaic System
34
In addition to master- slave and central modules, string inverters provide a third option (Figure 3.17c); where each module string is connected to one small inverters in this topology. This connection will enable each inverter to track the MPP for each string. This topology is ideal when there are different operation points for each string module due to receiving different degree of shading. The main disadvantage of this topology is the increased cost due to the increase in the number of inverters.
A further variant of the string inverter is the multistring inverter (Figure 3.17d), each string has a DC-DC converter, which can be galvanically isolated. All DC-DC converters are connected to one DC-AC inverter. The main advantage of this topology is that, the inverter combines several MPP trackers in one device which in turn increases the energy output. This topology combines the advantages of string and centralized topologies as it increases However, the main disadvantage of this topology is that, the losses from the DC-DC converters are added to the losses of the system.
3.7 Grid-Connected Systems
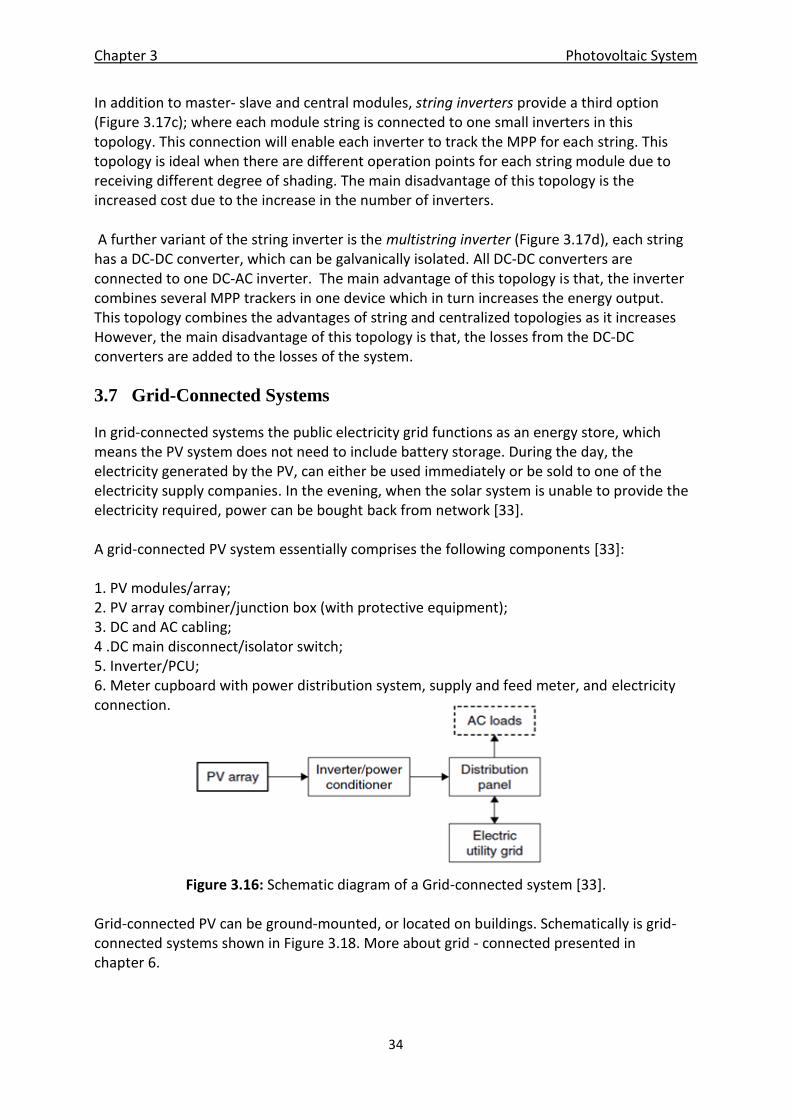
In grid-connected systems the public electricity grid functions as an energy store, which means the PV system does not need to include battery storage. During the day, the electricity generated by the PV, can either be used immediately or be sold to one of the electricity supply companies. In the evening, when the solar system is unable to provide the electricity required, power can be bought back from network [33]. A grid-connected PV system essentially comprises the following components [33]: 1. PV modules/array; 2. PV array combiner/junction box (with protective equipment); 3. DC and AC cabling; 4 .DC main disconnect/isolator switch; 5. Inverter/PCU; 6. Meter cupboard with power distribution system, supply and feed meter, and electricity connection.
Figure 3.16: Schematic diagram of a Grid-connected system [33]. Grid-connected PV can be ground-mounted, or located on buildings. Schematically is grid-connected systems shown in Figure 3.18. More about grid - connected presented in chapter 6.
Chapter 3 Photovoltaic System
35
3.8 Summary
In this chapter the principle operation of solar cells have been presented as well as the different solar cell technologies where it is classified into two generations based on either silicon wafers or thin film technologies. The solar cell provide little power, therefore many cells are combined to create PV modules, which are linked to create PV arrays in order to get the desired output. The performance of solar cell characterized by the I-V curves and it is affected by several keys factors, some of these factors have been discussed in this chapter. This thesis focused on the large scale grid – connected PV systems, therefore this chapter discussed just this application where the most important component are PV modules and inverters. For the large scale grid- connected PV systems, the main task for the inverter is to ensure that the PV module(s) is operated at the MPP and to inject a sinusoidal current into the grid. Some common PV systems topologies according to the connection of the PV modules with the PCU have been discussed in this chapter.
Chapter 4 System Model and Evaluation Method
36
4 System Mode and Evaluation Method
This chapter shows the way to estimate the output power from PV generator and the method and the tools that are used to get it.
4.1 Introduction
To find out the solar potential available at different districts in Palestine, information on solar irradiance on both, annual and hourly time scale and ambient temperature are needed Based on this, the expected output power of PV generators characterized by its components (module type, inverter Type and the orientation of its modules) can be modeled. This chapter discussed the modeling tools for solar irradiation of four districts in Palestine (Ramallah, Jerusalem, Jericho and Bethlehem) and the method that used to model the output power of the PV generator and in the next chapter discussed the option to use PV-generators production to partly cover the load of the electric supply grid in selected Palestinian districts.
4.2 Modeling Solar Irradiation Data
As described in section 3.2.3, the output power of a PV device depends on the incoming solar irradiance. The mean value of solar irradiation per unit area oriented perpendicular to the sun direction that arrives in the upper level of earth’s atmosphere is known as the solar constant and is 1367 [34]. Inside the earth’s atmosphere the irradiance is however modified by such factors as latitude, the day of the year, daytime, and the state of the atmosphere. The irradiance may be treated separately for its direct and diffuse components; the term diffuse irradiation means the irradiation that is scattered by clouds, water vapor, snow and anything else in the earth or atmosphere, while with direct irradiation the irradiation is coming directly from the sun disk. Recorded solar irradiation data at specific sites are required in order to compute the total output power of a solar cell, but detailed atmospheric records are not available in many locations around the world. When actual data are unavailable at a certain location, methods for generation of synthetic data can be used to simulate the hourly solar irradiation data for a large number of years.
4.3 Data Sources There are generally three different methods to estimate the solar resource in a specific location: The first one is to conduct ground measurements, the second is to assess radiation
Chapter 4 System Model and Evaluation Method
37
based on satellite observations and the third one is stochastic modeling based on measured average values. Some well-known available online web applications such as PVGIS [41], which based on satellite derived radiation data. Satellite data is not as accurate as ground measurements but it offers the best coverage and regular calculations for large territories.
For this master thesis ground measurements are not yet available. Therefore, only two sources have been used providing satellite data and stochastic modeling results.
Information on monthly irradiance sums are taken from:
New CM-SAF - PVGIS databases for Europe and Northern Africa:
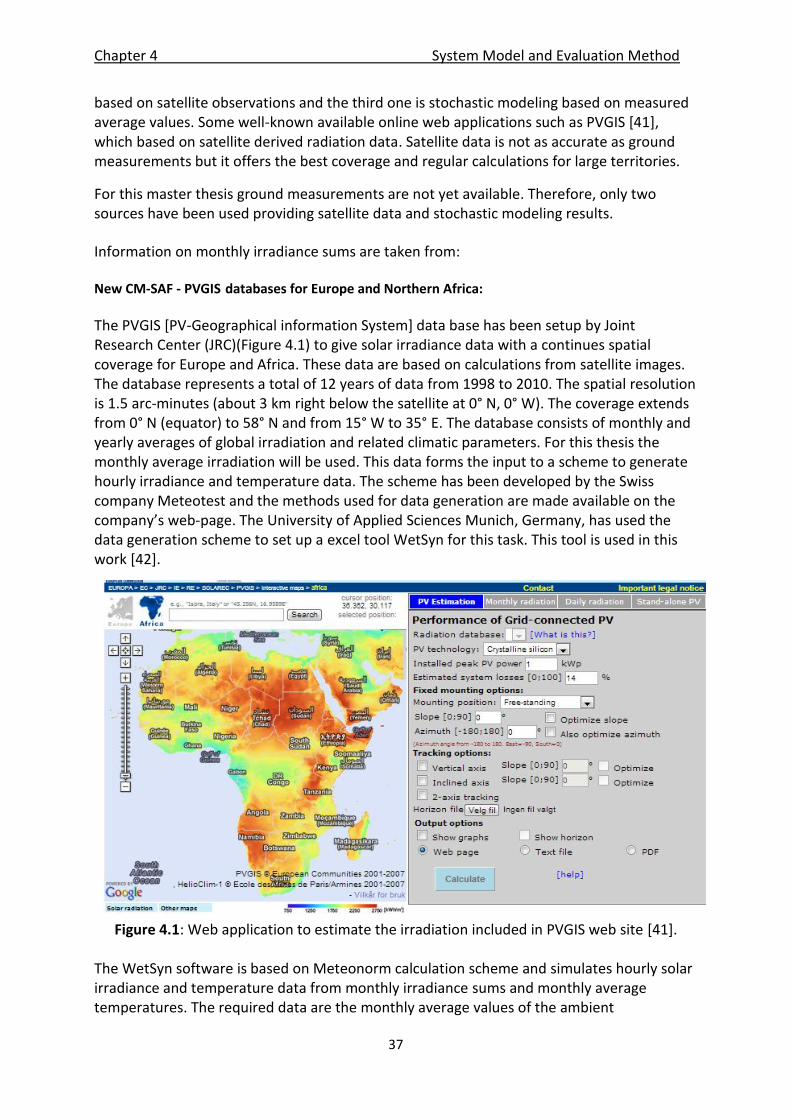
The PVGIS [PV-Geographical information System] data base has been setup by Joint Research Center (JRC)(Figure 4.1) to give solar irradiance data with a continues spatial coverage for Europe and Africa. These data are based on calculations from satellite images. The database represents a total of 12 years of data from 1998 to 2010. The spatial resolution is 1.5 arc-minutes (about 3 km right below the satellite at 0° N, 0° W). The coverage extends from 0° N (equator) to 58° N and from 15° W to 35° E. The database consists of monthly and yearly averages of global irradiation and related climatic parameters. For this thesis the monthly average irradiation will be used. This data forms the input to a scheme to generate hourly irradiance and temperature data. The scheme has been developed by the Swiss company Meteotest and the methods used for data generation are made available on the company’s web-page. The University of Applied Sciences Munich, Germany, has used the data generation scheme to set up a excel tool WetSyn for this task. This tool is used in this work [42].
Figure 4.1: Web application to estimate the irradiation included in PVGIS web site [41]. The WetSyn software is based on Meteonorm calculation scheme and simulates hourly solar irradiance and temperature data from monthly irradiance sums and monthly average temperatures. The required data are the monthly average values of the ambient
Chapter 4 System Model and Evaluation Method
38
temperature and the solar irradiation on a horizontal surface. The information on the irradiance is taken here from the PVGIS data base and the temperature data from Retscreen [43] for the locations described in section 4.5, these data are presented in appendices A & B. These data are used by the program to generate hourly solar irradiation data on a horizontal surface for one year in a very short calculation time. The program offers the direct and diffuse irradiation. As for the simulation of the performance of a PV-generator the irradiance in the plane of the generator is needed, the irradiance on the horizontal plane has to be converted to the plane irradiance. For this task standard conversion models can be applied. This calculation step is performed here in a separate excel tool. The following section shows the calculation for irradiation on tilted surface.
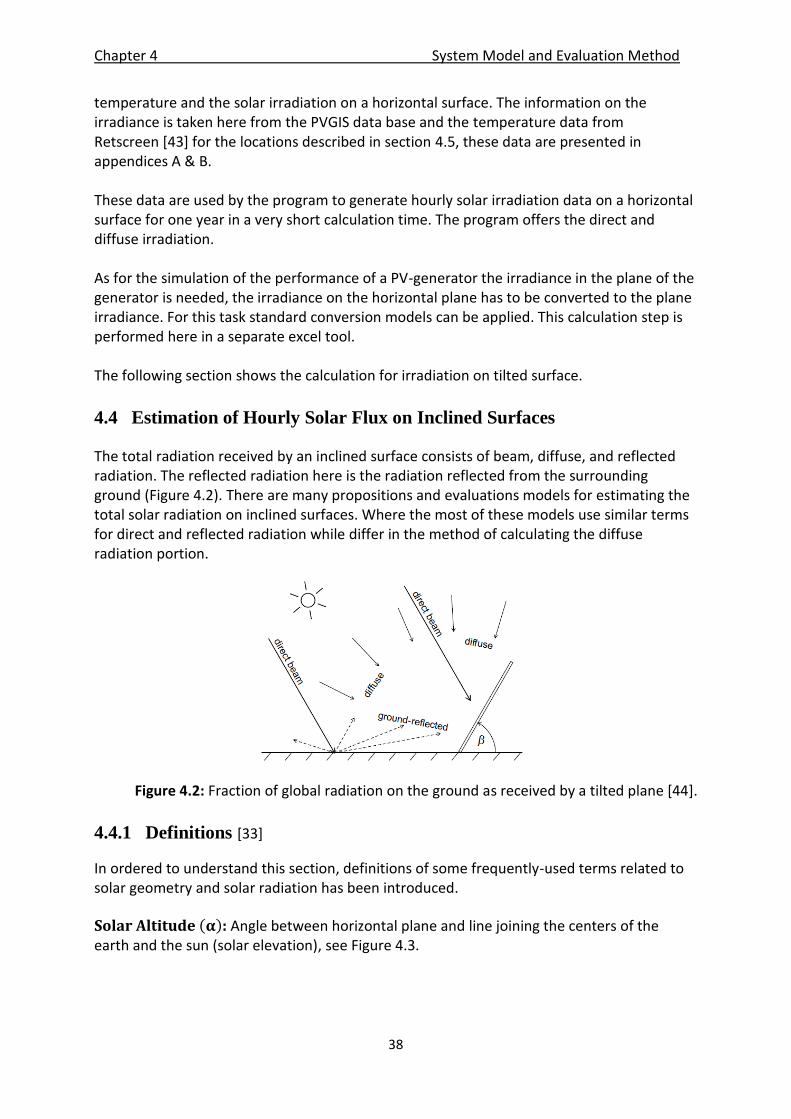
4.4 Estimation of Hourly Solar Flux on Inclined Surfaces The total radiation received by an inclined surface consists of beam, diffuse, and reflected radiation. The reflected radiation here is the radiation reflected from the surrounding ground (Figure 4.2). There are many propositions and evaluations models for estimating the total solar radiation on inclined surfaces. Where the most of these models use similar terms for direct and reflected radiation while differ in the method of calculating the diffuse radiation portion.
Figure 4.2: Fraction of global radiation on the ground as received by a tilted plane [44].
4.4.1 Definitions [33]
In ordered to understand this section, definitions of some frequently-used terms related to solar geometry and solar radiation has been introduced.
Solar Altitude : Angle between horizontal plane and line joining the centers of the earth and the sun (solar elevation), see Figure 4.3.
Chapter 4 System Model and Evaluation Method
39
Solar Azimuth Angle : The angle between the projection of the straight line joining the centers of the earth and the sun on the horizontal plane and the north-south line at a given location, see Figure 4.3.
Declination :It is the angle between the sun-earth center line and the projection of this line on the equatorial plane .Declinations north of the equator are positive and those south are negative, see Figure 4.4.
Hour Angle : The angle between the sun projection on the equatorial plane at a given time and the sun projection on the same plane at solar noon, see Figure 4.4.
Zenith Angle : The angle between the suns ray’s and the vertical, see Figure 4.4.
Local Latitude : Is the angle between a line from the center of the earth to site of interest and equatorial plane, see Figure 4.4.
Incidence Angle :Is the angle between the sun’s rays and the normal on a surface, see Figure 4.5.
Reflectance The ratio of radiation reflected from a surface to that incident on the surface. Reflectivity is the property of reflecting radiation, possessed by all materials to varying extents, called the albedo in atmospheric references.
Irradiance : The rate at which radiant energy is incident on a surface, per unit area of surface [ ].
Irradiation: The energy collected per square meter during a specific time interval. If the considered time interval is a day or a year, the terms ‘daily irradiation’ or ‘annual irradiation’ may be used. It has unit [ . Beam Radiation : Solar irradiation received by sun without scattering by i.e. clouds.
Diffuse Radiation : Solar irradiation received by sun after scattering (and change of direction) by the atmosphere.
Direct Normal Irradiation DNI : Beam irradiance perpendicular to a surface. Global Solar Radiation on horizontal plane : Sum of beam and diffuse radiation on horizontal.
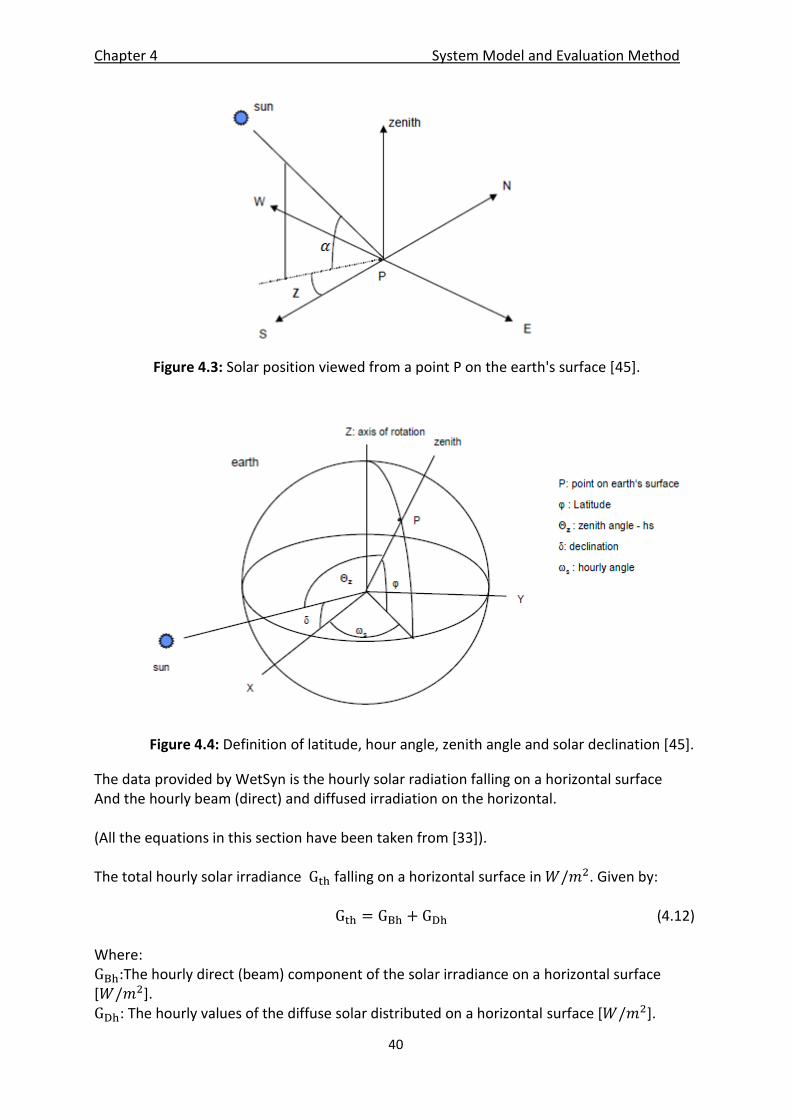
Chapter 4 System Model and Evaluation Method
40
Figure 4.3: Solar position viewed from a point P on the earth's surface [45].
Figure 4.4: Definition of latitude, hour angle, zenith angle and solar declination [45].
The data provided by WetSyn is the hourly solar radiation falling on a horizontal surface And the hourly beam (direct) and diffused irradiation on the horizontal. (All the equations in this section have been taken from [33]). The total hourly solar irradiance falling on a horizontal surface in . Given by: (4.12) Where: The hourly direct (beam) component of the solar irradiance on a horizontal surface [ ]. : The hourly values of the diffuse solar distributed on a horizontal surface [ ].
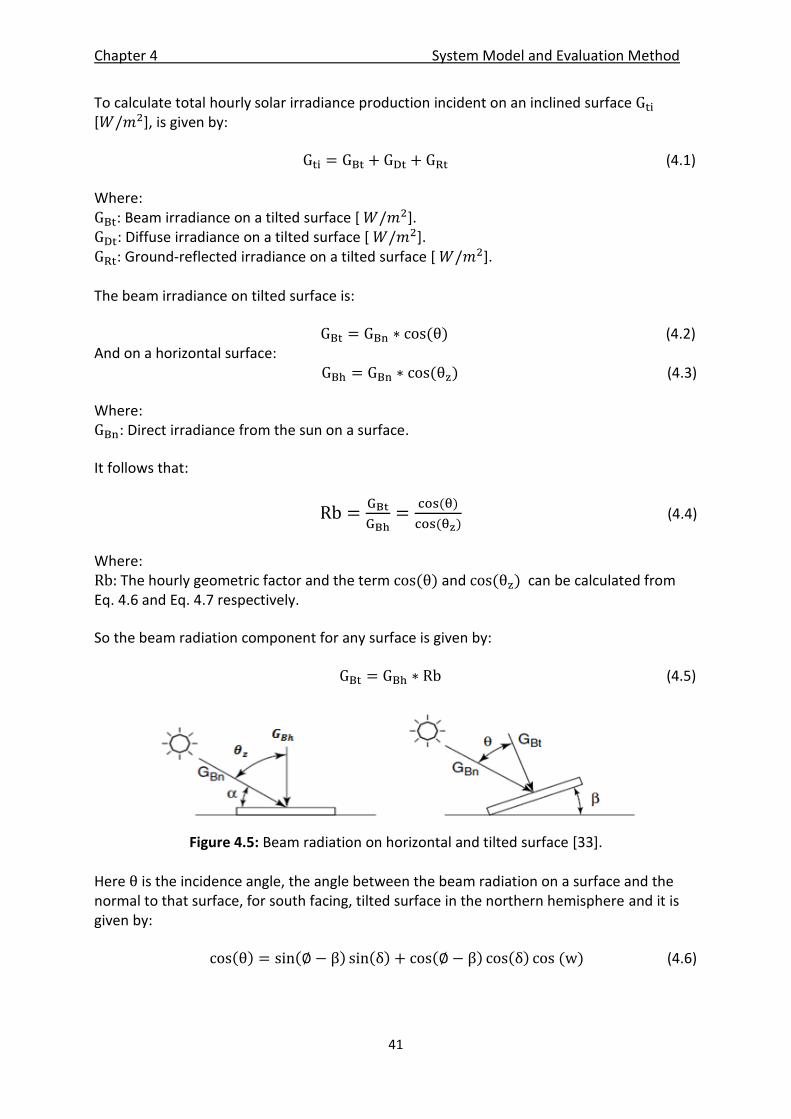
Chapter 4 System Model and Evaluation Method
41
To calculate total hourly solar irradiance production incident on an inclined surface [ ], is given by: (4.1) Where: : Beam irradiance on a tilted surface [ ]. : Diffuse irradiance on a tilted surface [ ]. : Ground-reflected irradiance on a tilted surface [ ]. The beam irradiance on tilted surface is: (4.2) And on a horizontal surface: (4.3) Where: : Direct irradiance from the sun on a surface. It follows that:
(4.4)
Where: The hourly geometric factor and the term and can be calculated from Eq. 4.6 and Eq. 4.7 respectively. So the beam radiation component for any surface is given by: (4.5)
Figure 4.5: Beam radiation on horizontal and tilted surface [33]. Here is the incidence angle, the angle between the beam radiation on a surface and the normal to that surface, for south facing, tilted surface in the northern hemisphere and it is given by:
(4.6)

Chapter 4 System Model and Evaluation Method
42
And the solar zenith angle calculated by:
(4.7)
Where:
: The location latitude angle (in degree) : Solar Altitude
The declination angle of the sun (in degrees) given by (ASHRAE 2007):
(4.8)
n: The day of the year under consideration (1 to365). See appendix C.
w: The hour angle of the sun (in degrees) given by:
(4.9)
h: The time of the day (solar time) in hours.
Because the day number and the hour of the year are frequently required in solar geometry calculation table in appendix C is given for easy reference.
Now to calculate for diffuse radiation on tilted surface :
(4.10)
This model refers to the assumption of a uniformly distributed diffuse irradiance and is known as the Liu and Jordan model [33]. The Ground – reflected radiation is obtained by:
(4.11)
Where: The angle the surface makes with the horizontal. Constant which depends on the type of ground surrounding the tilted surface and is called the ground reflectance (albedo constant). Then, the total hourly solar radiation energy incident on an inclined surface [ ], is given by:
(4.13)
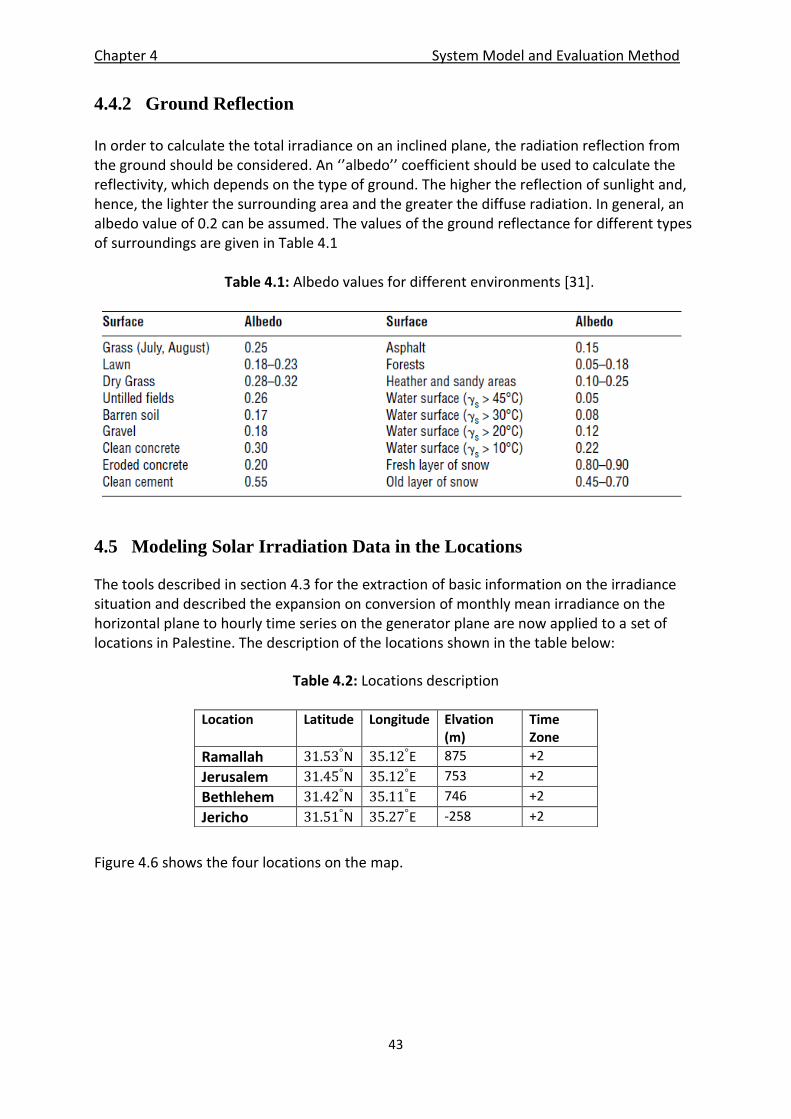
Chapter 4 System Model and Evaluation Method
43
4.4.2 Ground Reflection
In order to calculate the total irradiance on an inclined plane, the radiation reflection from the ground should be considered. An ‘’albedo’’ coefficient should be used to calculate the reflectivity, which depends on the type of ground. The higher the reflection of sunlight and, hence, the lighter the surrounding area and the greater the diffuse radiation. In general, an albedo value of 0.2 can be assumed. The values of the ground reflectance for different types of surroundings are given in Table 4.1 Table 4.1: Albedo values for different environments [31].
4.5 Modeling Solar Irradiation Data in the Locations
The tools described in section 4.3 for the extraction of basic information on the irradiance situation and described the expansion on conversion of monthly mean irradiance on the horizontal plane to hourly time series on the generator plane are now applied to a set of locations in Palestine. The description of the locations shown in the table below:
Table 4.2: Locations description
Figure 4.6 shows the four locations on the map.
Location Latitude Longitude Elvation (m)
Time Zone
Ramallah N E 875 +2
Jerusalem N E 753 +2
Bethlehem N E 746 +2
Jericho N E -258 +2
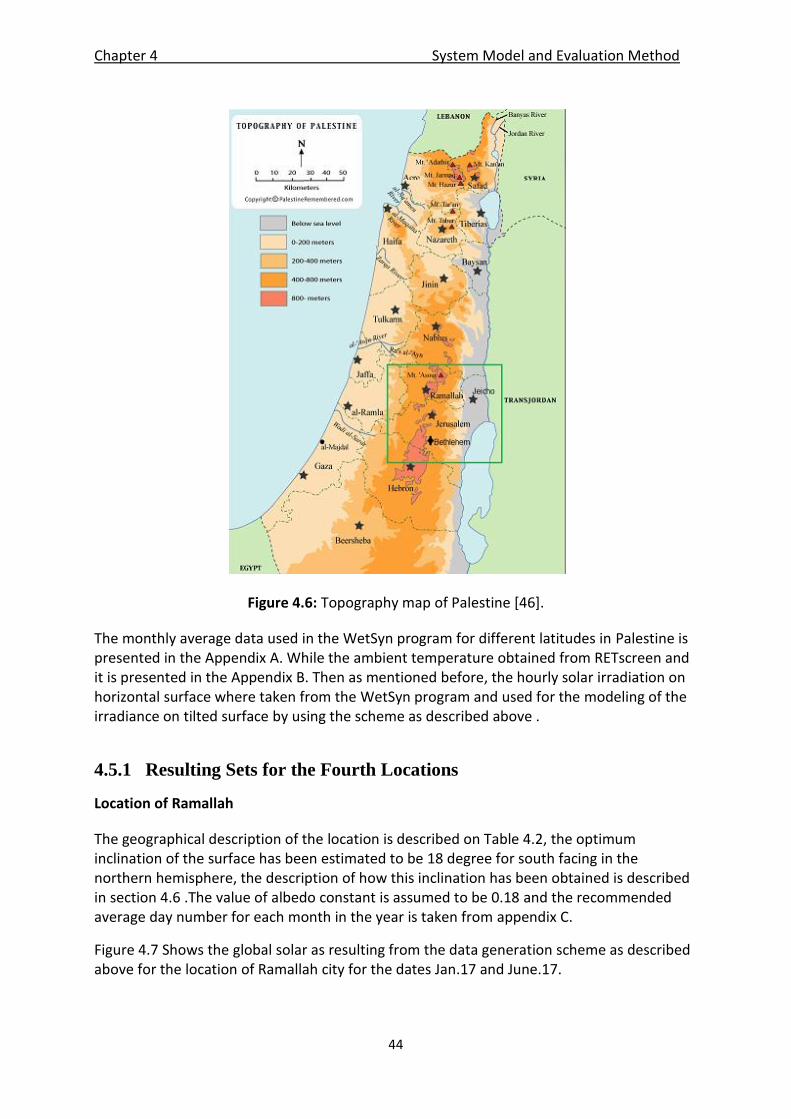
Chapter 4 System Model and Evaluation Method
44
Figure 4.6: Topography map of Palestine [46].
The monthly average data used in the WetSyn program for different latitudes in Palestine is presented in the Appendix A. While the ambient temperature obtained from RETscreen and it is presented in the Appendix B. Then as mentioned before, the hourly solar irradiation on horizontal surface where taken from the WetSyn program and used for the modeling of the irradiance on tilted surface by using the scheme as described above .
4.5.1 Resulting Sets for the Fourth Locations
Location of Ramallah
The geographical description of the location is described on Table 4.2, the optimum inclination of the surface has been estimated to be 18 degree for south facing in the northern hemisphere, the description of how this inclination has been obtained is described in section 4.6 .The value of albedo constant is assumed to be 0.18 and the recommended average day number for each month in the year is taken from appendix C.
Figure 4.7 Shows the global solar as resulting from the data generation scheme as described above for the location of Ramallah city for the dates Jan.17 and June.17.
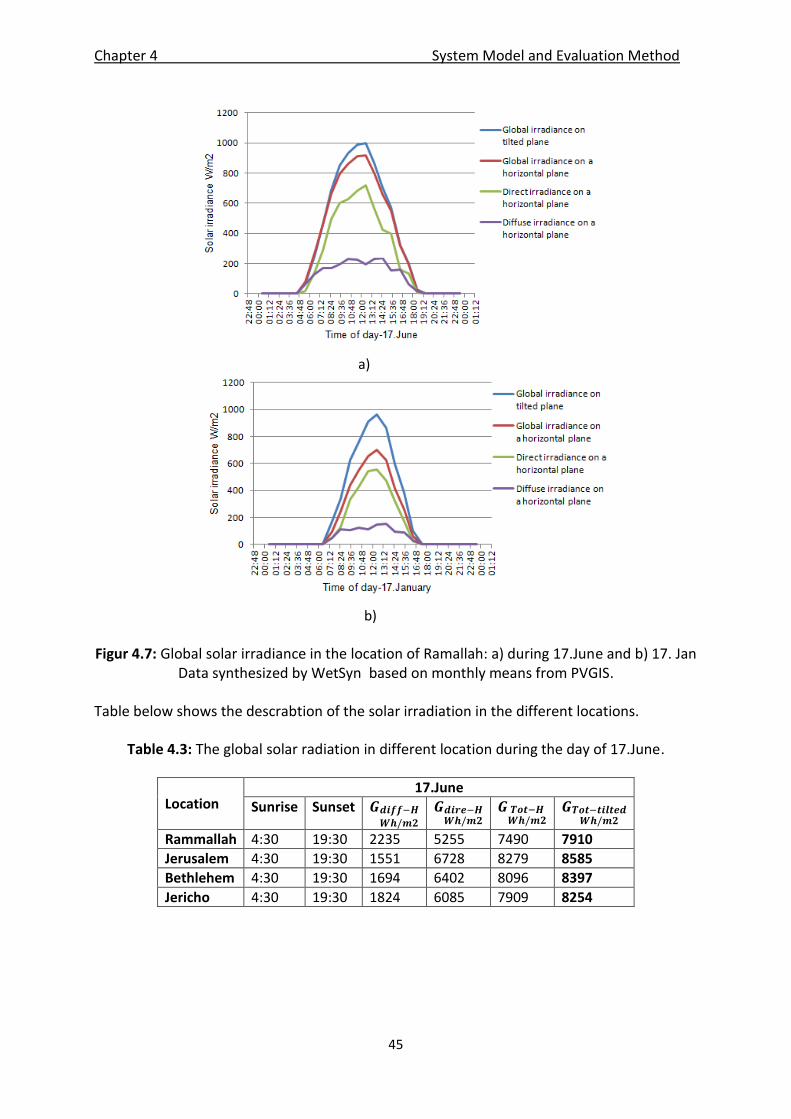
Chapter 4 System Model and Evaluation Method
45
a)
b)
Figur 4.7: Global solar irradiance in the location of Ramallah: a) during 17.June and b) 17. Jan Data synthesized by WetSyn based on monthly means from PVGIS.
Table below shows the descrabtion of the solar irradiation in the different locations.
Table 4.3: The global solar radiation in different location during the day of 17.June.
Location 17.June
Sunrise Sunset
Rammallah 4:30 19:30 2235 5255 7490 7910
Jerusalem 4:30 19:30 1551 6728 8279 8585
Bethlehem 4:30 19:30 1694 6402 8096 8397
Jericho 4:30 19:30 1824 6085 7909 8254
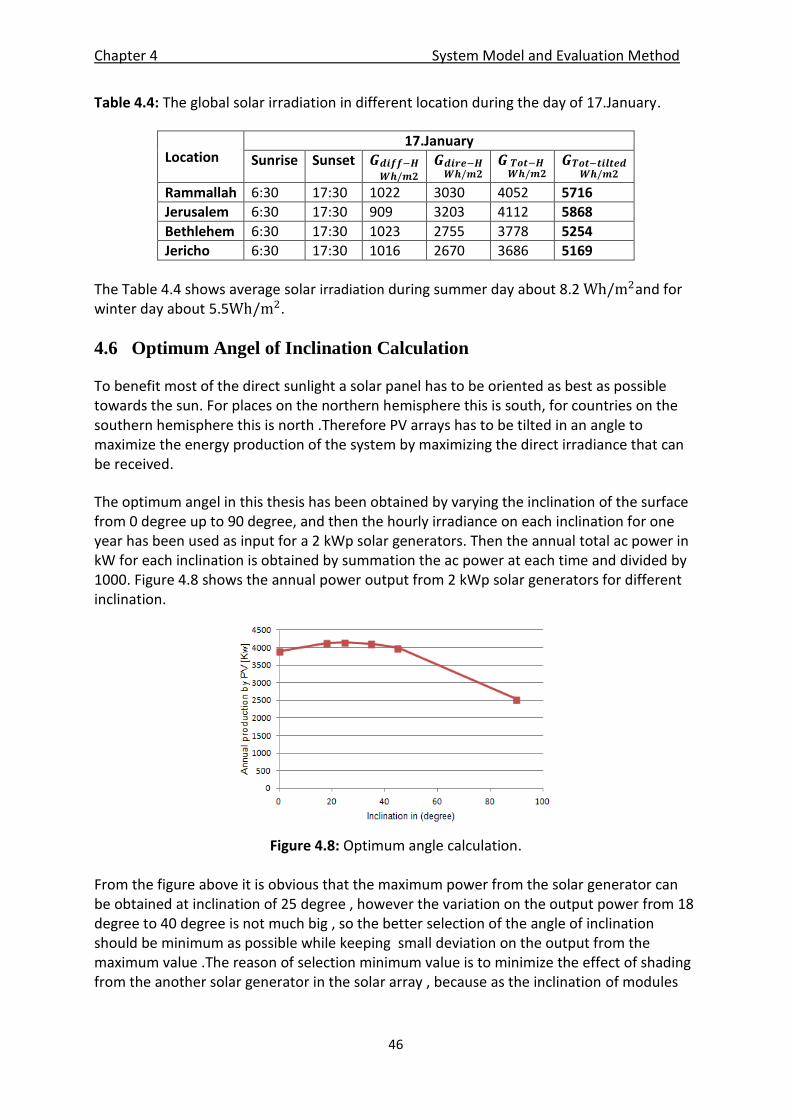
Chapter 4 System Model and Evaluation Method
46
Table 4.4: The global solar irradiation in different location during the day of 17.January.
Location 17.January
Sunrise Sunset
Rammallah 6:30 17:30 1022 3030 4052 5716
Jerusalem 6:30 17:30 909 3203 4112 5868
Bethlehem 6:30 17:30 1023 2755 3778 5254
Jericho 6:30 17:30 1016 2670 3686 5169
The Table 4.4 shows average solar irradiation during summer day about 8.2 and for winter day about 5.5 .
4.6 Optimum Angel of Inclination Calculation
To benefit most of the direct sunlight a solar panel has to be oriented as best as possible towards the sun. For places on the northern hemisphere this is south, for countries on the southern hemisphere this is north .Therefore PV arrays has to be tilted in an angle to maximize the energy production of the system by maximizing the direct irradiance that can be received.
The optimum angel in this thesis has been obtained by varying the inclination of the surface from 0 degree up to 90 degree, and then the hourly irradiance on each inclination for one year has been used as input for a 2 kWp solar generators. Then the annual total ac power in kW for each inclination is obtained by summation the ac power at each time and divided by 1000. Figure 4.8 shows the annual power output from 2 kWp solar generators for different inclination.
Figure 4.8: Optimum angle calculation.
From the figure above it is obvious that the maximum power from the solar generator can be obtained at inclination of 25 degree , however the variation on the output power from 18 degree to 40 degree is not much big , so the better selection of the angle of inclination should be minimum as possible while keeping small deviation on the output from the maximum value .The reason of selection minimum value is to minimize the effect of shading from the another solar generator in the solar array , because as the inclination of modules
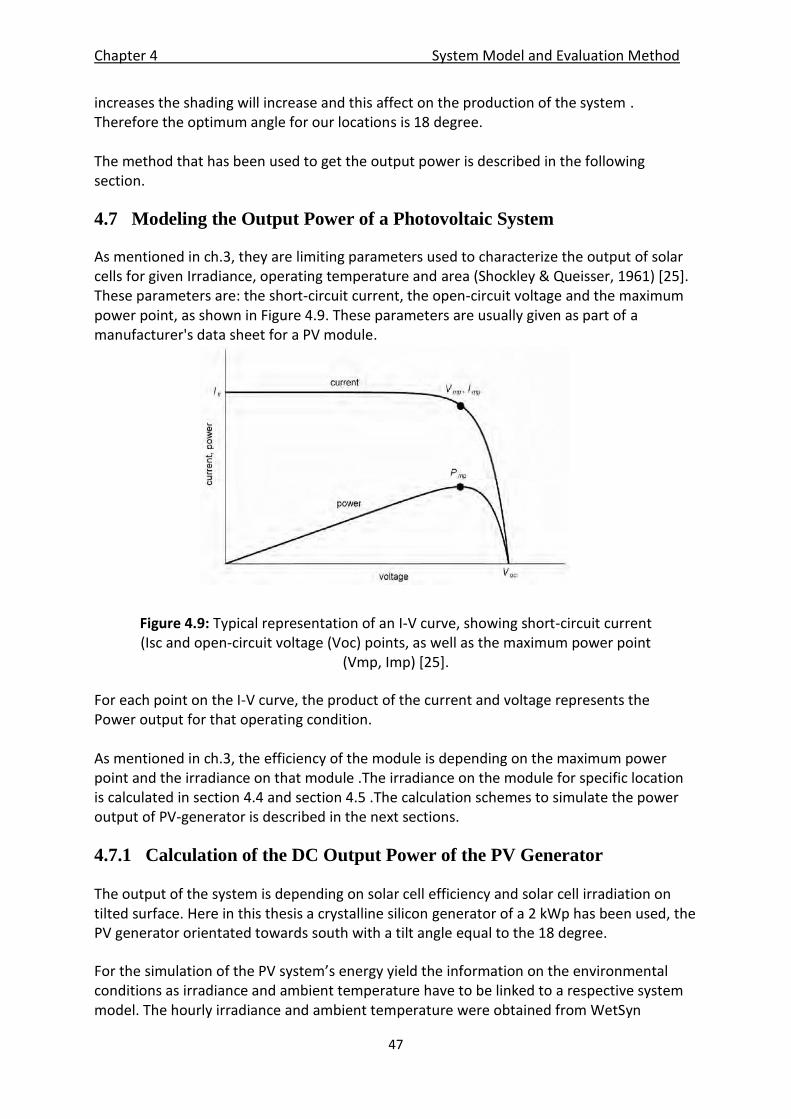
Chapter 4 System Model and Evaluation Method
47
increases the shading will increase and this affect on the production of the system . Therefore the optimum angle for our locations is 18 degree. The method that has been used to get the output power is described in the following section.
4.7 Modeling the Output Power of a Photovoltaic System
As mentioned in ch.3, they are limiting parameters used to characterize the output of solar cells for given Irradiance, operating temperature and area (Shockley & Queisser, 1961) [25]. These parameters are: the short-circuit current, the open-circuit voltage and the maximum power point, as shown in Figure 4.9. These parameters are usually given as part of a manufacturer's data sheet for a PV module.
Figure 4.9: Typical representation of an I-V curve, showing short-circuit current (Isc and open-circuit voltage (Voc) points, as well as the maximum power point
(Vmp, Imp) [25].
For each point on the I-V curve, the product of the current and voltage represents the Power output for that operating condition. As mentioned in ch.3, the efficiency of the module is depending on the maximum power point and the irradiance on that module .The irradiance on the module for specific location is calculated in section 4.4 and section 4.5 .The calculation schemes to simulate the power output of PV-generator is described in the next sections.
4.7.1 Calculation of the DC Output Power of the PV Generator
The output of the system is depending on solar cell efficiency and solar cell irradiation on tilted surface. Here in this thesis a crystalline silicon generator of a 2 kWp has been used, the PV generator orientated towards south with a tilt angle equal to the 18 degree.
For the simulation of the PV system’s energy yield the information on the environmental conditions as irradiance and ambient temperature have to be linked to a respective system model. The hourly irradiance and ambient temperature were obtained from WetSyn
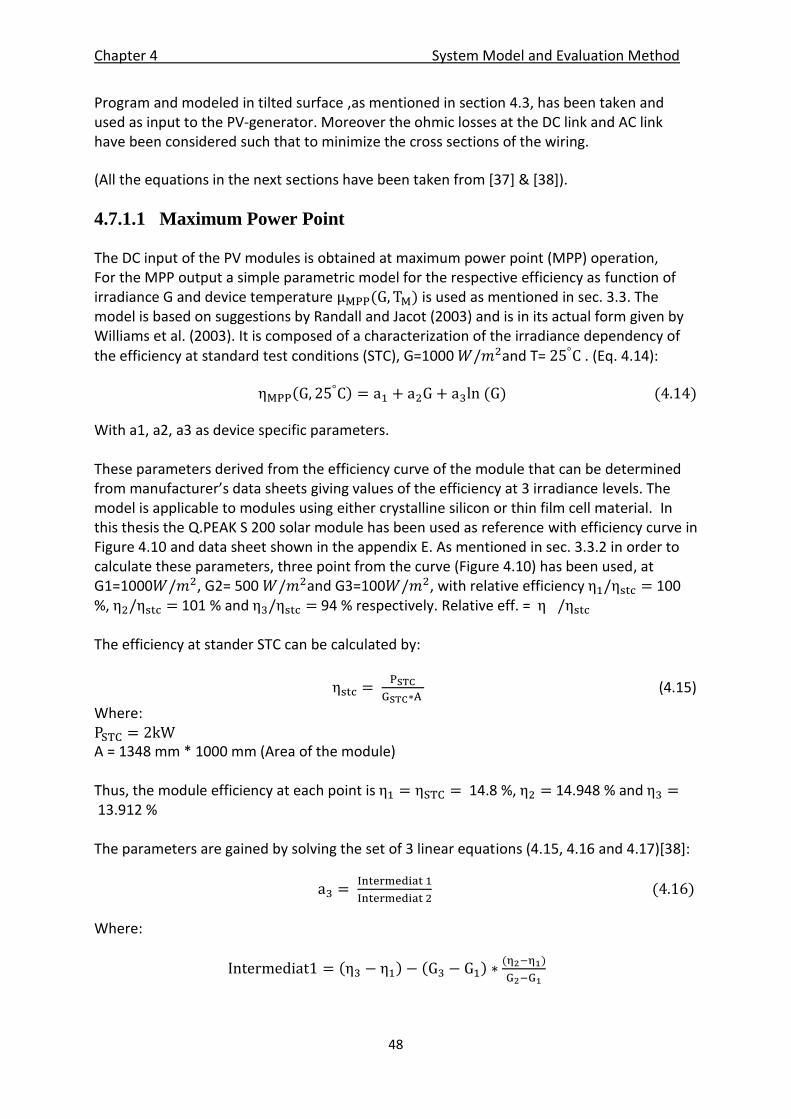
Chapter 4 System Model and Evaluation Method
48
Program and modeled in tilted surface ,as mentioned in section 4.3, has been taken and used as input to the PV-generator. Moreover the ohmic losses at the DC link and AC link have been considered such that to minimize the cross sections of the wiring.
(All the equations in the next sections have been taken from [37] & [38]).
4.7.1.1 Maximum Power Point
The DC input of the PV modules is obtained at maximum power point (MPP) operation, For the MPP output a simple parametric model for the respective efficiency as function of irradiance G and device temperature is used as mentioned in sec. 3.3. The model is based on suggestions by Randall and Jacot (2003) and is in its actual form given by Williams et al. (2003). It is composed of a characterization of the irradiance dependency of the efficiency at standard test conditions (STC), G=1000 and T= . (Eq. 4.14):
(4.14)
With a1, a2, a3 as device specific parameters. These parameters derived from the efficiency curve of the module that can be determined from manufacturer’s data sheets giving values of the efficiency at 3 irradiance levels. The model is applicable to modules using either crystalline silicon or thin film cell material. In this thesis the Q.PEAK S 200 solar module has been used as reference with efficiency curve in Figure 4.10 and data sheet shown in the appendix E. As mentioned in sec. 3.3.2 in order to calculate these parameters, three point from the curve (Figure 4.10) has been used, at G1=1000 , G2= 500 and G3=100 , with relative efficiency 100 %, 101 % and 94 % respectively. Relative eff. = The efficiency at stander STC can be calculated by:
(4.15)
Where: A = 1348 mm * 1000 mm (Area of the module) Thus, the module efficiency at each point is 14.8 %, 14.948 % and 13.912 % The parameters are gained by solving the set of 3 linear equations (4.15, 4.16 and 4.17)[38]:
(4.16)
Where:
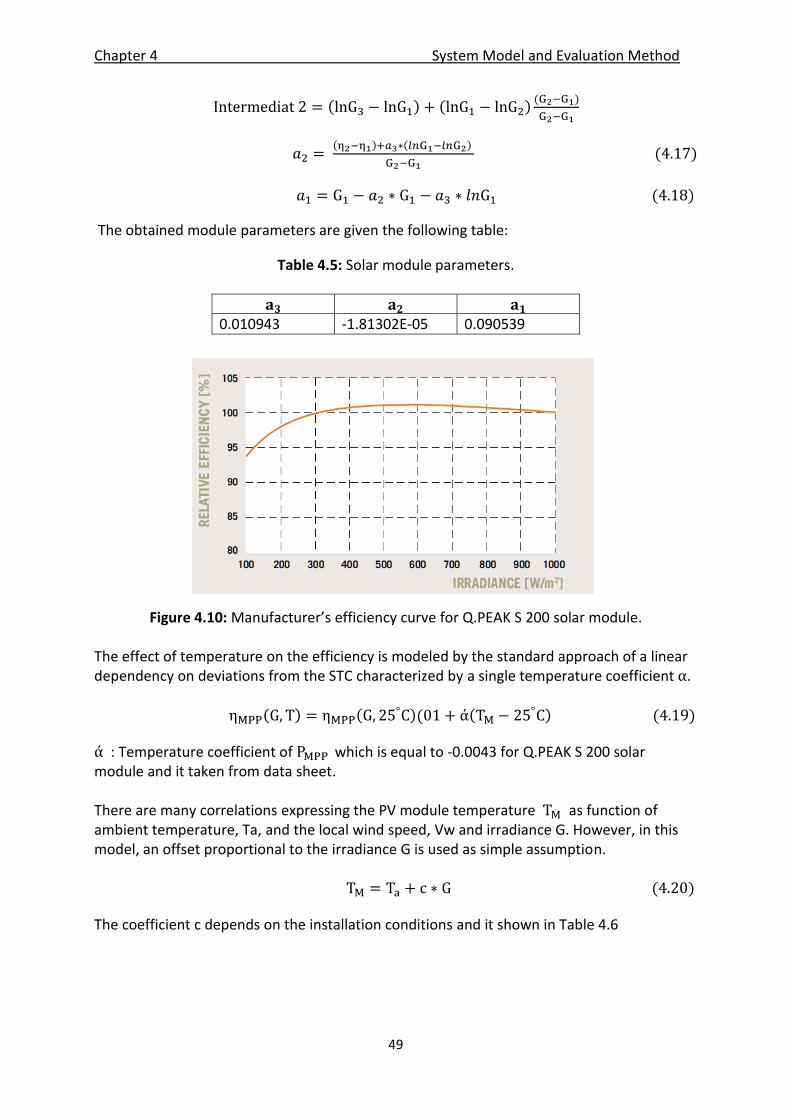
Chapter 4 System Model and Evaluation Method
49
(4.17)
(4.18)
The obtained module parameters are given the following table:
Table 4.5: Solar module parameters.
0.010943 -1.81302E-05 0.090539
Figure 4.10: Manufacturer’s efficiency curve for Q.PEAK S 200 solar module. The effect of temperature on the efficiency is modeled by the standard approach of a linear dependency on deviations from the STC characterized by a single temperature coefficient .
(4.19)
: Temperature coefficient of which is equal to -0.0043 for Q.PEAK S 200 solar module and it taken from data sheet. There are many correlations expressing the PV module temperature as function of ambient temperature, Ta, and the local wind speed, Vw and irradiance G. However, in this model, an offset proportional to the irradiance G is used as simple assumption. (4.20)
The coefficient c depends on the installation conditions and it shown in Table 4.6
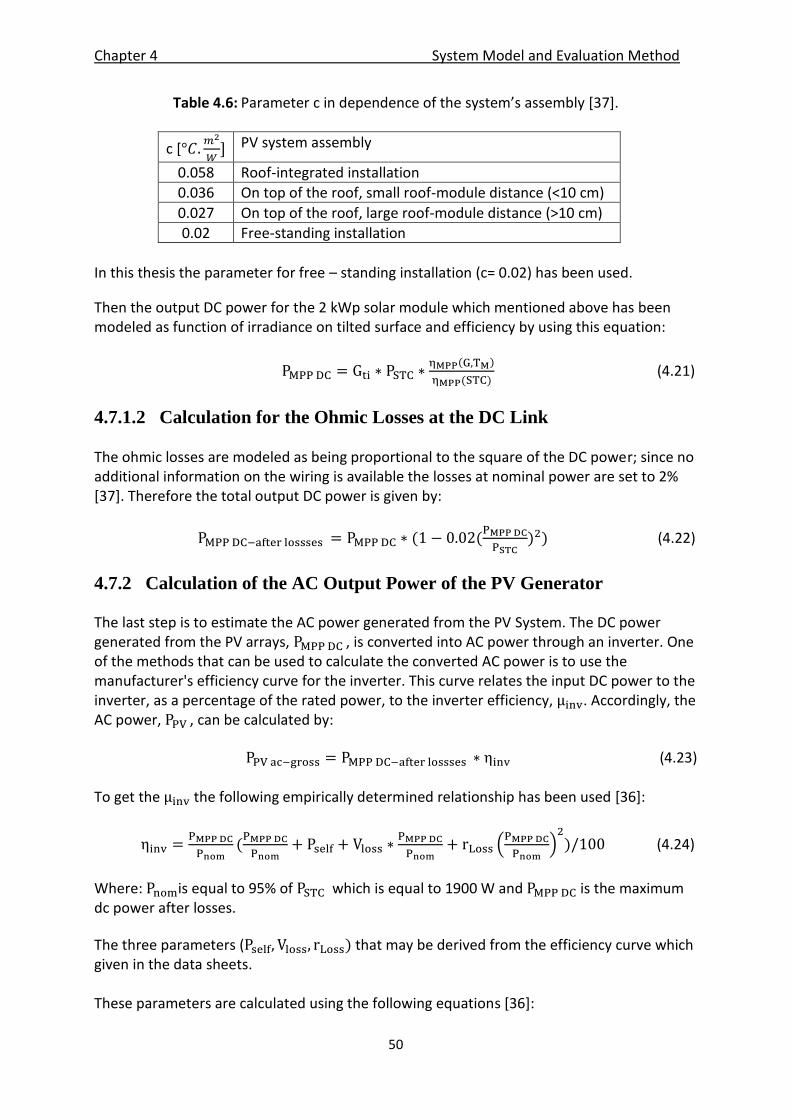
Chapter 4 System Model and Evaluation Method
50
Table 4.6: Parameter c in dependence of the system’s assembly [37].
c [
PV system assembly
0.058 Roof-integrated installation
0.036 On top of the roof, small roof-module distance (<10 cm)
0.027 On top of the roof, large roof-module distance (>10 cm)
0.02 Free-standing installation
In this thesis the parameter for free – standing installation (c= 0.02) has been used.
Then the output DC power for the 2 kWp solar module which mentioned above has been modeled as function of irradiance on tilted surface and efficiency by using this equation:
(4.21)
4.7.1.2 Calculation for the Ohmic Losses at the DC Link The ohmic losses are modeled as being proportional to the square of the DC power; since no additional information on the wiring is available the losses at nominal power are set to 2% [37]. Therefore the total output DC power is given by:
) (4.22)
4.7.2 Calculation of the AC Output Power of the PV Generator
The last step is to estimate the AC power generated from the PV System. The DC power generated from the PV arrays, , is converted into AC power through an inverter. One of the methods that can be used to calculate the converted AC power is to use the manufacturer's efficiency curve for the inverter. This curve relates the input DC power to the inverter, as a percentage of the rated power, to the inverter efficiency, . Accordingly, the AC power, , can be calculated by:
(4.23)
To get the the following empirically determined relationship has been used [36]:
(4.24)
Where: is equal to 95% of which is equal to 1900 W and is the maximum dc power after losses.
The three parameters ( that may be derived from the efficiency curve which given in the data sheets. These parameters are calculated using the following equations [36]:
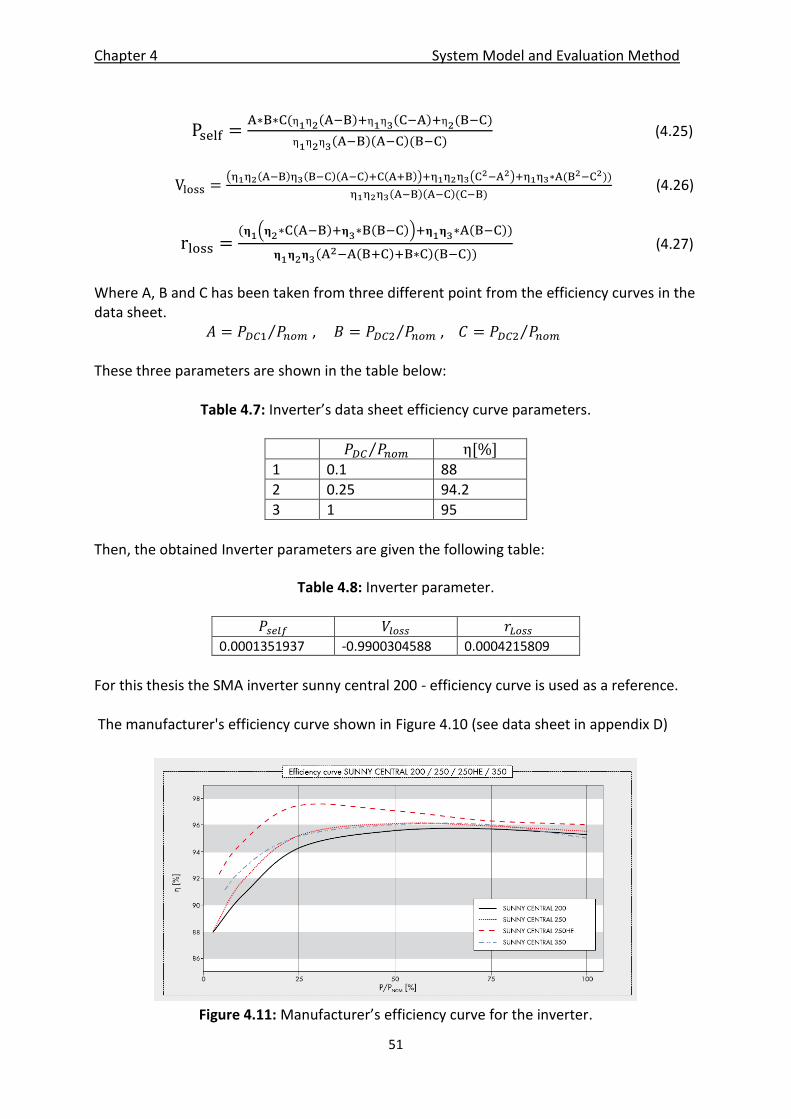
Chapter 4 System Model and Evaluation Method
51
(4.25)
(4.26)
(4.27)
Where A, B and C has been taken from three different point from the efficiency curves in the data sheet. , , These three parameters are shown in the table below:
Table 4.7: Inverter’s data sheet efficiency curve parameters.
1 0.1 88
2 0.25 94.2
3 1 95
Then, the obtained Inverter parameters are given the following table:
Table 4.8: Inverter parameter.
0.0001351937 -0.9900304588 0.0004215809
For this thesis the SMA inverter sunny central 200 - efficiency curve is used as a reference. The manufacturer's efficiency curve shown in Figure 4.10 (see data sheet in appendix D)
Figure 4.11: Manufacturer’s efficiency curve for the inverter.
Chapter 4 System Model and Evaluation Method
52
4.7.2.1 Calculation for the Ohmic Losses at the AC Link
As mentioned before, the ohmic losses are set 2%, Therefore the total output AC power is given by:
(4.28)
The power output states for the PV solar cell are presented in the next chapter.
4.8 Summery
In this chapter different tool has been used to estimate the hourly solar irradiation data at the horizontal on different locations in Palestine for one day in summer and one day in winter. Based on these data one model has been used to estimate the hourly solar irradiation on inclined surfaces. The way to get the optimum inclination of the surfaces has been discussed in this chapter. Where the hourly solar irradiation data at the horizontal generated by the WetSyn software, this program is a practical tool for studying many locations around the world as only monthly average data and latitude are required. This chapter shows that the average solar irradiation in the selected locations during summer day is about 8.2 and for winter day about 5.5 . The data for the irradiance on inclined panels has been used to model the output of a 2 kWp PV-generator operating at maximum power with 18 degree inclination at the different locations for the selected days. The calculation the output power is based on a simple parametric model for the respective efficiency as function of irradiance and device temperature. The output power of the PV-generator will be used in the next chapter to study the option to use PV-generators to partly cover the load of the electric supply grid in selected Palestinian districts.
Chapter 5 PV-Network Matching
53
5 PV- Network Matching
In this chapter the matching of the load profile with the PV output profile of a 2 – kWp generator as reference is assessed, while in chapter 6 these characteristic will be scaled up to a MWp to match the real utility load.
5.1 Introduction
One of the added values of the integration of PV systems into the network is defined by the relevance of PV to meet the electrical grid demand peak, which depends on the correlation between daily and seasonal load characteristics of the electrical grid and peak solar generation. Therefore, the objective of this chapter is to compare the solar electricity profile with the power demand of the electrical grid. This chapter will discuss on the option to use PV-generators to partly cover the load of the electric supply grid in selected Palestinian districts. This chapter also will discuss the annual and monthly energy yield of the PV-generator. The AC power output of a 2 kWp PV - generator for the selected districts are modeled using the schemes presented in chapter 4, while the profile of the power demand of line sections in these cities has been taken from JEDCO [47] for a summer day and a winter day.
5.2 PV Output
This section shows the output of a 2 kWp generator characteristic in 2 days in the year, and the monthly and annual output for the selected districts.
5.2.1 PV Output for the Selected Days
After estimating the global irradiance on the surface of the 2 kWp PV generator, the irradiance and the ambient temperature data are used in a PV model to calculate the maximum output. DC power of the PV system is calculated as shown in chapter 4. The model that is used to estimate the DC power of the PV system is mentioned in Chapter 4.7. The Figures from 5.1 to 5.2 shows the typical power profile generated by a PV - generator on a fixed tilted PV system for the selected districts and selected days. The tilted angle is 18 degree as mentioned before.
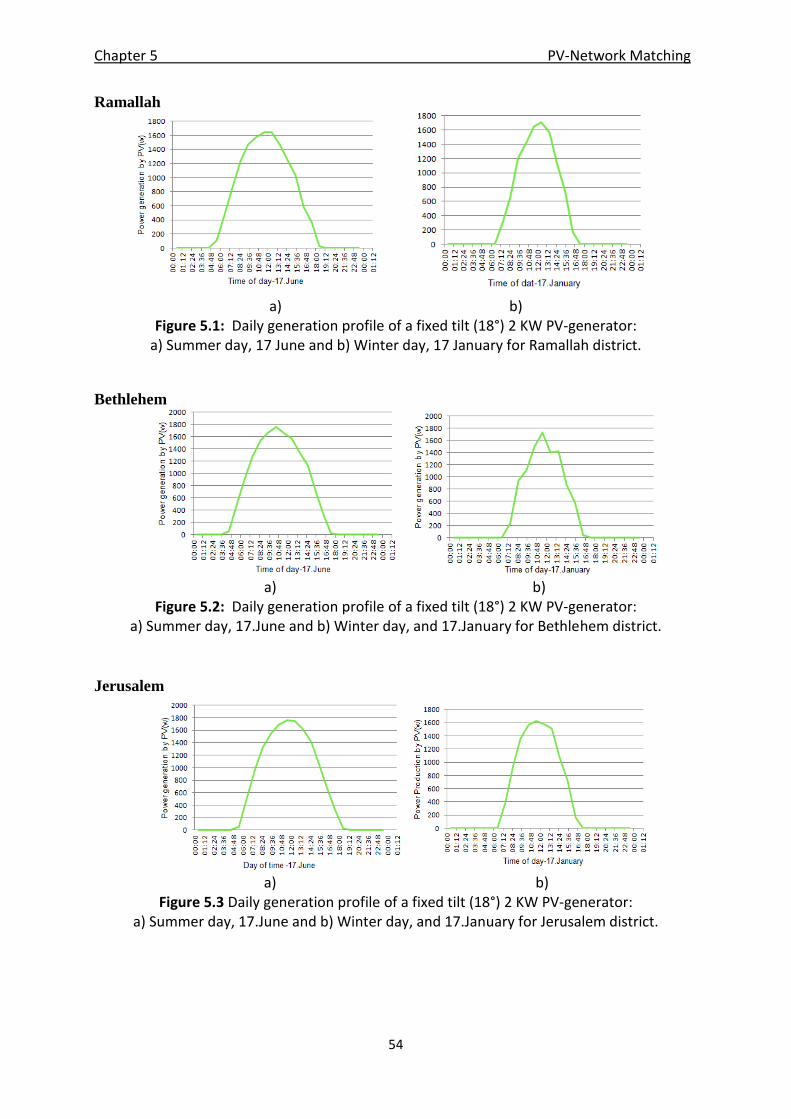
Chapter 5 PV-Network Matching
54
Ramallah
a) b) Figure 5.1: Daily generation profile of a fixed tilt (18°) 2 KW PV-generator:
a) Summer day, 17 June and b) Winter day, 17 January for Ramallah district.
Bethlehem
a) b)
Figure 5.2: Daily generation profile of a fixed tilt (18°) 2 KW PV-generator: a) Summer day, 17.June and b) Winter day, and 17.January for Bethlehem district.
Jerusalem
a) b)
Figure 5.3 Daily generation profile of a fixed tilt (18°) 2 KW PV-generator: a) Summer day, 17.June and b) Winter day, and 17.January for Jerusalem district.
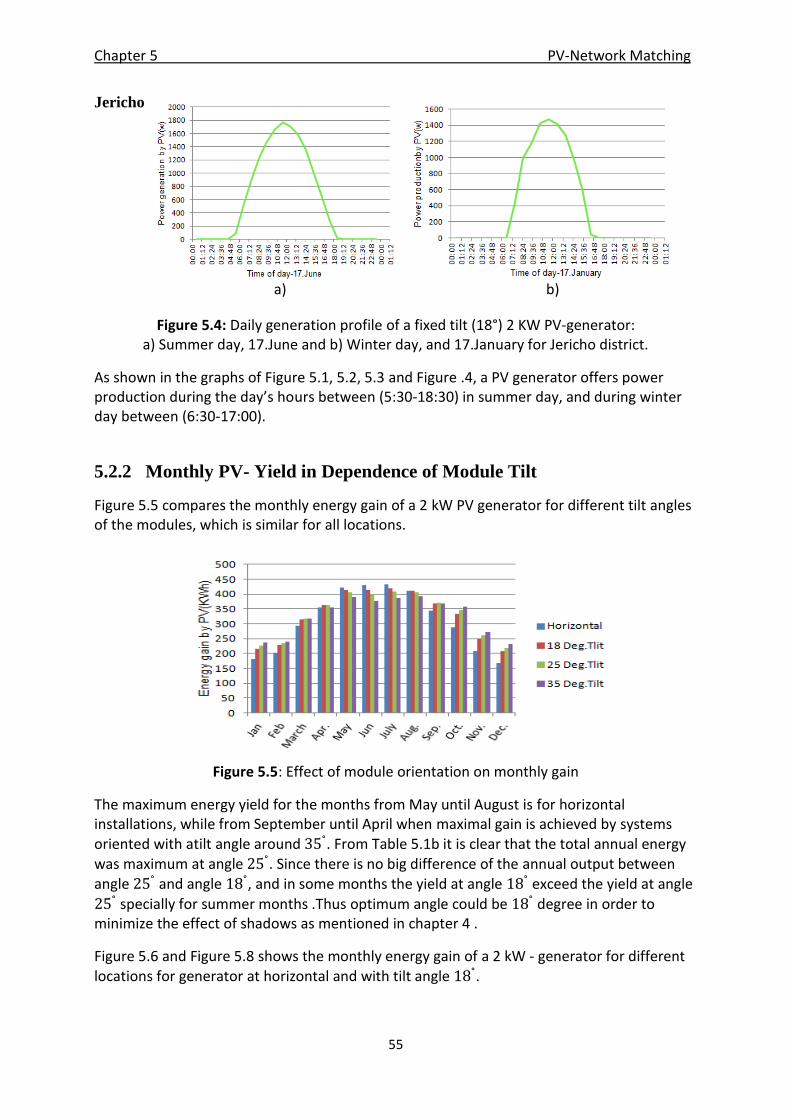
Chapter 5 PV-Network Matching
55
Jericho
a) b)
Figure 5.4: Daily generation profile of a fixed tilt (18°) 2 KW PV-generator: a) Summer day, 17.June and b) Winter day, and 17.January for Jericho district.
As shown in the graphs of Figure 5.1, 5.2, 5.3 and Figure .4, a PV generator offers power production during the day’s hours between (5:30-18:30) in summer day, and during winter day between (6:30-17:00).
5.2.2 Monthly PV- Yield in Dependence of Module Tilt
Figure 5.5 compares the monthly energy gain of a 2 kW PV generator for different tilt angles of the modules, which is similar for all locations.
Figure 5.5: Effect of module orientation on monthly gain
The maximum energy yield for the months from May until August is for horizontal installations, while from September until April when maximal gain is achieved by systems oriented with atilt angle around . From Table 5.1b it is clear that the total annual energy was maximum at angle . Since there is no big difference of the annual output between angle and angle , and in some months the yield at angle exceed the yield at angle
specially for summer months .Thus optimum angle could be degree in order to minimize the effect of shadows as mentioned in chapter 4 .
Figure 5.6 and Figure 5.8 shows the monthly energy gain of a 2 kW - generator for different locations for generator at horizontal and with tilt angle .
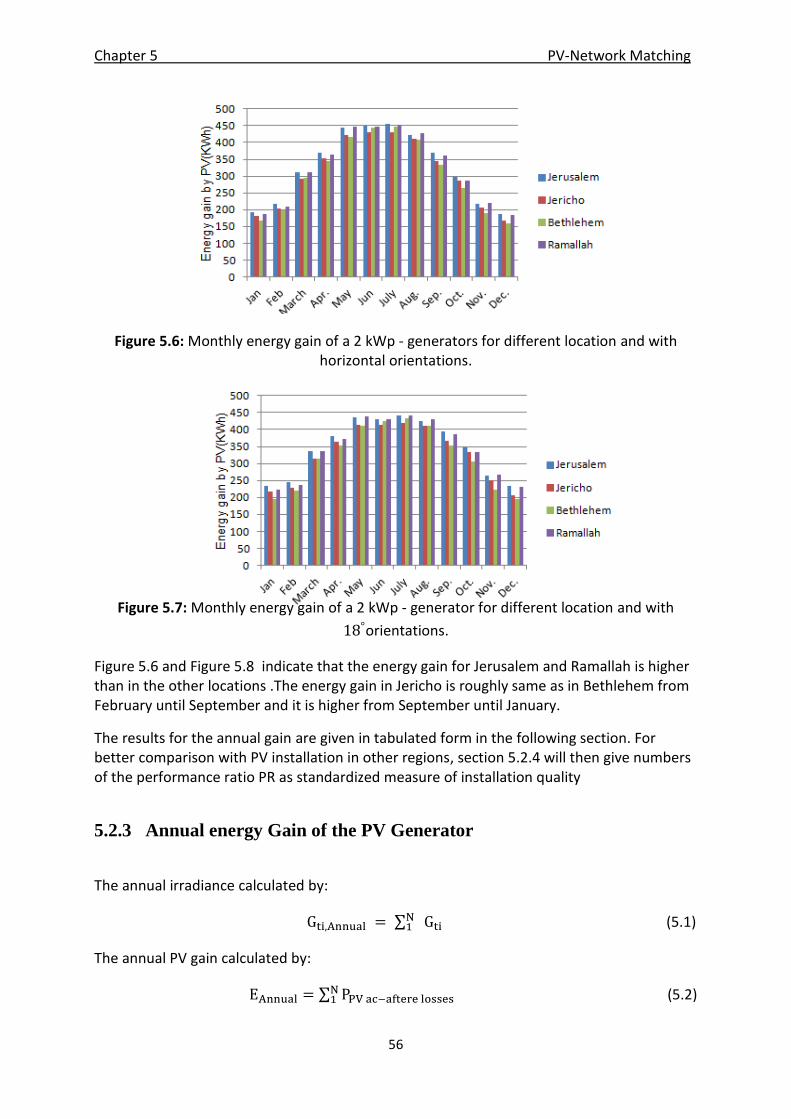
Chapter 5 PV-Network Matching
56
Figure 5.6: Monthly energy gain of a 2 kWp - generators for different location and with horizontal orientations.
Figure 5.7: Monthly energy gain of a 2 kWp - generator for different location and with
orientations.
Figure 5.6 and Figure 5.8 indicate that the energy gain for Jerusalem and Ramallah is higher than in the other locations .The energy gain in Jericho is roughly same as in Bethlehem from February until September and it is higher from September until January.
The results for the annual gain are given in tabulated form in the following section. For better comparison with PV installation in other regions, section 5.2.4 will then give numbers of the performance ratio PR as standardized measure of installation quality
5.2.3 Annual energy Gain of the PV Generator
The annual irradiance calculated by:
(5.1)
The annual PV gain calculated by:
(5.2)
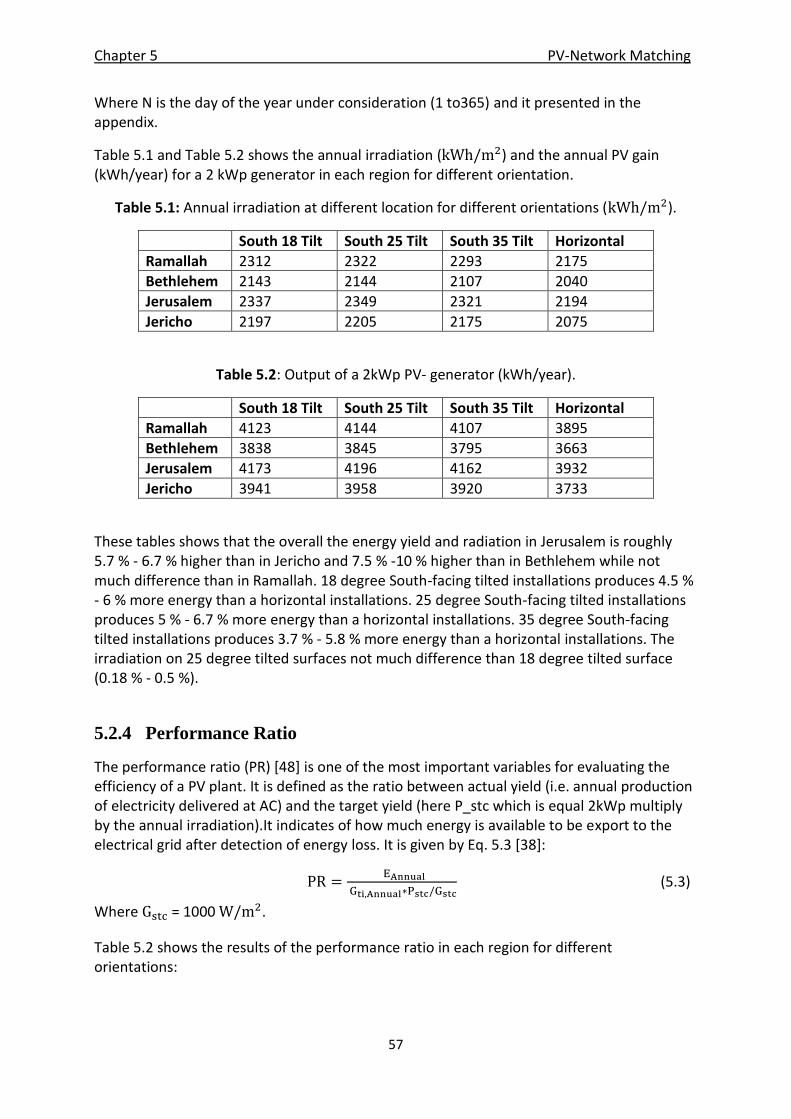
Chapter 5 PV-Network Matching
57
Where N is the day of the year under consideration (1 to365) and it presented in the appendix.
Table 5.1 and Table 5.2 shows the annual irradiation ( ) and the annual PV gain (kWh/year) for a 2 kWp generator in each region for different orientation.
Table 5.1: Annual irradiation at different location for different orientations ( ).
South 18 Tilt South 25 Tilt South 35 Tilt Horizontal
Ramallah 2312 2322 2293 2175
Bethlehem 2143 2144 2107 2040
Jerusalem 2337 2349 2321 2194
Jericho 2197 2205 2175 2075
Table 5.2: Output of a 2kWp PV- generator (kWh/year).
South 18 Tilt South 25 Tilt South 35 Tilt Horizontal
Ramallah 4123 4144 4107 3895
Bethlehem 3838 3845 3795 3663
Jerusalem 4173 4196 4162 3932
Jericho 3941 3958 3920 3733
These tables shows that the overall the energy yield and radiation in Jerusalem is roughly 5.7 % - 6.7 % higher than in Jericho and 7.5 % -10 % higher than in Bethlehem while not much difference than in Ramallah. 18 degree South-facing tilted installations produces 4.5 % - 6 % more energy than a horizontal installations. 25 degree South-facing tilted installations produces 5 % - 6.7 % more energy than a horizontal installations. 35 degree South-facing tilted installations produces 3.7 % - 5.8 % more energy than a horizontal installations. The irradiation on 25 degree tilted surfaces not much difference than 18 degree tilted surface (0.18 % - 0.5 %).
5.2.4 Performance Ratio
The performance ratio (PR) [48] is one of the most important variables for evaluating the efficiency of a PV plant. It is defined as the ratio between actual yield (i.e. annual production of electricity delivered at AC) and the target yield (here P_stc which is equal 2kWp multiply by the annual irradiation).It indicates of how much energy is available to be export to the electrical grid after detection of energy loss. It is given by Eq. 5.3 [38]:
(5.3)
Where = 1000 .
Table 5.2 shows the results of the performance ratio in each region for different orientations:
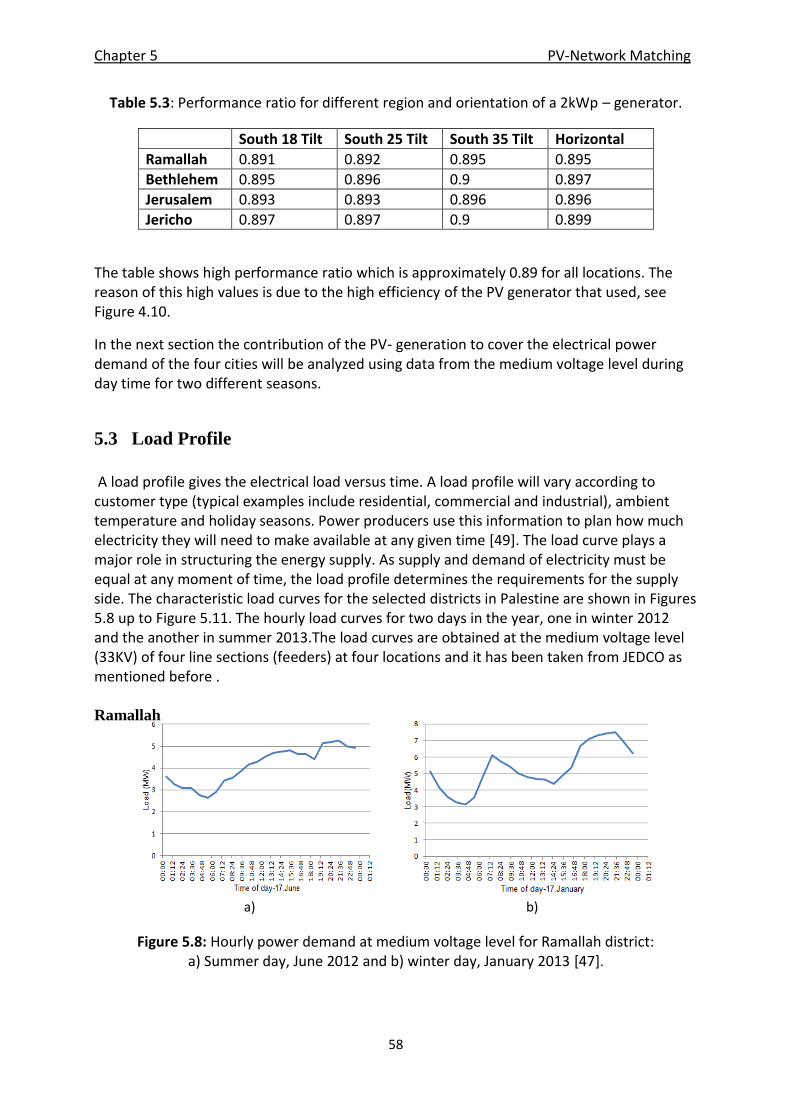
Chapter 5 PV-Network Matching
58
Table 5.3: Performance ratio for different region and orientation of a 2kWp – generator.
South 18 Tilt South 25 Tilt South 35 Tilt Horizontal
Ramallah 0.891 0.892 0.895 0.895
Bethlehem 0.895 0.896 0.9 0.897
Jerusalem 0.893 0.893 0.896 0.896
Jericho 0.897 0.897 0.9 0.899
The table shows high performance ratio which is approximately 0.89 for all locations. The reason of this high values is due to the high efficiency of the PV generator that used, see Figure 4.10.
In the next section the contribution of the PV- generation to cover the electrical power demand of the four cities will be analyzed using data from the medium voltage level during day time for two different seasons.
5.3 Load Profile
A load profile gives the electrical load versus time. A load profile will vary according to customer type (typical examples include residential, commercial and industrial), ambient temperature and holiday seasons. Power producers use this information to plan how much electricity they will need to make available at any given time [49]. The load curve plays a major role in structuring the energy supply. As supply and demand of electricity must be equal at any moment of time, the load profile determines the requirements for the supply side. The characteristic load curves for the selected districts in Palestine are shown in Figures 5.8 up to Figure 5.11. The hourly load curves for two days in the year, one in winter 2012 and the another in summer 2013.The load curves are obtained at the medium voltage level (33KV) of four line sections (feeders) at four locations and it has been taken from JEDCO as mentioned before . Ramallah
a) b)
Figure 5.8: Hourly power demand at medium voltage level for Ramallah district: a) Summer day, June 2012 and b) winter day, January 2013 [47].
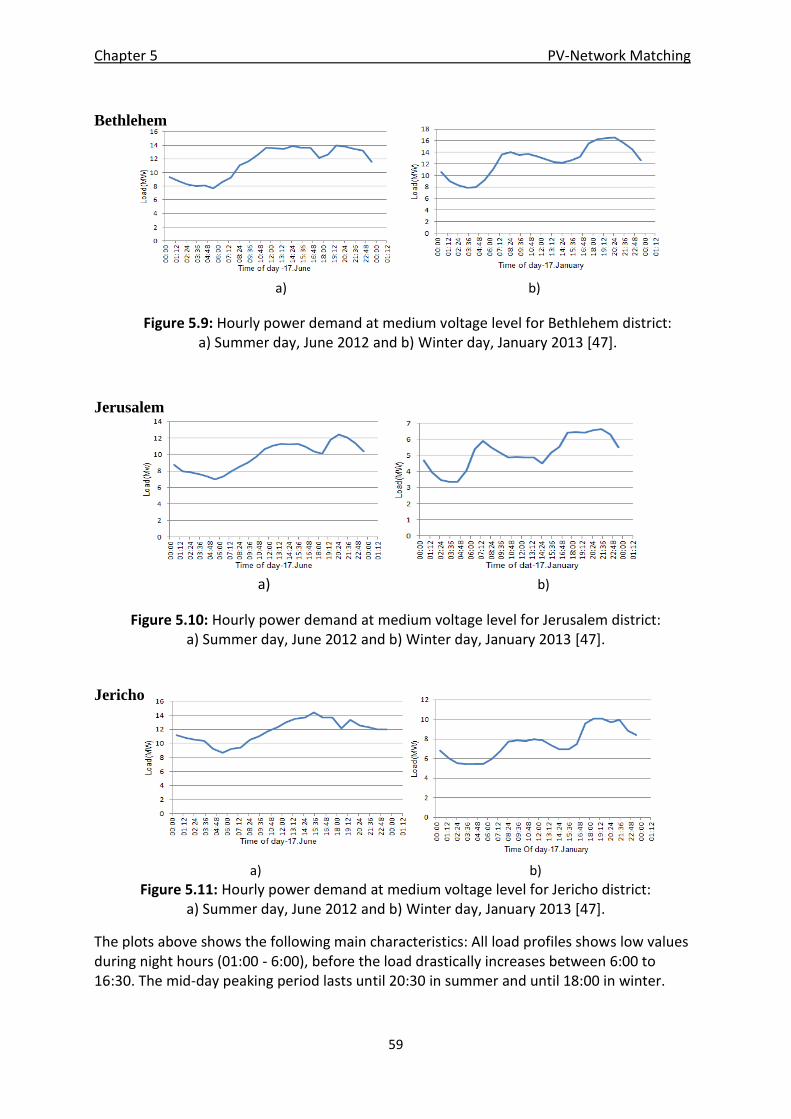
Chapter 5 PV-Network Matching
59
Bethlehem
a) b)
Figure 5.9: Hourly power demand at medium voltage level for Bethlehem district: a) Summer day, June 2012 and b) Winter day, January 2013 [47].
Jerusalem
a) b)
Figure 5.10: Hourly power demand at medium voltage level for Jerusalem district: a) Summer day, June 2012 and b) Winter day, January 2013 [47].
Jericho
a) b)
Figure 5.11: Hourly power demand at medium voltage level for Jericho district: a) Summer day, June 2012 and b) Winter day, January 2013 [47].
The plots above shows the following main characteristics: All load profiles shows low values during night hours (01:00 - 6:00), before the load drastically increases between 6:00 to 16:30. The mid-day peaking period lasts until 20:30 in summer and until 18:00 in winter.
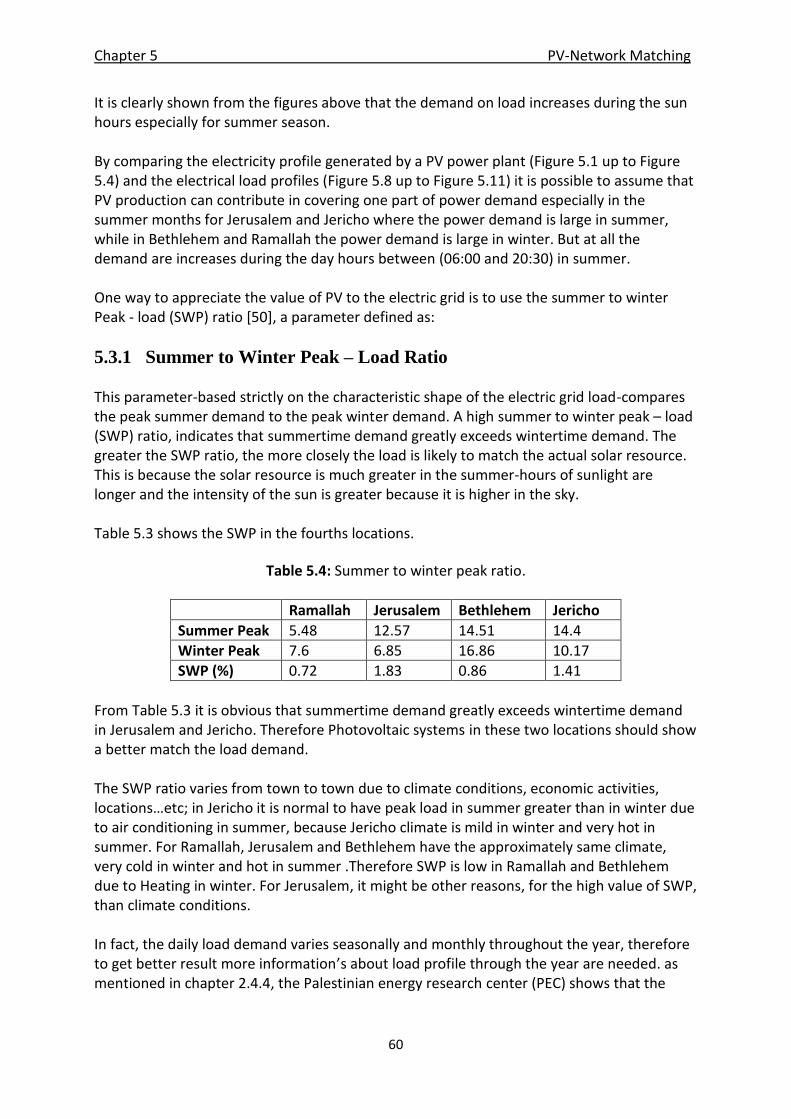
Chapter 5 PV-Network Matching
60
It is clearly shown from the figures above that the demand on load increases during the sun hours especially for summer season. By comparing the electricity profile generated by a PV power plant (Figure 5.1 up to Figure 5.4) and the electrical load profiles (Figure 5.8 up to Figure 5.11) it is possible to assume that PV production can contribute in covering one part of power demand especially in the summer months for Jerusalem and Jericho where the power demand is large in summer, while in Bethlehem and Ramallah the power demand is large in winter. But at all the demand are increases during the day hours between (06:00 and 20:30) in summer. One way to appreciate the value of PV to the electric grid is to use the summer to winter Peak - load (SWP) ratio [50], a parameter defined as:
5.3.1 Summer to Winter Peak – Load Ratio This parameter-based strictly on the characteristic shape of the electric grid load-compares the peak summer demand to the peak winter demand. A high summer to winter peak – load (SWP) ratio, indicates that summertime demand greatly exceeds wintertime demand. The greater the SWP ratio, the more closely the load is likely to match the actual solar resource. This is because the solar resource is much greater in the summer-hours of sunlight are longer and the intensity of the sun is greater because it is higher in the sky. Table 5.3 shows the SWP in the fourths locations.
Table 5.4: Summer to winter peak ratio.
Ramallah Jerusalem Bethlehem Jericho
Summer Peak 5.48 12.57 14.51 14.4
Winter Peak 7.6 6.85 16.86 10.17
SWP (%) 0.72 1.83 0.86 1.41
From Table 5.3 it is obvious that summertime demand greatly exceeds wintertime demand in Jerusalem and Jericho. Therefore Photovoltaic systems in these two locations should show a better match the load demand. The SWP ratio varies from town to town due to climate conditions, economic activities, locations…etc; in Jericho it is normal to have peak load in summer greater than in winter due to air conditioning in summer, because Jericho climate is mild in winter and very hot in summer. For Ramallah, Jerusalem and Bethlehem have the approximately same climate, very cold in winter and hot in summer .Therefore SWP is low in Ramallah and Bethlehem due to Heating in winter. For Jerusalem, it might be other reasons, for the high value of SWP, than climate conditions. In fact, the daily load demand varies seasonally and monthly throughout the year, therefore to get better result more information’s about load profile through the year are needed. as mentioned in chapter 2.4.4, the Palestinian energy research center (PEC) shows that the
Chapter 5 PV-Network Matching
61
maximum load demand in WB in summer and winter is between 12:00 and 19:00 and the demand in summer is 10 % more than winter time due to air conditioning and cooling loads. As mentioned above, if we look at the nature of load demand curves, it is found that the demand is increased from morning for different causes and that demand remains up to around 5 pm. And by matching this demand with the output from the PV system, it is very much ideal to meet that increased energy demand by using Grid-connected PV system. Therefore, to cover part of districts load, a MWp grid- connected system will be designed in the next chapter.
5.4 Summary In this chapter the gain for a 2 kWp PV generator has been simulated for the four selected districts in Palestine, assuming different tilt angles. This PV system can produce average yield of 1902 kWh/kWp with horizontal orientation and 2009 kWh/kWp with 18 degree tilt. The latter value refers to a performance of 0.89. The comparison of monthly and annual PV-energy yield of the different locations and orientations have been discussed in this chapter.
By comparing the production of the PV generator with the hourly load profile of the four locations, it is found that a PV generator can offer peak power production during the periods with high demand in summer and day’s central hours. The SWP shows that the summertime demand exceeds wintertime demand in some location for the selected days and therefore the PV is a good choice to match the load demand. So as a result PV systems can lower the remaining daytime demand and therefore contribute to reduce the overall demand for power.
Chapter 6 Design of Grid-Connected PV system
62
6 Design of Grid-Connected PV System
In this chapter the design of the utility scale grid-connected PV system for the selected locations is described and an estimation of the investment cost of the system is given.
6.1 Introduction
In chapter 5, we have seen how 2 kWp generators can match the utility load profile, particularly at the peak time during summer day. However this PV value is very low to contribute with the medium voltage distribution grid, therefore we need to scale up this value to a value which is capable to cover or partly cover the utility load for the different locations.
The installed capacity of grid-connected photovoltaic (PV) power system installations has grown dramatically over the last years [51]. Utility interactive system can range from the 1kW range to the megawatt range. Residential systems typically are about 1.5 to 5 kW peak, while commercial installations tend to be in the 15 kW range , while central power installations exist in excess of a megawatt [52].
This chapter focuses on the design of a grid-connected PV system of up to approximately 1MW rated power. They system is designed to be connected to the medium voltage (33 kV) distribution grid for two cases , Case 1 when there is available single land for installation and Case 2 when the area of installation is not available as single land . The Grid interfacing requirements according to international standards will be mentioned in this chapter and it should be fulfilled by the system. The major elements of the grid - connected system will be selected in this chapter and it must be according to these standards. This chapter also gives an overview over the investment cost of the system. Since the cost analysis of the system is beyond the scope of this thesis, cost analysis of one system from previous study in Palestine has taken part in this thesis in order to show whether or not the grid connected is economically profitable.
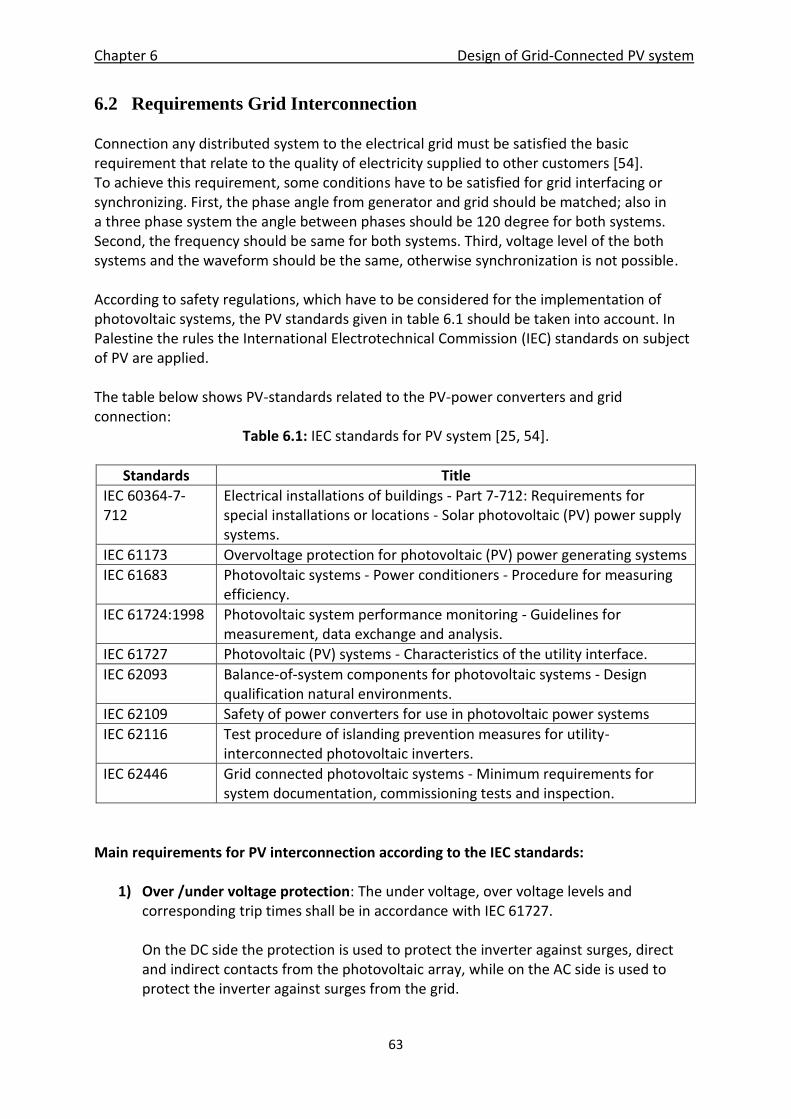
Chapter 6 Design of Grid-Connected PV system
63
6.2 Requirements Grid Interconnection Connection any distributed system to the electrical grid must be satisfied the basic requirement that relate to the quality of electricity supplied to other customers [54]. To achieve this requirement, some conditions have to be satisfied for grid interfacing or synchronizing. First, the phase angle from generator and grid should be matched; also in a three phase system the angle between phases should be 120 degree for both systems. Second, the frequency should be same for both systems. Third, voltage level of the both systems and the waveform should be the same, otherwise synchronization is not possible. According to safety regulations, which have to be considered for the implementation of photovoltaic systems, the PV standards given in table 6.1 should be taken into account. In Palestine the rules the International Electrotechnical Commission (IEC) standards on subject of PV are applied. The table below shows PV-standards related to the PV-power converters and grid connection:
Table 6.1: IEC standards for PV system [25, 54].
Standards Title
IEC 60364-7-712
Electrical installations of buildings - Part 7-712: Requirements for special installations or locations - Solar photovoltaic (PV) power supply systems.
IEC 61173 Overvoltage protection for photovoltaic (PV) power generating systems
IEC 61683 Photovoltaic systems - Power conditioners - Procedure for measuring efficiency.
IEC 61724:1998 Photovoltaic system performance monitoring - Guidelines for measurement, data exchange and analysis.
IEC 61727 Photovoltaic (PV) systems - Characteristics of the utility interface.
IEC 62093 Balance-of-system components for photovoltaic systems - Design qualification natural environments.
IEC 62109 Safety of power converters for use in photovoltaic power systems
IEC 62116 Test procedure of islanding prevention measures for utility-interconnected photovoltaic inverters.
IEC 62446 Grid connected photovoltaic systems - Minimum requirements for system documentation, commissioning tests and inspection.
Main requirements for PV interconnection according to the IEC standards:
1) Over /under voltage protection: The under voltage, over voltage levels and corresponding trip times shall be in accordance with IEC 61727. On the DC side the protection is used to protect the inverter against surges, direct and indirect contacts from the photovoltaic array, while on the AC side is used to protect the inverter against surges from the grid.
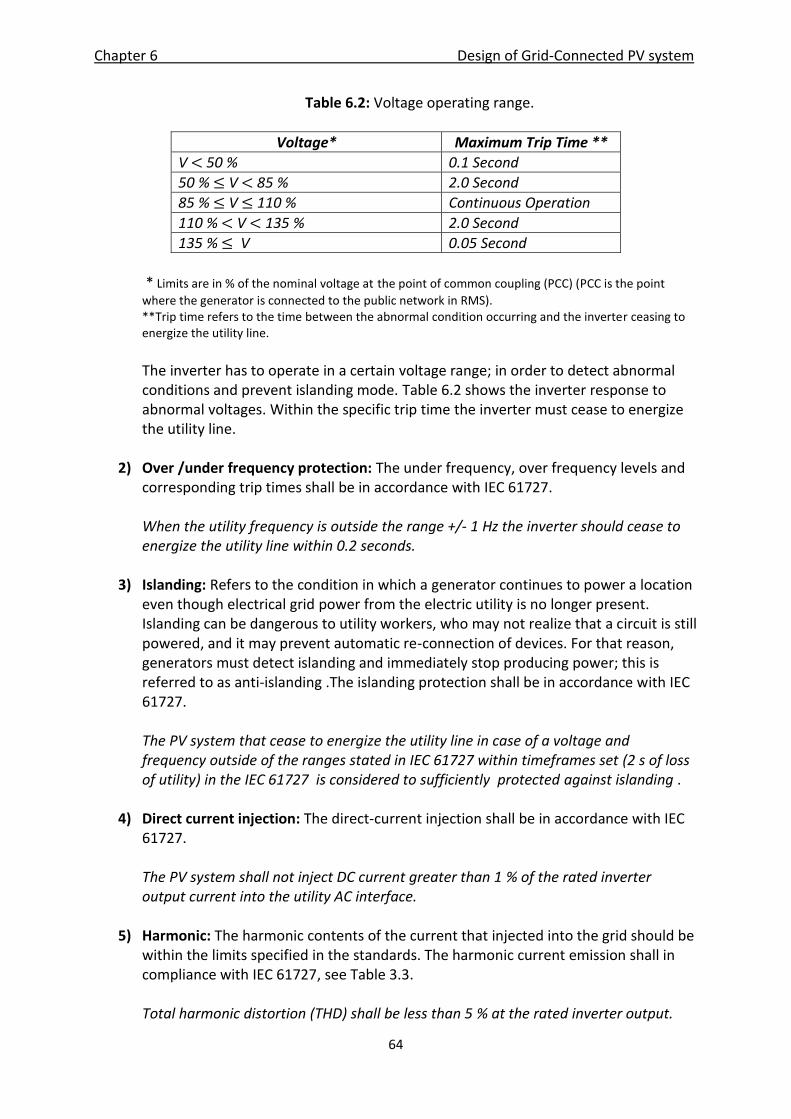
Chapter 6 Design of Grid-Connected PV system
64
Table 6.2: Voltage operating range.
Voltage* Maximum Trip Time **
V 50 % 0.1 Second
50 % V 85 % 2.0 Second
85 % V 110 % Continuous Operation
110 % V 135 % 2.0 Second
135 % V 0.05 Second
* Limits are in % of the nominal voltage at the point of common coupling (PCC) (PCC is the point
where the generator is connected to the public network in RMS). **Trip time refers to the time between the abnormal condition occurring and the inverter ceasing to energize the utility line.
The inverter has to operate in a certain voltage range; in order to detect abnormal conditions and prevent islanding mode. Table 6.2 shows the inverter response to abnormal voltages. Within the specific trip time the inverter must cease to energize the utility line.
2) Over /under frequency protection: The under frequency, over frequency levels and
corresponding trip times shall be in accordance with IEC 61727. When the utility frequency is outside the range +/- 1 Hz the inverter should cease to energize the utility line within 0.2 seconds.
3) Islanding: Refers to the condition in which a generator continues to power a location even though electrical grid power from the electric utility is no longer present. Islanding can be dangerous to utility workers, who may not realize that a circuit is still powered, and it may prevent automatic re-connection of devices. For that reason, generators must detect islanding and immediately stop producing power; this is referred to as anti-islanding .The islanding protection shall be in accordance with IEC 61727. The PV system that cease to energize the utility line in case of a voltage and frequency outside of the ranges stated in IEC 61727 within timeframes set (2 s of loss of utility) in the IEC 61727 is considered to sufficiently protected against islanding .
4) Direct current injection: The direct-current injection shall be in accordance with IEC
61727. The PV system shall not inject DC current greater than 1 % of the rated inverter output current into the utility AC interface.
5) Harmonic: The harmonic contents of the current that injected into the grid should be within the limits specified in the standards. The harmonic current emission shall in compliance with IEC 61727, see Table 3.3. Total harmonic distortion (THD) shall be less than 5 % at the rated inverter output.
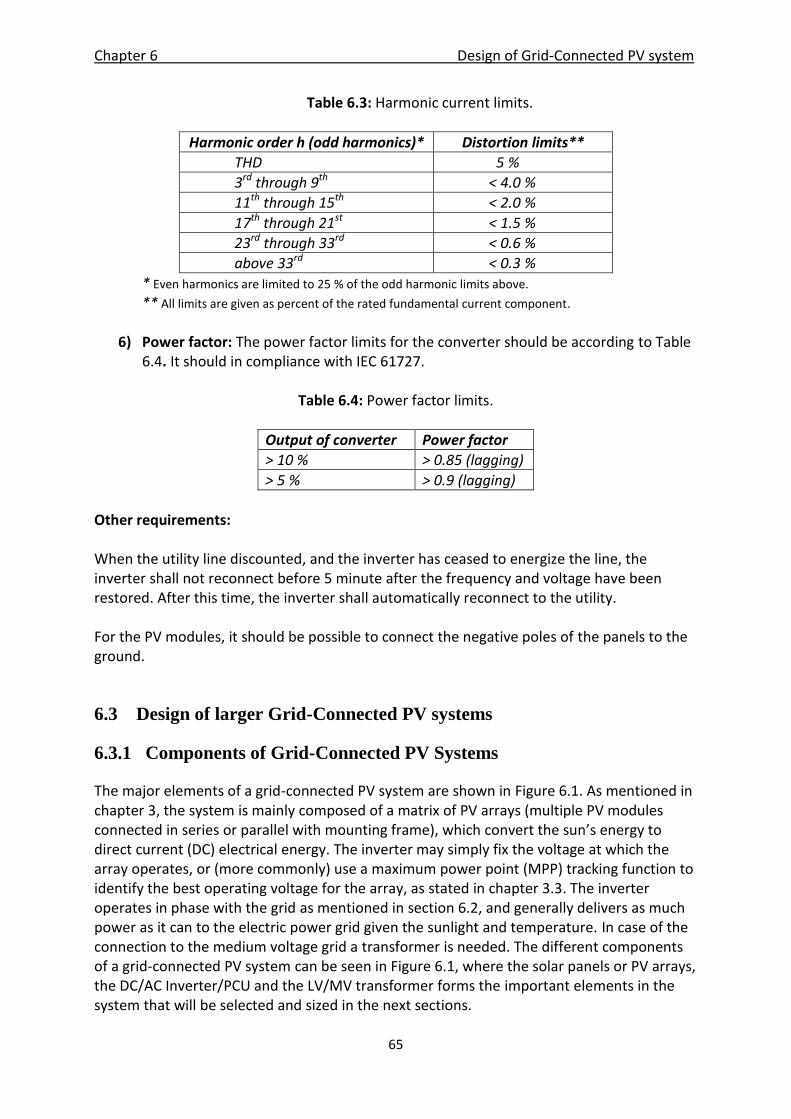
Chapter 6 Design of Grid-Connected PV system
65
Table 6.3: Harmonic current limits.
Harmonic order h (odd harmonics)* Distortion limits**
THD 5 %
3rd through 9th < 4.0 %
11th through 15th < 2.0 %
17th through 21st < 1.5 %
23rd through 33rd < 0.6 %
above 33rd < 0.3 %
* Even harmonics are limited to 25 % of the odd harmonic limits above.
** All limits are given as percent of the rated fundamental current component.
6) Power factor: The power factor limits for the converter should be according to Table 6.4. It should in compliance with IEC 61727.
Table 6.4: Power factor limits.
Output of converter Power factor
> 10 % > 0.85 (lagging)
> 5 % > 0.9 (lagging)
Other requirements: When the utility line discounted, and the inverter has ceased to energize the line, the inverter shall not reconnect before 5 minute after the frequency and voltage have been restored. After this time, the inverter shall automatically reconnect to the utility. For the PV modules, it should be possible to connect the negative poles of the panels to the ground.
6.3 Design of larger Grid-Connected PV systems
6.3.1 Components of Grid-Connected PV Systems
The major elements of a grid-connected PV system are shown in Figure 6.1. As mentioned in chapter 3, the system is mainly composed of a matrix of PV arrays (multiple PV modules connected in series or parallel with mounting frame), which convert the sun’s energy to direct current (DC) electrical energy. The inverter may simply fix the voltage at which the array operates, or (more commonly) use a maximum power point (MPP) tracking function to identify the best operating voltage for the array, as stated in chapter 3.3. The inverter operates in phase with the grid as mentioned in section 6.2, and generally delivers as much power as it can to the electric power grid given the sunlight and temperature. In case of the connection to the medium voltage grid a transformer is needed. The different components of a grid-connected PV system can be seen in Figure 6.1, where the solar panels or PV arrays, the DC/AC Inverter/PCU and the LV/MV transformer forms the important elements in the system that will be selected and sized in the next sections.
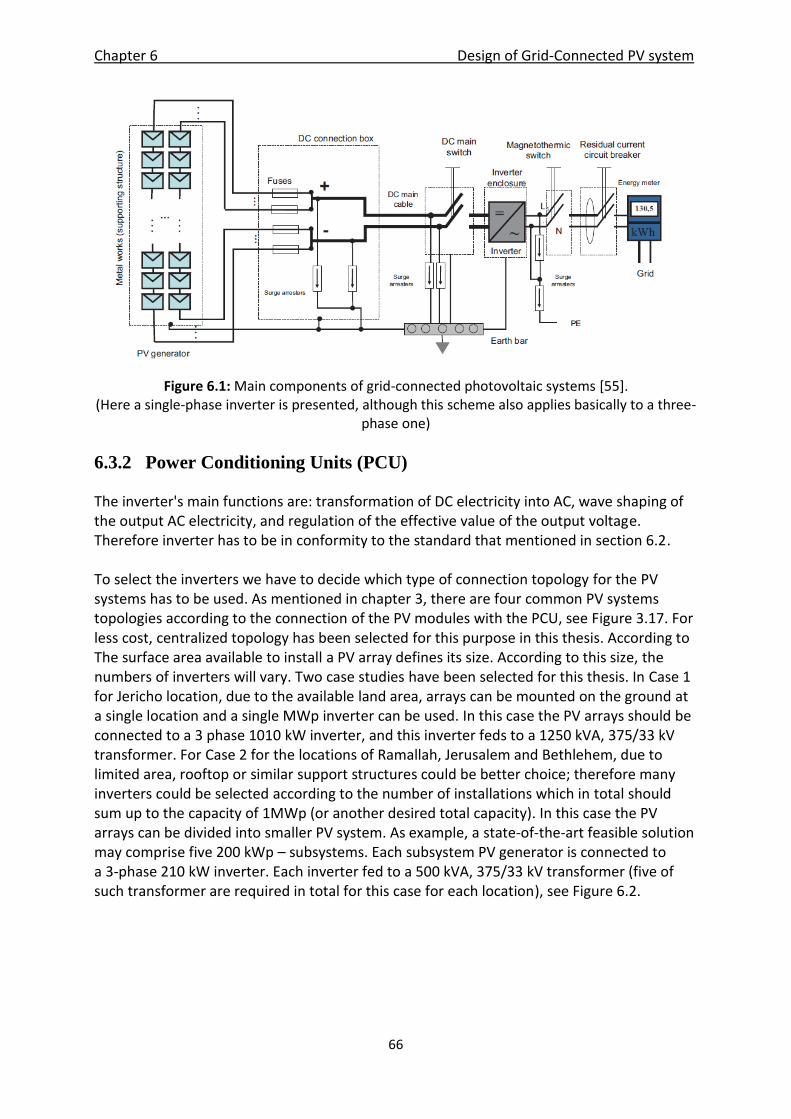
Chapter 6 Design of Grid-Connected PV system
66
Figure 6.1: Main components of grid-connected photovoltaic systems [55]. (Here a single-phase inverter is presented, although this scheme also applies basically to a three-
phase one)
6.3.2 Power Conditioning Units (PCU)
The inverter's main functions are: transformation of DC electricity into AC, wave shaping of the output AC electricity, and regulation of the effective value of the output voltage. Therefore inverter has to be in conformity to the standard that mentioned in section 6.2. To select the inverters we have to decide which type of connection topology for the PV systems has to be used. As mentioned in chapter 3, there are four common PV systems topologies according to the connection of the PV modules with the PCU, see Figure 3.17. For less cost, centralized topology has been selected for this purpose in this thesis. According to The surface area available to install a PV array defines its size. According to this size, the numbers of inverters will vary. Two case studies have been selected for this thesis. In Case 1 for Jericho location, due to the available land area, arrays can be mounted on the ground at a single location and a single MWp inverter can be used. In this case the PV arrays should be connected to a 3 phase 1010 kW inverter, and this inverter feds to a 1250 kVA, 375/33 kV transformer. For Case 2 for the locations of Ramallah, Jerusalem and Bethlehem, due to limited area, rooftop or similar support structures could be better choice; therefore many inverters could be selected according to the number of installations which in total should sum up to the capacity of 1MWp (or another desired total capacity). In this case the PV arrays can be divided into smaller PV system. As example, a state-of-the-art feasible solution may comprise five 200 kWp – subsystems. Each subsystem PV generator is connected to a 3-phase 210 kW inverter. Each inverter fed to a 500 kVA, 375/33 kV transformer (five of such transformer are required in total for this case for each location), see Figure 6.2.
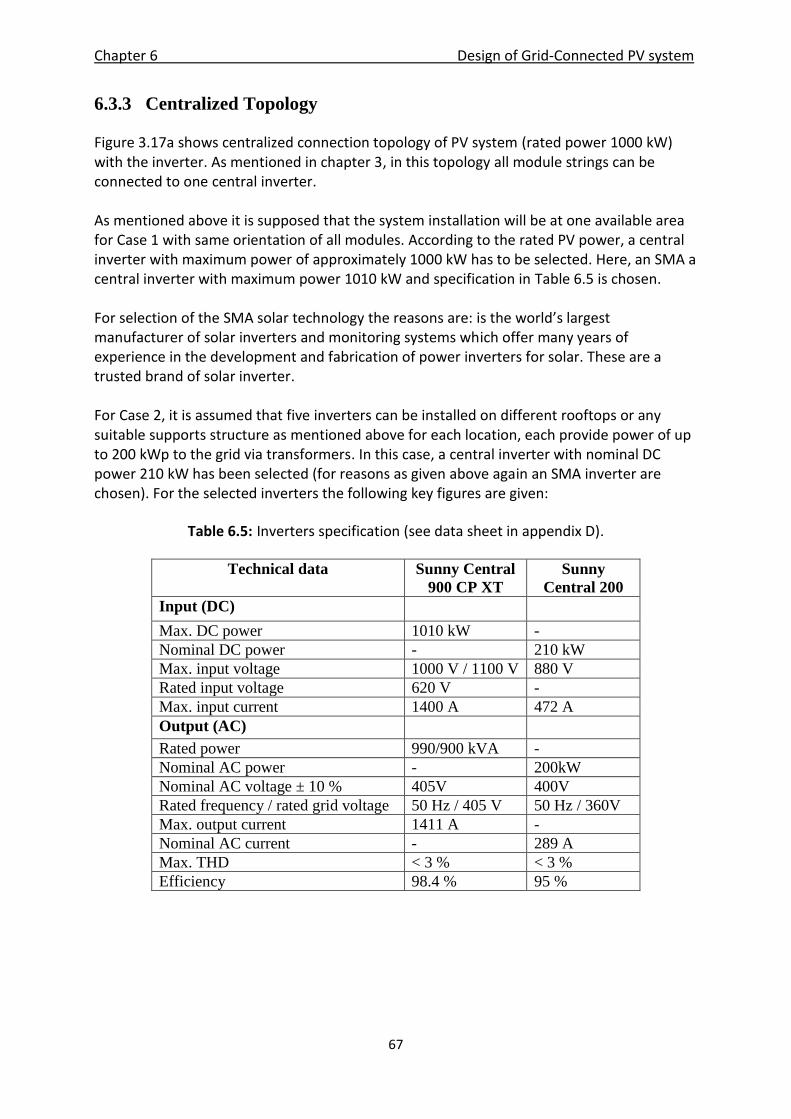
Chapter 6 Design of Grid-Connected PV system
67
6.3.3 Centralized Topology
Figure 3.17a shows centralized connection topology of PV system (rated power 1000 kW) with the inverter. As mentioned in chapter 3, in this topology all module strings can be connected to one central inverter. As mentioned above it is supposed that the system installation will be at one available area for Case 1 with same orientation of all modules. According to the rated PV power, a central inverter with maximum power of approximately 1000 kW has to be selected. Here, an SMA a central inverter with maximum power 1010 kW and specification in Table 6.5 is chosen. For selection of the SMA solar technology the reasons are: is the world’s largest manufacturer of solar inverters and monitoring systems which offer many years of experience in the development and fabrication of power inverters for solar. These are a trusted brand of solar inverter. For Case 2, it is assumed that five inverters can be installed on different rooftops or any suitable supports structure as mentioned above for each location, each provide power of up to 200 kWp to the grid via transformers. In this case, a central inverter with nominal DC power 210 kW has been selected (for reasons as given above again an SMA inverter are chosen). For the selected inverters the following key figures are given:
Table 6.5: Inverters specification (see data sheet in appendix D).
Technical data Sunny Central
900 CP XT
Sunny
Central 200
Input (DC)
Max. DC power 1010 kW -
Nominal DC power - 210 kW
Max. input voltage 1000 V / 1100 V 880 V
Rated input voltage 620 V -
Max. input current 1400 A 472 A
Output (AC)
Rated power 990/900 kVA -
Nominal AC power - 200kW
Nominal AC voltage ± 10 % 405V 400V
Rated frequency / rated grid voltage 50 Hz / 405 V 50 Hz / 360V
Max. output current 1411 A -
Nominal AC current - 289 A
Max. THD < 3 % < 3 %
Efficiency 98.4 % 95 %
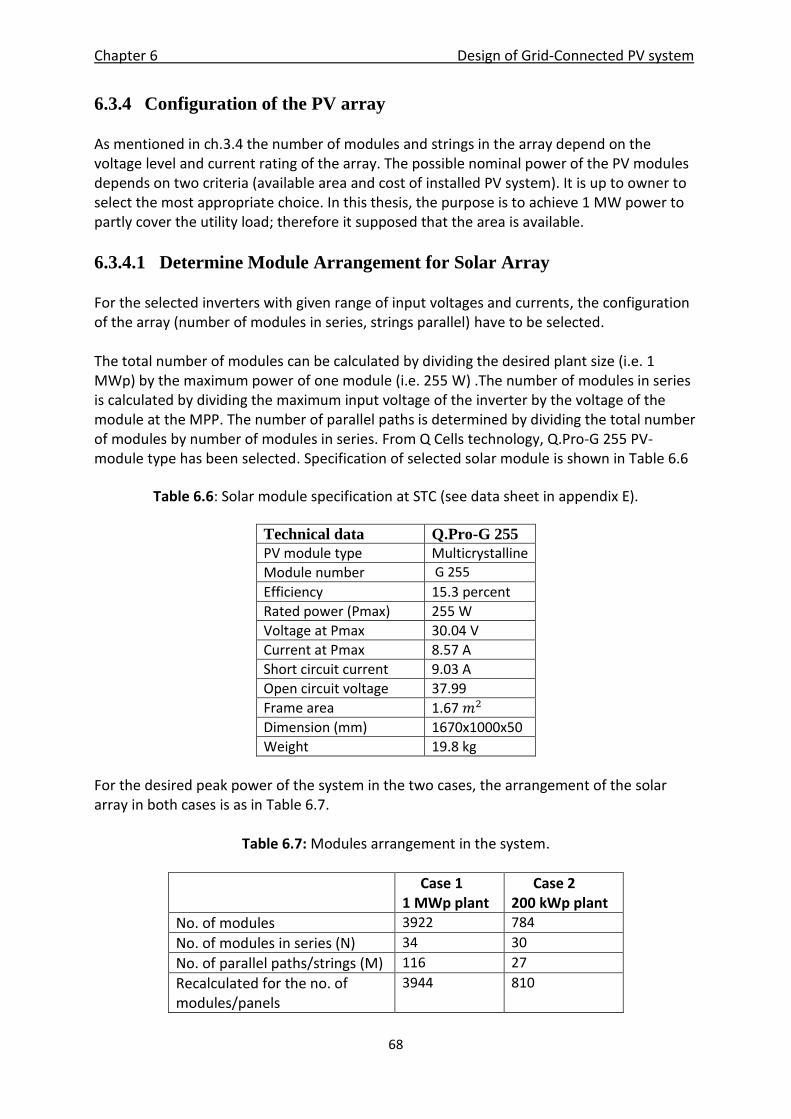
Chapter 6 Design of Grid-Connected PV system
68
6.3.4 Configuration of the PV array As mentioned in ch.3.4 the number of modules and strings in the array depend on the voltage level and current rating of the array. The possible nominal power of the PV modules depends on two criteria (available area and cost of installed PV system). It is up to owner to select the most appropriate choice. In this thesis, the purpose is to achieve 1 MW power to partly cover the utility load; therefore it supposed that the area is available.
6.3.4.1 Determine Module Arrangement for Solar Array For the selected inverters with given range of input voltages and currents, the configuration of the array (number of modules in series, strings parallel) have to be selected. The total number of modules can be calculated by dividing the desired plant size (i.e. 1 MWp) by the maximum power of one module (i.e. 255 W) .The number of modules in series is calculated by dividing the maximum input voltage of the inverter by the voltage of the module at the MPP. The number of parallel paths is determined by dividing the total number of modules by number of modules in series. From Q Cells technology, Q.Pro-G 255 PV- module type has been selected. Specification of selected solar module is shown in Table 6.6
Table 6.6: Solar module specification at STC (see data sheet in appendix E).
Technical data Q.Pro-G 255
PV module type Multicrystalline
Module number G 255
Efficiency 15.3 percent
Rated power (Pmax) 255 W
Voltage at Pmax 30.04 V
Current at Pmax 8.57 A
Short circuit current 9.03 A
Open circuit voltage 37.99
Frame area 1.67
Dimension (mm) 1670x1000x50
Weight 19.8 kg
For the desired peak power of the system in the two cases, the arrangement of the solar array in both cases is as in Table 6.7.
Table 6.7: Modules arrangement in the system.
Case 1 1 MWp plant
Case 2 200 kWp plant
No. of modules 3922 784
No. of modules in series (N) 34 30
No. of parallel paths/strings (M) 116 27
Recalculated for the no. of modules/panels
3944 810
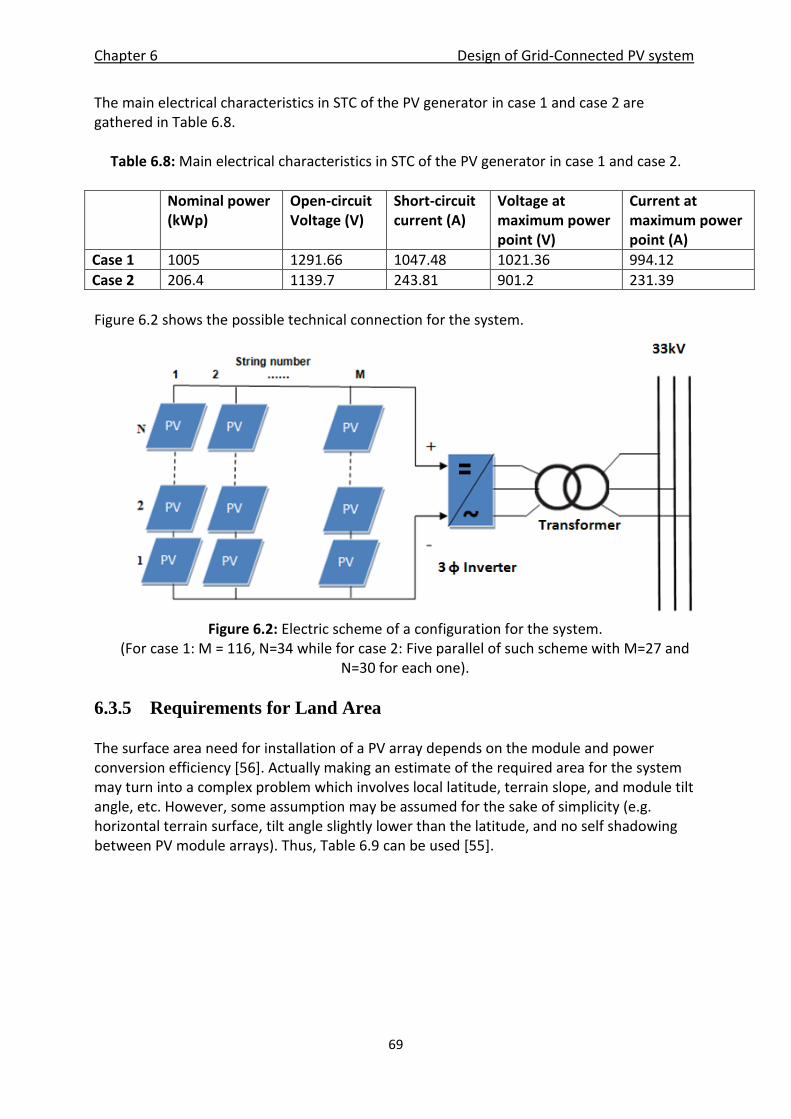
Chapter 6 Design of Grid-Connected PV system
69
The main electrical characteristics in STC of the PV generator in case 1 and case 2 are gathered in Table 6.8.
Table 6.8: Main electrical characteristics in STC of the PV generator in case 1 and case 2.
Nominal power (kWp)
Open-circuit Voltage (V)
Short-circuit current (A)
Voltage at maximum power point (V)
Current at maximum power point (A)
Case 1 1005 1291.66 1047.48 1021.36 994.12
Case 2 206.4 1139.7 243.81 901.2 231.39
Figure 6.2 shows the possible technical connection for the system.
Figure 6.2: Electric scheme of a configuration for the system.
(For case 1: M = 116, N=34 while for case 2: Five parallel of such scheme with M=27 and N=30 for each one).
6.3.5 Requirements for Land Area The surface area need for installation of a PV array depends on the module and power conversion efficiency [56]. Actually making an estimate of the required area for the system may turn into a complex problem which involves local latitude, terrain slope, and module tilt angle, etc. However, some assumption may be assumed for the sake of simplicity (e.g. horizontal terrain surface, tilt angle slightly lower than the latitude, and no self shadowing between PV module arrays). Thus, Table 6.9 can be used [55].
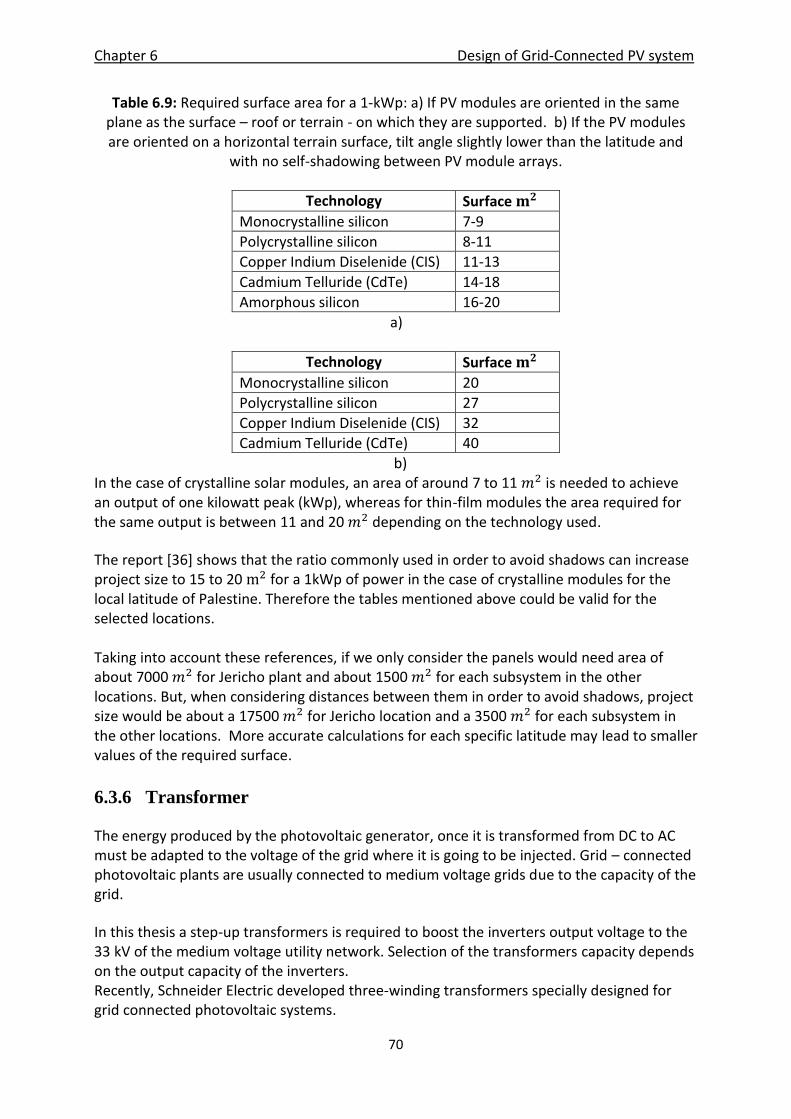
Chapter 6 Design of Grid-Connected PV system
70
Table 6.9: Required surface area for a 1-kWp: a) If PV modules are oriented in the same plane as the surface – roof or terrain - on which they are supported. b) If the PV modules are oriented on a horizontal terrain surface, tilt angle slightly lower than the latitude and
with no self-shadowing between PV module arrays.
Technology Surface
Monocrystalline silicon 7-9
Polycrystalline silicon 8-11
Copper Indium Diselenide (CIS) 11-13
Cadmium Telluride (CdTe) 14-18
Amorphous silicon 16-20
a)
Technology Surface
Monocrystalline silicon 20
Polycrystalline silicon 27
Copper Indium Diselenide (CIS) 32
Cadmium Telluride (CdTe) 40
b) In the case of crystalline solar modules, an area of around 7 to 11 is needed to achieve an output of one kilowatt peak (kWp), whereas for thin-film modules the area required for the same output is between 11 and 20 depending on the technology used.
The report [36] shows that the ratio commonly used in order to avoid shadows can increase project size to 15 to 20 for a 1kWp of power in the case of crystalline modules for the local latitude of Palestine. Therefore the tables mentioned above could be valid for the selected locations. Taking into account these references, if we only consider the panels would need area of about 7000 for Jericho plant and about 1500 for each subsystem in the other locations. But, when considering distances between them in order to avoid shadows, project size would be about a 17500 for Jericho location and a 3500 for each subsystem in the other locations. More accurate calculations for each specific latitude may lead to smaller values of the required surface.
6.3.6 Transformer
The energy produced by the photovoltaic generator, once it is transformed from DC to AC must be adapted to the voltage of the grid where it is going to be injected. Grid – connected photovoltaic plants are usually connected to medium voltage grids due to the capacity of the grid.
In this thesis a step-up transformers is required to boost the inverters output voltage to the 33 kV of the medium voltage utility network. Selection of the transformers capacity depends on the output capacity of the inverters. Recently, Schneider Electric developed three-winding transformers specially designed for grid connected photovoltaic systems.
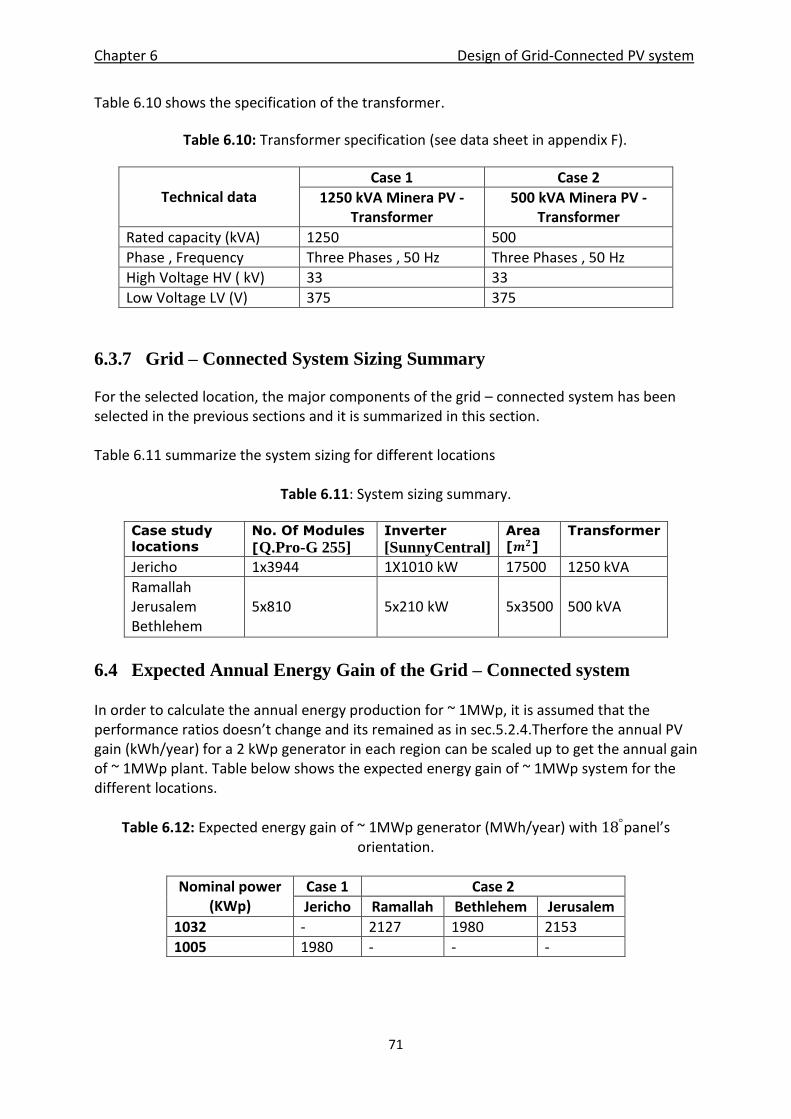
Chapter 6 Design of Grid-Connected PV system
71
Table 6.10 shows the specification of the transformer.
Table 6.10: Transformer specification (see data sheet in appendix F).
Technical data
Case 1 Case 2
1250 kVA Minera PV -Transformer
500 kVA Minera PV -Transformer
Rated capacity (kVA) 1250 500
Phase , Frequency Three Phases , 50 Hz Three Phases , 50 Hz
High Voltage HV ( kV) 33 33
Low Voltage LV (V) 375 375
6.3.7 Grid – Connected System Sizing Summary
For the selected location, the major components of the grid – connected system has been selected in the previous sections and it is summarized in this section. Table 6.11 summarize the system sizing for different locations
Table 6.11: System sizing summary.
Case study
locations
No. Of Modules
[Q.Pro-G 255] Inverter
[SunnyCentral] Area [ ]
Transformer
Jericho 1x3944 1X10¹⁰ kW 17500 1250 kVA
Ramallah Jerusalem Bethlehem
5x810
5x210 kW
5x3500
500 kVA
6.4 Expected Annual Energy Gain of the Grid – Connected system In order to calculate the annual energy production for ~ 1MWp, it is assumed that the performance ratios doesn’t change and its remained as in sec.5.2.4.Therfore the annual PV gain (kWh/year) for a 2 kWp generator in each region can be scaled up to get the annual gain of ~ 1MWp plant. Table below shows the expected energy gain of ~ 1MWp system for the different locations.
Table 6.12: Expected energy gain of ~ 1MWp generator (MWh/year) with panel’s orientation.
Nominal power (KWp)
Case 1 Case 2
Jericho Ramallah Bethlehem Jerusalem
1032 - 2127 1980 2153
1005 1980 - - -
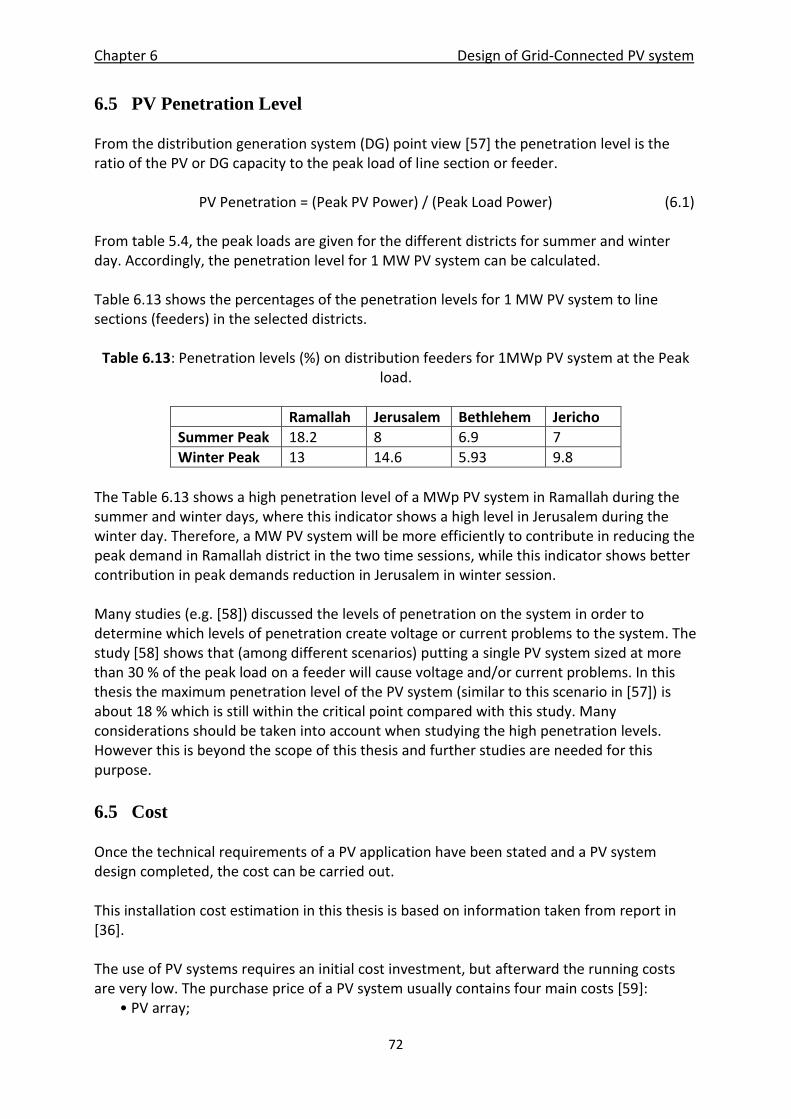
Chapter 6 Design of Grid-Connected PV system
72
6.5 PV Penetration Level From the distribution generation system (DG) point view [57] the penetration level is the ratio of the PV or DG capacity to the peak load of line section or feeder. PV Penetration = (Peak PV Power) / (Peak Load Power) (6.1) From table 5.4, the peak loads are given for the different districts for summer and winter day. Accordingly, the penetration level for 1 MW PV system can be calculated. Table 6.13 shows the percentages of the penetration levels for 1 MW PV system to line sections (feeders) in the selected districts.
Table 6.13: Penetration levels (%) on distribution feeders for 1MWp PV system at the Peak load.
Ramallah Jerusalem Bethlehem Jericho
Summer Peak 18.2 8 6.9 7
Winter Peak 13 14.6 5.93 9.8
The Table 6.13 shows a high penetration level of a MWp PV system in Ramallah during the summer and winter days, where this indicator shows a high level in Jerusalem during the winter day. Therefore, a MW PV system will be more efficiently to contribute in reducing the peak demand in Ramallah district in the two time sessions, while this indicator shows better contribution in peak demands reduction in Jerusalem in winter session. Many studies (e.g. [58]) discussed the levels of penetration on the system in order to determine which levels of penetration create voltage or current problems to the system. The study [58] shows that (among different scenarios) putting a single PV system sized at more than 30 % of the peak load on a feeder will cause voltage and/or current problems. In this thesis the maximum penetration level of the PV system (similar to this scenario in [57]) is about 18 % which is still within the critical point compared with this study. Many considerations should be taken into account when studying the high penetration levels. However this is beyond the scope of this thesis and further studies are needed for this purpose.
6.5 Cost Once the technical requirements of a PV application have been stated and a PV system design completed, the cost can be carried out. This installation cost estimation in this thesis is based on information taken from report in [36]. The use of PV systems requires an initial cost investment, but afterward the running costs are very low. The purchase price of a PV system usually contains four main costs [59]: • PV array;
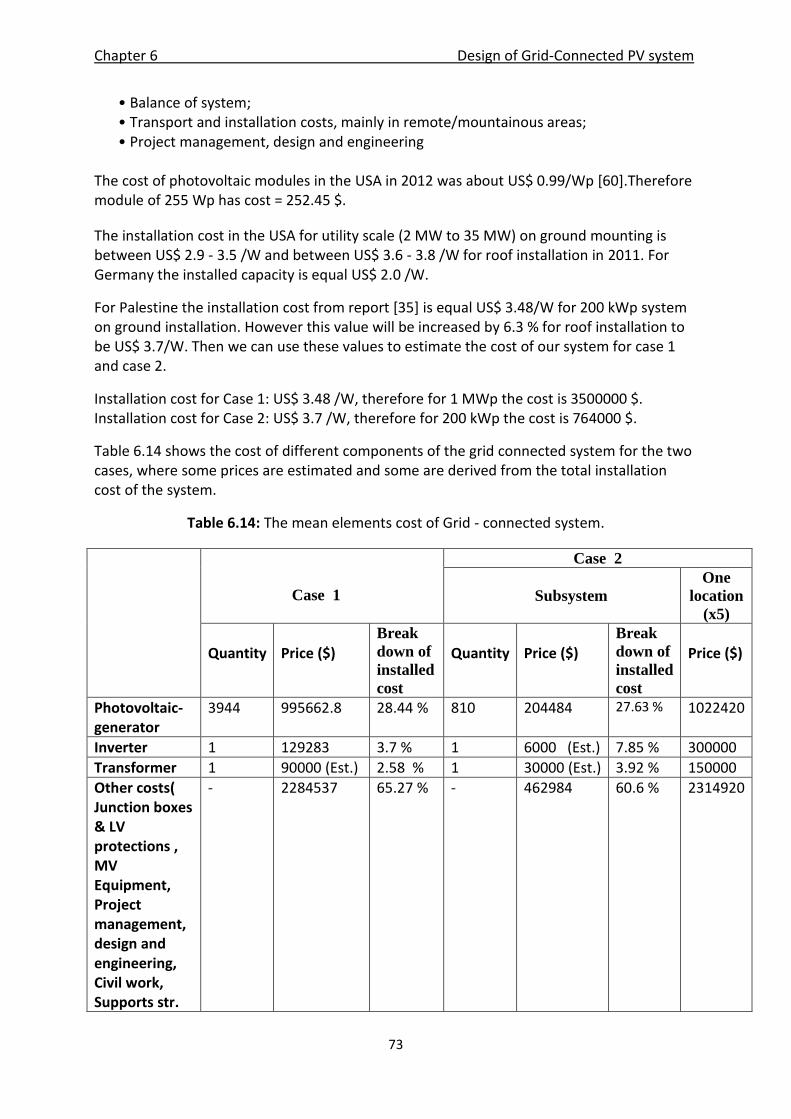
Chapter 6 Design of Grid-Connected PV system
73
• Balance of system; • Transport and installation costs, mainly in remote/mountainous areas; • Project management, design and engineering
The cost of photovoltaic modules in the USA in 2012 was about US$ 0.99/Wp [60].Therefore module of 255 Wp has cost = 252.45 $.
The installation cost in the USA for utility scale (2 MW to 35 MW) on ground mounting is between US$ 2.9 - 3.5 /W and between US$ 3.6 - 3.8 /W for roof installation in 2011. For Germany the installed capacity is equal US$ 2.0 /W.
For Palestine the installation cost from report [35] is equal US$ 3.48/W for 200 kWp system on ground installation. However this value will be increased by 6.3 % for roof installation to be US$ 3.7/W. Then we can use these values to estimate the cost of our system for case 1 and case 2.
Installation cost for Case 1: US$ 3.48 /W, therefore for 1 MWp the cost is 3500000 $. Installation cost for Case 2: US$ 3.7 /W, therefore for 200 kWp the cost is 764000 $.
Table 6.14 shows the cost of different components of the grid connected system for the two cases, where some prices are estimated and some are derived from the total installation cost of the system.
Table 6.14: The mean elements cost of Grid - connected system.
Case 1
Case 2
Subsystem One
location
(x5) Quantity
Price ($)
Break
down of
installed
cost
Quantity
Price ($)
Break
down of
installed
cost
Price ($)
Photovoltaic-generator
3944 995662.8 28.44 %
810 204484 27.63 % 1022420
Inverter 1 129283 3.7 % 1 6000 (Est.) 7.85 % 300000
Transformer 1 90000 (Est.) 2.58 % 1 30000 (Est.) 3.92 % 150000
Other costs( Junction boxes & LV protections , MV Equipment, Project management, design and engineering, Civil work, Supports str.
- 2284537 65.27 %
- 462984 60.6 % 2314920
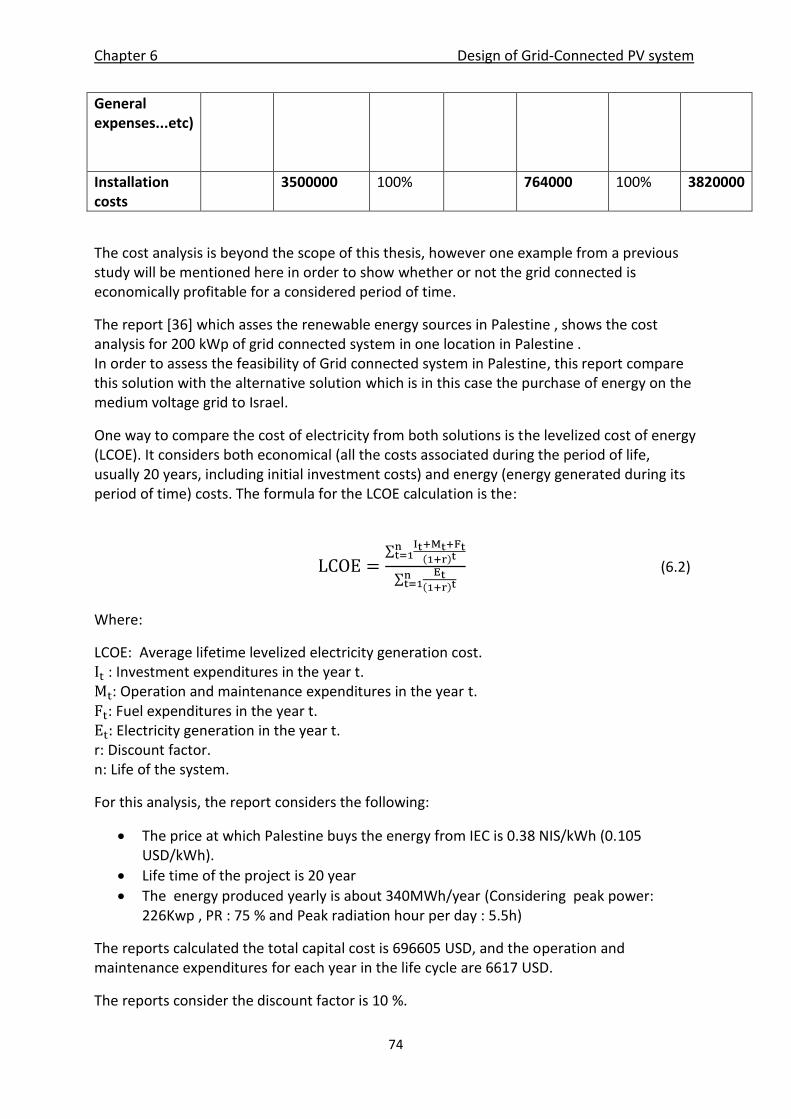
Chapter 6 Design of Grid-Connected PV system
74
General expenses...etc)
Installation costs
3500000 100% 764000 100% 3820000
The cost analysis is beyond the scope of this thesis, however one example from a previous study will be mentioned here in order to show whether or not the grid connected is economically profitable for a considered period of time.
The report [36] which asses the renewable energy sources in Palestine , shows the cost analysis for 200 kWp of grid connected system in one location in Palestine . In order to assess the feasibility of Grid connected system in Palestine, this report compare this solution with the alternative solution which is in this case the purchase of energy on the medium voltage grid to Israel.
One way to compare the cost of electricity from both solutions is the levelized cost of energy (LCOE). It considers both economical (all the costs associated during the period of life, usually 20 years, including initial investment costs) and energy (energy generated during its period of time) costs. The formula for the LCOE calculation is the:
(6.2)
Where:
LCOE: Average lifetime levelized electricity generation cost. : Investment expenditures in the year t. : Operation and maintenance expenditures in the year t. : Fuel expenditures in the year t. Electricity generation in the year t. r: Discount factor. n: Life of the system.
For this analysis, the report considers the following:
The price at which Palestine buys the energy from IEC is 0.38 NIS/kWh (0.105 USD/kWh).
Life time of the project is 20 year
The energy produced yearly is about 340MWh/year (Considering peak power: 226Kwp , PR : 75 % and Peak radiation hour per day : 5.5h)
The reports calculated the total capital cost is 696605 USD, and the operation and maintenance expenditures for each year in the life cycle are 6617 USD.
The reports consider the discount factor is 10 %.
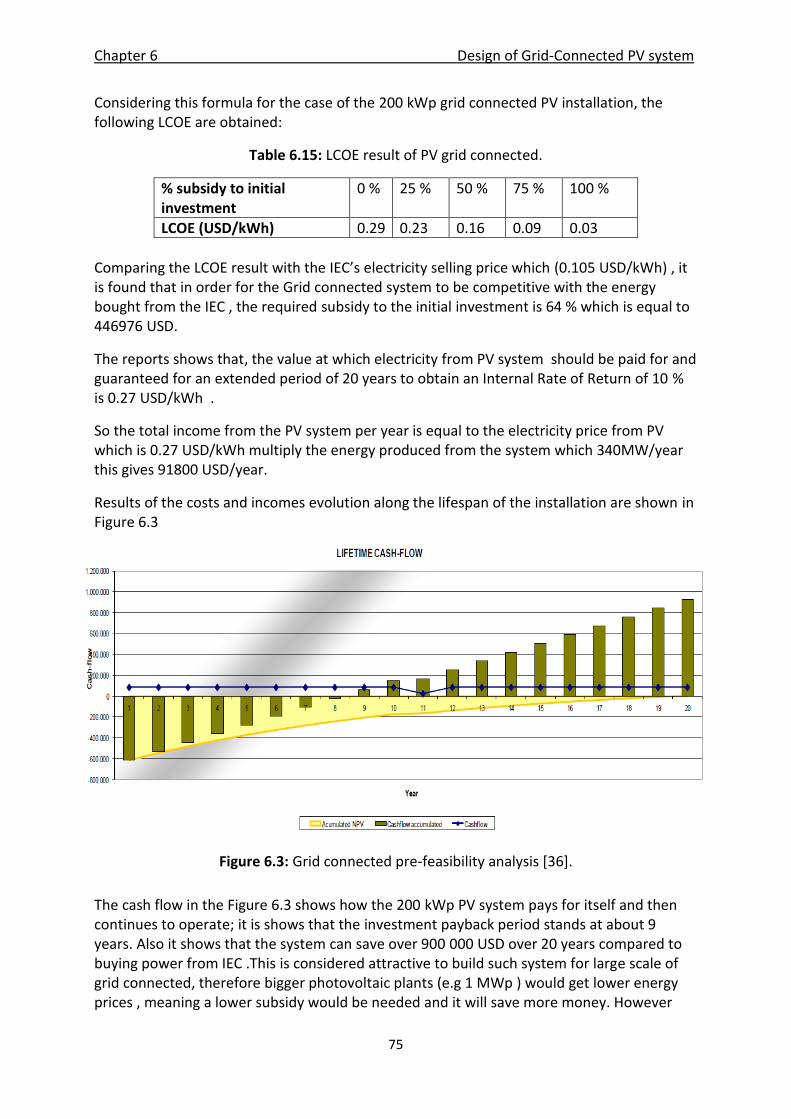
Chapter 6 Design of Grid-Connected PV system
75
Considering this formula for the case of the 200 kWp grid connected PV installation, the following LCOE are obtained:
Table 6.15: LCOE result of PV grid connected.
% subsidy to initial investment
0 % 25 % 50 % 75 % 100 %
LCOE (USD/kWh) 0.29 0.23 0.16 0.09 0.03
Comparing the LCOE result with the IEC’s electricity selling price which (0.105 USD/kWh) , it is found that in order for the Grid connected system to be competitive with the energy bought from the IEC , the required subsidy to the initial investment is 64 % which is equal to 446976 USD.
The reports shows that, the value at which electricity from PV system should be paid for and guaranteed for an extended period of 20 years to obtain an Internal Rate of Return of 10 % is 0.27 USD/kWh .
So the total income from the PV system per year is equal to the electricity price from PV which is 0.27 USD/kWh multiply the energy produced from the system which 340MW/year this gives 91800 USD/year.
Results of the costs and incomes evolution along the lifespan of the installation are shown in Figure 6.3
Figure 6.3: Grid connected pre-feasibility analysis [36].
The cash flow in the Figure 6.3 shows how the 200 kWp PV system pays for itself and then continues to operate; it is shows that the investment payback period stands at about 9 years. Also it shows that the system can save over 900 000 USD over 20 years compared to buying power from IEC .This is considered attractive to build such system for large scale of grid connected, therefore bigger photovoltaic plants (e.g 1 MWp ) would get lower energy prices , meaning a lower subsidy would be needed and it will save more money. However
Chapter 6 Design of Grid-Connected PV system
76
when coming to new cost analysis for bigger system, some parameters for LCOE are changeable due to the cost fluctuating and therefore it should be taken into consideration at the time.
6.6 Summary
In this chapter, the design of large scale grid - connected system is given for two cases. Case 1: a MW scale ground mount system and Case 2 a some 200 kW rooftop or any suitable support structure. While the proposed solar PV grid-connected system with 1 MW capacity consist of 3944 fixed panels for case 1 and for Case 2, 810 fixed panels for each 5 subsystems. Total required installation area is 17500 for case 1 and 3500 for each subsystem in Case 2.
The panels are inclined at an angle equal to the 18 degree and are south facing (see ch. 4.6). The azimuth angle was taken as zero (i.e. facing south) for all the studied locations. Direct current into alternating current (DC/AC) inverters was utilized in the proposed system with a total capacity of 1010 kW for Case 1 and 210 kW for each subsystem in Case 2. To fed the power from the inverters to the utility grid, 1250 kVA 375V/33kV transformer has been used for case 1 and 500 kVA 375V/33kV for each subsystem in case 2. The PV module cost can be estimated to 0.99 US$/Wp. The total installed cost for Case 1 is estimated to 3500000 $ and 3820000 $ for Case 2. The cost analysis of 200 kWp PV system from pervious study has taken part in this chapter to show the feasibility of using such system, where the investment payback period in this example stands at about 9 years, taken into account subsidy to initial investment is 64 %.
77
7 Conclusion and Further Work
The purpose of this thesis has been to evaluate the potential of solar energy for meeting part of the electric energy demand in some locations in Palestine. Four locations with high annual solar irradiation were selected. These locations were: Ramallah, Jerusalem, Bethlehem and Jericho. By using the example of the output characteristics of a household size (2 kWp generator), the solar energy offers peak production during the periods with high demand in summer and days central hours. Moreover a 1 kWp generator will produce on a national average about 1902 kWh with horizontal orientation and 2009 kWh with 18 degree tilt. Accordingly, the investment payback period stands at about 9 years. However, the key element to make the investment in PV systems attractive and financially viable is to receive subsidy to the initial investment from the government. With its high potential for generating solar energy, and due to the fact that the cost of the PV system has been reduced considerably in the past few years and continues to reduce in the future, Palestine could solve part of the energy sector problems due to the political, economical and security shocks, and reduce its depending on importing electricity. The solar data that has been analyzed in this thesis were obtained from satellite observations that are readily available online, however these data are not as accurate as ground measurements. Therefore, in future work, ground measurements could be utilized for more reliable results. Using different types of renewable energy in hybrid systems, in order to utilize all available renewable energy resources, may offer an option for higher reliability. Therefore, this thesis may be a starting point for further work on future projects for e.g. use of PV/wind turbine systems. Studying the impact of high penetration level of PV systems on the utility grid could be good subject for future work. In addition, as future technology becomes smarter, studying the option of using smart grid functionality with PV-grid connected system could be also good subject for future work.
78
Bibliography
[1] Energy Information Administration (EIA). International Energy Outlook 2011. Washington, DC 20585. US. http://www.eia.gov/forecasts/ieo/index.cfm . (Retrieved May 2013).
[2] Environmental Protection Agency (EPA). Global Greenhouse Gas Emissions Data Washington, DC, 20460. US. http://www.epa.gov/climatechange/ghgemissions/global.html. (Retrieved May 2013)
[3] J.Ribas, P.Arranz, X.Vallve. Uncovering the potential for commercial photovoltaic applications in Palestine.Trama Techno Ambiental. Nov.2010.
[4] T.Abu Hamid, L.Isma’il, H.Falmm. Assessing renewable energy potential in Palestine. [email protected].
[5] Solar Energy Industries Association (SEIA). Solar technology: Photovoltaic (Solar electric). Suite 800, Washington, D.C. US. http://www.seia.org/policy/solar-technology/photovoltaic-solar-electric. (Retrieved May 2013).
[6] T.Abu Hamid, H.Falmm, M.Azraq. Renewable energy in the Palestinians territories: opportunity and challenges. Renew Sust Energ Rev 16 (2012) :1082– 1088.
[7] A.Abu Alkhair. The current status of the energy sector in palestine. Geneva University. 2006.
[8] Portland Trust. The renewable energy sector in the Palestinian territory. The Economic Feature, July 2010. Al Masyoun, PO Box 4102, Al Bireh. Ramallah.
[9] I. Ibrik. Energy profile and the potential of renewable energy in Palestine. Renewable energy in the Middle East. Proceedings of the NATO Advanced Research Workshop on Enhancing Security in the Middle East Through Regional Cooperation on Renewable Energy London, United Kingdom 16–18 January 2008. ed. M. Mason and A. Mor, 71-89. Dordrecht: Springer2009.
[10] PEC. Integration of solar technologies into buildings in Mediterranean communities. Solar-build. EC-FP6-INCO-MPC/SSA. June 2007.
[11] Americans United for Palestinian Human Right (AURHR). Palestinian loss of land: 1946 – 2012. Portland, OR 97293.US. http://auphr.org/index.php?option=com_content&view=article&id=5100:palestinian-loss-of-land-1946-2012&catid=32&Itemid=7 . (Retrieved May 2013).
[12] Palestinian Academic Society for the Study of International Affairs (PASSIA). Palestine map. Jerusalem. Palestine.
79
http://www.passia.org/palestine_facts/MAPS/0_pal_facts_MAPS.htm. (Retrieved May 2013).
[13] Palestine Central Bureau of Statistics (PCBS). Ramallah. Palestine. http://www.pcbs.gov.ps/. (Retrieved February 2013).
[14] Al-Zaytouna Centre for Studies & Consultations. Palestine. http://www.alzaytouna.net/permalink/4586.html. (Retrieved March 2013)
[15] Energy: a key sector for the Mediterranean partner countries. KS-SF-09-057-EN-N. ISSN 1977- 0316. European Communities, 2009.
[16] I.IBrik. Presentation (the potential of renewable energy in Palestine). Energy research center. Alnajah University-Nablus, Palestine.
[17] A.Abu Alkhair. Presentation (Refrigeration: The case of electrical system in Palestine).CUEPE. Financing: Program PEACE, Université de Genève.2006.
[18] The European Neighborhood and Partnership Instrument (ENPI). Paving the way for the mediterranean solar plan. Horizontal tasks A&B: Activities 3.5&3.6. Power system 2020: Palestine.
[19] Sh. Awad. Engineer in Dura electricity. Hebron.Palestine. (Personally contact, date April.2013)
[20] The Israel Electricity Cooperation (IEC). Market division. Consumer & rates dept. http://www.iec.co.il/EN/IR/Documents/tariff_1.4.12.pdf . (Retrieved March 2013)
[21] Dynamic energy & water solution. P.O.Box 15201, Dubai, U.A.E http://www.dynamic- ews.com/Tariffs/Electricity%20Tariffs/Jordan.pdf . (Retrieved March 2013)
[22] Statistik sentralbyrå (SSB): Statistic Norway. Electricity prices, Q4 2012. Oslo. Norway http://www.ssb.no/en/elkraftpris. . (Retrieved May 2013)
[23] Solar Cell central. US electricity prices – 2011. http://solarcellcentral.com/cost_page.html
[24] Palestinian Energy and Natural Reassures Authority (PENRA). Palestine solar initiative. Prepared by pwc. 31.2012.
[25] S.R. Wenham, M.A. Green, M.E. Watt, R. Corkish. Applied photovoltaic. Second edition.
[26] Al.Miller, B. Lumby. Utility scale solar power plants. A guide for developers and investors.IFC. Feb.2012.
[27] B.Zeidane. Contribution to the study of the grid connected photovoltaic system. Master thesis. Universtity De Patna. 2003.
[28] Pveducation. Properties of sunlight: Energy of photon. http://pveducation.org/pvcdrom/properties-of-sunlight/energy-of-photon .(Retrieved March 2013
80
[29] National Instruments. Part I: Photovoltaic cell overview. White paper. Publish Date: des 04, 2009. http://www.ni.com/white-paper/7229/en . (Retrieved May 2013)
[30] Urjart. Your alternative energy info center. Solar cell: Basic principle of operation http://urjart.wordpress.com/2008/10/05/solar-cell-%E2%80%93-basic-principle-of-operation .(Retrieved May 2013).
[31] Planning and installing photovoltaic systems: A guide for installers, architects and engineers. Second edition.DGS-I.V Berlin BRB. ISBN-13; 9781-1-84407-4426. 2008.
[32] National Instruments. Part II: Photovoltaic cell overview. White paper. Publish date: mai 10, 2012. http://www.ni.com/white-paper/7230/en. (Retrieved May 2013
[33] Solar energy engineering: process and systems. Elsevier inc. press. First edition. ISBN: 978-0-12-374501-9. 2009. Pages: 52-100, 476 – 494, 711-715.
[34] R.Foster, M.Ghassami, A.Cota. Solar energy: Renewable energy and the environment.CRS press. Taylor & Francis Group. ISBN: 978-1-4200-7566-3.Pages:138-144
[35] G. Dzimano. Modeling of photovoltaic system. Master thesis. The Ohio State University. 2008.
[36] AF-Mercado EMI, IDRC. Task I report: Assessment of renewable sources. Final report
[37] A. Drews, A.C. de Keizer, H.G. Beyer, E. Lorenz, J. Betcke, W.G.J.H.M. van SarK , W. Heydenreich, E. Wiemken, S. Stettler, P. Toggweiler, S. Bofinger, M. Schneider, G. Heilscher, D.Heinemann. Monitoring and remote failure detection of grid-connected PV systems based on satellite observations. Solar Energy 81 (2007) 548–564.
[38] H.G.Beyer. Lecture notes: Renewable energy curse for master program. Agder University. 2011/2012
[39] W.Omran. Performance analysis of grid-connected photovoltaic system. Doctor of philosophy thesis. University of Waterloo. Canda. 2010.
[40] RENI. Inverter and PV system technology. Industry guide 2012.
[41] European Commission, Joint Research Centre(JRC). Photovoltaic Geographical .Information System (PVGIS). http://re.jrc.ec.europa.eu/pvgis/apps4/pvest.php?lang=en&map=africa. (Retrieved January 2013).
[42] M.Maier. Weather Synthesis (WetSyn) - Solar radiation and temperature data generator. University of applied sciences. Munich.
[43] RETscreen. RETScreen software suite. http://www.retscreen.net/ang/home.php (Retrieved January 2013)
[44] A.Woyte.Grid connected of photovoltaic system. Leuven.Dec.2003.
81
[45] Meteonorm: Global metrological database. Handbook part II: Theory. Version 7.0.20. February 2013.
[46] PalestineRemembered.com. http://www.palestineremembered.com/Acre/Maps/Story584.html. (Retrieved February 2013)
[47] S. Adeeb. Manager of Test & Technical Specifications Department. International & Public Relation Department. JEDCO. Palestine. (Contact date January.2013)
[48] Green Rhino Energy. Solar Power. http://www.greenrhinoenergy.com/solar/technologies/pv_energy_yield.php (Retrieved April 2013)
[49] Wikipedia. http://en.wikipedia.org/wiki/Load_profile. (Retrieved April 2013)
[50] R. Perez, R. Seals. Photovoltaic’s can add capacity to the utility grid. The National Renewable Energy Laboratory. DOUGO-10096-262. DE96000544. September 1996.
[51] Ch.Whitaker, J.Newmiller, M.Ropp, B.Norris. Renewable system interconnection study: Distributed photovoltaic systems design and technology requirements. Sandi national laboratories. Feb. 2008.
[52] R. Messenger, J. Venter. Photovoltaic system engineering.
[53] L. Freris and D. Infield, Renewable energy in power systems. Wiley, 2008
[54] List of standards, drafts and specifications specially developed for PV applications. DKE German Commission for Electrical, Electronic & Information Technologies of DIN and VDE. Aug.2012.
[55] G. Nofuentes, J. V. Muñoz, D. L. Talavera, J. Aguilera and J. Terrados. The installation of on-ground photovoltaic plants over marginal areas: PVs in BLOOM Project - A new challenge for land valorisation within a strategic eco-sustainable approach to local development. Technical handbook.
[56] W.Brooks, J.Dunlop. Photovoltaic (PV) installer resource guide. NABCEP. V.5.2. March 2012.
[57] A. Ellis . Presentation on Utility/Lab Workshop on PV Technology and Systems: Grid Operations and High Penetration PV. Sandia National Laboratories.
[58] A. Hoke, R. Butler, J. Hambrick, and B. Kroposki. Maximum Photovoltaic Penetration Levels on Typical Distribution Feeders. Sustainable Energy .IEEE. Journal Article NREL/JA-5500-55094. July 2012.
[59] M. Zeman. Solar cell. Delft University of Technology.
[60] PVinsight. Grid the world. http://pvinsights.com/ (Retrieved April.2013)
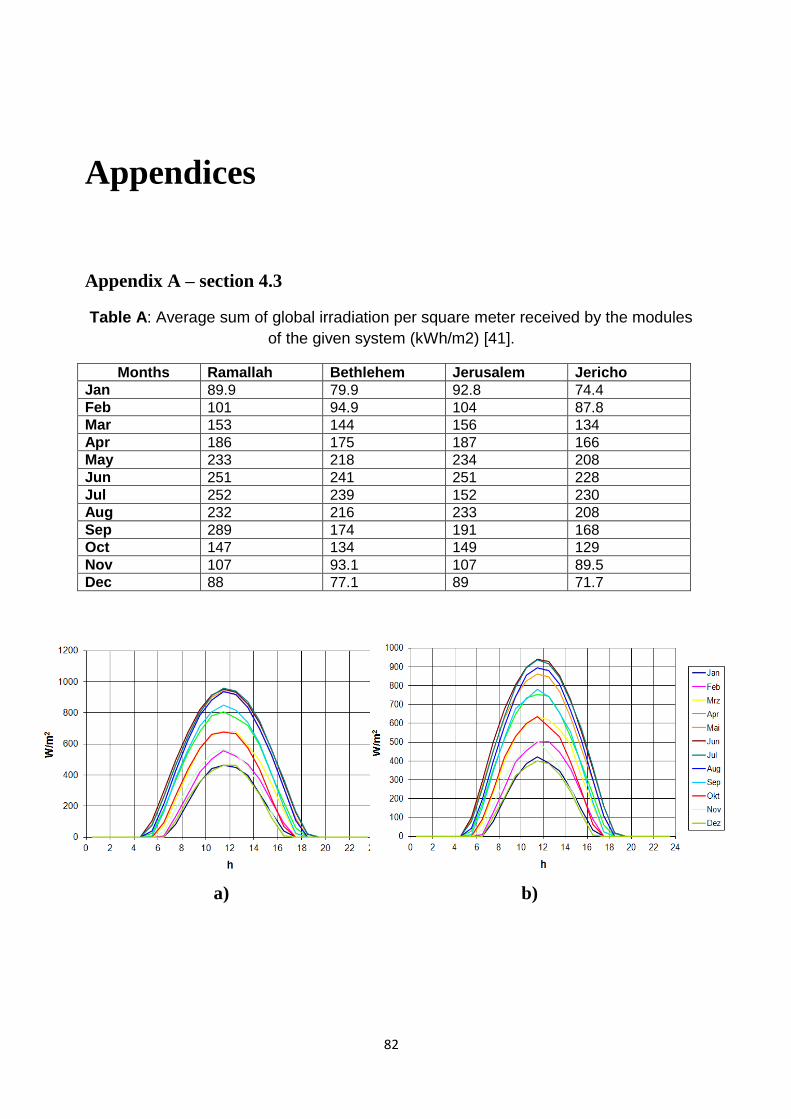
82
Appendices
Appendix A – section 4.3
Table A: Average sum of global irradiation per square meter received by the modules
of the given system (kWh/m2) [41].
Months Ramallah Bethlehem Jerusalem Jericho
Jan 89.9 79.9 92.8 74.4
Feb 101 94.9 104 87.8
Mar 153 144 156 134
Apr 186 175 187 166
May 233 218 234 208
Jun 251 241 251 228
Jul 252 239 152 230
Aug 232 216 233 208
Sep 289 174 191 168
Oct 147 134 149 129
Nov 107 93.1 107 89.5
Dec 88 77.1 89 71.7
a) b)
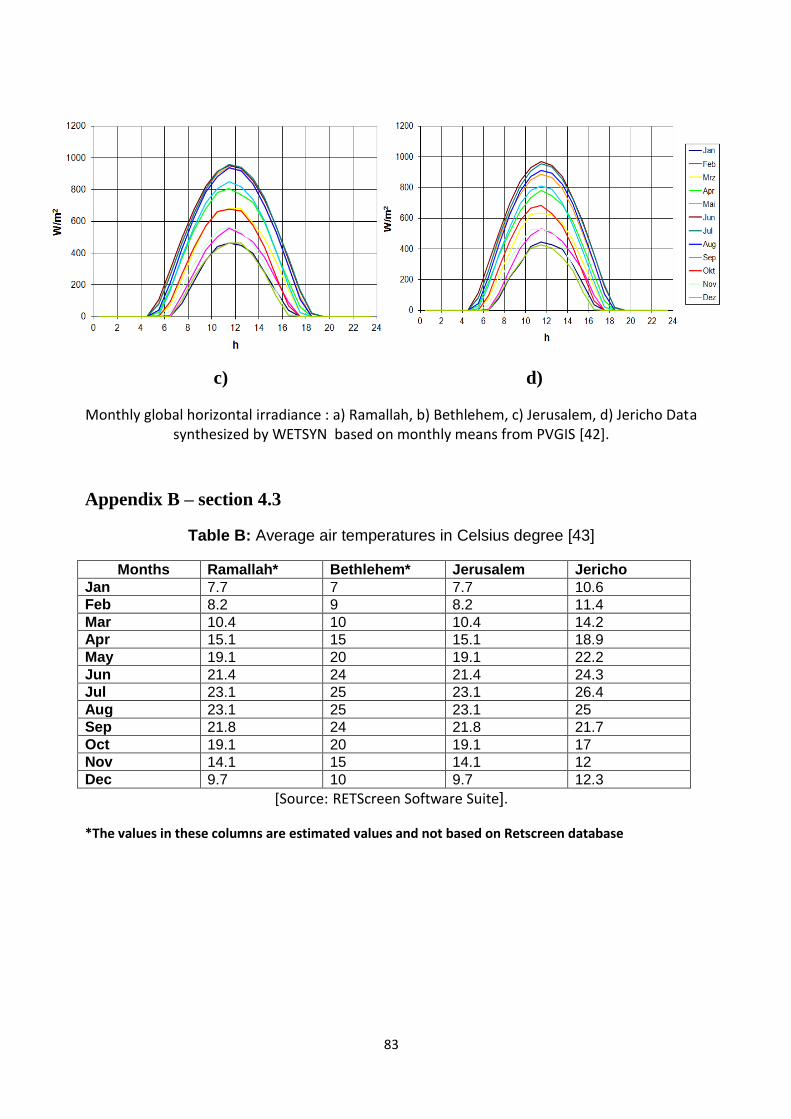
83
c) d)
Monthly global horizontal irradiance : a) Ramallah, b) Bethlehem, c) Jerusalem, d) Jericho Data synthesized by WETSYN based on monthly means from PVGIS [42].
Appendix B – section 4.3
Table B: Average air temperatures in Celsius degree [43]
Months Ramallah* Bethlehem* Jerusalem Jericho
Jan 7.7 7 7.7 10.6
Feb 8.2 9 8.2 11.4
Mar 10.4 10 10.4 14.2
Apr 15.1 15 15.1 18.9
May 19.1 20 19.1 22.2
Jun 21.4 24 21.4 24.3
Jul 23.1 25 23.1 26.4
Aug 23.1 25 23.1 25
Sep 21.8 24 21.8 21.7
Oct 19.1 20 19.1 17
Nov 14.1 15 14.1 12
Dec 9.7 10 9.7 12.3
[Source: RETScreen Software Suite].
*The values in these columns are estimated values and not based on Retscreen database
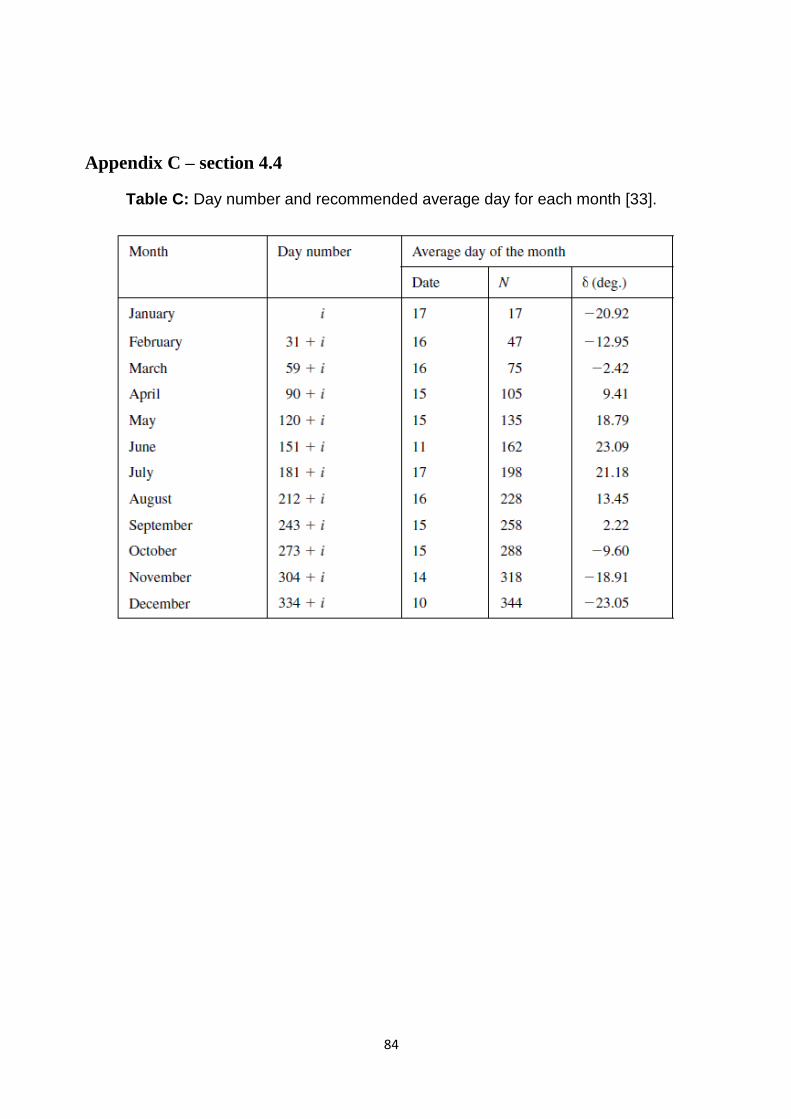
84
Appendix C – section 4.4
Table C: Day number and recommended average day for each month [33].
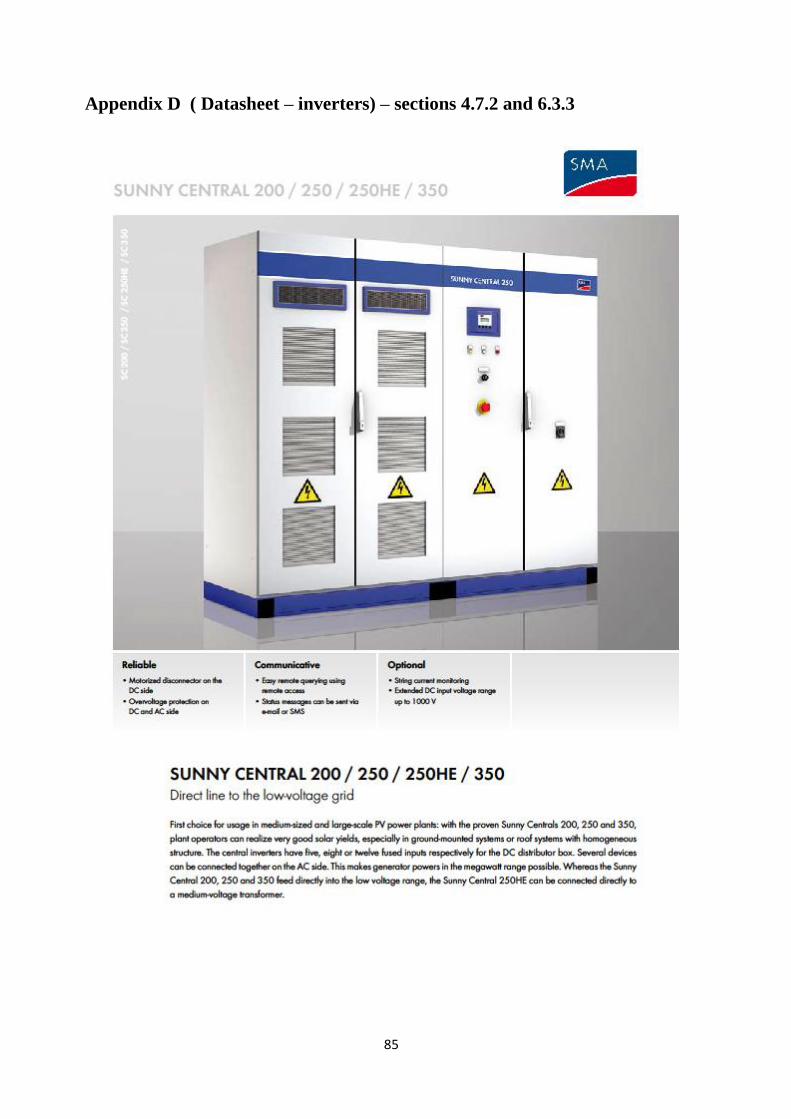
85
Appendix D ( Datasheet – inverters) – sections 4.7.2 and 6.3.3
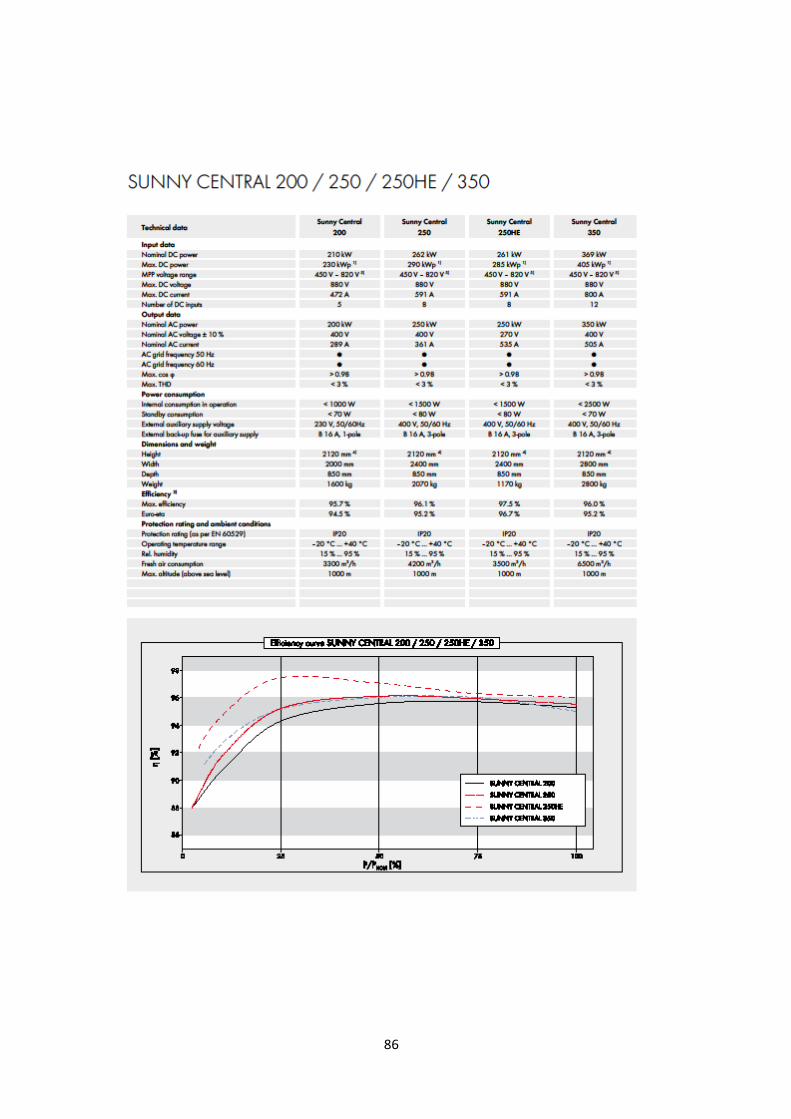
86
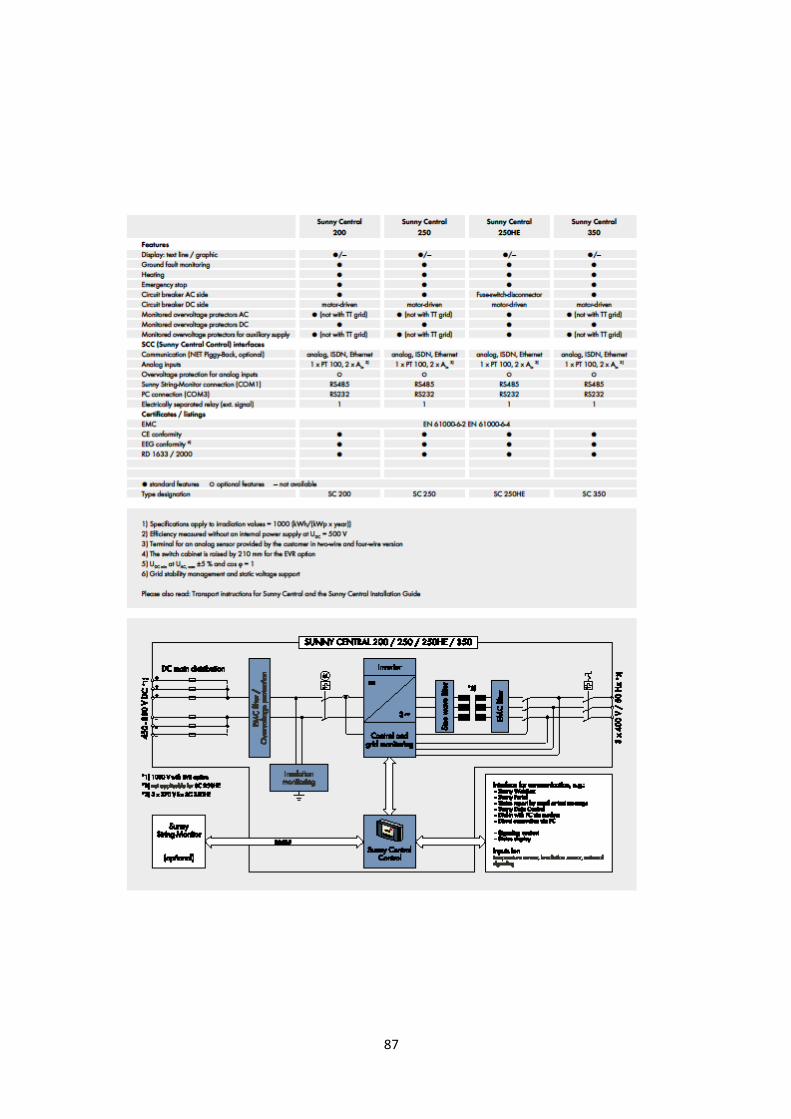
87
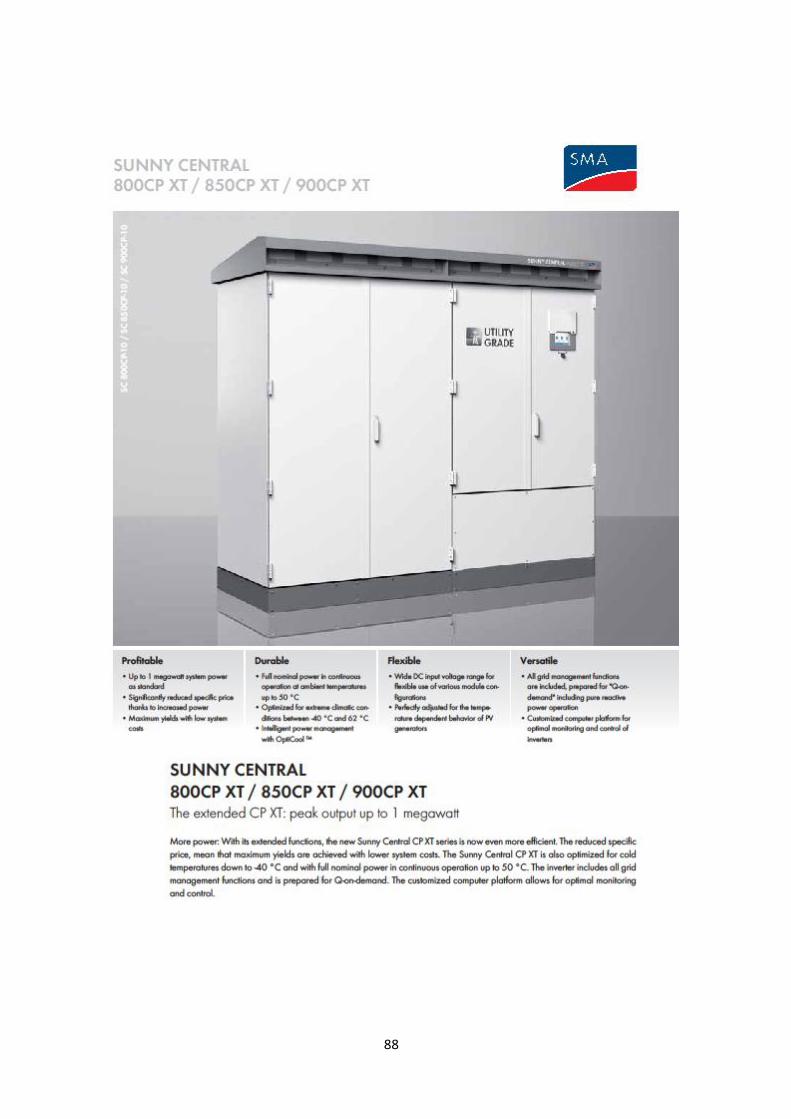
88
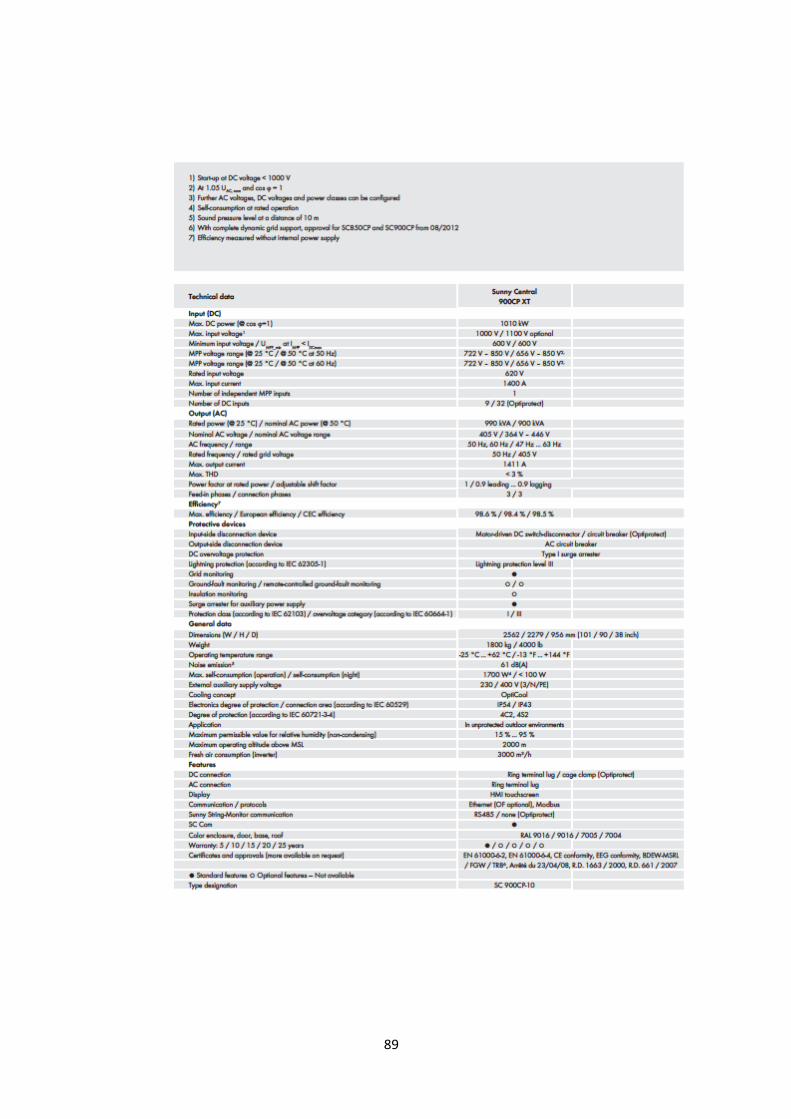
89
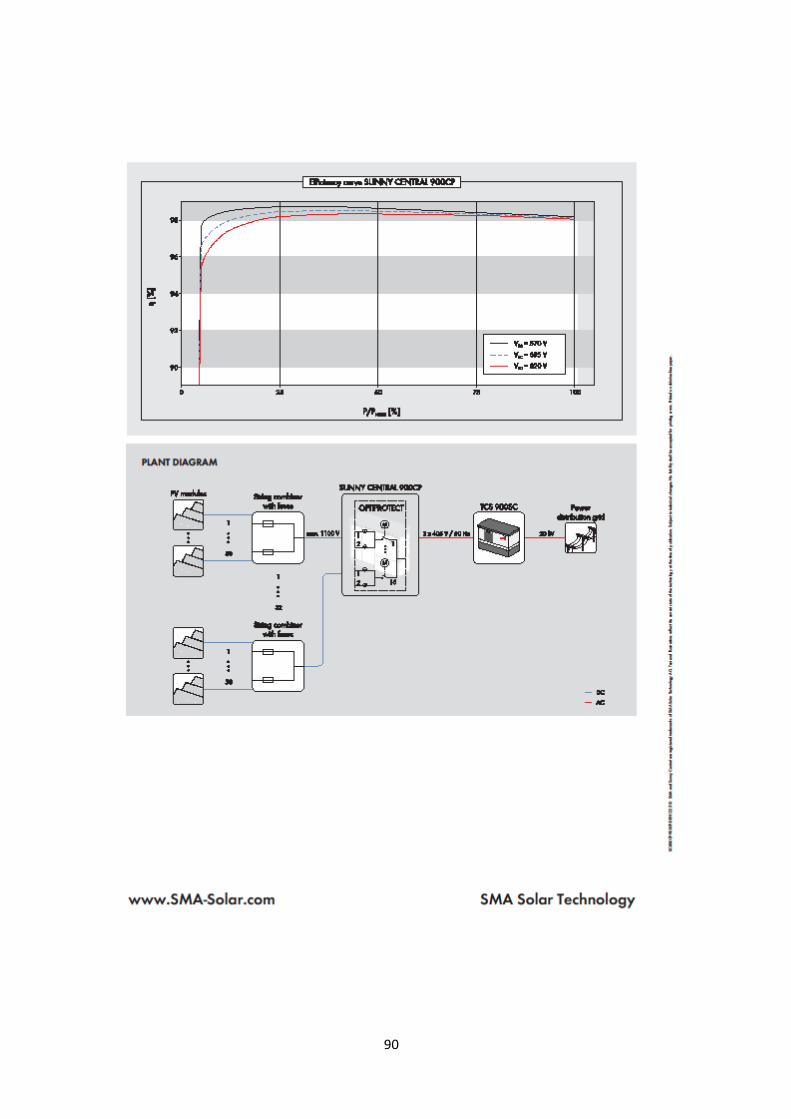
90
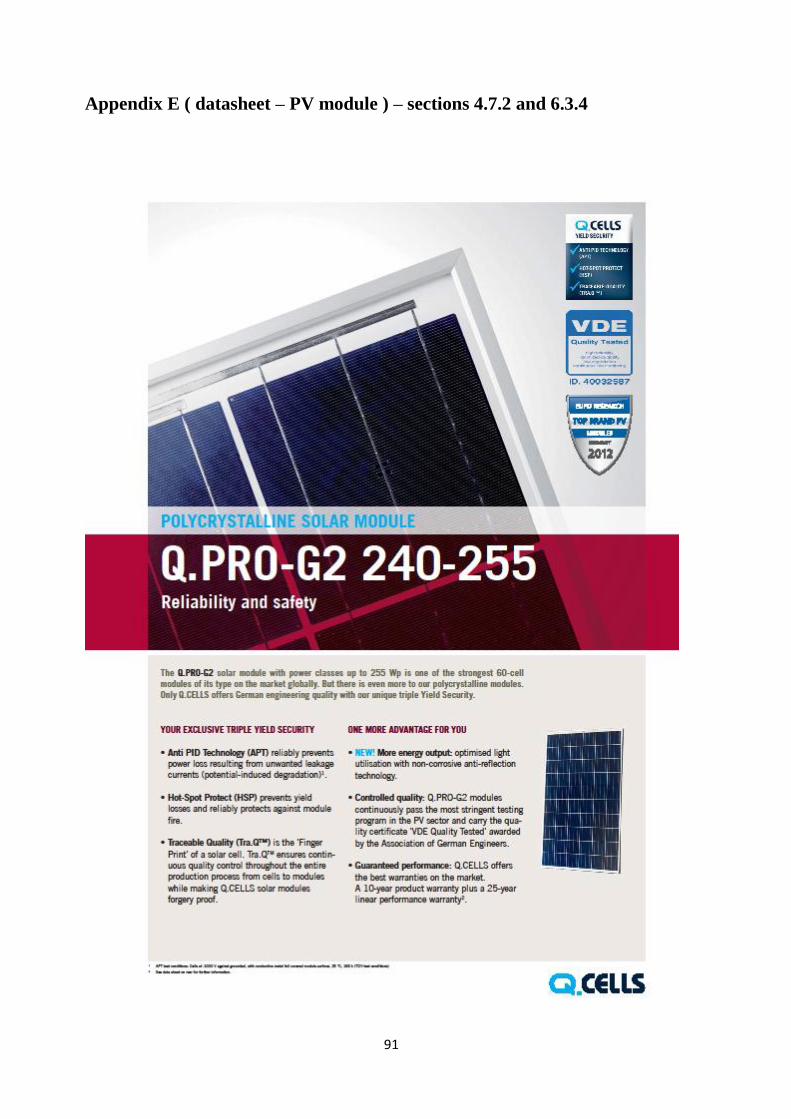
91
Appendix E ( datasheet – PV module ) – sections 4.7.2 and 6.3.4
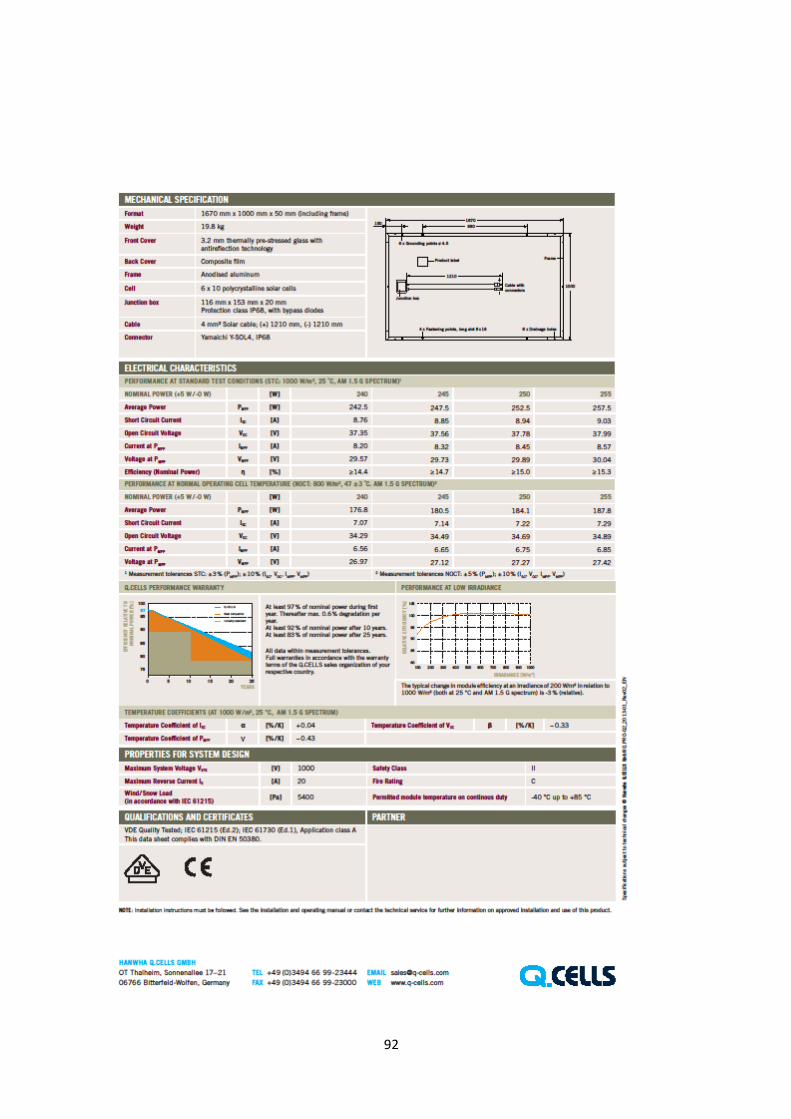
92
93
Appendix F ( datasheet – Transformer ) – section 6.3.6
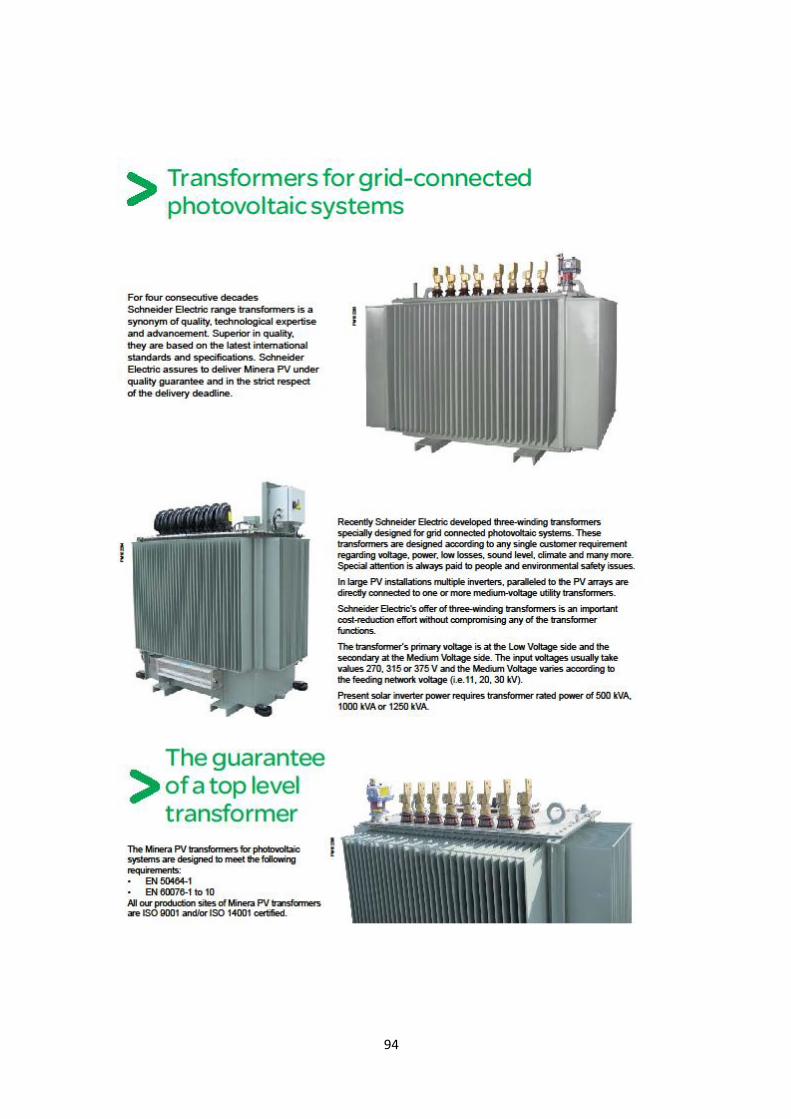
94
95