Embed Size (px)
Citation preview
Seediscussions,stats,andauthorprofilesforthispublicationat:https://www.researchgate.net/publication/306042788
ThePoreCharacteristicsofGeopolymerFoamConcreteandTheirImpactontheCompressiveStrengthandModulus
Article·August2016
DOI:10.3389/fmats.2016.00038
CITATIONS
0
READS
81
2authors:
Someoftheauthorsofthispublicationarealsoworkingontheserelatedprojects:
DurabilityofGeopolymerConcreteViewproject
geopolymerViewproject
ZuhuaZhang
UniversityofSouthernQueensland
29PUBLICATIONS682CITATIONS
SEEPROFILE
HaoWang
UniversityofSouthernQueensland
999PUBLICATIONS6,936CITATIONS
SEEPROFILE
AllcontentfollowingthispagewasuploadedbyHaoWangon25August2016.
Theuserhasrequestedenhancementofthedownloadedfile.Allin-textreferencesunderlinedinblueareaddedtotheoriginaldocumentandarelinkedtopublicationsonResearchGate,lettingyouaccessandreadthemimmediately.
August 2016 | Volume 3 | Article 381
Original researchpublished: 10 August 2016
doi: 10.3389/fmats.2016.00038
Frontiers in Materials | www.frontiersin.org
Edited by: Wenhui Duan,
Monash University, Australia
Reviewed by: Ionut Ovidiu Toma,
Gheorghe Asachi Technical University of Iasi, Romania
Lin Liu, Hohai University, China
*Correspondence:Zuhua Zhang
[email protected]; Hao Wang
Specialty section: This article was submitted to
Structural Materials, a section of the journal
Frontiers in Materials
Received: 20 June 2016Accepted: 26 July 2016
Published: 10 August 2016
Citation: Zhang Z and Wang H (2016)
The Pore Characteristics of Geopolymer Foam Concrete and Their Impact on the Compressive
Strength and Modulus. Front. Mater. 3:38.
doi: 10.3389/fmats.2016.00038
The Pore characteristics of geopolymer Foam concrete and Their impact on the compressive strength and ModulusZuhua Zhang* and Hao Wang*
Centre for Future Materials, University of Southern Queensland, Toowoomba, QLD, Australia
The pore characteristics of geopolymer foam concretes (GFCs) manufactured in the laboratory with 0–16% foam additions were examined using image analysis (IA) and vacuum water saturation techniques. The pore size distribution, pore shape, and poros-ity were obtained. The IA method provides a suitable approach to obtain the information of large pores, which are more important in affecting the compressive strength of GFC. By examining the applicability of the existing models of predicting compressive strength of foam concrete, a modified Ryshkevitch’s model is proposed for GFC, in which only the porosity that is contributed by the pores over a critical diameter (>100 μm) is con-sidered. This “critical void model” is shown to have very satisfying prediction capability in the studied range of porosity. A compression-modulus model for Portland cement concrete is recommended for predicting the compression-modulus elasticity of GFC. This study confirms that GFC have similar pore structures and mechanical behavior as those Portland cement foam concrete and can be used alternatively in the industry for the construction and insulation purposes.
Keywords: alkali-activated cement, geopolymer, foam concrete, pore size, porosity, compressive strength, compression modulus
inTrODUcTiOn
Foam concrete is usually manufactured by introducing air, either by chemical reaction or mechani-cal mixing, into Portland cement paste or mortar (with normal sand or lightweight aggregates) to form a homogeneous porous structure. Because of the large volume of voids, foam concrete offers better thermal insulation property than normal dense concrete. In recent years, the increasing public concern of building energy efficiency and embodied energy of construction materials has driven the rapid research and development of foam concretes. The utilization of foam concretes in China has exceeded 35 million m3 in 2015, of which ~80% were used as/for insulation wall panel and insulation layer of roof; the production of foam concrete is increasing at an annual rate of 20% in China [China Concrete & Cement-Based Products Association (CCPA) Report, 2016].
Geopolymer foam concrete (GFC) is the most recently developed foam concrete with the concept of using geopolymer as an alternative binder to replace Portland cement (Zhang et al., 2014b). Geopolymer is manufactured by alkali-activation of reactive aluminosilicate solids, usually the industrial by products, such as fly ash and slag, and other types of raw materials (particularly the heated kaolin). The alkali activators are normally sodium/potassium hydroxide, sodium/potas-sium silicate solutions, and their mixtures. After the activation and reaction at ambient to elevated
Mix(1-2 min)
Cast
Cure
DemoldPore anal. and test
Activationsolutions
Solid raw materials
Mix(5-10 min)
Prepared foam
Weight
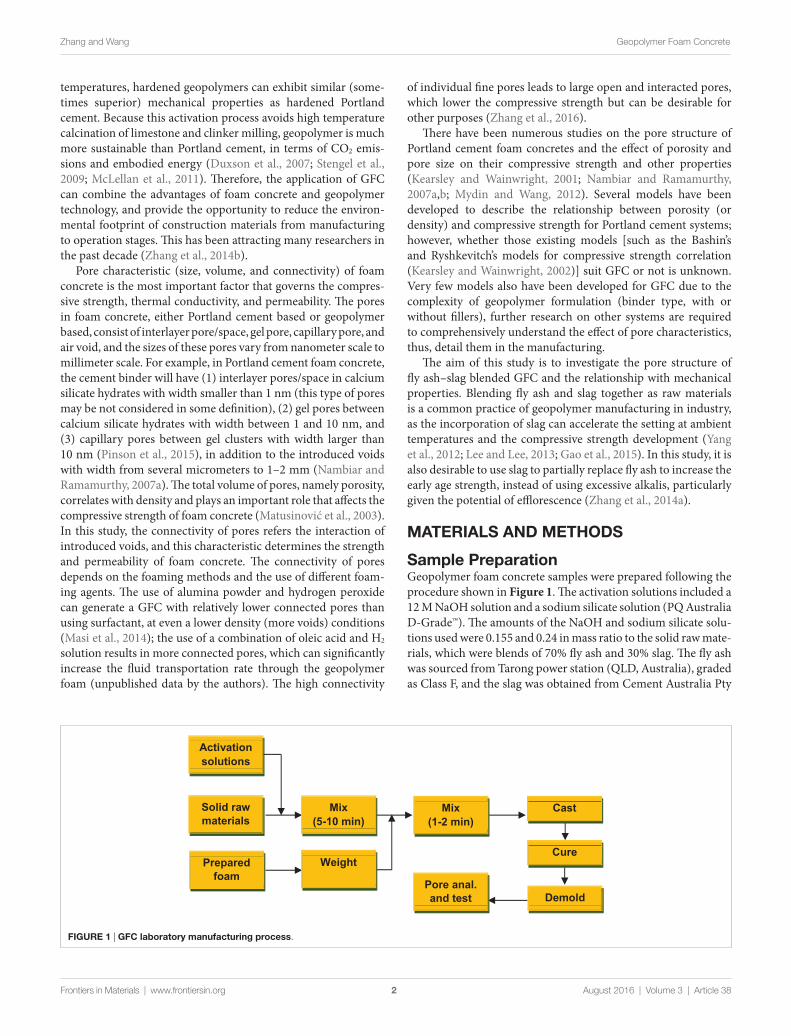
FigUre 1 | gFc laboratory manufacturing process.
2
Zhang and Wang Geopolymer Foam Concrete
Frontiers in Materials | www.frontiersin.org August 2016 | Volume 3 | Article 38
temperatures, hardened geopolymers can exhibit similar (some-times superior) mechanical properties as hardened Portland cement. Because this activation process avoids high temperature calcination of limestone and clinker milling, geopolymer is much more sustainable than Portland cement, in terms of CO2 emis-sions and embodied energy (Duxson et al., 2007; Stengel et al., 2009; McLellan et al., 2011). Therefore, the application of GFC can combine the advantages of foam concrete and geopolymer technology, and provide the opportunity to reduce the environ-mental footprint of construction materials from manufacturing to operation stages. This has been attracting many researchers in the past decade (Zhang et al., 2014b).
Pore characteristic (size, volume, and connectivity) of foam concrete is the most important factor that governs the compres-sive strength, thermal conductivity, and permeability. The pores in foam concrete, either Portland cement based or geopolymer based, consist of interlayer pore/space, gel pore, capillary pore, and air void, and the sizes of these pores vary from nanometer scale to millimeter scale. For example, in Portland cement foam concrete, the cement binder will have (1) interlayer pores/space in calcium silicate hydrates with width smaller than 1 nm (this type of pores may be not considered in some definition), (2) gel pores between calcium silicate hydrates with width between 1 and 10 nm, and (3) capillary pores between gel clusters with width larger than 10 nm (Pinson et al., 2015), in addition to the introduced voids with width from several micrometers to 1–2 mm (Nambiar and Ramamurthy, 2007a). The total volume of pores, namely porosity, correlates with density and plays an important role that affects the compressive strength of foam concrete (Matusinović et al., 2003). In this study, the connectivity of pores refers the interaction of introduced voids, and this characteristic determines the strength and permeability of foam concrete. The connectivity of pores depends on the foaming methods and the use of different foam-ing agents. The use of alumina powder and hydrogen peroxide can generate a GFC with relatively lower connected pores than using surfactant, at even a lower density (more voids) conditions (Masi et al., 2014); the use of a combination of oleic acid and H2 solution results in more connected pores, which can significantly increase the fluid transportation rate through the geopolymer foam (unpublished data by the authors). The high connectivity
of individual fine pores leads to large open and interacted pores, which lower the compressive strength but can be desirable for other purposes (Zhang et al., 2016).
There have been numerous studies on the pore structure of Portland cement foam concretes and the effect of porosity and pore size on their compressive strength and other properties (Kearsley and Wainwright, 2001; Nambiar and Ramamurthy, 2007a,b; Mydin and Wang, 2012). Several models have been developed to describe the relationship between porosity (or density) and compressive strength for Portland cement systems; however, whether those existing models [such as the Bashin’s and Ryshkevitch’s models for compressive strength correlation (Kearsley and Wainwright, 2002)] suit GFC or not is unknown. Very few models also have been developed for GFC due to the complexity of geopolymer formulation (binder type, with or without fillers), further research on other systems are required to comprehensively understand the effect of pore characteristics, thus, detail them in the manufacturing.
The aim of this study is to investigate the pore structure of fly ash–slag blended GFC and the relationship with mechanical properties. Blending fly ash and slag together as raw materials is a common practice of geopolymer manufacturing in industry, as the incorporation of slag can accelerate the setting at ambient temperatures and the compressive strength development (Yang et al., 2012; Lee and Lee, 2013; Gao et al., 2015). In this study, it is also desirable to use slag to partially replace fly ash to increase the early age strength, instead of using excessive alkalis, particularly given the potential of efflorescence (Zhang et al., 2014a).
MaTerials anD MeThODs
sample PreparationGeopolymer foam concrete samples were prepared following the procedure shown in Figure 1. The activation solutions included a 12 M NaOH solution and a sodium silicate solution (PQ Australia D-Grade™). The amounts of the NaOH and sodium silicate solu-tions used were 0.155 and 0.24 in mass ratio to the solid raw mate-rials, which were blends of 70% fly ash and 30% slag. The fly ash was sourced from Tarong power station (QLD, Australia), graded as Class F, and the slag was obtained from Cement Australia Pty
Table 1 | compositions of solid raw materials, mass%.
Materials siO2 al2O3 caO MgO K2O na2O Fe2O3 P2O5 sO3 TiO2 lOia
Fly ash 72.1 24.7 0.1 0.2 0.5 ≤0.1 1.2 ≤0.1 ≤0.1 1.4 0.4Slag 33.3 14.6 41.7 6.1 0.3 0.2 0.8 0.2 0.6 0.6 0.5
aLOI is loss on ignition.
3
Zhang and Wang Geopolymer Foam Concrete
Frontiers in Materials | www.frontiersin.org August 2016 | Volume 3 | Article 38
Ltd. The chemical compositions of the activations solutions and solid raw materials are given in Table 1.
The solid raw materials were dry mixed in a cement mortar mixer, followed by adding the NaOH solution and sodium silicate solution. The mixing will be 5–10 min; at the meanwhile, foam was generated using an air pressure foam generator, weighed, and immediately transferred at the end of paste mixing. Considering the water content introduced by foam (with mass ratios to solid materials of 0, 1.3, 3.3, 5, 6.7, 10, 13, and 16%), additional water (0–10%) was added during the paste mixing, thus, to obtain a consistent mixture with high flowability (as determined by a mini slump) and little variation of compositions. The homogeneous foamed slurry was cast in φ53 × 105 mm plastic molds, sealed with plastic film wrap, cured at 40°C for 1 day, aged for 27 days at ambient conditions, and then demolded for testing and charac-terization. The curing temperature 40°C was optimized according to the mixture. At this temperature, there is little volume change during the curing period, while high or low temperatures can cause large expansion or sink of the fresh slurry.
Pore analysisThe characterization of air voids was also carried out with an image analysis (IA) system consisting of an Olympus optical microscopy and the Analysis-FIVE software. The sample prepa-ration was referenced the method proposed by Nambiar and Ramamurthy (2007a). Specifically, the oven-dried specimens were first polished, cleaned with compressed air to blow away the losing particles in the open air voids, coated with black ink, and allowed to dry for several hours. White talc powder was then spread on the black surface and slowly filled into the air voids by vibrating the specimens and pressing with a flat glass slide. The excess powder was wiped away with the edge of a razor blade and then with normal office adhesive tape, which can remove the powder lying on the binder while retain the powder in voids unaffected. This method attained a surface with sharp and easily distinguishable boundaries of the air voids and matrix by their high color contrast under optical microscopy. As the objective was to observe the air voids of GFC, a low magnification of 20× was selected. Each specimen has 20 images captured to analyze parameters of pore size and shape factor of all identified voids. The shape factor is determined by SF = (perimeter)2/(4π·area).
The porosity of GFC was determined by a vacuum saturation method (Kearsley and Wainwright, 2002). Usually, the test sample should be a core taken from a large specimen, so as to avoid the possible effects of the surface on water absorption. In this study, the surfaces of specimens were, therefore, polished with sand paper. After measuring the sizes and oven-dried weight (mdry) at 105°C, specimens were evacuated under a vacuum of 80–100 kPa for 2 days and then boiled water was sucked in until all specimens
were immersed. The immersed system was kept under the nega-tive pressure for 1 day. By this process, it was believed that all of the air bubbles have been removed from the specimens as well as that in the boiled water. After the vacuum, specimens were removed from the water and weighed (msat). The water saturation porosity was calculated using this formula, P = (msat − mdry)/(ρv), in which ρ is the density of water, v is the volume of the polished specimen.
Mechanical MeasurementsThe compressive strength of the cylindrical (φ53 × 105 mm) samples was measured at the age of 28 days on an MTS universal mechanical testing instrument at a loading speed of 0.5 mm/min. The stress–strain were recorded to calculate the modulus of compression elasticity by using the range between 20 and 60% of maximum stress of each curve.
resUlTs anD DiscUssiOn
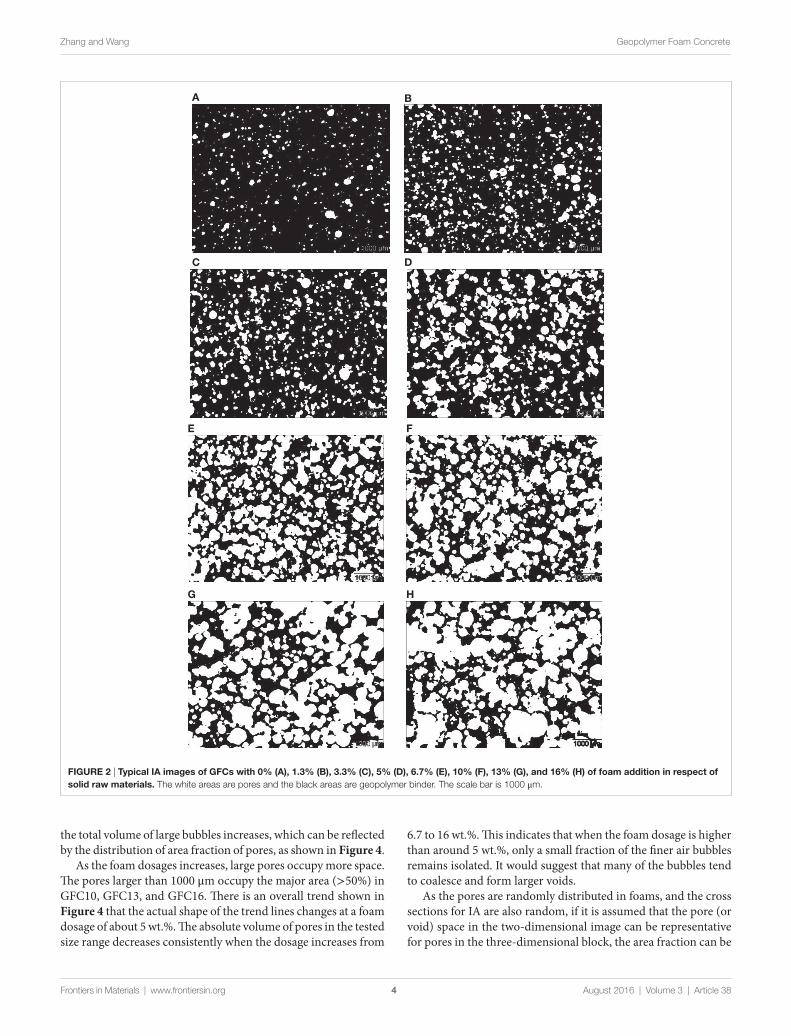
Pore size and DistributionTypical binarized images of GFC with 0–16% foam addition are shown in Figure 2. The pore and voids are in the diameters from several micrometers to over 1000 μm. It is acknowledged that one of the limitations of the imaging method is that only large pores can be effectively characterized. In this study, the smallest distin-guishable pores are 24.62 μm2, and the corresponding equivalent circle diameter (ECD) is 5.60 μm, which is much smaller than the objective macropores (>50 μm) in the analysis of OPC foam concretes (Nambiar and Ramamurthy, 2007a).
In the solid geopolymer sample GFC0, pores that are larger than 5.6 μm are also observed. Two possible reasons may cause these large pores in solid samples. The first reason is the introduction of air voids during mixing. This is inevitable under ambient conditions (vacuum mixing could avoid such type of pores). The second possible reason is that the unreacted fly ash particles in the hollow structure fall off from the shell during sampling. However, whether formed because of mixing or the detachment of unreacted particles, these pores are all weak regions in the structure, and have impact on the mechanical properties.
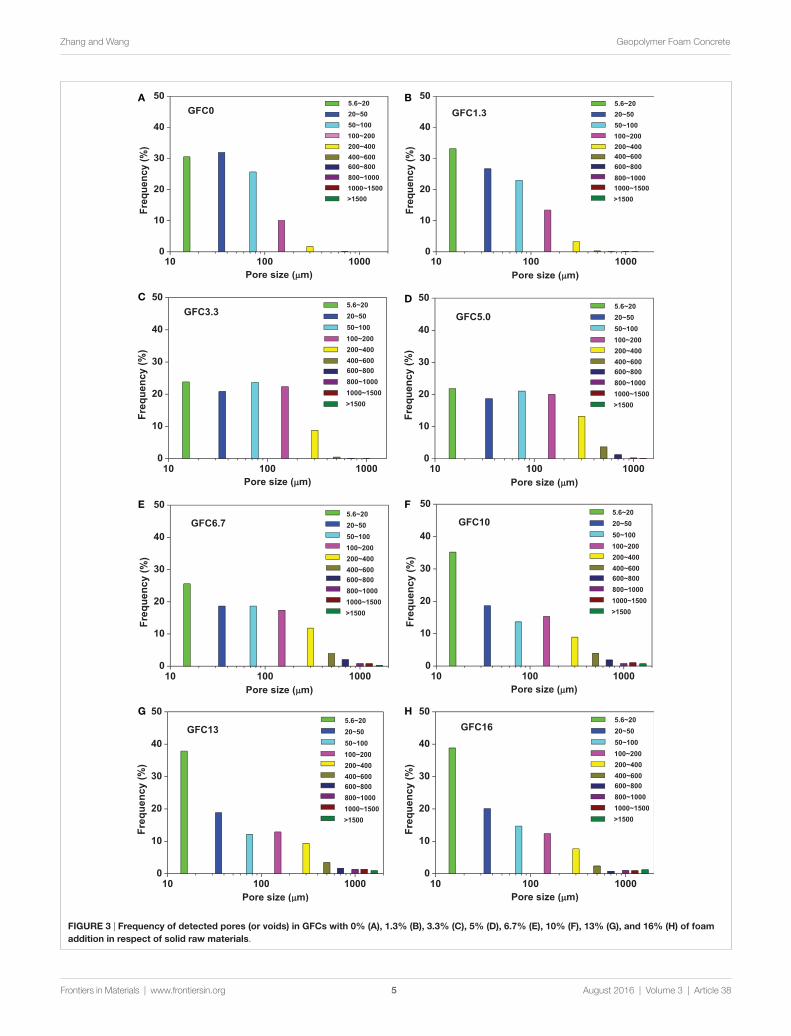
Figure 3 further presents the frequency of the detected pores as a function of their size ranges. In the geopolymer GFC0, 85% of the detected pores are smaller than 100 μm. With an increased dosages of foam, the number of pores that are larger than 100 μm increases. However, when foam addition is higher than 10%, the frequency of pores <100 μm increases significantly. This is not because the number of fine pores becomes larger but because of the increased pore interruption, which is the total number of pores decreases (which is evident in Figures 2G,H). As a result,
E
G
F
H
A B
DC
FigUre 2 | Typical ia images of gFcs with 0% (a), 1.3% (b), 3.3% (c), 5% (D), 6.7% (e), 10% (F), 13% (g), and 16% (h) of foam addition in respect of solid raw materials. The white areas are pores and the black areas are geopolymer binder. The scale bar is 1000 μm.
4
Zhang and Wang Geopolymer Foam Concrete
Frontiers in Materials | www.frontiersin.org August 2016 | Volume 3 | Article 38
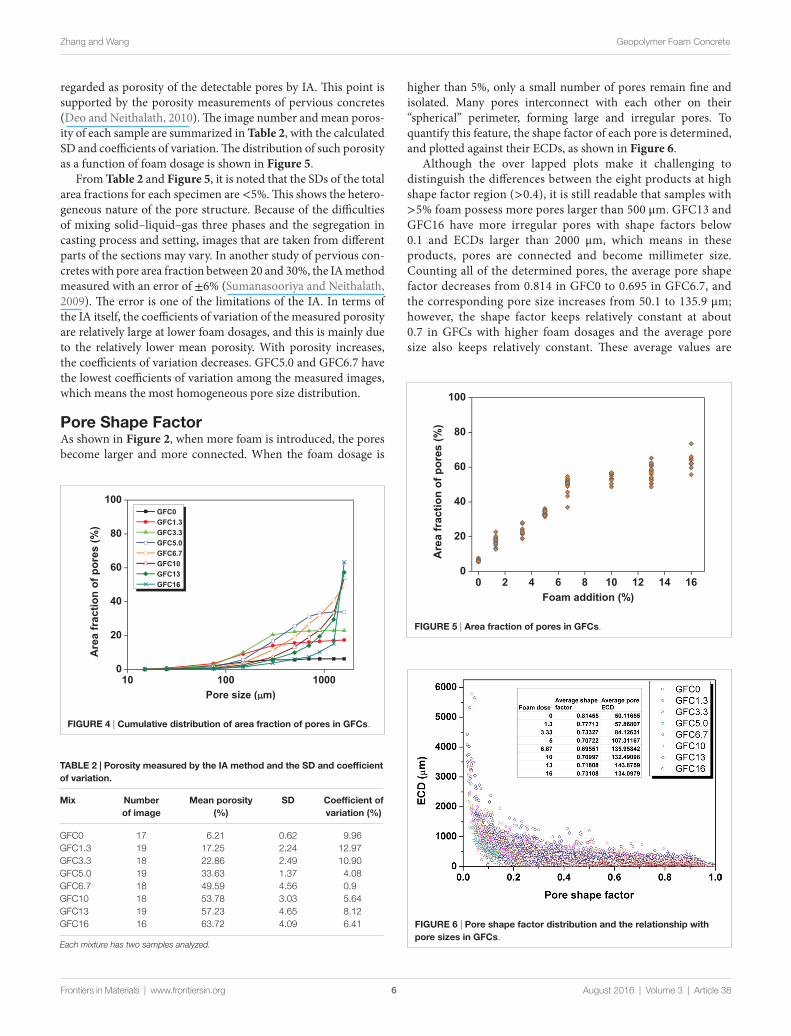
the total volume of large bubbles increases, which can be reflected by the distribution of area fraction of pores, as shown in Figure 4.
As the foam dosages increases, large pores occupy more space. The pores larger than 1000 μm occupy the major area (>50%) in GFC10, GFC13, and GFC16. There is an overall trend shown in Figure 4 that the actual shape of the trend lines changes at a foam dosage of about 5 wt.%. The absolute volume of pores in the tested size range decreases consistently when the dosage increases from
6.7 to 16 wt.%. This indicates that when the foam dosage is higher than around 5 wt.%, only a small fraction of the finer air bubbles remains isolated. It would suggest that many of the bubbles tend to coalesce and form larger voids.
As the pores are randomly distributed in foams, and the cross sections for IA are also random, if it is assumed that the pore (or void) space in the two-dimensional image can be representative for pores in the three-dimensional block, the area fraction can be
A
C
E
G
B
D
F
H
FigUre 3 | Frequency of detected pores (or voids) in gFcs with 0% (a), 1.3% (b), 3.3% (c), 5% (D), 6.7% (e), 10% (F), 13% (g), and 16% (h) of foam addition in respect of solid raw materials.
5
Zhang and Wang Geopolymer Foam Concrete
Frontiers in Materials | www.frontiersin.org August 2016 | Volume 3 | Article 38
6
Zhang and Wang Geopolymer Foam Concrete
Frontiers in Materials | www.frontiersin.org August 2016 | Volume 3 | Article 38
regarded as porosity of the detectable pores by IA. This point is supported by the porosity measurements of pervious concretes (Deo and Neithalath, 2010). The image number and mean poros-ity of each sample are summarized in Table 2, with the calculated SD and coefficients of variation. The distribution of such porosity as a function of foam dosage is shown in Figure 5.
From Table 2 and Figure 5, it is noted that the SDs of the total area fractions for each specimen are <5%. This shows the hetero-geneous nature of the pore structure. Because of the difficulties of mixing solid–liquid–gas three phases and the segregation in casting process and setting, images that are taken from different parts of the sections may vary. In another study of pervious con-cretes with pore area fraction between 20 and 30%, the IA method measured with an error of ±6% (Sumanasooriya and Neithalath, 2009). The error is one of the limitations of the IA. In terms of the IA itself, the coefficients of variation of the measured porosity are relatively large at lower foam dosages, and this is mainly due to the relatively lower mean porosity. With porosity increases, the coefficients of variation decreases. GFC5.0 and GFC6.7 have the lowest coefficients of variation among the measured images, which means the most homogeneous pore size distribution.
Pore shape FactorAs shown in Figure 2, when more foam is introduced, the pores become larger and more connected. When the foam dosage is
higher than 5%, only a small number of pores remain fine and isolated. Many pores interconnect with each other on their “spherical” perimeter, forming large and irregular pores. To quantify this feature, the shape factor of each pore is determined, and plotted against their ECDs, as shown in Figure 6.
Although the over lapped plots make it challenging to distinguish the differences between the eight products at high shape factor region (>0.4), it is still readable that samples with >5% foam possess more pores larger than 500 μm. GFC13 and GFC16 have more irregular pores with shape factors below 0.1 and ECDs larger than 2000 μm, which means in these products, pores are connected and become millimeter size. Counting all of the determined pores, the average pore shape factor decreases from 0.814 in GFC0 to 0.695 in GFC6.7, and the corresponding pore size increases from 50.1 to 135.9 μm; however, the shape factor keeps relatively constant at about 0.7 in GFCs with higher foam dosages and the average pore size also keeps relatively constant. These average values are
Table 2 | Porosity measured by the ia method and the sD and coefficient of variation.
Mix number of image
Mean porosity (%)
sD coefficient of variation (%)
GFC0 17 6.21 0.62 9.96GFC1.3 19 17.25 2.24 12.97GFC3.3 18 22.86 2.49 10.90GFC5.0 19 33.63 1.37 4.08GFC6.7 18 49.59 4.56 0.9GFC10 18 53.78 3.03 5.64GFC13 19 57.23 4.65 8.12GFC16 16 63.72 4.09 6.41
Each mixture has two samples analyzed.
FigUre 5 | area fraction of pores in gFcs.
FigUre 6 | Pore shape factor distribution and the relationship with pore sizes in gFcs.
FigUre 4 | cumulative distribution of area fraction of pores in gFcs.
7
Zhang and Wang Geopolymer Foam Concrete
Frontiers in Materials | www.frontiersin.org August 2016 | Volume 3 | Article 38
obtained by weighting the sum of shape factors or pore sizes over the total number of each sample. This seems conflict with the observation in Figure 2. The reason is that overall weighting does not consider the numbers of fine pores on the shape factor. There are only a few pores that have large sizes, such as >2000 μm. To more accurately describe the shape factors and pore sizes, Figure 7 plots their average values by weighting the numbers of pores over certain ranges (as shown by icons in Figure 3).
It is noted that the pore shape factor has no direct relation-ship with foam dosages. The shape factor decreases in a roughly linear relation as function of the pore size. At the small pore size range, the pores are more cycle while at larger sizes, the pores become more irregular, which is due to the interconnection between pores. Nambiar and Ramamurthy (2007a) suggested that the shape of pores has no influence on the properties of foam concrete, as the air voids are approximately the same shape and independent of foam volume. The pore shape distribution of GFCs seems to follow the same trend as Portland cement foam concrete, that is, the average pore shapes keep constant as a func-tion of dosage of foam or density.
PorosityThe total porosity P as determined by water saturation method is given in Table 3, with comparison to the values by IA for large pores. As expected, the water saturation porosity is much higher than porosity determined by IA, which cannot count those pores
with diameter smaller than 5.6 μm in the matrix. As the water saturation method was performed under vacuum conditions and the matrix are porous, which allows water to easily penetrate, the porosity determined by this method is believed to be the true porosity. These pore features and porosity are critical factors that will govern the mechanical properties and other properties of foam concrete.
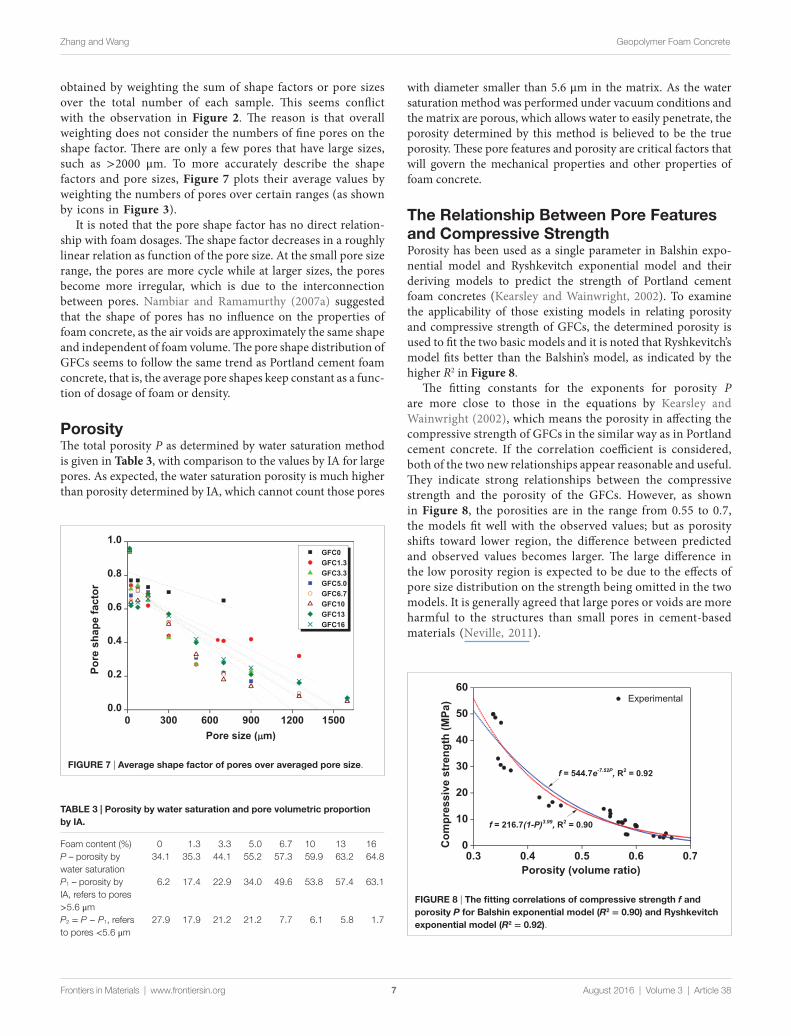
The relationship between Pore Features and compressive strengthPorosity has been used as a single parameter in Balshin expo-nential model and Ryshkevitch exponential model and their deriving models to predict the strength of Portland cement foam concretes (Kearsley and Wainwright, 2002). To examine the applicability of those existing models in relating porosity and compressive strength of GFCs, the determined porosity is used to fit the two basic models and it is noted that Ryshkevitch’s model fits better than the Balshin’s model, as indicated by the higher R2 in Figure 8.
The fitting constants for the exponents for porosity P are more close to those in the equations by Kearsley and Wainwright (2002), which means the porosity in affecting the compressive strength of GFCs in the similar way as in Portland cement concrete. If the correlation coefficient is considered, both of the two new relationships appear reasonable and useful. They indicate strong relationships between the compressive strength and the porosity of the GFCs. However, as shown in Figure 8, the porosities are in the range from 0.55 to 0.7, the models fit well with the observed values; but as porosity shifts toward lower region, the difference between predicted and observed values becomes larger. The large difference in the low porosity region is expected to be due to the effects of pore size distribution on the strength being omitted in the two models. It is generally agreed that large pores or voids are more harmful to the structures than small pores in cement-based materials (Neville, 2011).
FigUre 7 | average shape factor of pores over averaged pore size.
FigUre 8 | The fitting correlations of compressive strength f and porosity P for balshin exponential model (R2 = 0.90) and ryshkevitch exponential model (R2 = 0.92).
Table 3 | Porosity by water saturation and pore volumetric proportion by ia.
Foam content (%) 0 1.3 3.3 5.0 6.7 10 13 16P – porosity by water saturation
34.1 35.3 44.1 55.2 57.3 59.9 63.2 64.8
P1 – porosity by IA, refers to pores >5.6 μm
6.2 17.4 22.9 34.0 49.6 53.8 57.4 63.1
P2 = P − P1, refers to pores <5.6 μm
27.9 17.9 21.2 21.2 7.7 6.1 5.8 1.7
8
Zhang and Wang Geopolymer Foam Concrete
Frontiers in Materials | www.frontiersin.org August 2016 | Volume 3 | Article 38
Considering the potential effects of pore size, two new models based on Ryshkevitch’s and Balshin’s models are proposed as follows:
Model 1: = +f A e B eca p b p× ×⋅ ⋅1 2
(1)
Model 2: f C p D pcc d= × − + × −( ) ( )1 11 2 (2)
In Models 1 and 2, the volume of small pores (<5.6 μm) and the volume of large pores (>5.6 μm) are treated separately (Table 3). The empirical constants a, b in Eq. 1, and c, d in Eq. 2 indicate the relative impacts of large pores and small pores on the strength; A, B, C, and D are fitting constants. The regression results are given in Table 4.
The correlation coefficient and R2 both increase in the new models compared to those original Ryshkevitch’s and Balshin’s models in Figure 8. It is clear that treating different size pores separately is helpful in improving the fitting accuracy. In other words, the pores with different sizes contribute differently to the mechanical property of foam concrete. The second parts of the two models both have very high exponents, which mean that the terms of small pore in the two equations contribute nearly zero to fc. The porosity of large pores correlates with the strength very well, while the effect of small pores is very limited. Considering this fact, Model 3 based on Ryshkevitch’s model is proposed to only treat large pores with critical diameter and the regression equation is shown below:
Model 3: f ecp
c= −62 33 4 307. . (3)
In which Pc refers to the porosity of pores larger than 100 μm. This size is selected from the analysis of pore size distribution over area, as shown in Figure 4, and it was selected by Schober (2011) to allocate the lower limited of air or gas pores (also regarded as macropores) in OPC foam concretes, and also used by Hlaváček et al. (2015) as a critical size for fly ash-based GFC using aluminum powder as foaming agent. The proposed critical pore model has R2 of 0.98 and a correlation coefficient of 0.99. Using the porosity of critical pores can precisely correlate with the strength of GFC. It confirms that for foam concrete, the large pore model gives a satisfying and better fitting than using the whole range of pores or total porosity (Nambiar and Ramamurthy, 2007a).
Modulus of elasticity in compressionThe modulus of elasticity is one of the key mechanical properties of concrete that determine the strain and creep behavior. The relationship between strain and stress over their full range is of vital importance in structural design. Understanding compres-sion elastic modulus of GFCs is an important aspect to develop them for structural or semi-structural applications.
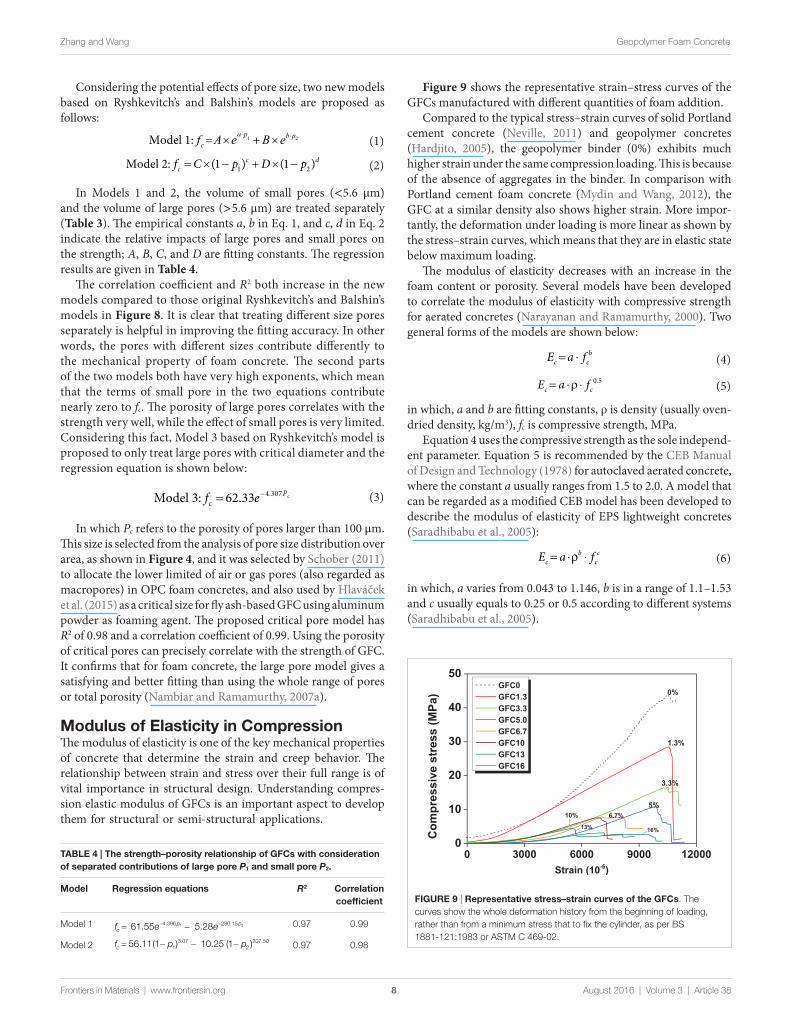
Figure 9 shows the representative strain–stress curves of the GFCs manufactured with different quantities of foam addition.
Compared to the typical stress–strain curves of solid Portland cement concrete (Neville, 2011) and geopolymer concretes (Hardjito, 2005), the geopolymer binder (0%) exhibits much higher strain under the same compression loading. This is because of the absence of aggregates in the binder. In comparison with Portland cement foam concrete (Mydin and Wang, 2012), the GFC at a similar density also shows higher strain. More impor-tantly, the deformation under loading is more linear as shown by the stress–strain curves, which means that they are in elastic state below maximum loading.
The modulus of elasticity decreases with an increase in the foam content or porosity. Several models have been developed to correlate the modulus of elasticity with compressive strength for aerated concretes (Narayanan and Ramamurthy, 2000). Two general forms of the models are shown below:
E a fc cb= ⋅ (4)
E a fc c= ⋅ ⋅ρ 0 5. (5)
in which, a and b are fitting constants, ρ is density (usually oven-dried density, kg/m3), fc is compressive strength, MPa.
Equation 4 uses the compressive strength as the sole independ-ent parameter. Equation 5 is recommended by the CEB Manual of Design and Technology (1978) for autoclaved aerated concrete, where the constant a usually ranges from 1.5 to 2.0. A model that can be regarded as a modified CEB model has been developed to describe the modulus of elasticity of EPS lightweight concretes (Saradhibabu et al., 2005):
E a fcb
cc= ⋅ ⋅ρ (6)
in which, a varies from 0.043 to 1.146, b is in a range of 1.1–1.53 and c usually equals to 0.25 or 0.5 according to different systems (Saradhibabu et al., 2005).
Table 4 | The strength–porosity relationship of gFcs with consideration of separated contributions of large pore P1 and small pore P2.
Model regression equations R2 correlation coefficient
Model 1 f e ecp p. .. .= −− − 61 55 5 284 396 280 151 2 0.97 0.99
Model 2 f p pc . .( ) ( ). .= − − −56 11 1 10 25 113 07
2207 50 0.97 0.98
FigUre 9 | representative stress–strain curves of the gFcs. The curves show the whole deformation history from the beginning of loading, rather than from a minimum stress that to fix the cylinder, as per BS 1881-121:1983 or ASTM C 469-02.
9
Zhang and Wang Geopolymer Foam Concrete
Frontiers in Materials | www.frontiersin.org August 2016 | Volume 3 | Article 38
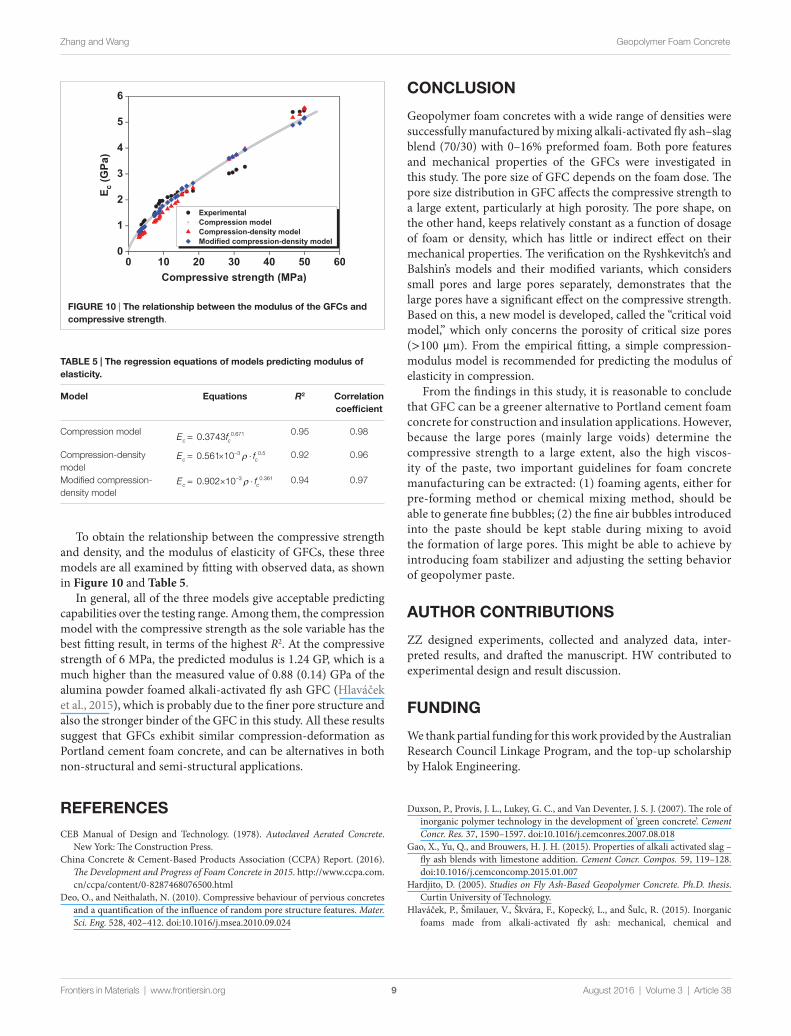
To obtain the relationship between the compressive strength and density, and the modulus of elasticity of GFCs, these three models are all examined by fitting with observed data, as shown in Figure 10 and Table 5.
In general, all of the three models give acceptable predicting capabilities over the testing range. Among them, the compression model with the compressive strength as the sole variable has the best fitting result, in terms of the highest R2. At the compressive strength of 6 MPa, the predicted modulus is 1.24 GP, which is a much higher than the measured value of 0.88 (0.14) GPa of the alumina powder foamed alkali-activated fly ash GFC (Hlaváček et al., 2015), which is probably due to the finer pore structure and also the stronger binder of the GFC in this study. All these results suggest that GFCs exhibit similar compression-deformation as Portland cement foam concrete, and can be alternatives in both non-structural and semi-structural applications.
Table 5 | The regression equations of models predicting modulus of elasticity.
Model equations R2 correlation coefficient
Compression model E fc c. .= 0 3743 0 671 0.95 0.98
Compression-density model
E fc c. .= × ⋅− 0 561 10 3 0 5ρ 0.92 0.96
Modified compression-density model
E fc c. .= × ⋅− 0 902 10 3 0 361ρ 0.94 0.97
FigUre 10 | The relationship between the modulus of the gFcs and compressive strength.
cOnclUsiOn
Geopolymer foam concretes with a wide range of densities were successfully manufactured by mixing alkali-activated fly ash–slag blend (70/30) with 0–16% preformed foam. Both pore features and mechanical properties of the GFCs were investigated in this study. The pore size of GFC depends on the foam dose. The pore size distribution in GFC affects the compressive strength to a large extent, particularly at high porosity. The pore shape, on the other hand, keeps relatively constant as a function of dosage of foam or density, which has little or indirect effect on their mechanical properties. The verification on the Ryshkevitch’s and Balshin’s models and their modified variants, which considers small pores and large pores separately, demonstrates that the large pores have a significant effect on the compressive strength. Based on this, a new model is developed, called the “critical void model,” which only concerns the porosity of critical size pores (>100 μm). From the empirical fitting, a simple compression-modulus model is recommended for predicting the modulus of elasticity in compression.
From the findings in this study, it is reasonable to conclude that GFC can be a greener alternative to Portland cement foam concrete for construction and insulation applications. However, because the large pores (mainly large voids) determine the compressive strength to a large extent, also the high viscos-ity of the paste, two important guidelines for foam concrete manufacturing can be extracted: (1) foaming agents, either for pre-forming method or chemical mixing method, should be able to generate fine bubbles; (2) the fine air bubbles introduced into the paste should be kept stable during mixing to avoid the formation of large pores. This might be able to achieve by introducing foam stabilizer and adjusting the setting behavior of geopolymer paste.
aUThOr cOnTribUTiOns
ZZ designed experiments, collected and analyzed data, inter-preted results, and drafted the manuscript. HW contributed to experimental design and result discussion.
FUnDing
We thank partial funding for this work provided by the Australian Research Council Linkage Program, and the top-up scholarship by Halok Engineering.
reFerences
CEB Manual of Design and Technology. (1978). Autoclaved Aerated Concrete. New York: The Construction Press.
China Concrete & Cement-Based Products Association (CCPA) Report. (2016). The Development and Progress of Foam Concrete in 2015. http://www.ccpa.com.cn/ccpa/content/0-8287468076500.html
Deo, O., and Neithalath, N. (2010). Compressive behaviour of pervious concretes and a quantification of the influence of random pore structure features. Mater. Sci. Eng. 528, 402–412. doi:10.1016/j.msea.2010.09.024
Duxson, P., Provis, J. L., Lukey, G. C., and Van Deventer, J. S. J. (2007). The role of inorganic polymer technology in the development of ‘green concrete’. Cement Concr. Res. 37, 1590–1597. doi:10.1016/j.cemconres.2007.08.018
Gao, X., Yu, Q., and Brouwers, H. J. H. (2015). Properties of alkali activated slag – fly ash blends with limestone addition. Cement Concr. Compos. 59, 119–128. doi:10.1016/j.cemconcomp.2015.01.007
Hardjito, D. (2005). Studies on Fly Ash-Based Geopolymer Concrete. Ph.D. thesis. Curtin University of Technology.
Hlaváček, P., Šmilauer, V., Škvára, F., Kopecký, L., and Šulc, R. (2015). Inorganic foams made from alkali-activated fly ash: mechanical, chemical and
10
Zhang and Wang Geopolymer Foam Concrete
Frontiers in Materials | www.frontiersin.org August 2016 | Volume 3 | Article 38
physical properties. J. Eur. Ceram. Soc. 35, 703–709. doi:10.1016/j.jeurceramsoc. 2014.08.024
Kearsley, E. P., and Wainwright, P. J. (2001). Porosity and permeability of foamed concrete. Cement Concr. Res. 31, 805–812. doi:10.1016/S0008-8846(01)00490-2
Kearsley, E. P., and Wainwright, P. J. (2002). Ash content for optimum strength of foamed concrete. Cement Concr. Res. 32, 241–246. doi:10.1016/S0008-8846(01)00666-4
Lee, N. K., and Lee, H. K. (2013). Setting and mechanical properties of alkali-ac-tivated fly ash/slag concrete manufactured at room temperature. Constr. Build. Mater. 47, 1201–1209. doi:10.1016/j.conbuildmat.2013.05.107
Masi, G., Rickard, W. D. A., Vickers, L., Bignozzi, M. C., and van Riessen, A. (2014). A comparison between different foaming methods for the synthesis of light weight geopolymers. Ceram. Inter. 40, 13891–13902. doi:10.1016/j.ceramint.2014.05.108
Matusinović, T., Šipušić, J., and Vrbos, N. (2003). Porosity-strength relation in cal-cium aluminate cement pastes. Cement Concr. Res. 33, 1801–1806. doi:10.1016/S0008-8846(03)00201-1
McLellan, B. C., Williams, R. P., Lay, J., Van Riessen, A., and Corder, G. D. (2011). Costs and carbon emissions for geopolymer pastes in comparison to ordinary portland cement. J. Clean. Prod. 19, 1080–1090. doi:10.1016/j.jclepro.2011.02.010
Mydin, M. O., and Wang, Y. C. (2012). Mechanical properties of foamed concrete exposed to high temperatures. Constr. Build. Mater 26, 638–654. doi:10.1016/j.conbuildmat.2011.06.067
Nambiar, E. K. K., and Ramamurthy, K. (2007a). Air-void characterisation of foam concrete. Cement Concr. Res. 37, 221–230. doi:10.1016/j.cemconres.2006. 10.009
Nambiar, E. K. K., and Ramamurthy, K. (2007b). Sorption characteristics of foam concrete. Cement Concr. Res. 37, 1341–1347. doi:10.1016/j.cemconres. 2007.05.010
Narayanan, N., and Ramamurthy, K. (2000). Structure and properties of aerated concrete: a review. Cem. Concr. Compos. 22, 321–329. doi:10.1016/S0958-9465(00)00016-0
Neville, A. M. (2011). Properties of concrete, 5th Edn. London, UK: Pearson.Pinson, M. B., Masoero, E., Bonnaud, P. A., Manzano, H., Ji, Q., Yip, S., et al. (2015).
Hysteresis from multiscale porosity: modeling water sorption and shrinkage in cement paste. Phys. Rev. Appl. 3, 1–17. doi:10.1103/PhysRevApplied. 3.064009
Saradhibabu, D., Ganeshbabu, K., and Wee, T. (2005). Properties of lightweight expanded polystyrene aggregate concretes containing fly ash. Cement Concr. Res. 35, 1218–1223. doi:10.1016/j.cemconres.2004.11.015
Schober, G. (2011). “Porosity in autoclaved aerated concrete (AAC): a review on pore structure, types of porosity, measurement methods and effects of porosity on properties,” in 5th International Conference on Autoclaved Aerated Concrete (Bydgoszcz, Poland: Cement-Wapno-Beton), Special Issue: 39–43, 351–359.
Stengel, T., Reger, J., and Heinz, D. (2009). “Life cycle assessment of geopolymer concrete – what is the environmental benefit?’’,” in Concrete Solutions 09: Proceedings of the 24th Biennial Conference of the Concrete Institute of Australia (Sydney).
Sumanasooriya, M. S., and Neithalath, N. (2009). Stereology – and morphology – based pore structure descriptors of enhanced porosity (pervious) concretes. ACI Mater. J. 106, 429–438. doi:10.14359/51663143
Yang, T., Yao, X., Zhang, Z., and Wang, H. (2012). Mechanical property and struc-ture of alkali-activated fly ash and slag blends. J. Sustain. Cement Base Mater 167–178. doi:10.1080/21650373.2012.752621
Zhang, Z., Li, L., He, D., Ma, X., Yan, C., and Wang, H. (2016). Novel self-support-ing zeolitic block with tunable porosity and crystallinity for water treatment. Mater. Lett. 178, 151–154. doi:10.1016/j.matlet.2016.04.214
Zhang, Z., Provis, J. L., Reid, A., and Wang, H. (2014a). Fly ash-based geopolymers: the relationship between composition, pore structure and efflorescence. Cement Concr. Res. 64, 30–41. doi:10.1016/j.cemconres.2014.06.004
Zhang, Z., Provis, J. L., Reid, A., and Wang, H. (2014b). Geopolymer foam con-crete: an emerging material for sustainable construction. Const. Build. Mater. 56, 113–127. doi:10.1016/j.conbuildmat.2014.01.081
Conflict of Interest Statement: The authors declare that the research was con-ducted in the absence of any commercial or financial relationships that could be construed as a potential conflict of interest.
Copyright © 2016 Zhang and Wang. This is an open-access article distributed under the terms of the Creative Commons Attribution License (CC BY). The use, distribu-tion or reproduction in other forums is permitted, provided the original author(s) or licensor are credited and that the original publication in this journal is cited, in accordance with accepted academic practice. No use, distribution or reproduction is permitted which does not comply with these terms.
View publication statsView publication stats


![HempCreate: the art of hemp based Geopolymer extrusion. · The material aspect Extrude [print] buildings Necessary to; understand Geopolymer chemistry discover a suitable Geopolymer](https://img.pdfslide.us/doc/110x75/5f6499b949fcf85d37753e59/hempcreate-the-art-of-hemp-based-geopolymer-the-material-aspect-extrude-print.jpg)