Embed Size (px)
Citation preview
1974World Population Year
THE POPULATIONOF
NEW ZEALA
1974 WORLD POPULATION YEAR
THE POPULATION OFNEW ZEALAND
CICRED Series

PREFACE
This publication is one of a series of monographs prepared bydifferent countries at the suggestion of the United Nations to com-memorate World Population Year. Prepared according to a common plan,each monograph deals with the historical growth and development of thepopulation of the subject country, its present characteristics and socialconditions, and future trends.
This monograph dealing with the population of New Zealand, whichwas prepared by the Demographic Analysis Section of the Department ofStatistics, is based mainly on data already available in various pub-lications of the Department, especially on that derived from the five-yearly Censuses of Population and Dwellings. A bibliography is includedaf the back of the publication. The work was undertaken at the requestof the Committee for International Co-ordination of National Research inDemography (CICRED), which has assumed responsibility for co-ordinating these national monographs on population.
E.A. HARRISGovernment Statistician

CONTENTSPage
CHAPTER I - POPULATION GROWTH
1.1 Introduction .... .... .... .... 71.2 Historical Growth .... .... .... 71.3 Contribution of Natural Increase and Migration of
Population Growth .... .... .... 101.4 Immigration and Emigration .... .... .... 12
CHAPTER II - COMPONENTS OF POPULATION GROWTH
2.1 Introduction .... .... .... .... 152.2 Mortality .... .... .... .... 152.3 Fertility .... .... .... .... 232.4 Migration .... .... .... .... 32
CHAPTER III - POPULATION COMPOSITION
3.1 Introduction .... .... .... .... 413.2 Sex Ratios .... .... .... .... 413.3 Age and Sex Distribution .... .... .... 43•3.4 Marital Status .... .... .... .... 453.5 Households and Families .... .... .... 483.6 Birthplace .... .... .... .... 513.7 Ethnic Origin .... .... .... .... 533.8 Religious Denominations .... .... .... 573.9 Education .... .... .... .... 60
CHAPTER IV - REGIONAL POPULATION GROWTH AND DISTRIBUTION
4.1 Introduction .... .... .... .... 654.2 Trends in Regional Population Distribution and Growth 654.3 Components of Regional Population Growth .... 714.4 Regional Population Density .... .... 734.5 Urban-Rural Population Growth and Distribution .... 754.6 Metropolitan Population Growth .... .... 804.7 Characteristics of Urban-Rural Populations .... 854.8 Regional Distribution of the Labour Force .... 884.9 Regional Distribution of Population by Ethnic Groups 90

CONTENTS -continued
PageCHAPTER V - THE LABOUR FORCE
5.1 introduction .... .... .... .... 995.2 Trends in the Labour Force .... .... .... 995.3 Employment Structure .... .... .... 1035.4 Occupational Status .... .... 1105.5 Regional Distribution of the Labour Force .... 1145.6 Employment Trends .... .... .... 115
CHAPTER VI - POPULATION PROJECTIONS FOR NEW ZEALAND, 1976-2001
6.1 Introduction .... .... .... .... 1216.2 Assumptions Employed in Projections .... .... 1216.3 Projection Results .... .... .... 1236.4 Forecasting Population Growth .... .... 125
APPENDIX
The Collection and Compilation of Population Statistics in NewZealand .... .... .... .... 127
BIBLIOGRAPHY .... .... .... .... 129
MAPS
North I s l a n d - N e w Zealand .... .... .... 132South Island - New Zealand .... .... .... 133

CHAPTER I
POPULATION GROWTH
1.1 INTRODUCTIONThe total population of New Zealand at 31 March 1975 was
estimated to be 3,105,400. This figure is over twenty-five times thepopulation (115,462) recorded at the first Census of Population in1858. The one million population level was reached in 1908. Forty-fouryears later, in 1952, the population had doubled to two million and by1973 (in just over two decades) it had passed the three million mark.Figure 1.1 illustrates the historical growth pattern of the New Zealandpopulation as recorded at successive Censuses from 1858 to 1971. NewZealand comprises two large islands (the North and South Islands)and several small islands. Its total area is 268,675 squarekilometres. At the 1971 census, population density was 10.7 personsper square kilometre compared with 5.2 persons per square kilometreat the 1926 Census. Population densities are higher in the northernand generally warmer regions; the North Island, with 17.9 persons persquare kilometre in 1971, has for many years been more denselypopulated than the South Island (5.3 persons per square kilometre in1971). In New Zealand, distribution of the population is greatlyaffected by the nature of the land and climate. Mountains, lakes andrough hill country cover 75 percent of the country thus restrictingsettlement to about 25 percent of the land area. By world standardsNew Zealand's population is small and its population density is low.Although its current growth is higher than that of many European andNorth American countries, neither the rate of population increase northe overall size of the population have yet imposed any seriousimpediments to economic and social development. However, since1970 there have been signs of increasing pressure on resources arisingfrom an acceleration in growth attributable to a rapid increase in thelevel of net immigration. There have also been problems associatedwith an increasingly uneven pattern of areal population distributionand with differential fertility rates among various ethnic and socio-economic groups in the community.
1.2 HISTORICAL GROWTH
In New Zealand's early colonial years, the bulk of populationincrease was due to immigration of European settlers encouraged bybetter economic prospects, the discovery of gold, a new deal in labourrelations and a vigorous public works policy. It was not until the late

THE POPULATION OF NEW ZEALAND
POPULATION GROWTH
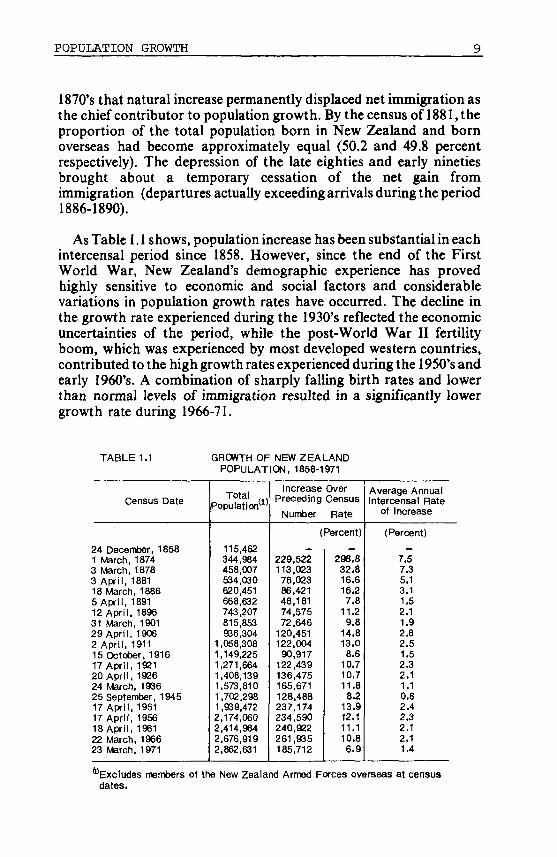
1870's that natural increase permanently displaced net immigration asthe chief contributor to population growth. By the census of 1881, theproportion of the total population born in New Zealand and bornoverseas had become approximately equal (50.2 and 49.8 percentrespectively). The depression of the late eighties and early ninetiesbrought about a temporary cessation of the net gain fromimmigration (departures actually exceeding arrivals during the period1886-1890).
As Table 1.1 shows, population increase has been substantial in eachintercensal period since 1858. However, since the end of the FirstWorld War, New Zealand's demographic experience has provedhighly sensitive to economic and social factors and considerablevariations in population growth rates have occurred. The decline inthe growth rate experienced during the 1930's reflected the economicuncertainties of the period, while the post-World War II fertilityboom, which was experienced by most developed western countries,contributed to the high growth rates experienced during the 1950's andearly 1960's. A combination of sharply falling birth rates and lowerthan normal levels of immigration resulted in a significantly lowergrowth rate during 1966-71.
TABLE 1.1 GROWTH OF NEW ZEALANDPOPULATION, 1858-1971
Census DateTotal
Population1'
Increase OverPreceding Census
Number Rate
Average AnnualIntercensal Rate
of Increase
24 December, 18581 March, 18743 March, 18783 April, 188118 March, 18865 April, 189112 April, 189631 March, 190129 April, 19062 April. 191115 October, 191617 April, 192120 April. 192624 March, 193625 September, 194517 April, 195117 April, 195618 April, 196122 March, 196623 March, 1971
115,462344,984458,007534,030620,451668,632743,207815,853986,304
1,058,3081,149,2251,271,6641.408,1391,573,8101,702,2981,989,4722,174,0602,414,9842,676,9192,862,631
(Percent)
229,522113,02376,02386,42148,18174,57572,646
120,451122,004
90,917122,439136,475165,671128,488237,174234,590240,922261,935185,712
298.832.816.616.27.8
11.29.8
14.813.08.6
10.710.711.88.2
13.912.111.110.86.9
(Percent)
7.57.35.13.11.52.11.92.82.51.52.32.11.10.82.42.32.12.11.4
^Excludes members of the New Zealand Armed Forces overseas at censusdates.
10 THE POPULATION OF NEW ZEALAND
1.3 CONTRIBUTION OF NATURAL INCREASE ANDMIGRATION TO POPULATION GROWTH
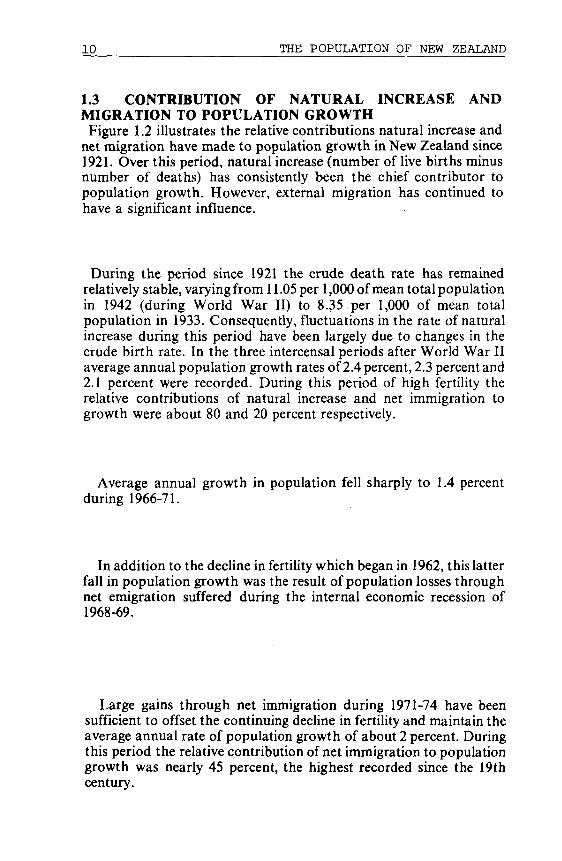
Figure 1.2 illustrates the relative contributions natural increase andnet migration have made to population growth in New Zealand since1921. Over this period, natural increase (number of live births minusnumber of deaths) has consistently been the chief contributor topopulation growth. However, external migration has continued tohave a significant influence.
During the period since 1921 the crude death rate has remainedrelatively stable, varying from 11.05 per 1,000 of mean total populationin 1942 (during World War II) to 8.35 per 1,000 of mean totalpopulation in 1933. Consequently, fluctuations in the rate of naturalincrease during this period have been largely due to changes in thecrude birth rate. In the three intercensal periods after World War IIaverage annual population growth rates of 2.4 percent, 2.3 percent and2.1 percent were recorded. During this period of high fertility therelative contributions of natural increase and net immigration togrowth were about 80 and 20 percent respectively.
Average annual growth in population fell sharply to 1.4 percentduring 1966-71.
In addition to the decline in fertility which began in 1962, this latterfall in population growth was the result of population losses throughnet emigration suffered during the internal economic recession of1968-69.
Large gains through net immigration during 1971-74 have beensufficient to offset the continuing decline in fertility and maintain theaverage annual rate of population growth of about 2 percent. Duringthis period the relative contribution of net immigration to populationgrowth was nearly 45 percent, the highest recorded since the 19thcentury.

POPULATION GROWTH 1 1
FIGURE 1.2 POPULATION INCREASE, NATURAL INCREASE. AND INCREASE DUE TONET MIGRATION OVER SUCCESSIVE FIVE YEAR PERIODS, 1921 . 1971
Number (000)300
27S
250
225
200
175
150
125
100
75
50
• ' • ' " ' • '''<'••'•
•V'-'.Y;',
NET IHM!GRATION
NET EMIGRATION
NATURAL INCREASE
Ï«:V/,''•"''.V
:'-ív!
_ :.yg'•'< ••_
VÖ.
'•ici ;':-ï^'v:
HuBber (000)300
275
250
225
20D
- 175
-i?/.::-:?- 150
-iiVííí-Wíííí- 125
-/.vVi-iv - 100
- 75
.1921-26 1926-31 1931-36 1936-41 1941-46 1946-51 1951-56 1956-61 1961-66 1966-71Five Year Periods
12 THE POPULATION OF NEW ZEALAND
TABLE 1.2 NEW ZEALAND: POPULATION INCREASE,NATURAL INCREASE AND INCREASE DUE TO
NET MIGRATION, 1921-1974
Five YearPeriod
Ended 31December
1926193119361941194619511956196119661 9 7 1 ^1974 (3)
TotalPopulationat end of
Period
1,429.71,522.81.584.61,631.31.781.21,970.52,209.12,461.22,711 a2,899.13,094.7
PopulationIncreaseDuringPeriod
NaturalIncreaseDuringPeriod
(Thousand)
136.893.161.946.7
149.9189.3238.6252.1250.1187.719b.fc>
88.780.470.089.2
112.4157.9175.2204.3198.5192.1107.9
IncreaseDue to NetImmigration
DuringPeriod W
48.112.7,
- 8.2»-42.6»)
37.631.463.447.851.6
- 4.4(2)87.7
Proportion of PopulationIncrease Attributable To:
NaturalIncrease
NetImmigration(1)
(Percent)
64.986.3
113.2191.274.983.473.481.179.4
102.355.2
35.113.7
- 13.2«)-91.2 <2)
25.116.626.618.920.6
- 2.3 <2>44.8
Difference between population increase and natural increase.Decrease due to net emigration.Three year period ended 31 December.
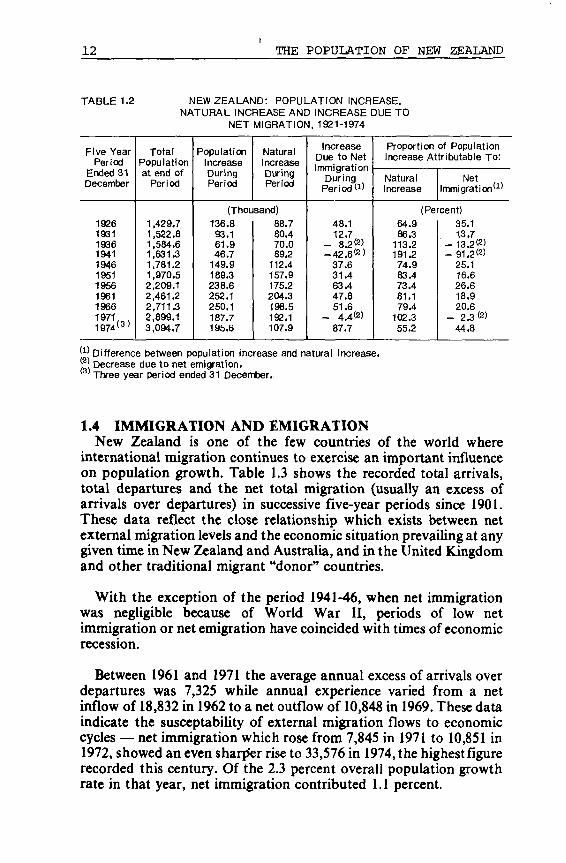
1.4 IMMIGRATION AND EMIGRATIONNew Zealand is one of the few countries of the world where
international migration continues to exercise an important influenceon population growth. Table 1.3 shows the recorded total arrivals,total departures and the net total migration (usually an excess ofarrivals over departures) in successive five-year periods since 1901.These data reflect the close relationship which exists between netexternal migration levels and the economic situation prevailing at anygiven time in New Zealand and Australia, and in the United Kingdomand other traditional migrant "donor" countries.
With the exception of the period 1941-46, when net immigrationwas negligible because of World War II, periods of low netimmigration or net emigration have coincided with times of economicrecession.
Between 1961 and 1971 the average annual excess of arrivals overdepartures was 7,325 while annual experience varied from a netinflow of 18,832 in 1962 to a net outflow of 10,848 in 1969. These dataindicate the susceptability of external migration flows to economiccycles — net immigration which rose from 7,845 in 1971 to 10,851 in1972, showed an even sharper rise to 33,576 in 1974, the highest figurerecorded this century. Of the 2.3 percent overall population growthrate in that year, net immigration contributed 1.1 percent.

POPULATION GROWTH 13
TABLE 1.3 EXTERNAL MIGRATIONARRÍVALS, DEPARTURES AND EXCESS OFARRIVALS OVER DEPARTURES, 1901-1975
Five YearPeriod
Ended 31March
19061911191619211926193119361941194619511956196119661971, , .1975 (2 )
TotalArrivalsDuring
Periodd)
155,468194,568190,445119,156196,150180,898108,128158,30234,498
199,972318,665434,984851,404
1,411,2242,154,417
TotalDepartures
DuringPeriod«»
107,760157,185153,71999,632
150,091162,264120,494144,56430,280
171,595250,406393,259779,437
1,409,9422,055,883
Excess ofArrivals Over
DeparturesDuring Period d>
47,70837,38336,72619,52446,05918,634
-12,3660'13,7384,218
28,37768,25941,72571,967
1,28298,534
(»Figures are exclusive of crews, through passengers,tourists on cruising liners and members of the armedforces.
Four year period ended 31 March.
Excess of Departures over arrivals.

CHAPTER II
COMPONENTS OF
POPULATION GROWTH2.1 \ INTRODUCTION
The growth of any population depends primarily on three processes,also called the dynamics of population growth, viz., fertility, mortalityand migration. This chapter provides a comprehensive analysis of thedifferentials, patterns and trends in the three demographic processes inNew Zealand during the present century. In presenting this analysisthe primary objective was to cover the demographic experience of thetotal New Zealand population. But in some cases, owing either to thelack of historical data on Maori vital events or the defective nature ofthe available official data, the analysis had to be restricted to theEuropean (non-Maori) experience only. It should, however, beemphasised that Maori births and deaths account for only a smallproportion of all births and deaths in New Zealand in any year, andtheir numerical effect on the level and pattern of national fertility andmortality is essentially limited.
2.2 MORTALITYSecular changes in the crude death rate (number of deaths per 1,000
mean population) in New Zealand during the 54-year period 1921-74,are illustrated graphically in Figure 2.1. With the exception of atemporary but significant rise during the 1930's and the early-WorldWar II years, the general trend in the crude death rate was downwardsover the period. The annual changes in rate, especially since the early-1950's, have been generally small and erratic. The crude death rate in1974 was 8.30 per 1,000 mean population compared with 11.05 per1.000 in 1942 or with the initial (1921) level of 9.00 deaths per 1,000mean population.
Secular trends in the crude death rate are, however, affected by thecontemporary changes in the age and sex structure of population. Toallow for these factors, adjusted (or standardised) death rates werecomputed (the 1971 age and sex distribution of total New Zealandpopulation was used as standard for this purpose), for selected yearsand these are compared with the corresponding crude rates in Table2.1 below.

16 THE POPULATION OF NEW ZEALAND
flOURE 2.1 CRUDE DEATH RATES (TOTAL POPULATION)
1921 . 1974
Ratas par 1,000 Mean Population
1921 1925 1930 1935 1940 1945 1950
Calendar Tear1 9 5 5 I 9 6 0 1965 1970 1974

COMPONENTS OF POPULATION GROWTH 17
TABLE 2.1 CRUDE AND STANDARDISED (l)DEATH RATES FOR TOTAL
NEW ZEALAND POPULATION, 1941-1971
Year
19411951196119661971
Standardised Death Rate (a '
Males
11.189.599.169.729.39
Females
11.269.268.258.037.61
Total Population
11.229.428.708.888.50
Crude DeathRatee>: TotalPopulation
10.459.678.988.868.49
(1)Per 1,000 mean population.ß'Rates were adjusted by the "Di rect " method of standardisation
using the 1971 age and sex distribution of total New Zealandpopulation.
This comparison shows that the crude series understated the "real"level of, and the amount of decline in, mortality during the 1940's.Also, it masked the small but demographically, socially and medicallyimportant rise in mortality between 1961 and 1966. This rise, it shouldbe noted, was due mainly to a rise in male mortality and led to thefurther widening of the male-female differential. In 1971, the femalestandardised death rate was 7.61 per 1,000 and the male standardisedrate was 9.39 per 1,000 — a difference of 19 percent compared with adifference of only 3 percent in 1951.
2.2.1 Expectation of Life at BirthThe historical series on life expectancy at birth, presented in Table
2.2 confirm these broad mortality trends and differentials.
TABLE 2.2
Psriodof
LifeTable
1880-921891-951896-19001901-051906-101911-151921-221925-2719311934-381950-521955-571960-621965-671970-72
EXPECTATION OF
Non-Maori
Males
54.4455.2957.3758.0959.1760.9662.7663.9965.0465-4668.2968.8869.1768.6769.09
_IFE>\T BIRTH , 1880-1972
Expectation of Life a
Population
Females
57.2658.0959.9560.5561.7663.4865.4366.5767.8868.4572.4373.8874.5174.8475.16
Maori Population
Males
„..,.,,,,
tt,,
,54.0557.2359.0561.4460.96
Females
* »•„t,,t
tt
11
,,,,
55.8858.6861.3764.7864.96
t Birth:
Sex Differentials:(Females - Males)
Non-Maori
2.822.802.582.462.592.522.672.582.842.994.145.005.346.176.07
Maori
1.E1.12 . :
¡352
3.344.00
18 THE POPULATION OF NEW ZEALAND
The long term trend since the last centrury has been generally that ofa continuous but slowing improvement in longevity for both sexes.The only notable interruption in this trend was the small decrease inmale life expectancy experienced between 1960-62 and 1965-67, whichwas due to the higher male mortality resulting from a higher incidenceof organic diseases (mainly heart diseases and cancer) and accidents.
Between 1880-92 and 1970-72, the average non-Maori male lifeexpectancy rose by 14.65 years from 54.44 years to 69.09 years, and theaverage non-Maori female life expectancy rose by 17 90 years from57.26 years to 75.16 years. The gains in the last two decades have beenessentially small: approximately one year for males and three years forfemales. Table 2.2 shows that the female advantage in average lifeexpectancy increased from 2.52 years in 1911-15 to 4.14 years in 1950-52 and further to 6.07 years in 1970-72.
2.2.2 Trends in Mortality by AgeTable 2.3 summarises the levels and trends in death rates by age and
sex since the beginning of the twentieth century. With few exceptions,there were significant improvements in mortality at all ages. Innumerical terms the largest improvement took place in the risk ofdeath in the first year of life: the infant mortality rate decreased from71.40 deaths per 1,000 live births in 1901 to only 16.06 per 1,000 in1973: the provisional figure for 1974 is only 15.54 per 1,000.
At the turn of the century, deaths in the first year of life accountedfor almost 20 percent of the deaths at all ages: in 1974 thecorresponding proportion was only 3.6 percent. Advances in medicalknowledge and practice, improvement in ante-natal and post-natalcare, the introduction of various public health measures, theexpansion of health services, and the improvement in social andeconomic conditions and general standard of living contributedmeasurably to this end.
Beyond the first year of life, the relative improvement in death ratesduring the period (1901-74) has been successively smaller with theincrease in age, ranging from 87 percent for pre-school children (1-4years) to 18 percent for the oldest group (75 years and over).Moreover, with one exception, age by age, the improvement inmortality was substantially higher for females than for males. This isreflected in the widening of the male-female differentials in mortality.
In 1973, male death rates at various ages exceeded the female ratesby 22-198 percent, with the largest difference being for ages 15-24years, where accidents constitute the most common cause of death.

COMPONENTS OF POPULATION GROWTH 19
TABLE 2¿3
Year
1901 <2>1911 I2 '1921(2'1931 O)1941195119611971197219731974
1901 <2)1911 i2 '1921 (2)1931 <2)1941195119611971197219731974
1901 (2)1911 (2>1921 <2)1931 (2)1941195119611971197219731974
MORTALITYBY AGE AND SEX
RATES (TOTAL POPULATIONFOR SELECTED YEARS, 1901-1973
Age Group
Under 1Ü) 1-4
(Rates per
78.6063.4853.1038.2143.6531.6925.8617.9117.6619.0018.26
6.815.364.782.834.391.871.341.071.001.060.86
63.8748.7442.3125.6737.7523.0919.5015.1013.8313.3012.66
5.505.374.492.473.841.591.160.820.950.870.80
71.4056.3147.8232.1539.8127.5422.7616.5415.7916.2215.54
6.175.364.642.654.121.731.250.950.980.960.83
5-14
,000 0
1.891.911.851.351.360.750.490.460.340.500.48
1.641.481.310.971.200.540.350.280.360.260.33
1.771.701.581.171.280.650.420.370.350.380.41
(1)Per 1,000 live births in this case.(a Non-Maori figures only as
15-24 25-34 35-44 45-54 55-64
f mean population in each age group)Males
3.522.422.442.282.531.821.281.441.641.821.60
3.973.873.562.772.931.951.471.331.321.361.47
6.166.275.554.643.953.152.682.892.502.712.62
Females3.582.762.341.851.940.890.530.560.620.610.61
4.724.343.383.202.441.300.870.910.740.770.70
6.704.924.463.813.502.271.951.871.871.842.07
Both Sexes3.552.582.392.072.221.360.911.011.141.231.11
\daon deaths at
4.334.093.472.982.671.631.181.121.031.071.09
6.405.645.104.223.722.712.312.392.192.282.35
11.9411.029.618.699.207.577.397.347.257.537.37
10.628.388.006.846.905.674.594.714.444.384.78
11.379.828.857.808.026.676.006.025.855.976.10
23.1220.8319.9618.2521.1320.4619.6520.6920.1020.5919.89
19.4417.8914.8815.3615.0413.8511.2210.3710.7110.5610.85
21.6319.5517.5916.8818.1617.0315.4115.4315.2915.4315.72
65-74
50.5953.2246.1744.1847.4447.5247.3348.3946.8949.1747.02
43.3240.4436.8136.8338.6032.8029.8925.4727.7326.5526.36
47.8747.7441.9040.5643.0439.9337.6735.9436.5036.9235.84
ages not available for these years.
75 andOver
141.67130.58128.60130.57140.27121.66126.31137.67136.14134.87134.05
127.98119.60120.23122.87118.92109.79104.74100.05104.43102.2599.20
135.71126.13124.84126.87129.15115.26114.01113.96116.08114.18111.91

20 THE POPULATION OF NEW ZEALAND
Recent developments in mortality trends have been far fromencouraging. For many years until the end of World War II, NewZealand boasted of the lowest infant mortality in the world. Sincethen, however, it has lagged behind some other countries. There hasalso been a significant deceleration in the decline in mortality atyounger ages. At ages 45 years and over, death rates have eitherlevelled off or started to rise.
2.2.3 Maori — Non-Maori Differentials in MortalityMortality statistics in New Zealand have for many years pointed
to the sharp differences between Maori and non-Maori mortalityexperiences. Crude death rates for Maoris are significantly lower thanfor non-Maoris (Table 2.4). However, this, as has been often pointedout, is due to the more youthful age structure of the Maori population.The death rates adjusted for the differences in age structures indicatethat the true risk of death for Maoris is at least 70 percent higher (onthe basis of 1970-72 experience) than for their non-Maoricounterparts.
TABLE 2.4 CRUDE AND AGE-STANDARDISED(1) DEATHRATES(2): (MAORI AND NON-MAORI POPULATIONS), 1961-1974
CalendarYear
19611962196319641965196619671968196919701971197219731974
Crude Death Rate
MaoriPopulation
8.37.06.66.26.26.45.96.26.16.36.25.75.75,2
Non-MaoriPopulation
9.09.09.09.08.99.18.69.18.99.08.78.78.78.6
Age-Standardised (1)
Death
MaoriPopulation
15.814.814.914.714.715.613.515.815.715.715.214.4
...
...
Rate
Non-MaoriPopulation
8.78.78.78.88.78.98.58.98.78.98.48.5
...
'The "Di rect " method of standardisation was used, the standardpopulation being the age-specific population as enumerated atthe 1971 Census.
( 2 )Per 1,000 mean population.
Source: Department of Health
Table 2.2 shows that between 1950-52 and 1970-72, the average lifeexpectancy for Maori males rose by about 6.91 years from 54.05 yearsto 60.96 years, and that for Maori females by 9.06 years from 55.88years to 64.96 years. These gains, it should be noted, were considerably
COMPONENTS OF POPULATION GROWTH 21
larger than those recorded for non-Maoris, and as a result there wassome narrowing of the Maori-non Maori differences in longevity overthe years. Nevertheless, in 1970-72, a non-Maori male baby couldexpect to live about 8 years longer than a Maori male baby and a non-Maori female baby female baby about 10 years longer than a Maorifemale baby. With expected improvement in Maori standards of livingand increased access to medical and hospital services, Maori lifeexpectancy at birth may improve significantly in the future.
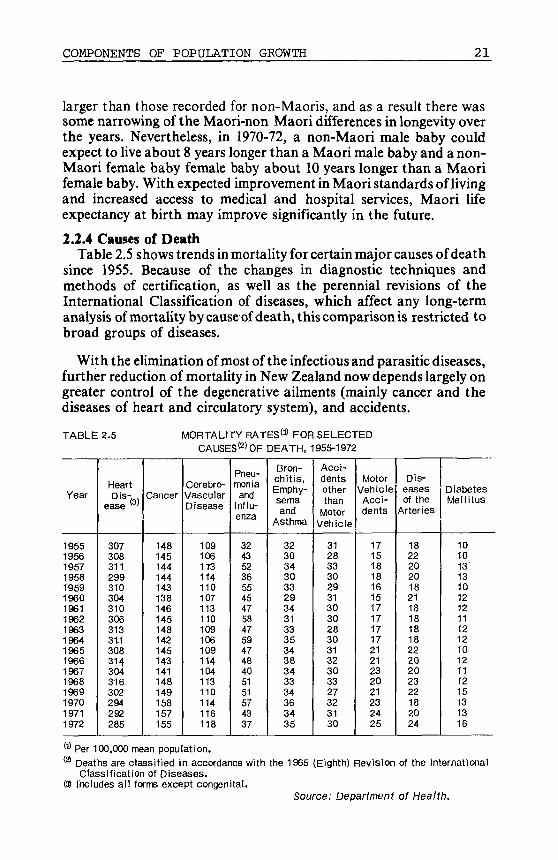
2.2.4 Causes of DeathTable 2.5 shows trends in mortality for certain major causes of death
since 1955. Because of the changes in diagnostic techniques andmethods of certification, as well as the perennial revisions of theInternational Classification of diseases, which affect any long-termanalysis ofmortality by cause of death, this comparison is restricted tobroad groups of diseases.
With the elimination of most of the infectious and parasitic diseases,further reduction of mortality in New Zealand now depends largely ongreater control of the degenerative ailments (mainly cancer and thediseases of heart and circulatory system), and accidents.
TABLE
Year
195519561957195819591960196119621963196419651966196719681969197019711972
2.5
HeartDis- ( )
ease w
30730831129931030431030631331.1308314304316302294292285
Cancer
148145144144143138146145148142145143141148149158157155
MORTALITY RATES0 FOR SELECTEDCAUSES(2)OF
Cerebro-VasoularDisease
1091061T3114110107113110109106109114104113110114116118
Pneu-moniaand
Influ-6nza
324352365545475847594748405151574337
DEATH, 1955-1972
Bron-chitis,Emphy-semaand
Asthma
323034303329343133353438343334363435
Acci-dentsotherthan
MotorVehicle
312833302931303028303132303327323130
MotorVehicleAcci-dents
171518181615171717172121232021232425
Dis-easesof the
Arteries
182220201821181818182220202322182024
DiabetesMel I ¡tus
101013131012121112121012111215131316
(1) Per 100,000 mean popu la t ion .(2) Deaths are c lass i f ied In accordance w i th the 1965 (Eighth) Rev is ion of the Internat ional
Classification of Diseases.(o) Includes all forms except congenital.
Source: Department of Health.

22 THE POPULATION OF NEW ZEALAND
Diseases of the heart are the leading cause of death in New Zealandand in 1972 accounted for almost one-third of all deaths. Heart diseaseis predominantly a cause of death at the older ages (65 years and over)among both males and females, but is also a leading killer among malesin the late-working ages (45-64 years). Between 1968 and 1972 therewas a small (10 percent) improvement in the mortality rate for heartdisease, from 316 to 285 per 100,000 mean population, which was dueto an improvement in the mortality rates for rheumatic, hypertensive,valvular and symptomatic forms of the disease.
All forms of malignant neoplasm (cancer) are the second majorcause of death, and in 1972 accounted for 18 percent of all deathscompared with 16 percent in 1955. Cancer is a major cause of deathboth at middle and old ages. Mortality due to cancer is higher amongmales than among females at all ages except the age group 25-44 years,where females have a higher cancer death rate because of a highincidence of breast and genito-urinary cancer.
Another 14 percent of all deaths are attributed to cerebrovasculardisease, including conditions such as subarachnoid haemorrhage,embolism and thrombosis of the cerebral arteries, stroke, apoplexyand ischaemic cerebrovascular disease.
Influenza and pneumonia are the fourth most frequent cause ofdeath, followed closely by a residual group of the diseases of therespiratory tract; bronchitis, emphysema and asthma. During 1970-72, 5 percent and 4 percent respectively of all deaths were due to thesetwo groups.
Deaths due to accidents other than motor vehicle rank sixth andthose due to motor vehicle accidents rank seventh among the causes ofdeath. In 1972, the mortality rate from motor vehicle accidents was 25per 100,000 mean population compared with 17 per 100,000 meanpopulation in 1955.
Other significant causes of death are diseases of the arteries,diabetes mellitus and congenital anomalies in that order.

COMPONENTS OF POPULATION GROWTH 23
2.3 FERTILITYIn examining the historical changes in fertility in New Zealand, we
have to rely heavily on non-Maori data. Until 1913, there were noregistration data on Maori births available, and the data on ages,collected at the quinquennial censuses, which could afford someindirect estimates on the Maori fertility level, suffered from asubstantial under-enumeration of children. The compulsoryregistration of Maori births was introduced in 1913, but until paymentof family benefit, subject to birth registration became universal in 1946reporting was considered incomplete. The official estimates of theMaori birth rate during this period are not consistent with the fertilitylevels suggested by the intercensal growth of Maori population.
The transition in non-Maori fertility from "large" to "small" familiesprobably began during the 1870's. By 1913, when information on ageof mother, facilitating the computation of more refined fertilitymeasures, was first obtained on birth certificates, the crude birth rate(number of births per 1,000 mean population) had dropped from over40 per 1,000 to about 25 per 1,000. Corresponding changes in thegeneral fertility rate (number of births per 1,000 women aged 15-49years), suggest that fertility actually fell by about one-half during thisperiod.
Changes in the crude birth rate understated the "real" decline infertility, because of the favourable changes in the relative size and agestructure of females in reproductive ages. Between 1874 and 1911, thegeneral fertility rate, adjusted for these changes by the indirect methodof standardisation, decreased by about 53 percent from 208.7 per 1,000in 1874 to 99.0 per 1,000 in 1911.
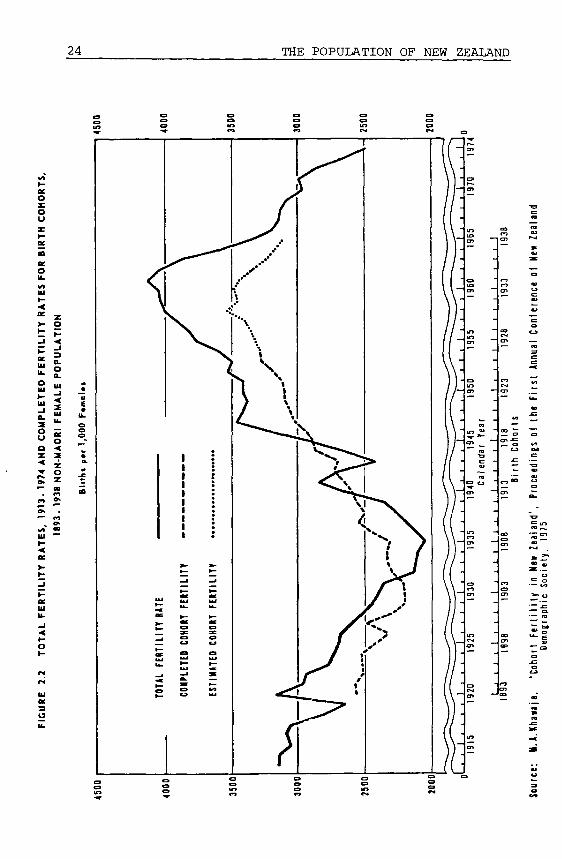
Major trends in the total fertility rate (sum of age-specific fertilityrates) since 1913 are illustrated in Figure 2.2. The total fertility rategives the average number of births a group of women would have ifthey were subject to a given set of age-specific fertility rates throughouttheir reproductive span and none of them died during this period. In1913, the total fertility rate was 3,166 births per 1,000 women.Flolowing a brief but sharp rise at the end of World War I, the ratedropped steadily to 2,601 per 1,000 in 1927, then fell below"replacement level" during the economic depression, finally reachingits nadir (2,046 per 1,000) in 1935.
In common with many developed nations, New Zealandexperienced a "baby boom" after World War II. The total fertility rateincreased by about 72 percent from 2,408 in 1943 to 3,409 in 1950, andfurther to a new peak of 4,140 births per 1,000 in 1961. This peak ratewas over twice the lowest "depression-time" rate and was also thehighest post-war peak fertility rate among the countries of thedeveloped world.
24 THE POPULATION OF NEW ZEALAND
ou
acou.
•<
" zy- o- i •<n".Sou o .-
5 1 Io» •
„ o«
111 - "I -
o
ÏJ1 ta
in ^,

COMPONENTS OF POPULATION GROWTH 25
Since 1962, the total fertility rate has dropped by nearly 37 percent,to 2,584 births per 1,000 in 1974, and at its present rate of decline maydrop to, or even below, "replacement level" by 1980. Both in absoluteand relative terms the recent decline in New Zealand's fertility has beengreater than in any equivalent time interval during the present century.
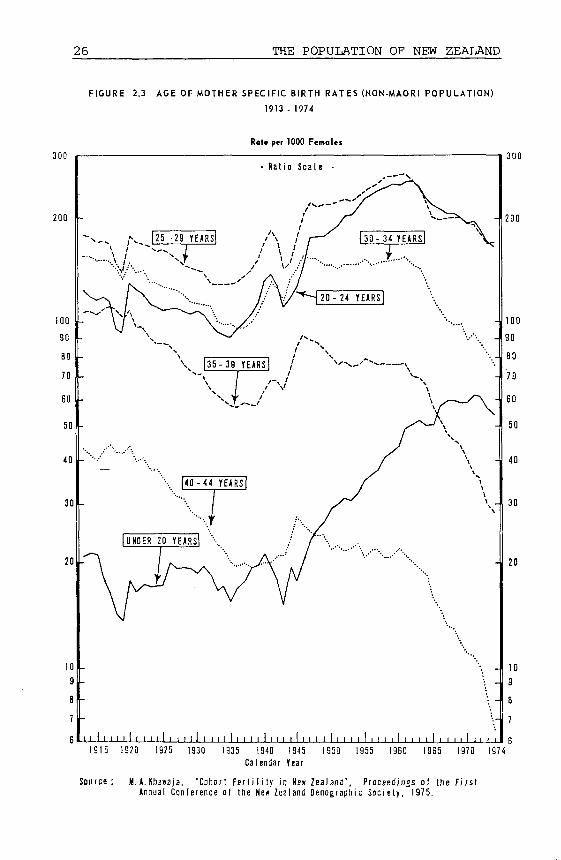
2.3.1 Trends in Fertility by Age of MotherTrends in non-Maori fertility rates (age-of-mother-specific) during
1913-74 are shown in Figure 2.3. Fertility rates for all maternal agesdecreased significantly during the first broad phase, 1913-35. Inrelative terms, the decline was successively larger with age: whereas thefertility rates for women below age 25 fell by 25 percent, those forwomen aged 40 years and over fell by more than 50 percent.
The recovery in fertility rates after the lows of the mid-1930's wasalso slower at maternal ages 30 and over, and only partial. Conversely,the fertility rates for younger women (below 30) recovered to theirrespective 1913 levels, by t he early-1940's, and there were further largeincreases during the post-war years, resulting in a "baby boom".During this time, the number of births almost doubled from 32,949 in1939 to 65,476 in 1961.
Between 1943 and 1961, the fertility rate for teenage non-Maoriwomen more than tripled (from 15.3 to 49.2 per 1,000), that for womenaged 20-24, more than doubled (from 111.5 to 255.8 per 1,000), andthat for women 25-29, increased by 74 percent (from 152.8 to 267.1 per1,000). These increases were probably due partly to marriages andbirths postponed during the war years and partly to a growing trendtoward earlier marriage and child-bearing. This caused a remarkableshift in the age distribution of fertility: the proportion of total birthsattributable to women below 25 years, and below 30 years, climbedfrom 26.4 percent and 58.1 percent, respectively, in 1943, to 36.8percent and 69.1 percent, respectively, in 1961. The average age atchildbearing dropped from 29.3 years to 27.7 years over the sameperiod.
Since 1962, the fertility rates for all non-Maori women, exceptteenagers, have recorded large decreases, ranging from 33 percent forwomen aged 20-24 years to 73 percent for the oldest women (aged 45-49 years). In 1974, women in only two maternal age groups — below 20and 20-24 years — were reproducing above the levels recorded in 1913.The average age at childbearing had dropped further to 26.3 years, andmore than three-quarters of all births were concentrated in thematernal ages below 30.
26 THE POPULATION OF NEW ZEALAND
FIGURE 2.3 AGE OF MOTHER SPECIFIC BIRTH RATES (NON-MAORI POPULATION)
1913 . 1974
Rot* per 1000 Females
300
200
100
90
B0
70
60
50
40
30
20
- Ratio Scale -
,\._ 125 -29 YEARS!
I 1 l I I I I l I I I I l I I 1 1 l I I I I l I I I I l I I I I l I I I I lI I I I I I I I I I I I I I I I I I I I I I I I
300
200
40
30
20
10
9
1915 1920 1925 1930 1935 1940 1945 1900 1955 1960 1965 1970 1974Calendar Year
Source: M.i.Khanaja, 'Cahort Fertility in Hew Zealand', Proceedings of the Fi rstAnnual Conference of the Ne» Zealand Demographic Society, 1975.
COMPONENTS OF POPULATION GROWTH 27
2.3.2 Period and Cohort FertilityHow far these lows and peaks in fertility reflected the real changes in
non-Maori average family size, may be examined in Figure 2.2., whichalso compares these trends with those in the completed fertility of thebirth cohorts of non-Maori women. The latter are independent of thedirect influence of the shifts in the timing of births. (A birth cohortconsists of girl babies born during a 12-month period). Figure 2.2clearly suggests that period rates (total fertility rates) exaggerated thereal movements in average family size over the years under analysis.
For example, unlike the period rates noted above, none of the birthcohorts, actually recorded a completed family size below the"replacement" level. Also, whereas a total fertility rate of over 3.5children per woman was recorded in at least 13 years (from 1952 to1964), only one cohort of women (those born in 1931) is expected toattain that figure.
2.3.3 Marriage and FertilityIn recent years, in New Zealand, ex-nuptial births have formed an
increasing larger proportion of all births. However, a majority ofchildren (84 percent in 1974) are born within wedlock and therefore,changes in marriage patterns and in the fertility of marriages play apredominant role in determining the level and pattern in fertility.
The 1960's were marked by a steady rise in the crude marriage rate(number of marriages per 1,000 mean population) — from 7.88 per1,000 in 1962 to the unusually high level of 9.50 per 1,000 in 1971. Therise was due partly to a significant rise in the marriageable population(a direct consequence of the post-war "baby boom") and partly to areal increase in the incidence of marriage. There was also acontinuation of the post-war trend toward earlier marriages. Themedian age at first marriage for women dropped from 22.54 years in1962 to 21.19 years in 1971. The proportion of women married in theprimary reproductive age-group (20-24 years) increased from 58.6percent at the 1961 Census of Population to 62.4 percent at the 1971Census of Population. (Variations in the proportions of womenmarried at younger ages affect fertility by increasing or decreasing theprobability of any woman bearing a child in any year.)
Paradoxically, as Table 2.6 below indicates, there have been largedecreases in the nuptial fertility rates for women of all ages, includingteenagers, during the past decade. This indicates that the rise inteenage fertility between 1961 and 1971, noted above, was caused byincreases in extra-marital fertility.

28 THE POPULATION OF NEW ZEALAND
TABLE 2.6 AGE-OF-MOTHER-SPECIFICNUPTIAL BIRTH RATES FOR SELECTED
PERIODS, 1962-1973
MaternalAge Group
(Years)
Period
1962-64 1965-67 1968-70 1971-73
16-1920-2425-2930-3435-3940-4445-49
0.555060.389270.272580.153730.076250.024060.00176
Birth Rate0.457230.337460.236230.119880.058980.018630.00158
0.432420.325800.227690.109350.048890.014450.00108
0.404600.286320.207490.096650.038780.011070.00088
16-1920-2425-2930-3435-3940-4445-49
Birth Rate Index100.0100.0100.0100.0100.010O.0100.0
82.486.786.778.077.477.489.8
(1)
77.983.783.571.164.160.161.4
72.973.676.162.950.946.050.0
'Base: 1962-64 =100.0
In absolute terms, the greatest reductions took place in the fertilityof women aged below 30 years, who contribute almost four-fifths of allnuptial births in any year. Between 1962-64 and 1971-73 nuptial birthrates for the 16-19, 20-24 and 25-29 age group fell by 150, 103 and 65births per 1,000 mean total population "exposed to risk", respectively.
However, it was among the older maternal age groups (35-49 years),which account for only about 6 percent of all nuptial births, that thelargest relative falls in fertility were recorded; birth rates for thesegroups being halved during 1962-73.
Two factors probably contributed to the occurrence of thisphenomenon. Firstly, there is the increasing tendency towardsformation of smaller families, and as high parity births generally occurto married women in the older maternal age group, the considerablerate of decline in nuptial birth rates for these age groups is consistentwith this trend. Secondly, but of less significance in terms of totalnuptial fertility, there is the general tendency towards childbearingearlier in a woman's reproductive life. In a large number of cases,couples now leave little family formation to take place in the olderreproductive ages.
COMPONENTS OF POPULATION GROWTH 29
The introduction of the oral contraceptive pill in the early 196O'sprovided an effective means for regulating fertility and for preventingunwanted pregnancies and must be considered as a contributing factor.However, the role of the pill should not be over-emphasised. Fertilitydeclined significantly during the great depression of the 1930'salthough no contraceptive as reliable as the pill was available duringthat period. It may therefore, be more appropriate to attribute therecent general decline in New Zealand nuptial fertility to social andeconomic factors. Contraception is only a "means to an end" in thedemographic context and changing social attitudes to marriage,employment of women, and family formation, together with anincreasing awareness of the economic and other advantages to begained from limiting family size, may well be the main underlyingfactors.
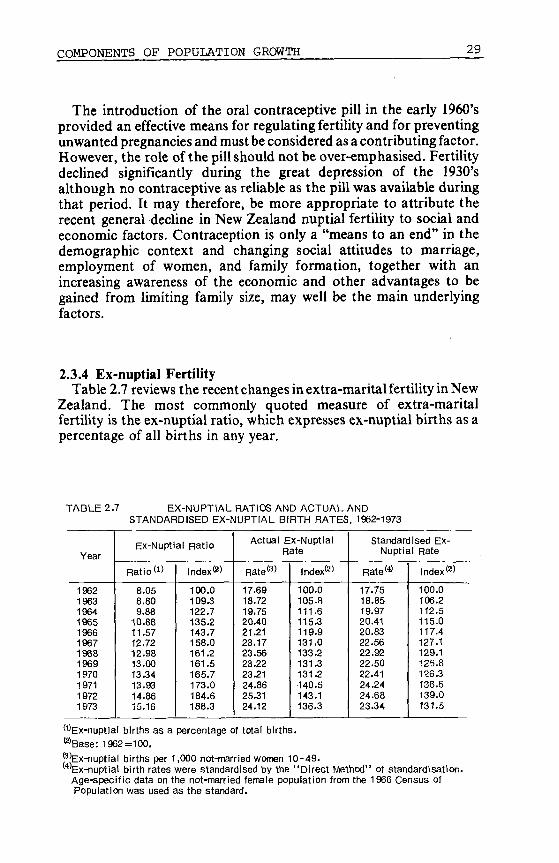
2.3.4 Ex-nuptial FertilityTable 2.7 reviews the recent changes in extra-marital fertility in New
Zealand. The most commonly quoted measure of extra-maritalfertility is the ex-nuptial ratio, which expresses ex-nuptial births as apercentage of all births in any year.
TABLE 2.7 EX-NUPTIAL RATIOS AND ACTUAL ANDSTANDARDISED EX-NUPTIAL BIRTH RATES, 1962-1973
Year
196219631964196519661967196819691970197119721973
Ex-Nuptial Ratio
Ratio (1)
8.058.809.88
10.8811.5712.7212.9813.0013.3413.9314.8615.16
Index«
100.0109.3122.7135.2143.7158.0161.2161.5165.7173.0184.6188.3
Actual Ex-NuptialRate
Rate(3)
17.6918.7219.7520.4021.2123.1723.5623.2223.2124.8625.3124.12
Index«2)
100.0105,8111.6115.3119.9131.0133.2131.3131.2140.5143.1136.3
Standardised Ex-Nuptial Rate
Rate(4
17.7518.8519.9720.4120.8322.5622.9222.5022.4124.2424.6823.34
Index«'
100.0106.2112.5115.0117.4127.1129.1125.8126.3136.6139.0131.5
^Ex-nuptial births as a percentage of total births.
^Base: 1962=100.
*"Ex-nuptial births per 1,000 not-married women 10-49.(4)Ex-nuptial birth rates were standardised by the "Direct Method" of standardisation.
Age-specific data on the not-married female population from the 1966 Census ofPopulation was used as the standard.
30 THE POPULATION OF NEW ZEALAND
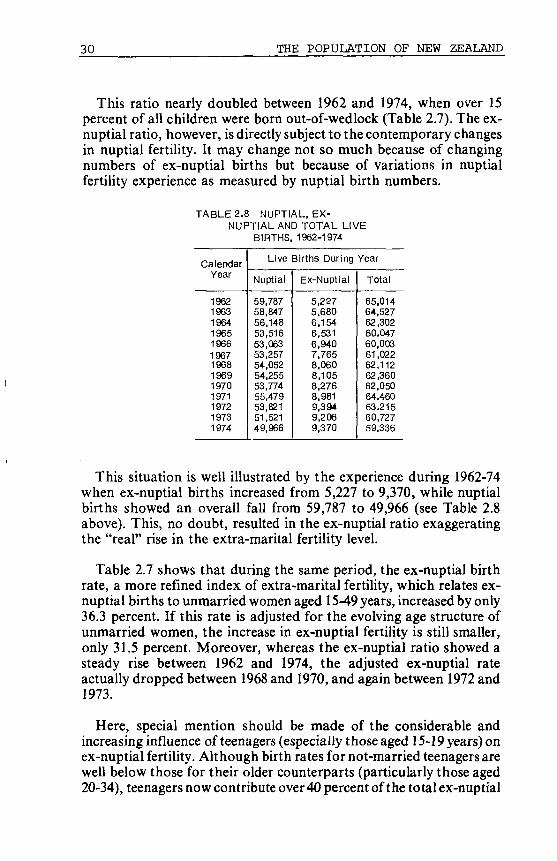
This ratio nearly doubled between 1962 and 1974, when over 15percent of all children were born out-of-wedlock (Table 2.7). The ex-nuptial ratio, however, is directly subject to the contemporary changesin nuptial fertility. It may change not so much because of changingnumbers of ex-nuptial births but because of variations in nuptialfertility experience as measured by nuptial birth numbers.
TABLE 2.8 NUPTIAL, EX-NUPTIAL AND TOTAL LIVE
BIRTHS, 1962-1974
CalendarYear
1962196319641965196619671968196919701971197219731974
Live
Nuptial
59,78758,84756,14853,51653,06353,25754,05254,25553,77455,47953,82151,52149,966
3irths During
Ex-Nuptial
5,2275,6806,1546,5316,9407,7658,0608,1058.2768,9819,3949,2069,370
Year
Total
65,01464,52762,30260.04760,00361,02262,11262,36062,05064.46063.21560,72759,336
This situation is well illustrated by the experience during 1962-74when ex-nuptial births increased from 5,227 to 9,370, while nuptialbirths showed an overall fall from 59,787 to 49,966 (see Table 2.8above). This, no doubt, resulted in the ex-nuptial ratio exaggeratingthe "real" rise in the extra-marital fertility level.
Table 2.7 shows that during the same period, the ex-nuptial birthrate, a more refined index of extra-marital fertility, which relates ex-nuptial births to unmarried women aged 15-49 years, increased by only36.3 percent. If this rate is adjusted for the evolving age structure ofunmarried women, the increase in ex-nuptial fertility is still smaller,only 31.5 percent. Moreover, whereas the ex-nuptial ratio showed asteady rise between 1962 and 1974, the adjusted ex-nuptial rateactually dropped between 1968 and 1970, and again between 1972 and1973.
Here, special mention should be made of the considerable andincreasing influence of teenagers (especially those aged 15-19 years) onex-nuptial fertility. Although birth rates for not-married teenagers arewell below those for their older counterparts (particularly those aged20-34), teenagers now contribute over 40 percent of the total ex-nuptial
COMPONENTS OF POPULATION GROWTH 31
births in any year. This is due primarily to the large number of women"exposed-to-risk" in this group, about nine-tenths of all women aged15-19 at the 1971 Census of Population being in the "not-married"category. Thus, almost half of the total increase of about 4,000 in ex-nuptial births during 1962-73 can be attributed to not-married teenagewomen.
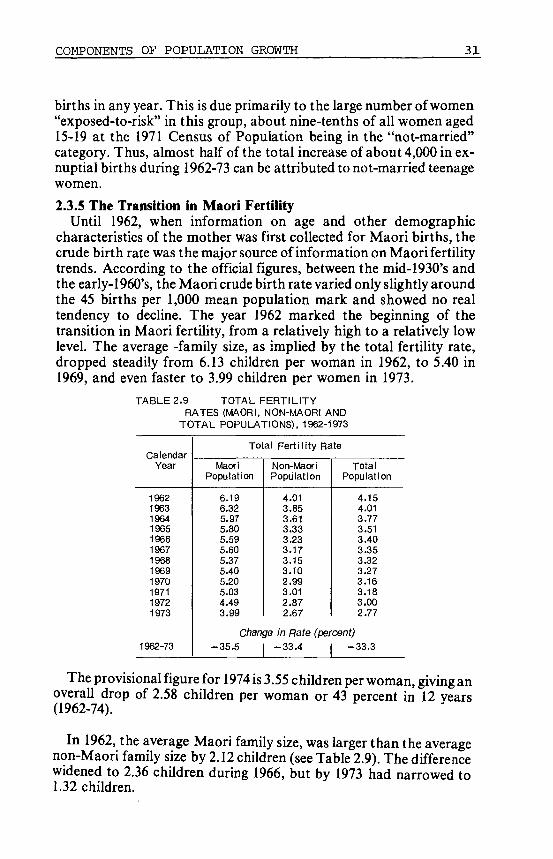
2.3.5 The Transition in Maori FertilityUntil 1962, when information on age and other demographic
characteristics of the mother was first collected for Maori births, thecrude birth rate was the major source of information on Maori fertilitytrends. According to the official figures, between the mid-1930's andthe early-1960's, the Maori crude birth rate varied only slightly aroundthe 45 births per 1,000 mean population mark and showed no realtendency to decline. The year 1962 marked the beginning of thetransition in Maori fertility, from a relatively high to a relatively lowlevel. The average -family size, as implied by the total fertility rate,dropped steadily from 6.13 children per woman in 1962, to 5.40 in1969, and even faster to 3.99 children per women in 1973.
TABLE 2.9 TOTAL FERTILITYRATES (MAORI, NON-MAORI AND
TOTAL POPULATIONS), 1962-1973
CalendarYear
19621963196419651966196719681969197Ü197119721973
1962-73
Total Fert i l i ty Rate
MaoriPopulation
6.196.325.975.805.595.605.375.405.205.034.493.99
Non-MaoriPopulation
4.013.853.613.333.233.173.153.102.993.012.872.67
TotalPopulation
4.154.013.773.513.403.353.323.273.163.183.002.77
Change in Rate (percent)
-35.5 -33.4 -33.3
The provisional figure for 1974 is 3.55 children per woman, giving anoverall drop of 2.58 children per woman or 43 percent in 12 years(1962-74).
In 1962, the average Maori family size, was larger than the averagenon-Maori family size by 2.12 children (see Table 2.9). The differencewidened to 2.36 children during 1966, but by 1973 had narrowed to1.32 children.
32 THE POPULATION OF NEW ZEALAND
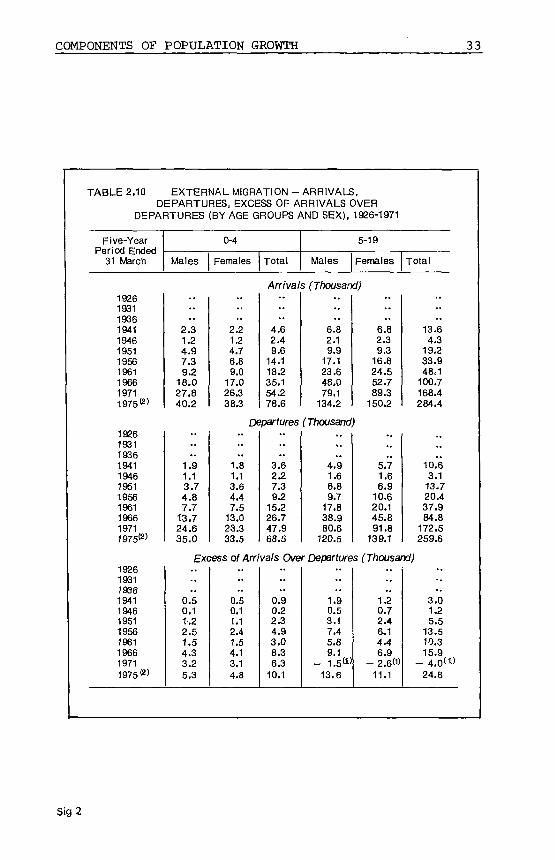
2.4 MIGRATIONNet immigration has accounted for nearly one-quarter of the total
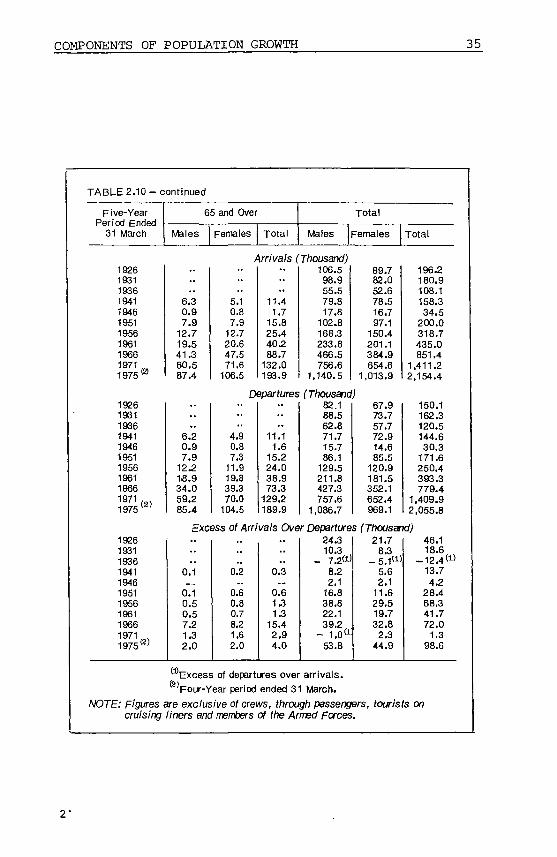
growth of New Zealand population in this century. Table 2.10summarises the historical data on external arrivals into, anddepartures from, New Zealand. During 1926-71, the net average gainfrom external migration was about 28,000 per quinquennium. Five-yearly migration levels, however, fluctuated from a net outflow of2,400 during 1931-36 to a net inflow of 66,200 during 1951-56. The netimmigration level for the four years ended March 1975 (98,600) is thehighest ever recorded in New Zealand.
Since 1971, external migration has increased in relative importanceas a contributor to population growth.
During the 12 months ended 31 March 1974, external arrivalsexceeded the departures by 33,200, accounting for almost half of thetotal estimated growth (68,100) in population during that year. Theserelatively large gains from net immigration have placed specialburdens on housing, social services and available employment. Thisled to the Government imposing a more restrictive migration policyearly in 1974. The revised tenets within this new migration policy werethe elimination of free entry rights for British citizens, and the priorrequirement of entry permits. The present Government's policy is tocut down the net immigration even more severely, to a level of about5,000 per annum. Immigrants are to be subjected to more strenuousselection criteria based on skills and qualifications, health, character,age and number of dependents. Prospective immigrants having familyties with New Zealand residents are expected to continue to receivepreferential treatment.
2.4.1 Age and Sex Structure of MigrationTable 2.10 shows the number of arrivals and departures in various
age and sex groups during 1926-71. Over the years, the age group 20-44years has been the largest migrant group. Until 1961, net immigrants inthis age-group made up more than half of all net immigrants. The netoutflow during 1966-71 was also largest at these ages; although,overall, the country gained 1,300 people, it lost 5,800 males and 2,600females aged 20-44 years.
COMPONENTS OF POPULATION GROWTH 33
TABLE 2.10 EXTERNAL MIGRATION - ARRIVALSDEPARTURES, EXCESS OF ARRIVALS OVER
DEPARTURES
Five-YearPprinrt P^rvi^fi
31 March
19261931193619411946195119561961196619711975«)
19261931193619411946195119561961196619711975»'
19261931193619411946195119561961196619711975«
Males
..
..-.
2.31.24.97.39.2
18.027.840.2
..
..1.91.13.74.87.7
13.724.635.0
(BY AGE GROUPS AND SEX),
0-4
Females
..
• •
2.21.24.76.89.0
17.026.338.3
Total Males
1926-1971
5-19
Females
Arrivals (Thousand)
••••
4.62.49.6
14.118.235.154.278.6
Departures......
1.81.13.64.47.5
13.023.333.5
..
..
3.6227.39.2
15.226.747.968.5
..
6.82.19.9
17.123.648.079.1
134.2
• .
6.82.39.3
16.824.552.789.3
150.2
(Thousand),,....
4.91.66.89.7
17.838.980.6
120.5
. .
..
..5.71.66.9
10.620.145.891.8
139.1
Total
• •
- .
13.64.3
19.233.948.1
100.7168.4284.4
10.63.1
13.720.437.984.8
172.5259.6
Excess of Arrivals Over Departures (Thousand)......
0.50.11.22.51.54.33.25.3
..
0.50.11.12.41.54.13.14.8
-...
0.90.22.34.93.08.36.3
10.1
..
..
. .1.90.53.17.45.89.1
- 1.5«1»13.6
..
..
..1.20.72.46.14.46.9
- 2 . 6 »11.1
..• .
3.01.25.5
13.510.315.9
- 4.0d '24.8
Sig2

34 THE POPULATION OF NEW ZEALAND
TABLE 2.10 - continued
Five-YearPprirvH Fndpdi O 1 \^2 CltUwU
31 March Males
19261931193619411946195119561961196619711975<2)
..
..
..40.9
8.752.989.8
118.9233.4372.5565.7
19261931193619411946195119561961196619711975«)
..
..36.1
7.641.664.3
106.3221.9378.3537.4
20-44
Females Total Males
Arrivals (Thousand)..••
. .
39.99.2
47.372.387.2
152.2261.7415.2
..
..
..80.817.9
100.2162.1206.1385.6634.2980.9
Departures....
36.98.0
41.055.576.4
142.6264.3393.1
..
..
..73.115.782.6
119.8182.7364.5624.6930.5
Excess of Arrivals Ove1926193119361941194619511956196119661971 ,„,1975ß)
..
..4.81.1
11.325.612.611.5
-5 .8 (D28.3
..
..
..2.91.26.3
16.710.89.6
- 2.6Í«22.1
..
..7.82.3
17.642.323 A21.1
- 8.4 (D50.4
23.54.9
27.241.362.7
125.8216.6313.0
(Thousand^.,....
22.64.6
26.038.561.1
118.8214.9308.4
45-64
Females
..
..24.4
3.228.041.959.7
115.4205.8303.6
..
..23.6
3.126.738.457.6
111.3202.9298.9
Total
..
..47.8
8.255.283.2
122.4241.3422.4616.6
..,,,.
46.27.7
52.877.0
118.6230.1417.8607.3
' Departures (Thousand)
..
..0.80.41.32.81.67.11.84.6
..
0.80.11.23.42.24.12.84.7
..
1.6o;52.56.23.8
11.24.69.3
COMPONENTS OF POPULATION GROWTH 35
TABLE 2.10 - continued
Five-YearPeriod Ended
31 March
65 and Over
Males Females Total
Total
Males Females Total
19261931193619411946195119561961196619711975
19261931193619411946195119561961196619711975
(2)
(2)
Arrivals (Thousand)......
6.30.97.9
12.719.541.360.587.4
• •
5.10.87.9
12.720.647.571.6
106.5
••• •• •
11.41.7
15.825.440.288.7
132.0193.9
106.598.955.579.817.8
102.8168.3233.8466.5756.6
1,140.5
89.782.052.678.516.797.1
150.4201.1384.9654.6
1,013.9
6.20.97.9
12.21.8.934.059.285.4
4.90.87.3
11.919.839.370.0
104.5
11.11.6
15.224.038.973.3
129.2189.9
Departures (Thousand)82.1 67.988.5 73.762.8 57.771.7 72.915.7 14.686.1 85.5
129.5 120.9211.8 181.5427.3 352.1757.6 652.4
1,086.7 969.1
196.2180.9108.1158.334.5
200.0318.7435.0851.4
1,411.22,154.4
150.1162.3120.5144.630.3
171.6250.4393.3779.4
1,409.92,055.8
Excess of Arrivals Over Departures (Thousand)1926193119361941194619511956196119661971 M ,1975(2)
.•
0.1„ _
0.10.50.57.21.32.0
tm
0.2._
0.60.80.78.21.62.0
..
..,.
0.3. .
0.61.31.3
15.42.94.0
24.310.3
- 7.2(D8.22.1
16.838.822.139.2
- 1.0'1
53.8
21.78.3
- 5 .1 ' 1 '5.62.1
11.629.519.732.8
2.344.9
46.118.6
-12.4 «13.74.2
28.468.341.772.0
1.398.6
Excess of departures over arrivals.
Four-Year period ended 31 March.
NOTE: Figures are exclusive of crews, through passengers, tourists oncruising liners and members of the Armed Forces.
36 THE POPULATION OF NEW ZEALAND
Migrants in the age interval 5-19 years constitute the next importantgroup, followed by age group 45-64 and 65 years and over in that order.
According to Table 2.10 male net migration to New Zealand hasgenerally exceeded the female net migration. This holds for all agegroups except 65 years and over, where the reverse is true. During the5-year period 1966-71, which was affected by an economic recession,male emigrants exceeded the male immigrants by 1,000 while, incontrast, there was a net immigration of 2,300 for females.
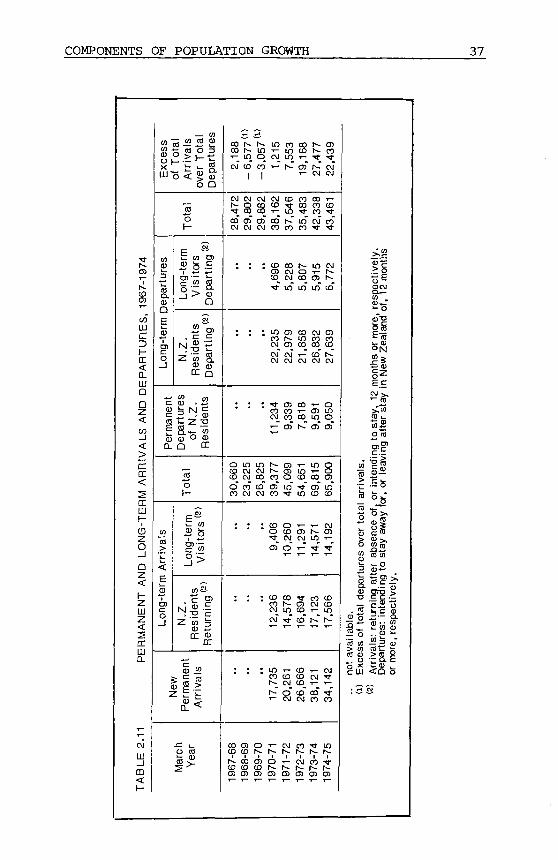
2.4.2 Permanent and Long-term MigrationIn recent years, economic factors have played a major role in
determining the volume and direction of net permanent and long-termmigration to New Zealand. It is difficult to attempt a systematicanalysis of migration trends in terms of the classical "push" and "pull"factors, but a study of the historical data suggests two relationships.
In economically "lean" periods in New Zealand, relative to donorcountries, potential immigrants have generally been deterred fromcoming while New Zealand residents have emigrated to moreeconomically viable areas. Conversely, periods of economic expansionhave generally attracted considerable numbers of immigrants whileresidents have been content to remain in New Zealand. This hasespecially been the case when migrant donor countries haveexperienced economic downturns relative to the New Zealandsituation.
Recent data on permanent and long-term arrivals and departures arepresented in Table 2.11.
The trends evident in this table reflect economic conditions andofficial immigration policy which has tended to be contemporary tosuch conditions.
COMPONENTS OF POPULATION GROWTH 37
O)
coO)
c/í
PA
RT
UR
E
LUQQ<
CO_ ]
cece
^ceLU
O_1DZ
EN
T /
Z
DCLUD .
2.11
LU
<I -
;ess
LU-
coCD
jV -
COQ_euQE
Long
-ter
£Z0CZ
CDD.
val
eS
o
— co
Iva
lsT
ota
rture
~ t - aO Q
tal
o
E CO D)
Y 5 ë
-1 D
N.Z
.R
esi
de
nts
De
pa
rtin
g
t " co
tu . mT NI c
+Z ' C D
CO —Û . — coCD O CDQ CC
~s'S\-
»_ co+j O
1 *-•
O '.T—1
Zu Tcu ~ce CD
tr
S co
ï ro >
"l<
arc
r'ea
,188
CM
CMh-
COCM
O
gOco
:
:
.
co
7-6
CDO)
,57
7'
coI
CM
enCM
.
i nCMCM
COCM
;
:
ai
8-6
CDai
,05
7'
coI
CM
3aiCM
.
mINcocoCM
:
:
•
o
ciCDai
,215
CMCD
COCO
CD
enco
22
,23
5
COCM
*~
N-r--coO)co
g
,236
CM
m
,73
t—i
or—O)
553
CO
aco
coCMIN
in22
,979
a>cocoen
en§m
oCDCM
o• * ~
,578
CM
o"CM
CM
i
cn
168
ai• ' - '
coco
inco
ocoin
21,8
58
co
5r-.
Sm
SCM
• » "
,694
co
CDcoco_co"CM
co1
CM
en
477
CM
COCOCO
CMTT
in
eni n
26,8
32
aimai
i n
5enco
T-
i n
• * ~
,123
CM
co"CO
co
43
9
CMCM
^_CD
CO
CM
r—CD
27,6
39
oinoen
ooai
i nco
CMai
^ -
,566
17,
CMi f
CO
in
en
'co
'S
¡r.ra>
er t
otal
§coCD
rSQ.CD
T3
2
"5co
ces
XLU
w
. ! §
S£!CD -T"- O
¿•a
onth
s or
mo
New
Ze
ala
g c
2 à?^^ co
o*î5
if? ^£—•- &
nee
of,
away
ti
CD -w
a cot- OC D + -
jrnin
gnt
endi
i-i
va part
< û
CD>
O
dsa.
mor
.

38 THE POPULATION OF NEW ZEALAND
2.4.3 Ethnic Origin of ImmigrantsHistorically, immigrants to New Zealand have been predominantly
of European descent. The major sources have been Commonwealthcountries, particularly the United Kingdom and Australia. Table 2.12below shows that during 1973-74, of the 69,800 persons intendingpermanent residence in New Zealand, 31,800 (or 45.6 percent) and20,300 (or 29.1 percent) came from the United Kingdom and Australia,respectively. Another 6.4 percent were from Canada and the UnitedStates. Pacific Islanders (mainly from the Cook Island, Niue Island,Fiji and Western Samoa) made up another 5.9 percent of all migrants.
TABLE 2.12 ARRIVALS INTENDING PERMANENT ORLONG-TERM RESIDENCE BY COUNTRY OF LAST
PERMANENT RESIDENCE, 1967-1974
Country
United KingdomAustraliaUnited StatesCook Islands and Niue
IslandCanadaFiji«2 'South AfricaNetherlandsWestern Samoam
All Others (2)
Total«1'
1967-68
Number(000)
14.98.31.0
0.60.70.50.20.70.23.6
30.7
Pro-portion
ofArrivals
(Percent)48.527.0
3.3
2.02.31.60.62.30.7
11.7
100.0
1971-72
Number(000)
15.216.12.4
1.22.10.80¿50.60.45.7
45.0
Pro-portion
ofArrivals
(Percent)33.835.8
5.3
2.74.71.81.11.30.9
12.6
100.0
1973-74
Number(000)
31.820.32.4
2.32.11.20.80.70.67.6
69.8
Pro-portion
ofArrivais
(Percent)45.629.1
3.4
3.33.01.71.11.00.9
10.9
100.0
Pro-portionalChange
1967-68-1973-74
(Percent)-2 .9
2.10.1
1.30.70.10.5
-1.30.2
-0.8
C-) Includes returning New Zealand Residents.<a Excludes Fijians, Tongans and Western Samoans who are admitted to New Zealand each
year, initially on 6 month work permits and who later may qualify for permanentresident status.
2.4.4 Migration of Pacific IslandersSince the end of World War II, there has been a large inflow of
Pacific Islanders to New Zealand. Those born in the Cook, Niue andTokelau Islands are New Zealand citizens and may enter at any time.Long-term arrangements have also been made with the indépendantIslands, notably Fiji, Tonga and Western Samoa, for sending theircitizens to New Zealand to work on a temporary basis. At present,about 1,500 Western Samoans enter New Zealand on this basis everyyear.
COMPONENTS OF POPULATION GROWTH 39
2.4.5 Effect of Migration on The Labour ForceIn periods of internal economic downturn (such as took place during
the thirties and on a smaller scale during 1968-69) there is a tendencyfor many people to emigrate from New Zealand to other countries.This outflow generally affects the most skilled and qualified groupsand particularly those in the younger working ages. However, there isalso a considerable outflow, in normal times, of skilled, technical andprofessional people seeking better job opportunities overseas orwanting to enhance their experiences and gain higher qualifications.However, this is generally offset by an inflow of similar people fromoverseas.
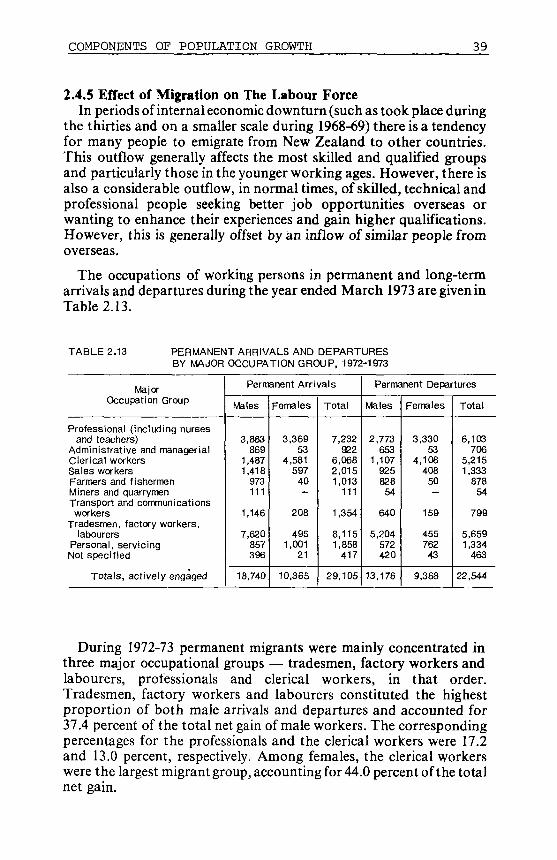
The occupations of working persons in permanent and long-termarrivals and departures during the year ended March 1973 are given inTable 2.13.
TABLE 2.13 PERMANENT ARRIVALS ANDBY MAJOR
MajorOccupation Group
Professional (including nursesand teachers)
Administrative and managerialClerical workersSales workersFarmers and fishermenMiners and quarrymenTransport and communicationsworkers
Tradesmen, factory workers,labourers
Personal, servicingNot specified
Totals, actively engaged
DEPARTURESOCCUPATION GROUP, 1972-1973
Permanent Arrivals
Males
3,863869
1,4871,418
973111
1,146
7,620857396
18,740
Females
3,36953
4,581597
40—
208
4951,001
21
10,365
Total
7,232922
6,0682,0151,013
111
1,354
8,1151,858
417
29,105
Permanent Departures
Males
2,773653
1,10792582854
640
5,204572420
13,176
Females
3,33053
4,108408
50—
159
45576243
9,368
Total
6,103706
5,2151,333
87854
799
5,6591,334
463
22,544
During 1972-73 permanent migrants were mainly concentrated inthree major occupational groups — tradesmen, factory workers andlabourers, professionals and clerical workers, in that order.Tradesmen, factory workers and labourers constituted the highestproportion of both male arrivals and departures and accounted for37.4 percent of the total net gain of male workers. The correspondingpercentages for the professionals and the clerical workers were 17.2and 13.0 percent, respectively. Among females, the clerical workerswere the largest migrant group, accounting for 44.0 percent of the totalnet gain.
40 THE POPULATION OF NEW ZEALAND
2.4.6 Assisted ImmigrantsTwo schemes providing financial assistance to immigrants through
the New Zealand Government have been in operation in the past — thesubsidy scheme, which involves a contribution by employers toimmigrants' fares, and the assisted passage scheme. The subsidyscheme operates from Britain, the United States, France, Belgium,Switzerland, the Netherlands and West Germany and there is no quotainvolved. Employers wishing to take advantage of the scheme areobliged to provide employment, arrange housing in New Zealand, andmeet one-quarter of the cost of immigrants' fares. The Governmentmeets the remaining three-quarters of the fares. Single people andmarried men between the age of 18 and 45 years may be sponsored.
The assisted passage scheme, which began in 1947, operated onlyfrom Britain, and was limited to 500 immigrants a year. The schemewas terminated in April 1975 to reduce the strain on housing and otherfacilities brought about by the immigration boom. On occasions,refugees coming within the mandate of the United Nations HighCommission for refugees, have also been accepted.
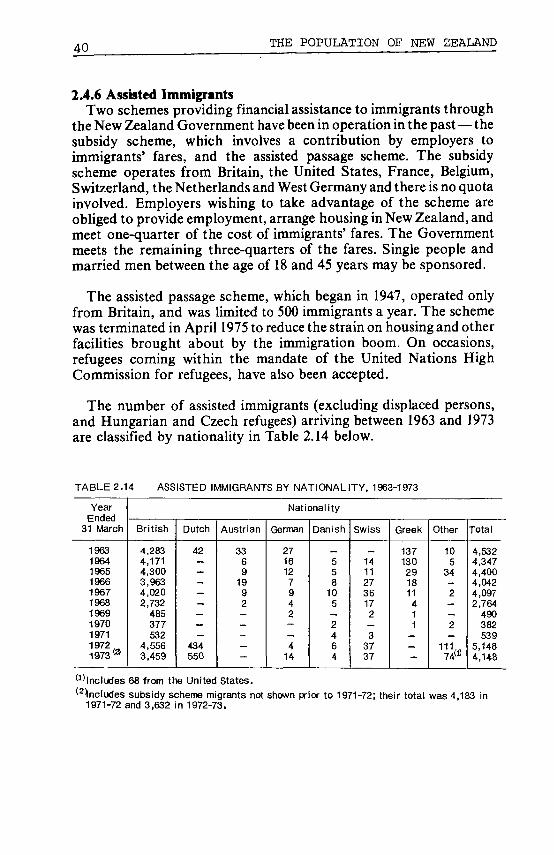
The number of assisted immigrants (excluding displaced persons,and Hungarian and Czech refugees) arriving between 1963 and 1973are classified by nationality in Table 2.14 below.
TABLE 2.14 ASSISTED IMMIGRANTS BY NATIONALITY. 1963-1973
YearEnded
31 March
1963196419651966196719681969197019711 9 7 2 r*1973®
British
4,2834,1714,3003,9634,0202,732
485377532
4,5563,459
Dutch
42———__—__
434550
Austrian
3369
1992—___—
Nationality
German
2716127942—_4
14
Danish
558
105_2464
Swiss
_14112736172
33737
Greek
137130291811411
__-
Other
105
34—2__2_
111,,74(fi
Total
4,5324,3474,4004,0424,0972,764
490382539
5,1484,148
(1)lncludes 68 from the United States.i nc l udes subsidy scheme migrants not shown prior to 1971-72; their total was 4,183 in
1971-72 and 3,632 in 1972-73.

CHAPTER III
POPULATION COMPOSITION
3.1 INTRODUCTIONThe size of a population and its distribution by age, sex and other
demographic characteristics are vital elements in any demographicand social analysis. They are also important for determining thepresent and future needs and priorities of a country in social andeconomic areas such as education, employment, housing, health andretirement provisions. This chapter analyses the major changes in thecomposition of the New Zealand population during the presentcentury. Besides the fundamental variables of age and sex, a number ofother characteristics, notably, marital status, family and householdstructure, birthplace, ethnicity and literacy are examined.
3.2 SEX RATIOSTable 3.1 shows the number of males and females in the New
Zealand population and the sex ratio (males per 100 females) atsuccessive population censuses since 1956.
The population of New Zealand, though it has never been exactlyequally balanced between males and females, has, in recent years, beenclose to parity. Between the 1956 and 1966 Censuses of Population, thesex ratio dropped from 101.1 to 100.8 males per 100 females. In 1971, acensus of the New Zealand population for the first time (with theexception of the war-time Census of 1945) recorded a sex ratio belowparity, the enumerated populations being 1,430,856 males and1,431,775 females. This reversal in the familiar pattern was the result ofthe 1968-1969 economic recession, when a disproportionately largenumber of males left New Zealand.
Sex ratios for 5-yearly age groups at the 1956,1961,1966 and 1971Censuses of Population are also given in Table 3.1. In populationsclosed to migration the age pattern of the sex ratio is determined by thevariations in the sex ratio of births and the sex differences in mortality.Generally, annual variations in the sex ratio of births are small, and thesex ratio decreases gradually with increasing age. In a large number of

42 THE POPULATION OF NEW ZEALAND
O
OJ
1966
CD
Age
3ex
tío
a:
esgu.
«
ale
(i)
3ex
tio
or
Fem
ales
to
Mal
e
3x oo ~co m
les
Fem
a
CO
1
Sex
ati
o(1
cc
ales
§LL
COCD
Ma
Gro
up(Y
ears
)
333388
916
310
286
116
447'
622
KSBSCO^S
oSoSSS
149,
689
146,
441
130,
001
120.
041
93,2
5882
,319
954
816
498
326
394
927
CD C\J CD LO h- -*J-LO LO CO C\J CJ 00
C\J S (O 03 [ • Q
3S33S3
041
821
829
895
020
173
143
127
119 90 78 70
032
880
339
324
043
600
149
133
125 95 80 73
8SSSSS
855
438
991
660
491
502
I O N O CD CD CO
OCX)
o c
609
S í
siSf2
o in
, - O LO LO TT T - LO
O O O) O) O) 00 1 -
445
488
658
919
260
914
221
oo oo •*- co oo h~ r*-
251
879
141
264
597
700
462
SSScoñ^S
co co Tf œ co o> en
OOOOICHOCDCOS
72,8
6778
.978
78,7
9573
,516
69,2
2660
,316
49,9
9342
,961
34.0
50
CD tr^ oo
CO T -
o o
976
846
LO t^
923
024
Seo
04.1
97.9
361
441
429
913
385
272
778
438
158
468
497
t~ CM CO T- Oï CD Tíoo r - CD co -^ co c j
O) CO O CM O CD CD
O) o o o CTÏ h- r
764
290
836
258
682
413
565
O T f
CD LO
CD CC
CO N
CC OJ
00 LO
fO
S
270
010
co
N CO CD
25,5
0315
,730
045
616
00 O9,
492
731
LO
CD CO CD
S S!N O r r TTOJCMCO-'a-
232
203
307
424
573
396
925
T- r- -<r m y- -r- LO
170
246
690
398
210
918
695
OCOWNT- NO
472
502
535
654
881
116
149
054
336
OJ O
85.8
81.6
SST- O
42U
676
Onl f lCOOlQCOOOtD lOCDLOcONCOCD
I I I I I I
30 -
34
35 -
39
I I I I I I I I !
CO
252
761
70.5
593
LO
941
CO
85 a
nd o
ver
OJ
99.
775
5
856
•30
CO
00.
1,33
3,17
674
31,
343
o
o
608
1.20
137
61,
213
01.1
851
1,08
021
11.
093
All
Age
s
POPULATION COMPOSITION 43
populations, the preponderance of males at birth is gradually off-set bythe higher mortality of males at each age, and a balance of sexes isgenerally observed by age 50. In New Zealand, this common pattern ismodified, to some degree, by external immigration, which normallyproduces a preponderance of males. Consequently, it is not surprisingthat at any point of time, which has been preceded by a period of heavyimmigration, changes in the sex ratio, from one age group to the next,are not regular, nor is male/female parity necessarily obtained by age50. The low sex ratio of 98 males per 100 females for the age group 35-39 years in 1956, and its surviving cohorts (aged 40-44 years in 1961 or45^49 years in 1966) is due to the casualties among yooung malesduring World War II.
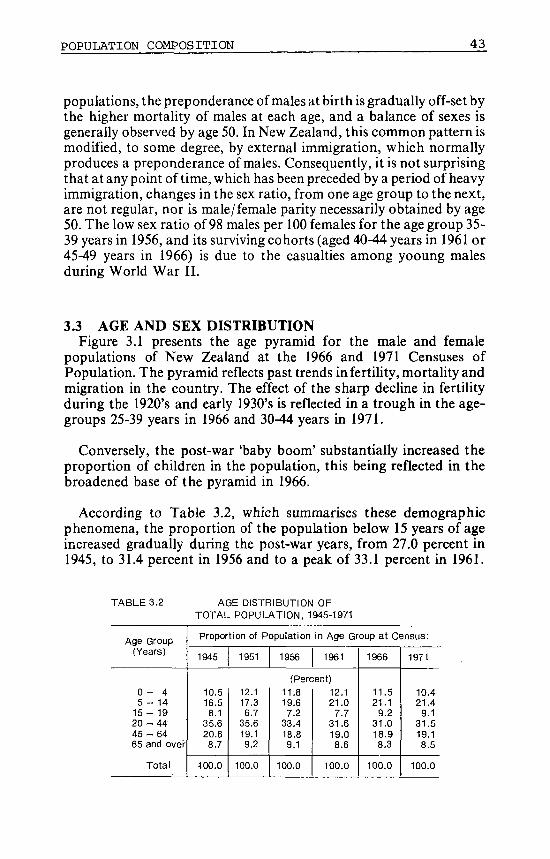
3.3 AGE AND SEX DISTRIBUTIONFigure 3.1 presents the age pyramid for the male and female
populations of New Zealand at the 1966 and 1971 Censuses ofPopulation. The pyramid reflects past trends infertility, mortality andmigration in the country. The effect of the sharp decline in fertilityduring the 1920's and early 1930's is reflected in a trough in the age-groups 25-39 years in 1966 and 30-44 years in 1971.
Conversely, the post-war 'baby boom' substantially increased theproportion of children in the population, this being reflected in thebroadened base of the pyramid in 1966.
According to Table 3.2, which summarises these demographicphenomena, the proportion of the population below 15 years of ageincreased gradually during the post-war years, from 27.0 percent in1945, to 31.4 percent in 1956 and to a peak of 33.1 percent in 1961.
TABLE 3.2 AGE DISTRIBUTION OFTOTAL POPULATION, 1945-1971
Age Group(Years)
0 - 45 - 1 4
15 - 1920 - 4445 - 6465 and over
Total
Proportion of Population
1945
10.516.58.1
35.620.68.7
400.0
1951 1956
in Age Group at Census:
1961
(Percent)12.117.36.7
35.619.19.2
100.0
11.819.67.2
33.418.89.1
100.0
12.121.0
7.731.619.08.6
100.0
1966
11.521.1
9.231.018.98.3
100.0
1971
10.421.4
9.131.519.18.5
100.0

44 THE POPULATION OF NEW ZEALAND
oa.oX
P
i
o

POPULATION COMPOSITION 45
The small drop in the proportion between 1961 and 1971, reflects therapid decline in fertility experienced since 1962, which has been offset,only partially, by the large increase in the numbers of women in thereproductive age-group during the period. The median age of thepopulation dropped significantly from 30.3 years in 1945 to 27.3 yearsin 1961 and further to 25.6 years in 1971. The proportion of populationin the lower to middle working age-group (15-44 years) fell from 43.7percent in 1945 to 39.3 percent in 1961, but thereafter increased slightlyto reach 40.6 percent, in 1971, as the "boom babies" started to enter thework force in increasing numbers. Persons in the middle to higherworking ages (45-64) comprised 20.6 percent of the total population in1945. The proportion dropped to about 19.1 percent in 1951, and sincethen has remained almost unchanged.
Post-war changes in the proportion of old people (65 years and over)in the total population, while generally small reflect the younger
structure of the population. In 1971, only 8.5 percent of the populationwere in this age bracket, compared with 9.1 percent in 1956 and 8.7percent in 1945.
Though not all persons in the working ages (15-64 years) are activelyengaged in economic pursuits, and not all persons outside these agesare dependants, the ratio of children (below 15) and elderly people (65years and over) to those in working ages provides a broad index of apopulation's dependency level. New Zealand's population had adependancy ratio (number of persons in the dependant age-groups —below 15 and 65 years and over — per 100 aged 15-64 years) of 56 in1945, but this rose rapidly to 63 in 1956, and subsequently to 71 in 1961.This rise was due chiefly to the corresponding rise in the youthdependency ratio (i.e. the ratio of children under 15 to persons aged 15-64 years), which in turn resulted from a more youthful population. By1971, the dependency ratio had fallen to 68 per 100 aged 15-64 years.
3.4 MARITAL STATUSIn New Zealand, the minimum legal age for marriage is 16 years. At
the 1971 census, of 932,318 males aged 16 years and over who specifiedtheir status, 26.9 percent were "never married", 67.8 percent were"married", 2.9 percent "widowed" and 2.4 percent were either "legallyseparated" or "divorced". Among females, aged 16 and over specifyingtheir status, the proportion "married" was slightly smaller, but theproportion "widowed" more than three and a half times thecorresponding proportion for males.

46 THE POPULATION OF NEW ZEALAND
TABLE 3.3 TOTAL POPULATION BYSEX AND MARITAL STATUS, 1971
Marital Status
Never MarriedMarriedLegally SeparatedWidowedDivorced
Total a >
Total Population
Males
250,372632,108
11,59826,79811,442
932,318
Females
186,619637,922
14,139104,53314,711
957,924
Total
436,9911,270,030
25,737131,33126,153
1,890,242
(1) Excluding persons not specifying status.
Of 957,924 females aged 16 years and over at the 1971 Census, 19.5percent were "never-married", 66.6 percent were "married", 10.9percent "widowed" and 3.0 percent "divorced" or "legally separated".
There has been little change in the proportion "married" over thepast two decades. During this period the propertion of the populationaged 16 years and over classified as "married", varied between 64.5percent and 67.2 percent. These variations may be attributed tofluctuations in economic conditions, changes in the age composition ofthe population and minor variations in the crude marriage rate.
TABLE 3.4
MaritalStatus
Nevermarried M
FMarried M
FLegally
Separ-ated M
FWidowed M
FDivorced M
F
Totals MF
BY >
1951
87.568.112.331.2
0.10.5
_0.10.10.1
100.0100.0
DISTRIBUTION OF5EX, AGE GROUP AND
1956 1961 1966
16-24 Years
86.966.413.033.1
0.10.3
_0.1
_0.1
100.0100.0
85.564.814.434.7
0.10.3
_0.1
_0.1
100,0100.0
83.664.916.234.5
0.20.4
—0.1
—0.1
100.0100.0
TOTAL POPULATIONMARITAL STATUS, 1951-1971
1971 1951
(Percent)
79.260.320.438.5
0,30.9
—0.10.10.2
100.0100.0
28.315.769.881.2
0.91.30.30.80.71.0
100.0100.0
1956 1961
25-34 Years
27.112.771.384.8
0.81.20.20.60.60.7
100.0100.0
22.910.275.687.5
0.81.20.20.50.50.6
100.0100.0
1966
20.99.5
77.688.0
0.91.30.10.50.50.7
100.0100.0
1971
17.38.6
80.237.4
1.62.30.10.50.81.2
100.0100.0

POPULATION COMPOSITION 47
TABLE 3.4\
MaritalStatus
\
Nevermarried M
FMarried M
FLegally
Separ-ated M
FWidowed M
FDivorced M
F
Totals MF
— continued
1951
\ 12.3\11.1\84.283.2\
1.21.50.92.61.41.6
100.0100.0
1956 1961 1966
35-44 Years
11.69.1
85.485.8
1.01.20.72.31.31.6
100.0100.0
11.27.4
85.987.9
1.11.30.52.01.31.4
100.0100.0
10.76.1
86.589.2
1.11.40.51.91.21.4
100.0100.0
1971 1951
(Percent)
9.15.1
87.489.1
1.62.00.52.01.31.8
100.0100.0
10.511.084.077.2
1.31.42.57.71.71.9
100.0100.0
1956 1961 1966
45-54 Years
9.510.785.779.2
1.01.12.07.01.82.0
100.0100.0
8.98.9
86.581.1
1.01.21.76.71.92.1
100.0100.0
8.77.2
86.682.6
1.11.31.76.71.92.2
100.0100.0
1971
8.15.8
86.483.4
1.71.71.76.62.12.4
100.0100.0
TABLE 3.4
MaritalStatus
Nevermarried M
FMarried M
FLegally
Separ-ated M
FWidowed M
FDivorced M
F
Totals MF
- continued
1951
10.512.480.064.4
1.21.36.6
20.21.71.7
100.0100.0
1956 1961 1966
55-64 Years
9.711.881.966.1
0.90.95.7
19.31.81.9
100.0100.0
8.910.983.367.3
0.80.95.0
18.82.02.1
100.0100.0
8.29.7
84.269.0
Ï.O0.94.5
18.12.12.3
100.0100.0
1971 1951
(Percent
7.58.0
84.570.3
1.41.24.3
17.82.32.7
100.0100.0
11.313.365.039.2
1.41.0
21.045.6
1.30.9
100.0100.0
1956 1961 1966
65 Years and over
10.312.966.238.7
0.80.6
21.346.6
1.41.2
100.0100.0
9.112.467.837.3
0.70.5
20.948.6
1.51.2
100.0100.0
8.411.869.736.9
0.60.5
19.749.4
1.61.4
100.0100.0
1971
7.410.772.138.0
1.20.7
17.548.8
1.81.8
100.0100.0
These overall trends, however, mask the recent dramatic shifts inthe marital status distribution of the young population. Table 3.4presents the pattern of change, in the marital status distribution, of themale and female populations in selected 10-year age groups, between1951 and 1971. Post-war trends towards earlier and more marriageshave caused a steady and large increase in the proportions "married" atall ages below 45 years. This tendency has been relatively morepronounced among males than among females. For example, amongmales aged 25-34 years, the proportion "married" rose from 69.8

4 8 THE POPULATION OF NEW ZEALAND
percent in 1951 to 80.2 percent in 1971, while the correspondingproportion for females only rose from 81.2 percent to 87.4 percent.These increases were also accompanied by small increases/in theproportions of males and females classified as "legally separated".Conversely, Table 3.4 shows a steady drop in the proportion of malesand females "widowed" at all ages below 65 years between 1951 and1971. This is attributable to the post-war improvement in longevity,discussed in the previous chapter. At ages 65 years and over, theproportion "widowed" among males dropped from 21.0 percent in1951 to 17.5 percent in 1971, but the corresponding proportion forfemales increased, from 45.6 percent to 48.8 percent, over the sameperiod. These diametrically opposing trends reflect the widening gap inthe life expectancies of the two sexes.
3.5 HOUSEHOLDS AND FAMILIESFor census purposes a household is defined as "a person or group of
persons living in an inhabited permanent private dwelling". "One-family-only households" include "complete-family-households"which consist of a husband and wife with or without unmarriedchildren of any age and "incomplete-family-households" from whichone parent or one or more children are missing on census night. Othertypes of households enumerated in the census include "extended-family-households", which contain extra-family persons/'non-familyhouseholds" and "non-private households" (group living quarters).
The size, type and composition of households are influenced by theavailable stock of housing, by the levels of nuptiality, fertility,migration and mortality and by economic and social trends.
3.5.1 Numbers and Types of HouseholdsAt the 1971 Census of Population and Dwellings, there were 809,827
dwellings in New Zealand. Of these 801,686 (or 99.0 percent) werepermanent private dwellings, 1,069 were mobile and temporarydwellings and 7,082 were non-private dwellings.
Table 3.5 sets out the numbers of private households in NewZealand and the average numbers of persons per household at eachcensus since 1936. The number of permanent private households moredoubled between 1936 and 1971, while the average number of personsper household declined gradually from 3.9 in 1936 to 3.6 during the1950's and further to 3.4 in 1971.
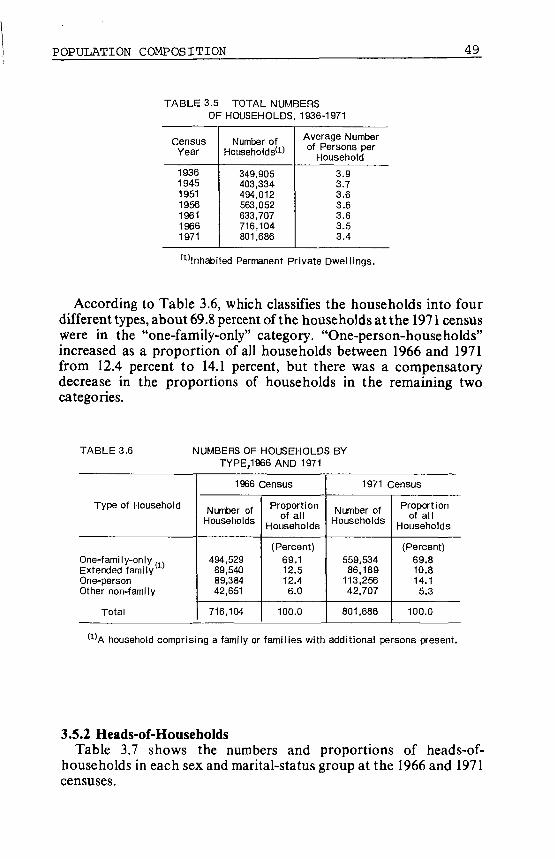
POPULATION COMPOSITION 49
TABLE 3.5 TOTAL NUMBERSOF HOUSEHOLDS, 1936-1971
CensusYear
1936194519511956196119661971
Number ofHouseholds^
349,905403,334494,012563,052633,707716,104801,686
Average Numberof Persons per
Household
3.93.73.63.63.63.53.4
(111Inhabited Permanent Private Dwellings.
According to Table 3.6, which classifies the households into fourdifferent types, about 69.8 percent of the households at the 1971 censuswere in the "one-family-only" category. "One-person-households"increased as a proportion of all households between 1966 and 1971from 12.4 percent to 14.1 percent, but there was a compensatorydecrease in the proportions of households in the remaining twocategories.
TABLE 3.6 NUMBERS OF HOUSEHOLDS BYTYPE,1966 AND 1971
Type of Household
One-family-only . ,Extended familyw
One-personOther non-family
Total
1966 Census
Number ofHouseholds
494.52989,54089,38442,651
716,104
Proportionof all
Households
(Percent)69.112.512.46.0
100.0
1971 census
Number ofHouseholds
559.53486,189
113,25642,707
801,686
Proportionof all
Households
(Percent)69.810.814.15.3
100.0
(1) k household comprising a family or families with additional persons present.
3.5.2 Heads-of-HousehoIdsTable 3.7 shows the numbers and proportions of heads-of-
households in each sex and marital-status group at the 1966 and 1971censuses.

50 THE POPULATION OF NEW ZEALAND
TABLE 3.7 NUMBERS AND DISTRIBUTION OF
HOUSEHOLDS BY SEX
QPX and MaritalOCA Cil tvl IVIŒI 1 t u l
Status ofHead-of-Household
MalesNever-marriedMarriedWidowedLegally SeparatedDivorced
FemalesNever-marriedMarriedWidowedLegally SeparatedDivorced
Total
AND MARITAL STATUS OF1966 AND 1971
1966 Census
Number
30,367541,206
16,4433,1484,452
25,03017,71165,530
5,4926,725
716,104
Proportion ofTotal Heads-
of-Households
(Percent)
4.275.62.30.40.6
3.52.59.20.80.9
100.0
HEAD,
1971 Census
Number
37,703593,554
17,1586,1936,363
29,51320,41871,513
9,27010,001
801,686
Proportion ofTotal Heads-
of-Households
(Percent)
4.774.0
2.10.80.B
3.72.58.91.21.2
100.0
In 1971, 74.0 percent of households were headed by married maleswhile widows were the next most important group comprising 8.9percent of all heads-of-households. "Never-married" males (4.7percent) and "never-married" females (3.7 percent), in that order, werethe next most important groups.
3.5.3 Dwelling TenureThe proportion of householders at the 1971 census who either
owned their own homes or were buying them on mortgage was 68.1percent.
TABLE 3.8 TENURE OF INHABITEDPERMANENT PRIVATE DWELLINGS
IN NEW ZEALAND, 1951, 1961 AND 1971
Tenure
Renting or leasingRent freeBuying on mortgageOwned without mortgage
Total
Proportion of TotalPermanent Private Dwellings
1951
30.38.3
30.730.7
100.0
1961
24.36.8
40.128.8
100.0
1971
25.96.0
41.426.7
100.0
This was much the same as in 1961 but substantially higher than in1951. The proportion of householders who were renting or leasingtheir homes dropped between 1951 and 1961 but increased slightlybetween 1961 and 1971.

POPULATION COMPOSITION 5 1
3.6 BIRTH PLACETable 3.9 gives the number of persons born in New Zealand and
those born overseas as recorded at successive censuses of the NewZealand population since 1878. Immigration played a major role in thepopulation growth of New Zealand, in the early-colonial days.However, as fertility during that period was also quite high, as early as1881 the population born in New Zealand (267,501) was greater thanthe overseas born population (265,696).
TABLE 3.9 NEW ZEALAND BORN AND OVERSEAS BORNPOPULATIONS*11 1878-1971
Census
187818811886189118961901190619111916192119261936194519511956196119661971
Population
New ZealandBorn
217,721267,501342,159408,709481,515559,249653,978752,623843,915959,034
1,054,9661,279,9171,456,0671,672,9621,863,3442,074,5092,279,9942,444,169
OverseasBorn
239,338265,696276,263258,925261,095256,171281,859304,910303,702311,977323,955291,833245,183265,242309,547338,673394,943411,956
Proportion of Total Population
New ZealandBorn
OverseasBorn
(Percent)
47.650.255.361.264.868.669.971.273.575.576.581.485.686.385.886.085.285.6
52.449.844.738.835.231.430.128.826.524.523.518.614.413.714.214.014.814.4
(1),'Excludes cases where birthplace is not specified.
With natural increase (excess of births over deaths) continuing to bethe chief contributor to New Zealand's population growth, theproportion of the total population born in New Zealand increasedsteadily throughout the remaining part of the 19th century and thefirst half of the 20th century — from 50.2 percent in 1881 to a peak of86.3 percent in 1951.
The period under review was also characterised by two waves ofemigration; the first during the 1890's and the second, during thedepression of the 1930's and the subsequent war-years. Emigrantsduring these periods included many people born overseas andconsequently the number of persons born overseas (245,183)
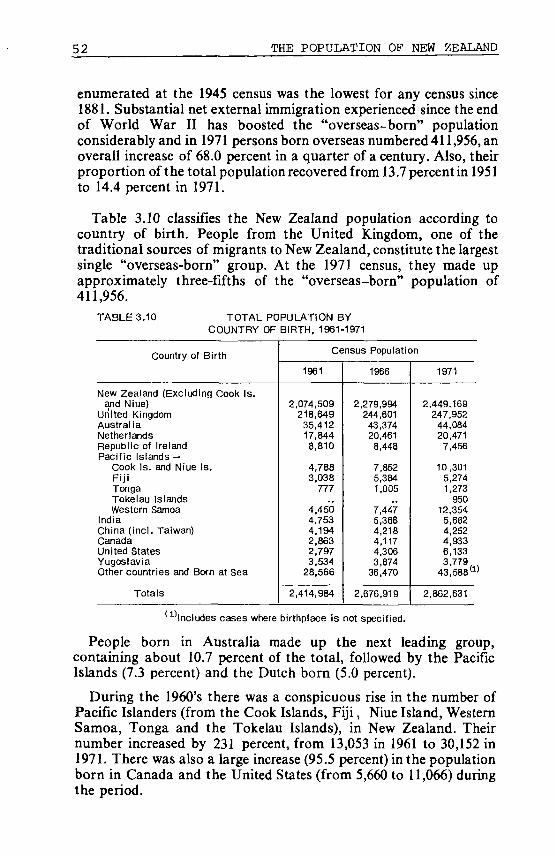
52 THE POPULATION OF NEW ZEALAND
enumerated at the 1945 census was the lowest for any census since1881. Substantial net external immigration experienced since the endof World War II has boosted the "overseas-born" populationconsiderably and in 1971 persons born overseas numbered 411,956, anoverall increase of 68.0 percent in a quarter of a century. Also, theirproportion of t he total population recovered from 13.7 percent in 1951to 14.4 percent in 1971.
Table 3.10 classifies the New Zealand population according tocountry of birth. People from the United Kingdom, one of thetraditional sources of migrants to New Zealand, constitute the largestsingle "overseas-born" group. At the 1971 census, they made upapproximately three-fifths of the "overseas-born" population of411,956.
TABLE 3.10 TOTAL POPULATION BYCOUNTRY OF BIRTH, 1961-1971
Country of Birth
New Zealand (Excluding Cook Is.and Niue)
United KingdomAustraliaNetherlandsRepublic of IrelandPacific Islands —
Cook Is. and Niue Is.FijiTongaTokelau IslandsWestern Samoa
IndiaChina (incl. Taiwan)CanadaUnited StatesYugoslaviaOther countries and Born at Sea
Totals
Census Population
1961
2,074,509218,64935,41217,8448,810
4,7883,038
777
4,4504,7534.1942,8632,7973.534
28.566
2,414,984
1966
2,279,994244,60143,37420,4618,448
7,8525,3841,005
7,4475,3684,2184,1174,3063,874
36,470
2,676,919
1971
2,449,169247,952
44,08420,471
7,456
10,3015,2741,273
95012.3545,6624,2524,9336,1333,779
43,588(1)
2,862,631
^'includes cases where birthplace is not specified.
People born in Australia made up the next leading group,containing about 10.7 percent of the total, followed by the PacificIslands (7.3 percent) and the Dutch born (5.0 percent).
During the 1960's there was a conspicuous rise in the number ofPacific Islanders (from the Cook Islands, Fiji, Niue Island, WesternSamoa, Tonga and the Tokelau Islands), in New Zealand. Theirnumber increased by 231 percent, from 13,053 in 1961 to 30,152 in1971. There was also a large increase (95.5 percent) in the populationborn in Canada and the United States (from 5,660 to 11,066) duringthe period.

POPULATION COMPOSITION 53
The age structure of the "overseas-born" population varies quiteconsiderably according to birthplace, and also from the "NewZealand-born" pattern. The New Zealand-born population is youngerthan the overseas-born group; this is largely because immigrantsgenerally tend to be concentrated more in the working and retirementage-groups.
3.7 ETHNIC ORIGINThe New Zealand population can broadly be classified, according to
ethnic origin, into three main groups: Europeans, Maoris and"others". Europeans include all persons of European origin,while theMaori population consists of all persons with half or more Maoriancestry. The residual "others" ethnic group consists largely of Asiansand Pacific Islanders. Table 3.11 shows the broad ethnic compositionof New Zealand population at each census since 1916. Europeans areby far the largest ethnic group in New Zealand. Their proportion of thetotal New Zealand population has been decreasing gradually since the1916 Census, however. At the 1971 Census they comprised nearly 90.0percent of the country's population of 2,862,631. Trends and patternsin fertility and mortality in New Zealand predominantly reflect thefertility and mortality experience of the European population. Thechanging ethnic distribution of the total New Zealand population isshown graphically in Figure 3.2.
TABLE 3.11 TOTAL POPULATION BYETHNIC ORIGIN, 1916-1971
CensusEthnic Group
Europeans (l) Maoris*2' OthersTotal
1916192119261936194519511956196119661971
1916192119261936194519511956196119661971
1,093,024•1,209,2431,338,1671,484,5101,592,9081,809,4412,016,2872,216,8862,426,3522,561,280
95.195.195.094.393.693.392.791.890.689.5
Population52,99756,98763,67082,32698,744
115,676137,151167,086201,159227,414
3,2045,4386,3026,976
10,67814,35520,62431,01249,40873,937
Proportion (Percent)4.64.54.55.25.86.06.36.97.57.9
0.30.40.40.40.60.70.91.31.82.6
1,149,2251,271,6681,408,1391,573,8121,702,3301,939,4722,174,0622,414,9842,676,9192,862,631
100.0100.0100.0100.0100.0100.0100.0100.0100.0100.0
^'includes European - Maori — quarter castes.^ or more Maori blood.

54 THE POPULATION OF NEW ZEALAND
O
3 i1 Ia.
I l l
UJ
zozo
o»
«/>
=>Ztuu
ï>mlua.
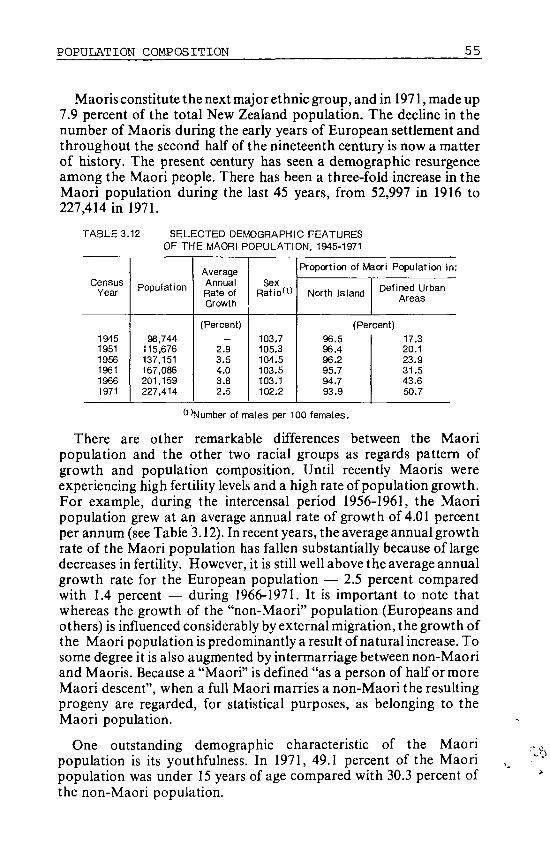
POPULATION COMPOSITION 55
Maoris constitute the next major ethnic group, and in 1971, made up7.9 percent of the total New Zealand population. The decline in thenumber of Maoris during the early years of European settlement andthroughout the second half of the nineteenth century is now a matterof history. The present century has seen a demographic resurgenceamong the Maori people. There has been a three-fold increase in theMaori population during the last 45 years, from 52,997 in 1916 to227,414 in 1971.
TABLE 3.12 SELECTED DEMOGRAPHIC FEATURESOF THE MAORI POPULATION, 1945-1971
CensusYear
194519511956196119661971
Population
98.744115.676137.151167.086201.159227.414
AverageAnnualRate ofGrowth
(Percent)_
2.93.54.03.82.5
SexRatio*1 '
103.7105.3104.5103.5103.1102.2
Proportion of Maori Population in
North IslandDefined Urban
Areas
(Percent)
96.596.496.295.794.793.9
17.320.123.931.543.650.7
'^Number of males per 100 females.
There are other remarkable differences between the Maoripopulation and the other two racial groups as regards pattern ofgrowth and population composition. Until recently Maoris wereexperiencing high fertility levels and a high rate of population growth.For example, during the intercensal period 1956-1961, the Maoripopulation grew at an average annual rate of growth of 4.01 percentper annum (see Table 3.12). In recent years, the average annual growthrate of the Maori population has fallen substantially because of largedecreases in fertility. However, it is still well above the average annualgrowth rate for the European population — 2.5 percent comparedwith 1.4 percent — during 1966-1971. It is important to note thatwhereas the growth of the "non-Maori" population (Europeans andothers) is influenced considerably by external migration, the growth ofthe Maori population is predominantly a result of natural increase. Tosome degree it is also augmented by intermarriage between non-Maoriand Maoris. Because a "Maori" is defined "as a person of half or moreMaori descent", when a full Maori marries a non-Maori the resultingprogeny are regarded, for statistical purposes, as belonging to theMaori population.
One outstanding demographic characteristic of the Maoripopulation is its youthfulness. In 1971, 49.1 percent of the Maoripopulation was under 15 years of age compared with 30.3 percent ofthe non-Maori population.

56 THE POPULATION OF NEW ZEALAND
In 1971 the average age of the Maori population was 20.7 years formales and 20.6 years for females: for the non-Maori population thecorresponding figures were 30.5 years for males and 32.2 years forfemales. Moreover, whereas females outnumber males among thenon-Maoris, the Maori population has a preponderance of males, theMaori sex ratio being 102.2 males per 100 females in 1971.
The third group, "others", consists largely of Pacific Islanders,Chinese, Indians, Syrians, Lebanese and Arabs (see Table 3.13). In1971, this residual group contained 2.6 percent of the total NewZealand population compared with 0.6 percent in 1945.
TABLE 3.13 TOTAL POPULATIONS OF MINORETHNIC GROUPS (EXCLUDING
EUROPEAN AND MAORI). 1961-1971
Ethnic Group
Pacific Islanders —Cook Island MaoriSamoanNiuean and TokelauanTonganOther
Sub-TotalsPacific Islanders
ChineseIndianFijianSyrian, Lebanese and ArabOther Ethnic Groups
Sub-TotalsOthers
Totals
Census Population
1961
4,4996,4811,7281,043
589
14,340
8,5244,179
7461,1012,122
16,672
31,012
1966
8,63311,8422,8461,3891,531
26,271
10,2836,8431,3231,0993,589
23,137
49,408
1971
13,77222,198
5,4592,0751,909
45,413
12,8187,8072,0211,1264,752
28,524
73,937
Substantial immigration since World War II of Pacific Islanders,who now constitute approximately 1.5 percent of the total population,is the main reason for the growth of this group. At the 1936 censusthere were only 988 Pacific Islanders in New Zealand and there wereonly 2,159 in 1945. Their numbers had jumped to 14,340 by 1961, andby 1971 had more than tripled, to 45,413.
POPULATION COMPOSITION 57
The Pacific Islanders residing in New Zealand are mostly Samoans,Cook Islanders, Niueans and Tongans. In ethnic origins they are, invarying degrees, akin to the New Zealand Maori population butdespite this, are finding assimilation into New Zealand society moredifficult than other ethnic groups. This problem can be partiallyexplained by the fact that the majority of Polynesian immigrants areunskilled or semi-skilled workers, with limited education.
The Chinese and Indians are the next most important groups,providing 0.4 and 0.3 percent of the total population, respectively, in1971. The Chinese were the earliest group of non-Europeanimmigrants to New Zealand, arriving as early as the 1850's from thecoastal districts of Southern China, particularly from Canton. TheIndian community, on the other hand, has been built up largely sinceWorld War I, most permanent residents being related Hindus fromBombay and its vicinity. The geographic distribution of these minoritygroups tends to be one of concentration in the larger urban areas. MostPacific Islanders settle in the two principal urban centres: Aucklandand Wellington.
3.8 RELIGIOUS DENOMINATIONSThe parts played by certain churches in the early settlement of New
Zealand, the loyalty of settlers to the faiths of their homelands and thesubsequent loyalty of their descendants to these faiths, have led to fourChristian denominations holding a prédominent position in NewZealand since the early days of the colony. These four — in order ofnumbers of adherents — are the Anglican, Presbyterian, RomanCatholic and Methodist churches. Early statistics do not includeMaoris, but of the 256,393 Europeans enumerated at the 1971 census,87.1 percent belonged to one of these four churches. A century later, in1971, the same four churches received the support of 73.8 percent ofthe New Zeland population.
Figure 3.3 compares the proportion of New Zealand's populationwithin the major religious professions in 1871 and 1971. This diagramshows that the adherents to the Roman Catholic church increasedslightly from 13.9 percent to 15.7 percent of the total populationduring the period. The corresponding decrease in the proportion of thetotal population belonging to the Anglican, Methodist andPresbyterian churches reflects the emergence of minority religiousgroups. Table 3.14 affords some evidence that a substantial part of thedecrease in support for these other three main churches occurredduring the 1960's.

58 THE POPULATION OF NEW ZEALAND
zo
o0-
oo
= o
£ ;: ~
IU Ui o .
u.O
etO
oo.

POPULATION COMPOSITION 59
TABLE 3.14 MAJOR RELIGIOUS PROFESSIONS:NUMBERS OF ADHERENTS, 1961-1971
Religious Profession:
Anglican (Church of England)PresbyterianRoman Catholic (including Catholic
undefined)MethodistBaptistProtestant (undefined)Christian (undefined)RatanaLatter Day Saints (Mormon)BrethrenSalvation ArmySeventh Day AdventistJehovah's WitnessNo religion (so returned)Object to stateOthers (incl. not specified)
Totals
Anglican (Church of England)PresbyterianRoman Catholic (including Catholic
undefined)MethodistBaptistProtestant (undefined)Christian (undefined)RatanaLatter Day Saints (Mormon)BrethrenSalvation ArmySeventh Day AdventistJehovah's WitnessNo religion (so returned)Object to stateOthers (incl. no specified)
Totals
Adherents at Census
1961
835,434539,459
364,098173,83840,88645,10012,13023,12617,97825,76415,4548,2205,944
17,486204,056
86,011
2,414,984
1966
901,701582,976
425,280186,26046,74846,09021,54827,57025,56423,13917,7379,5517,455
32,780210,851111,669
2,67fi,919
1971
895,839583,701
449,974182,72747,35037,47533,18730,15629,78525,76819,37110,47710,31857,485
247,019201,999
2,862,631
Proportion of Total Population
34.622.3
15.17.21.71.90.51.00.B1.10.60.30.20.78.43.6
100.0
(Percent)33.721.8
15.97.01.71.70.81.01.00.90.70.40.31.27.94.2
100.0
31.320.4
15.76.41.71.31.21.11.00.90.70.40.42.08.67.1
100.0
NOTE: Where religious affiliation is clear, adherents using different des-criptive terms are grouped together. For example, Anglican, Church ofEngland, Anglo-Catholic, and Church of the Province of New Zealandare all among the recognised terms used by adherents of the AnglicanChurch.
While the numbers of Anglicans and Methodists decreased betweenthe censuses of 1966 and 1971, none of the other nine churches withmore than 10,000 adherents experienced similar declines in numbers ofadherents. Relative support for all of the four main churches declinedbetween 1966 and 1971. Together they claimed 73.8 percent of NewZealand's total population in 1971, compared with 78.4 percent in 1966
60 THE POPULATION OF NEW ZEALAND
and 79.2 percent in 1961. Six of the seven other major churchesmaintained a constant proportion and one, the Ratana Church,increased its following from 1.0 percent in 1966 to 1.1 percent in 1971.This church has predominantly Maori adherents: 27,460 of its 30,156members in 1971 coming from this group.
Some churches have their greatest numbers of adherents in certaingeographical areas. This is primarily a reflection of the historical factthat certain areas of New Zealand were originally colonised as religioussettlements: in some areas the missionaries of one particular churchpredominated. For example, the statistical areas of Canterbury,Marlboróugh, Nelson (South Island) and East Coast (North Island)are traditionally Anglican while Otago and Southland (South Island)are predominantly Presbyterian. The strongest Roman Catholic areais Westland (South Island), while Taranaki and Northland (NorthIsland) are strong Methodist areas.
Two other religious professions — the Ratana church and theLatter Day Saints church — both have predominantly Maori supportand this is reflected in the areal distribution of their members.
3.9 EDUCATIONLiteracy is an almost universal characteristic of the New Zealand
population as a result of education at all levels being available withgenerally equal opportunity. Education for all children between theages of 5 and 15 years is compulsory and the Education Act 1964provides for free secular education in state primary and secondaryschools. Tertiary education is provided under the Universities Act1961 with the government providing bursaries to students according totheir secondary school qualifications. In New Zealand, the centraladministrative body directing education at all levels is the Departmentof Education.
The post-World War II years have seen rapid expansion within theeducation system. The rise in primary school rolls reflects populationgrowth within the appropriate age groups. Large increases insecondary school and university rolls during the 1960's were also due inpart to the movement of the 'baby boom' population cohorts into theappropriate age-groups. There was, however, a marked tendency formore pupils to remain longer at secondary school and, also, tosubsequently undertake tertiary education.
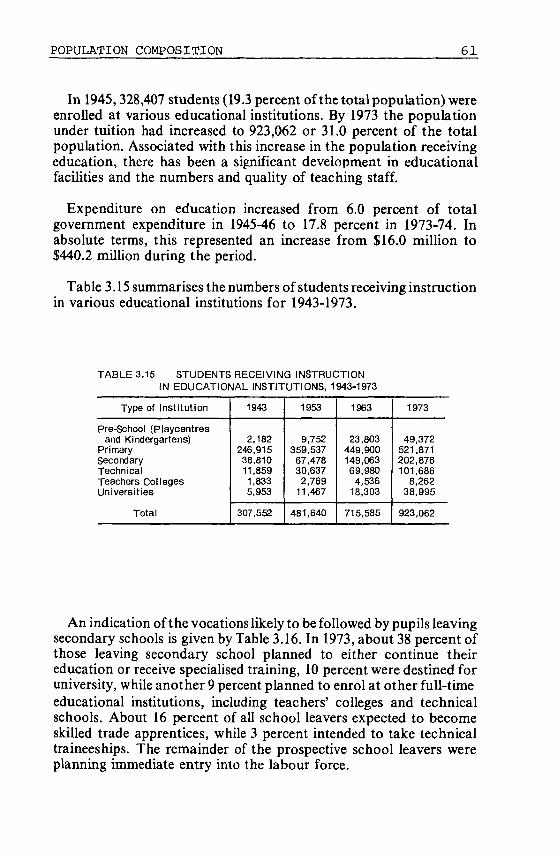
POPULATION COMPOSITION 6 1
In 1945,328,407 students (19.3 percent of the total population) wereenrolled at various educational institutions. By 1973 the populationunder tuition had increased to 923,062 or 31.0 percent of the totalpopulation. Associated with this increase in the population receivingeducation, there has been a significant development in educationalfacilities and the numbers and quality of teaching staff.
Expenditure on education increased from 6.0 percent of totalgovernment expenditure in 1945-46 to 17.8 percent in 1973-74. Inabsolute terms, this represented an increase from $16.0 million to$440.2 million during the period.
Table 3.15 summarises the numbers of students receiving instructionin various educational institutions for 1943-1973.
TABLE 3.15 STUDENTS RECEIVING INSTRUCTIONIN EDUCATIONAL INSTITUTIONS, 1943-1973
Type of Institution
Pre-School (Playcentresand Kindergartens)
PrimarySecondaryTechnicalTeachers CollegesUniversities
Total
1943
2,182246,91538,81011,8591,8335,953
307,552
1953
9,752359,53767,47830,6372,769
11,467
481,640
1963
23,803449,900149,06369,980
4,53618,303
715,585
1973
49,372521,871202,876101,686
8,26238,995
923,062
An indication of the vocations likely to be followed by pupils leavingsecondary schools is given by Table 3.16. In 1973, about 38 percent ofthose leaving secondary school planned to either continue theireducation or receive specialised training, 10 percent were destined foruniversity, while another 9 percent planned to enrol at other full-timeeducational institutions, including teachers' colleges and technicalschools. About 16 percent of all school leavers expected to becomeskilled trade apprentices, while 3 percent intended to take technicaltraineeships. The remainder of the prospective school leavers wereplanning immediate entry into the labour force.
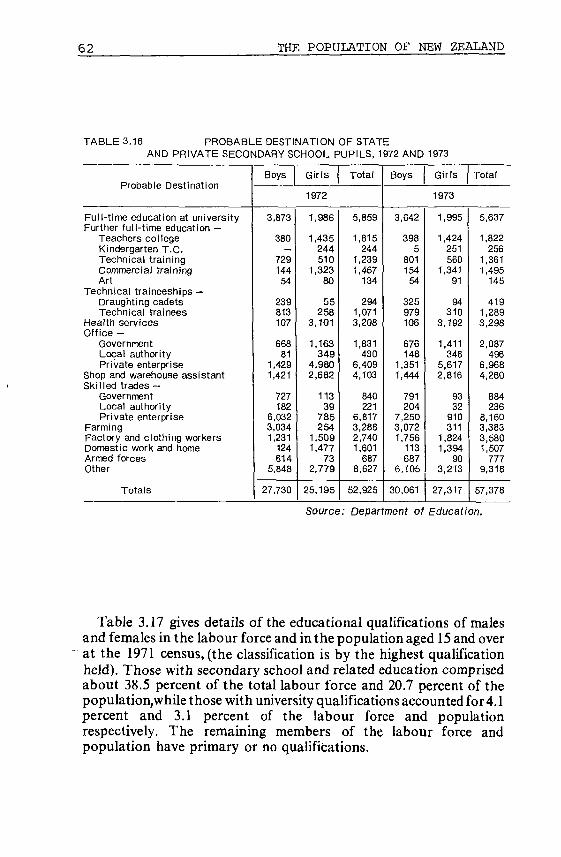
62 THE POPULATION OF NEW ZEALAND
TABLE 3.16 PROBABLE DESTINATION OF STATEAND PRIVATE SECONDARY SCHOOL PUPILS, 1972 AND
Probable Destination
Full-time education at universityFurther full-time education -
Teachers collegeKindergarten T.C.Technical trainingCommercial trainingArt
Technical traineeships —Draughting cadetsTechnical trainees
Health servicesOffice -
GovernmentLocal authorityPrivate enterprise
Shop and warehouse assistantSkilled trades —
GovernmentLocal authorityPrivate enterprise
FarmingFactory and clothing workersDomestic work and homeArmed forcesOther
Totals
Boys
3,873
380-
729144
54
239813107
66881
1,4291,421
727182
6,0323,0341,231
124614
5,848
27,730
Girls
1972
1,986
1,435244510
1,32380
55258
3,101
1,163349
4,9802,682
11339
785254
1,5091,477
732,779
25,195
Total
5,859
1,815244
1,2391,467
134
2941,0713,208
1,831430
6,4094,103
840221
6,8173,2882,7401,601
6878,627
52,925
Boys
3,642
3985
801154
54
325979106
676148
1,3511,444
791204
7,2503,0721,756
113687
6,105
30,061
1973
Girls
1973
1,995
1,424251560
1,34191
94310
3,192
1,411348
5,6172,816
9332
910311
1,8241,394
903,213
27,317
Total
5,637
1,822256
1,3611,495
145
4191,2893,298
2,087496
6,9684,260
884236
8,1603,3833,5801,507
in9,318
57,378
Source: Department of Education.
Table 3.17 gives details of the educational qualifications of malesand females in the labour force and in the population aged 15 and overat the 1971 census, (the classification is by the highest qualificationheld). Those with secondary school and related education comprisedabout 38.5 percent of the total labour force and 20.7 percent of thepopulation,while those with university qualifications accounted for 4.1percent and 3.1 percent of the labour force and populationrespectively. The remaining members of the labour force andpopulation have primary or no qualifications.
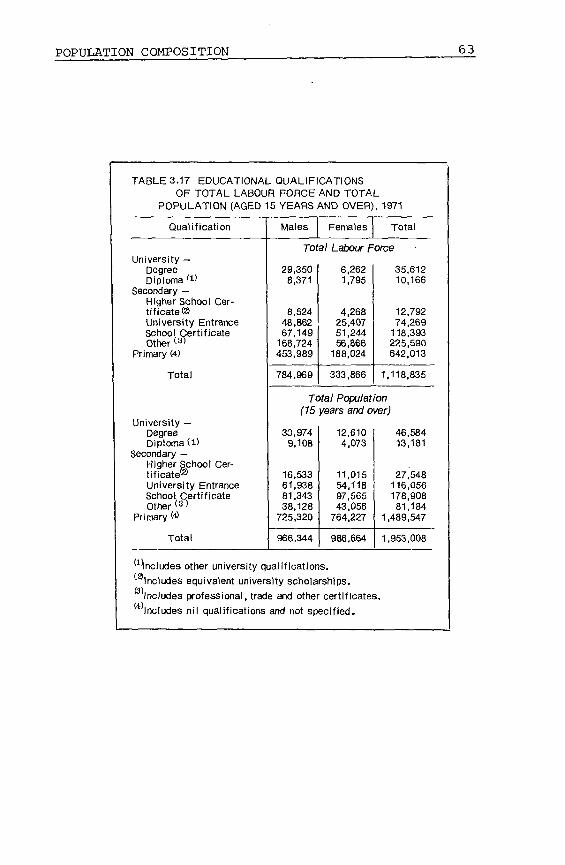
POPULATION COMPOSITION 63
TABLE 3.17 EDUCATIONAL QUALIFICATIONSOF TOTAL LABOUR FORCE
POPULATION (AGED 15 YEARS
Qualification
University —DegreeDiploma ' 1 '
Secondary —Higher School Cer-tificate®University EntranceSchool CertificateOther <3>
Primary (4)
Total
University —DegreeDiploma ( i )
Secondary —Higher School Cer-tificate®University EntranceSchool CertificateOther(3 >
Primary M
Total
Males
AND TOTAL<\ND OVER)
Females
, 1971
Total
Total Latour Force
29,3508,371
8.52448,86267,149
168,724453,989
784.969
6,2621,795
4,26825.40751,24456,866
188,024
333,866
35,61210,166
12,79274,269
118,393225,590642,013
1,118,835
Total Population(15
30.9749,108
16.53361,93881,34338,128
725,320
966,344
years and over)
12,6104,073
11,01554,11897,56543,056
764.227
986,664
'^includes other university qualifications.(3lncludes equivalent university scholarships.
Includes professional, trade and othe
46,58413,181
27,548116,056178,90881,184
1,489,547
1,953,008
certificates.Includes nil qualifications and not specified.


CHAPTER IV
REGIONAL POPULATION GROWTH
AND DISTRIBUTION
4.1 INTRODUCTIONVariations in population growth within the geographic areas of any
country and its various types of communities (urban, metropolitan andrural) are due to differences in the components of growth viz., births,deaths and migration (both internal and external in the New Zealandcontext), experienced. These components in turn are influenced byvarious socio-economic, geographic, cultural and political factors. Inthis chapter an attempt has been made to investigate, briefly, sub-national variations in the growth and distribution of the New Zealandpopulation over time and to describe these in terms of the abovecomponents. Special emphasis is given to the phenomenon ofurbanisation and the settlement areas of external immigrants. Thegrowing importance attached by New Zealand to regionaldevelopment policies indicates the level of concern about regionalpopulation growth and distribution, and urbanisation.
4.2 TRENDS IN REGIONAL POPULATION DISTRIBUTIONAND GROWTH
In pre-European days and until 1860, the larger portion of NewZealand's population was in the North Island (one of the country's twomain islands). The South Island was the more densely populated from1860 until 1900 because the discovery of rich gold fields in Otago in the1860's and the relatively easy availability of land led to considerablepopulation inflows. After 1900, when the populations of the twoislands were roughly equal, the North Island went ahead steadily.Many economic, social and political factors contributed to thischange. Government opened up new lands in the North Island suitablefor dairy farming and available in small lots. This in turn led toimproved communications, including the completion of the maintrunk railway line from Wellington to Auckland in 1908. On the otherhand, the South Island suffered from both the exhaustion of itsgoldfields and from the development of industry in those North Islandcentres with large populations and easy access to world shippingroutes.
Sig3

66 THE POPULATION OF NEW ZEALAND
By 1926, the proportion of New Zealand's population living in theNorth Island had increased to 63.4 percent, while that for the SouthIsland had dropped to 36.6 percent. Since then the gap has widenedfurther. Between 1926 and 1971 the population of the North Islandincreased by 130 percent, from 892,679 to 2,051,363, while that for theSouth Island increased by only 57 percent from 515,460 to 811,268 (seeTable 4.1). The North Island not only had a higher rate of naturalincrease, and attracted a disproportionately large number ofimmigrants but it also gained substantially from the general drift ofpopulation from the South Island to the North Island. In 1971,72 outof every 100 people in New Zealand were located in the North Islandand only 28 out of every 100 in the South Island. Figure 4.1 provides agraphical indication of the changing geographical distribution of theNew Zealand population.
The drift northward was complemented by a drift from rural areasand small population centres to the large urban centres (notablyAuckland, Christchurch and Wellington) which provided bettereconomic and employment opportunities. There is evidence that thesephenomena occurred in both the North and South Islands as Tables4.1, 4.2 and 4.3 illustrate. In the North Island, the relative increase inpopulation in the northern part (which corresponds with the statisticalareas of Northland, Central Auckland, South Auckland-Bay of Plentyand East Coast) during each intercensal period since the 1926 census,has been at least 50 percent higher than that in the southern part (seeTable 4.1). Taking the 46-year period (1926-71) as a whole, thepopulation of the northern half of the North Island grew by 169percent, compared with a 86 percent increase in the population of thesouthern half of the North Island.
In 1971, the northern part contained 1,264,232 people or 61.6percent of the total population of the North Island compared to 58.2percent in 1956, and 52.6 percent in 1926. Its share of total NewZealand population increased from 37.7 percent in 1945 to 44.2 percentin 1971.
Similarly, in the South Island, during 1926-71, the overallpopulation increase in the Marlborough, Nelson and Canterburystatistical areas exceeded that in Otago, Southland and Westland (seeTable4.1). In 1971 Canterbury statistical area alone contained 398,830people or 49.2 percent of the total population of the South Island,compared with 46.1 percent in 1956 and 42.4 percent in 1926.

REGIONAL POPULATION GROWTH AND DISTRIBUTION 67
o
oa.
x S:o —
h S >_¡2 - £X .. ujO so ej
i ï s:OU M- < =3OC M
o ïlu uo
etao
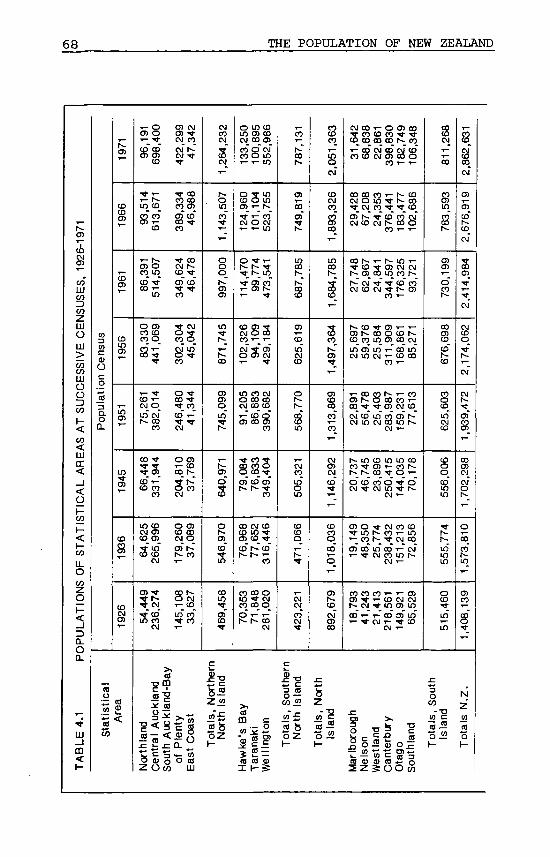
6 8 THE POPULATION OF NEW ZEALAND
m
SCM
en
CO
JSU
SE
LUÜ
LU
7ñcoLUCIO
AS
A
TÍ
LU
>T
ICA
LA
TIS
r-co
LLO
O
û_r\CL
* -
TA
BL
E
(0
Den
sio
nul
atP
opti
ca
l
oco
y—
coO)
• * " *
CD
a>
195
in
CO
s
<n
cñ o* - TfCD COS) en
co
¡ñ CD
S J 2
y- t -OJ Oco mCD Tf00 y-
m
o enco coco o
S i
CM Om CMr~ co
co
CO Tf
T f OJ
CD y-CÛ co
co
625
996
CM
OJ TfTf f»Tf CMTf COin coCM
klan
dan
d-B
ay
H*72<3
Nor
th la
Ce
ntr
al
Sou
th A
OJÇM
CM COCM N-CJ TfTf
T f COco coCO O)
oj coCO Tfco
Tf COCMI--CO TfOJ CDTf TfCO
Si?co oST?co
O Tf00 TfTf COCD y-
o eni - coco f-Tf r-o coCM
O OJco çpCM 3OJ r--r— co
ço r^O CMi - com coT f CO
c S
of
Pie
Ea
st C
e
CMCOCM
264
y~
507
S?
ooo
enOJ
745
871
099
745
, _
OJ
640
0/6
546
CO
mTfOJCOT f
Nort
hern
Isla
nd
«"£o hOZH
o in coin OJ coCM CO OJCO O CMco o inT - T - m
99/frO
l096
Tf y- COCM O CMi - y- in
470
774
541
Tf OJ coT - OJ N.
326
109
184
CM Tf OJO OJ CMy- Tf
in co CMO CO COCM CO CO
OJ CO OJco
Tf COTfop oo o
en co en
CO CM COCD m Tf
co r~ cor~- r- y-
co
353
848
020
O T- y-t*- r~- co
CM
a— o
Haw
ke's
Tar
anak
We
llin
gt
CO
787
819
OJTfr-
inCO
S61
962
577
056
8
_CMCO
505
066
471
^_CMOJ
COOJ
Sou
ther
nIs
lan
d
S bOZH
bzto
to
To
t
SCO
051
CM
326
SCO
' "
incor-T fCOco_
364
497
869
1,31
3
CMOJCM
1,14
603
61,
018
<TJ
CD
OJCO
?SV)
CM CO i - OTf co co coCO CO
CO S
80282fr
CJJ h -CM CO
T f CO
r- enI > - CMCM CO
697
376
oo coCM COCM OJ
co
m iCO T fTf COCM N-
co
5 OJ
OJTf
182
477
coTfco
106
686
Sñ
CM
*~
OJco in co h-Tf TfCM Tf
co
Tf OJco oin eft
i n 05 in T-CM i n CM y-
co
y~ COen r-CO Tf
?MS
t - inCO Tf
O COCM Tf
SETf O)
25 283
co mO) T-
23 250
OJ O Tf CMTf in h- coy- co h- TfOJ OO
co co0) TfI-- CM00 y-y- Tf
)ugh
Mar
lbor
cN
els
on
m coCM CO
CM
CO y-
i Sy- COCM y-
CM
> ,
<nr~-
861
168
231
159
in
8
144
9327
185
613
77
CO
70
CO CO
CM 0 0
151
OJTf
Wes
t Ian
Ca
nte
rbO
tago
CM
r-
rnCM
in
•5
Sou
thla
r
Sou
th
SCM
811
593
Sh-
gr -
OCO
8699/9
603
929
co00
556
774
555
0CO
Tfin
m
»?
To
t
CO
CO
631
862
CM
919
76
CD
S05T fLfr'S
290fr/L
'
CM
472
1,93
900OJCM
1,70
281
01,
573
05co
sT f
M.Z
.
(0
to
To
t

REGIONAL POPULATION GROWTH AND DISTRIBUTION 69
T3
O1
LU
CD<t1-
ctuÜ
nCDtn
tu
oCDQbCDcoCD
ëo, •
to
Q .
CL
tati
stic
a
C/J
971
T j
coen
971
•
en
996
CDen
_CD
en• ,
CD
men
CDmen',"i nenY—
|
inen
iin
194
i n
en•
tn
193
tnCOCD
' ,
192É
Are
a
CD
CD•"-
enCM
CM
co
r-.
t n
i nO)
coco
coen7—
CD
CO CD
h -
O1
coco
coCM
h_
CO
• a
hlar
o•
£-
7 ~
i n
m'
T -
i n
co
CM
CD
CM
•nc
JO2¿o
<
rai
r*CDO
Bay
uckl
and-
r
nco
o
en
mco
•o-7 -
7 —
h -
coo
coo
T -
CM
m co•
co enCMCJ
cooCM
CO
•a-
m
CO
mCD
coY -
coco o
nty
Pie
,o
w
ocntoLU
t~
ther
als
, N
or
CO
enco
tD
o
TTT —
Tf
• • "
O
h -
CM
CD
CMh-
mCD
-ac
ort
h Is
la
ozi-
ir T coen o coco ^r en
CO C\J CD
CD o in
1
CM CO CO
en T- oT —
en o coT- CD o• • " " '
r~
CM co en
CM CO O)
CO T*" COi n co 7 -
h~ T - -«i-
CM T - O
1
TT T - CO
en co CM
tom c,„ •-. o
ke'£
nak
ngt
S 2 =(Ö ctJ CD
11- 5
CI
ther
als
, S
ou
otnCO
oi n
oen
CJ)
m
ooT~
COCM
COh-
CO7 -
c
ort
h Is
la
ozh-
CO
enCM
co
CM7 ~ *
i n
CM7 ~
O
1
CO
• t f
coCM
O
SZ
als
, N
orla
nd
i -
mCD
m
co
om
coCM•
o
coco
CD7 -
)ugh
b
ent nCD
CM
CO
O
t n
m
CO
oCM
coco
1
CM
h -
ototl)
cot n
co
1
oCM
1
enCM
1
h_
o
coCD
COh~
1
O
land
tnm
m en
CO CM
coCMCO
o -<r CD
co o
1
a i-CD T}-
m TTO -fl-
CO oen co
•>f CD
co o
O h-in TT
1
T - en
en o
CD O
CO i SO U
CO
CD
m
enen
enen
CD
o
h_
ro
1
CM7 -
• a
jo
co
.c
als
, S
ouT
ot
i n
i n
co
co
eni—
tM
CO
i n
CM
coh-
land
m
cocoo
enCD
coo
,__
7 -
T -
CM1
enco
CM
co
co7 -
als
N
.ZT
ot
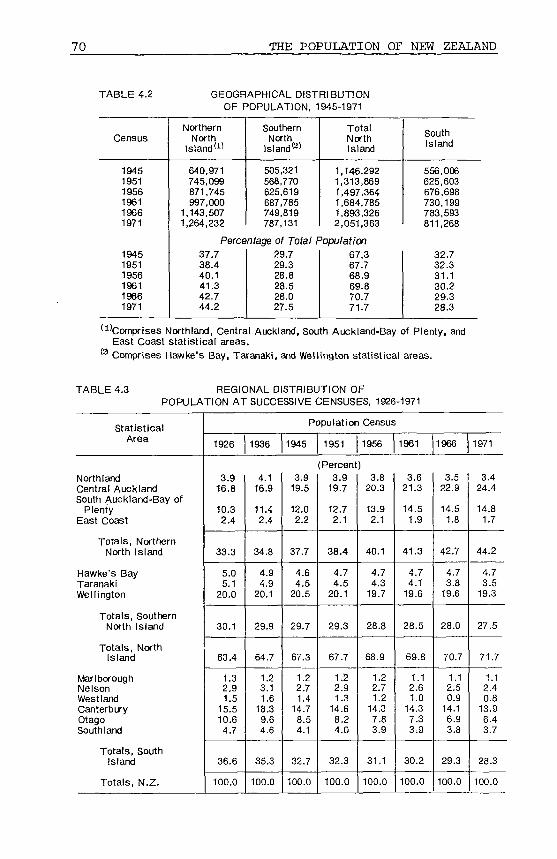
70 THE POPULATION OF NEW ZEALAND
TABLE 4.2 GEOGRAPHICAL DISTRIBUTIONOF POPULATION, 1945-1971
Census
194519511956196119661971
194519511956196119661971
NorthernNorth
Island(1)
640,971745,099871,745997,000
1,143,5071,264,232
SouthernNorth
lsland te)
505,321568,770625,619687,785749,819787,131
TotalNorthIsland
1,146,2921,313,8691,497,3641,684,7851,893,3262,051,363
Percentage of Total Population37.738.440.141.342.744.2
29.729.328.828.528.027.5
67,367.768.969.870.771.7
Cm ithooutnIsland
556,006625,603676,698730,199783,593811,268
32.732.331.130.229.328.3
(^Comprises Northland, Central Auckland, South Auckland-Bay of Plenty, andEast Coast statistical areas.
® Comprises Hawke's Bay, Taranaki, and Wellington statistical areas.
TABLE 4.3 REGIONAL DISTRIBUTION OFPOPULATION AT SUCCESSIVE CENSUSES, 1926-1971
StatisticalArea
NorthlandCentral AucklandSouth Auckland-Bay of
PlentyEast Coast
Totals, NorthernNorth Island
Hawke's BayTaranakiWellington
Totals, SouthernNorth Island
Totals, NorthIsland
MarlboroughNelsonWest I andCanterburyOtagoSouthland
Totals, SouthIsland
Totals, N.Z.
1926
3.916.8
10.32.4
33.3
5.05.1
20.0
30.1
63.4
1.32.91.5
15.510.64.7
36.6
100.0
1936
4.116.9
11.42.4
34.8
4.94.9
20.1
29.9
64.7
1.23.11.6
18.39.64.6
35.3
100.0
Populatior
1945
3.919.5
12.02.2
37.7
4.64.5
20.5
29.7
67.3
1.22.71.4
14.78.54.1
32.7
100.0
1951
(Percent3.9
19.7
12.72.1
38.4
4.74.5
20.1
29.3
67.7
1.22.91.3
14.68.24.0
32.3
100.0
Census
1956
)3.8
20.3
13.92.1
40.1
4.74.3
19.7
28.8
68.9
1.22.71.2
14.37.83.9
31.1
100.0
1961
3.621.3
14.51.9
41.3
4.74.1
19.6
28.5
69.8
1.12.61.0
14.37.33,9
30.2
100.0
1966
3.522.9
14.51.8
42.7
4.73.8
19.6
28.0
70.7
1.12.50.9
14.16.93.8
29.3
100.0
1971
3.424.4
14.81.7
44.2
4.73.5
19.3
27.5
71.7
1.12.40.8
13.96.43.7
28.3
100.0

REGIONAL POPULATION GROWTH AND DISTRIBUTION 7 1
In 1926 the largest statistical areas, in terms of population size, were(in descending order) Wellington, Central Auckland, Canterbury,Otago and South Auckland-Bay of Plenty, all with populations of over100,000 people. In the 45 years to 1971, Central Auckland statisticalarea displaced Wellington statistical area as the most populous and, atthe 1971 Census, it contained 698,400 people or roughly one-quarter ofthe country's population of 2,862,600. In 1926, the correspondingfigure was 16.8 percent. Similarly, the South Auckland-Bay of Plentystatistical area, which in 1971 contained 14.8 percent of the total NewZealand population compared with 10.3 percent in 1926, overtookboth Canterbury and Otago in size. The overall increase in thepopulation of these two statistical areas, Central Auckland and SouthAuckland-Bay of Plenty, during 1926-71 (over 190 percent) was morethan twice that for any other statistical area. Finally, all but these twostatistical areas recorded decreases in their proportions of totalpopulation between 1926 and 1971. Westland statistical area hasshown an absolute decrease in its population since the 1956 census.
4.3 COMPONENTS OF REGIONAL POPULATION GROWTHThe foregoing analysis has shown that the rates of population
growth varied considerably among statistical areas, as well as withineach statistical area, from one intercensal period to another. Theirvariations are the result of a complex interplay of a variety ofdemographic processes, such as the variations in the natural increase,changes in the level and direction of internal migration, and the directand indirect effects of external migration. This section examines theindividual roles of natural increase and net migration (both internaland external) in the regional growth and geographical redistributionof the New Zealand population between 1956 and 1971.
Table 4.4 shows large areal variations in the level of natural increaseas well as in the levels and directions of net migration. During theintercensal period 1956-1961, for instance, the rate of natural increasevaried markedly from 129.07 per 1,000 mean population in the SouthAuckland - Bay of Plenty statistical area to only 63.80 per 1,000 inOtago statistical area. It is notable that statistical areas like Northland,South Auckland - Bay of Plenty, East Coast and Southland — all withfarming backgrounds and relatively large rural populations — hadmuch higher fertility (and natural increase) than the remaining nineareas. These differences in fertility have somewhat narrowed in morerecent years. This may be attributed to the decline in fertility during the1960's, which was relatively larger in areas which initially had highlevels.

72 THE POPULATION OP NEW ZEALAND
ceoLLLU
LUceOZ
zO
LA
TI
PO
PU
QZ
n
f -rn*7
• • -
GR
AT
IA
RE
AS
E,
NE
T M
C/3
LUenoz_ ]
<
H
Z
LLn
RA
TE
S
T f
AB
LE
4
l -
T 1
ST IC
AL
<
rn
iod)
CDCL
"5ceuÜ
B
CD
r-
o
ati
on
Fea
n P
opul
o.,_!_CD
CL
CO
Brr
- g
CDCL
erce
ns
c
fien
CDcoen
¡Cd
Per
COCO
CD
CD
Int
CDCO
1961
-1S
Per
iod
CO
CDoCDc
O5
i
CD
Pop
latic
1 =
CO
atu
r
z
2J £O_ —
Q.-SS
CM
o
o
gra
ti
05COCO9JO
U
—
C CD
Ü
co
S
Nat
ura
Pop
u-la
tio
n
CM
—> .-
—
U
CO
ica
l A
rea
CO
Sta
ti
CDCO
Incr
ea
in-
cre
ase
o
- £• 5
05CO
CD
CMCMCOCM
m
129
CO COCO
-46
i nCJ
inr-
m
m
T —
S
enO5
coco
O5h~i n
in CMCD00
1
Sr-CO
CM
o• * —
CO
inTf
h- O
CD côco m
(MT —
m
1
i —
CMCO
05 en
ort
hla
nd
z
i n
¡C
klan
de
ntr
ai A
u
and-
Bay
of
J É
auth
Aue
co
roC\l
S
mCM
O5
enT f
8
mT f
^ .
Ü
m'*"
i n
-64
coCM
pi
CD
o
m oen*-
CM
in
105
145.
17
n
en
r~-oenCM
Ple
nty
i n
cocoI
ai
31.3
8
<n
ocoI
T fi n
ast
Coa;
LU
Nor
ther
n
co
To
ta
COCM
100
CDTf
COOl
coCO
co
rncoCDco
ocooin
59
coco
134.
05
CJ5T f
co'CO
eni n
fe
sta
nd
—
Nor
th
CM O
s™I
Tf inCO Tf
co coco coi - CD'r~ co
CM TfCD CM( ^ C0CO i -
ocoTfin
TfTf
-14
co
cdCD
o
oo
in co c-CD CM
^ C D
1
COCOCBTf
Tf COco r -
112.
0358
.44
1 - TfU l ' -
CM
CM
coTfO5
98.2
7
i nen
cD in öCOCM
1
CM CO
m min coh- co
CO
m
aw
ke's
ara
na
ki
X H
CM
coco
ell
ing
to
mi n
coTf
O5cooC\J
I
i nen
S
ocococo
cooco'
CMCM
OCO
94.6
6
, _
co'
i n
r-
Sou
ther
ns
land
co —
To
taN
ortr
No
rth
ro
Oco
h-coCD
co
"
coi nCO
Tfi n
CM'CO
§S
117.
80
roc jCOCM
TfO5CO
« - a
To
taIs
lan
mo)
enr-m coOJCO
CM
I
CMTfO5C0O5h-CDTf
h-COr*-1—
coinmco
in col > - CO
com
1
CMCX3
76.7
558
.70
CD inT f COcd en
| |
T-inCM CO
Seo
O)
o
II
oCM
S1
CJ
-109
CDTf
Sm
T
en
i n
COy—
CO T fen oco m
co1
c~- coco in
Tf co oin TfI I
co ai T-i n
coin
co co05 m
CO CD 05co r- CMCO O5 r-co
CO C35O
COCO
I
CMCM
2
-29
.47
CM
O
'l
TT
est
land
co en
en t'-CM O Tf
CM
ss
en CM
1
m CMco coco coin co
99.5
843
.25
94.4
2
m coin CD
CM O COCO CM
T fT f
co
ante
rbur
|
o mco oco coCD 85
tag
oou
thla
nd
Sou
th
1/3
To
ta
TfCO
T f
-20
CDT f
T f
mn
Si n
TfCD
76.0
6
enT f
T f
eni n
• o
Isla
n
i noCD
T fT f
1
O5T f
§
COCOCMO
OCDTfCM
COCM
CO
105.
00
CMO
CM
COenCO
co
Z
co
To
ta
eat
O
I
min
us n
ir
of
birt
hs
f
§
E
otal
min
us 1
i mm
i gra
ti or
al
oY-
,-*

REGIONAL POPULATION GROWTH AND DISTRIBUTION 7 3
In both the North and South Islands, and all statistical areas exceptCentral Auckland and Westland, natural increase was the majorcontributor to population change during each of the three intercensalperiods (1956-1961, 1961-1966 and 1966-1971) considered here. In theCentral Auckland statistical area, net in-migration contributedroughly 55 percent of the total population growth during 1956-1971,and this large migration contribution helped produce a total rate ofgrowth which was nearly double the next highest rate of growth, thatfor the Wellington statistical area. In Westland statistical area, on theother hand, net migration losses outweighed the natural increaseduring each of the three intercensal periods, causing a net populationdecline.
Recent data suggest that this declining trend might now have beenhalted. In another six statistical areas — Northland, East Coast,Taranaki, Marlborough, Otago and Southland — net migration madea negative but generally small contribution to population changeduring the intercensal periods 1956-1961 and 1961-1966. During theintercensal period 1966-1971, which was affected by the economicrecession, all areas except Central Auckland, Canterbury andMarlborough experienced net migration losses. In the Taranaki andOtago statistical areas these outflows outweighed the natural growth,and they joined Westland in having a population decline during thisperiod.
4.4 REGIONAL POPULATION DENSITYThe population density, or the relation of population to area,
depends not only on the size of the population and on economic andsocial factors such as industrialisation, residential development, andcommunications, but on the relatively immutable elements of climateand geography. Changes in the density of New Zealand and its twomain islands are set out in Table 4.5 below. The density of the NewZealand population doubled between 1874 and 1901, when a density of3.0 persons per square kilometre was recorded. It doubled again to 6.3persons per square kilometre in 1945, and had reached 10.7 persons persquare kilometre by 1971.
Differences in population density within New Zealand are due partlyto urbanisation, partly to the population drift from the South to theNorth Island and partly to natural increase rates. The greaterpopulation density of the North Island not only reflects its greaterpopulation but also its smaller area.
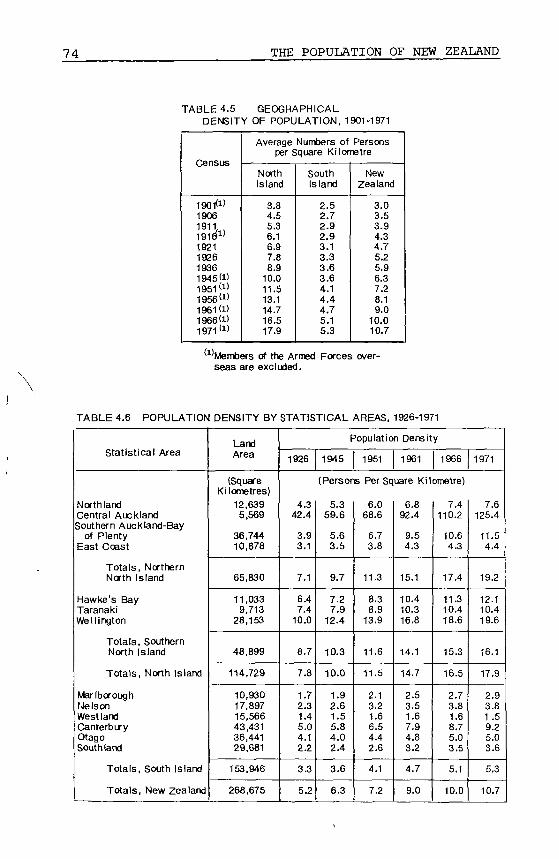
74 THE POPULATION OF NEW ZEALAND
TABLE 4.5 GEOGRAPHICALDENSITY OF POPULATION, 1901-1971
Census
1901<l>19061911, ,191 a1 '1921192619361945(D1951 &>1956«1)1961(D1966(D1971 (D
Average Numbers of Personsper Square Kilometre
NorthIsland
3.84.55.36.16.97.88.9
10.011.513.114.716.517.9
SouthIsland
2.52.72.92.93.13.33.63.64.14.44.75.15.3
NewZea land
3.03.53.94.34.75.25.96.37.28.19.0
10.010.7
(l)Members of the Armed Forces over-seas are excluded.
TABLE 4.6 POPULATION
Statistical Area
NorthlandCentral AucklandSouthern AucK land-Bay
of PlentyEast Coast
Totals, NorthernNorth Island
Hawke's BayTaranakiWellington
Totals, SouthernNorth Island
Totals, North Island
Marlborough1 Je Is onWest landCanterburyOtagoSouthland
Totals, South Island
Totals, New Zealand
DENSITY BY
LandArea
(SquareKilometres)
12,6395,569
36,74410,878
65,830
11,0339,713
28,153
48,899
114,729
10,93017,89715,56643,43136,44129,681
153,946
268,675
STATISTICAL AREAS, 1926-1971
Population Density
1926
4.342.4
3.93.1
7.1
6.47.4
10.0
8.7
7.8
1.72.31.45.04.12.2
3.3
5.2
1945
(Persor
5.359.6
5.63.5
9.7
7.27.9
12.4
10.3
10.0
1.92.61.55.84.02.4
3.6
6.3
1951
ts Per Sq
6.068.6
6.73.8
11.3
8.38.9
13.9
11.6
11.5
2.13.21.66.54.42.6
4.1
7.2
1961
uare Ki l
6.892.4
9.54.3
15.1
10.410.316.8
14.1
14.7
2.53.51.67.94.83.2
4.7
9.0
1966
ometre)
7.4110.2
10.64.3
17.4
11.310.418.6
15.3
16.5
2.73.81.68.75.03.5
5.1
10.0
1971
7.6125.4
11.54.4
19.2
12.110.419.6
16.1
17.9
2.93.81 .59.25.03.6
5.3
10.7

REGIONAL POPULATION GROWTH AND DISTRIBUTION 75
The North Island covers an area of 114,729 square kilometres or 43percent of the total area of New Zealand (268,675 square kilometres)and the South Island, 153,946 square kilometres or 57 percent of thetotal area. In 1874, the two islands had almost the same populationdensity but by the 1926 Census, the North Island had more than twiceas many persons per square kilometre (7.8 persons) as the South Island(3.3 persons). In 1961, its density was three times the latter — 14.7persons compared with 4.7 persons per square kilometre. Over the lastten years, the gap has widened further.
Table 4.6 shows the population density of New Zealand's statisticalareas from 1926 to 1971. Central Auckland has the highest populationdensity, and this has increased considerably over the period. Westlandis the only statistical area to show a decrease in population densityduring this time.
4.5 URBAN-RURAL POPULATION GROWTH ANDDISTRIBUTION
New Zealand follows the pattern common to many countries of theworld. The national population increases by about two percent a year,while the populations of most cities and sizeable towns increase at amuch greater rate, and some of the smaller towns and rural areas losepopulation. This latter drift is not just a recent phenomenon. In fact,even as far back as 1916 there was a noticeable rural to urban drift.However, the economic depression checked the urbanisation trendfrom 1926 to 1936 when a lack of employment opportunities in townsdeterred rural-urban flows and also some of the unemployed were sentto rural areas to do relief work. Table 4.7 shows the urban and ruralpopulations at selected censuses, while Figure 4.2 illustrates, ingraphical terms, the rural-urban drift.
TABLE 4.7
CensusVpflrT cal
192619511956196119661971
URBAN AND RURAL POPULATIONS,1926-1971
Urban(1)
Population
937,3041,406,5161,600,8081,840,2022,119,0852,328,876
Proportionot Total
Population
(Percent)
66.972.773.876.479.381.5
Rural<2>
Population
464,370527,078568,806569,217553,023528,609
Proportionof Total
Population
(Percent)
33.127.326.223.620.718.5
(1ljrban population has been defined as population in the 24 urbanareas plus that of all boroughs, town districts, townships andcountry towns with populations of 1,000 or over not within the24 urban areas.
<2) Rural population is the remainder of the population except personson shipboard, who are omitted from the tabulation.

76 THE POPULATION OF NEW ZEALAND
zo
oCL.
O
o S1- „
£ S £a
oc=3O

REGIONAL POPULATION GROWTH AND DISTRIBUTION 77
As can be seen from Figure 4.2, with 81.5 percent of the populationliVing in urban areas in 1971, New Zealand is now a highly urbanisednition. Although the farming industry constitutes a very importantsekment of New Zealand's economy, greater mechanisation, moremodern methods of farming, and the amalgamation of farms intolarger, more economical units have enabled great increases inproduction to be achieved without increasing the farm labour force.Consequently, employment opportunities in rural areas or in smalltowns close to rural areas have remained essentially limited, forcingmany young workers to go to larger urban centres to obtain jobs. Aswell as the attraction of better employment opportunities in the urbanareas there is the attraction of better social and cultural facilities and,in particular, better opportunities for education. Also,with improvedroads and other transport services, people can commute to the ruralareas from towns and so enjoy rural recreational facilities while stillworking in urban areas.
Table 4.8 shows the distribution of the New Zealand population bysize-group of centres (cities, boroughs, town districts and county townsare included), and illustrates the population shift from the smaller tolarger centres. The reasons for the movement of population from smalltowns to the larger towns and cities are basically the same as those forthe rural to urban shift. Also, because the larger centres offer a betterselection of jobs and social and cultural facilities, the majority ofoverseas immigrants settle in larger cities in preference to the smallertownships.
TABLE 4.8 DISTRIBUTION OF POPULATIONBY SIZE-GROUP OF CENTRE, 1926-1971
Size-groupof UrbanCentre
1 ,000- 2,4992,500 - 4,9995 , 0 0 0 - 9,999
10,000 - 24,99925,000 and over
Totals
Number of
1926
632311124
113
1961
4547342112
159
Centres
1966
4441342319
161
1971
4340352322
163
Proportion
1926
7.56.25.9
13.324.1
57.0
of TotalPopulation
1961 1966
(Percent)3.07.29.6
15.032.5
67.3
2.55.58.9
13.540.9
71.3
1971
2.45.08.8
12,844.6
73.6
As in other developed countries, the larger cities in New Zealand areexperiencing "mushroom-type" population growth. Populationincrease in the outer suburban areas is generally high while in the veryheart of the city either the population increase is very low or apopulation decline is being experienced.
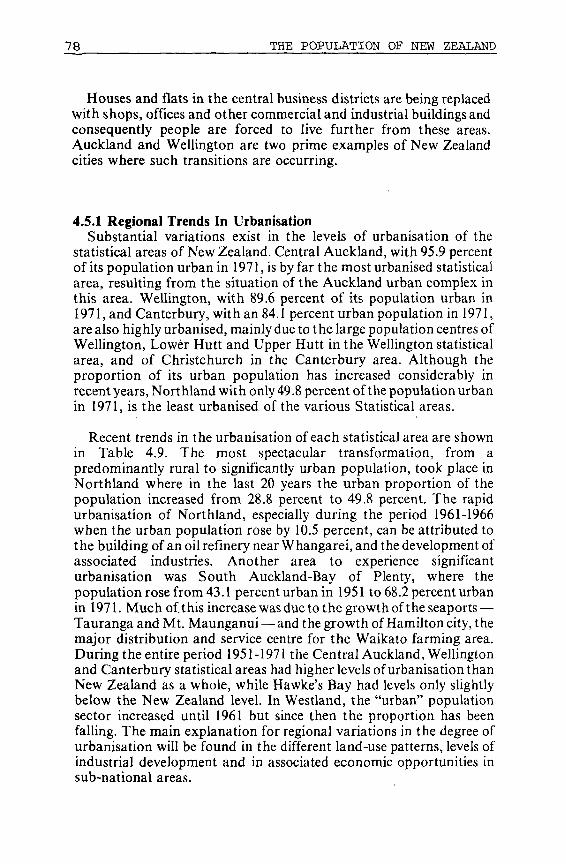
7 8 THE POPULATION OF NEW ZEALAND
Houses and flats in the central business districts are being replacedwith shops, offices and other commercial and industrial buildings andconsequently people are forced to live further from these areas.Auckland and Wellington are two prime examples of New Zealandcities where such transitions are occurring.
4.5.1 Regional Trends In UrbanisationSubstantial variations exist in the levels of urbanisation of the
statistical areas of New Zealand. Central Auckland, with 95.9 percentof its population urban in 1971, is by far the most urbanised statisticalarea, resulting from the situation of the Auckland urban complex inthis area. Wellington, with 89.6 percent of its population urban in1971, and Canterbury, with an 84.1 percent urban population in 1971,are also highly urbanised, mainly due to the large population centres ofWellington, Lower Hutt and Upper Hutt in the Wellington statisticalarea, and of Christchurch in the Canterbury area. Although theproportion of its urban population has increased considerably inrecent years, Northland with only 49.8 percent of the population urbanin 1971, is the least urbanised of the various Statistical areas.
Recent trends in the urbanisation of each statistical area are shownin Table 4.9. The most spectacular transformation, from apredominantly rural to significantly urban population, took place inNorthland where in the last 20 years the urban proportion of thepopulation increased from 28.8 percent to 49.8 percent. The rapidurbanisation of Northland, especially during the period 1961-1966when the urban population rose by 10.5 percent, can be attributed tothe building of an oil refinery near Whangarei, and the development ofassociated industries. Another area to experience significanturbanisation was South Auckland-Bay of Plenty, where thepopulation rose from 43.1 percent urban in 1951 to 68.2 percent urbanin 1971. Much of. this increase was due to the growth of the seaports —Tauranga and Mt. Maunganui — and the growth of Hamilton city, themajor distribution and service centre for the Waikato farming area.During the entire period 1951-1971 the Central Auckland, Wellingtonand Canterbury statistical areas had higher levels of urbanisation thanNew Zealand as a whole, while Hawke's Bay had levels only slightlybelow the New Zealand level. In Westland, the "urban" populationsector increased until 1961 but since then the proportion has beenfalling. The main explanation for regional variations in the degree ofurbanisation will be found in the different land-use patterns, levels ofindustrial development and in associated economic opportunities insub-national areas.

REGIONAL POPULATION GROWTH AND DISTRIBUTION 79
TABLE 4.9 REGIONAL DISTRIBUTION OFURBAN POPULATIONS, 1951-1971
Stat ist ical Area
NorthlandCentral AucklandSouth Auckland-Bay or PlentyEast Coast
Totals, Northern NorthIsland
Hawke's BayTaranakiWellington
Totals, Southern NorthIsland
Totals, North Island
MarlboroughNelsonWest landCanterburyOtagoSouthland
Totals, South Island
Totals, New Zealand
Proportion of Total Populationin Statistical Area Classif ied
as Urban ( 1 '
1951
28.888.543.147.8
65.1
67.551.180.7
74.1
69.0
44.854.158.276.570.255.9
68.4
68.8
1956
(131.488.649.450.2
67.5
68.852.680.4
74.3
70.4
54.456.258.677.571.257.3
69.9
70.2
1961
Dercen1
35.989.653.953.9
70.7
70.755.982.8
77.0
73.3
56.359.859.379.372.960.1
72.1
72.9
1966
)46.695.363.860.0
79.1
77.862.288.3
83.0
80.7
59.167.255.883.074.262.4
75.2
79.1
1971
49.895.968.263.8
81.9
80.564.889.6
85.0
83.1
61.270.055.784.175.666.1
77.0
81.4
(1)For definit ion of "Urban" see footnote to Table 4.7.
4.5.2 Components of Urban-Rural Population GrowthAdequate data are not available for analysing, in depth, the factors
causing rural-urban growth differentials in the various regions andseparating the components of growth during each intercensal period.The factors that affect rural and urban growth in any intercensalperiod include reclassification or extension of the boundaries of urbanareas, natural increase in the areas classified as "urban" at successivecensuses and the areas newly classified as "urban" and net migration(both rural-urban and external migration) in the areas which are"urban" at successive censuses and the areas newly classified as"urban". The process of reclassification has the effect of continuouslydepleting the rural population. The more rapidly a rural area grows,the greater the chances are that it will be reclassified as urban at thenext census.

go THE POPULATION OF NEW ZEALAND
4.6 METROPOLITAN POPULATION GROWTHThe dominant feature of urbanisation in New Zealand in recent
years has been the rapid growth of populations in metropolitan centresknown as "urban areas" and the development of new "urban areas".
In New Zealand an "urban area" consists of a central city or largeborough together with the adjacent areas, such as neighbouringboroughs, town districts and parts of administrative counties, whichare regarded as suburban and as belonging to that centre ofpopulation. They are non-administrative units, their purpose being toprovide stable districts so that the expansion of the centres with morehighly concentrated populations can be measured. First defined in1917, their boundaries remained unaltered until a major revision wasmade in 1951 and the new areas were used in the census ofthat year. Inmost cases little alteration was necessary. However, the boundaries ofthe Auckland and Wellington urban areas were extendedconsiderably, and Wellington was subdivided into the Wellington andLower Hutt urban areas. For the 1961 census, three new urban areas —Whangarei, Tauranga, and Rotorua — were defined, bringing thetotal to 18. The boundaries were again revised prior to the 1971 censuswhen the number of areas increased from 18 to 24 by the division of theAuckland metropolitan area into four urban areas, the creation of oneadditional area each from the Wellington and Hutt Valleymetropolitan areas, and the inclusion of Masterton as an urban area.
The majority of the "urban" population of New Zealand currentlylives in the 24 urban areas. In 1971, about 1,930,000 or 83 percent of thetotal urban population and 67.5 percent of the total New Zealandpopulation resided in these 24 urban areas. Using comparable figuresfor 1926 (based on the urban areas as defined in 1971) we find thatbetween 1926-1971 the population of the urban areas increased by 149percent as compared with a 104 percent increase in the totalpopulation.
4.6.1 Regional Trends in Urban Area GrowthOf the twenty-four urban areas in 1971, nine were in the northern
part of North Island (including four in the Central Auckland and threein South Auckland-Bay of Plenty Statistical areas) and ten in thesouthern half (including seven in the Wellington statistical area). Theremaining five were in the South Island (including two in theCanterbury statistical area).

REGIONAL POPULATION GROWTH AND DISTRIBUTION 81
In 1971, the nine urban areas in the northern part of the NorthIsland had a population of 874,849 or 45.3 percent of the totalpopulation of the 24 urban areas in New Zealand, again illustrating theconcentration of population in the north. Table 4.10 shows thepopulations and growth rates of all urban areas for intercensal periodssince 1926. There have been considerable changes in the relativerankings of urban areas in terms of population size during theseperiods. In 1971, the four major urban areas were; Central Auckland(286,787), Christchurch (275,968), South Auckland (165,048) andWellington (136,782). If the four Auckland urban areas are combined,and the four urban areas close to Wellington city (Wellington, LowerHutt Valley, Upper Hutt Valley and Porirua Basin urban areas) aretaken as an entity, the Auckland metropolitan area had a populationof 649,746 (22.7 percent of the total New Zealand population) andWellington a population of 307,629 (10.8 percent of the total NewZealand population).
Table 4.10 also shows that the Western Auckland urban area hasbeen one of the six centres with highest population growth rates inevery intercensal period since 1926. Although it had a slightly lowergrowth rate than other centres between 1945 and 1951, SouthernAuckland has had the highest growth rate of all urban areas since1961. Northern Auckland has also shown a rapid growth since 1961,the opening of the Auckland Harbour Bridge providing greater accessto this area. Tauranga and Rotorya have also been represented in thesix urban areas with highest growth rates in almost every intercensalperiod while Porirua Basin had the highest growth rate of all theurban areas during the 1945-61 intercensal period. Lower Huttexperienced a high but decreasing rate of growth between 1926 and1951, while Upper Hutt's most rapid growth was between 1936 and1961.
During the intercensal period 1966-71, the South Auckland urbanarea had the highest growth rate (32.2 percent), followed by thePorirua Basin (27.2 percent) and Northern Auckland (25.1 percent).Wanganui, the only urban area to record a loss in population, recordeda growth rate of - 0.5 percent.

82 THE POPULATION OF NEW ZEALAND
COLUCO3
LUOLU
g?LUOO
CO
I-
LU
CE
<mCEZ3LLO
O
0.
LU
CD
OJ CD
o o
co
oí
) Cû W) LO GO
O OîO OJ
CNJCM tû lOC\ln( f lWlQOxfw
c\j
i - inCv] CO
oo o oo •CD CJ O) •
ÍoCL
O
O rO
lOWOOlWSOCOOJO
s sO COCO CDCJ IO
£ S1
» ^ n c o i r T OOOOJtOCvJCDtDtCCO
h- co 0)00)Osoc\jT-[ûcnT~ T— COCO I ^ T ' C V J O J O J C J C\i
OJ
CD
S300 O OJ ï?5 Oî '
l t - O CD
I oo ^ - i - o E io 5 o r-_ S 5^ oo o" uí oí co ui co*
i - T - i - c o T - e o w
s sh- m O)
O)co coN- COco_ cqO î ^ CDOJ^lßißCOCOCOCOT-
CD i-i- T-T--I-T-OJCJ
OCNJO)Ö5 i -COCMCOCNJN- CJ O U O O J O C Om co co co oj to T- io in co a o> OJ co co
r-- CD O) OJ i*-
Oï cO ^*
* - w
Ü 3 3 • 5 S
ai •- °- « S !K = t e = 2 - S ° M
c?^>^>¿:
1 ^ fe
• Q î

REGIONAL POPULATION GROWTH AND DISTRIBUTION 83
• o
HCCOo1
.10
III. 1CD<
cu
T<D
co
R°'S
te
tit
ensa
l
oCO
nt
c
_c
1966
-71
CD " >
S?
•
m coOl IO
i
en • *
OJ <OO) '•O
: m
Are
C
SCL
9.8
25.1
18.7
COCO COCM "*t N -CO CO CO
O OJ O CO
CO i - T -
TJ- TJ* CO 1^-
„„coo.
I— T- N- Tj-LO CM C\J CO r- T - î -
CO CO CO CO CO O CON O COi - CO LO
CO Tf T -
LO 1 5 CM i—" Í CM CO
T-OJSCOr--1- in co co co oT - CO LO T f CO Ti-
CO CO CO
CD h - O5
CO CO CO
CO O LO
Píe?
c "gJ¿ —
îo £ cO) ^ ûj
8.9
30.1
20.2
49.3
CO CO CM N
co co co - ^
T T O J C O N
o co oi coCJOC0 SC O T T - I -
i - m oí œ
co co co o
•<}• (M 1O <O•fl- r - CO • *T- T - T- CO
Sfflî-WfO WO
CO Tj- CM COCO i - r- i -
co en co o
CD CO T - CO
CO r- CO LO CM
-g C
_C0 _»¿
si^ - (- C ro
£ o "c F ^
to c pj3 c5 o5
(EÖZI
co co to ^
18.2
13.2
17.6
38.0
•q- o iß CD
CO G) CO -<3-
4.1
27.2
lOh-
7 - CO
f CO
o tT - CO
O5 CO
33.3
55.7
CJ CO
T - CO CO i - CO CD OCO CO CO CO LO CO CM
T - T - -r- T -
i - LO LO CO f ^ LO COT - 1— 1— T -
OÎ CO CO O i - T - COT - CO T - -r- CO T t O
CO O O CD CO CO TJ-
luOCOOT-rNh-W
? Y T- IM m cj
• ^ —
.c o co
E • - ,2 3_ ^ co xQ. co « i_
IItt \
asi
3 QJ(Ö
"- _J
5 ™
j a
NO^fWOCOS
n rch
^ o _? CT
n j2 r Ü 3 C (5c Q3 O "^ *- "° u
— +; M .!2 fl ^ j jQ) CO flJ •— ^ ¿
10.4
1^IT)• ^
OJ
I f' r -
oCO
15.0
inCO
t _
OJ
tn
ota
I -
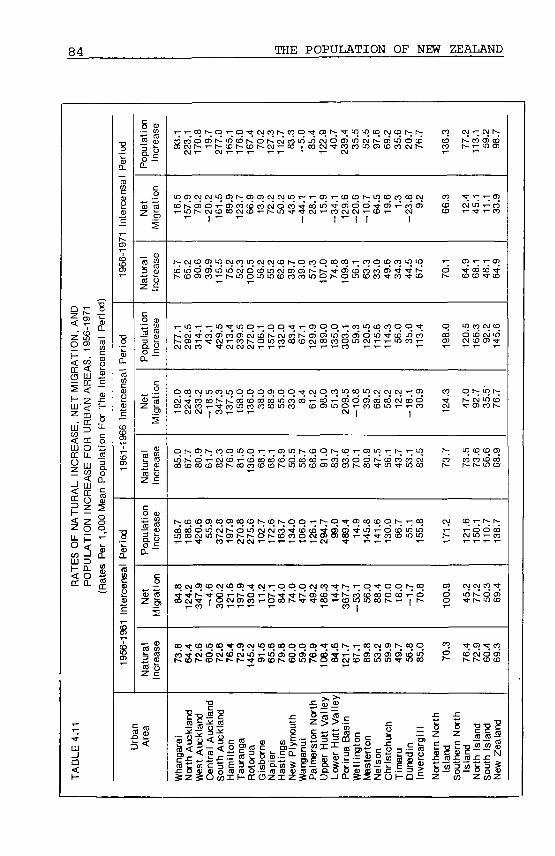
84 THE POPULATION OF NEW ZEALAND
<
z . g bLU 3 U-^ E OLU O SCC LL to
^LU aQ.
- J LU
5 D:
g 8
i lCCD.
LU
<
.1 s« S
_ o(0 »k- ni
O 31
o cQ. ~
ü Srao
to b
=><
OJ T ; OJ h-NI cô oî oô
O ^ c ot-cûT- CJ
cvj co aï u) oj.q ioojw(ûsocriococqr;nococoioioñ d í Ó O d O ñ i ^ í i ó o d í í
co
CMi COr
ScqtOiBCOOlCOtOStDh.qqT-SOTfffitDCDqNT^CO OJ CD -r; h~ h--^ í Qî Oî ^ f ^O ^~ C3 CO LO LO T*1* T * C3 CO COCT> o ï COT— ^ ^ " C O C O I O L O f*- W W i— COCM r t T - T - T - 1 - T - T - T - T - 1 -
OAS'í^-OOT-(D5ílOa3Sr-Tfs O ^Th-LOCD
:sU3 i - 1O O> c-^ OÍ (o h- t

REGIONAL POPULATION GROWTH AND DISTRIBUTION 85
4.6.2 Components of Urban Area Population GrowthAlthough, as previously noted, data for analysing the various
components of urban and rural population growth are not available,the components of growth (natural increase and net migration) in the24 urban areas can be quantified and are shown in Table 4.11. In a largenumber of urban areas net migration (including both internal andexternal migration) has been the dominant contributor to populationgrowth. During the 1956-61 intercensal period, 14 of the 24 urbanareas had higher net migration rates than natural increase rates butonly 11 urban areas had a similar experience during the 1961-66intercensal period. The low levels of net external immigrationgenerally experienced during the late 1960's reduced this number to 9during the 1966-71 intercensal period.
Porirua Basin, West Auckland, and South Auckland had thehighest net migration rates of any urban areas during the threeintercensal periods under review. Conversely, the Wellington andDunedin urban areas experienced net out-migration during each of theintercensal periods but this was not large enough to offset the naturalincrease. The only urban area to lose population during 1956-71 wasWanganui, which recorded a population decline during the intercensalperiod 1966-71, when the net out-migration outweighed naturalincrease.
4.7 CHARACTERISTICS OF URBAN-RURAL POPU-LATIONS
The remaining section of this chapter discusses the geographicaldistribution of the New Zealand population according to age, sex, raceand marital status.
4.7.1 Distribution by AgeTable 4.12 records the size and age distribution of the urban male,
female populations in urban and rural areas at the 1971 census.Persons under 20 years of age at the 1971 Census accounted for 44.4percent of the total rural population, but only 40.1 percent of the urbanresidents. Between the ages of 20-39 years, the age structures were verysimilar, but for the age groups in the 40 years and over range, theposition was reversed, the proportions of the total urban population inthese age groups becoming increasingly higher relative to thecorresponding rural proportions.
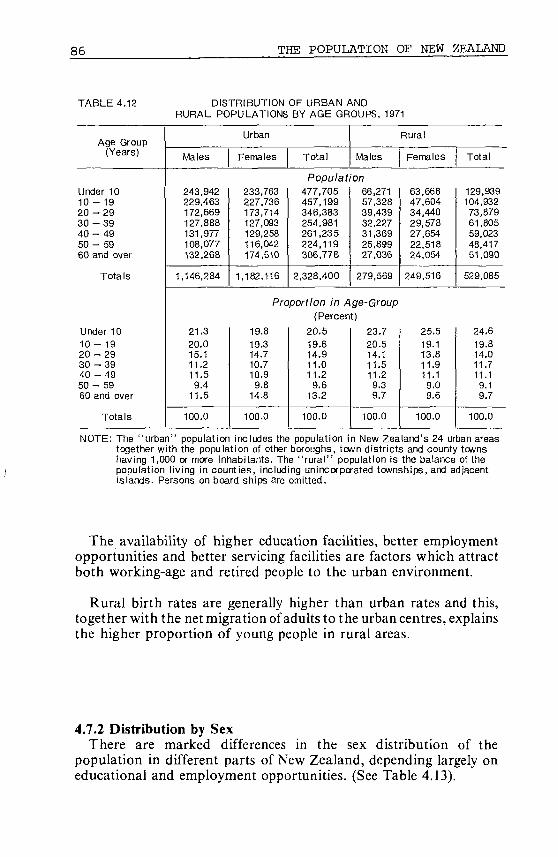
86 THE POPULATION OF NEW ZEALAND
TABLE 4.12
Age Group(Years)
Under 1010 - 1920 - 2 930 - 3 94 0 - 4950 - 5960 and over
Totals
Under 1010 - 1920 - 2930 - 3 940 - 4 950 - 5960 and over
Totals
DISTRIBUTIONRURAL POPULATIONS
Males
243,942229,463172,669127,888131,977108,077132,268
1,146,284
21.320.015.111.211.59.4
11.5
100.0
Urban
Females
233,763227,736173,714127,093129,258116,042174,510
1,182,116
OF URBAN ANDBY AGE GROUPS, 1971
Total Males
Population477,705457,199346,383254,981261,235224,119306,778
2,328,400
66,27157,32839,43932,22731,36925,89927,036
279,569
Proportion in Age-Group
19.819.314.710.710.9
9.814.8
100.0
(Percent)20.519.614.911.011.2
9.613.2
100.0
23.720.514.111.511.29.39.7
100.0
Rural
Females
63,66847,60434,44029,57827,65422,51824,054
249,516
25.519.113.811.911.19.09.6
100.0
Total
129,939104,93273,87961,80559,02348,41751,090
529,085
24.619.814.011.711.19.19.7
100.0
NOTE: The "urban" population includes the population in New Zealand's 24 urban areastogether with the population of other boroughs, town districts and county townshaving 1,000 or more inhabitants. The "rural" population is the balance of thepopulation living in counties, including unincorporated townships, and adjacentislands. Persons on board ships are omitted.
The availability of higher education facilities, better employmentopportunities and better servicing facilities are factors which attractboth working-age and retired people to the urban environment.
Rural birth rates are generally higher than urban rates and this,together with the net migration of adults to the urban centres, explainsthe higher proportion of young people in rural areas.
4.7.2 Distribution by SexThere are marked differences in the sex distribution of the
population in different parts of New Zealand, depending largely oneducational and employment opportunities. (See Table 4.13).
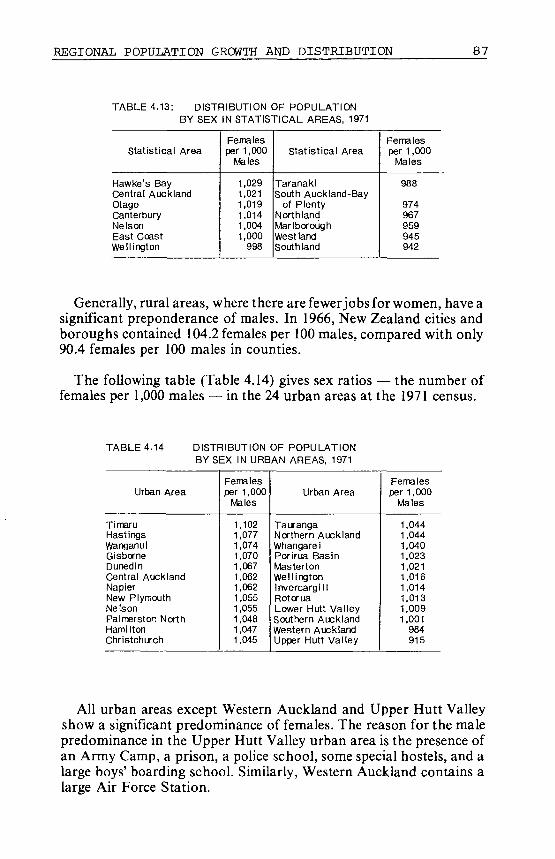
REGIONAL POPULATION GROWTH AND DISTRIBUTION 87
TABLE 4.13: DISTRIBUTION OF POPULATIONBY SEX IN STATISTICAL AREAS, 1971
Statistical Area
Hawke's BayCentral AucklandOtagoCanterburyNelsonEast CoastWellington
Femalesper 1,000
teles
1,0291,0211,0191,0141,0041,000
998
Statistical Area
TaranakiSouth Auckland-Bay
of PlentyNorthlandMarlboroughWest landSouth land
Femalesper 1,000
Males
988
974967959945942
Generally, rural areas, where there are fewer jobs for women, have asignificant preponderance of males. In 1966, New Zealand cities andboroughs contained 104.2 females per 100 males, compared with only90.4 females per 100 males in counties.
The following table (Table 4.14) gives sex ratios — the number offemales per 1,000 males — in the 24 urban areas at the 1971 census.
TABLE 4.14 DISTRIBUTION OF POPULATIONBY SEX IN URBAN AREAS, 1971
Urban Area
TimaruHastingsWanganuiGisborneDunedinCentral AucklandNapierNew PlymouthNelsonPalmerston NorthHamiltonChristchurch
Femalesper 1,000
Males
1,1021,0771,0741,0701,0671,0621,0621,0551,0551,0481,0471,045
Urban Area
TaurangaNorthern AucklandWhangareiPorirua BasinMastertonWellingtonInvercargillRotoruaLower Hutt ValleySouthern AucklandWestern AucklandUpper Hutt Valley
Femalesper 1,000
Males
1,0441,0441,0401,0231,0211,0161,0141,0131,0091,001
984915
All urban areas except Western Auckland and Upper Hutt Valleyshow a significant predominance of females. The reason for the malepredominance in the Upper Hutt Valley urban area is the presence ofan Army Camp, a prison, a police school, some special hostels, and alarge boys' boarding school. Similarly, Western Auckland contains alarge Air Force Station.

88 THE POPULATION OF NEW ZEALAND
4.7.3 Distribution by Marital StatusThe marital status composition of the rural and urban populations,
as recorded at the 1971 census, is shown in Table 4.15. As comparedwith the urban population, the rural population contains a higherproportion of unmarried males and a lower proportion of unmarriedfemales. The relatively scarce job opportunities for women mainlyaccount for the lower proportions of single, widowed and divorcedwomen in the country areas.
TABLE 4.15
MaritalStatus
Never MarriedMarriedLegally SeparatedWidowedDivorcedNot specified
Totals
Never MarriedMarriedLegally SeparatedWidowedDivorced
Totals
URBAN AND RURAL POPULATIONSBY MARITAL STATUS, 1971 (l)
Urban Population'2'
Males
199,145513,487
10,03922,0009,8903,099
757,660
26.468.1
1.32.91.3
100.0
Females
165,265521,688
13,15093,13213,7921,216
808,243
Total
364,4101,035,175
23,189115,13223,6824,315
1.565,903
Rural Population'*
Males
49,648117,395
1,5004,7751,484
508
175,310
Females
21,346116,155
98611,400
916202
151,005
Proportion of Total (Specified) Population
20.564.6
1.611.51.7
100.0
(Percent)23.366.3
1.57.41.5
100.0
28.467.2
0.92.70.8
100.0
14.277.0
0.77.60.6
100.0
Total
70,994233,550
2,48616,175
2/00710
326,315
21.871.7
0.85.00.7
100.0
^ Excludes persons on shipboard.'2)The "urban" population is defined as all persons in the 24 urban
areas together with the populations of other boroughs, town districtsand county towns having 1,000 or more inhabitants.
'3 ' The "rural" population includes the balance of the population livingin counties, including unincorporated townships and adjacent islands.
4.8 REGIONAL DISTRIBUTION OF THE LABOUR FORCEAt the 1971 census the New Zealand labour force comprised 784,969
males and 333,866 females, a total of 1,118,835 persons or 39.1 percentof the total population. The North Island contained 72.3 percent of thetotal labour force and the South Island 27.7 percent at this time. Inrecent years the North Island has increased its share of the total labourforce, the proportions in 1961 and 1966 being 70.3 percent and 71.7percent respectively. These increases, as was stated in the last chapter,are consistent with the increase in the proportion of the total NewZealand population residing in the North Island.
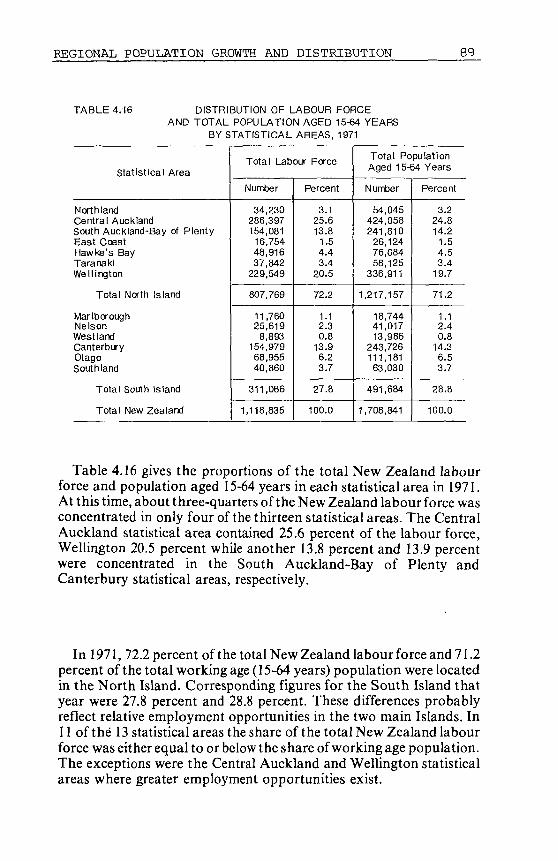
REGIONAL POPULATION GROWTH AND DISTRIBUTION 89
TABLE 4.16 DISTRIBUTION OF LABOUR FORCEAND TOTAL POPULATION AGED 15-64 YEARS
BY STATISTICAL AREAS, 1971
Statistical Area
NorthlandCentral AucklandSouth Auckland-Bay of PlentyEast CoastHawke's BayTaranakiWellington
Total North Island
Mar IboroughNelsonWest landCanterburyOtagoSouthland
Total South Island
Total New Zealand
Total Labour Force
Number
34,230286,397154,08116,75448,91637,842
229,549
807,769
11,76025,6198,893
154,97968,95540,860
311,066
1,118,835
Percent
3.125.613.81.54.43.4
20.5
72.2
1.12.30.8
13.96.23.7
27.8
100.0
Total PopulationAged 15-64 Years
Number
54,045424,058241,81026,12476,08458,125
336,911
1,217,157
18,74441,01713,986
243,726111,18163,030
491,684
1,708,841
Percent
3.224.814.21.54.53.4
19.7
71.2
1.12.40.8
14.36.53.7
28.8
100.0
Table 4.16 gives the proportions of the total New Zealand labourforce and population aged 15-64 years in each statistical area in 1971.At this time, about three-quarters of the New Zealand labour force wasconcentrated in only four of the thirteen statistical areas. The CentralAuckland statistical area contained 25.6 percent of the labour force,Wellington 20.5 percent while another 13.8 percent and 13.9 percentwere concentrated in the South Auckland-Bay of Plenty andCanterbury statistical areas, respectively.
In 1971, 72.2 percent of the total New Zealand labour force and 71.2percent of the total working age (15-64 years) population were locatedin the North Island. Corresponding figures for the South Island thatyear were 27.8 percent and 28.8 percent. These differences probablyreflect relative employment opportunities in the two main Islands. In11 of the 13 statistical areas the share of the total New Zealand labourforce was either equal to or below the share of working age population.The exceptions were the Central Auckland and Wellington statisticalareas where greater employment opportunities exist.

90 THE POPULATION OF NEW ZEALAND
4.9 REGIONAL DISTRIBUTION OF POPULATION BYETHNIC GROUP
Some of the most interesting demographic phenomena experiencedin New Zealand since World War II have resulted in changes in theethnic compositions of sub-national populations. These changestogether with the regional distribution patterns of various ethnicgroups in the population are discussed below.
TABLE 4.17 REGIONAL DISTRIBUTION OFPOPULATION BY ETHNIC ORIGIN, 1971
StatisticalArea
NorthlandCentral
AucklandSouth
Auckland-Bay ofPlenty
East CoastHawke's BayTaranakiWellington
NorthIsland
MarlboroughNelsonWest landCanterburyOtagoSouthland
SouthIsland
NewZealand
Population in
Europeans
75,111
609,503
346,52232,852
114,29193,083
500,659
1,772,021
30,68066,95622,346
388,428178,229102,620
789,259
2,561,280
Maoris
20,456
50,958
69,17914,09117,1237,208
34,562
213,577
8211,389
4456,3091,8663,007
13,837
227,414
Ethnic Group
Others
624
37,939
6,598399
1,836604
17,765
65,765
141493
704,0932,654
721
8,172
73,937
Total
96,191
698,400
422,29947,342
133,250100,895552,986
2,051.363
31,64268,83822,861
398,830182,749106,348
811,268
2,862,631
Proportion of New ZealandPopulation in Group
Europeans
2.9
23.8
13.51.34.53.6
19.5
69.2
1.22.60.9
15.27.04.0
30.8
100.0
Maoris Others
(Percent)9.0
22.4
30.46.27.53.2
15.2
93.9
0.40.60.22.80.81.3
i
6.1
100.0
0.8
51.3
8.90.52.50.8
24.0
88.9
0.20.70.15.53.61.0
11.1
100.0
Total
3.4
24.4
14.81.74.73.5
19.3
71.7
1.12.40.8
13.96.43.7
28.3
100.0
Table 4.17 shows the regional distributions of major ethnic groupswithin the New Zealand population at the 1971 census. While thegreatest numbers of each of the three major ethnic groups —Europeans, Maoris and "Others" — live in the North Island, there is agreater proportion of Europeans in the South Island than thecorresponding proportions for the other defined ethnic groups.Certain areas in the North Island — notably Northland, SouthAuckland-Bay of Plenty and East Coast — have traditionally been themajor residential areas for Maoris while economic opportunity has led

REGIONAL POPULATION GROWTH AND DISTRIBUTION 91
to the migration of Maoris to the Central Auckland and Wellingtonstatistical areas since World War II. Over three quarters of thepopulation within the "others" ethnic groups — comprised largely ofPolynesians — live in the Central Auckland and Wellington statisticalareas where there are greater employment opportunities for unskilledlabour.
In the South Island, the Canterbury statistical area contains thegreatest proportions of each of the three major ethnic groups that livein that island.
4.9.1 The Non-Maori PopulationThe location and growth of the non-Maori population — which
includes Europeans and minor ethnic groups within the "others"category — is shown in Table 4.18. Of the 2,635,217 non-Maorisenumerated at the 1971 census, 1,837,786 or 69.7 percent lived in theNorth Island. In 1971, over 4 out of every 10 non-Maoris lived in thefour statistical areas — Northland, Central Auckland, SouthAuckland and East Coast — which are in the northern half of theNorth Island. The two largest statistical areas in terms of population— Central Auckland and Wellington — contained 44.2 percent of thenon-Maori population of New Zealand in 1971. While these two areashave contained the largest numbers of non-Maoris since early thiscentury, their relative share of the non-Maori population has alsoincreased significantly since 1926 when they contained 37.7 percent ofthe total non-Maori population. The Central Auckland and SouthAuckland-Bay of Plenty statistical areas have consistently been thefastest growing non-Maori population areas since 1926. Canterburyhas generally been the fastest growing area in the South Island duringthe period, its rate of non-Maori population growth being of a similarorder to that of Wellington.
Less urbanised statistical areas — including East Coast, Taranakiand West Coast — have generally experienced low growth rates intheir non-Maori populations since 1926 and, in some instances,population declines.
A high proportion of the non-Maori population has tradionallylived in urban areas since their inception in 1917. As early as 1921,49.4percent of all non-Maoris were residing in the fourteen major urbancentres. By 1971, the proportion of non-Maoris living in urban areashad risen to 68.9 percent. There is every indication that urbanization ofthe non-Maori population will continue in the short term at least. Thereasons for this continuing trend towards greater urbanisation of non-Maoris are largely economic.

9 2 THE POPULATION OF NEW ZEALAND
O)
t¿çy
-7
0
H
_l
Q.O0.
5
zo2
OX
5*ŒO
3I0N
/S
LUCC
18T
AB
LE
4
a)wc
6
ion
Íat
äCL
~~
xi-M
aor
CO
To
CO
istica
Sta
t19
71
%
mOJ
1951
%
FS
mror-
7528
0
CM
CM
647
902
m
S 8
CO
o
CO
CO
CO
m
247
46
OJCMCM
CDTT
COOJO
O
Nort
hla
nd
CM
OJCO•*r
293
inCM
SCD
370
757
23
CO
oOJ
COCM
CM
32ees
Tí
ück
lan
I C
entr
al A
Bay
klan
d-I
Sou
th A
uc
oCM
353
422
CMCO
CO
oCMOJCM
m
7325
4
i —90S
179
72
1 —
mAICM
if!
m
s
124
->,
of P
lent
i nCM
COCO
584
ro
SiCD
ro
CO
3COCM
536
26
SCO
CM
CO
34
CDCM
CJ
IoCO
LU
CM
116
892
O)o
mo
8CMOJ
COCOco
s
721
71
mcoco
oCMCD
mCD
> .
rfi
I H
awke
's
onCO
a
771
COOJ
CMCO
S!
i^00
•o-cococo
105
CM
CMr -co
f2
f MCD
S
I T
aran
aki
CM•<r
518
645
S
OJco
in
r foSCM
CO
mco
377
439
38
co
t ^
feCO
o
tí
273
I W
ellin
gtor
co
r--
837
209' -
OJCOcoCM
,_r
o
mCDCO
* -
mco
1,20
298
450
o' -
OJcoOJ
co"COOJ
co1-9
831
and
sal
s, N
Tot
CO
oCO
618
COCM
So
CM
1—CO
omCM
CM
OJCM
068
oCM
Sinco
^
coco
JZ
Mar
lbor
ou
enTT
6793
0
LOC£J
00TfOJ
s
aenm
ooôIOIO
471
46
coy—
?
CO
S
Nel
son
CD
CMOJ
620
OJ
S
OJ
mmcomCM
inco
mCM
722
23
CMCMCO
mCM
CD
CM
CM
Wes
t lan
d
&
392
875
CO
8
CO
mf-co
moco
oOJCM
282
909
48
OJ
021
SiOJ
3721
7
> ,
[ C
ante
rbur
ro00co
180
998
coT—
CM
UJ
75
inOJCM
coco
coCD
158
652
co
*~
ooco
s
OJCM
in
149
Ota
go
co
103
508
8
Í5
Si
COcoTj-CO
CDro
748
69
coCM
CM
CM
mCD
Sou
thla
nd
797
958
CM
O)m
coCM
44
r -
O)CO
§
570
ñ
m•<r
mCM
m
coco
512
and
J0
s
als,
ST
ot
C)
als
, N
•s
^_
CM
635
CM
760
m
CM
8
CM
T—
Oï
CD
SCM
ÇO
1,82
355
4
oCD
" ~
S1"
O)
O)
1,34
4ea
lanc
N
aoCDo
LU
"co
Eo•aJB
UB
a.o
LUco11)
2

REGIONAL POPULATION GROWTH AND DISTRIBUTION 93
•g5
- co
ntT
AB
LE
4.1
8
it)D
erce
ion
(
to
pul
a.c
ease
Dee
r
5gu
en l*~
en to
toS to
195 5í
,
T~
to m
• » ~
1926
-36
to01
<
Sta
tist
CO
to
CO
CM
r-
CO O
m to
enCO - f
CM
to
OO
mm
I N
orth
land
I O
T f
toCOOJ
CO
CM
and
| C
entr
al A
uck
'S
nd-B
a|
sout
h A
ucki
a
CO
CO
to
1t
CMCM
O>O
CO
en
CM
| P
lent
y
oCM
CO
OJ
CO
r -
T -
0 0
m0 0
co1
oT f
| E
ast
Coa
st
eno
i -
CO
1 -
oCM
CMN-
| H
awke
's B
ay
o1
toT~
in
e»
CO
CM
1
CO
| T
aran
aki
to••a-
mO)
toen
men
IO
i -
•r-
O
CM
1 W
ellin
gton
en
to
O!
cnCM
13
totn
Nor
th1
Tot
als,
f .
00
m
CO
I O
CM
CO
O
r -
CO
CO
* "
1 M
arlb
orou
gh
CO
CM
to
CO
I O
CO
CM
O
t f
CO
1
CM
Sin
1
to1
CM
CO
1
1^
o
to
T f
1
T f
oCM
| W
est l
and
toI O
enCO
CM
o
CO
en
CO
oin
oo
| C
ante
rbur
y
too1
CO
CO
oto
I O
o
• « •
1
O l
o
Ota
go
toC\J
CO
I O
O l
men
too
r--co1
CM
Sou
thla
nd
Sou
thT
otal
s
CM
CO
ento
oCO
I O
CM
oo
00
1—
Is la
ne
New
To
tals
,
•fl-
eo
o
o
co
m
O)
o
E
Zea
la
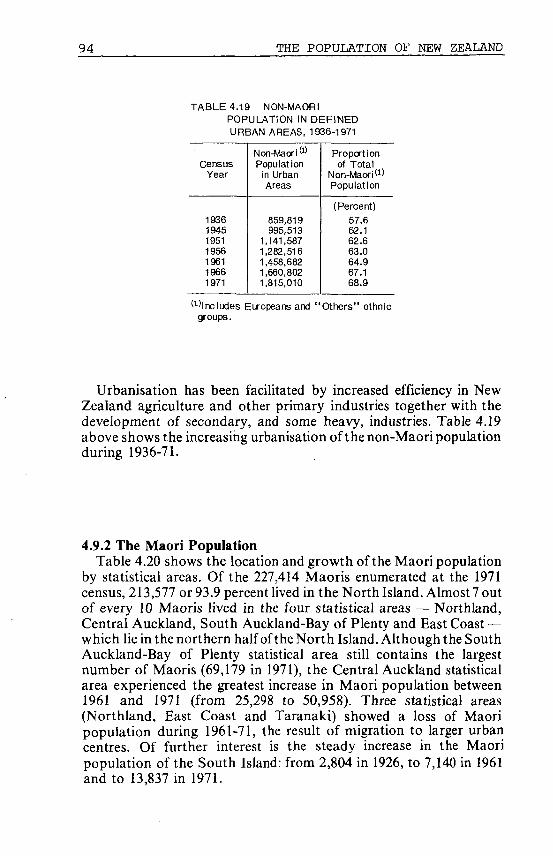
9 4 THE POPULATION OF NEW ZEALAND
TABLE 4.19 NON-MAORIPOPULATION IN DEFINEDURBAN AREAS, 1936-1971
CensusYear
1936194519511956196119661971
Non-Mao-i(1)
Populationin UrbanAreas
859,819995,513
1,141,5871,282,5161,458,6821,660,8021,815,010
Proportionof Total
Non-Maori*1)Population
(Percent)
57.662.162.663.064.967.168.9
(1) lncludes Europeans and " O t h e r s " ethnicgroups.
Urbanisation has been facilitated by increased efficiency in NewZealand agriculture and other primary industries together with thedevelopment of secondary, and some heavy, industries. Table 4.19above shows the increasing urbanisation of the non-Maori populationduring 1936-71.
4.9.2 The Maori PopulationTable 4.20 shows the location and growth of the Maori population
by statistical areas. Of the 227,414 Maoris enumerated at the 1971census, 213,577 or 93.9 percent lived in the North Island. Almost 7 outof every 10 Maoris lived in the four statistical areas — Northland,Central Auckland, South Auckland-Bay of Plenty and East Coast —which lie in the northern half of theNorth Island. Although the SouthAuckland-Bay of Plenty statistical area still contains the largestnumber of Maoris (69,179 in 1971), the Central Auckland statisticalarea experienced the greatest increase in Maori population between1961 and 1971 (from 25,298 to 50,958). Three statistical areas(Northland, East Coast and Taranaki) showed a loss of Maoripopulation during 1961-71, the result of migration to larger urbancentres. Of further interest is the steady increase in the Maoripopulation of the South Island: from 2,804 in 1926, to 7,140 in 1961and to 13,837 in 1971.

REGIONAL POPULATION GROWTH AND DISTRIBUTION 95
6-1E
en1
^iZ
LA
TIÓ
Q.O
^OR
I F
L.O
LTO
»JA
L
O
o
iLE
4
.20
í
crease
bmCO
eu
Cen
sus
on a
tJl
ati
Pop
S eD»eo
1956
-61
i
Ol * 5
• * 7Z0 5 > "
CO I Í505 fl-
1926
-3
6
| v .O)
996 L
961
8
sCO
8
CO
ed
Sta
tisti
ca
l A
re
CO
ICO
7
CM
i 'O |v-
¿CM
LO
CD
CO
O5
CD
|v-
CDLO
•fl-O
234
CM
1,62
7
CM
090
CMCM
518
CM
^ _
OCM
OCM
396
CO•
421
•fl-
-Han
dN
ort
en
oCDLO
•fl-
So
39
CO
ooCO
f
100
•fl-
COCO
CO
o
463
395,2
98
CO
776
1535
1
CO
oo
086
•fl-
296
CM
ral
Au
ckla
nd
Cen
i A
uck
lan
d-
| S
out
CO
CO
| v .
CM
r-
CO
T-
• f l -
CO
LO
f -1
fv .
oCO
• f l -
COCO
enT—
C5
912
64
E
569
•fl-
339
COCO
T _
COCD
CMCO
035
| v .
273
oCM
y of
Ple
nty
S
CM
egI
CD
CM
I,-CO
eno
COT -
- I~
CO
LO
CM
COCO
T _USCJ
• f l -T ~
404
4,7
86
931
CO
560
eg
COCOCO
j :
698
05
281
Coast
| E
as
CO
CO* ~
CO
CM
CO
oCO
•fl-
•f l-
CM
O
£3
,-oT f
MCM
|v .
890
LO
2.41
932
0
o
867
CO
COCÜCO
633
CD
733
•fl-
ke's
Bay
I
ICO
7oeo
05
eo
fl-i^7~
LO
O
, -
CD-1-
COoCM
333
fv.
7.4
53
318
CO
549
LO
CO
fs•fl-
280
•fl-
686
CO
naki
CO
oCOCO
LO
35
CO
30
CM
19CO
1 —
CM
CO
COCM
CO
enT~
CM
LO
fl-CO
110
83
0,75
2
CO
890
1532
8
eo
LO
So
969
CO
520
h -
ingto
nI
We
ll
To
tals
, N
ort
h
CM1 —
T -
C35
CO
CM
CO
00
O
^~
LO
20
ooCO
LO
CO
CO
524
190
9,9
46
LO
894
131
512
111
CO
oCOLOCJ>
097
en
866
60Is
land
•fl-
| v .
CO
CM
-fl-
eoCM
oCO
I
CM
• f l -
r-
COCM
T _
CMCO
810
694
666
649
enCOCD
586
476
boro
ugh
| M
arl
i -m
•f l-
LOeg
o
20
,_COCO
ene\iCO
, _
17CO
CO
mCOCO
278
1,01
984
963
8
s.CO
•fl-COCM
197
co
| N
eis
•fl-
CO
LO
•fl-
?CD
•fl-
CO
cnCO
n
ro
l O
^ -
324
283
249
238
152
134
land
| W
est
CO
COCO
CO
soLO•fl-
•fl-
23
CM
^ .
CO
CO
cn1~
rnCJCO
CD
566
•f l-
3,0
37
094
CM
697
• * ~
en
s
411
y—
190
' -
erb
ury
| C
ant
CO
cnCM
I v .
79
LO
21.
T f, _
OJ
ro
1
toro
enrnCO
479
823
566
46
5
ro
413
399
oid
5
COCO
CO
s
s.CD
•fl-
O5
O
1^.O
1
r -
CO
j ^00
ro
178
CO
1,28
483
347
7
oeo•fl-
433
408
h la
ndI
Sou
t To
tals
, S
outh
oCO
05
CO• f l -
CO
LOCO
CO
COCM
CM
CM
•fl-
eo
CM
LO
COCO
CO
635
10,
7,1
40
257
LO
164
•fl-
eoCO•fl-
CO
622
ro
804
CM
Isla
nd
To
tals
, N
ew
CO
20
CO
CM
CO
18
CM
r*.
O5
05
CO
O5CM
•fl-
•fl-
CMCM
159
201
7,0
86
CO
151
137
676
LO
S
326
COCO
670
63Z
eala
nd
wcu
b
cub
bof
ha
lfso
ns
£
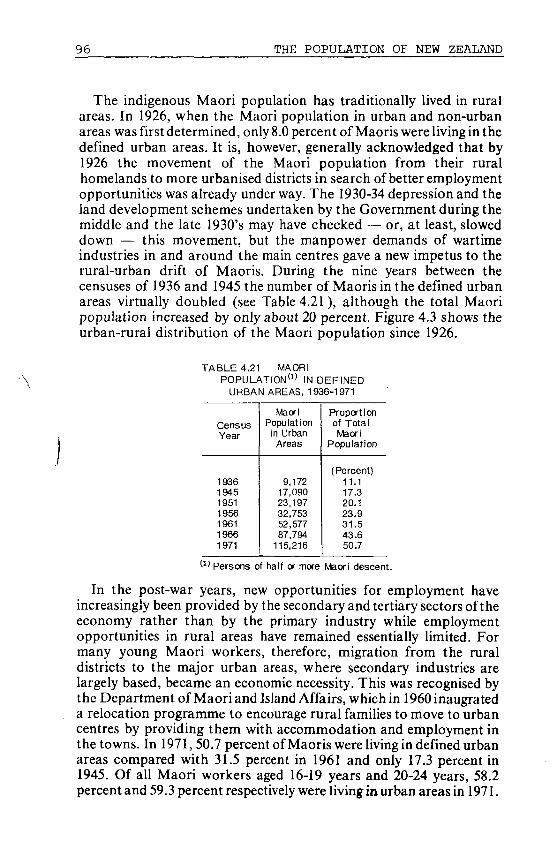
96 THE POPULATION OF NEW ZEALAND
The indigenous Maori population has traditionally lived in ruralareas. In 1926, when the Maori population in urban and non-urbanareas was first determined, only 8.0 percent of Maoris were living in thedefined urban areas. It is, however, generally acknowledged that by1926 the movement of the Maori population from their ruralhomelands to more urbanised districts in search of better employmentopportunities was already under way. The 1930-34 depression and theland development schemes undertaken by the Government during themiddle and the late 1930's may have checked — or, at least, sloweddown — this movement, but the manpower demands of wartimeindustries in and around the main centres gave a new impetus to therural-urban drift of Maoris. During the nine years between thecensuses of 1936 and 1945 the number of Maoris in the defined urbanareas virtually doubled (see Table 4.21), although the total Maoripopulation increased by only about 20 percent. Figure 4.3 shows theurban-rural distribution of the Maori population since 1926.
TABLE 4.21 MAORIPOPULATION11' IN DEFINED
URBAN AREAS, 1936-1971
CensusYear
1936194519511956196119661971
MaoriPopulationin UrbanAreas
9,17217,09023,19732,75352,57787,794
115,216
Proportionof TotalMaori
Population
(Percent)11.117.320.123.931.543.650.7
l l ) Persons of half or more Maori descent.
In the post-war years, new opportunities for employment haveincreasingly been provided by the secondary and tertiary sectors of theeconomy rather than by the primary industry while employmentopportunities in rural areas have remained essentially limited. Formany young Maori workers, therefore, migration from the ruraldistricts to the major urban areas, where secondary industries arelargely based, became an economic necessity. This was recognised bythe Department of Maori and Island Affairs, which in 1960 inaugrateda relocation programme to encourage rural families to move to urbancentres by providing them with accommodation and employment inthe towns. In 1971, 50.7 percent of Maoris were living in defined urbanareas compared with 31.5 percent in 1961 and only 17.3 percent in1945. Of all Maori workers aged 16-19 years and 20-24 years, 58.2percent and 59.3 percent respectively were living in urban areas in 1971.

REGIONAL POPULATION GROWTH AND DISTRIBUTION 97
3
O
O "~
5 S
K =Z Z•< IUm U
luat3O
Sig4

9 8 THE POPULATION OF NEW ZEALAND
4.9.3 Minor Ethnic GroupsThe regional distribution of the minor ethnic groups within the New
Zealand population, which make up the "others" category, is given inTable 4.22. While populations in all of the minor ethnic groups —Polynesians, Chinese, Indians, Syrians, Lebanese and Arabs, and theremainder — are all mainly resident in the North Island, there areconsiderable differences in areal distribution among these groups.
The largest groups within the "others" category — Polynesians —are heavily concentrated in the Central Auckland and Wellingtonstatistical areas of the North Island. There are also high, but varying,concentrations of all other minor ethnic groups in these two areas.
Other statistical areas which contain significant concentrations ofthe minor ethnic groups are: South Auckland-Bay of Plenty, whichcontains 14.2 percent of the Indian population; Canterbury, whichcontains 9.8 percent of the Chinese population and 9.7 percent of the"remainder" groups; and Otago, which contains 9.5 percent of theChinese and 22.1 percent of the "Syrians, Lebanese and Arabs" group.
TABLE 4.22
Area
NorthlandCentral AucklandSouth Auckland-
Bay of PlentyEast CoastHawke's BayTaranakiWellington
North Island
MarlboroughNelsonWest landCanterburyOtagoSouthland
South Island
New Zealand
REGIONAL DISTRIBUTION OFPOPULATIONS IN MINOR ETHNIC GROUPS, 1971
Distribution of Ethnic Groups
Polynesians
0.760.8
8.90.22.10.3
20.5
993.5
0.10.30.13.71.31.0
6.5
100,0
Chinese
0.931.7
5.81.94.50.8
33.3
79.0
0.20.60.19.89.50.9
21.0
100.0
Indians
(Percent)0.5
41.9
14.20.41.42.5
29.5
90.5
0.21.20.15.02.40.7
9.5
100.0
Syrians,Lebanese
andArabs
0.524.2
7.70.62.76.2
28.2
70.2
0.21.40.55.0
22.10.6
29.8
100.0
Remainder
2.038.0
8.90.42.32.2
23.«
77.7
0.62.20.39.78.41.1
22.3
100.0
Total (1)
3.424.4
14.81.74.73.5
19.3
71.7
1.12.40.8
13.96.43.7
28.3
100.0
'"Others" ethnic group.

CHAPTER V
THE LABOUR EORCE
5.1 INTRODUCTIONThe size of the labour force in relation to the total population is
affected by various demographic and social factors, including changesin the birth rate, changes in the school-leaving age and attitudes totertiary education and by the changing proportion of married womenseeking work. Net external migration generally has only a secondaryeffect on the work force (except in times of economic recession) eventhough a large proportion of migrants are in the working age-group.There is a relatively greater participation within the 15-24 year agegroup of the labour force as the majority of females are "activelyengaged" during this period of their lives before taking on home-making responsibilities. (The term "actively engaged" is applied tothose who are normally engaged in gainful occupations and as such itincludes the temporarily unemployed. Those "not actively engaged" —in economic terms — are mainly housewives, children, retired personsand full-time students).
5.2 TRENDS IN THE LABOUR FORCEAs at 1 April 1975, the New Zealand labour force numbered
approximately 1,207,700 or 38.9 percent of the country's estimatedpopulation of 3,105,400. By comparison, in 1936, the labour forcealthough much smaller in numbers (669,423 — of which some 38,000were unemployed), represented a peak figure of 42.5 percent of thetotal population (see Table 5.1). Between 1936 and 1961, theproportion actively engaged dropped gradually from 42.5 percent to37.1 percent. This significant decrease is partly attributed to thesubstantial increase in the proportion of the population under 15 yearsof age, which was caused by the post-war "baby boom". Theintroduction of a comprehensive pension scheme enabling elderlyworkers to retire was another contributing factor. Also, the raising ofthe school-leaving age to 15 years in 1944 and expansions of secondaryand university education helped to delay the entry of young people intothe labour force.
Despite the fact that New Zealand lost some of its workers toAustralia and other countries during the economic recession of 1968-69, the size of the labour force increased by 25 percent between 1961and 1971, from 895,363 to 1,118,835. The corresponding increase inthe total population was slightly smaller, 19 percent. Consequently,
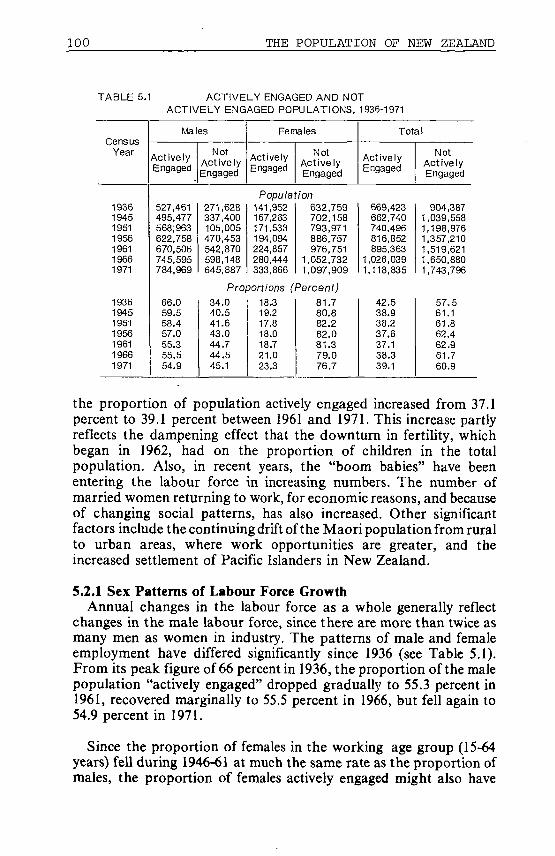
100 THE POPULATION OF NEW ZEALAND
TABLE 5.1 ACTIVELY ENGAGED AND NOTACTIVELY ENGAGED POPULATIONS, 1936-1971
CensusYear
1936194519511956196119661971
1936194519511956196119661971
Males
ActivelyEngaged
NotActivelyEngaged
Females
ActivelyEngaged
NotActivelyEngaged
Total
ActivelyEngaged
NotActivelyEngaged
527,461495,477568,963622,758670,506745,595784,969
66.059.558.457.055.355.554.9
271,628337,400105,005470,453542,870598,148645,887
Population141,952167,263171,533194,094224,857280,444333,866
632,759702,158793,971886,757976,751
1,052,7321,097,909
669,423662,740740,496816,852895,363
1,026,0391,118,835
Proportions (Percent)34.040.541.643.044.744.545.1
18.319.217.818.018.721.023.3
81.780.882.282.081.379.076.7
42.538.938.237.637.138.339.1
904,3871,039,5581,198,9761,357.2101,519,6211,650,8801,743,796
57.561.161.862.462.961.760.9
the proportion of population actively engaged increased from 37.1percent to 39.1 percent between 1961 and 1971. This increase partlyreflects the dampening effect that the downturn in fertility, whichbegan in 1962, had on the proportion of children in the totalpopulation. Also, in recent years, the "boom babies" have beenentering the labour force in increasing numbers. The number ofmarried women returning to work, for economic reasons, and becauseof changing social patterns, has also increased. Other significantfactors include the continuing drift of the Maori population from ruralto urban areas, where work opportunities are greater, and theincreased settlement of Pacific Islanders in New Zealand.
5.2.1 Sex Patterns of Labour Force GrowthAnnual changes in the labour force as a whole generally reflect
changes in the male labour force, since there are more than twice asmany men as women in industry. The patterns of male and femaleemployment have differed significantly since 1936 (see Table 5.1).From its peak figure of 66 percent in 1936, the proportion of the malepopulation "actively engaged" dropped gradually to 55.3 percent in1961, recovered marginally to 55.5 percent in 1966, but fell again to54.9 percent in 1971.
Since the proportion of females in the working age group (15-64years) fell during 1946-61 at much the same rate as the proportion ofmales, the proportion of females actively engaged might also have

THE LABOUR FORCE 1 0 1
been expected to drop, but the only fall in female participation wasthat recorded between 1945 and 1951 (which presumably reflects thepost-war withdrawal of many women from the labour force toundertake family formation). The proportion of females activelyengaged has increased significantly over the last two decades; it was17.8 percent in 1951, 18.7 percent in 1961, and 23.3 percent in 1971, thehighest level ever recorded at a census in New Zealand. The rise inparticipation was much greater for married women. Between 1956 and1974 the proportion of married women working increased from 12.9percent to 26.1 percent.
5.2.2 Age Structure of the Labour ForceFigure 5.1 and Table 5.2 illustrate the post-war changes in the age
structure of the labour force. These data suggest that a narrowing ofthe working age group in the population has taken place. Table 5.2shows that the numbers in, as well as the proportions of, both the"under 16 years" and the "65 years and over" groups of the labour forcehave declined significantly since 1936. The total number of workersunder 16 years of age decreased from 15,462 in 1936 to 9,469 in 1966and to 8,469 in 1971.
TABLE 5.2 TOTAL LABOUR FORCE BYAGE GROUPS, 1936 AND 1961 - 1971
Age Group (Years)
Under 16 MF
1 6 - 2 0 MF
2 1 - 4 4 MF
4 5 - 6 4 MF
65 and over MF
Not specified MF
Totals MF
Under 16 MF
1 6 - 2 0 MF
2 1 - 4 4 MF
4 5 - 6 4 MF
65 and over MF
Not specified MF
Totals MF
1936
10,2665,196
64,01737,764
275,99774,867
155,72621,41020,6392,539
816186
527,461141,962
2.03.7
12.126.652.352.729.515.13.91.80.20.1
100.0100.0
Census
1961
5,0345,333
74,70865,429
361,15595,249
209,45654,93820,1533,908
——
670,506224,857
1966
4,6794,790
93,19883,936
395,556118,373229,69368,60822,4694,737
——
745,595280,444
Percentages0.82.4
11.129.153.942.431.224.43.01.7
-
100.0100.0
0.61.7
12.529.953.142.230.824.5
3.01.7
——
100.0100.0
1971
4,0994,370
93,12184,588
421,181155,900244,476
84,09822,0924,910
—-
784,969333,866
0.51.3
11.925.353.746.731.125.22.81.5-
100.0100.0

102 THE POPULATION OF NEW ZEALAND
uo
O81
<
Uj IU
x^ - IU

THE LABOUR FORCE 103
Male workers aged below 16 years declined from 2.0 percent of themale labour force in 1936 to 0.5 percent in 1971, while female workersin the same age group dropped from 3.7 percent of the female labourforce in 1936 to 1.3 percent in 1971. These declines are attributed to thelarger proportions of younger persons remaining at secondary schoolsand subsequently undertaking tertiary education.
Workers in the 16 to 64 years age group increased from 629,781 or94.1 percent of the total labour force in 1936 to 1,083,364 or 96.8percent of the total labour force in 1971. Within the smaller age classesof this broad age group the proportions of male and female workersdiffer appreciably, reflecting the withdrawal of women from the labourforce following marriage or for childbearing. At the 1971 Census 25.3percent of the female labour force was contained in the 16-20 age groupcompared with 11.9 percent of the male labour force.
In contrast, the 21-44 year age group (the major labour force agegroup) contained only 46.7 percent of the total female labour force but53.7 percent of the male labour force, while the 45-64 year age groupcontains 25.2 percent of the female labour force and 31.1 percent of themale labour force (see Table 5.2).
During the period 1936-71 New Zealand emerged from the grip ofthe depression of the 1930's to a period of general prosperity andhigher living standards. This era saw the introduction of old-agepensions and superannuation schemes. In 1936, 23.7 percent of thepopulation in the "65 years and over" age group were actively engaged.By 1951 this proportion had declined to 14.4 percent and by 1971 hadreached its lowest level at 11.1 percent. This change is reflected in theproportion of males aged "65 years and over" in the total male labourforce which declined from 3.9 percent in 1936 to 2.8 percent in 1971while the proportion of females in the same age group declined from1.8 percent to 1.5 percent of the total female labour force between 1936and 1971.
5.3 EMPLOYMENT STRUCTUREThe growth of population in New Zealand has been accompanied by
a changing emphasis in employment. In the nineteenth century thethen major employment activities of farming, mining, and lumberingbegan to give place to manufacturing industries and to commercial andprofessional occupations. In 1881,11.2 percent of the total population
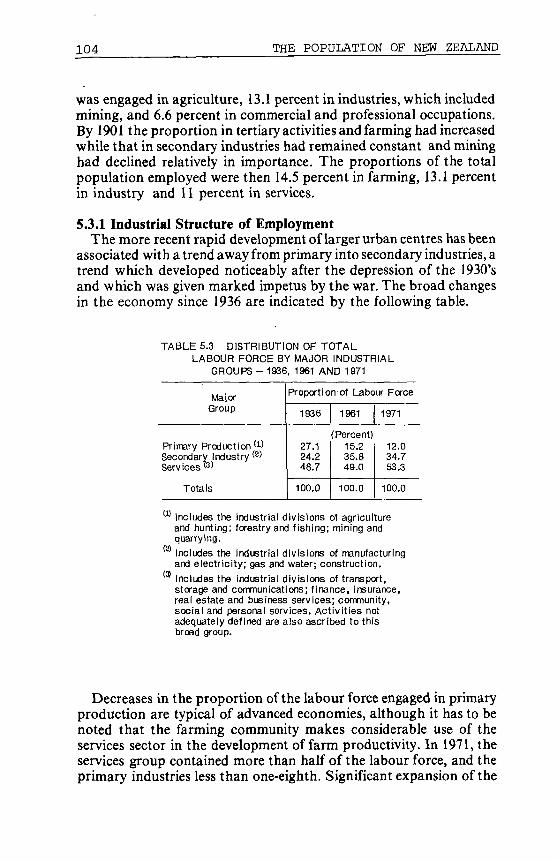
104 THE POPULATION OF NEW ZEALAND
was engaged in agriculture, 13.1 percent in industries, which includedmining, and 6.6 percent in commercial and professional occupations.By 1901 the proportion in tertiary activities and farming had increasedwhile that in secondary industries had remained constant and mininghad declined relatively in importance. The proportions of the totalpopulation employed were then 14.5 percent in farming, 13.1 percentin industry and 11 percent in services.
5.3.1 Industrial Structure of EmploymentThe more recent rapid development of larger urban centres has been
associated with a trend away from primary into secondary industries, atrend which developed noticeably after the depression of the 1930'sand which was given marked impetus by the war. The broad changesin the economy since 1936 are indicated by the following table.
TABLE 5.3 DISTRIBUTION OF TOTALLABOUR FORCE BY MAJOR INDUSTRIAL
GROUPS - 1936, 1961 AND 1971
MajorGroup
Primary Production ^Secondary Industry ®)Services « '
Totals
Proportionof Labour Force
1936
27.124.248.7
100.0
1961
(Percent)15.235.849.0
100.0
1971
12.034.753.3
100.0
(D Includes the industrial divisions of agricultureand hunting; forestry and fishing; mining andquarrying.Includes the Industrial divisions of manufacturingand electricity; gas and water; construction.Includes the Industrial divisions of transport,storage and communications; finance, insurance,real estate and business services; community,social and personal services. Activities notadequately defined are also ascribed to thisbroad group.
Decreases in the proportion of the labour force engaged in primaryproduction are typical of advanced economies, although it has to benoted that the farming community makes considerable use of theservices sector in the development of farm productivity. In 1971, theservices group contained more than half of the labour force, and theprimary industries less than one-eighth. Significant expansion of the
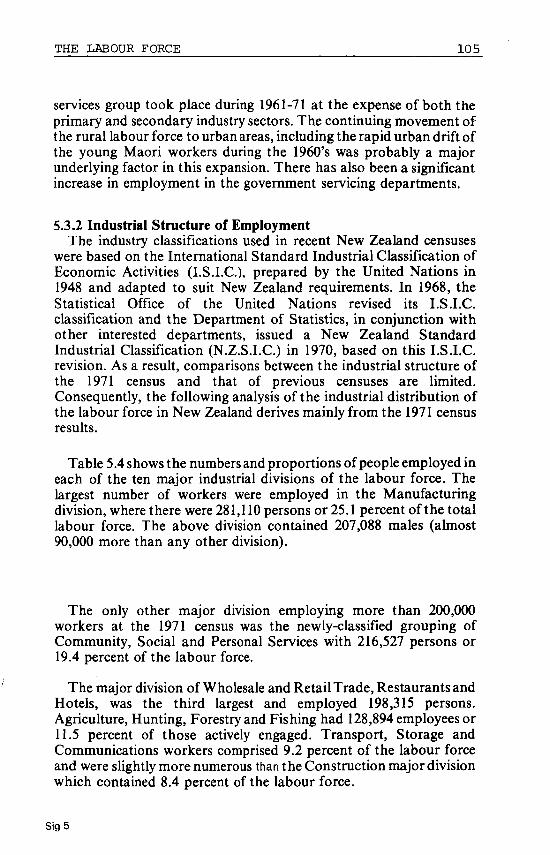
THE LABOUR FORCE 105
services group took place during 1961-71 at the expense of both theprimary and secondary industry sectors. The continuing movement ofthe rural labour force to urban areas, including the rapid urban drift ofthe young Maori workers during the 1960's was probably a majorunderlying factor in this expansion. There has also been a significantincrease in employment in the government servicing departments.
5.3.2 Industrial Structure of EmploymentThe industry classifications used in recent New Zealand censuses
were based on the International Standard Industrial Classification ofEconomic Activities (I.S.I.C), prepared by the United Nations in1948 and adapted to suit New Zealand requirements. In 1968, theStatistical Office of the United Nations revised its I.S.I.C.classification and the Department of Statistics, in conjunction withother interested departments, issued a New Zealand StandardIndustrial Classification (N.Z.S.I.C.) in 1970, based on this I.S.I.C.revision. As a result, comparisons between the industrial structure ofthe 1971 census and that of previous censuses are limited.Consequently, the following analysis of the industrial distribution ofthe labour force in New Zealand derives mainly from the 1971 censusresults.
Table 5.4 shows the numbers and proportions of people employed ineach of the ten major industrial divisions of the labour force. Thelargest number of workers were employed in the Manufacturingdivision, where there were 281,110 persons or 25.1 percent of the totallabour force. The above division contained 207,088 males (almost90,000 more than any other division).
The only other major division employing more than 200,000workers at the 1971 census was the newly-classified grouping ofCommunity, Social and Personal Services with 216,527 persons or19.4 percent of the labour force.
The major division of Wholesale and Retail Trade, Restaurants andHotels, was the third largest and employed 198,315 persons.Agriculture, Hunting, Forestry and Fishing had 128,894 employees or11.5 percent of those actively engaged. Transport, Storage andCommunications workers comprised 9.2 percent of the labour forceand were slightly more numerous than the Construction major divisionwhich contained 8.4 percent of the labour force.
Sig5
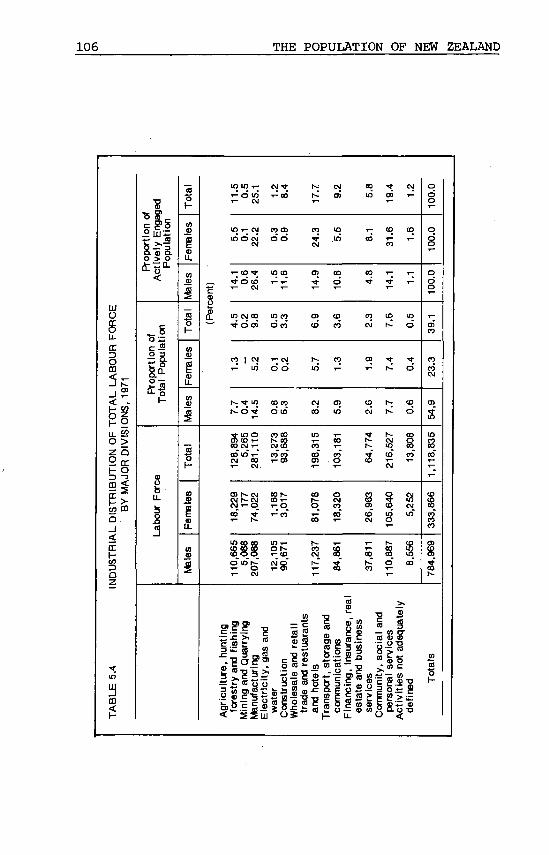
106 THE POPULATION OF NEW ZEALAND
LÓ
ego
W U ) T - CM * t - ; CM
h-" O)
CO • * CM
ui oí T^
in T- CM co c»in d o j c i d
- 10 •«• LO CD en co•* d
LO OJ CO 10 CO
d i d co*ai coco cô
co co to« s o
(0
IBLL
co | oj T- CM r coT^ LO d d LO i-"
N- Tf LO
r*" d ^COCO
d co*CO
cocoh-CO
co "f coO CO T -
CO
u.
•f
O) h - OJ GO h-CM h - CNJ CD i—CNJ 1 - O T- O
CO V ^•*~ r -
T ^ CO
O CO
T^ COCO T -
SíCO CM
to" ino
IO i -o h-i-CD
t s

THE LABOUR FORCE 1 0 7
mSid
o
et
o
o 2Z UJO _
^ . w Vf
1ST
a_i•<
US
TRIN
D
i c
_ l
mu_ ü_ J _ =
^ * • * 1
u
* -
1<ñ ^
i
108 THE POPULATION OF NEW ZEALAND
Figure 5.2 gives a pictorial representation of the industrialdistribution of male and female workers in 1971. As one would expect,there are essential sex differentials in the industrial distribution.Approximately four-fifths of female workers were concentrated inonly three major industrial divisions: 32 percent being in community,social and personal services; 24 percent in wholesale and retail tradeand restaurant and hotels; and 22 percent in manufacturing.Conversely, male workers were more widely distributed, with thelargest group — the manufacturing division — containing only 26percent of the total male labour force. Another 43 percent were dividedalmost equally between agriculture, forestry and fishing, wholesaleand retail trade, and community services. Approximately another 12percent were construction workers, and 11 percent were in thetransport, storage and communication division, in contrast, less than 1percent of female workers were in the construction division and under6 percent in the transport storage and communications division.
5.3.3 Occupational Structure of EmploymentAnalysis of the historical changes in the occupational structure of
the New Zealand labour force is also affected by the changes in theI.S.I.C. classification introduced in 1970. Therefore, as in the case ofthe industrial modified distribution, the following study of theoccupational structure is based solely on 1971 census data.
Persons actively engaged and employed in the 9 major occupationalgroups at the 1971 census by sex and as a proportion of the total andactively engaged populations are shown in Table 5.5. The largestproportion of those actively engaged were in the followingclassifications; production, transport equipment operators andlabourers (37.9 percent), clerical and related workers (16.1 percent),professional and technical workers (12.5 percent) and agriculture,forestry, fishermen etc. (11.6 percent).
The individual patterns of male and female occupationaldistribution differed significantly from one another and from that ofthe total actively engaged population. About half of the males but onlyone-sixth of the females were in the broad group "production andrelated workers". Conversely, about one-third of females but less thanone-tenth of males, were clerical and related workers. Among females,
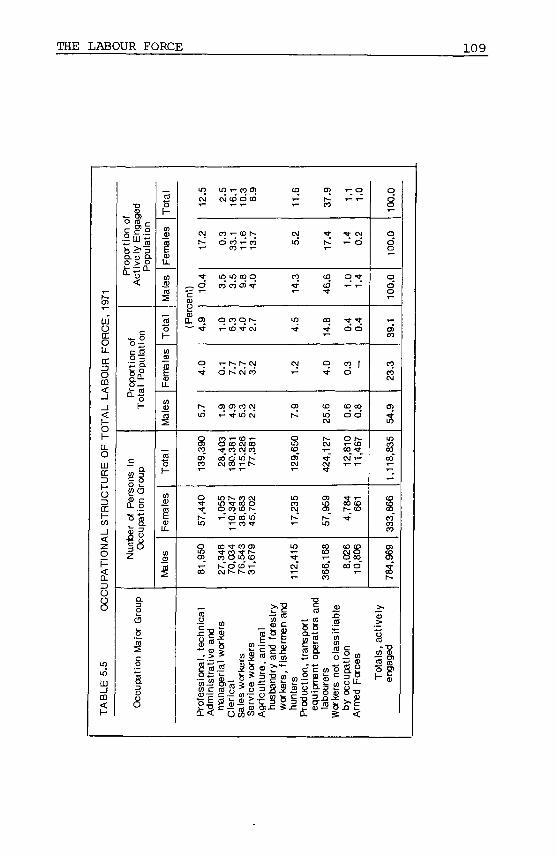
THE LABOUR FORCE 109
feuJ
oLL
irIDm
5_i
feLL
"UR
E C
RU
CT
f-C/)
1<
O
Sio8
LO
TA
BL
E 5
•o
'o CO r-
O £ • -
&> o"|t '5C L
*í
c
on <
ilat
'Í3 Q.
£•21-
3ns
in•o
up
co o
Is'S Sí._ 8.
Q.
¡öfe
|
Occ
upât
ota
les
£co
.93re
al
o'mCO
mal
(0
Mal
Tota
mal
es
cuLL.
c/)CO
Mai
LOCM
CM
Ï:
.r O
CZCD
CL O)
q
r~-LO
8CO
139,
44
0
LO
950
CO
_
LO T - CO 01
CM CO O CD
CO •*- CO I-*-
d co T^ cô
LO io co qcô cô en Tt
qcoONT ^ CD' • * CM
T ^ h~ t~; CM
O K CM CO
O) O5 CO CM
T^ T Í LO* CM
CO » -CD r -O CO CM CO^ f CO CM CO
28
,18
0,11
5,77,
LO N . CO CM
r- O CO" LÓ"i - CO T
CO T CO O)
CO 8 A CDr-~ d to" I-"CM f - r - CO
>,-o
I, te
chn
ica
ive a
ndw
ork
ers
rs kers
an
ima
lan
d f
ae
sti
sherm
en a
i
2 3
Pro
fess
i oi
Ad
min
istr
« S fe cu" >»-
CC
^Z
CMLfj
CO•er
LO
CM
œ
SCO
129,
235
*~
415
112,
man
ager
iC
leri
ca
lS
ale
s w
orl
Se
rvic
e w
Agrie
u It
ur
husb
andi
wo
rke
rs,
hunte
rs
m
transp
ort
opera
tors
;
en
COCO
CO
q
CDIOCO
CM
42
4,
959
LO
168
366,
cu
cla
ssif
iab
tn O
r- O
T d
o •*
•0- T
d d
CO |
d
CD CO
d d
T - COCO ^f
"
^t T-00 CD|^- CO
026
,806
CO O
is
Pro
duct
I oi
equi
pmei
laboure
r:W
ork
ers
nb
y occ
u[
Arm
ed F
a
>,
ils,
act
ive
1
LU
"S
o
8
O
g
oQO
öS
cocóCM
O)
iLOcoco
|1,1
18,
CD
COCOCO
969
S
1CD
(U
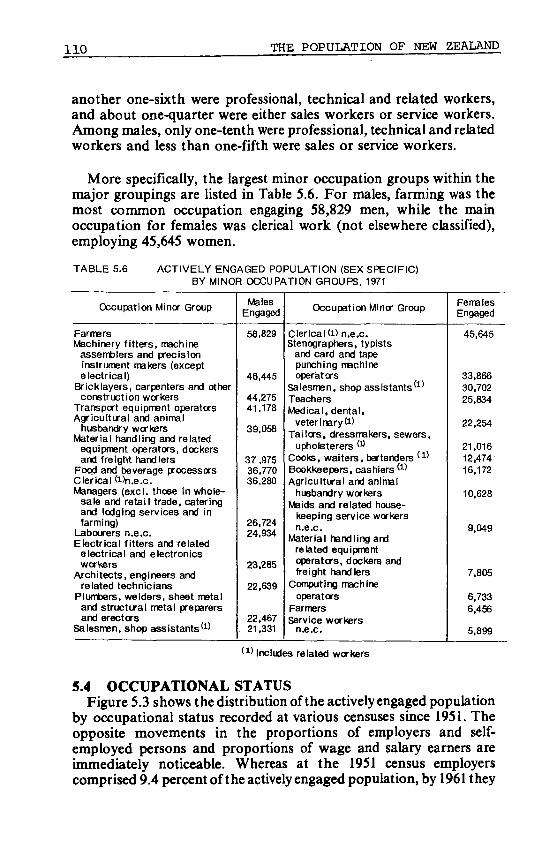
1 1 0 THE POPULATION OF NEW ZEALAND
another one-sixth were professional, technical and related workers,and about one-quarter were either sales workers or service workers.Among males, only one-tenth were professional, technical and relatedworkers and less than one-fifth were sales or service workers.
More specifically, the largest minor occupation groups within themajor groupings are listed in Table 5.6. For males, farming was themost common occupation engaging 58,829 men, while the mainoccupation for females was clerical work (not elsewhere classified),employing 45,645 women.
TABLE 5.6 ACTIVELY ENGAGED POPULATION (SEX SPECIFIC)BY MINOR OCCUPATION GROUPS, 1971
Occupation Minor Group
FarmersMachinery fitters, machine
assemblers and precisioninstrument makers (exceptelectrical)
Bricklayers, carpenters and otherconstruction workers
Transport equipment operatorsAgricultural and animal
husbandry workersMaterial handling and related
equipment operators, deckersand freight handlers
Food and beverage processorsClerical 'Dn.e.c.Managers (excl. those in whole-
sale and retail trade, cateringand lodging services and infarming)
Labourers n.e.c.Electrical fitters and related
electrical and electronicsworkers
Architects, engineers andrelated technicians
Plumbers, welders, sheet metaland structural metal préparer sand erectors
Salesmen, shop assistants'1'
MalesEngaged
58,829
46,445
44,27541,178
39,058
37 ,97536,77036,280
26,72424,934
23,285
22,639
22,46721,331
Occupation Minor Group
Clerical (i) n.e.c.Stenographers, typists
and card and tapepunching machineoperators
Salesmen, shop assistants'1'TeachersMedical, dental.
veterinary*!)Tailors, dressmakers, sewers,
upholsterers <*Cooks, waiters, bartenders ' 1 'Bookkeepers, cashiers '•"•'Agricultural and animal
husbandry workersMaids and related house-
keeping service workersn.e.c.
Material handling andrelated equipmentoperators, dockers andfreight handlers
Computing machineoperators
FarmersService workers
n.e.c.
FemalesEngaged
45,645
33.86630,70225,834
22,254
21,01612,47416,172
10,628
9,049
7,805
6,7336,456
5,899
( 1 ) Includes related workers
5.4 OCCUPATIONAL STATUSFigure 5.3 shows the distribution of the actively engaged population
by occupational status recorded at various censuses since 1951. Theopposite movements in the proportions of employers and self-employed persons and proportions of wage and salary earners areimmediately noticeable. Whereas at the 1951 census employerscomprised 9.4 percent of the actively engaged population, by 1961 they
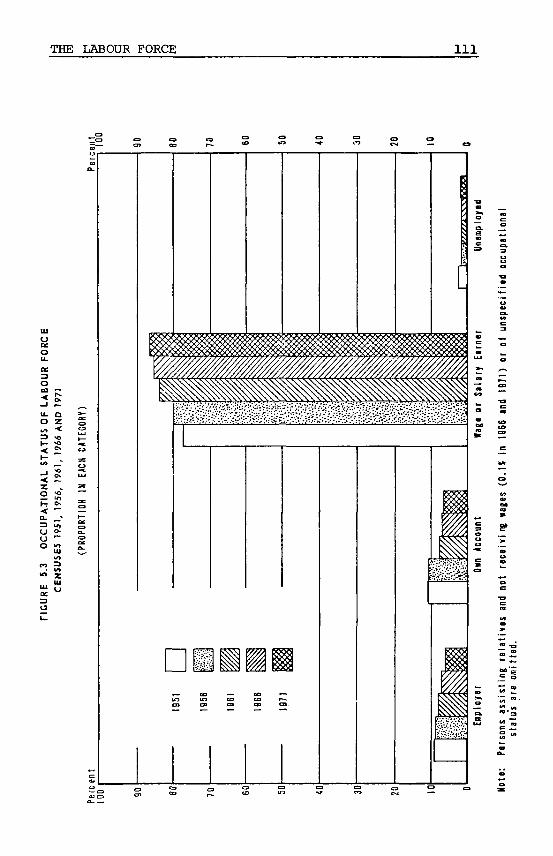
THE LABOUR FORCE 111
ii- a Ï:o z S
<
35 I
ce
O
ES
to 10 « CM
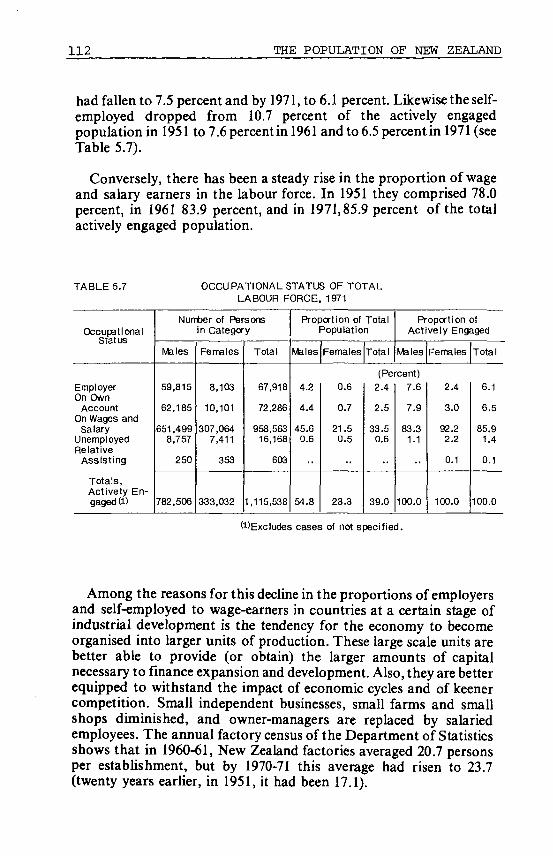
112 THE POPULATION OF NEW ZEALAND
had fallen to 7.5 percent and by 1971, to 6.1 percent. Likewise the self-employed dropped from 10.7 percent of the actively engagedpopulation in 1951 to 7.6 percent in 1961 and to 6.5 percent in 1971 (seeTable 5.7).
Conversely, there has been a steady rise in the proportion of wageand salary earners in the labour force. In 1951 they comprised 78.0percent, in 1961 83.9 percent, and in 1971,85.9 percent of the totalactively engaged population.
TABLE 5.7 OCCUPATIONAL STATUS OF TOTALLABOUR FORCE. 1971
Occupational
EmployerOn Own
AccountOn Wages and
SalaryUnemployed
Assisting
Totals,Actively En-gaged (l)
Number of Persons
Males
59,815
62,185
651,4998,757
250
782,506
in Category
Females
8,103
10,101
307,0647,411
353
333,032
Total
67,918
72,286
958,56316,168
603
1,115,538
Proportion of
Males
4.2
4.4
45.60.6
54.8
TotalPopulation
Females
0.6
0.7
21.50.5
••
23.3
Total
Proportion DfActively Engaged
Males
(Percent)2.4
2.5
33.50.6
39.0
7.6
7.9
83.31.1
100.0
Females
2.4
3.0
92.22.2
0.1
100.0
Total
6.1
6.5
85.91.4
0.1
100.0
(^Excludes cases of not specified.
Among the reasons for this decline in the proportions of employersand self-employed to wage-earners in countries at a certain stage ofindustrial development is the tendency for the economy to becomeorganised into larger units of production. These large scale units arebetter able to provide (or obtain) the larger amounts of capitalnecessary to finance expansion and development. Also, they are betterequipped to withstand the impact of economic cycles and of keenercompetition. Small independent businesses, small farms and smallshops diminished, and owner-managers are replaced by salariedemployees. The annual factory census of the Department of Statisticsshows that in 1960-61, New Zealand factories averaged 20.7 personsper establishment, but by 1970-71 this average had risen to 23.7(twenty years earlier, in 1951, it had been 17.1).

THE LABOUR FORCE 1 1 3
Other circumstances which have probably a strong bearing onrecent trends include: the comparative youthfulness of the labour forceas a result of the high post-war birth rate (young workers will, in themain, tend to be wage-earners rather than employers or self-employed); the growing re-entry of married women into the labourforce, mainly as wage-earners; and immigration (relatively fewimmigrants are likely to be employers or to set up in business on theirown account in the short term).
Moreover, as was also noted in the previous sections, there has beena continuing redistribution of the labour force away from the primaryindustries and into secondary and service industries. The ratio ofemployees to employers is much higher in most of these latterindustries.
Within the primary industries the high ratio of employers and self-employed persons has been maintained. Of every 100 persons engagedin agricultural and livestock production in 1971,26 were employers, 31were self-employed and 43 were wage or salary earners. (However, inthe farming industry in recent years a considerable number of farmershave converted their farms into companies or trusts, with their ownrole changed from that of employer to that of employee (as manager)to the company or trust.)
Within the combined major divisions of wholesale and retail trade(including hotels and restaurants) and of financing, insurance, realestate and business services (which together employed 263,089persons) 7.4 percent were employers, 4.4 percent were working on theirown account and 87.3 percent were salary or wage earners.
In the major division of community, social and personal servicesemploying 216,527 persons, the percentage of wage and salary earnerswas higher — 93.6 percent — while 3.0 percent were employers and 2.5percent worked on their own account.
The largest major division, that of manufacturing, which employed281,110 persons, had the highest proportion of wage and salaryearners (96.7 percent of the total labour force in the division). Theemployers and self-employed in manufacturing were 1.2 percent and1.3 percent respectively.
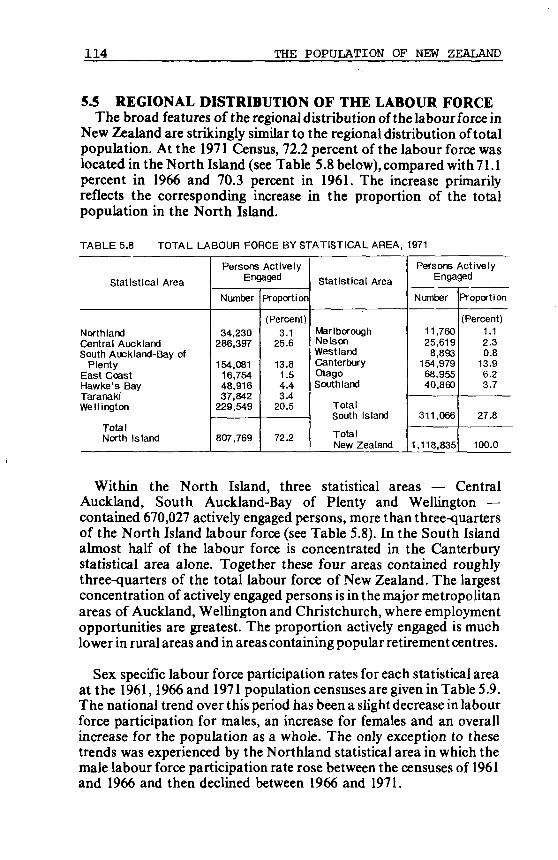
114 THE POPULATION OF NEW ZEALAND
5.5 REGIONAL DISTRIBUTION OF THE LABOUR FORCEThe broad features of the regional distribution of the labour force in
New Zealand are strikingly similar to the regional distribution of totalpopulation. At the 1971 Census, 72.2 percent of the labour force waslocated in the North Island (see Table 5.8 below), compared with 71.1percent in 1966 and 70.3 percent in 1961. The increase primarilyreflects the corresponding increase in the proportion of the totalpopulation in the North Island.
TABLE 5.8 TOTAL LABOUR FORCE BY STATISTICAL AREA,
Statistical Area
NorthlandCentral AucklandSouth Auckland-Bay of
PlentyEast CoastHawke's BayTaranakiWellington
TotalNorth Island
Persons ActivelyEngaged
Number
34,230286,397
154,08116,75448,91637,842
229,549
807,769
Proportion
(Percent)
3.125.6
13.81.54.43.4
20.5
72.2
Statistical Area
MarlboroughNelsonWest landCanterburyOtagoSouthland
TotalSouth Island
TotalNew Zealand
1971
Persons ^ t i ve lyEngaged
Number
11,76025,619
8,893154,97968,95540.860
311,066
1,118.835
Proportion
(Percent)1.12.30.8
13.96.23.7
27.8
100.0
Within the North Island, three statistical areas — CentralAuckland, South Auckland-Bay of Plenty and Wellington —contained 670,027 actively engaged persons, more than three-quartersof the North Island labour force (see Table 5.8). In the South Islandalmost half of the labour force is concentrated in the Canterburystatistical area alone. Together these four areas contained roughlythree-quarters of the total labour force of New Zealand. The largestconcentration of actively engaged persons is in the major metropolitanareas of Auckland, Wellington and Christchurch, where employmentopportunities are greatest. The proportion actively engaged is muchlower in rural areas and in areas containing popular retirement centres.
Sex specific labour force participation rates for each statistical areaat the 1961,1966 and 1971 population censuses are given in Table 5.9.The national trend over this period has been a slight decrease in labourforce participation for males, an increase for females and an overallincrease for the population as a whole. The only exception to thesetrends was experienced by the Northland statistical area in which themale labour force participation rate rose between the censuses of 1961and 1966 and then declined between 1966 and 1971.

THE LABOUR FORCE 1 1 5
Between 1961 and 1971, the North Island continued to experiencegenerally higher male, female and total labour force participationrates than the South Island, and the gap widened somewhat duringthis period. At all three censuses, the highest participation rates formales occurred in Southland (97.1 percent, 96.9 percent and 95.4percent in 1961, 1966 and 1971 respectively), for females in CentralAuckland (38.1 percent, 41.0 percent and 44.2 percent respectively)and for the total population in Wellington (66.8 percent, 67.8 percentand 68.1 percent).
The lowest rates, on the other hand, were experienced by differentregions over the ten year period. At the 1971 Census the lowest labourforce participation rate for males was in Otago (86.7 percent), whileSouthland had the lowest female labour force participation rate (30.8percent).
TABLE 5.9 TOTAL LABOUR FORCE PARTICIPATION RATES «•>(POPULATION
Statistical
Area
NorthlandCentral
AucklandSouth
Auckland-Bay of Plenty
East CoastHawke's BayTaranakiWellington
Total, NorthIsland
Marl boroughNelsonWest landCanterburyOtagoSouthland
Total, SouthIsland
AGED 15-64 YEARS) BY
1961
Males
92.4
93.9
94.394.595.394.995.1
94.4
95.491.394.092.391.797.1
92.9
Females
24.0
38.1
26.627.728.827.437.2
33.5
25.728.424.831.631.325.0
30.1
Total
(59.0
65.9
61.761.362.161.766.8
64.4
61.760.061.662.061.763.2
61.9
STATISTICAL AREA, 1961-1971
1966
Males Females
Percent)93.2
93.3
93.393.794.493.793.5
93.4
94.691.193.791.189.896.9
91.8
28.7
41.0
30.531.632.431.240.7
37.1
29.333.529.634.734.428.5
33.4
Total
62.1
67.0
62.762.963.463.067.8
65.6
63.162.463.463.162.365.0
63.1
1971
Males
91.5
91.1
91.792.793.592.891.5
91.6
92.289.591.389.036.795.4
89.6
Females
34.0
44.2
34.835.235.636.244.1
40.8
31.135.232.937.737.130.8
36.1
Total
63.3
67.5
63.764.164.365.168.1
66.4
62.762.563.663.662.064.8
63.3
1 Ratio of the number of persons actively engaged in the labour force to the number ofpersons in the population aged 15-64 years.
5.6 EMPLOYMENT TRENDSTable 5.10 contains recent data on the average monthly numbers of
notified job vacancies, placements in jobs, and registered unemployedpersons as recorded by the Department of Labour.

116 THE POPULATION OF NEW ZEALAND
In the post-war years up to 1967 the labour situation was generallycharacterised by overfull employment and a high number of vacanciesin industry.
5.6.1 UnemploymentIn 1967, following deflationary measures, there was a sharp rise in
the number of unemployed persons. By the middle ofthat year, whenseasonal workers found difficulty in obtaining off-season jobs, thenumber of unemployed rose to over 6,000 or about 0.6 percent of thelabour force.
TABLE 5.10 NOTIFIED AVERAGEPLACEMENTS
Year
196419651966196719681969197019711972197319741975
MONTHLY JOB VACANCIES,AND REGISTERED UNEMPLOYED PERSONS. 1964-1975
Average NotifiedVacancies at
of
Males
4,8476,0005,5502,6821,8522,9773,7942,2071,7902,6263,3861,640
EndEach Month
Females
1,7761,9362,2031,445
8281,1901,451
950857912
1,170411
Total
6,6137,9367,7534,1272,6804,1675,2453,1572,6473,5384,5562,051
Average PlacementsDuring Each
Males
788722674
1,3761,8211,162
796946
1,5291,3121,0672,023
Month
Females
392379337407542378290337396394345543
Total
1,1801,1011,0111,7832,3631,5401,0861,2831,9251,7061,4122,566
Average Registered Un-employed Persons atEnd
Males
511385332
3.2675.2722,1911,2252,5554,3681,591
6072,713
of Each Month
Females
139128131585
1,609735375560
1,316730348
1,453
Total
650513463
3,8526,8812,9261,6003,1155,6842,321
9554,166
Source: Department of Labour
Unemployment remained at about 6,000 until the autumn of 1968,when it rose further to 8,500 and remained about this figure during thefollowing winter. From a peak of 8,560 in July 1968 the number fellgenerally, except for occasional monthly increases, to under 1,200 inMarch 1971. The number of unemployed rose again to average 5,684for 1972, subsequently dropped to an average of 955 for 1974. Jobvacancies which moved from a general level of about 8,000 to a levelbetween 2,000 and 4,000 during 1967 and 1968, increased toapproximately 6,000 in late 1969, and averaged 3,538 in 1973 and 4,556in 1974.
In addition to a half-yearly survey of the employment position, theDepartment of Labour maintains a weekly record of registeredunemployed persons and a half-monthly record of job vacancies andjob placements. Table 5.10 is derived from their records and hencesummarises the department's operations as an employment service.
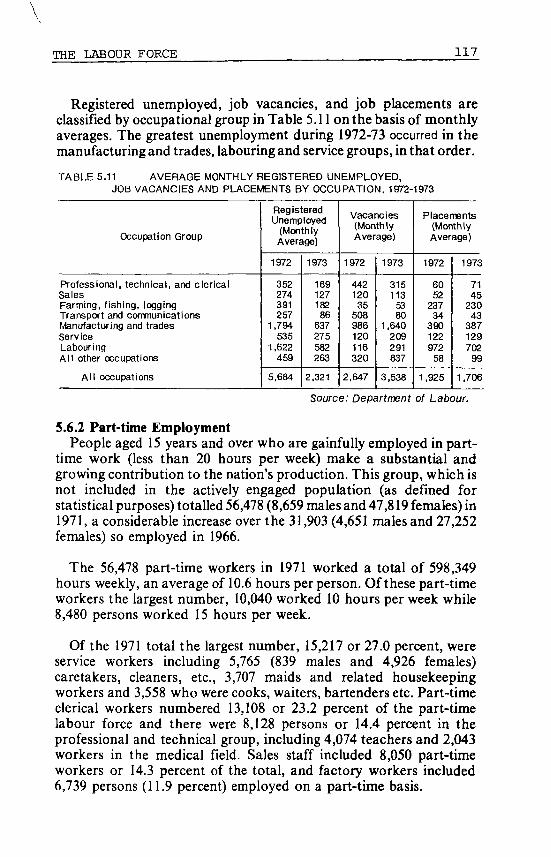
\
THE LABOUR FORCE 117
Registered unemployed, job vacancies, and job placements areclassified by occupational group in Table 5.11 on the basis of monthlyaverages. The greatest unemployment during 1972-73 occurred in themanufacturing and trades, labouring and service groups, in that order.
TABLE 5.11 AVERAGE MONTHLY REGISTERED UNEMPLOYED,JOB VACANCIES AND PLACEMENTS BY OCCUPATION, 1972-1973
Occupation Group
Professional, technical, and clericalSalesFarming, fishing, loggingTransport and communicationsManufacturing and tradesServiceLabouringAll other occupations
Al l occupations
RegisteredUnemployed
(MonthlyAverage)
1972
352274391257
1,794535
1,622459
5,684
1973
16912718286
637275582263
2,321
Vacancies(MonthlyAverage)
1972
44212035
508986120116320
2,647
1973
315113
5380
1,640209291837
3,538
Placements(MonthlyAverage)
1972
6052
23734
39012297258
1,925
1973
7145
23043
387129702
99
1,706
Source: Department of Labour.
5.6.2 Part-time EmploymentPeople aged 15 years and over who are gainfully employed in part-
time work (less than 20 hours per week) make a substantial andgrowing contribution to the nation's production. This group, which isnot included in the actively engaged population (as defined forstatistical purposes) totalled 56,478 (8,659 males and 47,819 females) in1971, a considerable increase over the 31,903 (4,651 males and 27,252females) so employed in 1966.
The 56,478 part-time workers in 1971 worked a total of 598,349hours weekly, an average of 10.6 hours per person. Of these part-timeworkers the largest number, 10,040 worked 10 hours per week while8,480 persons worked 15 hours per week.
Of the 1971 total the largest number, 15,217 or 27.0 percent, wereservice workers including 5,765 (839 males and 4,926 females)caretakers, cleaners, etc., 3,707 maids and related housekeepingworkers and 3,558 who were cooks, waiters, bartenders etc. Part-timeclerical workers numbered 13,108 or 23.2 percent of the part-timelabour force and there were 8,128 persons or 14.4 percent in theprofessional and technical group, including 4,074 teachers and 2,043workers in the medical field. Sales staff included 8,050 part-timeworkers or 14.3 percent of the total, and factory workers included6,739 persons (11.9 percent) employed on a part-time basis.
118 THE POPULATION OF NEW ZEALAND
5.6.3 Employment of WomenThe ratio of females to males in the labour force has shown a steady
increase since World War II. From 26.9 females per 100 males in 1936the ratio rose to 42.5 females per 100 males in 1971. Females comprisedonly about 21 percent of the labour force in 1936, but by 1971 this'proportion had increased to almost 30 percent (see figure 5.4). Duringthis period, the female labour force increased by 135.2 percentcompared with a 48.8 percent increase in the male work force.
Labour force participation rates for women aged 15 to 64 years arealso shown in figure 5.4. This rate,which was 26.5 per 1,000 in 1961,hadreached a high of 38.9 per 1,000 in 1971. However, despite this markedincrease the New Zealand female labour force participation rate is stilllower than that for many developed countries. (For example, in 1970,Japan, the United States and Sweden recorded rates of 54.4,46.0 and45.5 per 1,000, respectively).
The continual growth in recent years in the proportion of females inthe labour force has been largely due to the increasing tendency forwomen to continue in employment after marriage until commencingfamily formation and to re-enter the labour force as familyresponsibilities lessen. This trend has been augmented by acombination of factors including the progressively younger ages atmarriage (and consequent earlier completion of child-bearing),changing social attitudes particularly toward the role of marriedwomen, in society, greater awareness and readier acceptance of familyplanning and improved methods of contraception.
5.6.4 Married Women in the Labour ForcePrior to World War II, married women did not have a significant
role in the labour force. In 1936 only 8.2 percent of the "non-Maori"female labour force over the age of 16 years was married. This positionchanged markedly with the demands made for maintenance ofproduction during the war when a large proportion of the male labourforce was serving overseas with the Armed Forces. By the 1945 censusthe number of "non-Maori" women in the labour force had doubledand married women accounted for 17.5 percent of the "non-Maori"female labour force at that time. This trend continued. By 1961 theproportion of married women within the total female labour forcereached 38.5 percent and by 1971 it had reached the highest recordedlevel at 50.5 percent (see Table 5.12).

THE LABOUR FORCE 1 1 9
FIGURE 5.4 FEMALE LABOUR FORCE PARTICIPATION
CENSUSES 1936- 1971
FEMALE LABOUR FORCE PARTICIPATIONRATE ( 1 5 - 6 4 TEA» AGE GROUP)
FEMALE LABOUR FORCE AS PROPORTIONOF TOTAL LABOUR FORCE
22
20 -
- 22
- 20
1936 1945 1951 1956 1961
C«njui Tea r
1966 1971

120 THE POPULATION OF NEW ZEALAND
Of the 166,472 married women actively engaged in 1971, 28,080(16.9 percent) were under 25 years of age, 79,918 (48 .Opercent) were inthe 25-44 years group, 57,179 (34.3 percent) were in the 45-64 yearsgroup and 1,295 (0.8 percent) were aged 65 years and over.
The majority of the women in the labour force are wage or salaryearners and the proportion of women in this status group is higherthan that for males. In 1971, 92.2 percent of the women actively'engaged were wage or salary earners while 83.3 percent of males werein this category. Women made up 11.9 percent of all employers and14.0 percent of all those classified as "self employed".
Of the 166,472 married women in the labour force at the 19/1census, 6,425 were employers and 7,991 were self-employed. Togetherthey represented 8.7 percent of the total married women workers. Ofthe remaining 152,056 married women, almost all were receiving wagesor salaries.
TABLE 5.12 MARITAL STATUS OF FEMALELABOUR FORCE (AGED 16 YEARS AND OVER), 1966 AND 1971
Marital ÇtnttK
Never marriedMarriedLegally separatedWidowedDivorcedNot specified
Totals
1966
Numbers
137,529.116,314
4,61910,7726,188
232
275,654
Census
Proportion
(Percent)49.942.2
1.73.92.20.1
100.0
1971
Numbers
135,052166,472
7,40611,8028,018
746
329,496
Census
Proportion
(Percent)41.050.52.23.62.40.2
100.0
CHAPTER VI
POPULATION PROJECTIONS FOR
NEW ZEALAND, 1976-2001
6.1 INTRODUCTIONThis chapter contains alternative series of projections of the total
population of New Zealand for the period 1976-2001 prepared by theDepartment of Statistics. These projections were produced using the"component method" and incorporate a range of alternativeassumptions concerning future levels of fertility and migration. Theyhave as a base the estimated total New Zealand population, analysedby sex and five-year age groups, as at 31 March 1974. It should beemphasised that these projections are not strict "forecasts" or "targets"but "conditional forecasts" based on the stated assumptions.
6.2 ASSUMPTIONS EMPLOYED IN PROJECTIONS6.2.1 Fertility
Of the various components of population growth which determinethe population size in future years, projection of fertility involves thegreatest degree of uncertainty. In the past the Department of Statisticshas used varying methodological procedures in attempting to improvethe projection of future birth numbers. Recently, the department hascompleted a detailed historical analysis of the reproductive behaviourof successive birth cohorts of non-Maori women in New Zealand.However, no attempt has yet been made to project future fertility usingthe cohort approach.
The fertility assumptions employed in these projections were arrivedat using a cross-sectional analysis of fertility trends and patterns during1962-73. Three alternative variants were selected, namely, "low","medium" and "high". In general, the "low" assumption is based on acontinuation of the 1962-73 trend from 1974 to 1979 with an extensionof this trend, somewhat flattened, until 1984 and a further extension,even more flattened until 1989. The "high" and "medium" assumptionswere then derived relative to the "low" assumption using generally lessextreme declining trends with the further condition that the "medium"birth rate values were the average of the "high" and "low" values at anyprojection time-point. In the "under 20" maternal age group the "high"assumption was used as the bench-mark, and the "medium" and "low"assumptions were derived relative to this variant. Because of the
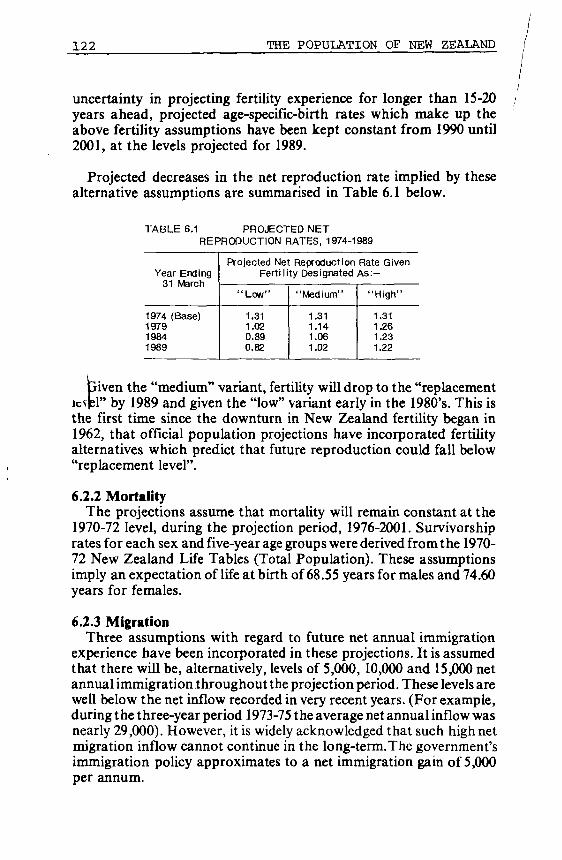
1 2 2 THE POPULATION OF NEW ZEALAND
uncertainty in projecting fertility experience for longer than 15-20years ahead, projected age-specific-birth rates which make up theabove fertility assumptions have been kept constant from 1990 until2001, at the levels projected for 1989.
Projected decreases in the net reproduction rate implied by thesealternative assumptions are summarised in Table 6.1 below.
TABLE 6.1 PROJECTED NETREPRODUCTION RATES, 1974-1989
Year Ending31 March
1974 (Base)197919841989
Projected Net Reproduction Rate GivenFertility Designated As: -
"Low"
1.311.020.890.82
"Medium"
1.311.141.061.02
"High"
1.311.261.231.22
Given the "medium" variant, fertility will drop to the "replacementic^l" by 1989 and given the "low" variant early in the 1980's. This isthe first time since the downturn in New Zealand fertility began in1962, that official population projections have incorporated fertilityalternatives which predict that future reproduction could fall below"replacement level".
6.2.2 MortalityThe projections assume that mortality will remain constant at the
1970-72 level, during the projection period, 1976-2001. Survivorshiprates for each sex and five-year age groups were derived from the 1970-72 New Zealand Life Tables (Total Population). These assumptionsimply an expectation of life at birth of 68.55 years for males and 74.60years for females.
6.2.3 MigrationThree assumptions with regard to future net annual immigration
experience have been incorporated in these projections. It is assumedthat there will be, alternatively, levels of 5,000, 10,000 and 15,000 netannual immigration throughout the projection period. These levels arewell below the net inflow recorded in very recent years. (For example,during the three-year period 1973-75 the average net annual inflow wasnearly 29,000). However, it is widely acknowledged that such high netmigration inflow cannot continue in the long-term.The government'simmigration policy approximates to a net immigration gain of 5,000per annum.
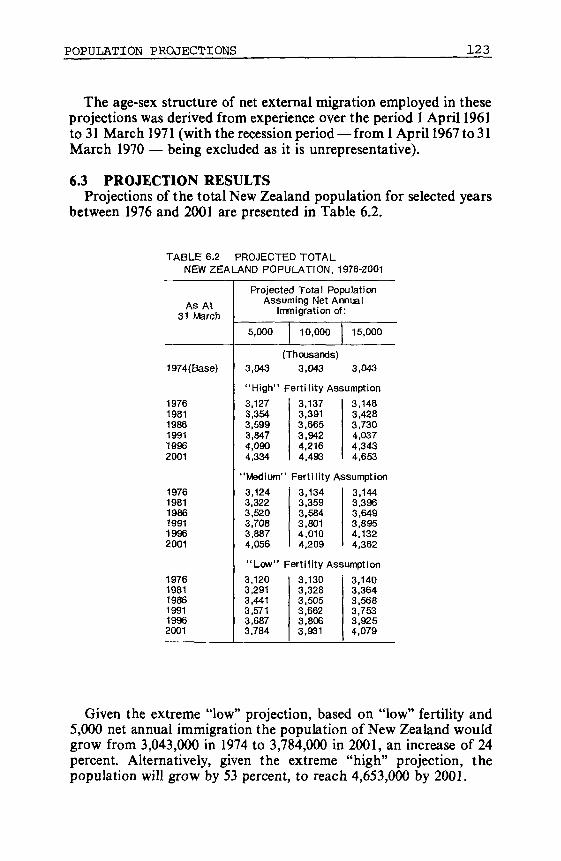
POPULATION PROJECTIONS 123
The age-sex structure of net external migration employed in theseprojections was derived from experience over the period 1 April 1961to 31 March 1971 (with the recession period — from 1 April 1967 to 31March 1970 — being excluded as it is unrepresentative).
6.3 PROJECTION RESULTSProjections of the total New Zealand population for selected years
between 1976 and 2001 are presented in Table 6.2.
TABLE 6.2 PROJECTED TOTALNEW ZEALAND POPULATION, 1976-2001
Ao A +A\ö AM
31 March
1974(Base)
197619811986199119962001
197619811986199119962001
197619811986199119962001
Projected Total PopulationAssuming Net Annual
5,000
3,043
"High'
3,1273,3543,5993,8474,0904,334
"Mediurr
3,1243,3223,5203,7083,8874,056
"Low1
3,1203,2913,4413,5713,6873,784
mmigration of:
10,000
(Thousands)
3,043
15,000
3,043
Ferti lity Assumption
3.1373,3913,6653,9424,2164,493
3,1483,4283,7304,0374,3434,653
" Fertility Assumption
3,1343,3593,5843,8014,0104,209
3,1443,3963,6493.8954,1324.362
Fertility Assumption
3,1303,3283,5053,6623,8063,931
3,1403,3643,5683,7533,9254,079
Given the extreme "low" projection, based on "low" fertility and5,000 net annual immigration the population of New Zealand wouldgrow from 3,043,000 in 1974 to 3,784,000 in 2001, an increase of 24percent. Alternatively, given the extreme "high" projection, thepopulation will grow by 53 percent, to reach 4,653,000 by 2001.

124 THE POPULATION OF NEW ZEALAND
Ul>
•<
zet
i i< 1
£ O
O
-<
30.O0 ._ l<
O
^"_ l-<^.U•<
^
111ce=>OLL
O.O
a.
ol -ií.
ozo~'VuoDC0-
\
c:c=c
-, i
\
\
N
1
I
O C3C3 C3
O O» ça in —
Ann
ual
Inn
lgra
tlo
n o
l 5
.
Ann
ual
Inn
igia
tio
n
ol
10
Wat
A
nnua
l Im
ng
ratl
on
of
Net
A
nnua
l In
iaig
rati
on
ol
and
Na
t
and
Na
t
ity
«nil
I
Ity
an
d
lill
ty
lili
ty
-art
i I
-art
i 1
LOR
Fan
LOR
Far
l
Ned
lun
1
Ned
i UM 1
!2 er c= c c
Act
ual
Pro
j act
Ass
i
AS
SI
AS
SI
AS
SI
\
\
\
\
\
\
\
\
\
\
\
_
in
i i
-
1
ih1
11
11
11
i|ii
-
-
\ i\ -
2001 , ,
1996 i;
ta
CO
<o
CB
O
D
CO
—
O»
—'
-Pro
jec
tio
ns
(As
at
ía i f i -1975
1970
1965
I960
1955
1950 : ren
'SI945¿
ta
19405
1835 J
1930
1925
1920
1915
1910
1905
1901

POPULATION PROJECTIONS 125
6.4 FORECASTING POPULATION GROWTHBecause of the considerable uncertainty regarding New Zealands'
future fertility and net annual migration, it is difficult to give a clearindication as to which of the alternative projection series, contained inTable 6.2 above, is most likely to describe future population growth.
Since these projections were produced there has been a steady andsignificant decrease in age-of-mother-specific birth rates for both the"non-Maori" and "Maori" populations of New Zealand. Availableevidence indicates that the fertility of the population as a whole willfall below the "replacement level" in the near future. The highercurrent fertility levels for Maoris and other ethnic groups (notablyPolynesians) relative to the European population may delay thisprocess, but only briefly. For short-term forecasting, therefore, the"low" fertility variant is probably the most appropriate choice.
How long will this downward trend in New Zealand fertilitycontinue and to what level will fertility fall? These are two questionswhich have to be answered before long-term forecasting of populationgrowth can be undertaken. Unfortunately, the available historicalfertility data for New Zealand and other developed countries do notnecessarily provide satisfactory answers. For a number of reasons —including varying ethnic compositions, social attidutes and economicconditions — overseas experience is not a fool proof guide forpredicting the future New Zealand situation as regards fertility. Thegeneral reduction in New Zealand fertility levels, which began in 1962,coincided with changing social attitudes towards family size andwomen in the work force and was made possible by improvedcontraceptive devices. Also, economic factors — there have been tworecessions since 1962 — may well be playing a significant role indecision making on desirable family size.
In the absence of conclusive evidence on future fertility trends the"medium" fertility variant — which implies that fertility will not fallbelow the "replacement level" for any great length of time — appearsto be the most appropriate for long-term forecasting. Forecastingfuture migration levels also involves considerable uncertainty. Whilethe average net annual immigration experienced during the fifteenyears ended 31 March 1973 was about 8,500, net immigration duringthe years years ended 31 March 1974 and 1975 amounted to 33,600and 29,600, respectively. This immigration "boom" imposes strains onthe economic and social systems of New Zealand and led to theintroduction of a restricted immigration policy. When the alternativepopulation projections were produced (about two years ago), it was

126 THE POPULATION OF NEW ZEALAND
confidently expected that this "boom" would not continue if the newpolicy measures proved effective. According to provisional migrationstatistics, recently released, net immigration for the year ended 31March 1976 was only 9,993. The present government is committed toreducing the level of immigration to about 5,000 per annum oneconomic and social grounds. Therefore, it is recommended that a netimmigration level of 5,000 be adopted for short-term and medium-term forecasting.
Long term forecasting of population growth is more hazardous. Butif historical evidence, which includes periods of low and higheconomic activity, is accepted then an annual net immigration levelnearer to 10,000 might well be more appropriate.
APPENDIX
THE COLLECTION AND COMPILATION OFPOPULATION STATISTICS IN NEW ZEALAND
Population statistics in New Zealand are collected from three mainofficial sources; the quinquennial census of population and dwellings,the vital registration system and migration records collected at ports ofentry into, and exit from.the country.
The first general census of the New Zealand population was held in1851. Early censuses, however, lacked reliability — mainly because ofthe problems in enumerating the Maori population on a single night —and were held at irregular intervals. The Census Act of 1868 providedfor a general census to be held every five years. The population censushas been held every fifth year since 1871 in years ending " 1 " and "6",except in 1931,1941 and 1946. The census due to be held in 1931 waspostponed for economic reasons and subsequently taken in 1936, whilethe one due in 1941 was postponed because of war conditions and heldin 1945. From 1951, ther " 1 " and "6" yearly pattern was resumed.
The census enumeration has always been of the de facto type,counting those persons actually in the country regardless of origin orfuture intention to travel. Months of the year and days of the week onwhich the census has been held have varied from census to census. Forreasons given in the various census reports (chiefly the chance offinding people at their usual residence) the census has, since 1926, beenheld on a week night, whereas from 1901 to 1921 it was held on aSunday night. The 1976 census of Population and Dwellings was heldon Tuesday 23 March.
The information provided by the census includes data on location ofpopulation, age, sex, marital status, education, race, religiousprofession, industry and occupation, income, birth place, dwellingsand households. An inquiry on mobility was instituted in 1971, when aquestion on usual place of residence one year earlier and five yearsearlier was asked.
Registration of births, deaths and marriages is compulsory in NewZealand and in the case of the non-Maori (European) population,dates back to 1855. However, until 1962 Maori vital events wererecorded in separate registers, which did not make provisions for asmany particulars as was the case with the European births and deaths.Since 1973 separate vital statistics for New Zealand residents of PacificIslands origin have also been available.
1 2 8
Particulars required in the registration of a birth include date andplace of the birth, sex of child, name, age, occupation and birth placeof father, name, age and birth place of mother, date and place ofmarriage of parents, their usual place of residence, number of childrenborn previously to this marriage and the ethnic origin of the father andmother. The death registration form requires information on the dateand place of death, name, age, sex, marital status, occupation, birthplace, and the ethnic origin of the deceased. Copies of the registrationforms completed for each vital event are forwarded by the Registrarsof Births, Deaths and Marriages to the Department of Statistics.Statistics on divorces are provided to the Department of Statistics bythe Department of Justice.
The Department of Statistics compiles and analyses these vitalstatistics data which are published in the department's "AnnualReport on Vital Statistics". Statistics on causes of death are compiledand published by the National Health Statistics Centre, Departmentof Health.
Migration statistics are compiled from migration cards obtained byCustoms authorities from each person arriving in, or departing from,New Zealand. The cards contain information on age, sex, date andplace of birth, marital status, purpose of visit or purpose of journeyoverseas, occupation, nationality and ethnic origin of the migrant.Along with other demographic data, migration statistics are compiledand analysed by the Department of Statistics and published in theannual report on "Population and Migration".


BIBLIOGRAPHY
Inter-Departmental Committee on Population Questions, Wellington.New Zealand Country Statement 1974, distributed at the WorldPopulation Conference, Bucharest, Romania, August 1974.
Inter-Departmental Committee on Population Questions, Wellington.New Zealand Population Policy Guidelines. Wellington, 1975.
Khawaja, Mansoor A. "Cohort Fertility in New Zealand."Proceedings of the First Annual Conference of the New ZealandDemographic Society. Wellington, July 1975.
New Zealand Demographic Society (Inc). Submission to the RoyalCommission to Inquire Into and Report Upon Contraception,Sterilisation and Abortion. Wellington, 1975.
New Zealand Department of Health. Medical Statistics Report,1971.Part 1 — Mortality and Demographic Data, Wellington:Government Printer, 1973.
New Zealand Department of Statistics. "Internal Migration andUrbanisation." Paper presented to Fourth East-West PopulationCensus Conference, 1975.
New Zealand Department of Statistics. Monthly Abstract of Statistics,July 1975. Wellington: Government Printer, 1975.
New Zealand Department of Statistics. "New Zealand." UnitedNations Second Inquiry on Population Growth andDevelopment. Wellington, 1974.
New Zealand Department of Statistics. New Zealand Census ofPopulation and Dwellings, Volume 1 — "Increase and Locationof Population." 1951, 1956, 1961, 1966, 1971, Wellington:Government Printer.Volume 2 — "Ages and Marital Status." 1951, 1956,1961,1966,1971.Volume 3 — "Religious Professions." 1951, 1956, 1961, 1966,1971.Volume 4 — "Industries and Occupations." 1951, 1956, 1961,1966, 1971.Volume 5 — "Incomes." 1971.Volume 6 — "Education and Birthplaces." 1966.Volume 7 — "Race." 1966.Volume 8 — "Maori Population and Dwellings." 1966.Volume 9A — "Dwellings." 1966.Volume 9B — "Households." 1966.Volume 10 — "General Report — The New Zealand People."1966.
New Zealand Department of Statistics. New Zealand Life Tables,1970-72. Wellington: Government Printer, 1975.
New Zealand Department of Statistics. New Zealand OfficialYearbook 1975. Wellington: Government Printer, 1975.
131
New Zealand Department of Statistics. New Zealand Population andMigration 1971-72. Wellington: Government Printer, 1974.
New Zealand Department of Statistics. New Zealand Population andMigration 1972-73 and 1973-74. Part A-Population.Wellington: Government Printer, 1975.
New Zealand Department of Statistics. "Recent Trends in NewZealand Fertility." Supplement to Monthly Abstract of Statistics,November 1975. Wellington: Government Printer, 1975.
New Zealand Department of Statistics. Vital Statistics 1973.Wellington: Government Printer, 1975.
New Zealand Ministry of Works. Population Forecasts 1971-1991.Recent Population Trends and Forecasts of Future Growth ofRegional and Local Areas. Wellington: Government Printer,1972.

132
C. MAPSNEW ZEALAND
- NORTH ISLAND -
17 3"
STATISTICAL AREAS
I
::$tf NORTH LAN Dig;
WHANGAREI
Á •'Ï «
AU.CK LANDES? ?.V~;— PAPATOETtfgfMANliXAU \-.
w f AU RANGA
• HAMILTONÍLfo SOUTH AUCKLAND
-BAY OF PLENTY•ROTORUA
• EAST Í Í ;COAST M
WELLINGTON/^:-1"--..
•MASTERTON
" 2 " I " " 1 7 4 ' 1 7 5 ' 1 7 6 * 177" 176* 1 7 9 '
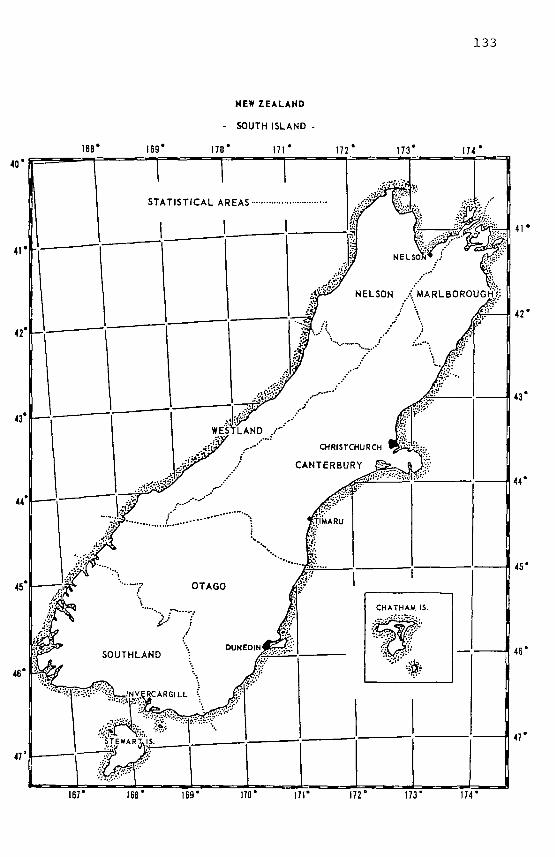
1 3 3
NEW ZEALAND
- SOUTH ISLAND -
170* 171* 172 "
NELSON A MARLBOROUGH?;
CHRISTCHURCH
CANTERBURY
41'
47'
42°
43*
44*
45*
46"
47°
173" 174'