Embed Size (px)
Citation preview

INSTITUTO DE ESTUDIOS ECONÓMICOS
THE POLITICAL ECONOMY
OF CATALAN INDEPENDENCE
SEPTEMBER 2014
INSTITUTO DE ESTUDIOS ECONÓMICOSCastelló, 128, 6ª 28006 Madrid
Tel.: (34) 91 782 05 80. Fax: 91 562 36 [email protected]


THE POLITICAL ECONOMY
OF CATALAN INDEPENDENCE
José Luis Feito Higueruela
Ángel de la Fuente
Guillem López-Casasnovas
Joan Rosselló Villalonga
Clemente Polo
SEPTEMBER 2014
© 2014 José Luis Feito Higueruela, Angel de la Fuente, Guillem López Casasnovas, Joan Rosselló Villalonga y Clemente Polo
© 2014 INSTITUTO DE ESTUDIOS ECONÓMICOS C/ Castelló, 128 - 6.ª planta 28006 Madrid Tel.: 917 820 580 [email protected] www.ieemadrid.es
Depósito Legal: M-27010-2014
Layout and design: Erica Alonso Alba
Printed by Fragma Printed in Spain - September 2014
All rights reserved. No part of this publication may be transmitted in any form or by any means. Nor may any part of this publication be included as a reference in any other work without authorization. Please contact CEDRO (Centro Español de Derechos Reprográficos, www.cedro.org) if you need to photocopy or scan any part of this publication.

INDEX
Introduction
Instituto de Estudios Económicos.............................................................................................7
JOSÉ LUIS FEITO HIGUERUELA
The pitfalls of Catalan independence’s economic postulates...........................................9
1. Introduction.......................................................................................................................10
2. The importance of economic factors in fostering the pro-independence
sentiment in Catalonia..............................................................................................11
3. The fiscal crisis of Spain and Catalonia................................................................15
3.1. Fiscal consequences of the boom and the economic crisis...........................16
3.2. The fiscal crisis of Catalonia..............................................................................19
4. The plundering myth and the reality of the fiscal treatment of Catalonia....23
4.1. The fiscal balances of Catalonia.......................................................................25
4.2. The fiscal treatment of Catalonia.....................................................................31
5. The economic costs for Catalonia of independence and self-determination
referendums................................................................................................................34
5.1. The costs of independence for Catalonia..........................................................36
5.2. An independent Catalonia within Europe.......................................................40
5.3. The cost of the self-determination referendum or plebiscite election..........43
6. Conclusions.................................................................................................................46
Bibliographical appendix................................................................................................51

ÁNGEL DE LA FUENTE
Is Catalonia being fiscally mistreated?................................................................................55
1. Introduction: The current state of affairs of the debate in Spain.....................56
2. Is the Catalan regional government underfinanced?..........................................56
3. Is Spain robbing us?..................................................................................................59
4. This doesn’t happen anywhere else?.....................................................................62
4.1. Germany..............................................................................................................62
4.2. United States.......................................................................................................64
4.3. Italy.....................................................................................................................65
4.4. UK, Australia and Canada................................................................................66
5. Conclusion: much ado about nothing....................................................................68
References...........................................................................................................................70
GUILLEM LÓPEZ-CASASNOVAS and JOAN ROSSELLÓ VILLALONGA
The debate of fiscal balances: two different questions, two different methods,
two different results..........................................................................................................73
1. Introduction................................................................................................................73
2. Two methods...............................................................................................................74
3. Questions and results................................................................................................76
4. Concluding remarks..................................................................................................78
CLEMENTE POLO
The secessionist challenge and the economic consequences of Independence....81
1. Introduction.......................................................................................................................82
2. The political challenge to the State and the economic case for secession.............84
3. Catalonia a privileged region of Spain.........................................................................87
3.1. Might Catalonia have become the Holland of southern Europe?.......................88
3.2. The economic consequences of the Succession War (1702-1714)........................88
3.3. Catalonia ‘the workshop of Spain’...........................................................................89
3.4. From the end of the 19th century to the Civil War...............................................90
3.5. Economic recovery during Franco’s regime..........................................................91

3.6. The protection of the national market....................................................................91
3.7. Conclusions.................................................................................................................92
4. The weight of Catalonia’s exports to the ROS and the consequences of the
rupture of the national market and the exit of the EU...............................................93
4.1. The importance of the Spanish market at the start of the 21st century...............94
4.2. Effects of independence on Catalonia’s exports.....................................................96
4.3. Antràs and Ventura’s estimates………...............................................................….98
5. The ‘eurization’ of the Catalan economy.....................................................................99
5.1. Effects on financial institutions, interest rates and asset holdings………..........99
5.2. Effects on foreign investment, money supply and financial stability...............100
5.3. Fairy tales………........................................................................................................101
5.4. Conclusions…………................................................................................................101
6. Catalonia’s fiscal balance and the fiscal dividend of independence....................102
6.1. On the concept of fiscal balance and fiscal deficit………....................................102
6.2. Catalonia’s fiscal balance and fiscal deficit with the State Central
Administration.........................................................................................................103
6.3. The role of the spatial dimension……..............................................................….103
6.4. A closer analysis of the CFB results………....................................................…...105
6.5. The independence’s manna…..........................................................................…...106
7. General conclusions……………………………………..........................…………….107
References……………...................................................................................................…….111
Appendix 1. The input-output model…………….....................................................……114
Appendix 2. Detailed sectoral results for total production............................................116
Appendix 3. Trade intensity in several disintegration episodes in Central Europe.120


7
Introduction
Instituto de Estudios Económicos
The Instituto de Estudios Económicos (IEE) is a private research organization
aimed at promoting and publishing studies and analysis in the economic and social fields, mainly concentrating on themes concerning Spain and with a special focus on private enterprise and market system as most efficient mechanisms for resource allocation. The IEE now offers an analysis of the economic consequences which a hypothetical secession of Catalonia could bring along and also reviews the financial situation of Catalonia, badly financed according to the recurring complaints of Catalan nationalists.
The IEE has selected a series of major articles previously published on these subjects such as the studies produced by Ángel de la Fuente (“Is Catalonia being
fiscally mistreated?”) and Clemente Polo (“Catalonia: The secessionist challenge and the economic consequences of independence”). The President of the IEE, José Luis Feito, has also published a study, originally prepared for Panel Cívico, which is included in this review under the title “The pitfalls of Catalan independence’s
economic postulates”. Finally, Guillem Lopez-Casasnovas and Joan Rossello offer a detailed analysis of fiscal balances in Spain (“The debate of fiscal balances: two
different questions, two different methods, two different results”). The IEE thus continues to promote discussion and analysis of key regional
economic issues in Spain. Most of these themes have already been touched upon in previous works by the IEE such as “El Ajuste Fiscal de las Comunidades Autónomas visto desde dentro”, “La Cuestión Catalana I”, “Propuestas para la Reforma de Financiación Autonómica”, “La Cuestión Catalana II: Balanzas Fiscales y Tratamiento Fiscal de Cataluña.


9
THE PITFALLS OF CATALAN INDEPENDENCE’S ECONOMIC POSTULATES
José Luis Feito Higueruela(*)
President of the IEE
January 2014
Study prepared for:
(*) President of the Instituto de Estudios Económicos. The opinions in this study are the author’s personal opinions and
do not have to coincide with those of the IEE or other institutions to which that author might be linked.

The political economy of Catalan independence
10
1. Introduction
The purpose of this study is to critically examine the economic postulates of the
independence movement in Catalonia. Although this examination inevitably requires
dealing with certain social and political aspects of Catalan society’s drift towards
secession, the study focuses on the economic reasoning of that movement and does
not address in depth other dimensions of the independence phenomenon.
The first section aims to justify this study by highlighting the decisive role
played by economic factors in accentuating pro-independence sentiment in
Catalonia.
The second section analyses the economic and fiscal crisis in Spain and Catalonia. The
purpose of this second section is to firstly show that the economic crisis of 2008 caused
massive fiscal imbalances in each and every public administration in Spain, imbalances
whose severity in the various regions has been proportional to the excesses committed
before the crisis and the fiscal policies pursued by the respective regional governments. It
will be shown that those imbalances have nothing or little to do with the fiscal treatment
that these governments receive from the regional financing system. It is also suggested in
this section that the magnitude of these imbalances in Catalonia's case and the high
political cost of adequately addressing them is one of the main reasons for the drift
towards independence of Catalan nationalism. In my opinion, one basic key to
understand the dangerous manoeuvres towards independence of those who have never
supported it and the open rebellion of those who have always been looking for it lies in
the fiscal crisis in Catalonia.
The third section shows that there is no empirical basis for justifying pro-
independence sentiments based on fiscal plundering as claimed by the popular slogan
“Spain robs us”. To this end, a clarification of the concept and meaning of the fiscal
balances commonly presented in Catalonian a circles to prove these assertions is
provided and an analysis is undertaken of the fiscal treatment of Catalonia by the
regional financing system.
The fourth section evaluates the main studies on the economic costs of Catalan
independence conducted to date and some thoughts on the costs of holding a plebiscite
election or self-determination-referendum. Special attention is devoted to how an
independent Catalonia would fit within Europe, because the magnitude of the economic
costs of independence would to a very large extent depend on this. The final section
summarizes the main conclusions of the study.
For easier reading, the main text contains only essential bibliographical references.
Any reader interested in knowing the main sources consulted in this work or in exploring
the subject in more detail can check the bibliographical appendix, which lists the most
important articles and books used for the various sections in the study. To encourage the
reading of this essay and make it as accessible as possible, each of the sections is self
contained so that their arguments can be followed without having to necessarily read the
other sections.

The pitfalls of Catalan independence’s economic postulates
11
2. The importance of economic factors in fostering the pro-independence
sentiment in Catalonia
As mentioned in the introduction, the aim of this study is to examine the economic
foundations of Catalan independence as stated by those who seek or support the
secession of that autonomous region. In essence, they argue: 1) that Catalonia is
economically oppressed by the rest of Spain, and 2) that independence would free it from
this oppression and allow Catalan citizens to achieve a haven of well-being presently
denied to them by belonging to Spain.
Naturally there are other factors not strictly economic behind the rise in pro-
independence sentiment in Catalonia in recent years. Various emotional and political
factors undoubtedly play a part. Sentiments are not unrelated to economic factors,
though, because few things inflame more the emotions of such a hardworking people
as Catalans as the thought, however unfounded, that someone is stealing their wallet or
arresting their economic progress. With regard to political factors, the most important
is the fact that the Catalan government has been controlled since 2003 by political
coalitions increasingly dominated by factions whose main goal is Catalan
independence. Throughout Spain’s history, Catalan separatism has aggressively
challenged the government of the nation during periods of acute political or economic
crisis.
Having said this, these coalitions have managed to hold onto power mainly
because they have been able to convince most of Catalan society of the two above
mentioned economic postulates. The first being that their living conditions have
unduly worsened not because of the economic crisis which the whole country has
suffered to a greater or lesser extent, or by the disastrous management of the regional
Catalan governments, but because of the excessive withdrawal of resources to pay for
the welfare of the rest of Spain. The second is that their standard of life would
improve dramatically with independence. Although it may not appear so at first, the
validity of one of these two propositions does not necessarily imply the veracity of the
other. In other words the first might be true but the second false, or the first false and
the second true, or both of them true. It may also be the case, as I believe and hope to
show in this study, that both are false. It should be stressed that this study only
examines the economic assumptions of the independence movement. It does not
analyse other social or political dimensions which may advise against secession even
if, contrary to what is maintained here, this was economically profitable for Catalonia.
What this study aims to do is simply highlight the blatant fallacies of the economic
arguments that pro-independence groups truculently throw out to justify the secession
of Catalonia. Arguments, it should be noted, that have persuaded the majority of
Catalan society.
The Leaders of Convergencia i Unió (CiU) and Ezquerra Republicana (ER) have
often linked economic factors to their pro-independence discourse. Indeed, the President
of the Catalan government and several of his ministers have repeatedly stated how Spain
economically oppresses Catalonia and that independence is the only option to maintain
the welfare state in Catalonia. More recently they have prepared a list of economic
grievances according to which “Madrid” owes Catalonia a huge sum of around 9 billion
euros, half of which stem from an alleged breach of the ruling of Catalonia´s Statute on

The political economy of Catalan independence
12
the public investment of the State in Catalonia .This claim that the State owes them
money for public investment not made in Catalonia is surprising. The Catalan
government knows perfectly well that the article of the Statute which requires that the
central government invests in Catalonia a percentage of its public investment equivalent
to the contribution of that autonomous region to Spanish GDP was amended by the
Constitutional Court, with the amount of that investment being now dependent on
national budgets approved by the Spanish parliament, so no debt whatsoever can be
owed to Catalonia on this account. Claiming the payment of this non-existent debt can
only be understood as an attempt to manipulate public opinion and inflame the passions
of Catalan society encouraging it to think that Spain “is robbing them” money for
investment, which actually does not exist and which in no case has been taken from
them. In the same vein, practically every member of the Catalan government and the
main leaders of ER have repeatedly exhibited the negative size of one of the many
variants of the fiscal balance of Catalonia for proving both the plundering which
according to them this region suffers and the economic potential of an independent
Catalonia.
Based on the fallacies of fiscal plundering and huge tax revenues that
independence would bring, Catalonia’s governing parties are looking to benefit from
electoral gains that a rise in pro-independence sentiment could bring them, while at
the same time obtaining more resources and funding in order to soften as much as
possible the fiscal adjustments that this region needs to do. In this respect it must be
said that Catalonia’s budgetary problems, appreciably more serious than those of
most other regions as it has made fewer deficit adjustments than others, is not due to
any fiscal plundering or debt unpaid by “Madrid” or to any policy of re-
centralisation of powers or contempt of the Catalan reality as pro-independence
groups claim. As it will be shown below it is simply due to the relatively higher
levels of public spending and regional debt than other regions.
For the purpose of this section it is important to state that Catalan secessionists have
repeatedly cited the plundering to blame Spain for increases in the regional taxes and
the hidden public debts accumulated by not paying their suppliers, not to mention the
cuts in public investment and social spending carried out by the Catalan government.
Encouraged by these assertions, widely disseminated by the Catalan media, many
Catalan businesses and families have become convinced that their economic pains are
not due to the lack of resources, especially severe in times of crisis, but rather to the
contempt that Spanish governments have for Catalonia, diverting resources from there
to other regions in the country. Likewise, most Catalan citizens do not blame successive
Catalan governments for the particularly heavy tax increases they have had to endure
but rather the Spanish government. It is therefore not surprising that persuaded by the
ideas of secessionist politicians a significant part of Catalan society views independence,
or at least the call for independence, as the only way to stop the adjustments and
improve their living conditions. Given the persistent intensity and widespread
dissemination of these proclamations, what is truly surprising and a source of hope for
the future, is not that 40% and 60% of Catalans want independence, but rather that 60%
or 40% do not want it.
It is difficult to overstate the strong influence of economic aspects in Catalan society’s
drift towards secession. As fuel for the fire of independence, reference has occasionally been

The pitfalls of Catalan independence’s economic postulates
13
made to alleged or actual restrictions on the language policy of the Catalan government
imposed by Madrid or appeals lodged against the Statute approved by the Catalan
parliament and its subsequent repeal or revision by the Constitutional Court of part of its
articles. However, if the majority of Catalan citizens who have switched to the pro-
independence side in recent years were to be asked to list the inconveniences that they have
suffered in using Catalan, or the statutory articles whose repeal or amendment turned them
towards pro-independence, it is extremely unlikely that they would be able to provide
precise answers. On the other hand, it is safe to say that if these people were to be asked for
their reasons for calling for independence their replies would be basically economic in
nature. In my opinion, part of the rise in the pro-independence movement in Catalonia,
difficult to quantify but very significant, based on those citizens who stated in the surveys
that they were in favour of independence prior to the economic crisis of 2008 and those who
do so today, is due to the widespread belief that their economic woes are down to the
“Spanish State” and that independence would enable them to improve their living
conditions.
I also believe that it would not be untrue to say that most Catalans think that merely
requesting independence and holding a referendum, even if it was non-binding, would give
them access to more fiscal resources. As previously stated, in recent years Catalan
citizens have become convinced that they pay higher taxes and suffer greater public
spending cuts and non-payment by their administrations than citizens and
businesses elsewhere in Spain because they are constitutionally bound to transfer
an excessive amount of resources to the rest of the country. Consequently, many
Catalans believe that simply negotiating with the alternative of independence on
the table would encourage amendment of the articles of the Constitution or the
organic laws necessary to substantially increase the fiscal resources available to
them.
In any case, the deterioration in the living conditions of Catalans since 2008,
slightly less than that suffered generally by the rest of Spaniards as will be shown later,
and their conviction that this deterioration is mostly attributable to the government of
Spain cannot solely explain the rise in pro-independence. In most countries with federal
structures like Spain there are fiscal tensions between regions, and between the regions
and the central government, and there are always regions that justly or unjustly
consider that they are particularly poorly treated fiscally. This is often the case with the
richest regions whose citizens contribute relatively more than those from other regions
to state coffers and receive from them relatively fewer resources than the others. But the
complaints and resulting tensions generated by those situations are not channelled in
any country along secessionist paths unless there are parties with significant levels of
power that have as a short or long-term objective the independence of the regional state
in question. These parties shamelessly exploit fiscal and financial tensions, particularly
acute in times of crisis, to hastily advance their secessionist project. The existence of
these parties and factions in Catalonia is undeniable and so is the fact that there are
Catalans who want independence even if it comes at a high economic cost. Politicians
who represent these Catalans should be honest and rigorous with the data and not
manipulate or misinterpret them, much less hide any significant short and long-term
losses in welfare brought about by their project. However, Catalan citizens who
demand independence because they honestly believe that they are being suffocated
The political economy of Catalan independence
14
economically and that things would be much better outside than inside Spain, should
be encouraged to reconsider the economic grounds on which their shift towards
independence is based. This study is particularly aimed at these Catalans more than
any other group of Spaniards.
Nothing of the above implies that Catalan society can be easily manipulated.
Indeed, this study is being conducted because its author is convinced of the opposite,
is actually the truth. When a society as rich as Catalonia faces a severe economic crisis
which jeopardises its prosperity it is normal to feel inclined to consider the
redistribution mechanisms of the State as the cause of its crisis and their reformulation
as the solution to it. In these circumstances, sayings such as “Spain robs us” or “we
would be better outside than inside of Spain”, repeated ad nauseam by the Catalan
government, reaffirm these instinctive reactions to the crisis. The coincidence between
what our instincts tell us and official explanations which distort reality tell us exerts a
powerful fascination over the mind of individuals. For example, our instincts tell us
that the sun rises in the east and sets in the west, and any explanation questioning the
Ptolemaic view of reality was long considered heretical nonsense. Only knowledge of
basic theoretical physics could allow overcoming our instincts and realising that,
contrary to appearances, it is the earth that revolves around the sun and not vice
versa. As with physics, economic reality is not always easily understood by those who
are not trained in the basic theoretical knowledge. Unfortunately, the economic
knowledge required to thoroughly understanding the fiscal treatment of Catalonia
and the costs of its independence are relatively complex and not available even to
professional economists unless they have made the necessary effort to acquire it.
When complexity and rigour come face-to-face with popular saying, the battle for
public opinion is always won by the saying, at least in the short term, particularly if
those who coin the saying have a virtual monopoly of the media in that region. This
has happened with the false economic postulates of pro-independence. But
increasingly these fallacies have to confront more rigorous and better founded
alternative versions which sooner or later will penetrate society and erode their power
of attraction to the general public.
It must be noted, however, that it is not easy to shake beliefs so firmly entrenched
today in Catalonia, such as “Spain robs us” or that “independence is much more profitable than
carrying on as we are”. As I hope to show, these pro-independence economic assumptions
are founded on quicksand and sink under the weight of reason and evidence. Of course, as
previously noted, an intellectual effort must be made to apply reason and assimilate the
evidence. Moreover these beliefs of many Catalans, who mistakenly attribute the cause of
their economic problems to belonging to Spain and their remedy to abandon it, suggest an
easy, almost automatic way out of the crisis. So it won’t be easy to shake them. Because if
those beliefs are not true, there is no other alternative than the painful path of reforms and
adjustments needed to bring spending and public debt down to sustainable levels. It is
well known that it is not easy for human nature to accept arguments and evidence that
frustrate hope. Neither it is to abandon simple mono-causal explanations of the crisis and
automatic and painless solutions for complex explanations and therapies with varying
degrees of sacrifice.
Moreover, these beliefs have been formed over a long period of time based on
unilateral and wrong interpretations of Catalan economic reality. In other words, the

The pitfalls of Catalan independence’s economic postulates
15
everyday interpretation of important economic data such as Catalonia’s fiscal balances,
the territorial distribution of public investment from central government, the rescuing of
bankrupt saving banks, aid from the regional liquidity fund or the fund to pay suppliers,
deficit targets set for the autonomous regions, etc. until very recently reached Catalan
citizens almost exclusively from separatist platforms. The same has happened with
descriptions of what a future independent Catalonia can expect. Analyses and
interpretations of from non separatist spheres have until recently been scarce, particularly
those from Spain’s central government. That is perhaps why analyses and interpretations
opposed to the pro-independence view on the economic benefits of secession that have
proliferated lately are systematically labelled as exaggerations of self-interest groups
hurled out to frighten Catalan society and prevent their right to freely decide their future.
This stigma that secessionist circles attribute to any study or opinion that questions the
plundering or the idyllic future of an independent Catalonia should be reflected upon by
Catalan society. It should not be unquestionably accepted that anyone who says that the
mere exercise of the right to decide, let alone the eventual independence of Catalonia,
would produce very painful economic consequences, does so directed by the government
of Spain or in its own interests to preserve the status quo. Not everything that the central
government or those who would prefer Catalonia within Spain say is necessarily false.
These analyses should not be disdainfully ignored claiming that their intention is to
groundlessly frighten Catalans in order to subdue their desire to freely decide their future.
It should not be thought either that any study that asserts that such decisions would
involve no more than a minor and rapidly fleeting economic pain must always be
scientifically pure, objective and, above all, necessarily true.
3. The fiscal crisis of Spain and Catalonia
To fully understand the efforts made by Catalan secessionists to divulge the
economic benefits of independence and their acceptance by the majority of Catalan
society, one must firstly consider two exceptional phenomena in Spain’s economic
development over the past 20 years. The first is that from 1994 (the year when the early
nineties crisis ended) to 2007 Spain enjoyed the longest and strongest span of economic
growth in its recent history. The second is that since 2008 the country has been
immersed in the severest and longest recession since, at least, the post-Civil War years.
Although, naturally, despite the crisis, current income levels are higher than those
of the 1990s, that sequence of fast and strong growth followed by an equally intense and
prolonged recession has had very harmful political consequences for Spain. One of these
consequences, in my view, is the emergence of secessionism in political factions which
had previously not considered it and the subsequent rise in pro-independence sentiment
in Catalan society. To grasp this contention, it is necessary to analyse in detail both the
influence of economic expansion on public revenues and spending, particularly on those
of the regions, as well as the devastating impact of the subsequent crisis on the public
revenues of all areas of government. The basic relationship between the economic
phenomena highlighted, fast and prolonged growth followed by a sudden and long-
lasting recession, and the rise in pro-independence sentiment are summarised below.

The political economy of Catalan independence
16
3.1. Fiscal consequences of the boom and the economic crisis
The rapid pace of economic expansion after the adoption of the euro led to even
faster growth of the public revenues of all public administrations and those of regions in
particular. The revenue of regional governments grew faster than that of the central
government because most of the taxes generated by the property boom were collected by
the regions and because successive regional financing agreements transferred an
increasing amount of resources from central government to those regional public
administrations. This was possible because the big cut in interest rates and strong job
creation through the expansion period drastically reduced the public spending of central
government on interest payments and unemployment during those years, while rapid
GDP and employment growth caused public revenues to soar. This reduced central
government deficit and debt by more than expected and helped to meet the demand of
regions for additional resources. Consequently, the strong revenue growth of all public
administrations generated even faster growth in non-financial public spending, i.e.
public spending available for financing investments, health, education and other public
activities. So, all public administrations embarked on ambitious public investment
projects, which additionally benefited from abundant European funds, and significantly
expanded their education and health programmes and all types of consumptive and
representative current spending. Growth in public spending and in the political and
administrative bureaucracy that supports it both in the regions and the rest of the public
administrations was based on the tacit assumption of its irreversibility or, rather, the
sustainability of the public revenue that financed it.
The abrupt halt in economic expansion in 2008 led to the collapse of public
revenues, a collapse which due to the nature of Spain’s regional financing system had a
delayed effect on regions’ revenues. All public administrations faced a marked drop in
public revenue with a very rigid spending structure. Central government had to face
increased spending on pensions, unemployment benefits and interest on public debt
with falling public receipts. The regions, depending on their level of indebtedness, also
recorded a significant increase in the interest burden and suddenly found themselves
without the necessary public revenue to meet their spending needs, particularly on
education and health whose service levels were considered immovable downward. Not
all regions had increased public spending during the boom at the same rate and not all
reacted in the same way during the initial phases of the crisis. Catalonia was one of the
regions that most increased its level of spending and public debt during the boom and
among the slowest to react and least vigorously make adjustments in response to the
crisis. This was possible through significant increases of its already high level of
indebtedness. However, the crisis came with (in fact this was one of its driving forces) a
huge increase in the cost of financing the public debt, leading to a sharp rise in the
interest burden of the most indebted regions such as Catalonia. This increase in the cost
of servicing the debt has absorbed a growing part of the diminishing public revenues
available to finance social spending and other operating costs of the regions
governments putting pressure on the economic and social situation in the corresponding
territories.
These are the economic circumstances surrounding both the Catalan governments’
attempts to improve as much as possible the fiscal treatment that they received from the
regional financing system (something that they got in the period 2010-2014) and their

The pitfalls of Catalan independence’s economic postulates
17
drift towards secession. The reason for the latter is that the funding pressures to which
Catalonia has been and continues to be subjected are of such magnitude that they cannot
be resolved through graduals improvements or even substantial changes of the regional
financing system. For the first time in many years spending on culture and education,
which in Catalonia represent a greater proportion of their GDP than in most other
regions, are facing the need for significant cuts. It is therefore not surprising that the pro-
independence movement is particularly strong on TV channels, radio stations and other
media, as well as in universities and education groups, all of whom depend on the fiscal
resources of the Catalan government1.
It should be emphasized that although the public finance situation in Catalonia, as
well as in other autonomous region such as Castilla-La Mancha or Valencia, is particularly
serious, in general terms it is similar to other regions and public administrations. Spain as
a whole, as previously highlighted, has been immersed in a fiscal crisis caused by
insufficient public revenue to meet public spending levels which are difficult to reduce, at
least in the short term. Rising unemployment and increased interest on public debt, due
both to higher public debt and the rise in the risk premium, combined with growing
imbalances in the pension system associated with falling employment, the retirement of
workers with increasingly higher pensions than average and the ageing population. In
other words, Spain as a whole, more in some places than in others, has been consuming
goods and public resources substantially above its public revenue generation possibilities.
The country faces the problem of implementing major economic and tax reforms, and
public expenditure cuts, which would gradually help to reduce the public deficit and at
least stabilise public debt in proportion to the size of the economy. A problem that
certainly occurs with more or less virulence in some territories than others
depending on their pre and post-crisis fiscal policies, but a problem which cannot be
attributed to the plundering of one region by others, and which will not only not be
resolved but would be infinitely complicated by leaving Spain. It is an undeniable
fact that the crisis has made reductions in public spending inevitable for all public
administrations, with the resulting damage to the beneficiaries of this spending. A
cut so drastic it was hitherto unseen in either Catalonia or the rest of Spain, just like
the huge prolonged growth period that the country experienced during the 15 years
prior to the crisis was equally exceptional. The harmful effects of these spending cuts
have been exacerbated by those caused by the dramatic fall in economic activity in
the private sector.
It must be repeated that the economic and fiscal crisis in Catalonia is a manifestation
of the economic and fiscal crisis in Spain and has little or nothing to do with the regional
financing system. In fact, as already stated and as outlined below, Catalonia improved
somewhat its financing during the crisis, between 2009 and 2014, in relation to the
previous situation. In any case, both before and, in particular, after 2009, Catalonia
received more favourable fiscal treatment than some other autonomous regions whose
1 An example of this is public expenditure on regional TV. In 2013, the Catalan Corporation of Audiovisual Media (Corporació Catalana de Mitjans Audiovisuals - CCMA) received 225 million euros, compared to the subsidy
of 168 in Andalusia, 94 in Galicia, 71 in Madrid, 68 in Valencia (before the recent labour force adjustment plan)
and 105 in the Basque Country. TV3 has 2,400 employees, more than twice that of Canal Sur and the Basque
station EiTB. In 2014, according to the budget announced by the Catalan government, the CCMA will receive
241.74 million of euros in subsidies, of which 209 million will be for TV3.

The political economy of Catalan independence
18
deficit and public debt was not as excessive as that in Catalonia. On the other hand, the
regions with the “concert” (the special fiscal agreement), Navarre in particular, could not
prevent the accumulation of notable budget deficits despite their fiscal privileges. In other
words, when a country suffers a crisis of the magnitude of the one suffered by Spain since
2008, after 14 years of strong GDP and public spending growth, any public administration
(central, regional or local) will have far less public revenue than required to keep intact its
welfare state. As mentioned earlier, the severity of economic hardship varies from region to
region depending on how much their spending and debt grew before the crisis and during
the initial stages of it, the dependence of their income on the property boom and how they
handled the taxes over which they have exclusive control.
To illustrate the above arguments, the relevant fiscal figures of all Spanish public
administrations are set below followed by the corresponding data for Catalonia.
Table 1. Accounts of Spanish Public Administrations
(As % of GDP)
2007 2008 2009 2010 2011 2012
Public Revenue 41.12 36.89 35.08 36.69 36.17 37.12
Public Spending 39.15 41.4 45.2 46.31 45.73 47.76
Public Deficit a) (-) 1.97 -4.51 -11.12 -9.61 -9.56 -10.55
Public Deficit b) (-) 1.97 -4.51 -11.12 -9.61 -9.07 -6.84
Public Debt 36.3 40.2 54.0 61.7 70.9 86.0
Source: National Audit Office and Eurostat.
Notes: Deficit b) is calculated excluding aid to banks.
The above table clearly shows the devastating effects of the crisis on public finances.
Between the last year of the growth phase (2007) and the outbreak of the crisis during 2008
and 2009 the total income of public administrations collapsed by a staggering six
percentage points of GDP, an unheard development in practically any other Western
country. Public spending increased no less dramatically, also by six GDP points, especially
because of increased spending on unemployment, pensions and interest on debt as well as
spending on public administration personnel. To varying degrees this is the problem that
any public administration faces in Spain: public revenue obtained from the current
taxation structure is insufficient to finance current public spending levels. Table 2 shows
the trends in the main public spending items since 2007, revealing the big explosion in
social security payments, in the form of unemployment benefits and pensions, as well as in
interest on public debt.
Table 2. Main spending items of public administrations
(As % of GDP)
2007 2009 2010 2011 2012
Social security payments 11.65 14.68 15.46 15.59 16.30
Interest on debt 1.61 1.77 1.95 2.52 3.05
Spending on personnel 10.24 12.01 12.02 11.82 11.20
Source: National Audit Office

The pitfalls of Catalan independence’s economic postulates
19
3.2. The fiscal crisis of Catalonia
The data for Catalonia are shown below in table 3, comparing them to the total
figures for all the regions, those of the central government and those of the public
administrations as a whole.
Table 3. Deficit and Debt: Catalonia and all autonomous regions
(As % of corresponding GDP) 2007 2010 2011 2012 2013 ( i )
Table 3 bears out the arguments outlined in the above section. Firstly, Catalonia faced
the crisis with a level of public debt more than 50% higher than the average of all regions.
The excess of Catalan debt over the rest of autonomous regions would in fact be even
higher than that indicated in table 3 because all the regions in the table include Catalan debt.
Making the appropriate correction, Catalan debt as a percentage of its GDP would almost
be 75% higher than the average ratio for the rest of the autonomous regions at the time. This
high indebtedness was basically due to the sharp increase in public spending in Catalonia
during the first tripartite government. Since the outbreak of the crisis, Catalonia’s deficit has
continued to be much higher than those of other regions (once again, comparison with all
autonomous regions underestimates the relative excess of the Catalan deficit). Since then
Catalan public debt level continued to grow substantially and to be far higher than those of
the majority of other regions. The data in table 3 show that of all the autonomous regions
Catalonia has been by far the biggest contributor to the growth in the deficit and debt of
public administrations during the crisis. In other words, if every region had had a fiscal
imbalance and debt in proportion to its GDP like Catalonia, Spain’s total deficit and debt
would be even higher than it is currently.
In addition, Catalonia, far more than any other region, has made necessary the
issuance of public debt by the central government to meet the growth in debt, interest
payments and other financing needs of the regions whose debt was not accepted by the
market. Indeed, in 2012, the Regional Liquidity Fund (FLA) was created to meet these
needs of the regions. Catalonia absorbed 40.05% of the total resources of the FLA in 2012
(16.64 billion euros) and 43.7% of the total resources issued by that fund in 2013 (23.37
billion euros). Catalonia’s receipt of FLA resources is far higher than its percentage
contribution to Spanish GDP, well over double what it would be if the fund had been
Catalonia Deficit a) (-)
Debt
All regions Deficit a) (-)
Debt
Central government Deficit (-)
Debt
All public admin. Deficit b) (-)
Debt
-0.60 -4.59 -4.12 -2.21 -2.00
8.00 17.80 21.70 25.80 27.00
-0.24 -3.24 -3.41 -1.84 -1.40
5.80 11.60 13.07 18.00 20.00
2.21 -5.69 -5.20 -4.24 -5.3
28.50 50.90 57.80 68.00 80.00
1.97 -9.61 -9.07 -6.84 -6.8
36.30 61.70 70.09 86.00 96
Source: Bank of Spain and Ministry of Finance
(i) Forecasts
a) Before making final settlements
b) No aid for banks
The political economy of Catalan independence
20
used in proportion to GDP by all regions, which clearly indicates the delicate financial
situation of Catalonia compared to the regions on average.
It is important to point out the vital contribution of the FLA to enable Catalonia to
reach such high public deficit levels in relation to other autonomous regions as recorded
in 2012 and 2013. During these two years the FLA, apart from covering debt maturities,
made it possible to finance the Catalan deficit for respective amounts of 1% and 0.7% of
the GDP of that region. Moreover, FLA loans to Catalonia allowed a considerable saving
on interest payments in 2012 and 2013 to this region, as these were ten-year loans with a
two-year grace period and a far lower interest rate than market issues with the Catalan
government rating. Regions that use the FLA agree to make a series of adjustments in
their public revenues and spending to hit the deficit targets set in the Stability Plan, with
the payment of the resources depending, in principle, on complying with that plan.
However, in 2012 Catalonia finished the year with a deficit of more than 2% of its GDP
when the target set was 1.5%. In 2013, Catalonia was allowed to set a deficit target of
1.58% of its GDP, while most of the regions had a target of 1.3%. As of October 2013, the
deficit was 1.7% of GDP, which almost certainly implies that the target was not hit
because in the final months there are proportionally more payments and less revenue
than the previous months. This was recently acknowledged by the Catalan Minister of
Finance.
As will be shown below, the continued high level of public deficit and resulting
growth in the already excessive public debt in Catalonia is worrying. Yet, leaving this
aside, what is remarkable is the surprising contrast between the support that, compared
to the rest of Spain Catalonia receives from the Spanish government to soften the impact
of its fiscal adjustment, and the furious criticism of that government by Catalan political
authorities. What is particularly striking during this year and last, in which Catalonia
has registered a significantly higher budget deficit than the rest of the regions and been
able to finance that deficit and refinance the maturities of its sizeable debt thanks to the
FLA, are the growing cries of “Spain robs us”, cries led and vigorously encouraged by
the Catalan government.
The suppliers payment fund (FPP) has also helped to substantially alleviate the
efforts of the autonomous region of Catalonia, just like those of the other regions, as
well as those of the local councils of Catalonia and the rest of Spain. The suppliers’
payment fund is designed to “do away with” the commercial debt contracted by the
autonomous regions and local authorities with suppliers of goods and services to those
administrations. One difference with regard to the FLA is that this is limited to the
regions while the suppliers plan is also open to local councils. The other is that the
initiative for joining the FLA rests solely with the government of the region while with
the FPP if a company which has any outstanding invoices in the autonomous region has
not been included in the list sent by the region to Spanish Ministry of Finance, the
company may request its inclusion and subsequent payment to the Ministry. The FPP
has had three phases. The first in 2012 for invoices prior to 1-1-2012, the second on 22-2-
2013 for invoices prior to 1-1-2012 that had not been included in phase 1 and the third
and final phase, according to the Ministry of Finance, in the second half of 2013 for
invoices entered into the accounts up to May 2013. Total aid to regional administrations
provided through the FPP came to almost 30 billion euros, of which the autonomous
region of Catalonia has received around 7 billion euros, far more than what it would be

The pitfalls of Catalan independence’s economic postulates
21
entitled to in relation to its contribution to Spanish GDP, as is the case with the FLA.
Table 4 summarises all figures mentioned on the FLA and the FPP.
Table 4. Regional Liquidity Fund (FLA) and Suppliers Payment Fund (FPP) (millions of euros)
FLA resources absorbed FPP resources absorbed 2012 2013 (a) 2012 2013(a)
Source: Ministry of Finance
Note: For FPP, % is not indicated as this fund has also been used by local
authorities
(a) 2013 figures are provisional
Both the FLA and FPP are special instruments to help regional public
administrations cushion the impact of the adjustments and alleviate the social costs
imposed by the crisis. These are smart, good economic policy initiatives which
deserve support and warm congratulations, especially by those who have most
benefited from them, with the region of Catalonia being by far the most prominent
beneficiary. However, official statements from the Catalan government, by its
President and its Minister for Economy and Finance, have been inexplicably critical.
The President declared that Catalonia is entitled to any loan they request from the
FLA because, according to him, they are simply recovering money which belongs to
the Catalans. The economic nonsense of this statement should be obvious. To fund
that loan the Kingdom of Spain has had to issue additional debt whose burden will
fall proportionally on all Spaniards while residents in Catalonia benefit from this debt
in far greater proportion than residents in the rest of Spain.
For his part, the Regional Minister for Economy and Finance has stated that
Catalonia is entitled to consume whatever it needs from the FLA for being a net
contributor to central government, also asserting that if the government of Spain had
allowed the suspension of payments and subsequent restructuring of Catalonia’s debt
it would have had very negative consequences for Spain’s debt. Regarding the first
assertion, the most generous thing that can be said is that this is a glaring non sequitur.
An individual or a company which through the taxes that they pay brings in more
revenue to the State than the benefits they receive from State public spending may
have contracted higher debts than the net value of their assets, i.e. debts whose
interest and repayment they cannot be covered with their income or by selling their
assets. It is also evidently nonsensical to consider that being a net contributor gives an
individual or a company a right to be rescued by the government. If Catalonia has not
gone bankrupt, it is because of the implementation of the FLA, which has given it the
necessary resources to avoid restructuring. Whether it is a net contributor or not to
central government is completely irrelevant for these purposes. Bearing in mind that
most other regions, whether net contributors or not, did not have a debt as excessive
as Catalonia’s, the massive use of the FLA by this region is indicative of the huge
fiscal imbalances that have been accumulated there.
As for the second argument, it was undoubtedly true in 2012, year in which there
Catalonia region
(% Total)
Total Funds
6,664.8 10,050.6 2,020.2 3,695.0
40.05 43.7
16,638.4 23,000 17,718.6 11,628.7

The political economy of Catalan independence
22
was massive capital flight from both Spanish public and private debt, which exceeded
20% of Spain’s GDP. But the cost for Spain of letting a region as important as Catalonia
go bankrupt has been reduced since then and would be far less in 2014 and even lower in
2015. In any case, none of this should prevent anybody from recognising that the design
and implementation of the FLA and FPP are among the best economic policy decisions
taken by the Spanish government since the crisis.
The above data show that between 2012 and 2013, Catalonia received central
government loans, obtained by issuing debt by the Kingdom of Spain, for around 23
billion euros, loans which will continue to increase in 2014. These vast resources, around
15% of Catalan GDP, together with tolerance towards deviations from public deficit
targets in Catalonia, have made it possible to soften the adjustments and reforms
necessary to position the public accounts and debt of those regions at sustainable levels.
The access to these resources and the tolerance for higher deficits have limited the fall in
Catalonia’s GDP with respect to what would have happened without this support, while
also avoiding the political costs to the Catalan government of having to make a tougher
fiscal adjustment. It is worth pointing out that the smaller fiscal adjustment of the
Catalan government compared to other regions since the start of the crisis, particularly
compared to those that have a similar level of over-indebtedness, has resulted in a lower
cumulative fall in GDP in Catalonia than the rest of Spain, as shown in table 5.
Table 5. Cumulative fall in GDP between 2008 and 2013 (in %)
Spain -7.5 Valencian Region -11.0
Catalonia -6.7 Extremadura -10.0
Andalusia -10.3 Galicia -6.4
Aragon -7.6 Madrid -5.3
Asturias -11.4 Murcia -4.0
Balearic Islands -3.2 Navarre -6.0
Cantabria -4,5 Basque Country -6.2
Castilla-León -6.8 La Rioja -8.0
Castile-La Mancha -12.7 Source: Bulletin of Inflation and Macroeconomic Analysis. Instituto Flores de
Lemus research centre. November 2013.
Notes: % of cumulative fall in GDP between second quarter of 2008 and second quarter
of 2013
Catalonia has therefore cushioned the impact of the crisis in relation to other
regions through higher public deficits and the resulting increase in its debt. In the
early years of the crisis this was possible by issuing Catalan debt in the market; and
during the last two years because the Spanish government allowed it to incur higher
deficits than other regions and gave it the necessary resources to finance these deficits
and repay debt maturities falling due in this period.
Increasing the public deficit and debt may reduce the decline in GDP for a while but
sooner or later it will take its toll. This is because interest on debt will erode the
spending power of regions on public investment and other non-financial goods and
services. What’s more, the lack of fiscal adjustment reforms and effective measures
make debt growth unsustainable and will continue to block the Catalan government’s
access to financial markets. The political consequence of all this is that the Catalan

The pitfalls of Catalan independence’s economic postulates
23
government will continue to insist on independence, not solely based on conviction, but
also to put pressures on the Spanish government to continue counting on its support to
avoid fiscal adjustments required to restructure its tough financial situation. It remains
to be seen whether Catalan citizens will glimpse, amid the thick smog created by the
debate on the referendum and independence demands, that it is the poor management
of its regional government and inability to make the undoubtedly difficult adjustments
required by its delicate financial situation what is truly robbing them of their economic
future.
4. The plundering myth and the reality of the fiscal treatment of Catalonia
The fiscal abuse of Catalonia by the Spanish state, or more crudely put fiscal
plundering or “Spain robs us”, are sayings that despite having no real basis have had
powerful persuasive effects on Catalan society. Before analysing this fallacy, a few
comments should be made. Firstly, in any fiscally decentralised country, and Spain is one
of the countries with the greatest degree of fiscal decentralisation in the world, no system
of regional financing can be established without causing frictions between the regions. Of
necessity, there will always be regions that justly or unjustly consider themselves to be
fiscally mistreated with respect to others. The fiscal system of regional financing in place in
Spain is by no means perfect and in any case complex and difficult to understand for
citizens and even for professional economists that have not studied it properly. It is
therefore undeniably a system to which changes should be made to make it more efficient
and transparent, changes which should ideally be implemented with the mandatory
review of the system for the period 2015-2019. These changes will inevitably improve the
financing of some territories at the expense of others. In the past, the central State provided
discretionary transfers so that those regions negatively affected by alterations in the system
saw their resources remain unchanged. Today this is no longer possible as the Central State
does not have available resources. Consequently, future changes to the system will have to
be introduced gradually as there is no way to compensate those regions that lose resources.
Therefore no radical change can be made in the short-term financing of some or other
regions. By radical here it should be understood changes that improve (or worsen) the
resources that any autonomous region receives by around 1% of their regional GDP2. In
any case, if system changes are always inherently complicated, it will become an
impossible task if one of the regions tries to negotiate with approaches such as “this is what
I want or I’m leaving Spain”.
Secondly, it will be shown that the regional financing system does not treat
Catalonia badly. Many other regions, especially those of a similar per capita income or
economic size, are treated equally and some quite a lot worse. Any conceivable
improvement in the system will therefore not provide Catalonia significant amounts to
enable it to eliminate or even significantly reduce its current fiscal deficit, let alone
reduce its debt to sustainable levels. That is one reason, among others, for the creative
advertising behind the emergence of the plundering myth and the magic solution of
independence to obtain resources equivalent to 8% or 9% of Catalonia GDP. According
to pro-independence groups this is the figure resulting from what Catalonia contributes
2 The autonomous region of Valencia is perhaps the only exception
The political economy of Catalan independence
24
to the Spanish Central State and what it receives from it. As already mentioned, when
pro-independence sentiments break out in a federal country it irreparably complicates
the solution of the always delicate balances of the regional financing system. The pro-
independence assumption is that any system that does not give to Catalonia the same
amount that Catalonia contributes to Spain is plundering Catalonia for the
corresponding difference. So Catalans separatists criticise any increase in spending or
tax cuts made by any region, in particular those that have a positive fiscal balance, as if
they were an extravagance at the expense of Catalan citizens and businesses. More
generally, they criticise the spending and taxation decisions of central government and
other regions, erroneously believing that these decisions are the cause of the allegedly
high deficit of the fiscal balance of Catalonia and the source of its economic problems.
As previously stated, the serious over-indebtedness and high budget deficit problems in
Catalonia will not be resolved with any feasible change of the regional financial system,
which would at best give them additional fiscal resources of around 0.5% of its GDP. It
is therefore not surprising that Catalan nationalism has gone from looking for
improvements within the common regional financing system to requesting the special
fiscal agreement found in the Basque regions and Navarra, and then as even this would
fall short in proportion to its needs and aspirations, to subsequently demanding
independence. What more than one Catalan politician really want from all this is to have
the necessary fiscal resources to return to the public spending structure prior to the crisis
which is unfortunately impossible for both Catalonia and the rest of Spain.
Thirdly, and although this will be looked at again in the following section, it is worth
highlighting here a logical mistake in the pro-independence assumptions on Catalonia’s
fiscal balance. The mistake consists in assuming that the fiscal dividend of the independence
of Catalonia is the negative of its fiscal deficit balance.
Leaving aside the fact that the fiscal balance figures that they usually manage are
neither well calculated nor the correct one for these purposes, it is a mistake to think
that the fiscal contribution of Catalans to the Central State is an invariable amount
completely unrelated to their belonging to the nation and all the various types of
redistribution mechanisms that operate within it. Catalonia benefits enormously from
belonging to Spain, as shown by the impressive growth in its GDP per capita which
between 1978 and 2009, well above that of the most advanced countries in Europe, and
at the end of that final year exceeded Germany, the UK, France and Italy, and the
average GDP per capita of the EU-15. Not to mention that its GDP per capita is well
above that of the rest of Spain by approximately 19% (see table 5 in the in the next
section for these data). If within Spain Catalonia has managed to obtain a higher per
capita level of income, not just compared to the rest of Spain but to the major European
countries, it is reasonable to think that outside Spain things would be worse. In other
words, the tax revenues of an independent Catalonia would be substantially less than
its revenue today because in all likelihood its GDP would dramatically come down at
least during the initial stages of independence. Furthermore, public spending in an
independent Catalonia would be far higher than the current spending by the Central
State in Catalonia which is currently used to calculate the fiscal balance. Spending on
national public goods required by the constitution of a State (defence, justice, foreign
affairs, etc.) is subject to economies of scale, so the smaller the economic size of the State
the higher that expenditure in proportion to GDP. Public spending would in fact be far

The pitfalls of Catalan independence’s economic postulates
25
higher because the new Catalan state would have a much higher interest and debt
levels and because the economic crisis caused by independence would trigger further
unemployment spending. In any case, if Catalonia contributes more tax revenues to the
Central State than what this State spends in Catalonia it is because Catalonia benefits
from belonging to Spain more than the regions that have a surplus or a lower fiscal
deficit than Catalonia. Therefore having a fiscal balance deficit is not an indicator of
plundering but simply that the territory in question has a higher per capita income than
the rest of the country.
Other criticisms from secessionist centres, citing the persistent fiscal deficit over the
last ten to twenty years, point out the inefficiency of the regional financing system to
reduce the surplus of the fiscal balance of the poorest or least wealthy regions and
therefore ask for a reduction in contributions to interregional solidarity. Likewise, to
demonstrate the alleged fiscal abuse of Catalonia, it has been argued that its fiscal
balance deficit is higher than that of other regions around the world with a similar per
capita income, such as Bavaria or Massachusetts or certain states in Canada or Australia.
As to the first criticism, one of the determining factors of differences in the fiscal
balances of a country’s wealthiest and poorest regions is the relative inequality of per
capita income between its regions. Hence, if this inequality persists so too will the
surplus and deficit amounts of the regional fiscal balances. The persistence of inequality
in the per capita income between regions has little to do with the regional financing
system and a lot to do with the sharp fall in interregional migration flows in Spain in
recent decades. As for the comparison with other countries, apart from existing
differences in the relative degree of inequality of regional per capita income between
those countries and Spain, the relative size of the regional welfare state and the
progressivity of the taxation system must be considered too. Leaving aside the fact that
the differences between the Catalan fiscal balance and those of the foreign regions
mentioned with a similar per capita income is not significant3, comparisons make no
sense if, as is the case, the regional inequality in per capita income or the size of the
welfare state or progressivity of the tax structure are bigger in Spain than in countries
where those regions are located. Furthermore, as will be seen below, the fiscal balance is
not the appropriate instrument for measuring the fiscal treatment of a region by the
system of regional financing.
4.1. The fiscal balances of Catalonia
Indeed, the fiscal balance is not the right indicator to determine whether the
financing system provides a particular region with sufficient fiscal resources so
that the said region can finance its spending in equal conditions as all the others.
Catalan separatists confuse fiscal treatment with the fiscal balance and they make
the extent of fiscal abuse proportional to the size of the deficit of the fiscal
balance. However, these are two separate concepts. One region with a fiscal
surplus may be mistreated fiscally and another with a fiscal deficit may not, and
there may also be differences in the fiscal treatment of two regions with an
identical fiscal balance. To understand this, it may suffice to show for now that
3 See De la Fuente (2012) and De la Fuente (2014).

The political economy of Catalan independence
26
increased public investment by the central government in an autonomous region
reduces the fiscal balance but does not provide the fiscal resources that said
region can use to finance its delegated spending on health and education services,
which are the main items of expenditure covered by the regional financing
system. Naturally, changes in the financing system alter the fiscal balances of the
regions, but so do many other economic forces so that it may be misleading to use
them as indicators of sufficient or insufficient regional financing, i.e., as indicators of the
fiscal treatment which the region in question receives from the regional financing
system.
The fiscal balance of a region is an instrument for measuring the relationship
between the contribution made by citizens and businesses of the region to central
government revenue (State and social security) and the public spending by said central
government in that region. A comparison of the fiscal balances of the various
autonomous regions provides an approximation of the redistributive fiscal effects
between regions of central government revenue and public spending policies. The bulk
of these redistributive effects are accounted for by the relative income of individuals and
businesses in various regions and the progressivity of the tax structure from which
central government revenue is generated. For this reason, for a given level of regional
public spending, the fiscal balance deficits of regions with a higher per capita income
than others will be wider in countries with a more progressive tax structure and greater
per capita income inequality between the various regions.
It is worth pondering the meaning and scope of the fiscal balance data. Firstly, as
previously pointed out, the fiscal balance of each region does not measure whether the
funds provided by the regional financing system to said region are sufficient or
insufficient to finance regional public goods. The fiscal balance includes central
government revenue and spending which does not affect the ability to finance those
public goods, for example, public investment by the State in that region or pension
system spending and revenues. Fiscal balances, on the other hand, are expressed in
proportion the GDP of the region while the appropriateness of the financing system is
normally measured in per capita terms, i.e. in proportion to the population of that region.
Secondly, the fiscal balance is an imperfect measurement instrument, more perhaps than
many other economic tools, as the measurements obtained are the result of applying
approximate assumptions on who ultimately bears the tax burden and benefits from
public spending. With some taxes, for example income tax, the burden is clear and there
are no doubts on the region to which the taxpayers belong; with VAT or corporation tax,
the burden on citizens or businesses of one region or another is always debatable. The
same applies to the regional allocation of the benefits of central government spending on
public goods such as defence or the foreign service, whose beneficiaries are all Spanish
citizens not only those from the region where the spending on personnel and other
resources necessary for providing those public goods is concentrated. These conceptual
difficulties of fiscal balances have led to their calculation by two different methods, the
monetary flow and the burden-benefit, in order to assess as accurately as possible the
impact of central government fiscal policies on different regions.
The monetary flow approach allocates the revenues collected by central government
to the region where the taxable event occurs and expenditure by Central government to
that region where the spending is located. The burden-benefit approach allocates central

The pitfalls of Catalan independence’s economic postulates
27
government revenues to the territory where the individuals that bear the tax burden that
generates that revenue reside, and attributes expenditure by the central government to
the territory where the individuals that benefit from that expenditure reside. For
example, if citizens from outside Catalonia purchase goods or services from a Catalan
company, the monetary flow approach would allocate the revenue generated by the
corresponding VAT to Catalonia, while the burden-benefit approach would distribute
the allocation of this revenue between Catalonia and the region where the citizen that
pays the VAT resides. For expenditure, if, for example, Ministry of Defence spending in
Catalonia is for the maintenance of small barracks and there are no Spanish diplomatic
service representatives in the region, the monetary flow approach would only calculate
as central government expenditure in Catalonia the aforesaid maintenance in the former
case and zero expenditure in the latter. The burden-benefit approach would calculate in
both cases as central government expenditure in Catalonia the total expenditure by
central government on Defence and the Foreign Service multiplied by the percentage that
the Catalan population represents of Spain’s population as a whole, because the benefits
from that expenditure are proportional to the population.
The regional allocation of national public goods such as the costs of the Head of
State, Parliament, Senate, Supreme Court, Constitutional Court, Ministry of Defence,
Ministry of Foreign Affairs, etc., is undoubtedly the main source of differences between
the resulting balances of applying one approach or the other. But substantial differences
may also arise when there is significant public investment that affects different regions,
such as the AVE Madrid-Barcelona (the high speed rail link). Based on the monetary flow
approach, the lion’s share of this expenditure would be allocated to the region with
greater investment, i.e. with the higher number of kilometres of track and stations, so
Aragon would be the region that benefits more substantially from this expenditure.
However, based on the burden-benefit approach, regional allocation must be made in
proportion to the origin or destination of travellers, who are the beneficiaries of that
investment, so Madrid and Catalonia should show in their fiscal balances almost the total
amount of expenditure accounted for by that public investment.
The burden-benefit approach is suitable for measuring the redistribution effects
between regions of the budget activity of central government and, therefore, the only one
that permits to identify the regions as net beneficiaries or contributors to that activity.
Hence it is the only approach, with the numerous defects and limitations of the fiscal
balance tool, which can provide an approximate measure of the contribution of a region to
the fiscal solidarity of the State as a whole. The monetary flow approach is used, with the
same limitations highlighted, to assess the effects of State public spending and revenues
on the economic activity of each region. In this respect, it should be pointed out that the
fact that the effects of State spending on the economic activity of a region are significant
and that certain regions are the headquarters of more Central State institutions that
provide national public goods and services than others, does not necessarily mean that
this is positive for the growth potential of the region in question, but rather the opposite.
Economic literature on the 19th century and during the 1960s industrial boom accurately
contrasted the economic and business dynamism of Catalonia and the Basque Country
with the backwardness of Madrid which was seen as just a town, “full of politicians, priests
and soldiers”. Then as now, what was important economically is not, for example, where
the Ministry of Defence was located, but rather where military gear, ships, planes and

The political economy of Catalan independence
28
other vehicles as well as military material were built. To put it differently, Central State
spending on a region may have indirect negative effects if it absorbs resources which have
more productive alternative private uses. Furthermore, some central government
activities can generate negative external economies such as storage of nuclear waste or
prisons.
There is another complication in the calculation of fiscal balances. The fiscal balances
calculated in accordance with either of the two approaches mentioned can be presented
by neutralising or not neutralising the figures for the economic cycle. Thus strictly
speaking there would be four fiscal yearly balances. The concept of cycle neutralisation
involves correcting actual central government revenue and expenditure data for any
given year as necessary to close the budget deficit .Thus if due to a collapse in public
revenues because of an economic crisis, the central government and all regions incur in
deficits, the subsequent variation in regional fiscal balances does not necessarily have to
alter the redistributions impact of central government fiscal action. In other words,
Catalonia’s fiscal balance deficit can be reduced by the same amount as the decrease in
the surpluses of other regions. To better understand the concept, let us assume that in
any given year the Spanish economy grows at its potential and the central government
deficit is zero, and then neutralised and non-neutralised fiscal balances would be the
same. In another year in which the Spanish economy grows well below its potential and
government deficit shoots up as a result of increased spending and a collapse in revenue
caused by the recession, all the regional fiscal balances would be positive or the negative
balances would be much lower than in the first case. Neutralisation consists in imputing
to the regions the virtual increase in public revenue necessary to close the central state
deficit, the imputation being made in proportion to their share of central government
public revenue. It can also be neutralised by a virtual reductions of expenditure.
Consequently, virtual fiscal balances are generated which should be similar to the actual
fiscal balances in years of strong economic growth. As with the assumptions and
methodologies for preparing the two types of fiscal balance, there are also different
assumptions and methods to effect this neutralisation. For the purposes of this section,
what is important is to grasp the meaning of neutralisation as well as the correct and
wrong uses of the different fiscal balance estimates.
Fiscal balances have to be neutralised for the cycle, particularly during years when
the central government records significant budget deficits, if they are to be correctly used
to measure the redistributive fiscal effects between regions caused by State public
revenue and expenditure policies. We have already seen how the fiscal balance that
correctly measures these effects is that calculated by the burden-benefit method, so this
balance would need to be neutralised to rightly measure those redistributive effects in
times of crisis, and also in times of economic boom. More questionable is the usefulness
of neutralising the fiscal balance based on the monetary flow approach as the effect of the
fiscal action of central government on regional production activity, which is the only
thing that can be measured according to this approach, may become more distorted
neutralising than not neutralising (depends on the methodology used). What is complete
nonsense is to use, as pro-independence politicians do, the fiscal balance calculated
according to the monetary flow approach and neutralised as an indicator of plundering
or as the fiscal dividend of independence. As previously seen, the fiscal balance
calculated according to this approach does not reflect the contribution of the region to

The pitfalls of Catalan independence’s economic postulates
29
interregional solidarity, much less if it is neutralised. Furthermore, the balance created in
this way imputes a virtual revenue, provided by citizens and companies in Catalonia,
which actually does not exist at that moment, so that the government in that region could
not count on that revenue the day after independence. In fact, it could not count even on
a significant part of tax revenue calculated by the balances without neutralising them, as
this would be lost due to the drop in income caused by independence. It would also have
to face far higher expenditure than that calculated in those balances because of the
additional cost of building a new state and increased spending on unemployment
benefits and higher interest on public debt caused by the economic crisis of
independence. It is difficult to avoid the conclusion that Catalan pro-independence
platforms systematically uses the monetary neutralised balance simply because it shows
the highest deficit of all those possible.
To show the manipulation of fiscal balances by the Catalan government and pro-
independence platforms it is convenient to submitting their data to the scrutiny of
rigorous economic criteria. The Catalan government’s study (2012) of Catalonia’s fiscal
balance summarises the balances for the 2006-2009 period. It is worth looking at 2009,
because the deficit for that year, for one of the many fiscal balances, has been the most
widely used by pro-independence politicians to provide figures on the plundering and
fiscal dividend of independence, a balance, which for that fiscal balance variant is
practically the same as that of 2010, which has just been published recently. The
corrections and points made on fiscal balance data for 2009 are identical to those that can
be made for any of the other years. The 2009 data are shown in table 6.
Table 6. Catalonia’s fiscal balance in 2009 (According to the Catalan government)
Monetary Flow Burden Benefit NN N NN N
Balance -791 -16,400 +4,015 -11,269
(% GDP) (-0.4) (-8.4) (+2.1) (-5.8) Source: Government of Catalonia (2012)
Notes: Figures in million euros, NN= Not neutralised, N=Neutralised
The balance usually argued by pro-independence groups is the neutralised
monetary flow, resulting in a deficit of 16.4 billion euros, 8.4% of Catalan GDP that year.
This and the remaining balances are calculated based on assumptions that inflate central
government proceeds allocated to Catalonia as much as possible (and minimise central
government spending in that region). As previously mentioned, this balance would only
measure the relative contribution of central government to regional economic activity. It
measures neither Catalonia’s contribution to interregional solidarity nor much less the
fiscal dividend of independence. The right balance to measure the contribution to
interregional solidarity would be that calculated according to the neutralised burden-
benefit approach. Even if we assume that the Catalan government’s calculations are
correct, table 6 shows that the neutralised fiscal balance according to the burden-benefit
approach would result in a deficit of 5.86% of GDP, a figure not at all exaggerated as an
indicator of the contribution of a region whose per capita income is 20% higher than the
rest of Spain. However, the real indicative figure is substantially less than that calculated
by the Catalan government. To arrive at fiscal balances that more accurately reflect the

The political economy of Catalan independence
30
allocation to Catalonia of central government revenue and expenditure, it will be
necessary to produce more precise calculations than those of the Catalan government,
like those of Polo (2014) who puts Catalonia’s fiscal deficit based on the neutralised
burden-benefit approach at 4.13% of GDP for that year. In another study, Vilalta (2012)
shows that if fiscal balances are neutralised by a virtual reduction in public spending, the
balances estimated by the Catalan government would be reduced by approximately two
GDP percentage points for both approaches. In addition, Barberán and Uriel (2013)
calculate that to assess the contribution of a region to interregional solidarity all revenue
and expenditure relating to the contributory social security system should be excluded
from allocated revenue and expenditure. This exclusion is justified because the system is
like an insurance policy and the citizen can contribute to it in one region but receive the
benefits in another. If this adjustment were to be made, Catalonia’s average annual fiscal
deficit balances for the 2005-2009 period would be reduced by an average of 2.15% of its
GDP.
It is interesting to note the reaction of separatists to the 2010 fiscal balance data
published recently by the Catalan government. As previously highlighted, the fiscal
balance based on the neutralised monetary flow approach published by the Catalan
government for 2010 is similar to that for 2009, with a deficit of 16.54 billion euros. That
non-neutralised fiscal balance deficit was only 5.38 billion euros while the fiscal balance
calculated by the burden-benefit method produced a deficit of 774 million euros for
that year. When presenting this data, the President of the Catalan Government (La
Vanguardia, 23/05/2013) only mentioned the fiscal balance deficit based on the
neutralised monetary flow approach. He stated that the total fiscal deficits in Catalonia
for 2009 and 2010 came to 32.54 billion euros and that with only a third of that amount
the budget adjustments for the last few years would have been saved. Leaving aside
that adjustments of that scale were not made, if President Mas had used the correct
fiscal balance, calculated according to the burden-benefit approach, he should have
pointed out that Catalonia’s actual contribution to the State as a whole in those two
years was negative (i.e. the relevant fiscal balance was in surplus) to the tune of 3.24
billion euros, which was funded by the corresponding issuance of debt by the Kingdom
of Spain. Once again, the systematic manipulation of data to inflame anti-Spanish and
pro-independence sentiments among Catalan society is evident.
The critical examination of the use of Catalan fiscal balances by pro-
independence groups can be summarised in the four points below:
a) Catalonia’s fiscal balances calculated by the Catalan government are based
on assumptions that systematically inflate the deficit of these balances compared to
balances estimated by renowned academic experts on the matter.
b) Catalonia’s latest fiscal balances published by the Catalan government for
2009 and 2010, systematically chosen as proof of plundering and to show the manna of
independence, focus on the neutralised fiscal balance based on the monetary flow
approach, which of all the possible fiscal balances is the one that records by far the highest
deficit.
c) These fiscal balances emphasized by secessionists neither measure
Catalonia’s contribution to interregional solidarity nor the dividend of independence.
If properly calculated, they merely show the relative effect of central government
action on the economic activity of various regions. In this regard it must be stated that

The pitfalls of Catalan independence’s economic postulates
31
often the regions that are most dependent on State activity are usually the country’s
poorest or least prosperous regions. In particular, the neutralised fiscal balance according
to the monetary flow approach does not even remotely measure the fiscal dividend that
Catalonia would obtain with independence. This is because this balance neither covers the
spending on national public goods by the central government which an independent
Catalonia would have to pay for itself, nor does it reflect the increase in public spending
and the fall in public revenues that the economic crisis of independence would bring.
It is also a mistake or a gross manipulation to use a neutralised fiscal balance, in which
fictitious, and therefore, non-existent revenue is included for cycle correction, as a
measurement of the taxable income that Catalonia would count on the day after its
independence.
d) The figures for Catalonia’s fiscal balance calculated according to the burden-
benefit approach, including those published by the Catalan government, do not
denote an unduly large deficit, neither in themselves nor compared to other regions
with a similar income in either Spain or other countries. Nor do they in any case
reflect onerous fiscal treatment for Catalonia, because, as already mentioned, fiscal
balances are not reliable indicators of the fiscal treatment of a region by the regional
financing system.
4.2. The fiscal treatment of Catalonia
Reference should be made firstly to what was said in the previous section. Using
the fiscal balance deficit of a region whose per capita income is appreciably higher than
the average of the rest of the country as an indicator of the inadequate funding of that
region is a gross error. Identifying that fiscal balance deficit as a the proof of an
imaginary plundering and as fiscal dividend of hypothetical independence is an
absurdity and gross manipulation which is only understood if the aim of those which do
it is to inflame the passions of the Catalans against the rest of Spain.
As already seen interpreting fiscal balances is not a simple task, but assessing if an
autonomous region is relatively better or worse financed as the average is perhaps even
harder. To start with, any such comparison must be done on a uniform basis, so only
regions subject to the common regional financial system must be considered. Though not
the goal of this study, proper reform of the regional financing system should ensure that
the regions under the special financial regime (i.e. Basque Country and Navarra) make a
net contribution to the system in proportion to their per capita income similar to that
made by other regions (on this matter see the bibliography notes on the regional
financing system).
In the common regime, comparison between regions requires making a series of
adjustments. For example, not all regions have been delegated all the functions that
Catalonia has. This region, unlike all others in the common regime, has assumed
responsabilities for policing and prison-related functions, so the gross income provided
to it by the financing system must exceed that received from others by a sufficient
amount to carry out those functions at the same level covered by the central government
in other regions. Furthermore, each region has been able to vary in one way or another
the taxes over which they have regulatory capacity raising or lowering their public
revenues as a result. In this regard, it must be said that it is highly unlikely that increases
in estate, inheritance or marginal income tax rates on which the regions have regulatory

The political economy of Catalan independence
32
power are automatically accompanied by a proportional increased in revenue. There is
significant evidence of a displacement of tax bases from Catalonia to other regions to
avoid paying the higher tax burden that Catalan citizens suffer in the aforementioned
taxes. In addition, some regions may need higher revenue from the financing system
than others to provide the same functions. For example, regions with proportionally
more young people than others need more resources to finance spending on education;
those with older populations need more resources to meet health needs; larger regions
with more territory and less population density or island regions need more resources
than others because the unit cost of providing the public services is often greater than in
other autonomous regions.
Bearing this in mind, how can it be determined whether the regional financing
system treats Catalonia better or worse than other regions? To answer this question, I
will simply summarise the calculations and arguments in De la Fuente (2013a) and De la
Fuente (2014) who, in my opinion, is the economist who has most rigorously studied
these issues. This author, like others who have looked upon this question academically,
bases his findings for the various regions on a comparable uniform indicator. This
comparative financing indicator is a fraction whose numerator is the financing provided
by the system, homogenised by the functions assumed while holding constant the tax
effort for each region, and whose denominator is the adjusted population. The
denominator is the actual population of the region adjusted according to the
aforementioned demographic and geographical variables (age structure, size of region
and dispersion, insularity, etc.). For each region, the indicator so calculated would
measure the average financing per adjusted capita. In Catalonia, for example, revenue
received is adjusted downwards due to the greater number of functions assumed, so that
the comparative indicator is reduced on this account. The actual population of Castilla-
León, just to show another example, is adjusted upwards by the combined effect of
territorial size and dispersion, with the said indicator being reduced as a result.
Table 7 summarises the calculations of this indicator for 2002-2011 (the last year with
available homogeneous data), the “pro-independence exaltation” period. In the table, 100
represents the average financing per adjusted capita for all regions under the common
regime, with Catalonia and other regions compared to this average financing.
Table 7. Comparative financing indicator
among common regime Spanish regions, 2002-2011
Catalonia 99.7
Madrid 100.6
Andalusia 99.5
Balearic Islands 92.2
Valencia 92.5
Murcia 96.7 Source: De la Fuente, A. (2013)
Average financing per inhabitant adjusted for all regions = 100
As can be seen, Catalonia has received on the last ten years a fiscal treatment by the
regional financing system close to the average and practically the same as the other two
regions with a similar economic size and population, Madrid and Andalusia. There is no
basis therefore to maintain that Catalonia is fiscally mistreated. It should also be

The pitfalls of Catalan independence’s economic postulates
33
remembered that Catalonia greatly improved its financing in the system designed for the
2009-2014 period. Due to the mechanics of the system, the first year it received benefits
from the system was 2011, so the figures in table 7, which are average figures for 2002-
2011, barely reflect the amount of this improvement. In other words, it is highly likely that
the comparative financing indicator for Catalonia is currently at 100% (with Madrid
noticeably below), so its financing would be the same as the system average, with not
even the tiny difference shown by the data in table 7.
A criticism of the regional financing system from Catalonia, also shared by other
regions and which certainly makes sense, is the violation of the principle of ordinality by
the system redistribution mechanisms. As will be seen below, the current system does
not respect this principle, although the consequences of not doing so are not as damaging
to Catalonia or other regions as often thought, so the benefits of establishing it would not
be particularly significant for those regions. According to this principle, applying the
redistribution mechanisms of the common regime regional financing system should not
alter the ranking of the regions based on their pre-existing adjusted gross taxable income
capacity per capita before their application. It should be pointed out firstly that the
system certainly alters this ranking but not, as sometimes stated, the order of the
autonomous regions according to their per capita income. Catalonia’s position in this
ranking remains unchanged, as that of the rest of the regions, after fiscal redistributions
made by the regional financing system. However, if the gross fiscal capacity per capita
index is calculated uniformly for every region, after the redistribution of the system
Catalonia slips more than 10% down the pre-existing ranking, a lot less than Madrid or
Valencia though (these regions slip more than 30%). Extremadura and the Canary Islands
are the regions that most benefit from the redistribution of the system. The numerator for
this index, the homogenous gross fiscal capacity, is estimated from the public revenue
generated by the taxes assigned to the regions recalculating them assuming the same tax
effort for all the regions. The denominator, the adjusted population, is calculated
according to the above-mentioned procedure. It would be desirable if the new regional
financing system, which should come into effect in 2015, were to establish this principle
as its application would make the operation of the system more fair and efficient. Having
said this, the new system reformulated in such a way would provide Catalonia
additional resources of less than 0.5% of its GDP (see De la Fuente, A. (2013c). The reason
this figure, while being significant, is far less than the claims that Catalonia may have in
mind is twofold. Firstly, Catalonia is nowhere near the region that most loses out by not
applying this principle and, secondly, the regions that most benefit from its application,
from which resources would have to be diverted, are of very reduced economic size.
If, as seen, Catalonia does not suffer any type of fiscal mistreat but in fact is treated
the same way as the average and much better than other regions of the same economic
size, and also better than others with a higher or lower per capita income, there is no
possibility that it can obtain significant additional resources through any reasonable
reform of the common regime within the regional financing system. That is perhaps
why it requested an ad-hoc system similar to the special regime in Basque Country and
Navarra. But any conceivable regional financial system could provide the Catalonia
additional resources that would fall short in proportion to its aspirations. This is maybe
one of the reasons why in the last year and a half the Catalan government has only
been talking about the “fiscal dividend of independence”, the 16.4 billion euros or 8.5%

The political economy of Catalan independence
34
of Catalan GDP, shown by the neutralised monetary from fiscal balance. Sometimes
one gets the feeling that with this figure at least a part of the Catalan political class
wants is to actually set the price of “abandoning independence”.
Catalonia, like any other region with higher than the Spanish average per capita
income, derives huge benefits of belonging to Spain. These benefits are generated by the
full economic integration that only arises within a country and that entails the cost of
transferring fiscal resources to regions with lower per capita incomes. You cannot have
the one without paying for the other.
5. The economic costs for Catalonia of independence and self-determination
referendums
The aim of this section is to give an order of magnitude of both the costs brought
about by the attainment of independence through a unilateral declaration by the Catalan
government and those resulting from holding a plebiscite election or referendum on
independence restricted to residents in Catalonia. This second case has hardly been
studied. The analysis here conducted is based on the experience of Quebec, the only
example available at the moment which is perfectly comparable with a hypothetical
plebiscite election or self-determination referendum in Catalonia. The conclusions of
this chapter can be stated in advance: the short-term economic costs for Catalonia would
be exorbitant and immediate in the first case and very high, albeit more gradual, in the
second. It can also be said that in the first case the costs would be very high for the rest
of Spain too while in the second, as with Canada, the Spanish economy would not be
much affected as what Catalonia would lose other regions would gain.
This section could also be entitled: the economic benefits for Catalonia of belonging
to Spain and its acceptance of the current constitutional order. These benefits have been
considerable leading Catalonia to achieve higher per capita income levels than many
advanced countries in Europe as shown in the following table, taken from a study by
supporters of secession.

The pitfalls of Catalan independence’s economic postulates
35
Table 8. GDP per capita of EU-15 countries in 2009 (data in PPP)
GDP per capita % over EU-15 average
Catalonia €28,200 109
Sweden €28,270 109
Belgium €27,786 107
Germany €27,127 105
Finland €26,934 104
UK €26,223 101
France €25,429 98
Italy €24,364 94
Spain (*) €23,541 91
Source: Nuria Bosch and Marta Espasa, viability of
Catalonia as a State. CATDEM reports, July 2012.
(*) Spain without Catalonia
How is it possible that if Catalonia has been plundered by the rest of Spain, by
around an annual 8% of its GDP as secessionists maintain since the entry into effect of
the state of the autonomous regions in 1978, it has managed during this period to exceed
the per capita income of the richest countries in Europe? How is it possible that the
plundering rest of Spain still has a per capita income of 20% less than plundered
Catalonia?
It is curious to see how almost all economic reports by authors or groups that pursue
independence highlight, with understandable pride, the very high per capita income of
Catalonia to justify its viability as an independent country while at the same time
advancing the plundering hypothesis, “Spain robs us”, to justify independence. They can
always say, and some pro-independence authors do, that without the tax burden imposed
by the rest of Spain Catalonia would be even richer. But this means that they would move
off the per capita income map of the European Union and fall into line with the per capita
income of countries with privileged natural resources such as Norway or the Arab states
of the Persian Gulf. Would it not be more reasonable to conclude that if Catalonia within
Spain has been able to comfortably exceed the per capita income of Germany, France, the
UK and Italy it is because it benefits hugely from belonging to Spain? Would it not be
more logical to think, based on the evidence in table 6, that no plundering or nothing like
it exists and that if Catalonia was to leave Spain it would suffer a huge decline in its per
capita income compared to that of those European countries whose income it presently
exceeds and even in relation to the rest of Spain? These conclusions suggested by the data
in table 8 are precisely those reached in this chapter after examining the economic cost for
Catalonia of any possible secession from Spain and those from holding self-determination
referenda.

The political economy of Catalan independence
36
5.1. The costs of independence for Catalonia
Table 9 provides a summary of the economic costs of independence estimated by
various authors. Before evaluating this data a few points should be made on the
nature of these costs. Firstly, these are the economic costs of independence for
Catalonia. The costs that this independence would generate for the rest of Spain are
not calculated. That is why all these costs would need to be increased due to the
negative impact that the economic decline of the rest of Spain would have on the
independent Catalonia. Secondly, what I attempt to assess is the short-term economic
cost. Although in economics short and long-term are logical categories, they
inevitably have chronological dimensions which, albeit not very precise, are clearly
different in each case. The macroeconomic long-term normally refers to a country’s
growth potential, to the average annual growth rate during very long periods. The
short-term is a concept which barely stretches to a decade. For example, the current
economic crisis would fall within the short-term phenomena. As indicated in the
second section, the crisis has been with us five years and the total decline in GDP in
Spain since 2008 has been around 7%. This is the time frame in which the studies and
arguments on the economic costs of independence to Catalonia must be set. Falls in
GDP looked at here would occur with greater or lesser annual intensity during, say, a
five-year period.
What has not been addressed here or in any other study to date is the impact that
Catalonia’s independence would have on its long-term growth potential. That is, once
Catalonia reaches its GDP trough caused by independence, during the next thirty or
forty years, would it have a higher or lower growth in its per capita income than it
would have had if it had stayed as part of Spain? The evidence of the past thirty or forty
years suggests that Catalonia would struggle to do better outside than inside of Spain.
Furthermore, the economic policies implemented by governments dominated by pro-
independence factions in Catalonia since 2003, and this would be the political class that
would govern an independent Catalonia, are far more harmful for long-term growth
than those implemented by the rest of Spain.
Turning to the short term costs, the recent crisis is a good reference for gauging the
impact of the possible independence of Catalonia on the standard of living of its
inhabitants. If the cumulative fall in GDP since the start of this great recession in 2008 has
been around 7% and has led to an almost fourfold increase in the unemployment rate
(from 7% to 27%) and a tripling of debt levels, as well as tax increases and cuts in public
spending, it is easy to imagine the consequences that falls in GDP equal to or higher than
that figure would have on Catalonia. As table 9 shows, most of the studies conducted to
date forecast falls of more than 7%, some three times higher than this figure. Note also
that short-term falls in the GDP of Catalonia of less than or around 2% would be the
lower limit of the range of estimates. It will be shown how these more optimistic
estimates do not consider, as will inevitably happen, that Catalonia’s independence will
involve its immediate exit from the EU and the euro and that these forecasts are more
long-term than the others, so they are not incompatible with sharp falls in GDP during
the first few years of independence.
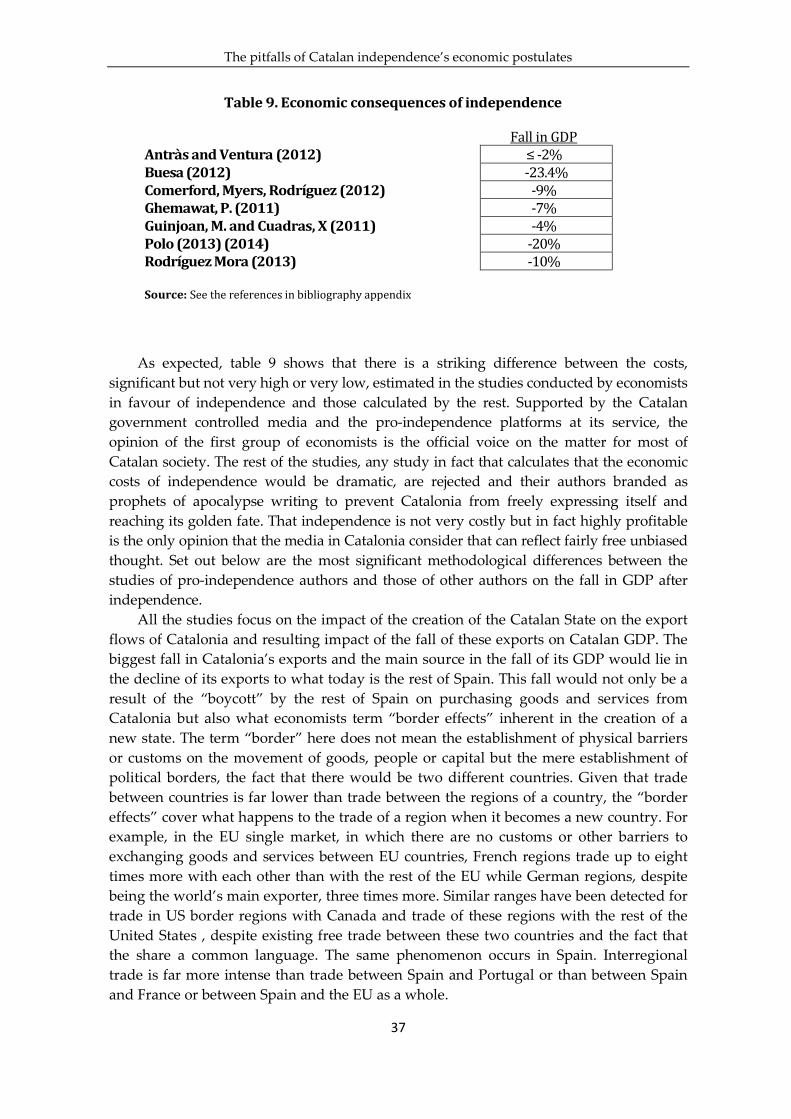
The pitfalls of Catalan independence’s economic postulates
37
Table 9. Economic consequences of independence
Fall in GDP
Antràs and Ventura (2012) ≤ -2%
Buesa (2012) -23.4%
Comerford, Myers, Rodríguez (2012) -9%
Ghemawat, P. (2011) -7%
Guinjoan, M. and Cuadras, X (2011) -4%
Polo (2013) (2014) -20%
Rodríguez Mora (2013) -10%
Source: See the references in bibliography appendix
As expected, table 9 shows that there is a striking difference between the costs,
significant but not very high or very low, estimated in the studies conducted by economists
in favour of independence and those calculated by the rest. Supported by the Catalan
government controlled media and the pro-independence platforms at its service, the
opinion of the first group of economists is the official voice on the matter for most of
Catalan society. The rest of the studies, any study in fact that calculates that the economic
costs of independence would be dramatic, are rejected and their authors branded as
prophets of apocalypse writing to prevent Catalonia from freely expressing itself and
reaching its golden fate. That independence is not very costly but in fact highly profitable
is the only opinion that the media in Catalonia consider that can reflect fairly free unbiased
thought. Set out below are the most significant methodological differences between the
studies of pro-independence authors and those of other authors on the fall in GDP after
independence.
All the studies focus on the impact of the creation of the Catalan State on the export
flows of Catalonia and resulting impact of the fall of these exports on Catalan GDP. The
biggest fall in Catalonia’s exports and the main source in the fall of its GDP would lie in
the decline of its exports to what today is the rest of Spain. This fall would not only be a
result of the “boycott” by the rest of Spain on purchasing goods and services from
Catalonia but also what economists term “border effects” inherent in the creation of a
new state. The term “border” here does not mean the establishment of physical barriers
or customs on the movement of goods, people or capital but the mere establishment of
political borders, the fact that there would be two different countries. Given that trade
between countries is far lower than trade between the regions of a country, the “border
effects” cover what happens to the trade of a region when it becomes a new country. For
example, in the EU single market, in which there are no customs or other barriers to
exchanging goods and services between EU countries, French regions trade up to eight
times more with each other than with the rest of the EU while German regions, despite
being the world’s main exporter, three times more. Similar ranges have been detected for
trade in US border regions with Canada and trade of these regions with the rest of the
United States , despite existing free trade between these two countries and the fact that
the share a common language. The same phenomenon occurs in Spain. Interregional
trade is far more intense than trade between Spain and Portugal or than between Spain
and France or between Spain and the EU as a whole.

The political economy of Catalan independence
38
Catalonia has a very open economy, with total exports representing around 66% of
its GDP. Of these exports, approximately half go to the rest of Spain, with Spain therefore
being by far its main trading partner. So, for example, Catalonia exports to France, a
country with the same currency, tariffs and geographical proximity to this region as the
rest of Spain, between a fifth and sixth of what it exports to the rest of Spain. What’s
more, Catalonia sells far more to the rest of Spain than what it purchases from it,
obtaining a surplus in its trade balance on goods and services which offsets the deficit
that it records in its trade with the rest of the world. For this reason, before the rise in
pro-independence and the propagandistic manipulation of the fiscal balances by the
Catalonia governments many believed that what “Catalonia lost” in its net fiscal
contribution “recovered” through its favourable trade balance with the rest of Spain.
Yet let us continue with the description of the main mechanism that the quoted
authors use to quantify the fall in Catalan GDP that would be brought about by
independence. The next step is to calculate by how much Catalonia’s exports to the rest
of Spain would fall. Non-pro independent economists, basing their opinions on a
combination of a boycott and “border effects”, calculate that this fall would be
substantial, not less than 50% (some authors estimate that it could initially reach 80%), as
the rest of Spain would tend to trade with Catalonia in the same way as it does with
France, Portugal or the rest of the EU (whose exports to Spain would increase in parallel
with the decline in exports from Catalonia to Spain). If, for example, Catalonia’s exports
to the rest of Spain fell by 50%, assuming for the moment that Catalonia’s exports to the
rest of the world remain unchanged, Catalonia’s exports would fall by 25%. It has
previously been shown that Catalonia’s total exports make up 66% of its GDP but when
exports fall by 25%, GDP does not fall by this fraction as part of its exports are produced
with imported products. As a result, the decline in exports does not fall fully on the
producers in the region but partially too on the producers of other regions or countries
that enable those imports. To correct these effects it is necessary to use the available
input/output tables according to which Catalonia’s exports to the rest of Spain, net of
imports, represent around 21% of its GDP. This means that a 50% fall in its exports
would result in roughly a 10% fall in Catalan GDP. To this drop should be added the loss
of exports to the rest of the world caused by its exit from the EU and the European
Single Market, and the relocation of multinationals and companies from the rest of Spain
that operate in Catalonia under the freedom of movement of goods, people and capital
that EU membership brings. Deducting from these negative effects the “fiscal dividend”
of independence, which most non pro-independence economists consider non-existent in
the short term and lower in any case than the nonsensical 8% of GDP estimated by pro-
independence authors, falls in GDP in the range of 10% to 20% cited in table 9 are
reached.
What calculations do pro-independence authors make to obtain substantially lower
figures than these? Firstly, they consider that the fall in Catalonia’s exports to the rest of
Spain would be far less than the 50% figure quoted and previously suggested. They
think that the “boycott” would either not be significant because economic interest
would prevail over emotional considerations, or that in any case it would only affect
final consumer goods, which only make up around a third of Catalan exports to the
rest of Spain. Even in the worst case, they believe that the boycott would be temporary
and quickly reversible. However, it has already been seen that, contrary to this view,

The pitfalls of Catalan independence’s economic postulates
39
“border effects” would tend to reduce Catalonia’s exports to the rest of Spain due to
the high transaction costs that would result for the rest of Spain trading with a new
State. Some pro-independence authors acknowledge these effects, but consider that the
figures would be lower than the estimates provided by other authors, despite tacitly
accepting that they may be significant. They believe that a fall in exports to the rest of
Spain would be offset euro for euro, and according to their arguments regardless of the
fall, by an increase in Catalonia’s exports to the rest of the world. This assertion is
based on two assumptions. The first is that they believe that Catalonia would remain in
the EU and the euro. Some pro-independence authors tacitly admit the possibility of
Catalonia leaving the EU (but not the euro), but then say that it would join the
European Economic Area which has similar freedom of movement of goods, people
and capital as the EU. They forget to mention, or perhaps ignore, that negotiating this
accession would take time and, although it does not require unanimous approval of
existing members to accept a new State (as with the EU), it does require a qualified
majority which Catalonia would in no way be guaranteed as will be seen in the next
section. The second is that the Catalan economy would reduce its prices and wages as
necessary to increase its exports to the rest of the world until that increase would offset
the fall in exports to the rest of Spain. In other words, Catalonia’s exports to the rest of
the world would not be negatively affected by independence but would in fact increase
substantially.
The arguments of pro-independence authors only make sense if a far longer
period than that envisaged by the other authors is considered. Having said that, these
arguments not only fail to deny but implicitly accept that the immediate impact of
secession on Catalan GDP would be very negative. This is so because only very sharp
falls in GDP can produce the necessary fall in prices and wages so that growth in
Catalan exports to the rest of the world can offset the decline in its exports to the rest
of Spain. Simply look at what has happened with the economic crisis in Spain since
2007. A cumulative fall of 7% in GDP and tripling of the unemployment rate has been
necessary to achieve the necessary price and wage flexibility to significantly increase
exports (and reduce imports). The increase in Catalonia’s net exports that pro-
independence authors postulate is far higher than that recorded in Spain, which
means the fall in Catalonia’s GDP should also be so. Regarding the prevalence of
economic interest over the emotional reaction of many Catalans and the rest of Spain,
it is possible that after a few years economic interest will prevail but it would be naive
to deny the emotional reaction in the short term. Besides, economic interests also
justify the existence of significant border effects. Furthermore, if the economic self-
interest of Catalans and the rest of Spaniards prevailed then there would be no
possibility of secession. In any case, these pro-independence studies suffer from the
fundamental defect of thinking that Catalonia would continue in the EU or in the EEA,
and that all multinational companies (which make up around 60% of Catalonia’s total
exports) would continue to operate in the new country with the same intensity as
presently. The fact that independence automatically entails Catalonia’s exit from the
EU (and the euro) and the uncertainty over the duration of the negotiations for its
entry into the EU or the EEA will inexorably have devastating effects on Catalonia’s
exports and private investment, and therefore Catalan GDP, at least during the first
years of independence.

The political economy of Catalan independence
40
5.2. An independent Catalonia within Europe
Catalan independence would lead ipso facto to its exit from the EU (and, as will be
seen, the euro too). Presently it appears that not even the President of the Catalan
government doubts this, as he recently reckoned in an Italian newspaper (La
Repubblica, 27/12/2013). What is really intriguing though is how the Catalan
government and its secessionist platforms have been able to convince much of Catalan
society otherwise. However, the deception is so great that despite the intense
propaganda Catalans are now starting seriously to doubt whether the new country
will remain in the EU and the euro exactly as it has to date. As mentioned, even
President Artur Mas has had to admit that Catalonia would leave the EU but not the
euro, the first assertion being true and the second false as will be shown below.
Apart from the clarity of European treaties on this matter, all relevant EU
authorities, from the President of the Commission to practically all the commissioners,
have emphatically and repeatedly expressed that, as a new country, Catalonia would
leave the EU and have to begin an accession process just like any other non-EU country.
The reaction at the time by Catalan government ministers and ERC leaders and
qualified representatives of pro-independence groups to these opinions have consisted
of a kind of creative advertising to remove from the mind of Catalans any fear over
Catalonia’s exit from the EU and the euro. Indeed, President Mas said that “Catalonia has
always been Europe and will remain so”. Other than from a mere geographical view, this
remark makes no sense. Politically Catalonia has always been Spain (and it has been
Europe by being part of Spain) but after independence it would no longer be so, and
therefore logically no longer Europe either. Minister Homs also stated that “Europe
would be dead if it rejected a market of more than 7.5 million consumers”, implying that this
economic reality would lead European authorities to do everything necessary for
Catalonia to remain in the EU. But Europe, the EU, has left and continues to leave
Turkey out, a market of 70 million consumers, significantly bigger than the Catalan
economy. In fact, Europe left Spain, and therefore Catalonia, out for a long time because
in the opinion of the majority of the member states this was demanded by the Union
treaty.
The main ideas that support the statements of pro-independence politicians and the
opinions of much of Catalan society on this matter can be found in Colectivo Wilson, Boix
(2012a) and Boix (2012b), ERC (2013) and Catalunya: Europa (2013), with the latter
prepared by the Economistas por la independencia, a platform of pro-independence
economists. The arguments that can be found in their writings are identical so there
should perhaps be a crossover between both sets of authors. It is perhaps most
interesting to analyse the study Catalunya: Europa (2013), which reflects very widespread
opinions in Catalonia.
This report maintains that all European authorities know that as independent
Catalonia will remain in the EU, but that they now deny it because they do not want to
hasten the independence process. As proof of this they present the initial statements by
Barroso, Reading and Almunia on an independent Catalonia continuing in Europe,
statements that were more hesitant than the categorical ones and, without any room for
doubt, made since then by these same authorities. The date of the publication of the
report did not allow the authors to cover other declarations, equally categorical on
Catalonia’s exit from the EU, made by other commissioners and European authorities

The pitfalls of Catalan independence’s economic postulates
41
consulted on the matter, the most recent being those of Van Rompuy, President of the
European Council. If as these authors claim, the principal European authorities agreed
that an independent Catalonia would remain in the EU and, “the political and economic
world knows that independence is inevitable and is not worried about it”, it is not clear why
they would want to delay the process and “give the impression” that they oppose it.
What these authors seem to ignore is that when there are laws and treaties, such as those
that govern the functioning of the EU, these laws must be observed. When, in addition,
and contrary to what is said in pro-independence circles, the treaties are clear on the
secession of a part of a member state, the European authorities can only express what the
law mandates in this instance. The secessionists have what could be called an elastic
view of the laws, where the laws are like some kind of clay mouldable to their interests.
Even in the not just extremely doubtful but simply false case that all the main European
countries were interested in Catalonia becoming a new EU state and did everything
possible to ensure this, it would be legally impossible for Catalonia not to exit the EU
even if it could return in a more or less short period of time. As will be seen, it is that exit
and the inevitable uncertainty over the duration of this period that will be the
determining factor to skyrocket the economic costs of secession.
Secessionists compare Catalonia’s access to the EU with that of other internationally
recognised countries. EU and international law, which the reports of pro-independence
platforms seem to be unaware of or simply ignore, set out a complex and lengthy road
map for a new country to be able to request entry into the EU. According to Jean-Claude
Piris, see Piris (2013), former legal adviser of the European Council and perhaps the
most respected legal voice in EU matters, this road map calls for fulfilling two
conditions (apart from being European). Firstly, it must be a country recognised by the
international community and, therefore, a member of the United Nations. Secondly, it
must comply with article 2 of the Treaty, which provides inter alia that the rule of law
must be applied and for which its creation must be legal. A simple unilateral declaration
of independence, whether after a referendum or without a referendum or after plebiscite
elections by the Catalan government, has no legal validity. In other words, a unilateral
declaration of independence does not mean that the territory becomes an independent
country before the international community and can therefore request its entry into the
EU. According to Piris, it would have to undertake a long and arduous journey. At the
European level it would involve changing the Spanish constitution (which establishes
the indivisibility of the Spanish territory) and the European treaties that cover Spain as
it is presently. Catalonia for its part would have to negotiate the international
recognition of the new State. All this betrays the delusions of immediate entry in the UE
that are being instilled in Catalan society. All those steps, which would naturally require
the support of Spain, involve a long and drawn-out process before requesting accession,
which could be blocked by any EU member. In short, the possibility of an independent
Catalonia remaining in the EU or automatically becoming part of the EEA is so
unbelievable that compliment should be paid to the power of persuasion of pro-
independence intellectuals and the strength of the propaganda machinery of the Catalan
government to make anyone inside or outside of Catalonia believe or have believed the
opposite.
The authors of the aforementioned study cannot be very certain that Catalonia will
remain in the EU because they are quick to say that what really counts is belonging to the

The political economy of Catalan independence
42
European Economic Area (EEA), an area of free movement of people, goods and capital
that includes non-EU countries such as Norway, Liechtenstein and Iceland. While re-
entry to the EU would require Catalonia obtaining the unanimous support of all its
members, it would only need a qualified majority, i.e. the favourable vote of 19 of the 28
member countries, to form part of the EEA. They therefore say that Spain could not veto
the entry of Catalonia into the EEA, like it could do into the EU. They add, and this is
basically an error as will be seen later, that an independent Catalonia outside the EU but
in the EEA could continue to use the euro, so its place within Europe would not be any
different to that presently. There are several problems with these assertions. The first is to
think that Spain is the only country in the EU that would oppose Catalan independence
and, therefore, the only member that would veto its entry into the EU or the EEA. But,
can we be convinced that the United Kingdom, which opposes the independence of
Scotland, would not veto Catalonia? Or Belgium, which experiences continuous tension
to prevent its breakup? Or Italy, which also has regions with centrifugal temptations? Or
France, which to a lesser extent could also see territorial tensions? Or Germany, to whom
Spain and Catalonia both owe a substantial part of their public and private debt, and
which knows that independence would lead Catalonia to bankruptcy and the default on
its debt, and that Spain would end up in a not very different situation to that suffered by
Greece, requiring rescue operations such as those introduced these past few years?
In the long or very long term, it is possible that Spain might support Catalonia’s
entry into the EU or the EEA, as the authors maintain, and that it might try to convince
other EU countries to support its inclusion too. But by then the damage would have been
done, and it would have been immense and irreparable for many people. The second
mistake is to assume that Catalonia would immediately enter the EEA. The long and
uncertain path that a new country must follow before it becomes recognised as such by
the international community has already been highlighted. What’s more, in the highly
unlikely case that this was accepted by the necessary qualified majority (almost certainly
most large EU countries would oppose it); these treaties take a long time to negotiate. It
must also be added that an independent Catalonia led by the coalitions that have
controlled the Catalan government in recent years is not very favourable to free trade.
Finally, in any independence situation, Catalonia would be forced to leave the euro and
introduce its own highly devalued currency.
The introduction of a new currency, as recognised by the most rigorous pro-
independence economists, would lead to a spiral of capital outflows-devaluation-
inflation-devaluation-capital outflows which would end in hyperinflation, thereby
offsetting the positive effects of devaluation on competitiveness, as well as sharp falls in
GDP, as described in Feito (2013). With a new currency, Catalonia would suffer a not too
dissimilar process to that followed by Germany in the interwar period. Naturally, pro-
independence economists know this and politicians sense it too, so it is understandable
that they resort to all sorts of mind games to convince Catalan society, and perhaps
themselves too, that an independent Catalonia would remain in the euro. The most
extensive versions are provided by Gali (2013a) and Gali (2013b). The starting point is
that there are countries outside the EU that have unilaterally adopted the euro, such as
Serbia, Montenegro, Cape Verde, Andorra, Liechtenstein, San Marino and the Vatican.
Undoubtedly, an independent Catalonia could unilaterally decide to adopt the euro as
legal tender. The fundamental question is whether outside the EU and therefore the

The pitfalls of Catalan independence’s economic postulates
43
euro area it could use the euro as the only legal tender or whether it would be obliged to
introduce its own currency because of not having the necessary euro credit to meet the
financing needs of its public and private sectors.
The crucial difference between an independent Catalonia and those other countries,
apart from their size and the fact that many of those city states are net creditors to the rest
of the world, is that Catalonia has all its assets and liabilities in euros while those countries
had them in their own currency when they adopted the euro. In other words, the Treasury
of an independent Catalonia would have public debt in euros, so debt redemptions and
new issuances to finance its deficit should be paid in euros. Who would grant the Treasury
of an independent Catalonia the necessary loans in euros to meet its borrowing needs?
Naturally, by not being a member of the Euro zone, the new Catalan state would not have
access to the financial facilities created to rescue banks or finance euro currency countries
whose situation impedes them from issuing debt in the markets. Pro-independence groups
answer this question as follows: the same as now; in other words, Spanish banks or
branches of Catalan banks in Spain or any other country in the euro area. Ignoring for now
the matter that one of the main lender to Catalonia is the Spanish central government,
Spanish banks that are currently refinancing Catalan debt and its public deficit do so
because these banks are in the euro system and can discount that Catalan debt at the ECB.
Spanish banks therefore finance Catalonia, like other regions, because its membership of
the euro system entitles them to ECB funding. If Catalonia leaves the EU, any bank that has
their headquarters there will leave the euro system and not have access to ECB funding, so
they would not acquire issuances of Catalan debt because they would not be able to
finance them. Pro-independence groups respond by saying that Catalan banks (in reality it
is unlikely that any would remain) could establish branches in Spain (or in any other
country in the Euro zone), even their headquarters if necessary, and access euro system
financing through those vehicles. This is certainly possible but the assets that will have to
be presented as collateral to obtain ECB funding must be issued by EU or EEA countries.
Thus, debt issued by the Catalan Government will not be accepted as collateral by the ECB.
Given that during the initial stages of its hypothetical independence Catalonia would be
outside the EU and the EEA, and that as already seen the negotiation period in both cases
would be lengthy and uncertain, the new Catalan state would have no other option than
introducing its own currency to meet its payments.
The reality would be more drastic. The financial markets, including here
Catalan businesses and families, would not give any option to the new state:
immediately after the unilateral declaration of independence there would be a
massive flight of capital from Catalonia, from the deposits of the banks located
there as well as from the Catalan debt in private and bank portfolios, causing
financial chaos that would require capital controls and establishing a new
currency. It is difficult to overstate the economic and social costs of a diabolical
downward spiral that would be triggered off at that moment.
5.3. The cost of the self-determination referendum or plebiscite election
The previous section looked at the economic costs for Catalonia of the hypothetical
circumstance of going from its current situation to independence. This section weighs up the
economic costs for Catalonia of holding a self-determination referendum, or a plebiscite
election with independence at the forefront of the electoral programme. Based on the

The political economy of Catalan independence
44
analysis in the previous section, the costs would undoubtedly be substantially less than
those generated by independence because Catalonia would not leave the EU or the euro
as would happen with secession. Therefore, the costs produced by the diversion of trade
flows and relocation of capital and human resources would also be lower, as would the
increase in the risk premium on Catalan debt, but they would be far from negligible.
Interestingly enough, despite the rise in pro-independence rhetoric during these past two
years, Catalonia has not yet suffered any of the costs that would be generated by either
the secession or the referendum without conclusive results. Not at the time of writing at
least, at the end of 2013, when an illegal referendum was announced and as such difficult
to hold for November 2014. It is true that some companies and citizens have moved to
other parts of Spain, but these movements are almost always explained by the high levels
of taxation on income and property levied in Catalonia. As mentioned above this high
taxation is completely unrelated to Catalonia’s financing difficulties and has ideological
roots because it stems from the decisions of left-wing parties which, alone or in coalition
with CiU, have governed Catalonia since 2003. Most of these measures were mainly
adopted before the outbreak of the economic crisis. Indeed there has been a recent rise in
inheritance tax imposed by ERC on CIU as a condition, together with the calling of the
referendum, for giving them its support for at least one more year of the term of office.
Some pro-independence groups, namely Economistas por la Independencia (2013),
want to see in the absence of negative effects of secessionist rhetoric a positive reaction
from the economic world to Catalan independence. The real reason why pro-independence
rhetoric has not had significant costs for Catalonia is that for now the main economic
players are ruling out the possibility of secession happening4. At the moment, the
financial markets, multinational and domestic companies, both Catalan and from the
rest of Spain, and even most citizens from Catalonia and the rest of the country, have
not considered in their spending and investment decisions the possibility of an
independent Catalonia, not even that of a Catalonia going further down the path of
self-determination referenda that may ultimately lead to secession. What is discussed
in this section is what would happen if this scenario starts to be discounted by
economic players. For this, what happened in Canada with the rise of pro-
independence in Québec is examined. It is certainly a remarkably similar experience to
what would happen if Catalonia were to hold a self-determination referendum as
recently announced by the President of the Catalan government or if at some point
plebiscite elections were held with the goal of independence in the electoral manifesto.
There are certainly differences which we will highlight in due course, differences that
suggest that the economic costs for Catalonia would be higher than those for Québec
since it decided to pursue independence. Like Catalonia in Spain, Québec plays an
important role in the economy of Canada, representing around 20% of its GDP and
23.5% of its population. The corresponding figures for Catalonia are 18.56 and 16.2
respectively.
Separatist tensions and their possible economic consequences are lodged in the mind
of Canadians with the electoral victory, on the back of a sovereignty project from the
Parti Québécois (PQ) in 1976. From then on tensions between Québec and other
Canadian provinces, as well as that province and the central government, intensified,
4 If any reader has any doubt over what the financial markets think of Catalan Independence they can consult J.P.Morgan (2012), Credit Suisse (2012) or UBS (2012) and more recently J.P. Morgan (2014) and Moody’s (2014)
The pitfalls of Catalan independence’s economic postulates
45
leading to the 1980 referendum, which was lost by the secessionists (the question in the
referendum was whether Quebeckers wanted to change their status to that of a Free State
associated with Canada). After a brief period of political stability, pro-independence
tensions escalated in the early 90s when, on the initiative of the PQ, a series of proposals
were put to the vote to “resolve the problem of Québec”. The first of these, the Lake
Meech Accord in 1990, was voted on in every province in Canada but did not receive the
necessary support and was not approved. The second, the Charlottetown Accord, was
submitted to a public referendum and defeated by a majority. After this, the secessionists
achieved in 1995 the holding of a national referendum with the question of independence
in which the “no” vote won by a close margin of 1%.
What has happened to the economy of Québec in the past 30 years? Between 1981
and 2007, to exclude the impact of the recent economic crisis, the average annual
economic growth of Québec was 2.3% while the average annual growth of the rest of
Canada was 3%. Although initially this difference may appear small, over such a long
period it means that while the rest of Canada saw an increase in its GDP between 1981
and 2006 of 109.9% during that time, the GDP of Québec only increased 76.6%.
Specifically, Québec went from representing 23.5% of Canada’s GDP in 1981 to 20.56% in
2006. One of the reasons for the lower GDP growth of Québec was indeed negative
demographics and emigration to other Canadian provinces, similar to what would
happen to Catalonia. As its population grew less than the rest of Canada, the growth in
per capita income in Québec during that period was similar to that of the rest of Canada.
But this equal growth in per capita income is indicative of economic inefficiency in
Québec, as its per capita income in 1991 was well below that of the rest of Canada (by an
amount of $3,652) and therefore its growth should normally have been faster. Due to the
equal growth in per capita income between Québec and the rest of Canada and the lower
level of per capita income of the former in relation to the latter in 1981, the gap between
the living standards of the rest of Canada and those of Québec has widened by 68%, from
$3,652 in 1981 to $6,137 in 2007.
The harmful influence of pro-independence tensions on the relative economic
performance of Québec is clear. Between 1976 and 1980, during the initial period of pro-
independence, thirty of the largest Canadian companies left Québec and around 100,000
of its citizens under 25 years of age went to live in other provinces. The economic and
financial predominance in Canada of Québec during the 1970s was clearly transferred to
Toronto and today the difference in income and population between the two cities leans
heavily in favour of Toronto. So, while in 1976 the metropolitan area of both cities had
practically the same population (around 2.8 million), today that of Toronto is 5.6 million
(double) and that of Montréal 3.6 million (30% more).
In my opinion, if Catalonia follows the path of self-determination referenda or
plebiscite elections, it would see a significant fall in its growth relative to the rest of Spain
(and relative to which Catalonia would have in the absence of referenda). As soon as the
separatist risk is discounted by national and international financial players, by Catalan
families and businesses and the rest of Spain, it would have negative economic consequences
for Catalonia and positive ones for the rest of Spain (in the same way as Québec separatism
has been beneficial for Ontario and other Canadian provinces). The veiled insinuations that
many national and multinational companies make today about their relocation would
actually take place with a frequency and intensity that would surpass mere anecdotes.

The political economy of Catalan independence
46
Catalan debt, currently outside the market, would see a significant increase in its risk
premium (as is happened with Québec debt compared to that of other Canadian provinces).
Exports from Catalonia to the rest of Spain would also be affected, although obviously to a
far lesser extent than with independence. As has happened in Canada, if Spain as a whole
was to recover from this crisis satisfactorily and grow vigorously once again, none of the
above would prevent Catalonia from growing with the Spanish economy, although not as
quickly. However, if Catalonia would follow the path of self-determination referenda and
plebiscite elections without having resolved its severe fiscal problem, Catalonia could end up
being left out from the recovery of the rest of Spain. Perhaps not at first, because the negative
effects referred to here would be fairly minor initially, but their gradual accumulation would
weaken the economic performance of Catalonia sooner or later.
6. Conclusions
The first conclusion of this study coincides with the premise on which it is based:
economic factors have played an essential role in the upturn in pro-independence in
Catalonia and will keep on doing so in the immediate future. Certainly they are not the
only ones and some people may think that they are not the most important ones.
Unquestionably, there are political factors, the most prominent being the existence of
parties and factions whose chief goal is Catalonia's independence. Throughout Spain's
modern history, secessionism has always reared its head whenever our country has been
at its weakest, and the economic crisis we are going through is definitely one of those
moments.
Even if only for that reason, economic factors are decisive for understanding why the
independence issue has been raised now and not before. In any case, they hold the key to
understanding both the disaffection with Spain and support for secessionism by a
growing number of Catalonians and the dangerous pro-independence pirouette of
politicians who had never been pro-independence and the open rebellion of those who
have always been.
The second section of the study underscores how crucially important two singular
economic phenomena have been to this process: the longest and most intense period of
economic expansion in our recent history (1994-2007) followed by a crisis that has also
been the longest and most intense on record in Spain (2008-2013). During that long and
vibrant economic upswing, which everyone thought would never end, all areas of the
State embarked on ambitious public spending projects, but the crisis made it impossible
to continue funding such projects. Spain as a whole has suffered a severe fiscal crisis that
has hit the different autonomous regions to a larger or lesser extent, depending on the
excesses committed before the crisis and the adjustments and reforms made since then.
The fiscal excesses committed in Catalonia by the first tripartite government (2003-2007)
were significantly larger than those of most other regions, and the way different Catalan
governments handled the crisis was just as equally disastrous. Consequently, when the
crisis hit Catalonia (as in Valencia or Castilla-La Mancha), the public debt and deficit
levels were unsustainable. Unlike many other region, however, Catalonia's ruling
political class has managed to convince Catalan society that its economic difficulties are
due to plundering by Spain and that the solution to them is to leave Spain or, at the very

The pitfalls of Catalan independence’s economic postulates
47
least, use this threat to obtain the huge resources they need to lower its public debt to
sustainable levels without further reforms and public spending cuts.
In this section, I argue that the switch to pro-independence is not unrelated to
Catalonia's huge difficulties to keep on financing its current level of public spending. The
pro-independence stances of the Catalonian Government and its separatist allies have
grown more aggressive as its financial problems have worsened. Paradoxically, it has
become more heavily economically dependent on the Spanish Government. The Catalan
Department of Finance found it impossible to issue enough debt necessary to pay its
suppliers, finance its high public deficit and make its huge debt repayments (just like
some other regions), which is why the Spanish Government set up the Regional
Liquidity Fund (FLA) and the Suppliers Payment Fund (FPP). With the Spanish
Government's support, Catalonia has absorbed nearly half of the FLA and a share of the
FPP that considerably outweighs its contribution to the Spanish GDP, enabling it over
the last two years to run up budget deficits significantly higher than the average of the
other regions and keep on increasing its public debt. This goes to show that the
Catalonian Government and the parties that back it have, for the time being, benefitted
from their pro-independence stance: they have managed to soften the adjustments
needed to put their deficit and public debt back on the path towards sustainability,
thereby lowering the political cost of these measures and cushioning the fall of its GDP.
Since the onset of the crisis, Catalonia's GDP has dropped 6.7%, less than the drop of
Spain's overall GDP (7.5%) and much less than that in Valencia (11%), Castilla-La
Mancha (12.7%), Andalusia (11%) or Extremadura (10%).
The pro-independence groups have managed to convince much of Catalan society
that its hardships are not due to the economic crisis that has hit the rest of Spain even
harder, or to overspending and economic mismanagement by its governments, but to the
fact that "Spain is robbing them." They have also got many people in Catalonia thinking
that independence is the solution to their economic problems and the door to a haven of
well-being that today they are denied because they are part of Spain. The study outlines
a number of reasons to explain the commercial success that the unfounded assumptions
of the independence movement have reaped among Catalan society. One is that it is not
easy for people in a region that is richer that almost all others to grasp that they may face
the same and even bigger difficulties than other regions that receive net transfers from
the financing system to keep on maintaining their level of public spending. It is hard to
avoid the easy temptation to think that these difficulties stem from too many resources
being transferred to other regions and that they would be solved by reducing those
transfers. Yet a person or a company who is much richer than others, and so with their
taxes contributes to support the State far more than those other people or companies,
could end up bankrupt or insolvent if they have over borrowed and the sum of their debt
servicing and current expenditure exceeds their current revenue plus any other revenue
raised by selling off assets.
The third section of the study demonstrates the nonsense of the “tax-plundering” or
“Spain robs us” myth, as well as the fallacy of the tax windfall that pro-independence
groups claim Catalonia would enjoy if it gained independence. The study also argues
that it will not be easy, nor therefore immediate, to eradicate these beliefs from the mind
of many Catalonians. As this study demonstrates, the two economic postulates of the
pro-independence movement, fiscal plundering and the well-being haven of
The political economy of Catalan independence
48
independence, are underpinned by quicksand and cannot withstand the weight of reason
and evidence. Nonetheless, as everyone knows, when rigor and evidence come up
against a saying that has become deeply rooted in people's minds, the saying always
wins in the short term, especially if the saying provides simple explanations of the causes
of the crisis and painless solutions to it, whereas fully understanding the reality involves
complex explanations and solutions which inevitably call for sacrifices. Above all if the
saying and economic axioms of pro-independence are voiced by powerful speakers who
drown out the alternative explanations. To make matters worse, until recently these
explanations have remained few and have been inadequately marketed to Catalonia
society. Even so, the logical gaps of the independence movement's economic foundations
are such that sooner or later reason and evidence will make inroads into Catalan society.
Indeed, it could be said that part of these foundations, such as whether an independent
Catalonia should remain in the European Union and the euro, have begun to erode in
recent months.
To prove the "tax plundering", pro-independence groups point to Catalonia's fiscal
balance deficit. According to the Regional Government's figures, in 2010 it stood at 8.5%
of GDP, and it claims this figure has stayed fairly constant since the introduction of the
State of the autonomies in 1978. This study summarizes the evidence available to date on
Catalonia's fiscal balances and gives a detailed explanation of the meaning and scope of
the fiscal balance concept, reaching several conclusions. The first is that the fiscal balance
is not the right instrument for measuring whether any region is treated better or worse in
fiscal terms. As is explained in the text, a region can have a larger fiscal balance deficit
than another and yet receive a better fiscal treatment. The second, that the differences
between the fiscal balances of a country's regions depend essentially on regional
differences in per capita income, the size of the welfare state managed by the regions and
how progressive the tax system as a whole is. The third, that there are two ways of
calculating fiscal balances: the monetary flow approach and the burden-benefit
approach, and each of these two approaches suits different purposes. The monetary flow
approach should only be used to measure how Central Government's fiscal actions
directly impact the regional economy. This direct impact might be positive but indirectly
it may have negative effects if it absorbs resources that could be put to more productive
private uses. The burden-benefit approach is the right one for measuring the
redistributive impact between regions of Central Government's fiscal actions and
therefore to gauge the region's contribution to inter-regional solidarity. Moreover, each
of these two balances can be recalculated to neutralize the impact of the economic cycle,
by developing the virtual fiscal balances that would exist if the Spanish economy was
growing at its potential and there was full employment. This means that, for each year,
there are not one but four possible fiscal balances for Catalonia. The study shows that of
all the possible fiscal balances, the Catalonia Government uses the ones that inflate
Catalonia's fiscal deficit the most. Yet, above all, it shows that they are used wrongly. For
example, the fiscal balance of 2010 (or any year) is used according to the monetary
approach and neutralized as an indicator of fiscal abuse or Catalonia's contribution to
inter-regional solidarity, which makes no sense. Taking the nonsense to its logical
apotheosis, the same balance is held up as a measure of the fiscal dividend of
independence.

The pitfalls of Catalan independence’s economic postulates
49
Catalonia's fiscal treatment has to be measured by other indicators, as it is done in
this study and is summarized below. Catalonia’s contribution to interregional solidarity,
and that of any other region, must be measured by the neutralized fiscal balance
calculated according to the burden-benefit method. The fiscal dividend of independence
must be calculated on the basis of the fiscal balance according to the non-neutralised
burden-benefit approach, correcting this balance by the substantially increased public
spending that an independent Catalonia would face and by the equally marked slump in
its public revenues. The final conclusion is that Catalonia's fiscal balances, including
those calculated by its Government, are fully consistent with the per capita income
differences between Catalonia and the rest of Spain, and are similar to those recorded by
the rich regions of other countries. Under no circumstances do they justify the tax
plundering argument or the promise of a tax windfall that would feed an independent
Catalonia. Indeed, how is it possible that if Catalonia has been plundered by the rest of
Spain, by around an annual 8% of its GDP as secessionists maintain since the coming into
effect of the state of the autonomous regions in 1978, it has been able to exceed during
this period the per capita income of the richest countries in Europe? How is it possible
that the rest of plundering Spain still has a per capita income of 20% less than the
plundered Catalonia? The fact that Catalonia belongs to Spain, like any other region
especially those with higher per capita income, has the huge benefits generated by full
economic integration that only arise within a country and the cost of transferring fiscal
resources to regions with lower per capita incomes. You cannot expect to have one
without paying for the other.
As mentioned earlier, the fiscal balance is not the right instrument for measuring
whether a given region is treated better or worse in fiscal terms. The best indicator for
this purpose would be the result of measuring how much the system gives to each region
relative to its population. As the text explains, constructing this indicator involves
considering the specific features of each region, the political powers transferred to them,
their population density and its age structure, etc. The studies that have calculated these
indicators on a like-for-like basis, so they can be compared across commonly-funded
regions, show that the fiscal treatment applied to Catalonia in the last ten years has been
very close to the average and almost the same as the other regions with similar
population or economic size, Madrid and Andalusia. In fact, the funding system agreed
for the period 2009-2014 noticeably improved Catalonia's funding, so that indicator
might improve accordingly when the figures for these last few years become available.
There is clearly room for improvement in the regional financing system, especially
with regard to its transparency, and it should also be made more efficient by applying,
among other improvements, the principle of ordinality as described in this study. That
said, neither this nor any other potential improvements to the regional financing system
would give Catalonia more than 0.5% of its GDP, so this amount would not solve the
serious problems of adjusting its debt and public deficit to sustainable levels.
Section four of the study explains how much independence would cost Catalonia in
economic terms, as well as the economic costs that the region would face if it goes down
the road of self-determination referenda or plebiscite elections. The study summarises
the main papers written on this matter and offers different considerations as to how large
these costs would likely be. Although it gives quantitative orders of magnitude, this
section mainly aims to identify the economic mechanisms that independence would set
The political economy of Catalan independence
50
off and determine whether these mechanisms have the potential to trigger off a major
depression in independent Catalonia.
Catalonia's independence would set off two different engines of depression: on one
hand, the fall in its exports to the rest of Spain and in investments from the rest of the
world, including the rest of Spain, in Catalonia, as well as the loss of skilled workers; on
the other, leaving the European Union (EU) and the euro. This second engine would not
only speed up the first, but also have a colossal depressive impact. There is no denying
that Catalonia would leave the EU, as shown in this section, and as the President of the
Catalonia Government himself has had to admit. Contrary to what the President claims,
Catalonia could not stay in the euro either and would be forced to introduce its own,
very devalued currency.
The reason why is that if Catalonia did not belong to the EU or the European
Economic Area (EEA) at the time of its independence, its debt would not be accepted by
any financial institution, either inside or outside Catalonia (unlike what happens today),
because the banks could not finance this debt through ECB loans. In fact, as soon as it
declared its independence, probably before, there would be a massive flight of bank
deposits and other Catalonian assets towards Spain and other Euro zone countries,
forcing it to introduce a new currency. The economic costs in the case of self-
determination referendums or plebiscite elections would be much smaller because
Catalonia would not leave the EU or the euro, but they would not be negligible. Using as
a proxy what happened in Quebec's case, this section shows that when the markets
(which include Catalan businesses and families) begin to discount the likelihood of a
probable though distant secession of Catalonia (and this has not occurred yet), the two
engines of depression referred to above would start operating, albeit at a much slower
rate. Unlike what would happen in the event of a unilateral declaration of independence,
which would be economically dramatic for Catalonia but also very expensive for the rest
of Spain, this latter case would be harmful to Catalonia but partially beneficial to the rest
of Spain, as has happened in the case of Quebec and the rest of Canada. For all these
reasons, and to conclude this study, it must be said, at least from an economic
perspective, that anyone seeking secession does not know what they are doing because
they do not know what they are undoing.

The pitfalls of Catalan independence’s economic postulates
51
Bibliographical appendix
Notes
There follows a description of the bulk of literature used in this study, as well as
references especially useful for delving deeper into the issues addressed.
The fiscal crisis in Spain and Catalonia
The annual reports published by the Bank of Spain (2009, 2010, 2011, 2012)
provide a particularly comprehensive overview of how the Spanish economy has
performed during the crisis. For a synthetic view of the fiscal crisis in Spain, see Taguas,
D. (2013). For information on the fiscal crisis in Catalonia and the autonomous regions as
a whole, see the reports published by Fedea (2012 and 2013) and BBVA (2013).
Catalonia's fiscal balances and fiscal treatment
For information on Catalonia's fiscal balances and the fiscal balance concept, see
Zabalza (2013), Barberán, R. y Uriel, E. (2013), Semur, A. (2013) and Polo, C. (2014). The
bibliography on the regional financing system and Catalonia's fiscal treatment is
particularly vast, and the following works shed most light on the issues. All the articles
in Instituto de Estudios Económicos (2013) are relevant. An especially useful and
comprehensive source is De la Fuente, A. (2012). See also Zabalza (2012) and De la
Fuente, A. (2013 a). For historical data on fiscal balances to 2005, see Barberán, R. and
Uriel, E. (2007), Instituto de Estudios Fiscales (2007) and Generalitat de Catalunya (2009).
See also Uriel, E. (2014) and Polo (2014). The most outstanding studies on Catalonia's
fiscal treatment are by De la Fuente (2013 a) and De la Fuente (2014).
The economic costs of independence for Catalonia and self-determination
referenda
In addition to the studies mentioned in the text, see Ghemawat, P. (2012 a), (2012
b) and Young, R. (1998).
Bibliography
Antràs, P. y Ventura, J. (2012), “Dos más dos son mil. Los efectos comerciales de la
independencia” Working document, 2012.
Bank of Spain (2009, 2010, 2011 and 2012), Annual Reports.
Barberán, R. y Uriel, E. (2007), Las balanzas fiscales de las CCAA españolas con la
AAPP central 1991-2005, Fundación BBVA, Bilbao.
___(2013), “Las balanzas fiscales y la financiación autonómica” en IEE, Estudios
Económicos (2013 a) Madrid.
BBVA (2013), “Las finanzas autonómicas en boom y en crisis 2003-2012", research.
Working document nº 13/16, April 2013.
Boix, C. (2012 a), “La qüestió internacional”, 11/9/2012.
___(2012 b), “Cataluña, ¿Estado de la Unión Europea?”, ARA 23/10/2012.
Bosch, N. y Espasa, M (2012), Viabilidad de Cataluña como Estado. Análisis de la
Hacienda Pública, Els informes de la Catdem.

The political economy of Catalan independence
52
Boyer, M. (2007), “Quebec's Disappointing Economic Performance in the Last 25
Years,”, Montreal Economic Institute, Economic Notes, Mayo 2007.
Buesa, M. (2009), "La independencia de Cataluña"
milkelbuesa.wordpress.com/2009/12/16
Colectivo Wilson, www.wilson.cat.
Comenford, D., Myers, N., Rodríguez, J.V., “Measuring Costs and Benefits of
Independence” Working document, 2012.
Credit Suisse (2012), Economic Research. European Economics "Catalonia's choice"
19/11/2012.
De la Fuente, A. (2011), “La financiación territorial en España: situación actual y
propuestas de reforma” in IEE 2011.
___(2012), “¿Cisne negro o pollo del montón? El déficit fiscal catalán en
perspectiva” Instituto de Análisis Económico, CSIC.
___(2013 a), “¿Está Cataluña maltratada fiscalmente?” Manuscrito CSIC, Instituto
de Análisis Económico, 2013.
___(2013 b), “La evolución de la financiación de las CCAA de régimen común,
2002- 2011” Working document 13/32, BBVA, Madrid 2013.
___(2013 c), “Algunas propuestas para la reforma del sistema de financiación de las
CCAA de régimen común”, IEE (2013 a).
___(2014), “¿Maltrato fiscal?” in IEE (2014).
Economistas por la independencia (2013), Catalunya: Europa, Barcelona, 2013.
ERC (2013), La Viabilitat económica de Catalunya Estat.
Fedea (2012 y 2013), Observatorio Fiscal y Financiero Comunidades Autónomas.
Feito, J.L. (2013), “Prólogo” in IEE (2013 a).
Gali, J (2013 a), “Estat propi: euro”, La Vanguardia 19-03-2013.
___(2013 b), “Cataluña: cooperación o confrontación” El País 12-10-2013.
Generalitat de Catalunya (2009), “Metodología y cálculo de la balança fiscal de
Catalunya amb l'Administració Central 2002-05” Departament de Economía y Finanzas,
Barcelona.
___(2012), “Resultats de la balança fiscal de Catalunya amb el sector públic central
2006-2009” Departament de Economía, Coneixement, monografía nº14/2012, Barcelona.
Ghemawat, P. (2011) , “Coste comercial de la separación”, La Vanguardia
19/6/2011.
___(2012 a), World 3.0. Global Prosperity and How to Achieve it. 2012.
___(2012 b), “To Secede or Not to Secede: The Case of Europe”, The Globalist
02/07/2012.
Guinjoan, M, Cuadras, X. (2011), Sense España, Ed. Portic, Barcelona 2011.
IEE, Instituto de Estudios Económicos (2011), Reformas necesarias para potenciar el
crecimiento de la economía española, Vol 1 Ed. Civita, Madrid 2011.
___(2013 a), Nº 1 y 2 de Revista de Estudios Económicos Propuesta para la reforma
de la financiación autonómica, Madrid 2013.
___(2013 b), “La cuestión catalana hoy” Instituto de Estudios Económicos, serie
Comunidades Autónomas, Madrid 2013.
___(2014), La cuestión catalana: balanzas fiscales y tratamiento fiscal de Cataluña.
Madrid 2014.

The pitfalls of Catalan independence’s economic postulates
53
Instituto de Estudios Fiscales (2006), Grupo de trabajo sobre metodología de cálculo
de las balanzas fiscales, Madrid 2006.
___(2008), “Las balanzas fiscales de las CCAA españolas con las AAPP centrales”
Ministry of Economy and Finance, Madrid.
J.P.Morgan (2012), Economic Research. Note "Catalonia challenge asks real
questions of Europe" 26/11/2012.
___ (2014), Europe Economic Research. ‘Catalonia set headwinds for Spain in 2014-
2015’, Europe Economic Research, 01/14.
Moody’s Analytics (2014), ‘Spain Outlook: a weak recovery’ Zach Witton, 14/01/14.
Piris, Jean-Claude (2013), Interview in El País (12/11/2013).
Polo, C. (2013), “El peso de las exportaciones en la economía catalana” en La
cuestión catalana hoy, IEE (2013).
___(2014), “Visión panorámica del argumento economista a favor de la
independencia de Cataluña: mito y realidad", in IEE (2014).
Rodríguez Mora, J.V. (2013), “Los costes de romper España” en El coste la No-
España, Fundación Progreso y Democracia, 2013.
Semur, A. (2013), “La perversidad de las balanzas fiscales” en IEE 2013 b).
Sobirania i Justícia (2013), Informe sobre la viabilidad económica de la
independencia de Catalunya, Barcelona.
Taguas, D. (2013), “Las fuerzas públicas españolas en el inicio del siglo XXI: los
efectos de la crisis financiera de 2007”, Institute of Macroeconomics and Finance, Camilo
José Cela University, Madrid 2013.
UBS (2012), UBS Investment Research "Can Catalonia leave? Hardly" 18/11/2012
(2014), “¿Cuál es el saldo fiscal de Cataluña”, Expansión 4/1/2014.
Vilalta, M. (2012), “Balanzas fiscales: metodología, resultado" Institut de Dret
Públic.
Young, R. (1998, “The secession of Quebec and the future of Canada”, McGill-
Queen's Press - MQUP, 1998.
Zabalza, A. (2012), “Malentendidos sobre el saldo fiscal calatán” El País, 29-11-2012.
___(2013),“Cuatro reflexiones sobre el saldo fiscal catalán”
www.fedeablogs.net/economia (06/04/2013).


55
IS CATALONIA BEING FISCALLY MISTREATED?
Ángel de la Fuente* Instituto de Análisis Económico (CSIC) and Barcelona GSE
June 2014
Abstract
This note critically appraises the claim that Catalonia is being fiscally mistreated, both in terms of the financing of its regional government and in terms of its net fiscal balance with the Spanish Central Government. Its conclusion is that nationalist complaints regarding these matters are not well founded. Looking at the available data, Catalonia’s fiscal situation is similar to that of other regions with similar levels of income per capita relative to the national average, both within Spain and abroad. This does not mean that all is well with Spain’s system of regional financing or with the distribution of Central Government expenditure across the country’s regions, but there are no traces of an anti-Catalan bias in either area.
*This paper is part of a research project financed by Fundación SEPI. Financing from the Ministry of Science and
Innovation under project ECO2011-28348 is also gratefully acknowledged.
This article was published by the IEE in ‘La Cuestión Catalana II’, on april 2014

The political economy of Catalan independence
56
1. Introduction
Over the last few years, economic considerations have come to play a central role
in the case for Catalan independence. Local nationalists have placed increasing emphasis on the idea that the Spanish Central Government is subjecting Catalonia to an unprecedented level of fiscal abuse that has no equal anywhere in the civilized world. This position is often synthesized in a slogan (Spain is robbing us!) which has become a key element in a highly successful marketing campaign that has contributed significantly to the growth of pro-independence sentiment in recent years.
Is there any truth to the slogan? The present note critically appraises the validity of nationalist charges of fiscal mistreatment by confronting them with the existing data on the fiscal situation of Catalonia and other territories that provide a natural reference. The analysis focuses on the two issues that are generally emphasized in nationalist propaganda: the financing of the Catalan Regional Government, also known as the Generalitat, and the net fiscal balance of the region with the Spanish Central Government. Looking at the data, we conclude that Catalonia’s fiscal situation is similar to that of other regions with similar levels of income per capita relative to the national average, both within Spain and abroad. This does not mean that all is well with Spain’s system of regional financing or with the distribution of Central Government expenditure across the country’s regions. Both have highly questionable features. That some of these features may cause irritation among many Catalans is quite understandable. That they should be enough to justify secession is another matter.
2. Is the Catalan regional government underfinanced?
Determining whether a Spanish region is relatively well financed is a bit more
complicated than it may seem at first sight. It is not enough, in particular, to check the gross revenue it receives under the current system of regional financing because some regional governments manage certain functions (such as the police or the prison system in the case of Catalonia) that other autonomous communities have not assumed and because they may have made different use of their fiscal powers to raise or lower regional taxes. It is also important to keep in mind that certain regions may require more resources than others in order to provide the same services because either the fraction of the population that needs such services is greater (as is the case with education in the regions with younger populations and with health care in those with older ones) or the unit costs of such services is higher as a result, for instance, of a disperse pattern of population settlement or the complications that arise in island regions.
In order to correct for all these factors, comparisons across regions are generally made using homogenized data on financing per adjusted capita that refer only to those functions that are managed by all the regions and try to hold approximately constant the level of fiscal effort. Hence, the numerator of this ratio is shown net of specific grants that finance non-standard functions assumed only by some regions and attempts to approximate the tax revenue regions would have obtained if all of them had applied a common tax schedule. Similarly, the denominator is not the real

Is Catalonia being fiscally mistreated?
population of each region but an adjusted population variable that is calculated using a formula that attempts to approximate the average cost per capita of the basket oservices provided by the regionalgeographical variables that have the greatest impact on such costs (basically, the age structure of the population, the land area of each region, the dispersion of its population and a special allowance for the two island regions). If we accept that the adjusted population variable approximates reasonably well the relative costs of public services in the different regions (and in my opinionsome room for improvementhead of population of the different regions should give us a fair measure of how well treated each one of them is in terms of its capacity to provide public services to citizens.1
Figure 1: Homogenized financing per adjusted capita,
- Key: Va = Valencia; Mu = Murcia; Catalonia; Ma = Madrid; Ba = Balearic Islands; León; Ex = Extremadura; Cnt = Cantabria and
Working with this indicatornormalize to 100 the average level of financing per adjusted head in Spain as a whole (excluding the so called foral regions of the Basque Country and Navarre, which enjoy a different and very favourableaverage, with an index of 99.last year that has been liquidated so far) or at averages over the period 2002be seen in Figure 1, this puts us approximately in the 1 The data on homogenized financing that are used in this note are taken from de la Fuente (2013).
further details on the construction of these data.2Working with unadjusted per capita financing changes things very little in the case of
other cases. In 2011, for instance, the Catalan index of relative financing would go from 99.6 to 98.7 if we did not
adjust the population, and that of Madrid would drop from100.2 to 94.8 because this region has a relatively you
population that is concentrated in a small territory
90
95
100
105
110
115
120
125
Va Mu Cana An
Is Catalonia being fiscally mistreated?
57
population of each region but an adjusted population variable that is calculated using a formula that attempts to approximate the average cost per capita of the basket oservices provided by the regional governments on the basis of those demographic and geographical variables that have the greatest impact on such costs (basically, the age structure of the population, the land area of each region, the dispersion of its
a special allowance for the two island regions). If we accept that the adjusted population variable approximates reasonably well the relative costs of public
rent regions (and in my opinion it does, even though some room for improvement), then the level of homogenized financing per adjusted head of population of the different regions should give us a fair measure of how well treated each one of them is in terms of its capacity to provide public services to
Homogenized financing per adjusted capita,
2011 and 2002-11 average
= Murcia; Cana = Canary Islands; An = Andalusia; C-M = Castilla= Balearic Islands; Ga = Galicia; As = Asturias; Ar = Aragón; = Cantabria and Ri= Rioja.
with this indicator, Catalonia has not been particularly mistreated. If we normalize to 100 the average level of financing per adjusted head in Spain as a whole (excluding the so called foral regions of the Basque Country and Navarre, which enjoy
favourable financing system), Catalonia is only slightly below taverage, with an index of 99.6 regardless of whether we look at figures for 2011 (the last year that has been liquidated so far) or at averages over the period 2002be seen in Figure 1, this puts us approximately in the same situation
The data on homogenized financing that are used in this note are taken from de la Fuente (2013).
further details on the construction of these data.
Working with unadjusted per capita financing changes things very little in the case of Catalonia and a bit more in
other cases. In 2011, for instance, the Catalan index of relative financing would go from 99.6 to 98.7 if we did not
adjust the population, and that of Madrid would drop from100.2 to 94.8 because this region has a relatively you
population that is concentrated in a small territory.
C-M CAT Ma Ba Ga As Ar CyL
2011 2002-11 avge.
population of each region but an adjusted population variable that is calculated using a formula that attempts to approximate the average cost per capita of the basket of
those demographic and geographical variables that have the greatest impact on such costs (basically, the age structure of the population, the land area of each region, the dispersion of its
a special allowance for the two island regions). If we accept that the adjusted population variable approximates reasonably well the relative costs of public
it does, even though there is still ), then the level of homogenized financing per adjusted
head of population of the different regions should give us a fair measure of how well treated each one of them is in terms of its capacity to provide public services to its
Homogenized financing per adjusted capita,
= Castilla-La Mancha; Cat = = Aragón; CyL = Castilla y
ly mistreated. If we normalize to 100 the average level of financing per adjusted head in Spain as a whole (excluding the so called foral regions of the Basque Country and Navarre, which enjoy
only slightly below the 6 regardless of whether we look at figures for 2011 (the
last year that has been liquidated so far) or at averages over the period 2002-11.2As can same situation as Madrid or
The data on homogenized financing that are used in this note are taken from de la Fuente (2013). See that paper for
Catalonia and a bit more in
other cases. In 2011, for instance, the Catalan index of relative financing would go from 99.6 to 98.7 if we did not
adjust the population, and that of Madrid would drop from100.2 to 94.8 because this region has a relatively young
Ex Cnt Ri
The political economy of Catalan independence
58
Andalusia (with averages over 2002-11 of 100.8 and 98.8 respectively) and clearly above the Balearic Islands (93.3), Valencia (92.6), Murcia (96.3), Castilla-La Mancha (98.3) and the Canary Islands (98.5).
What stands out from Figure 1 is not the non-existent mistreatment of Catalonia but the high dispersion of the regional financing index and the apparent arbitrariness of the distribution of resources across regions. With 2011 data, there is a spread of 27.5 percentage points between the top and bottom regions in terms of financing that has nothing to do with cost differences or, as we will see below, with gross tax revenues. Thus, Valencia is at 92.4 in terms of the index of relative financing per adjusted capita while Rioja reaches 120 for no apparent reason. The ordering of the autonomous communities in terms of resources per adjusted capita after the application of the system follows no clear logic. It is not that poor or rich regions are systematically well or badly treated. Rather, we find a bit of everything. Within poor regions we have Andalusia and Murcia between 94 and 96 while Extremadura exceeds 110. And the situation is similar within the group of rich regions, with Catalonia and Madrid between 99 and 101 while Rioja and Cantabria are around 120.
In terms of regional financing Catalonia is basically on the national mean, which is where all regions should be if we took seriously the constitutional principle of equality when it comes to citizens’ access to the public services managed by the autonomous communities. Hence, there are no objective grounds for complaint in this area. But there are understandable reasons for a certain irritation that comes essentially from two sources. The first one is the foral exception. The way the peculiar financing system enjoyed by the Basque Country and Navarre has been implemented in practice exempts two of Spain’s richest territories from any contribution to regional equalization and allows them to pay only a fraction of their share of the cost of the services they continue to receive from the Central Administration, leaving them with levels of financing per adjusted capita of the order of twice the average of the rest of the country.3Wishing for the same privileged deal is only human.
The second source of dissatisfaction has to do with the violation of what is sometimes called the ordinality principle. The same way the personal income tax does not alter the original ranking by gross income of otherwise equal taxpayers, the regional financing system should not alter the original regional ranking in terms of gross fiscal capacity (revenue from regional taxes under a common tax schedule) per adjusted capita – but it frequently does so and sometimes in striking ways. This can be clearly seen in Figure 2, where the homogenized financing of each region is compared with its gross fiscal capacity, with the regions ordered along the horizontal axis according to this last variable.4The vertical distance between the two lines in the figure measures the net effect of the redistribution mechanisms contained in the regional financing system on the resources of each autonomous community. While Catalonia loses 20 points (and Madrid 43) as we go from gross fiscal capacity to final financing per adjusted capita, Extremadura wins 37 points and the Canary Islands 44, which 3 See de la Fuente (2011). 4 The indicator of gross fiscal capacity used here differs from the official one for two reasons. The first one is that my
figures include the additional resources that the Canary Islands obtain outside the ordinary system of regional
financing due to the peculiar economic and fiscal regime this region enjoys. The second reason is that I introduce
some corrections to improve on the normative or homogenized revenues provided by the system for certain taxes. For
additional details, seede la Fuente (2013).

Is Catalonia being fiscally mistreated?
radically alters the positions of all way, converting the regional financinunderstandably resented by some of those who Figure 2: Homogenized financing vs. gross fiscal capacity per adjusted capita, 2011
3. Is Spain robbing us?
The second complaint of the Catalan nationalists has to do
fiscal balance of the region with the Central Government, which is often presented as nothing short of fiscal robbery. According to the Catalan Regional Government’s last report on the subject, the difference between the federal taxes Federal Government’s expenditure in the region amountedmillion euro or 7.7% of regional GDP. as the “excess burden” on Catalan taxpayers, what we should pay.
A couple of preliminary considerations seem to be in order. The first one is that interpreting a relatively rich region’s fiscal deficit as an unfair excess burden is plain nonsense. Doing so amounts to demandithem, leaving absolutely no room for redistribution, which is precisely reasons why taxes exist in the first placedeficit is larger than it would be reasonable, but given that the region per capita significantly higher than the national average, it would be very complicated to maintain, as nationalists oftenarbitrary policies that discriminate
The second consideration is that the way in which part of our taxes that returns to Catalonia is somean upward bias in the estimation of the region’s net fiscal balance. One of the most questionable options in this respect
50
60
70
80
90
100
110
120
130
140
150
Cana Ex C-M An
Is Catalonia being fiscally mistreated?
59
radically alters the positions of all of them in the regional ranking in a rather arbitrary , converting the regional financing model into a kind of lotte
understandably resented by some of those who are not on its winning side.
Homogenized financing vs. gross fiscal capacity per adjusted capita, 2011
The second complaint of the Catalan nationalists has to do with the adverse net fiscal balance of the region with the Central Government, which is often presented as nothing short of fiscal robbery. According to the Catalan Regional Government’s last report on the subject, the difference between the federal taxes paid in Catalonia and the Federal Government’s expenditure in the region amounted in 2011 to around 15.000
illion euro or 7.7% of regional GDP. The local press routinely interprets theseas the “excess burden” on Catalan taxpayers, i.e. as the amount we pay over and above
A couple of preliminary considerations seem to be in order. The first one is that interpreting a relatively rich region’s fiscal deficit as an unfair excess burden is plain nonsense. Doing so amounts to demanding that taxes should stay with those who pay them, leaving absolutely no room for redistribution, which is precisely
in the first place. One can try to argue that the Catalan fiscal deficit is larger than it would be reasonable, but given that the region per capita significantly higher than the national average, it would be very complicated to maintain, as nationalists often do, that such deficit is entirely the result of unfair and arbitrary policies that discriminate against Catalan citizens.
The second consideration is that the way in which the Generalitat calculatespart of our taxes that returns to Catalonia is somewhat peculiar and tends to produce an upward bias in the estimation of the region’s net fiscal balance. One of the most
stionable options in this respect is to disregard what comes back “in specie” rather
Mu Ga Va CyL As Ri Ar Cnt CAT
gross fiscal capacity homogeneous final financing
in a rather arbitrary g model into a kind of lottery that is
winning side.
Homogenized financing vs. gross fiscal capacity per adjusted capita, 2011
with the adverse net fiscal balance of the region with the Central Government, which is often presented as nothing short of fiscal robbery. According to the Catalan Regional Government’s last
paid in Catalonia and the to around 15.000
press routinely interprets these figures unt we pay over and above
A couple of preliminary considerations seem to be in order. The first one is that interpreting a relatively rich region’s fiscal deficit as an unfair excess burden is plain
ng that taxes should stay with those who pay them, leaving absolutely no room for redistribution, which is precisely one of the main
. One can try to argue that the Catalan fiscal deficit is larger than it would be reasonable, but given that the region has an income per capita significantly higher than the national average, it would be very complicated
the result of unfair and
the Generalitat calculates the what peculiar and tends to produce
an upward bias in the estimation of the region’s net fiscal balance. One of the most is to disregard what comes back “in specie” rather
CAT Ba Ma

The political economy of Catalan independence
60
than in cash, i.e. in the form of services provided by the Central Government that benefit the citizens of Catalonia even though they are not physically produced there. The Generalist’s preferred methodology (the so-called monetary flow procedure), does not count as part of the returns to the region its share of the central services and institutions of the Spanish federal administration, which is concentrated in Madrid, or almost any part of its expenditure on defence and foreign affairs.
The Catalan Government defends this approach on the grounds that it provides the best way to capture the effects of central expenditure on regional economic activity, but this is both irrelevant and questionable. It is irrelevant because the bulk of public expenditure has specific objectives that have little or nothing to do with the promotion of economic activity. Governments do not build military bases to create jobs but to protect their territory and, as a result, they put them in places that make strategic sense regardless of the local rate of unemployment. On the other hand, it is far from clear that the location of expenditure and the stimulus to economic activity always go together. In many cases what matters is not the location of expenditure per se but the place where the relevant goods or services are produced – say, where the fighter jet has been manufactured, and not where it is parked.
Unsurprisingly, regional fiscal balances are very sensitive to the methodology used to compute them. As an illustration, let us take the year 2005 for which, in addition to the Generalitat’s estimates (2009), we have another study undertaken by the Spanish Ministry of Economics and Finance (MEH, 2008) and a third estimate constructed by a couple of independent researchers, professors Uriel and Barberán (2007). Working always with neutralized figures,5 the Generalitat puts the Catalan fiscal deficit at 8,4% of GDP using the monetary flow approach. The same Catalan Government reduces this figure to 6% of GDP when a more reasonable methodology is used (the so called burden-benefit approach) in which central expenditure on common services, defence and foreign relations are distributed across all regions in proportion to their population. The Ministry gives somewhat smaller figures with the same two methodologies. If we neutralize their estimates with the same procedure that is used by the Generalitat, their central estimate of the Catalan fiscal deficit comes to 7,4% of GDP under the monetary flow approach and to 5,3% with the burden-benefit approach. Finally, Uriel and Barberán sensibly refrain from making monetary flow calculations and put the suitably neutralized Catalan fiscal deficit at 5% by the burden-benefit approach.
Hence, the most reasonable estimates of Catalonia’s net fiscal balance point toward a neutralized deficit of between 5% and 6% of GDP. To determine whether this is high or low, fair or unfair, we need to put this figure in context, relating it to Catalan and Spanish income per capita and checking what happens in similar territories. To do this,
5 “Neutralization” is used to avoid the distortion that arises because the budget imbalance of the Central
Administration varies over the business cycle and has a very direct effect on regional fiscal balances. In recession
years the Central Government spends much more than it collects in taxes, a fact that tends to improve the fiscal
balances of all regions simultaneously. During an expansion, the phenomenon tends to reverse itself. To eliminate
such noise, it is convenient to “neutralize” the budget imbalance of the Central Administration. The way the
Generalitat does it is by adjusting Central Government aggregate revenues so that they are equal to its aggregate
expenses, while holding constant the regions’ weights in total revenues. In what follows, I have used this procedure
whenever it has been possible in order to homogenize the different estimates of net fiscal balances.
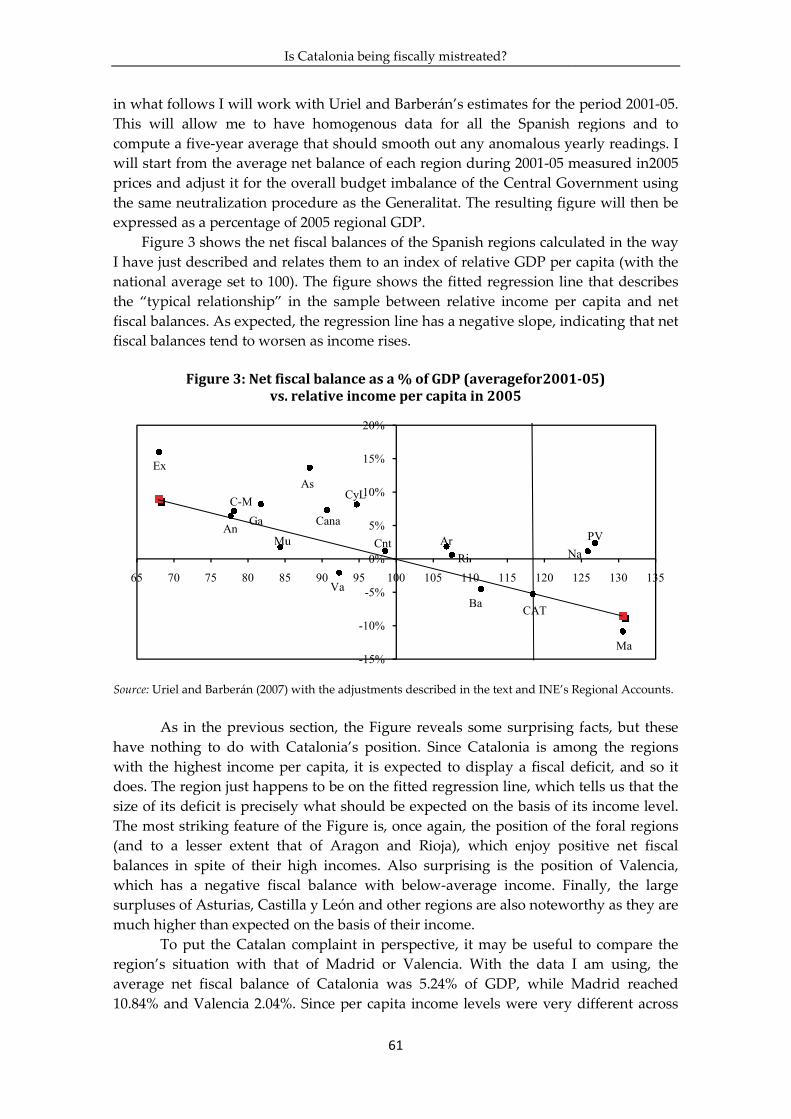
Is Catalonia being fiscally mistreated?
in what follows I will work with Uriel and Barberán’s estimates for the period This will allow me to have homogenous data for all the Spanish regions and to compute a five-year average that should smooth out any anomalous yearly readings. I will start from the average net balanceprices and adjust it for the overall the same neutralization procedure as the Generalitat. The resulting figure will then be expressed as a percentage of 2005 regional GDP.
Figure 3 shows the net fiscal I have just described and relates them to an index of relative GDP per capita (with the national average set to 100). The figure shows the fitted regression line that describes the “typical relationship” ifiscal balances. As expected, the regression line has a negative slope, indfiscal balances tend to worsen as income rises.
Figure 3: Net fiscal balance as a % of GDP (averagefor
vs.
Source: Uriel and Barberán (2007)
As in the previous section, the Figure reveals some
have nothing to do with Catalonia’s position. Since Catalonia is among the regions with the highest income per capita, it is expected to display a fiscal deficit, and so it does. The region just happens to be on the fitted regression lisize of its deficit is precisely what should be expected on the basis of its income level. The most striking feature of the Figure is, once again, the position of the foral regions (and to a lesser extent that of Aragon and Riojbalances in spite of their high incomeswhich has a negative fiscal balance with belowsurpluses of Asturias, Castilla y León and other regmuch higher than expected on the basis of their income.
To put the Catalan complaint in pregion’s situation with that of Madrid or Valencia. With the data I am using, the average net fiscal balance of Catalonia was 5.24% of GDP, while Madrid reached 10.84% and Valencia 2.04%. Since per capita income levels were very different across
65 70 75 80 85
Ex
An
C-M
Ga
Mu
Is Catalonia being fiscally mistreated?
61
in what follows I will work with Uriel and Barberán’s estimates for the period This will allow me to have homogenous data for all the Spanish regions and to
year average that should smooth out any anomalous yearly readings. I will start from the average net balance of each region during 2001-05 measured in
and adjust it for the overall budget imbalance of the Central Government using the same neutralization procedure as the Generalitat. The resulting figure will then be expressed as a percentage of 2005 regional GDP.
Figure 3 shows the net fiscal balances of the Spanish regions calculated inI have just described and relates them to an index of relative GDP per capita (with the national average set to 100). The figure shows the fitted regression line that describes the “typical relationship” in the sample between relative income per capita and net
al balances. As expected, the regression line has a negative slope, indto worsen as income rises.
Net fiscal balance as a % of GDP (averagefor2001
vs. relative income per capita in 2005
Barberán (2007) with the adjustments described in the text and INE’s Regional Accounts.
As in the previous section, the Figure reveals some surprising facts, but these have nothing to do with Catalonia’s position. Since Catalonia is among the regions with the highest income per capita, it is expected to display a fiscal deficit, and so it does. The region just happens to be on the fitted regression line, which tells us that the size of its deficit is precisely what should be expected on the basis of its income level. The most striking feature of the Figure is, once again, the position of the foral regions (and to a lesser extent that of Aragon and Rioja), which enjoy positive net fiscal
their high incomes. Also surprising is the position of Valencia, which has a negative fiscal balance with below-average income. Finally, the large surpluses of Asturias, Castilla y León and other regions are also noteworthy as they are much higher than expected on the basis of their income.
To put the Catalan complaint in perspective, it may be useful to compare the region’s situation with that of Madrid or Valencia. With the data I am using, the
age net fiscal balance of Catalonia was 5.24% of GDP, while Madrid reached 10.84% and Valencia 2.04%. Since per capita income levels were very different across
-15%
-10%
-5%
0%
5%
10%
15%
20%
85 90 95 100 105 110 115 120
Mu
As
Cana
Va
CyL
Cnt Ar
Ri
BaCAT
Na
in what follows I will work with Uriel and Barberán’s estimates for the period 2001-05. This will allow me to have homogenous data for all the Spanish regions and to
year average that should smooth out any anomalous yearly readings. I measured in2005
of the Central Government using the same neutralization procedure as the Generalitat. The resulting figure will then be
calculated in the way I have just described and relates them to an index of relative GDP per capita (with the national average set to 100). The figure shows the fitted regression line that describes
n the sample between relative income per capita and net al balances. As expected, the regression line has a negative slope, indicating that net
2001-05)
text and INE’s Regional Accounts.
ng facts, but these have nothing to do with Catalonia’s position. Since Catalonia is among the regions with the highest income per capita, it is expected to display a fiscal deficit, and so it
ne, which tells us that the size of its deficit is precisely what should be expected on the basis of its income level. The most striking feature of the Figure is, once again, the position of the foral regions
a), which enjoy positive net fiscal . Also surprising is the position of Valencia,
average income. Finally, the large ions are also noteworthy as they are
it may be useful to compare the region’s situation with that of Madrid or Valencia. With the data I am using, the
age net fiscal balance of Catalonia was 5.24% of GDP, while Madrid reached 10.84% and Valencia 2.04%. Since per capita income levels were very different across
125 130 135
Na
PV
Ma

The political economy of Catalan independence
62
these regions in 2005 (118.4, 130.6 and 92.3 respectively, with the Spanish average normalized to 100), what we should look at is not the size of the deficit per se but the relation between deficit and relative income. A useful way to describe this relationship is by dividing the net per capita fiscal balance of each region by its income per capita differential with the Spanish average to obtain a sort of aggregate marginal tax rate that tells us what fraction of the region’s per capita income differential is taken away by the Central Government and sent to the rest of the country. The value of this ratio is 28.5% in Catalonia, 35.5% in Madrid and -26.5% in Valencia. Catalonia’s coefficient coincides almost exactly with the national average, indicating that the Spanish fiscal system does not discriminate against the region. Madrid may have somewhat better reasons for complaining since the Central Government takes away a bigger fraction of its surplus relative to average income per capita, but this is not necessarily a bad thing if we think the tax system should be somewhat progressive. The region that should really complain loudly, however, is Valencia. The counterintuitive negative sign of its aggregate marginal tax rate reminds us that, as we have already seen, the region has a negative net fiscal balance in spite of having below-average income – something which does not make a whole lot of sense. 4. This doesn’t happen anywhere else?
Complaints about fiscal robbery are often accompanied by claims that no other territory in the civilized world suffers a crueller fiscal fate than Catalonia. Depending on the day and on the inclinations of the nationalist spokesman, the tirade may conclude with an invocation to a mythical Germany where we would be much better off than under Spanish exploitation, or with wishful references to some high-income US state also pictured as blissfully free of our heavy fiscal burdens. 4.1. Germany
The imaginary Germany pictured in the nationalist propaganda is a sort of confederal paradise for rich territories where the länder or federated states have completely independent fiscal systems and are protected against an excess of territorial redistribution by a limit of 4% of GDP on net fiscal balances set by the Constitutional Court and by a rigidly applied ordinality principle that prevents the regional financing system from altering the original ordering of the states in terms of per capita tax revenues. The real Germany is a rather more prosaic place where there are no such limits on redistribution and where the länder enjoy a degree of autonomy well below that of their Spanish counterparts –especially, but not only, in fiscal matters. The German system of regional financing, moreover, is very similar to our own, both in terms of the complexity of its structure and in the absence of a systematic relationship between the final financing of the different territories and their initial tax revenues or gross fiscal capacity.6
To appreciate the extent to which things are similar in the two countries, the reader should compare Figure 4 with Figure 2 and retain the following fact about the
6For additional details on the data and results summarized in this section, see de la Fuente (2012a).

Is Catalonia being fiscally mistreated?
three German länder most similar to Catalonia. In 2008 (last year for which I have found information in English), Bavaria (BY), Badenwith relative income per capita levels of 111, 112 and 122(vs. Catalonia’s 118 in 2011) had indices of relative financing of 96Catalonia’s 99.6, and lost 20.5, 21.0 and 25.8 points respectively when going from an index of fiscal capacity to another of final regional financing per capita (vs. 19.9 points in the case of Catalonia). It seems clear, then, that becoming German would not put an end to our fiscal miseries Bremen and Hamburg. This would entitle us to a 35% financing bonus, which is what explains the three peaks in the line that describes final financing in Figure 4.
Figure 4: Financ
- Key: NW = North Rhineland -Westfalia; = Hesse; RP = Rhineland-PalatinateSN = Sajonia; ST = Saxony-Anhalt; BE = Berlín. - Source: de la Fuente (2012) with data from the German Federal Ministry of Finance- Note: To allow homogeneous comparisoncapacity of the German lander, I have imputed VAT revenues in proportion to domestic regional consumption, as is done in Spain. In fact, however, the bulk of VAT revenue is distributeGerman länder in proportion to their population. The remainder is used to improve the financing of those länder with the lowest tax revenues.
In the case of Germany, there do not seem to exist reliable estimafiscal balances-- or at least I have not been able to find them in spite of having asked for the help of native experts on regional finances. In both countries, however, it is possible to approximate the component of such balances that is directly linked to the regional financing system, which should give us at least a feeling for the fiscal treatment of the richer regions. To construct such an estimate, we have to add each region’s net balance under the horizontal equalization schemes that exist in each country (the sharing of VAT revenue and the horizontal transfers across länder in Germany and the Guarantee Fund Spain) and the balance arising from
50
60
70
80
90
100
110
120
130
140
150
160
170
MV TH ST SN
Is Catalonia being fiscally mistreated?
63
most similar to Catalonia. In 2008 (last year for which I have found information in English), Bavaria (BY), Baden-Württemberg (BW) and Hesse (HE) with relative income per capita levels of 111, 112 and 122(vs. Catalonia’s 118 in 2011)
ve financing of 96.2, 96.2 and 98.1 respectively, always below and lost 20.5, 21.0 and 25.8 points respectively when going from an
index of fiscal capacity to another of final regional financing per capita (vs. 19.9 points Catalonia). It seems clear, then, that becoming German would not put an
end to our fiscal miseries – unless we were allowed to become a cityBremen and Hamburg. This would entitle us to a 35% financing bonus, which is what
ree peaks in the line that describes final financing in Figure 4.
4: Financing per capita vs. gross fiscal capacity
Germany 2008
Westfalia; BY = Bavaria; BW = Baden-Württemberg; NI = Lower SaxonyPalatinate; SH = Schleswig-Holstein; SL = Sarre; HH = Hamburg
Anhalt; TH = Turingy; BB = Brandeburg; MV = Mecklemburg
de la Fuente (2012) with data from the German Federal Ministry of Finance (FMF, 2010). homogeneous comparisons between the two countries, when calculating the gross fiscal
capacity of the German lander, I have imputed VAT revenues in proportion to domestic regional consumption, as is done in Spain. In fact, however, the bulk of VAT revenue is distribute
nder in proportion to their population. The remainder is used to improve the financing of those länder with the lowest tax revenues.
In the case of Germany, there do not seem to exist reliable estimaI have not been able to find them in spite of having asked for
the help of native experts on regional finances. In both countries, however, it is possible to approximate the component of such balances that is directly linked to the
m, which should give us at least a feeling for the fiscal regions. To construct such an estimate, we have to add each
region’s net balance under the horizontal equalization schemes that exist in each country (the sharing of VAT revenue and the horizontal transfers across länder in Germany and the Guarantee Fund net of the Central Government’s contribution in Spain) and the balance arising from the vertical transfers going from the Central
BB BE SL NI SH RP NW HB BY
capacidad fiscal bruta financiación final
most similar to Catalonia. In 2008 (last year for which I have Württemberg (BW) and Hesse (HE)
with relative income per capita levels of 111, 112 and 122(vs. Catalonia’s 118 in 2011) .2, 96.2 and 98.1 respectively, always below
and lost 20.5, 21.0 and 25.8 points respectively when going from an index of fiscal capacity to another of final regional financing per capita (vs. 19.9 points
Catalonia). It seems clear, then, that becoming German would not put an unless we were allowed to become a city-state, as Berlin,
Bremen and Hamburg. This would entitle us to a 35% financing bonus, which is what ree peaks in the line that describes final financing in Figure 4.
ing per capita vs. gross fiscal capacity
= Lower Saxony; HE
= Hamburg; HB = Bremen; = Mecklemburg-West Pomerania;
(FMF, 2010). between the two countries, when calculating the gross fiscal
capacity of the German lander, I have imputed VAT revenues in proportion to domestic regional consumption, as is done in Spain. In fact, however, the bulk of VAT revenue is distributed among the
nder in proportion to their population. The remainder is used to improve the financing of those
In the case of Germany, there do not seem to exist reliable estimates of regional I have not been able to find them in spite of having asked for
the help of native experts on regional finances. In both countries, however, it is possible to approximate the component of such balances that is directly linked to the
m, which should give us at least a feeling for the fiscal regions. To construct such an estimate, we have to add each
region’s net balance under the horizontal equalization schemes that exist in each country (the sharing of VAT revenue and the horizontal transfers across länder in
net of the Central Government’s contribution in the vertical transfers going from the Central
BW HE HH

The political economy of Catalan independence
64
Government to the regions, net of the contribution of their citizens to the federal revenues that finance such transfers. To approximate this last variable, I have used the shares of the different territories in aggregate regional tax revenues as an estimate of their shares in federal tax revenues (a piece of information I don’t have in the case of Germany). The margin of error arising from this approximation should be small since the tax baskets of the regional and central administrations are quite similar in both countries.
Once the necessary calculations have been completed, it is clear that Catalonia would not be better off under the German system. With 2008 data, Bavaria, Baden-Württemberg and Hesse had fiscal deficits arising from the regional financing system of 2.0%, 2.0% and 2.3% of GDP respectively, while Catalonia’s deficit amounted to 1.7%. To get the complete picture, we would need to know what happens with the rest of federal expenditure, but in principle there is no special compensation mechanism in Germany to return to richer regions part of what they pay in federal taxes. Hence, it seems unlikely that their fiscal deficits should be much smaller than ours. 4.2. United States
It is also doubtful that joining the US would greatly improve our fiscal fortunes, except possibly from the savings that would come from a significant slimming down of our welfare state. For the case of the USA, we have estimates of states’ net fiscal balances constructed by the Tax Foundation (see Dubay, 2006 and Tax Foundation, 2007). Using US Government reports on the distribution of federal expenditure and its own model of tax incidence, this organization published until a few years ago a breakdown of federal expenditures and tax revenues using a monetary flow criterion that is quite similar to the one used by the Catalan Regional Government to construct its preferred estimates of the region’s net fiscal balance (including a similar correction for the budget deficit of the Central Government).
For each year between 1981 and 2005, this source provides an estimate of the total amount of federal taxes (including Social Security contributions) borne by the residents of each state of the Union and of the volume of federal expenditure that “returns” to it using a monetary flow criterion. After adjusting tax revenues in order to neutralize the effects of federal budget imbalances, the Tax Foundation also computes the spending to
tax ratio for each state, defined as the amount of federal expenditure that comes back to it for each dollar of federal taxes collected. This ratio is a good indicator of the relative fiscal treatment of each territory. Unlike net fiscal balances measured as a percentage of GDP, spending to tax ratios are independent of the size of the public sector and therefore allow for valid comparisons between countries as different as the US and Spain.
Figure 5 shows that the spending to tax ratio decreases with relative income and tends to lie above unity in poor states and below it in rich ones. As the reader can appreciate, the red square representing Catalonia (in 2009) fits in perfectly with the pattern of the majority of the US states (in 2005). With an income per capita relative to the national average similar to that of New York (NY) or New Jersey (NJ), the Catalan spending to tax ratio (0,73) lies half way between those of these two states (0,64 and 0,81). Hence, if Spain robs us of 27 cents for each euro we pay in central government taxes, Uncle Sam easily beats it, reaching 36 cents per dollar in the case of New Jersey.

Is Catalonia being fiscally mistreated?
Figure 5: Spending to tax ratio adjusted for the federal deficit
It is true that the fiscal deficit of Catalonia(8.5% of GDP) is larger than that of all US states in the year of reference, but not by much: New Jersey’s deficit is only a point smallerdeficits of the richer US states are smaller than that ofrelative size of the public sectors of the two countries we are comparing, which in turn reflects the relative development of the welfare state in Spain and the US. An approximate correction for this effect can be achieved by balances under the assumptions that 1until the level observed in Spain, going from 17.9% to 30.6% of GDP, additional tax revenues needed to finance this expenditure are distway as current tax revenues and proportion to population. With these hypotheses, the size correction would bring New York’s deficit very close to Catalonia’s (rising from 3.5% to 6% oNew Jersey would be well above it (reaching 11.7% of GDP).
4.3. Italy
The information that is available for Italy also suggests that the Catalan net fbalance is much closer to the norm than to the outrageous exception that is often denounced by the local nationalists. 2008) construct estimates of the net fiscal balances of the Italian regions in the year 2005. These authors use a burdenimbalance of the Central Government, adjusting revenues in a way whose details are
7For additional details see de la Fuente (2012b).
0,0
0,5
1,0
1,5
2,0
2,5
60 70 80
spending to tax ratio
Is Catalonia being fiscally mistreated?
65
Spending to tax ratio adjusted for the federal deficit
vs. relative income per capita,
Catalonia and the states of the US
fiscal deficit of Catalonia under the monetary flow approach (8.5% of GDP) is larger than that of all US states in the year of reference, but not by
New Jersey’s deficit is only a point smaller. The main reason why the fiscal deficits of the richer US states are smaller than that of Catalonia has to do with the relative size of the public sectors of the two countries we are comparing, which in turn reflects the relative development of the welfare state in Spain and the US. An approximate correction for this effect can be achieved by recalculating net fiscal
ces under the assumptions that 1) the weight of federal expenditure increases until the level observed in Spain, going from 17.9% to 30.6% of GDP, additional tax revenues needed to finance this expenditure are distributed in the same way as current tax revenues and 3) that the additional expenditure is distributed in proportion to population. With these hypotheses, the size correction would bring New York’s deficit very close to Catalonia’s (rising from 3.5% to 6% of GDP) while that of New Jersey would be well above it (reaching 11.7% of GDP).7
The information that is available for Italy also suggests that the Catalan net fmuch closer to the norm than to the outrageous exception that is often
denounced by the local nationalists. Ambrosanio, Bordignon and Cernigliaconstruct estimates of the net fiscal balances of the Italian regions in the year
ors use a burden-benefit approach and neutralize the of the Central Government, adjusting revenues in a way whose details are
de la Fuente (2012b).
80 90 100 110 120
relative income per capita
Wyoming
CAT
NJ
NY
Spending to tax ratio adjusted for the federal deficit
the monetary flow approach (8.5% of GDP) is larger than that of all US states in the year of reference, but not by
. The main reason why the fiscal Catalonia has to do with the
relative size of the public sectors of the two countries we are comparing, which in turn reflects the relative development of the welfare state in Spain and the US. An
recalculating net fiscal ) the weight of federal expenditure increases
until the level observed in Spain, going from 17.9% to 30.6% of GDP, 2) that the ributed in the same
) that the additional expenditure is distributed in proportion to population. With these hypotheses, the size correction would bring New
f GDP) while that of
The information that is available for Italy also suggests that the Catalan net fiscal much closer to the norm than to the outrageous exception that is often
Cerniglia (AB&C, construct estimates of the net fiscal balances of the Italian regions in the year
benefit approach and neutralize the budget of the Central Government, adjusting revenues in a way whose details are
130 140
Alaska
Wyoming
CT
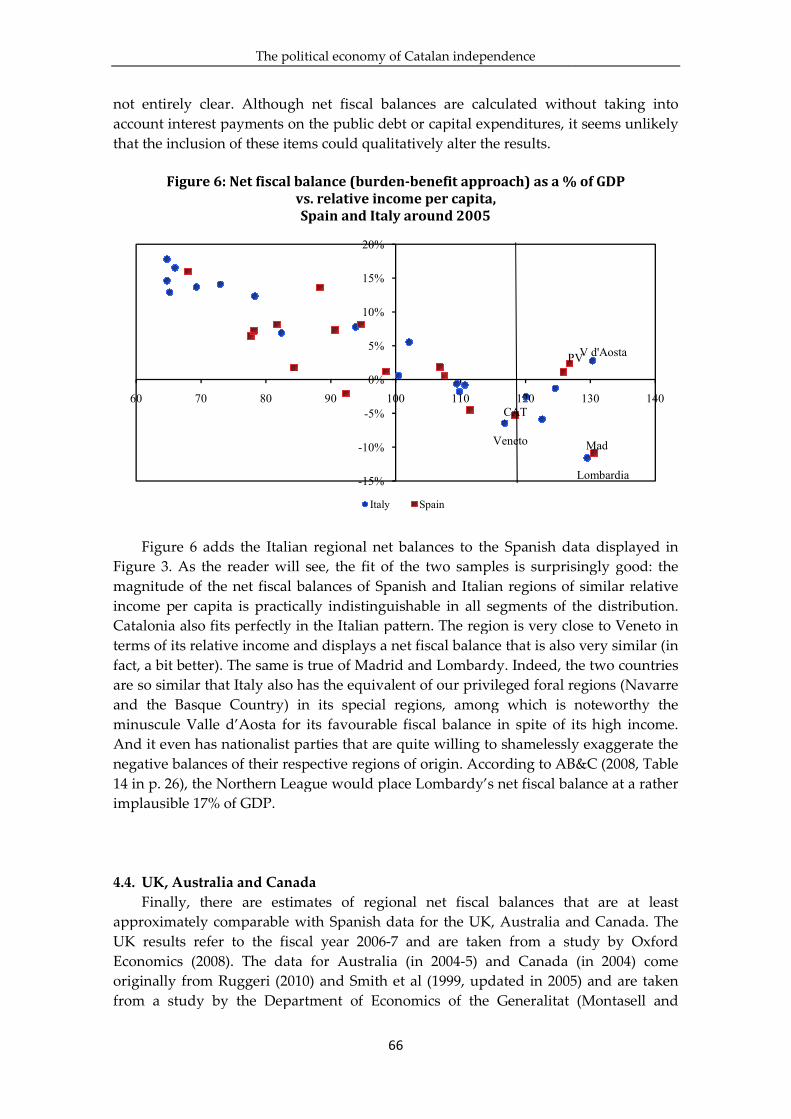
The p
not entirely clear. Although net fiscal balances are calculated without taking into account interest payments onthat the inclusion of these items could qualitatively alter the results.
Figure 6: Net fiscal balance (burden
Figure 6 adds the Italian
Figure 3. As the reader will see, the fit of the two samples is surprisingly good: the magnitude of the net fiscal balances of Spanish and Italian regions of similar relative income per capita is practically indistinguishaCatalonia also fits perfectly in the Italian pattern. The region is very close to Veneto in terms of its relative income and displays a net fiscal balance that is also very similar (in fact, a bit better). The sameare so similar that Italy also has the equivalent of our privileged foral regions (Navarre and the Basque Country) in its special regions, among which is noteworthy the minuscule Valle d’Aosta for iAnd it even has nationalist parties that are quite willing to shamelessly exaggerate the negative balances of their respective regions of origin. According to AB&C (2008, Table 14 in p. 26), the Northern League would place Lombardy’simplausible 17% of GDP.
4.4. UK, Australia and Canada
Finally, there are estimates of regional net fiscal balances that are at least approximately comparable with Spanish data for the UK, UK results refer to the fiscal year 2006Economics (2008). The data for Australia (in 2004originally from Ruggeri (2010) and Smith et al (1999, updated in 2005) from a study by the Department of Economics of the Generalitat (Montasell and
60 70 80
political economy of Catalan independence
66
not entirely clear. Although net fiscal balances are calculated without taking into interest payments on the public debt or capital expenditures, it seems unlikely
that the inclusion of these items could qualitatively alter the results.
Net fiscal balance (burden-benefit approach) as a % of GDP
vs. relative income per capita,
Spain and Italy around 2005
Figure 6 adds the Italian regional net balances to the Spanish data displayed in Figure 3. As the reader will see, the fit of the two samples is surprisingly good: the magnitude of the net fiscal balances of Spanish and Italian regions of similar relative income per capita is practically indistinguishable in all segments of the distribution. Catalonia also fits perfectly in the Italian pattern. The region is very close to Veneto in terms of its relative income and displays a net fiscal balance that is also very similar (in fact, a bit better). The same is true of Madrid and Lombardy. Indeed, the two countries are so similar that Italy also has the equivalent of our privileged foral regions (Navarre and the Basque Country) in its special regions, among which is noteworthy the minuscule Valle d’Aosta for its favourable fiscal balance in spite of its high income.
even has nationalist parties that are quite willing to shamelessly exaggerate the negative balances of their respective regions of origin. According to AB&C (2008, Table
thern League would place Lombardy’s net fiscal balance at a rather
UK, Australia and Canada
Finally, there are estimates of regional net fiscal balances that are at least approximately comparable with Spanish data for the UK, Australia and Canada. The UK results refer to the fiscal year 2006-7 and are taken from a study by Oxford Economics (2008). The data for Australia (in 2004-5) and Canada (in 2004) come originally from Ruggeri (2010) and Smith et al (1999, updated in 2005) from a study by the Department of Economics of the Generalitat (Montasell and
-15%
-10%
-5%
0%
5%
10%
15%
20%
90 100 110 120
Italy Spain
Veneto
CAT
PV
not entirely clear. Although net fiscal balances are calculated without taking into the public debt or capital expenditures, it seems unlikely
as a % of GDP
to the Spanish data displayed in Figure 3. As the reader will see, the fit of the two samples is surprisingly good: the magnitude of the net fiscal balances of Spanish and Italian regions of similar relative
ble in all segments of the distribution. Catalonia also fits perfectly in the Italian pattern. The region is very close to Veneto in terms of its relative income and displays a net fiscal balance that is also very similar (in
. Indeed, the two countries are so similar that Italy also has the equivalent of our privileged foral regions (Navarre and the Basque Country) in its special regions, among which is noteworthy the
nce in spite of its high income. even has nationalist parties that are quite willing to shamelessly exaggerate the
negative balances of their respective regions of origin. According to AB&C (2008, Table net fiscal balance at a rather
Finally, there are estimates of regional net fiscal balances that are at least Australia and Canada. The
from a study by Oxford 5) and Canada (in 2004) come
originally from Ruggeri (2010) and Smith et al (1999, updated in 2005) and are taken from a study by the Department of Economics of the Generalitat (Montasell and
130 140
Lombardia
V d'Aosta
Mad
PV

Is Catalonia being fiscally mistreated?
Sánchez, 2012) which reviews existing estimates of regional fiscal balances for other countries. Although the methodology used in these studies contains some peculithat may distort cross-country comparisonsseem to be more directly comparable with the burdenthe Spanish regions than with the balances constructed by the Catalan RegiGovernment using the monetary flow approach
With all the precaution requited by the heterogeneity of the data and its questionable quality in some cases, the experience of these three countries is not qualitatively different from the Spanish one andCatalonia is being fiscally mistreated once we take into account its level of income relative to the national average. As can be seen in Figure 7, when ththe three Anglosaxon countries areare very similar and Catalonia (CAT) fits rather well into any one of them.
Figure 7: Net fiscal balance as a % of GDP vs.
Spain, UK, Canada and
- Sources: Montasell and Sánchez (2012), UK are taken from Oxford Econto a specific region by the Treasury) is taken from Tablgeneral national interest) we use the allocation by population that is provided in Table 2. Tax revenues are allocated according to the region of residence as shown in Table 5. To obtain neutralized esrevenues are adjusted upward so that their national total is equal to total expenditure, respecting the weight of each region in total revenues. The neutralized net balance is divided by each region’s GVA
8In the British case, expenditure is allocated on the basis of official estimates that respond in principle to a benefit
criterion (PESA, 2013) and revenues are assigned according to a residence criterion. In Australia, defense
expenditure (except for the wages of military personnel), interest on the national debt, all federal expenditure
undertaken in the national capital and contributions to the pension system are allocated in proportion to the
population of the different states. If the same procedure had been applied in the case of Catalonia, its fiscal deficit
would have been considerably lower than under the Generalitat’s preferred monetary flow methodology. In the case
of Canada, a non-standard procedure has been used. Among ot
allocated in proportion to private sector output and interest payments on the public debt on the basis of the residence
of its recipients. These choices would also tend to lower Catalonia’s deficit below monetar
60 70 80 90
Is Catalonia being fiscally mistreated?
67
Sánchez, 2012) which reviews existing estimates of regional fiscal balances for other countries. Although the methodology used in these studies contains some peculi
country comparisons to some extent, in all three cases the results seem to be more directly comparable with the burden-benefit estimates available for the Spanish regions than with the balances constructed by the Catalan RegiGovernment using the monetary flow approach.8
With all the precaution requited by the heterogeneity of the data and its questionable quality in some cases, the experience of these three countries is not qualitatively different from the Spanish one and does not in any way suggest that Catalonia is being fiscally mistreated once we take into account its level of income relative to the national average. As can be seen in Figure 7, when the observations from the three Anglosaxon countries are plotted together with the Spanish data, the patterns are very similar and Catalonia (CAT) fits rather well into any one of them.
Net fiscal balance as a % of GDP vs. relative income per capita
Spain, UK, Canada and Australia around 2005
Sánchez (2012), Tables 1 and 3 for Australia and Canada, respectively. Data for the Oxford Economics (2008) proceeding as follows. “Identifiable” expenditure (assigned
to a specific region by the Treasury) is taken from Table 1. In the case of “non-identifiable” expenditure (of general national interest) we use the allocation by population that is provided in Table 2. Tax revenues are allocated according to the region of residence as shown in Table 5. To obtain neutralized esrevenues are adjusted upward so that their national total is equal to total expenditure, respecting the weight of each region in total revenues. The neutralized net balance is divided by each region’s GVA
expenditure is allocated on the basis of official estimates that respond in principle to a benefit
criterion (PESA, 2013) and revenues are assigned according to a residence criterion. In Australia, defense
enditure (except for the wages of military personnel), interest on the national debt, all federal expenditure
undertaken in the national capital and contributions to the pension system are allocated in proportion to the
If the same procedure had been applied in the case of Catalonia, its fiscal deficit
would have been considerably lower than under the Generalitat’s preferred monetary flow methodology. In the case
standard procedure has been used. Among other things, Central Government purchases are
allocated in proportion to private sector output and interest payments on the public debt on the basis of the residence
of its recipients. These choices would also tend to lower Catalonia’s deficit below monetary flow estimates
-15%
-10%
-5%
0%
5%
10%
15%
20%
25%
90 100 110 120 130 140
Spain CAT Australia Canada UK
CAT
AlbertaW Aust.
Ont
SE Ing Madrid
Sánchez, 2012) which reviews existing estimates of regional fiscal balances for other countries. Although the methodology used in these studies contains some peculiarities
, in all three cases the results benefit estimates available for
the Spanish regions than with the balances constructed by the Catalan Regional
With all the precaution requited by the heterogeneity of the data and its questionable quality in some cases, the experience of these three countries is not
does not in any way suggest that Catalonia is being fiscally mistreated once we take into account its level of income
e observations from her with the Spanish data, the patterns
are very similar and Catalonia (CAT) fits rather well into any one of them.
per capita
, respectively. Data for the
omics (2008) proceeding as follows. “Identifiable” expenditure (assigned identifiable” expenditure (of
general national interest) we use the allocation by population that is provided in Table 2. Tax revenues are allocated according to the region of residence as shown in Table 5. To obtain neutralized estimates, tax revenues are adjusted upward so that their national total is equal to total expenditure, respecting the weight of each region in total revenues. The neutralized net balance is divided by each region’s GVA
expenditure is allocated on the basis of official estimates that respond in principle to a benefit
criterion (PESA, 2013) and revenues are assigned according to a residence criterion. In Australia, defense
enditure (except for the wages of military personnel), interest on the national debt, all federal expenditure
undertaken in the national capital and contributions to the pension system are allocated in proportion to the
If the same procedure had been applied in the case of Catalonia, its fiscal deficit
would have been considerably lower than under the Generalitat’s preferred monetary flow methodology. In the case
her things, Central Government purchases are
allocated in proportion to private sector output and interest payments on the public debt on the basis of the residence
y flow estimates.
150 160
Alberta
London

The political economy of Catalan independence
68
calculated using a residence criterion (that is, wages are imputed to the region where workers live, rather than to the region where they work).
It is true that Catalonia’s fiscal deficit is larger than that of any of the Australian
states, but it must also be said that the relative income of the richest state (Western Australia, with a per capita income index of 107.7 and a fiscal deficit of 3.93% of GDP) is well below that of Catalonia (with a relative income of 118.4 and a deficit of 5.24%). The same is true when we compare Catalonia with Ontario (Ont), which has a deficit of 2.33% of GDP with an income per capita index of 103.1. In the case of the UK, Southeast England has a deficit about twice as large as Catalonia’s (11.4%) with a lower level of relative income (114.7). Although some of these results do not seem entirely plausible, if we compare them in terms of the aggregate marginal tax rates defined above, with a rate of 28.5%, Catalonia would be in a much better situation than Western Australia (51.2%), Ontario (75.2%) or Southeast England (78.0%).
On the other hand, Figure 7 reveals two examples of rich regions that, deviating from the usual pattern, do seem to receive a rather more favourable treatment than Catalonia. One is Alberta, with a relative income index of 145 and a deficit of only 3.23% of GDP, and the second is London, with an income of 153 and a fiscal deficit of 7.5% of GDP. Both territories, however, have some peculiarities that explain, and may partially justify, what at first sight does indeed look like a privileged fiscal treatment. In the case of London, it could be argued that the real income differential with the rest of the UK is probably much smaller than it would appear from the data we are using due to the high level of prices in the city. And given the scarcity of methodological detail supplied in the study, we cannot rule out the possibility that a disproportionate part of the costs of the central UK administration may have been assigned to London. As for Alberta, it must be kept in mind that oil production has an important weight on its GDP which may translate only partially into residents’ personal income and hence into federal taxes (which do not include royalties on the exploitation of natural resources).9 5. Conclusion: much ado about nothing
The quick review we have undertaken in this note of some aspects of public finances in Spain does not reveal a satisfactory situation. The net fiscal balances of some Spanish territories are as problematic as the levels of financing of their regional administrations. But the one problem there are no signs of in the data is the existence of an anti-Catalan bias in our fiscal system. Both in terms of regional financing and of its net fiscal balance, Catalonia is basically where it should be when we compare it with other Spanish and foreign regions with similar levels of income relative to the national average.
9On the other hand, the Government of Alberta (2012) estimates a fiscal deficit for the province of 16 billion
Canadian dollars, or 6.64% of GDP with data from Statistics Canada (2013). A tentative adjustment for the federal
budget deficit that is implicit in the data reported in the document would raise this figure to 8.2% of provincial GDP.
However, since this source provides almost no methodological information, it is impossible to know to what extent
its results are comparable with those available for Catalonia. (I am grateful to Gerardo González for this reference).

Is Catalonia being fiscally mistreated?
69
This is not true, however, of other territories. Some Spanish regions show large deviations in both directions from what would be reasonable in terms of both financing and fiscal balances. These deviations alert us of the possible existence of situations of unfairness or privilege that should be investigated with care and, if necessary, corrected.
The political economy of Catalan independence
70
References:
Ambrosanio, M. F., M. Bordignon and F. Cerniglia (2008). "Constitutional
reforms, fiscal decentralization and regional fiscal flows in Italy." Quaderni dell'Istituo di Economia e Finanza no. 84. Universita' Cattolica del Sacro Cuore, Milano.
de la Fuente, A. (2011). "¿Está bien calculado el cupo?" Moneda y Crédito231, pp. 93-150. http://ideas.repec.org/p/aub/autbar/803.10.html
de la Fuente, A. (2012a). "El mito alemán: anexo de datos y cálculos." Mimeo, Instituto de Análisis Económico, CSIC. http://ideas.repec.org/p/aub/autbar/920.12.html
de la Fuente, A. (2012b).,"¿Cisne negro o pollo del montón? El déficit fiscal catalán en perspectiva." Mimeo, Instituto de Análisis Económico, CSIC.http://ideas.repec.org/p/aub/autbar/914.12.html
de la Fuente, A. (2013). “La evolución de la financiación de las comunidades autónomas de regimen común, 2002-2011.” Mimeo, Instituto de Análisis Económico, CSIC. http://ideas.repec.org/p/aub/autbar/937.13.html
Dubay, C. (2006). "Federal tax burdens and expenditures by state." Tax Foundation, Special Report no. 139, March. http://taxfoundation.org/article/federal-tax-burdens-and-expenditures-state
Federal Ministry of Finance (FMF, 2010). Federation/Länder financial relations on
the basis of constitutional financial provisions. Update 2009. Berlin http://www.bundesfinanzministerium.de/Content/DE/Downloads/Broschueren_Bestellservice/Bund-laender-finanzbez-2010-en.html
Generalitat de Catalunya (2012). Resultats de la balança fiscal de Catalunya amb el sector públic central, 2006-2009. Departamentd’Economia i Conoixement. Col.leccióMonografies no. 14, Barcelona. http://www20.gencat.cat/portal/site/economia/menuitem.6135b456613b7f9af813ae92b0c0e1a0/?vgnextchannel=71876e6b77649210VgnVCM1000008d0c1e0aRCRD&vgnextfmt=default&vgnextoid=71876e6b77649210VgnVCM1000008d0c1e0aRCRD Generalitat de Catalunya (2009), “Metodologia y càlcul de la balança fiscal de Catalunya ambl’Administració central 2002-05,” Departamentd’Economía y Finances, Barcelona. http://www20.gencat.cat/docs/economia/financament/arxius/financament/bibliografia/Metodologia-balanca-fiscal-Catalunya-Aministracio-central-2002-2005.pdf Government of Alberta (2012). Fiscal Spotlight. Albertans’ net contribution to confederation. http://www.finance.alberta.ca/publications/fiscal/spotlights/2012-0223-alberta-net-contribution-to-confederation.pdf HMT Public Expenditure Statistical Analyses (PESA, 2013). https://www.gov.uk/government/collections/public-expenditure-statistical-analyses-pesa

Is Catalonia being fiscally mistreated?
71
Instituto de Estudios Fiscales (2008), “Las balanzas fiscales de las CC.AA. españolas con las AA. Públicas Centrales, 2005,” Ministerio de Economía y Hacienda, Madrid. http://www.meh.es/Documentacion/Publico/GabineteMinistro/Varios/BalanzasFiscalesCCAA.pdf Montasell, G. and E. Sánchez (2012). "Comparació internacional de les balances fiscals de les regions amb el sector públic central: una análisi de l'efecte redistributiu." Papers de Treball, sèrie sector public, no. 1/2012, juliol. Generalitat de Catalunya, Departamentd'Economia i Coneixement, Barcelona. http://www20.gencat.cat/portal/site/economia/menuitem.9924bb17bdcd2bdaf813ae92b0c0e1a0/?vgnextoid=50ccb82198649210VgnVCM1000008d0c1e0aRCRD&vgnextchannel=50ccb82198649210VgnVCM1000008d0c1e0aRCRD#Bloc2a7f2fa81b4f9210VgnVCM2000009b0c1e0a____ Office for National Statistics (ONS, 2013). Workplace and residence estimates of regional GVA http://www.ons.gov.uk/ons/publications/re-reference-tables.html?edition=tcm%3A77-317145 Oxford Economics (2008). “Regional winners and losers in UK public finances.” Economic Outlook 32(3), pp. 5-15. http://www.isitfair.co.uk/Reports/Public/OE%20UKPublicFinance.pdf Uriel, E. and R. Barberán (2007), Las balanzas fiscales de las comunidades autónomas
con la Administración Pública Central (1991-2005), Fundación BBVA, Bilbao. http://www.uv.es/uriel/publicaciones/NBF2007.pdf Statistics Canada (2013). Provincial and territorial economic accounts. Data tables. http://www.statcan.gc.ca/pub/13-018-x/2011001/tab-eng.htm#al Tax Foundation (2007). Federal taxes paid vs. federal spending received by state, 1981-2005. http://taxfoundation.org/article/federal-taxes-paid-vs-federal-spending-received-state-1981-2005 Ruggeri, G. C. and W. Yu (2000). "Federal fiscal balances and redistribution in Canada, 1992-97." Canadian Tax Journal 48(3), pp. 626-55. Ruggeri, G. C. (2010).“Interregional fiscal flows: Canada” in N. Bosch, M. Espasa and A. Solé Óllé, editors, The Political Economy of Inter-Regional Fiscals Flows: Measurement, Determinants and Effects on Country Stability. Barcelona: Edward Elgar, pp. 125-145. Smith, D. et al. (1999, actualizado en 2005). “Fiscal subsidies with in the Australian federation: Western Australia’s net subsidy to other states”: Western Australia Treasury, Intergovernmental Relations Division, discussion paper. Perth.


73
THE DEBATE OF FISCAL BALANCES:
TWO DIFFERENT QUESTIONS, TWO DIFFERENT METHODS,
TWO DIFFERENT RESULTS
Guillem López-Casasnovas1
Catedrático de Economía Pública of the Universitat Pompeu Fabra
Joan Rosselló Villalonga
Profesor Titular de Economía aplicada of the Universitat de les Illes Balears
1. Introduction: The current state of affairs of the debate in Spain
Whether there is a best method for calculating the fiscal balance is not a technical
debate. Quite simply there is no straight answer as to what best in this context might
mean. Different methods seek to satisfy different goals and these goals typically reflect
different motives. On the one hand, from an individual point of view, the average
taxpayer can feel hard done by at what he sees as an excessive fiscal residue resulting
from the taxes he has to pay and the benefits he believes he receives in return. Here, an
analysis of this fiscal residue can help clarify just who the tax burden falls on (not
always the party that pays the tax, as the tax burden can be transferred to another
economic agent) and just what the public service benefits are (often the taxpayer fails
to appreciate the benefits he derives from externalities and other centralised services).
Such an analysis is anything but a pedagogical exercise since it serves to dispel any
fiscal delusions and makes clear the degree of redistribution implicit in the tax system.
However, on the other hand, it is not only the taxpayer but also the territorial
authorities that may question the legitimacy of fiscal imbalances. Here the question is
what the spending capacity of the territory would be if instead of being financed
through centralised tax transfers, it was to finance itself from its own resources. Note
that in the first case – henceforth the ‘tax-benefit incidence’ approach – the territories
and the authorities do not enter into the equation: who does the spending is of no
consequence and where the money is spent is similarly of little importance. Here the
study centres on who the money is spent on and who ultimately benefits and who
bears the costs of funding (the inevitable loss of private resources due to taxation and
the deadweight loss of the tax system affecting the economy). To this extent, such an
exercise can be undertaken ignoring Part VIII of the Spanish Constitution – the
1An earlier summarised version of this paper was published in Institut d'Economia de Barcelona, July
2014, by Guillem López-Casasnovas, entitled Debating the fiscal balance or talking at cross-purposes. Additional references are G. López-Casasnovas “Equity and efficiency aspects of the regional redistribution policies
in Spain” (1995) published in Economic Union and Federal Systems (Eds. Mullins & Saunders, Federation Press,
Melbourne, Australia), The political economy of inter-regional fiscal flows (Eds. Bosch, Espasa & Solé-Ollé, 2010,
Edward Elgar Publishing Ltd, Cheltenham) and, more recently, with J. Rosselló: Fiscal Imbalances in Asymmetric
Federal Regimes. The Case of Spain (forthcoming, Hacienda Pública Española, IEF, 2014).

The political economy of Catalan independence
74
Territorial Organisation of the State. If anything the analysis is more coherent (and, in
fact, less complex) in a unitary State where distribution policies are not shared among
jurisdictions, and it could be completed along individual income or functional lines, or
even simply by age, sex or even surname!!
The second question to be raised is far more political in nature: it has to do with
the claim that the taxes/benefits paid/received by the citizens of a territory can be
allocated to the institutions that represent those taxpayers and the authorities that
defend that territorial sovereignty. The exercise is, as such, not neutral with respect to
the legitimacy of the question: it is in the parliamentary seat that the representatives of
the territory should assess the validity of the claim, which implicitly accepts that the
internal redistribution is a matter for that parliament to decide, while the external or
inter-jurisdictional redistribution is what is called into question. Territories that
consider themselves to be unfairly treated by centralised tax/benefit transfers seek to
restore the fiscal balance by having a greater say in these monetary flows. And it is
precisely this greater say in the spending in a territory of all (or most of) the revenue
generated within that territory that is appraised in the ‘monetary flow’ approach,
concerned as it is with the impact of the budget on the territory, direct and additional
economic side-effects for the creation of income and wealth.
2. Two methods
So, the ‘tax-benefit incidence’ and the ‘monetary flow’ approaches differ basically
in the importance they attach to the territorial jurisdiction: in the case of the former, it
is nothing more than a cloak behind which individual fiscal residues are summed,
while in that of the latter, it is the basis for fiscal sovereignty. From the perspective of
the first approach, the variance matters since tax progressivity shifts the total residue
through the aggregation of individual residues; whereas from the perspective of the
second, they are only means (with inequality being an internal affair). The tax-benefit
incidence approach requires that many complicated hypotheses be formulated: thus,
since the sixties it has been well known among tax scholars that incidence requires
general equilibrium models (à la Harberger, at the very least), and so much the better if
combined with the differential framework (where one tax or one expense substitutes
another) and with that of the balanced budget (with its assumptions about the origins
and applications of resources); applied then in autarkies or open economies, with
either free or restricted movements of capital and labour (migration); in competitive,
monopolistic or oligopolistic markets, be it from the supply side or the demand side of
labour as well as capital. And all these hypotheses are formulated for a specific country
at a given moment in time, with no universal validity, just an empirical validity
depending on the respective elasticity of supply, demand, price, income and factor
substitution effects for each specific set of circumstances. Yet most of these hypotheses
are untested in the Spanish economy and so they are typically improvised in the
studies undertaken. Thus, when De la Fuente (2014, Manual sobre Cuentas Regionales
Territorializadas) admits that he allocates values in a rough and ready fashion in his
computations for territorialized regional accounts or, when to avoid calculating the
impact of corporate tax on the related business figures (as the monetary flow approach
assumes and as occurs in the Basque Country under its economic agreement with the

The debate of fiscal balances: two different questions,
two different methods, two different results.
75
Spanish State), he improvises such surprising coefficients as the (arithmetic) mean (?)
to be allocated either: (1) according to the gross operating surplus (GOS) at 100%, or (2)
30% (?) according to the (general) relative participation (considering all goods) of
consumption (despite the informal economy, with no fiscal implications whatsoever)
and 70% (?) according to the regional GOS (by summing the provincial figures); or
even most surprisingly, (3) by third parts (?) of the GOS, household consumption and
the relative wages in all sectors! Equally, assumptions regarding forward or backward
transfers of social security contributions are more than questionable, as are the
assumptions of VAT being shifted forward to prices or backward to profits, in both
instances without specifying the sector, the degree of exposure to competition or the
price elasticity of demand. This contrasts with the allocation of VAT within monetary
flow analyses, where it is treated proportionally to internal consumption, just as the
Spanish National Institute of Statistics allocates it when dividing VAT among the
territories in the financing of Spain’s regions or its Comunidades Autónomas (henceforth,
ACs).
In short, the tax-benefit incidence approach is extremely ambitious, supposedly
more scholarly, but quite overblown given the little we know of its actual impact when
applied to the Spanish economy (indeed, one of the few published studies, focusing on
just one tax –social security contributions– is the work of Melguizo and González
Páramo, published in 2013 in the open-access journal SERIEs and in 2014 in VoxEU,
which demonstrates the uncertainties and ambiguities by postulating a 50:50 division
of the burden of social contributions between workers and employees). All in all, given
its dependence on highly subjective suppositions, the approach may lack academic
rigour.
In contrast, the monetary flow approach is more limited (as are its conclusions),
but it remains closer to reality: expenditure is “territorialized”, i.e., in the territories in
which it has been allocated in the budget and where in accounting terms the
expenditure occurs, in line with the capacity to decide where the services are to be
delivered. Meanwhile, spending that is not allocated to the territories (above all the
financing of the highly centralised services of defence, overseas services, prisons, work
creation programmes and civil defence) is assigned according to the ratio between
territorialized spending and total spending in each case (in keeping with the idea that
centralised services support the decentralised services). In contrast, the tax-benefit
incidence approach would assign expenditure according to population, deeming
irrelevant the effects of whether money is spent in one place or another under the
assumption that these are ‘public goods’ that benefit everyone equally. Note the
contradiction inherent in this last claim for those who argue against decentralising
central state institutions for the provision of services, because to be coherent with those
that accept the so-called territorialized regional accounts, who does the spending and
where the money is spent should make no difference! Otherwise, the monetary flow
approach would deal with R&D spending in a similar fashion, while the tax-benefit
incidence approach would improvise a 75% (?) share according to population and 25%
(?) according to gross value added.

The political economy of Catalan independence
76
3. Questions and results
Against this backdrop, what question are we seeking to answer when we calculate
the fiscal balance? In Catalonia, like it or not, since the Second Republic of the 1930s,
the question prone to be answered by the monetary flow approach has been: What
proportion of the tax resources raised within the territory is in fact returned to it? In
other words, the approach compares what the State spends in the AC in providing its
services plus what the State transfers to that AC to pay for decentralised services with
what the AC’s spending capacity would be if it were able to collect these resources
itself. Those that deny the very validity of the question base their claims (i) on a
Constitution that provides for an indivisible and exclusive fiscal sovereignty in the
hands of central tax authorities, (ii) on the sociological argument that in fiscal terms
“there are no Catalans, only Spaniards living in Catalonia”, and (iii) on the notion that
the ACs have no redistributive powers other than those which the State determines.
However, in opposition to such arguments, stands the political reality of the claims of
the Catalan Parliament and the fact that, even recognising that deficits are the result of
personal redistributive fiscal flows, Spanish data show that this is simply not the case
in Spain.
Cross-section data on fiscal balances corresponding to fiscal year 2005 (the only
one available) suggest that there is a negative correlation between fiscal balances and
per capita GDP, regardless of the methodology (see graphs 1 and 2).
Nevertheless, this result deserves a deeper analysis because data indicates also
that while some rich regions present negative fiscal imbalances, others record positive
ones. This suggests that fiscal balances do not depend exclusively on the level of
regional wealth.
Lopez Casasnovas and Rosselló in a recent paper in Hacienda Pública Española
(2014) analyze the components of fiscal imbalances and their relationship with regional
wealth. They find that fiscal revenues of ACs (regardless of the methodology) are
correlated with GDPpc (see graphs 3 and 4, in which the data correspond to
logarithms).
Graph 1. FiscalBalance (TBI) pc vs GDPpc
2005 y = -0.2432x + 5055.4
R2 = 0.5686
-3 000
-2 500
-2 000
-1 500
-1 000
-500
-
500
1 000
1 500
2 000
2 500
- 5 000 10
000
15
000
20
000
25
000
30
000
GDPpc 2005
Fis
cal
Ba
lan
cep
c 2
00
5
FiscalBalance pc
Lineal (FiscalBalance pc)
Graph 2. Fiscal Balance (MFI pc vs GDP pc
2005
y = -0.2611x + 5407.1
R2 = 0.4287
-4 000
-3 000
-2 000
-1 000
-
1 000
2 000
3 000
- 5 000 10
000
15
000
20
000
25
000
30
000
GDPpc2005
Fis
cal
Ba
lan
cep
c 2
00
5
Fiscal Balance pc
Lineal (Fiscal Balance
pc)

The debate of fiscal balances: two different questions,
two different methods, two different results.
77
However, in terms of expenditure, (see graphs 5 and 6) they do not observe a
systematic pattern of regional flows that matches personal differences in income. ACs
with similar income levels clearly receive discretionary levels of resources from the
central government, contrary to what the supporters of the tax-benefit incidence
approach claim. When López-Casasnovas and Rosselló (op. cit.) test this hypothesis to
determine whether it has a purely random political bias or whether it derives from
compensation for supply costs (that take into account the existence of scale economies,
the additional costs associated with being an island, population density, etc.), their
analysis does not allow any definite conclusions to be drawn either.
In addition to these results, data available for 2005 indicates that the implemented
methodology has an impact on the position of a region in the ranking of the group of
regions with positive or negative fiscal balances, but it would not mean (with some
exceptions) that one region would shift from one group to the other. Data in table 1
show that although both estimation procedures do indeed have a different impact on
the size of fiscal flows and that the tax-benefit analysis significantly reduces the size of
fiscal balances (imbalances), the group of regions of Madrid, Catalonia, Balearic Islands
and Valencia present unbalanced fiscal flows regardless of the methodology while the
group of Extremadura, Asturias, Canary Islands, Castilla-León, Castilla-la-Mancha,
Cantabria, Andalusia and Galicia, always present positive fiscal balances.
Graph 4. Resources pc (MFI) vs GDPpc, 2005
y = 0.6632x + 1.9886
R2 = 0.4399
8.1
8.2
8.3
8.4
8.5
8.6
8.7
8.8
8.9
9
9.1
9.4 9.6 9.8 10 10.2 10.4
GDPpc
Re
sou
rce
s p
c
Resourcespc
Lineal (Resourcespc)
Graph 3. Fiscal Burden pc (TBI) vs GDPpc,
2005
y = 0.5637x + 2.9208
R2 = 0.4021
8.2
8.3
8.4
8.5
8.6
8.7
8.8
8.9
9.4 9.6 9.8 10 10.2 10.4
GDPpc
Bu
rde
n p
c
Fiscal Burdenpc
Lineal (Fiscal Burdenpc)
Graph 5. Fiscal Benefit (TBI) pc vs GDPpc,
2005
y = -0.4129x + 12.614
R2 = 0.21
8.1
8.2
8.3
8.4
8.5
8.6
8.7
8.8
8.9
9
9.4 9.6 9.8 10 10.2 10.4
GDPpc
Fis
cal
Be
ne
fic
pc
Fiscal Benefit pc
Lineal (Fiscal Benefit pc)
Graph 6. Expenditure pc (MFI) vs GDPpc,
2005
y = -0.3683x + 12.217
R2 = 0.0938
8.1
8.2
8.3
8.4
8.5
8.6
8.7
8.8
8.9
9
9.1
9.4 9.6 9.8 10 10.2 10.4
GDPpc
Ex
pn
ed
itu
re p
c
Expenditure pc
Lineal (Expenditure
pc)

The political economy of Catalan independence
78
Therefore the debate on methodologies to calculate fiscal unbalances may be
relevant on academic grounds, but differences arise on the intensity of the deficits, not
on their signs. At the end of the day this is the debate in the political arena: whether
this is actually compatible with the exercise of self-governance.
4. Concluding remarks
In summary, the question ends being a talking at cross-purposes. The 'best'
methodological approximation for calculating fiscal balances is a fallacy, since what
those who would deny the validity of the monetary flow method are in fact denying –
with their supposedly scholarly arguments – is the very question that this
methodology seeks to answer when it calculates the fiscal balance, at least in our
country. The subject has become tiresome, as the two sides do little more than talk at
cross purposes. In this ongoing debate one of the parties does not want to hear what a
fairly substantial sector in the Catalan parliamentary assembly (almost 80% of the MPs)
is arguing for. The opposition, drawing on their supposedly scholarly arguments,
initially concluded that it was impossible even to perform the calculation of these fiscal
imbalances; later, they claimed that there were a surprising number of possible
methods and forwarded a multiplicity of hypotheses, including that of the ‘non-
neutralization’ of public deficits, all aimed at invalidating the calculations. Despite this,
two methods were subsequently validated, with the full endorsement of a broad-based
commission of experts from the Spanish Institute of Fiscal Studies. This brings us to the
situation today, in which the validity of the very question is again denied, now without
2005 Rank 2005 Rank
BALEARIC ISLANDS 3 246 - 1 MADRID 2 381 - 1
CATALONIA 2 117 - 2 BALEARIC ISLANDS 1 955 - 2
MADRID 1 494 - 3 CATALONIA 1 587 - 3
VALENCIA 1 188 - 4 VALENCIA 680 - 4
NAVARRE 823 - 5 NAVARRA 392 - 5
BASQUE COUNTRY 357 - 7 LA RIOJA 330 - 6
MURCIA 374 - 6 ARAGON 209 - 7
LA RIOJA 145 10 MURCIA 27 10
CANARY ISLANDS 300 9 BASQUE COUNTRY 53 9
ARAGON 402 8 CANTABRIA 548 7
CASTILLA-LA MANCHA 582 7 ANDALUSIA 491 8
ANDALUSIA 730 6 CASTILLA-LEON 862 6
CANTABRIA 1 015 5 GALICIA 1 081 4
GALICIA 1 378 4 CASTILLA-LA MANCHA 981 5
CASTILLA-LEON 1 470 3 CANARY ISLANDS 1 118 3
ASTURIAS 2 582 1 ASTURIAS 1 839 2
EXTREMADURA 2 486 2 EXTREMADURA 2 098 1
Source: IEF (2008)
Table 1 . Fiscal Balances, alternative methodologies. 2005
Monetary Flow analysis Cost-Benefi analysis
Fiscal Balance pc (euros) Fiscal Balance pc (euros)

The debate of fiscal balances: two different questions,
two different methods, two different results.
79
recourse to euphemism, but by replacing the question with the presentation of newly
drawn up territorialised regional accounts that are bound to create even more confusion.


81
CATALONIA: THE SECESSIONIST CHALLENGE
AND THE ECONOMIC CONSEQUENCES OF INDEPENDENCE
Clemente Polo
Professor of Economic Analysis in the Universidad Autónoma de Barcelona
September 2014
Abstract
The article examines the consequences of independence on the Catalan economy. After presenting the case for independence in Section 2, Section 3 sums up the role of the national market in the economic development of Catalonia, or the story of how Catalonia became “the workshop of Spain”. Section 4 presents quantitative estimates of the weight of the Spanish market in the Catalan economy at the start of the XXI century and the likely consequences of secession on production, employment and value added. The consequences of the exit of Catalonia from the Euro zone on Catalonia’s financial system, interest rates, asset holdings and capital flows and foreign investment are analyzed in Section 5. Lastly, the methodology and results of the fiscal balance of Catalonia are carefully examined and the validity of both the fiscal deficit figures published by the Catalan government and its mechanical identification with the fiscal dividend of independence are questioned. The article ends establishing the general conclusions.
Key words: national market, the weight of exports to the rest of Spain, ‘eurization’ of the Catalan economy, fiscal balance and fiscal deficit of Catalonia, fiscal dividend of independence.
Biographical note
Clemente Polo is professor of Economic Analysis in the Universidad Autónoma de Barcelona (1984-2014). He was Adviser to the President of the Spanish Government (1990-1993), member of the Research Activity National Evaluation Commission (CNEAI, 2003-2005). He also founded and directed the Master in Applied Economic Analysis (MAE, 1996-2007) at the Permanent Education Institute (IDEC) in the Pompeu Fabra University.
This article is a summary of the article published by the IEE in Cuestión Catalana II. June 2014

The political economy of Catalan independence
82
1. Introduction The main purpose of this paper is to examine the economic consequences of the hypothetical
independence of Catalonia, one of the 17 Autonomous Communities of Spain. As it is well known, the Kingdom of Spain is a parliamentary democracy since 1978 that joined the European Economic Community in 1986 and the European and Monetary Union (Euro zone) in 1999. The 1978 Constitution, approved by 87.9 percent of Spaniards and 90.5 percent of Catalans in 1978,1 categorically asserts “the indivisible unity of the Spanish Nation, the common and indivisible land of Spaniards”, although it also “recognizes and guarantees the right to self-government of nationalities and regions”. In line with the Constitution mandate, Spain has become one of the most decentralized states of the EU since 1878, but as most written constitutions the Magna Charta rules out independence.
The subject has received considerable attention in the recent past, especially since Catalonia’s government announced, with the support of 65 percent of the members of the Parliament of Catalonia, its intention to hold an illegal self-determination referendum on November 9, 2014, as the first step towards independence. The constitution of Catalonia as an independent state in 2015 would put an abrupt end to (at least) 300 years of political, fiscal and economic union that might have very serious consequences for the Catalan economy. To begin with, all international treaties signed by the Kingdom of Spain, including all the EU Treaties signed since 1986, would not apply to Catalonia. Thus, the first task of the new Catalan state would be to apply for admission to all international organisms, including the EU and the Euro zone, a process that being optimistic may take several years.
Moreover, Spain has functioned as a single market during the last three centuries, i.e., a territory where goods, services and people have moved freely within its well defined territorial boundaries and where all economic agents, public and private as well as domestic and foreign, have decided where to live, work or invest under the assumption that it would remain united. Of course, all that would change were Catalonia become an independent state. Even leaving aside the political, social and economic tensions that might arise among Catalonia and Spain after independence, there is no reason to expect that exports of Catalonia to Spain will still be six times larger than exports to France and ten times larger than exports to Germany, as it is the case now. Neither can one take for granted that multinational firms and financial institutions that produce for the national market but whose headquarters and plants are located in Catalonia will not move them to Spain if Catalonia becomes an independent state.
Economists in favour of independence claim that ‘Spain is a bad business for Catalans’ because the expected benefits of independence exceed the expected costs. Among the first, they mention some as diffuse as the opportunity it offers to improve the efficiency of the Catalan public administrations, and others rather specific like the so called ‘fiscal dividend of independence”, i.e., the additional revenues the Catalan government would collect if Catalonia were independent. Among the expected costs, they recognize the possibility of facing a ‘transitory boycott’ of the goods and services produced in Catalonia, whose impact, according to their estimates, would be far less than the expected benefits. This is the position expressed in the “Manifest of Catalonia’s career economists” presented in the Barcelona Stock Exchange on March, 3, 2014. The signatories claim
1 67.91 percent of Catalans voted the Constitution in 1978 and 90.46 percent approved it.

Catalonia: The secessionist challenge and the economic consequences of independence
83
that the “policies of the Spanish governments have failed” and that “Catalonia suffers a fiscal deficit high both in absolute terms and in relation to others international comparable cases”.2
Both assertions are simply gratuitous and lack any empirical support. To begin with, Spain’s outstanding economic performance during the second-half of the twentieth century –whereby Spain, one of the most backward states in Western Europe in 1950, joined the selected club of most developed countries– has often been presented as an ‘economic miracle’, i.e., an example of rapid and sustained economic growth. Although the real-state bubble set in by the availability of cheap credit after the launching of the Euro in 1999 and the subsequent financial crisis resulting when the economy plunged into recession in 2008 have had a dramatic impact on employment and GDP, the economy is slowly recovering and Spaniards still enjoy an enviable average per capita GDP. As to the second claim, it should be said that state fiscal rules are exactly the same for all citizens and businesses independently of their fiscal residence3, and the fact that some regions have fiscal surpluses (Andalusia or Extremadura) o deficits (Catalonia or Madrid) with the State Central Administration (SCA)4 basically reflects the uneven territorial distribution of economic activity and per capita incomes across Spain.
These claims are not only at odds with the empirical evidence and common sense but what it is more important the key arguments advanced by economists favourable to independence are fundamentally flawed. On the one hand, they assume highly improbable scenarios (Catalonia will remain in the EU after independence) or make heroic assumptions (trade diversion will small and transitory) and, on the other hand, they take as hard data figures (Catalonia’s fiscal deficit with the CA) that are the result of clumsy and biased imputations. All kind of tricks are allowed in the game as long as they are useful to justify the conclusion than expected profits of independence exceed expected costs. Galí (2012), for instance, argues that independence offers an opportunity to design more efficient institutions and implement structural reforms but he disregards the uncertainty and risks that accompany constitutional processes and fails to explain why those reforms have not been already undertaken by the Catalan governments since 1980. Others, like Antràs and Ventura (2013), Galí (2013) and Sala i Martí (2012) ), Bosch and Espasa (2012 and 2014) and the CCB (2014) assume that independence will have no noticeable effects on trade, the stability of the financial system and the tax revenues, respectively, something that very few economists would concede.
It is somehow paradoxical that these extravagant views about the economic standing of Catalonia in relation to Spain have reached certain respectability nowadays and permeated the political and social debate so as to be considered self-evident truths. I want to recall that it was only a few decades ago when reputed Catalan economic historians coined the term “Catalonia, the workshop of Spain” to underlie the crucial role the Spanish market (including the American colonies until 1998) played in the development of manufacturing during the second half of the 18th century and the first third of the 19th century, as well as in the subsequent industrialization of Catalonia. Fontana (1978) called the attention to the political dimension of the ‘national market’ and its indispensable role in the industrial revolution; Nadal and Maluquer de Motes (1985) published a
2 The institutions that back the Manifest are the ‘Catalan Business Circle’ (CCN) and the ‘Catalan National Assembly’ (ANC), an independence organization that has taken the relay of the National Coordinating Body that organized informal local polls throughout Catalonia between September, 13, 2009 and April, 10, 2011. C. Forcadell, president of the ANC, closed the act at the Barcelona Stock Exchange. 3 The only exceptions are the three provinces of the Bask Country (Álava, Vizcaya and Guipuzcoa) and Navarre. They are entitled by the Constitution to collect all taxes (except Social Security Contributions) and their net contribution to the sustenance of the State is well below that of the other territories. Of course, this is unfair to Catalans as well as to the rest of Spaniards. 4 The State Central Administration includes the State and the Autonomous Organisms, Public state owned firms, and the Social Security administration.

The political economy of Catalan independence
84
catalogue whose title “Catalonia the workshop of Spain, 1833-1936. A century of Catalan industrialization” is self-explanatory; and Nadal (1987) completed detailed sectoral tables showing the increasing concentration of industrial activity in Catalonia between 1856 and 1900. The characterization of Catalonia as the ‘workshop of Spain’ remained valid throughout most of the 20th century and one can assert that the rest of Spain (ROS) is by far the most important market for Catalan products even today.
Along these pages, it will be assumed that the independence process proceeds smoothly without triggering a political and social conflict of unforeseeable consequences, a rather unlikely assumption in view of what has occurred in previous disintegration processes in Europe and elsewhere.5 Even accepting this unrealistic scenario, I will argue that the cost of secession will probably be severe and potentially disastrous for Catalan workers and businessmen. Independence poses several main risks for the Catalan economy. First, breaking the political union with Spain and the EU will have a negative impact on Catalonia’s exports to its two principal markets, the ROS and the rest of the EU (REU); and it might even have a deterrent effect on domestic and international tourist arrivals to Catalonia. Second, domestic and multinational firms and financial institutions whose main markets are Spain and the EU will move their headquarters and even their production facilities and offices out of Catalonia. Third, households, companies and the Catalan public administration will have to pay higher risk premium on credits and there will be quantitatively significant outflows of capital looking for safer harbours. Fourth, there will also be a diversion of foreign investment towards other EU countries. Fifth, the fall in exports and the financial consequences of the ‘eurization’ of the Catalan economy will reduce the tax bases and tax revenues collected by the Catalan state. Finally, it is very likely that Catalonia’s Central Bank will end up imposing capital controls as a first as a step towards the introduction of its own currency.
The rest of the paper is divided in six sections. First, I outline the basics of the political challenge to the state and the economic case for secession. Next, I provide an overview of the economic development of Catalonia since 1714. In Section 4, I quantify the weight of Catalonia’s exports to the ROS in production, value added and employment using an extended input-output model and the impact it would have the ‘normalization’ of exports to the ROS. The consequences of the ‘eurization’ of the Catalan economy are examined in Section 5 and the methodology and the results of the CFB with the SCA are analyzed in Section 6. The article ends summing up the major conclusions.
2. The political challenge to the State and the economic case for secession
The Parliament of Catalonia approved a resolution on January 23, 2013, stating the right of the
people of Catalonia to unilaterally decide their own future. On December, 12th, 2013, the president of the Catalan government announced the intention to hold a self-determination referendum on November 9th, 2014, to ask Catalans whether they want to constitute an independent state. In order to give legal backing to the secessionist plan, the Catalan Parliament debated on January, 16th, 2014, a legislative initiative demanding the Spanish Congress the transfer of the right to organize, call
5 It is rather naïve to assume that if the government and the Parliament of Catalonia declare unilaterally the independence in 2015, the Spanish government, the Congress and the Senate will passively accept the decision. It will probably trigger a risky conflict with political, social and economic consequences hard to foresee.
Catalonia: The secessionist challenge and the economic consequences of independence
85
and celebrate a referendum to decide the political future of Catalonia. The initiative gathered the support of 65 percent of the representatives in the local Parliament.
On March, 24th, 2014, the Constitutional Court ruled illegal the projected referendum on the basis that the present Constitution of Spain, approved with the favourable vote of 90.46 percent of Catalans, does not allow an Autonomous Community like Catalonia to unilaterally decide whether or not wants to be part of Spain. The ruling came as no surprise since the Spanish Constitution clearly states that “national sovereignty belongs to the Spanish people, from whom all State powers emanate”, not to any subset of it, and it proclaims “the indissoluble unity of the Spanish Nation, the common and indivisible homeland of all Spaniards”. The Constitution also “recognizes and guarantees the right to self-government of the nationalities and regions of which it is composed and the solidarity among them all”, but it does not contemplate the right to self-determination. In a historical session on April 8th, 2014, the Spanish Congress debated the legislative initiative of the Catalan Parliament demanding the transfer of the competence to organize a self-determination referendum and 86 percent of congressman rejected it.
Regardless these legal and parliamentary setbacks, the president of the Catalan government has repeatedly voiced out its intention to go ahead with its plans to hold the referendum on November 9th. Although he has not spelled out his road map in detail, the Catalan Parliament is considering a legislative initiative, named “Popular Polls Law”, intended to provide legal backing to what it is a flagrant unconstitutional referendum, at least while the present Constitution is in force. It is not hard to foresee that the Popular Polls Law will be also declared unconstitutional by the Constitutional Court and if the Catalan government ignoring the ruling takes positive steps to hold the referendum, the Spanish government will have to adopt measures to restore the constitutional order. Another undesirable consequence of the drive towards independence is the fracture that has already produced in the Catalan society among those in favour of independence and those who want Catalonia continues being part of Spain.
Few sensible economists would deem the growing political and social confrontation in Catalonia as good news for the economy. Surprisingly, economists favourable to independence claim that the independence will raise the well-being of Catalans even in the short-run. Their recipe is very simple: eliminate the ‘fiscal drainage’ with the SCA and dedicate those resources to improve public services, pensions and infrastructures in Catalonia. They depict the rest of Spaniards as insatiable vampires ready to soak the blood up of hardworking Catalans and they also blame on the systematic ‘fiscal spoil’ they are subjected to both the expenditure cuts and the tax hikes implemented by the Catalan government to balance the budget since 2009.6
In my view, their argument rest on very feeble base since it explicitly or implicitly assumes that the Catalan economy will not register important negative impacts during the process of building the new state. Antràs and Ventura (2012) recognize there might be some negative impact on exports to the ROS but they deem the losses will be considerably smaller (1-2 percent of GDP) than the ‘fiscal dividend of independence’ (8 percent of GDP). Galí (2013) warns of ‘serious risks’ for the financial system and the economy if the new state is left out of the EU for several years but he relies on reaching a transitory agreement to avoid drawing its consequences. In a recent study, the CCB (2014) estimates that the public deficit of the new state will initially be 2.6 percent of GDP but it will achieve a structural budget surplus in the neighbourhood of 7 percent of GDP in the long run.
6 See, the “Manifest of Catalonia’s career economists” and the “Stop spoli” video espoused by ten Catalan social academics. https://www.youtube.com/watch?v=JJQkmRnLjeE .

The political economy of Catalan independence
86
Bosch and Espasa (2014) examine the effects of the independence on trade flows and fiscal variables and conclude that “Catalonia is viable” as an independent state.7
Beside ignoring or minimizing the negative impact of independence on the Catalan economy, a common thread in all these studies is they accept as an unquestionable data the largest estimate of the fiscal deficit of Catalonia with the SCA. Actually, the number they invariably use to back their arguments (16,000 million euro or 8 percent of Catalonia’s GDP) is a figure calculated by the Catalan government making crude and biased imputations to estimate the ‘contributions’ of Catalans to the SCA and the ‘returns’ obtained by them from the SCA8. Another feature they shared is that they ignore that the new Catalan state might lose a substantial part of the imputed ‘contributions’ to the SCA if independence substantially shrinks tax bases and the tax revenues collected by the Catalan government.
Is it reasonable to assume that the independence will have negligible effects on the economy and the new Catalan state will collect at least the same tax revenues now imputed to Catalonia in the CFB? The economists in favour of independence do not hide the two pillars supporting their optimistic views about the future Catalan state. First, they take for granted that “the transition towards its own state will take necessarily place in a context under the tutelage of the European Union”. Second, they also assume that the secession “does not necessarily imply to break up the ties with Spain because that would not benefit either”. In the same vein, the recent CCB (2014) study of government finances assumes that “all calculations are referred to a hypothetical Catalan state that remains in the EU and the change in the status quo has been accorded with Spain” 9. Bosch and Espasa also admit that their conclusion about public finances rests on the assumption that the Catalan state “keeps the same fiscal system… [and] the same fiscal pressure”. Actually, Bosch and Espasa forgot to add a further assumption, namely, that tax bases will remain unchanged after Catalonia’s secession.10
Assuming that the EU will ‘necessarily tutelage’ the transition process towards a new state, contravening all international treaties, or making the equally unrealistic assumption that tax bases will remain unchanged after secession, is wishful thinking. As to the first issue, the only argument advanced to support their view is that the interests of multinational companies located in Catalonia will weigh more than the Union Treaties accorded and signed by twenty-eight States. Sala i Martin (2012) argues that the Spanish government not only will not object to the entrance of Catalonia into the EU but it will do its best to speed up the process. If Catalonia’s economy (just 1.2 percent of EU GDP) is as vital for the EU and Spain as these economists claim, would it not be more sensible assuming that they will do everything in their hands to abort the process of independence?
It is in this illusory papier-mâché stage where the economists favourable to independence place themselves to draw the conclusion that the new Catalan state will be in better position “to overcome the present crisis and keep balance the public accounts and face future pensions”. Of course, it is hard to imagine that things might worsen if independence changes nothing. Let me illustrate the situation with an example taken from the sport world. The Barcelona C.F. is one of the greatest sport entities in Spain and its main soccer team is well known all over the world. It is
7 Bosch and Espasa (2014) focus their viability analysis in what they call “trade and fiscal factors”. 8 According to the latest press release by the DEC “the Catalan fiscal deficit (monetary flow method) of 2011 reached 15,006 million euros, some 7.7% of GDP”. The DEC reported even higher figures: 16,543 million euro in 2010 (DEC, 2013, p.7) and 16,409 million euro (DEC, 2012, p. 58). 9 CCB (2014), p. 23. 10 Bosch, N. y M. Espasa (2014), pp. 143-144.

Catalonia: The secessionist challenge and the economic consequences of independence
87
almost tautological that if the Barcelona teams continued playing in the Spanish Leagues after the independence, revenues, players’ salaries, profits and so on would be unchanged and the Catalan state will end up collecting some fiscal revenues that now go to the SCA. However, if all Barcelona teams, included soccer teams, were excluded from the Spanish Leagues and had to play in newly created Catalan Leagues, few economists would dare to maintain that the club finances and the tax bases (wages, transactions, personal income, etc) would increase.
What will happen to the Catalan economy if the process towards its own state leaves Catalonia out of the EU for a few years? How much will fall Catalan exports to Spain and the REU? Will there also be a fall in tourism flows towards Catalonia? How will the fall in economic activity impinge in the real-estate market? What will Catalan financial institutions do? How interest rates, balance sheets and direct foreign investment will be affected? Will the Catalan Central Bank end up abandoning the euro and introducing a ‘Catalan’ currency? How these sweeping changes in the Catalan economy will affect tax bases and public revenues? Most leaders of the EU have repeatedly made clear that the independence of Catalonia is an internal affair of Spain and that if Catalonia becomes an independent state it will have to ask for admission in the EU, a procedure that requires unanimity. It is a great irresponsibility to tell Catalans that the ‘fiscal dividend of independence’ will solve most of their economic problems instead of warning them of the significant risks independence poses to their well-being.
3. Catalonia a privileged region of Spain
How well has performed the Catalan economy during the last 300 years? To begin to separate the wheat from the chaff, let me recall that Catalans’ per capita GDP is 19.75 percent greater than the Spanish average, 24.4 percent above the average of the rest of Spaniards and 13 percent greater than the average of the EU28.11 Not bad to be an economy that according to the Catalan historians, sociologists, economists and linguists that promoted the recent Symposium “Spain against Catalonia” held in Barcelona, “Catalonia has been subject to political action, almost always repressive of the Spanish state towards Catalonia” since 1714 that have prevented the “full political, social, cultural and economic development of Catalonia” during three centuries. In face of the irrefutable fact that Catalans have enjoyed and still enjoy a much higher than the rest of Spaniards during the last 300 years and the average Europeans, one can follow two alternative paths: to succumb to the delirium of rewriting the history and its present derivatives, airing imaginary humiliations and spoliations in a futile attempt to hide the stubborn facts: or try to explain with objectivity the impressive social and economic development of Catalonia, an arduous task to which fortunately historians and economists, many of them Catalans, have devoted their life.
11 GDP Per capita for Spain, the ROS and Catalonia in 2013 have been calculated with data published by the National Statistical Institute (INE). GDP figures (in million euro) are 1.022.988 for Spain and 192.544 for Catalonia; population figures (in thousands) are 45,917.8 for Spain and 7,330.7 for Catalonia. Per capita GDP figures for EU28 regions correspond to 2011 and are corrected by differences in purchasing power. In 2010, Catalonia’s GDP per capita was 16.0 per cent above the EU28 average.

The political economy of Catalan independence
88
3.1. Might Catalonia have become the Holland of southern Europe?
The question can be posed in two different ways. First, one might ask whether Catalans might have reached a higher living standard had Catalonia been part of France since 1641, when Louis XIII proclaimed himself Count of Barcelona. Nobody knows that for certain. However, it is interesting to notice that the GDP per capita of the three Mediterranean regions of France (Languedoc-Rousillon, Provence-Alpes-Côte d’Azur and Corse) is well below that of Catalonia today. Second, one may also ask whether Catalans would be better-off today had Catalonia become a part of the Holy Roman Empire after proclaiming the Archduke Carlos Count of Barcelona in 1705. Nobody can either give a clear-cut answer to this question. However, it is clear that if Catalonia had been a part of the Holy Roman Empire it could not have profited of the opportunities it offered the Spanish market, including the American colonies, to develop its manufacturing base in the18th century. 3.2. The economic consequences of the Succession War (1702-1714)
Economic historians underlie the importance of both Castilian and American markets in the rapid economic growth of Catalonia during the 18th century. In his panoramic, “Catalonia, the first industrial region of Spain”, Carreras (1990) describe in the following terms the consequences of the Succession War for Catalonia:
“Let us focus the attention in the free access to the Spanish market. One of the consequences of the Succession War was the suppression of interior customs between Aragon and Castile (and inside the Aragon Crown). Although not all of them were abolished, the majority of them were eliminated and trade among the two Kingdoms was greatly facilitated after the abolition of customs. The measure was adopted with the purpose of equalizing the conditions of Castile and Aragon, eliminating old privileges and promoting commerce”. 12
As far as the distribution of the benefits accruing from the reforms undertaken by Phillipe V, Carreras has few doubts about who were those that reaped most benefits: “Thanks to the access to Aragon, Castile expanded its market by 25 percent (I assume similar per capita incomes). In exchange, Aragon gained access to a market four times larger”. The expansion was even larger for Catalonia that multiplied its market by a number between 9 and 10.13 Although communications were still rather primitive, the expansion of the market did not last to be noticed and “Catalan merchants were penetrating in the Castilian market protected by common customs offering Catalan cloths at prices more competitive than local artisans”, to the point that “the conquest of the Spanish market was already under way –although not completed yet- in the decade of 1770”. In sum, the reforms of Phillipe V and the customs that protected the ‘national’ market open unthinkable opportunities to Catalan merchants that took full advantage of being foreigners (by their language and uses) while being ‘nationals’ from a legal point of view. Their solidarity, endogamy, and mutual familiarity help them to penetrate into a hostile territory where they nevertheless had full right to trade”.14
The reforms also allowed Catalan producers and merchants to trade directly with the American colonies. Although the effects of these reforms are not so unanimous, several conclusions
12 Carreras (1990), p. 260. Carreras is General Secretary at the Department of Economics and Knowledge of the Catalan Government
since 2011. 13 Castile population was around 6 million and Aragon population 1.5 million. Simón i Tarrés (), p. 85, estimates the population of Catalonia in 1717 somewhere between 681,000 and 767.000. Bustelo (1974) placed Catalonia population in the interval (525,000-625,000). 14 See, Torras (1984 and 1985) and Torras and Duran (1983 and 1987).

Catalonia: The secessionist challenge and the economic consequences of independence
89
emerge from the studies undertaken. First, freedom of commerce with the American colonies facilitated the exports of agricultural products and its derivates (wine and liquor, particularly) as well as the re-export of clothes imported and printed in Barcelona. Second, it gave “a tremendous thrust to naval business. Thanks to the ‘free trade’, the Catalan fleet gained control of a substantial share of American freight. It started with the derivatives of Catalan trade but it made its way into non Catalan Spanish trade, allowing Catalans to specialize in naval insurance, seamanship, maritime navigation, naval construction, American trade, etc”. Third, Catalan merchants controlled sugar trade that “was distributed to the rest of Spain”, a trade complemented by liquor exports to the colonies and the extraordinary profits obtained with the slave trade fins its abolition and even after”.15
Recently, some historians favourable to independence have tried to minimize the importance of the national market. Feliu (2012) considers that growth of trade and manufactures in the 18th century was due to the expansion of markets in Northern Europe, America, peninsular Spain and the Mediterranean. The author dedicates several paragraphs to three of them but only a few remarks to the peninsular market whose role he clearly understates and even presents as a mere extension of Catalonia’s own domestic market.16 The same lack of objectivity is present in Albareda I Salvadó (1999) textbook, a useless attempt to reduce the history of Catalonia to a succession of political repression and fiscal exploitation by part of the Central government that are hard to reconcile with the impressive demographic expansion of Catalonia in the 18th century (after many decades of stagnation) sustained by economic expansion in Catalonia and significant gains in wellbeing.17
3.3. Catalonia ‘the workshop of Spain’
The manufacturing development of Catalonia gain velocity in the 18th Century, especially in the second half with the introduction of steam in the fabric system and transportation. According to Nadal (1987), en 1856 “the manufacturing industry was very unevenly distributed… Catalonia, the most important manufacturing region in Spain in absolute figures (25.6 percent of total) and relative terms (production/population ratio=2.28) showing significant positive surpluses in all sectors”. At the end of the 19th Century, Catalonia’s population accounted for about 11 percent o the total but the Catalan manufacturing shares have risen to 38.58 percent, increasing the ratio production/population to 3.47”. While the positive surpluses increased steadily in Catalonia, the relative ratios diminished in most regions to the point that Nadal asserts without hesitating that “the spectacular increase of Catalan advantage had increased the unbalances in 1900”. It was in this
15 See, Carreras (1990), pp. 262 y ss. In relation to the role of both markets, Maluquer de Motes, J., Historia Econòmica de Catalunya, Universitat Oberta de Catalunya-Proa, Barcelona, pp. 49 y ss., mantiene que “aquello que va a permitir aumentar la competitividad de las manufacturados catalanes va a ser el mercado interior español. Las compras coloniales van a ser mucho más importantes para el comercio y la agricultura que para la industria”. No obstante, el propio Maluquer de Motes, J., “El mercado colonial antillano en el siglo XIX” en Nadal, J. y G. Tortella, Agricultura, comercio colonial y crecimiento económico en la España contemporánea, Ariel, Barcelona, 1974, p. 323, reconoce que en el siglo XIX “la inyección de capital de origen colonial en la estructura económica de la Península tuvo una apreciable importancia en distintos sectores: industria textil, de la construcción y siderometalúrgica, transportes y banca”, y cita los casos de Miquel Biada y Bunyol, José Xifré Casas, la primera fortuna de la Barcelona de su época, y Juan Güell y Ferrer. 16 In effect, Feliu (2012), p. 91, asserts that “the domestic trade penetrated also with strength the domestic market of the rest of the Crown” given the impression that the decisive push came from the Catalan market itself. 17 Albareda i Salvadó (1999), J., Història de la Catalnya Moderna, Universidad Oberta de Catalunya, Barcelona, 1999, pp. 130 y ss. Albareda has to concede that “although initially the Royal Cadastre was a heavy burden for the Catalan society and was imposed by sheer coercion… its effects were cushioned by population growth and economic expansion along the 18th century”. However, he does not recognize the causal link between the political unification and the rationalization and relative homogenization of fiscal norms and the emergence of the national’ market and between ‘national’ market and Catalonia’s economic expansion.

The political economy of Catalan independence
90
period when Andalusia “lost industrial muscle and Catalonia became the ‘workshop of Spain’”. Nadal summed up this way the sweeping changes in the regional industrial distribution during the second half of the 19th century: “In 1856, Catalonia was at the head of the regional ranking in ‘textile’, ‘paper’ and ‘other manufacturing’. In 1900, its hegemony cover also ‘glass products’, ‘pottery’, ‘ceramics’, ‘lime’, ‘plaster’, ‘leather and shoes’, ‘chemical’, ‘metal products’ and ‘wood’, that is to say, all sectors except food products”.18
Estimates available indicate that Catalonia’s share on GDP increased from 8.3 % in 1802 to 14.7 % en 1849 and 16.27 % en 1901, doubling during the century. Per capita GDP Estimates of show also indicate very rapid economic progress. Departing from a very similar position, 102.4 in 1800, Catalans’ relative GDP have risen to 124.3 in 1860 and 153.8 in 1900.19 Notwithstanding all hard work and sagacity deployed by Catalan merchants and entrepreneurs, it has to be recognized that the rapid growth of Catalonia and the resulting lost of industrial weight of other regions like Andalusia required selling Catalan surpluses in the domestic markets. Given the extreme protectionist policies followed by most states in the 19th Century, one can assert without the slightest doubt that political union, far from being the end of an imaginary ‘Catalan state’, played a decisive role in the development of Catalonia. Put it other way, had Catalonia not being a part of Spain, it would not have been possible to sell their surpluses in the ‘national’ market.20 Inasmuch as to the importance of the ‘national’ market, Nadal and Maluquer de Motes recognize without hesitation that the “industrial consolidation was a consequence, however, of being able to produce manufactures in quantities higher than required to satisfy the internal needs, thanks to the capture of external markets, in America for some time and always in the rest of Spain.21
3.4. From the end of the 19th century to the Civil War
In the first third of the 20th century, the Catalan economy continued growing at a good pace in midst of increasing political and social tensions resulting from the establishment of powerful revolutionary trade unions in Catalonia. Alcaide (2003) estimates that the share of the four Catalan provinces in total gross value added at factor costs was 28.3 percent in 1930, inferior to the industrial share (38,58 %) estimated by Nadal at the start of the century but 10 percentage points greater than the GDP share (16.27 %) in 1901.22 In this period, the accumulated growth of Spanish GDP at constant prices was 84.5 % at an average annual rate of 2.06 %. Catalonia’ shares in 1901 and 1930, and the accumulated growth of the Spanish economy, imply that Catalonia accumulated growth was 142.2 % at an average annual rate of 3 %, almost a point above that of Spain.23 Available per capita GDP estimates at current prices also indicate that Catalans per capita GDP was 60 percent greater than Spaniards per capita GDP, a difference that would be even greater if the calculation had been made solely for the rest of Spain.24 Although prices were also probably higher, GDP differential is so large that it cannot be imputed to regional price differentials.
18 Nadal Oller, J. (1985), pp. 135. 19 Carreras and Rosés (2005), pp. 1365-1373. 20 As to the effects of the Catalan expansion on other regions, Nadal (1985), pp. 189-201, agrees with Carmona that “Catalan production displaces and ruins Galician lingerie” destroying the rural domestic industry in Galicia. 21 Nadal Oller and Maluquer de Motes (1985), p. 179. 22 Carreras (2005), pp. 404-405 and Alcaide (2003). 23 Maluquer de Motes (1998, p. 96), presents figures of Catalonia’s GDP at constant prices that imply that the accumulated growth rate between 1900 and 1930 was very similar: 136.3 %. The author does not indicate the source of his figures. 24 Calculations done with Escosura and Llano’s historical series reproduced by Carreras and Rosés (2005), pp. 1364 and 1372.

Catalonia: The secessionist challenge and the economic consequences of independence
91
3.5. Economic recovery during Franco’s regime
Alcaide (2003) provincial estimates of industrial gross value added indicate that the share of the four Catalan provinces diminished from 28.0 percent in 1930 to 24.1 percent in 1950. However, Catalonia recovered its pre-war level, 28.2 percent, in 1960, and almost maintained its privileged position during the fastest period of economic growth of the Spanish economy, ending the decade with a slight descend, 27.2 percent, in 1970. The relative decline of Catalonia started in the following decade where western economies were hit by oil shocks (1973-74 and 1980) as well as inflation in other primary markets. In the case of Spain, political instability and erratic macroeconomic policies after Franco’s death in 1975 caused a deep industrial crisis that lasted until Spain joined the EEC in 1986, a period of slow growth that I refer to as the ‘black decade’. Alcaide’s provincial estimate show that the share of the four provinces had fallen to 25.8 percent in 1980. Catalonia’s industrial share of gross value added at factor cost shows a noticeable advance from 28.3 % in 1955 to 33.3 % en 1975.25 Finally, Catalonia’ share of GDP at factor costs in Alcaide (2003) historical series for the period 1955-1998 shows great stability with a minimum of 18.2 percent in 1957 and a maximum of 19.8 percent in 1975. Although these figures suggest that Catalonia maintained its leadership in industrial production and gross value added until 1975, the evolution of relative per capita GDP in current prices show a steady fall since 1940 when it achieved its maximum value (163.5 ) until 1970 (134.8).26
All together, the picture that emerges is that Catalonia recovered his industrial leadership after the Civil War and continued to play a prominent role in the Spanish economy in the last three decades of Franco’s regime. Contrary to the view held by historians, sociologists and economists enrolled in the team “Spain against Catalonia”, ready to depict as a region subject to a tyrannical regime and economic exploitation, Catalonia regained its pre-eminent industrial position as the industrial workshop of Spain under the Franco regime. It also reaped the benefits of discretional investment decisions adopted by Franco’s regime to create modern automotive and petro-chemical industries in Catalonia. Both industries appear still today by production and exports as two strategic sectors of Catalonia’s industrial fabric. It is true that the gap in per capita income fell considerably during the second-half of the 20th century since other less developed regions grew faster and internal migration reduce income disparities.27
3.6. The protection of the national market
Protectionism has been a universal feature present in city states and ancient empires as well as in modern nation-states. As a matter of fact, it is hard to find a developed country today where its manufactures and industry have not been protected from external competition at one time or another. Economists in favour of protectionism have maintained that it helps to develop an industrial base that although it may appear inefficient at the start it paves the way to attain the technological frontier later on. Other economists have argued that protectionism results in an inefficient allocation of resources and reinforce the power of groups interested in perpetuating those inefficiencies.
25 Fundación BBV (1999), p. 96, These percentages differ considerably from Alcaide’s provincial estimates. 26 See, Carreras and Rosés (2005), Tables 17.20 and 17.21, pp. 1365-1367. The volatility of Catalonia’ share of GDP at market prices for 1980-2000 is slightly greater with a minimum of 17.85 per cent in 1985 and a maximum of 19.2 percent in 1994. Table 17.27, p. 1375, provides Per capita relative GDP in current prices for all Spanish regions. Estimates come from Llano (1986) until 1940 and Alcaide (2003) for the post Civil War period. 27 Catalonia’s population grew tenfold growth from 1718 while the growth factor was just 5.5 for the ROS.

The political economy of Catalan independence
92
It is beyond the scope of this paper to examine the merits and flaws of the two conflicting schools in general, or even to assess whether protectionism has acted as a driving force or a retardant of economic growth in Spain during the last three centuries.28 Although protection was often unnecessary while the means of transportations were rudimentary, protection became more the improvement of roads and waterways in the 18th century and the introduction of new means of transportation (railroads and steam ships) in the 19th century significantly brought down the costs of transportation. The only point I want to underscore is that Spain, like most nation states, resorted to all kind of restrictions to trade (customs duties, quotas, straight import prohibitions and administrative regulations) in order to protect domestic producers from international competitors. These policies benefited to the entrepreneurs and workers of the protected sectors and its costs were borne by Spanish consumers who paid higher prices for less valuable products.
How important was protection in the case of Spain? Tena (2005) provides figures on CIF imports, custom duty revenues and nominal protection rates from 1850 until 1980.29 The overall nominal protection, defined by the ratio of custom duty revenues (Tena, 2005, p. 626, series 1956) over the value of estimated CIF imports (Tena, 2005, p. 600, series 1827), fluctuated between a minimum of 9.1 percent in 1872 and a maximum of 24.5 percent in 1935, and the average rate was 16.1 percent during the 65 years period 1850-1914. During the war years and its immediate aftermath nominal protection rates fluctuated between 8 and 9 percent, since the war needs made protection unnecessary. However, nominal protection increased sharply after the end of the war and it averaged 21.5 percent in the ten years (1926-1935) that preceded the outbreak of the Spanish Civil War. The highest levels of nominal protection, however, occurred at the end of the Civil War when the average rate reached 30 percent in the decade 1940-1949. The acute need to import goods not available in Spain led the authorities to reduce nominal protection rates that averaged 6.1 percent in the 50’s. The policy was soon abandoned to protect domestic industry during the take-off of Spain’s economy in the 60’s and the first half of the 70’s with normal rates back to the 15-20 percent interval. Only in the 80’s there was a steady reduction in nominal protection as a by product of Spain’s entrance in the EEC in 1986 and the launching of the European Single Market in 1992.
3.7. Conclusions
Several conclusions emerge from this review of the role the Spanish market has played in the economic development of Catalonia. The political and economic reforms undertaken since 1714, far from being part of a systematic plan to exploit Catalans, contributed to progressively eliminate the obstacles to the free movement of goods, people and capital, a first step towards the creation of a ‘national’ market that comprised both the peninsular territories and the American colonies. As Catalan historians have long recognized, the emergence of a ‘national’ market where Catalans could sell their trades on equal terms is what made possible the rapid growth of Catalan trade and
28 See, Tortella (1997, pp. 167-175) for a general discussion. Maluquer de Motes (1998, p. 89) recognizes that key to the success of stamping ‘indianas’ (cotton or linen clothing often imported) in Catalonia “was the royal prohibition to import indianas in 1728”. He also blames Catalonia’s failure to develop a metallic products industry of its own to the combination of freedom to import railroad material and equipment and the high protection granted to iron and steel works. 29 Protection rates commented in this paragraph are averages of the annual nominal protection rates provided by Tena (2005, series 1958). Imports include both protected and non-protected goods. Of course, the rates are much higher when only protected goods are considered (Tena, 2005, series .

Catalonia: The secessionist challenge and the economic consequences of independence
93
manufactures in the 18th century and the subsequent industrialization in the 19th century.30 A market, it should be recalled, protected by all kind of barriers to trade, including high tariffs until 1986. Of course, the great beneficiaries of protection were the producers and traders whose wares were sold in the protected ‘national’ market. It goes without saying that while Catalonia was the ‘workshop of Spain’, businessman and workers in Catalonia received those benefits while consumers, mostly living in the ROS, bear the burden. Unfortunately, there are no reliable estimates of the trade surplus of Catalonia with the ROS during the last three centuries to quantify the spatial distribution of benefits and costs.
The Catalan economy also benefited of discretional decisions and generous subsidies and capital transfers during Franco’s dictatorship that facilitated the development of modern automotive, chemical and pharmaceutical industries in Catalonia. After the arrival of democracy in 1978, the automotive and other industrial sectors received large public capital injections to facilitate its reorganization and privatization. In the service sectors, Barcelona’s tourism boom in the last two decades is difficult to explain without having the Central government financed the 1992 Olympic Games. The Catalan financial system has also received large capital injections and the two main Catalan financial institutions (“la Caixa” and Banc Sabadell) have acquired financial entities at a symbolic price that have been previously rescued by the Central government which has also acquired the compromise to absorb future credit losses. Finally, the Central Government has injected more than 20.000 million to avoid the bankruptcy of the Catalan Government.
After all the arguments exposed, it is almost tautological to conclude that without the political union and the establishment of the ‘national’ market, highly protected from external competition by barriers and tariffs, Catalonia neither had accumulated the physical and human capital it has today nor had Catalans achieved a GDP per capita 25 percent greater than the rest of Spaniards. Not only are mean but also flagrantly ignorant those politicians and economists who denying the historical evidence downplay the importance of the ROS in the Catalan ‘miracle’ and present independence as the panacea to solve its present problems. They do a disservice to Catalans among other things because, discarding the unlikely scenario whereby the Spanish government makes a constitutional reform to concede independence to regions at demand and the EU accepts automatically its offspring as members of the EU, the secession of Catalonia will have negative, potentially disastrous, consequences for the Catalan economy and the wellbeing of its citizens. 4. The weight of Catalonia’s exports to the ROS and the consequences of the rupture of the
national market and the exit of the EU
The entrance of Spain in the EEC in 1986, the starting of the European Single Market in 1992,
and the growing liberalization of trade and capital movements all around the world during the last three decades have created a global market and highly diversified trade flows. Regardless these important structural changes, the Spanish market remains by far the largest single market for Catalan producers and the lost of a significant share of this market might have serious consequences for Catalans’ well-being.
30 Fontana (1981) considers the term ‘national market’ irreplaceable. According to him, it serves to distinguish it from the “external market –international– that is beyond the political entity, out of the limits set by a common legislation, frontiers, etc. But it is also useful to show the qualitative difference with primitive domestic trade whose scope is limited to small exchanges within the local community”.
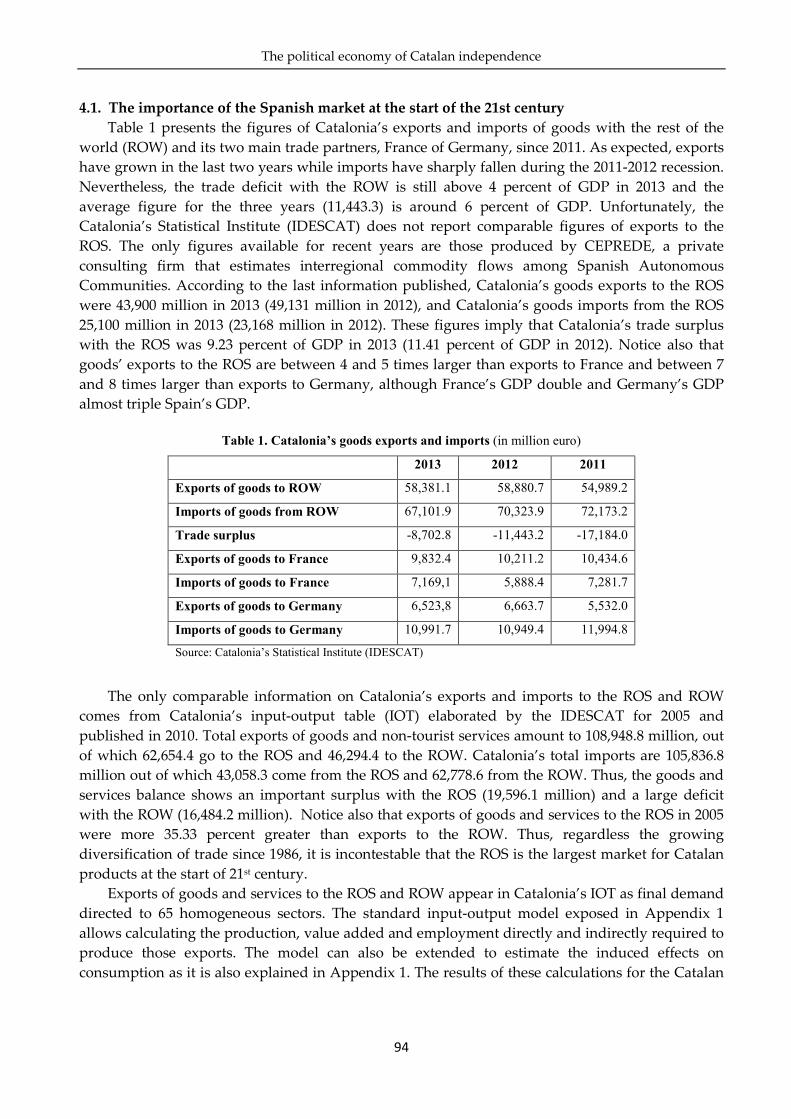
The political economy of Catalan independence
94
4.1. The importance of the Spanish market at the start of the 21st century
Table 1 presents the figures of Catalonia’s exports and imports of goods with the rest of the world (ROW) and its two main trade partners, France of Germany, since 2011. As expected, exports have grown in the last two years while imports have sharply fallen during the 2011-2012 recession. Nevertheless, the trade deficit with the ROW is still above 4 percent of GDP in 2013 and the average figure for the three years (11,443.3) is around 6 percent of GDP. Unfortunately, the Catalonia’s Statistical Institute (IDESCAT) does not report comparable figures of exports to the ROS. The only figures available for recent years are those produced by CEPREDE, a private consulting firm that estimates interregional commodity flows among Spanish Autonomous Communities. According to the last information published, Catalonia’s goods exports to the ROS were 43,900 million in 2013 (49,131 million in 2012), and Catalonia’s goods imports from the ROS 25,100 million in 2013 (23,168 million in 2012). These figures imply that Catalonia’s trade surplus with the ROS was 9.23 percent of GDP in 2013 (11.41 percent of GDP in 2012). Notice also that goods’ exports to the ROS are between 4 and 5 times larger than exports to France and between 7 and 8 times larger than exports to Germany, although France’s GDP double and Germany’s GDP almost triple Spain’s GDP.
Table 1. Catalonia’s goods exports and imports (in million euro)
2013 2012 2011
Exports of goods to ROW 58,381.1 58,880.7 54,989.2
Imports of goods from ROW 67,101.9 70,323.9 72,173.2
Trade surplus -8,702.8 -11,443.2 -17,184.0
Exports of goods to France 9,832.4 10,211.2 10,434.6
Imports of goods to France 7,169,1 5,888.4 7,281.7
Exports of goods to Germany 6,523,8 6,663.7 5,532.0
Imports of goods to Germany 10,991.7 10,949.4 11,994.8
Source: Catalonia’s Statistical Institute (IDESCAT)
The only comparable information on Catalonia’s exports and imports to the ROS and ROW
comes from Catalonia’s input-output table (IOT) elaborated by the IDESCAT for 2005 and published in 2010. Total exports of goods and non-tourist services amount to 108,948.8 million, out of which 62,654.4 go to the ROS and 46,294.4 to the ROW. Catalonia’s total imports are 105,836.8 million out of which 43,058.3 come from the ROS and 62,778.6 from the ROW. Thus, the goods and services balance shows an important surplus with the ROS (19,596.1 million) and a large deficit with the ROW (16,484.2 million). Notice also that exports of goods and services to the ROS in 2005 were more 35.33 percent greater than exports to the ROW. Thus, regardless the growing diversification of trade since 1986, it is incontestable that the ROS is the largest market for Catalan products at the start of 21st century.
Exports of goods and services to the ROS and ROW appear in Catalonia’s IOT as final demand directed to 65 homogeneous sectors. The standard input-output model exposed in Appendix 1 allows calculating the production, value added and employment directly and indirectly required to produce those exports. The model can also be extended to estimate the induced effects on consumption as it is also explained in Appendix 1. The results of these calculations for the Catalan

Catalonia: The secessionist challenge and the economic consequences of independence
95
economy and 5 large sectors are shown in Tables 2, 3 and 4 and the detailed results for the 65 sectors in Appendix 2.
The figures in column (3) show that total production, gross value added and employment directly and indirectly required to produce exports to the ROS account for 26.23, 21.64 and 20.22 percent, respectively of the economy totals. As the figures in column (5) show those percentages are considerably larger (36.29, 33.97 and 33.0 percent, respectively) when induced effects on consumption are taken into account. It should be emphasized that these figures are averages for the entire economy and hide that in Agriculture, stockbreeding and fishing and Industry the percentage explained by exports to the ROS is close to 50 percent and in the Private services sector near 40 percent). Only Construction and Private/Public Services (Education, Health and General Administration) are relatively independent of exports to the ROS. The detailed results in Appendix 2 indicate that in many industrial sectors those percentages are close to 60 and 70 percent.
Table 2: Total production and direct, indirect and induced production due to exports to the ROS, 2005
Main sectors
Homogeneous
total production
(HTP)
(1)
Direct
and indirect
production
(DIP)
(2)
DIP
in percent
of
HTP
(3)=(2)/(1)*100
Direct, indirect
and induced
production
(DIP+IND)
(4)
DIP+IND
in percent of
HTP
(5)=(3)/(1)*100
Difference
due to
induced
consumption
(6)=(5) - (3)
Agriculture, livestock
and fishing 3.927.241 1.450.852 36,94 1.870.686 47,63 10,69
Industry 122.366.486 56.134.492 45,87 60.707.645 49,61 3,74
Construction 37.981.820 793.141 2,09 1.876.082 4,94 2,85
Private services 146.391.870 30.788.421 21,03 56.374.294 38,51 17,48
Private/Public services 37.407.653 2.126.975 5,69 5.485.082 14,66 8,98
Total 348.075.070 91.293.882 26,23 126.313.790 36,29 10,06
Table 3: Total gross value added and direct, indirect and induced gross value added due to exports to ROS, 2005
Main sectors
Total gross
value added
(TGVA)
(1)
Direct and
indirect GVA
(DIGVA)
(2)
DIGVA
in percent
of
TGVA
(3)=(2)/(1)*100
Direct, indirect
and induced GVA
(DIGVA+IND)
(4)
DIGVA+IND
in percent of
TGVA
(5)=(3)/(1)*100
Difference
Due
to induced
consumption
(6)=(5) - (3)
Agriculture, livestock
and fishing 1.947.043 721.345 37,05 928825 47,70 10,66
Industry 37.057.820 17.081.733 46,09 18430694 49,73 3,64
Construction 16.514.981 344.868 2,09 815745 4,94 2,85
Private services 82.836.930 16.016.820 19,34 31241246 37,71 18,38
Private/Public services 24.073.618 981.480 4,08 3112331 12,93 8,85
Total 162.430.392 35.146.246 21,64 54528841 33,57 11,93

The political economy of Catalan independence
96
Table 4: Total employment and direct, indirect and induced employment due to exports to the ROS, 2005
Main sectors
Total
employment
(TE)
(1)
Direct and indirect
employment
(DIE)
(2)
DIE
in percent of
TE
(3)=(2)/(1)*100
Direct, indirect
and induced
employment
(DIE+IND)
(4)
DIE+IND
in percent
of TE
(5)=(3)/(1)*100
Difference
due to
induced
consumption
(6)=(5)-(3)
Agriculture, livestock
and fishing 82.146 30.405 37,01 39.159,40 47,67 10,66
Industry 795.047 372.245 46,82 397.974,71 50,06 3,24
Construction 349.536 7.299 2,09 17.265,04 4,94 2,85
Private services 1.756.706 294.280 16,75 655.935,82 37,34 20,59
Private/Public services 599.931 20.389 3,40 72.092,27 12,02 8,62
Total 3.583.366 724.618 20,22 1.182.427,24 33,00 12,78
4.2. Effects of independence on Catalonia’s exports
As we have shown in Section 3, Spain starting developing a ‘national’ market since 1714 where local producers were protected by trade barriers including high custom duties until 1986. Within its territorial boundaries, producers were free to produce goods and services and sell them on equal terms throughout the entire territory. People were also free to settle and work anywhere within Spain’s well defined boundaries. It is precisely the political union maintained during the last 300 years what explains the intensity of economic ties of Catalonia and the ROS, although many Spanish regions are more far more remote from Catalonia than southern France’s regions.
The effects of independence on Catalonia’s exports to Spain and the REU will depend on the attitude of the Spanish Government and the international community, particularly the EU. Although the Spanish government has repeatedly expressed its opposition to independence and the EU Commission has also made rather clear that it is an internal affair of Spain, economists favourable to independence believe that the EU authorities will press the Spanish government to accept the ‘fait accompli’ and Catalonia will be admitted in the EU in a few months. Sala i Martín (2012) has also suggested that the Catalan government has two powerful arms in its hands to ‘convince’ the Spanish government that it should facilitate Catalonia’s admission in the EU. Of course, this optimistic scenario implies that exports to Spain and REU will be almost unaffected. At most, pro-independence economists concede that there will be a transitory a not very effective boycott to Catalan products.
Is Catalonia as vital for the EU as pro-independence economists claim? And does the new Catalan state, as Sala i Martin claims, have the resorts to bend the will of the Spanish government? Catalonia’s GDP accounts for 1.6 percent of the EU’s GDP and 2.2 percent of the Euro zone’s GDP. These figures are not negligible but it is unlikely that the EU will disregard EU treaties and admission protocols to accommodate Catalonia’s demands. As far as the effectiveness of imposing a blockade to Spanish exports or repudiating the Spanish public debt to bend the will of the Spanish government, I think both measures could be counterproductive for Catalonia if they raise the stakes of the conflict and delay the admission process. Thus, the only realistic scenario is one where Catalonia’s is left out of the EU and politely asks for admission in the EU discarding any retaliatory measures against Spain, a member of the EU.
Nobody knows with certainty what will happen but there is a high probability that Spain (if its government does not abort the process by force) will oppose secession and Catalonia will be out of the EU (and other international institutions) for a good number of years. ¿What will happen while

Catalonia: The secessionist challenge and the economic consequences of independence
97
the Catalan government negotiates Catalonia’s admission into the EU? Among the certainties, one can assure that Catalan export to the ROS will be considered like exports to France or Germany and the corresponding VAT will be applied and collected in Spain. Second, all Catalan exports to Spain and other EU countries will be treated as imports from a non-member state and they will be subject to closer scrutiny and EU customs duties. According to the WTO, the average most favoured nation tariff is 13.2 percent for agricultural products and 4.2 percent for non-agricultural products, although rates of some commodities (dairy products, 54.7 %, Sugars and confectionary, 31 %, Beverages and tobacco, 21.3 %, and clothing, 11.5 %) are substantially higher. It is reasonable to assume that the combined effects of tariffs and non-tariff barriers might increase Catalan’s export prices between 8-10 percent.
How will the breakup of the national market affect trade among the Catalan state and ROS is a crucial issue to determine the economic effects on independence. On this matter, one can only make informed and reasonable conjectures. My view is that Catalonia’s exports to the ROS will fall considerably undergoing a process of trade ‘normalization’ which is consistent with what has been observed in countries that underwent a disintegration process recently. There is no reason to expect that Catalonia being an independent state will permanently export 5 times more to the ROS than to France (¡10 times more if we take into account the different size of France and ROS GDP!). Fidrmuc and Horváth (1999) and Fidmurc and Fidmurc (2003) studied several disintegration episodes in Central Europe and concluded that trade intensity among the new states fell between 30 and 50 percent (see figures in Appendix 3).
In my view, it is far more likely that exports will be cut to half within five years after the breakup of the Spanish ‘national’ market than to assume the business as usual scenario. Far from being a catastrophic hypothesis, I want to call the attention that in this scenario Catalonia’s exports to ROS would still be 31,327.4 million, a figure more than three times Catalonia’s exports to France (9,832.4 million) and almost five times Catalonia’s exports to Germany (6,523.8 million) in 2013. There is the slightest doubt that a fall of this magnitude would sharply cut production, value added and employment in the most dynamic sectors of the Catalan economy. For production, the fall would be 24 percent in agriculture, stockbreeding, fishing and industrial sectors and 19 percent in private service sectors. In those sectors where exports account 60-70 of total production, the fall would be 30-35 percent. Similar results hold for value added and employment. Of course, lower production and value added and employment also means reductions of the same order of magnitude in production taxes, social security contributions and income taxes.
To the pure breakup effect on exports’ volume, one has to add the export contraction due to price hikes cause by EU tariffs. And this is not the end of the story since one can also expect that the breakup of the national market may lead to businesses located in Catalonia to move to other friendlier regions within the EU to avoid tariffs and to other Spanish regions which share the same legal and fiscal system.31 Tourism flows from ROS to Catalonia and Catalonia’s second home real estate market may also be negatively affected if Spaniards prefer to go on holiday to Valencia, the Balearic Islands or Andalusia rather than to an independent Catalonia. Finally, the reduction in tax bases and public revenues will either skyrocket the public deficit or force the Catalan government to cut down public expenditure, what in turn would have a further negative impact on production, value added and employment.
31 In Section 5, I shall examine the likely consequences of independence for financial entities whose head offices are still located in Catalonia.

The political economy of Catalan independence
98
Although the Catalan economy dependence on exports to ROS is lesser today than thirty or fifty years ago and much, much lower than at the start of the 20th century, the ROS is still the largest market for Catalan products. It is hard to find a sole economic positive effect that independence could bring to Catalonia if, as it is reasonable to assume, Catalonia’s independence breaks up the ‘national’ market and the new state has to apply for admission into the EU. Exports, production, value added, employment, taxes, tourism and public expenditure will sharply fall in those circumstances and Catalans will undergo a serious process of impoverishment.
4.3. Antràs and Ventura’s estimates
Economists in favour of independence assume patently unrealistic scenarios to minimize its negative consequences. Not content with ignoring the negative impact on exports to other EU countries and tourist inflows caused by Catalonia self-exclusion of the EU, they adopt very unrealistic assumptions to minimize its impact on exports to the ROS, it’s by far largest market. Antràs and Ventura (2012), for instance, assume that the fall will not affect exports of multinational companies and intermediate products and only consumption exports will be affected. They finally assume exports fall by 18 %. They also take for granted that those exports can be placed in other markets accepting a 35-40 percent cut in prices.32 Given these assumption, they conclude that in the worst scenario GDP will fall between 1 and 2 percent.
Few companies would buy Antràs and Ventura’s diagnosis and conclusion. To begin with, the fall in final demand in consumption producing sectors would be substantially larger than the average 18 % used in their calculations; in those sectors, the impact would be severe. Second, it is rather unrealistic to assume both that the sales of multinational companies and companies exporting intermediate commodities will be unaffected and that Catalan companies producing consumption goods will easily find external markets to compensate the fall in exports to the ROS in the short-run. Third, the price cut they deemed necessary (35-40 percent) to place those additional exports would affect wages and profits and this would have detrimental effects on domestic consumption and investment. It cannot be discarded that the reduction in prices will turn unprofitable some plants that might even close down its operations in Catalonia. Finally, companies affected by the fall in exports might decide to close down their plants in Catalonia and locate them in other Spanish regions. Few economists and even less entrepreneurs will take seriously Antràs and Ventura back of the envelope calculations.
Let me return to the case of the FC Barcelona, one of the largest clubs in the sports sector in Catalonia with a budget worth 509 million in 2013-2014. It is rather paradoxical that an institution that has shown public support for independence has not withdrawn yet all its teams from the Spanish leagues (soccer, basketball, handball, etc.). According to Antràs and Ventura, the expected losses would be small and they could be easily compensated exporting more services, i.e., playing more international games and accepting to cut down prices. Nobody, much less the executive board of the CF Barcelona, takes seriously their phony argument. They know too well that it is completely unrealistic to assume that revenues, salaries and profits will remain almost unchanged after independence. Although it is true that the exit of the CF Barcelona (and other Catalan professional sports clubs) from the Spanish leagues will also cause losses to all Spanish teams, there is little doubt that Catalans’ teams would be the hardest hit. Sooner than later we would see most of the players of Catalan teams playing in other Spanish and European teams.
32 It should be noticed that the fall in export oriented sectors will be substantially greater than 18 percent and it will require even larger price cuts.

Catalonia: The secessionist challenge and the economic consequences of independence
99
5. The ‘eurization’ of the Catalan economy
‘Eurization’ is used here in the same way that ‘dollarization’ has been employed to describe
situations where a sovereign state adopts as legal tender the currency of other sovereign state.33 The present Catalan regional government and almost all economists in favour of independence have expressed the intention of retaining the Euro as the official currency of the future Catalan state renouncing to introduce a currency of its own. As they recognized, Catalonia’ standing after independence would be similar to that of Andorra, Monaco, The Vatican or Kosovo. Of course, nobody can prevent the Catalan government to declare the euro its currency and continue using it as a means of payment and store of value. However, if the new Catalan state is out of the EU and the central bank of the new state does not belong to the European System of Central Banks (ESCB), the ‘eurization’ of the Catalan economy will affect the structure of the financial system and the behaviour of financial entities, nonfinancial companies and households. In the end, it may turn out impossible to hold on to the euro if Catalonia remains out of the Euro zone for few years as economists in favour of independence recognize. 5.1. Effects on financial institutions, interest rates and asset holdings
A recent document published by the Advising Council for National Transition, an institution dependent of the President of the government Catalonia, recognizes that if the new Catalan state is not in the EU, the central bank of Catalonia (BdC) will not be a member of the ESCB and the financial entities with its head office in Catalonia will have no access to the standing facilities of the ECB. They will also be excluded of being counterparties of the European Central Bank (ECB) in financing operation. Moreover, the assets issued in Catalonia (included public debt issued by the Catalan government) will not be acceptable as collateral in any operations with the ECB. Of course, the BdC would be solely responsible for setting the operative rules within Catalonia and supervising all financial entities having their head office in Catalonia.34
How would the financial entities whose head offices are in Catalonia at present react to this frightful scenario? Obviously, they will move their head office to other States in the EU, most probably to Spain, to retain access to standing facilities and participate in open market operations with the ECB. Of course, they will operate following ECB rules and their operations will be supervised by the ECB. Notice, however, that they will have no incentive whatsoever to hold assets issued in Catalonia that cannot be used as collateral in their operations with the ECB. On the other hand, these entities (as well as financial institutions whose head office is in other regions of Spain at present but operate in Catalonia) will set up subsidiaries to run their operations in Catalonia that will be supervised by the BdC. Of course, Catalonia’s fiscal agency will collect only the corporation taxes obtained by these entities for their operations in Catalonia. I have no notice that any of the economists in favour of independence have taken into account the loss of revenues it might result for the Catalan state Treasury.
There are also good reasons to expect that this serious shake up of Catalonia’s financial system will raise interest rates and financial costs for companies, households and the Catalan public administrations. The last financial crisis has shown that the spread of interest rate differentials increases considerably when there is uncertainty regarding the economic prospects of a state. In those circumstances, public and private agents have to pay high premium risks to place their debt
33 See, Berg and Borezstein (2000). 34 See, CATN (2014), p.7.
The political economy of Catalan independence
100
emissions or have access to bank credit as the cases of Spain and Italy (not to mention Greece or Portugal) have shown. The confidence that Catalonia, a new state in process of constitution and excluded from the EU and the Euro zone, would offer to investors are nil in comparison. To the instability arising from the intense political conflicts that emerge during a constitutional process, one has to add the economic uncertainty that brings in setting anew a comprehensive public administration, including a fiscal agency that would be the sole responsible for collecting taxes and a central bank that would be the sole responsible for supervising the activities of financial entities. There is no way to escape to the conclusion that the public administrations, financial entities and private companies will have to pay higher risk premium to issue debt or obtain credit in the new Catalan state. And higher interest rates, other considerations aside, imply lower investment.
Independence will also affect the balance sheets of private agents. Households and companies will prefer to hold their deposits in financial entities whose head offices are in the euro zone. Even if the BdC matches the Euro zone deposit insurance limit, there is no guarantee that the new state will make good his promise. Household and companies would feel safer keeping their deposits in offices located within the Euro zone. Moreover, 45.5 percent of Catalans consider themselves at least as Spaniards as Catalans and many of them may prefer to keep their assets in Spain. On the other hand, the likely reduction in exports to the ROS and REU and in inbound tourism and the fall in investment will reduce economic activity curtailing deposits and credits and the balance sheets of Catalan financial institutions. Finally, there is the risk that deposits in Catalan financial entities may end up being forcibly converted into a less valuable currency, if the BdC is compelled to introduce a new less valuable coin to cope with large capital outflows.
5.2. Effects on foreign investment, money supply and financial stability
Multinational firms located in Catalonia have being the destination of large flows of foreign direct investment in the past. Many of those firms in the automotive, petrochemical and pharmaceutical sectors are responsible for a large share of Catalonia’s exports to the ROS and other EU countries. The industrial tradition and the strategic location of Catalonia, close to France and good access to the Mediterranean may lost their punch if Catalonia is left out of the EU and the Euro zone. Direct investment flows might found their way to other locations in the ROS or other EU countries to avoid EU custom duties and other administrative barriers, especially if the new state does not faithfully comply with EU regulations. The loss of interest of Catalonia as a destiny for foreign investors would be reinforced if companies have to pay higher interest rates to cope with political instability and economic uncertainty. The fall in direct investment would in turn reinforce the negative effects on the productivity and profits of financial entities caused by the loss of exports and tourism and the surge in capital outflows.
The three effects discussed above (the fall in exports and the worsening of the trade balances with the ROS and REU, the restructuring of balance sheets and capital outflows and the reduction in foreign direct investment) will reduce the amount of money (legal tender plus deposits) in the Catalan economy. A shrinking economy with higher interest rates and a dwindling money supply are the bleak economic prospects for the new state in the medium term. It is hard to escape to the conclusion that the BdC will sooner than later end up imposing capital controls to avoid massive capital outflows before introducing a new currency assuming a substantial devaluation with regard to the Euro and the dollar. Those agents with debts in Euros and dollars will suffer severe losses.

Catalonia: The secessionist challenge and the economic consequences of independence
101
5.3. Fairy tales
The ‘eurization’ of the Catalan economy is at best a very risky adventure that will affect the structure of the financial system, interest rates, balance sheets and capital flows, foreign investment and the money supply. It is very likely that the BdC will end up introducing its own currency what will be an additional impediment to enter the EU. Of course, most of these consequences would not occur if the process of independence was backed by the Spanish government and done under the auspices of the EU. And this is what Galí (2013) and most economists in favour of independence take for granted. He examines four possible cases. In the first two, he assumes that Catalonia will be in the EU from its constitution as a new state or that it will sign agreements with the EU with similar practical effects. Since the Spanish government has firmly expressed its opposition to the independence of Catalonia and all high officials in the EU Commission have repeatedly indicated that if Catalonia becomes independent it will be out of the EU and the new Catalan government would have to ask for admission, neither of the two scenarios are likely to occur. In the fourth scenario, Galí assigns a positive probability to Spain leaving the Euro zone before Catalonia becomes an independent state and he warns of the serious consequences it would have on the Catalan economy being left out of the EU. In order to avoid them, he suggests to declare Catalonia independence at the very moment Spain losses its membership! It is hard to believe that a sound economist may entertain himself with such absurdities. Curiously enough, it is the third and more likely scenario, namely that Catalonia declares unilaterally its independence from Spain, Spain remains in the EU and Catalonia is out of the EU (and the Euro zone) for some time, the one Galí pays less attention. To avoid spelling out the serious consequences it would have on the financial system and the Catalan economy in general, Galí assumes that Catalonia would sign a monetary agreement that would allow the new state to enjoy a similar status to that of Monaco, the Vatican, Andorra or Kosovo. Of course, there is not the slightest hint that that the EU has ever considered such a possibility.35
5.4. Conclusions
Denying the institutional reality of the EU and the binding character of the in force EU treaties and assuming that the EU will make exceptions “to preserve the reciprocity of rights” is simply nonsense. It is ridiculous to confound Catalan citizens presenting the unilateral drive towards independence of one of the richest regions of a member state of the EU with the reunification process of Germany, or to assimilate the situation of Spain, one of the oldest and largest states of Europe, to that of Monaco, The Vatican, Andorra or Kosovo. If the government and Parliament of Catalonia declares unilaterally the independence and the Spanish government does not abort the process, Catalonia will be left out of the EU and the Euro zone for a considerable period of time. In this scenario, what can be expected is a sort of ‘normalization’ of trade relations to the new situation that would imply lower exports to Spain and the EU, movements of companies and financial entities head offices to EU countries, capital flight and less foreign direct investment. The consequences in terms of production, value added and employment lost would be at best severe and might become disastrous if the Catalan government ends up introducing its own money.
35 There is also a fifth scenario that Galí plainly ignores. In the hypothetical case that Catalonia’s government declared unilaterally the independence, the Spanish Government might respond to the challenge by adopting the appropriate measures to reestablish the constitutional order. In this case, most of the negative economic consequences of independence can be avoided but it cannot be discarded social and political unrest that might harm the Spanish economy.

The political economy of Catalan independence
102
6. Catalonia’s fiscal balance and the fiscal dividend of independence36
Even their most fervent supporters have to admit that independence will bring in no positive
stimulus to the Catalan economy. Therefore, their economic case in favour of independence hangs on two very questionable believes. First, it is the bizarre notion that since independence can be reached without breaking the economic and monetary ties with Spain and the EU, the expected losses will accordingly be small. Our analysis in the preceding sections indicates that assuming that Catalonia will be in the EU or enjoy a status similar to EU and Euro zone members is out of question. It also forcefully suggests that if Catalonia stays out the EU for several years, its economic base and financial system will suffer severe and probably irreversible damage. Second, economists in favour of independence take the largest estimate of Catalonia’s fiscal deficit (CFD) with the State Central Administration (SCA), calculated by the own Catalan government, as irrefutable evidence of Catalonia’s being systematically sacked by the SCA. They naively conclude that those resources ‘taken away’ from Catalans will be at the disposal of the new Catalan state and more than compensate the expected losses resulting from independence. This section is dedicated to examine the reliability of CFD estimates and the soundness of the concomitant belief that these resources, suggestively labelled ‘the fiscal dividend of independence’, will be available to the new Catalan state. 6.1. On the concept of fiscal balance and fiscal deficit
The fiscal balance can be generally defined as a double entry table showing the contributions made by citizens to sustain the public administration and the returns they obtain from it. The difference between contributions made and compensations drawn is their net contribution. It would be more appropriate to call it citizens’ surplus with the administration but since it is customary to call it fiscal deficit will keep this terminology. A major difficulty to calculate the fiscal balance for a single citizen or any subset of them is to determine their actual contributions made to and the actual returns received from the administration. As it is well known, determining who really supports the contributions made to the public administration (mainly taxes) and who receives the benefits (money transfers, in kind transfers, infrastructure services, etc.) from public expenditures is one of the hardest tasks in public finance.
Fiscal balances are often calculated using both the monetary flow (MF) and the cost/benefit flow (C/BF) methods. Under the MF methodology only monetary contributions and returns are taken into account while the C/BF methodology includes other non-monetary contributions and compensations. The results obtained with both methods can differ considerably, especially when the returns come from public goods whose production is concentrated in a particular level of the administration. Most economists, however, deem the C/BF method is the sole one that provides a fair picture of the contributions made by citizens and the returns they receive from the administration. In both cases, crude incidence hypothesis and rough indicators are used to impute the contributions made by citizens and the benefits they receive. What can be expected from these coarse calculations in general? That wealthy people with high incomes will present fiscal deficits.
36 Polo (2014), pp. 50-72, examines in detail these issues.

Catalonia: The secessionist challenge and the economic consequences of independence
103
6.2. Catalonia’s fiscal balance and fiscal deficit with the State Central Administration
In the case of Catalonia’s fiscal balance (CFB) with the SCA, the table would ideally include all contributions made by all citizens registered as residents in Local government offices in Catalonia to the SCA and all the compensations obtained by those citizens from the SCA. It should be made clear that Catalans citizens are treated by the SCA on equal terms with the rest of Spaniards, paying exactly the same State taxes and receiving exactly the same compensations.
The Catalan government publishes regularly the CFB and Table 5 shows the results with the two methods for the four most recent years. It can be seen that the MF and the C/BF methods provide very different measures of the size of CFD. Notice also the substantial difference between the imputed fiscal deficit and the neutralized fiscal deficit. Not surprisingly, economists in favour of independence take the largest of these figures corresponding to the neutralized fiscal deficit obtained with the MF methodology and accept it as an irrefutable proof that Catalonia is submitted to the systematic plunder of SCA. Even high government officials in Catalonia and many economists in favour of independence have employed the catch phrase ‘Spain robs us’ to arouse Catalan’s animosity against the rest of Spaniards and strengthen their desire of independence. They Catalan government claims that around 16,000 million euro (8 percent of Catalonia’s GDP) are taken away from every year, resources that –so they tell Catalans– could be employed to improve public services and Catalonia’s infrastructures, raise pensions and lower taxes. Table 5. Fiscal balance of Catalonia with the State Central Administration, 2008-2011
Monetary flows Cost-benefit flows
2008 2009 2010 2011
2008 2009 2010 2011
Imputed contributions (million Euro) 51,778 46,195 51,164 47.725 50,783 45,184 50,093 46,859
Imputed contributions / State total (%) 19.34 19.25 19.35 19.22 18.97 18.83 18.95 18.87
Imputed returns (million Euro) 40,203 45,403 45,329 39.903 44,440 49,199 49,319 42,827
Imputed returns / State total (%) 13.55 14.14 14.18 13.97 14,97 15.33 15.43 14.99
Imputed fiscal deficit (million Euro) 11,575 792 5,835 7,822 6,343 -4,015 694 4,032
Imputed fiscal deficit / GDP (%) 5.7 0,4 3,0 3,5 3.2 -2.1 3,6 2.0
Fictitious contributions 5,625 15,617 10,708 7,184 5,517 15,276 10,516 7,055
Neutralized fiscal deficit 17,200 16,409 16,543 15,006 11,860 11.261 11,258 11,087
Neutralized fiscal deficit / GDP 8,5 8.4 8.5 7,7 5,9 5,8 5,8 5,7
Source: DEC (2014, 2013 and 2012).
6.3. The role of the spatial dimension
To the usual difficulties to determine the incidence of taxes and the recipients of benefits in a national economy, the spatial dimension of the CFB with the SCA adds new complications. The fact that Catalonia is a region of Spain and goods, services, people and capital can freely move within its boundaries makes even harder to determine which are the contributions and benefits of a particular subset of citizens, the Catalans in this case, with a particular level of the administration, the SCA in this case.
To begin with, notice that the ‘subset of Catalans’ changes continuously making even more complex and hazardous the task of calculating the CFB and interpreting the resulting fiscal deficit. Let us consider the case of an immigrant who lived and worked in Catalonia throughout his

The political economy of Catalan independence
104
working life but receives his pension in Murcia, Andalusia or Galicia where he lives after retirement. In this case, CFD is inflated both during his working-life (taxes paid are mainly imputed as contributions of ‘Catalonia’ to the SCA) and after retirement (pension transfer by the SCA is not considered a benefit for ‘Catalonia’). However, no serious economist would dare to assert, as economist in favour of independence do, that Catalonia is being sacked by the SCA. Taxes are paid and benefits received not because citizens are Catalan or Andalucian but because they are Spaniards.
The treatment of infrastructure expenditures by the State serves also to pinpoint the lack of rigor of the CFB calculations. Although the Catalan government does not explain how it obtains the two figures assigned to Catalonia in 2009, 1,387 million following the MF methodology and 1,490 million following the C/BF methodology, one can deduce from the vague explanatory remarks that State investment is mainly assigned among Spanish regions using the investment data completed in each region.37 The tiny difference between the two methodologies, 103 million, indicates that the most benefits accounted in the C/BM are the monetary investment completed within Catalonia boundaries. This conclusion is perplexing. According to the results presented in Tables 2-4 in Section 5, direct and indirect production required to produce Catalonia’s exports to the ROS account for 36.94 percent of primary production, 46.09 percent of industrial production and 37.21 percent of private service production. However, the benefits obtained from infrastructures investment completed out of Catalonia’s boundaries amount to just 103 million euro a year. It is simply embarrassing! For an export oriented region like Catalonia it may be more important to construct infrastructures in other regions to facilitate its exports than to complete investments within Catalonia.
Second, the spatial dimension introduces another sort of complication. In a closed economy, it is fair to assume that taxes are supported by tax-payers and benefits accrue mainly to national citizens. However, this is not the case in an open economy like Catalonia where taxes collected in Catalonia may be supported by citizens in other Spanish regions or even in other countries. In some cases, like the value added tax and other excise taxes, rough consumption indicators are used to assign consumption taxes among regions. But this is not the case for the personal and corporation income taxes and Social Security contributions (SSC). Let us consider, for instance, how employers’ SSC are treated in the CFB. The Catalan government assumes that 50 percent is supported by employers and 50 percent per employees in the C/BF methodology.38 The figures included in the CFB are then obtained multiplying the first 50 percent subtotal by Catalonia’ share in the national Gross operating surplus and the second 50 percent subtotal by Catalonia’ share in total employers’ SSC taxes. Of course, since most products and services produced in Catalonia are exported to the ROS and other countries, those taxes included in the CFB are collected in Catalonia but they are not supported by Catalans. It is totally out of place to consider those taxes as revenues taken away from Catalans, or to take for granted that if Catalonia becomes an independent state those taxes included in the prices paid by other Spaniards will be at the disposal of the Catalan state.
My last comment is that the rough and biased indicators employed in the CFB imply that Catalonia will necessarily have a deficit greater than 5 percent of Catalonia’s GDP under the C/BF
37 See, DEC (2013), Tables 3.1.3, 3.1.4 and 3.1.5, pp. 37-39. 38 See, DEC (2013), Table 2.3.3, p. 26.

Catalonia: The secessionist challenge and the economic consequences of independence
105
methodology.39 In effect, most indicators used to impute Catalonia’s contributions to the SCA are Catalonia’ shares in GDP and other macroeconomic variables closely related to GDP (consumption, gross operating surplus, gross wages, etc.); however, the indicators employed to impute the compensations obtained by Catalans from the SCA expenditures is the population share or a lower figure. Since Catalonia’s GDP share is 19.9 percent according to the IDESCAT while its population share is 15.02 percent, the systematic application of these indicators implies that the resulting CFD will be between 5 and 6 percent of Catalonia’s GDP, i.e., between 10.000 and 12.000 million, using the C/BF methodology. The figures included in Table 5 are close to 11.000 million. Of course, the figures are considerably greater when the FM methodology is employed since the shares applied to calculate the monetary benefits received by Catalans from the SCA are often zero.
6.4. A closer analysis of the CFB results
Even accepting the incidence hypothesis and the rough criteria used to impute contributions and returns in the CFB, the figures published by the Catalan government and the resulting fiscal deficit are far from being unquestionable data. The first comment is that the fiscal deficit resulting from the imputations is 792 million with the MF methodology and -4,015 million with the C/BF methodology, in 2009. These figures differ greatly of the deficit estimates published by the Catalan government, namely, 16,409 million with the MF methodology and 11,261 million with the C/B methodology. In particular, the highly publicized figure of 16,409 million is the result of two adjustments that also bias upwards Catalonia’s fiscal deficit with the SCA.40
First, the Catalan government discards from the SCA budget both financial revenues and expenditures of the SCA and the revenues and expenditures of the SCA with the EU. It turns out that in both cases the SCA has positive surpluses. The practical consequence of these exclusions is that the SCA deficit is increased in 3,461 million on average in the period 2006-2009. Since the Catalan government ‘neutralizes’ the SCA fiscal deficit to calculate the CFD, it turns out that increasing the SCA deficit raises the CFD in 625 million on average during those years. In my view, it is a complete absurdity to exclude those items from the SCA to inflate the SCA deficit and conclude after excluding them that the CFD is 625 million larger than it is, implying as the Catalan government does that those resources are taken away from Catalans.
The second adjustment consist in including in the CFB what I call in Table 5 ‘Fictitious Contributions’, a figure obtained after imputing to Catalonia its share of the SCA deficit. The figures imputed are 15,617 million with the MF methodology and 15,276 million with the C/BF methodology in 2009. The effect of this adjustment is that the small CFD obtained with the FM methodology (792 million) and the substantial surplus calculated with the C/BF methodology (4,015 million) are transformed into huge deficits, 16,409 million with the MF methodology and 11,261 million with the C/BF methodology. It is worth noticing, as Zabalza (2012) pointed out, that no Catalan, has ever paid those fictitious contributions to the National Tax agency and they will not be available to the future Catalan tax agency unless tax rates are raised.
39 The figures obtained are downward biased for two reasons. First, a close scrutiny of the expenditures considered by the Catalan government indicates that some expenditures items of the Social Security Administration are inappropriately excluded. Second, there are better indicators available than the population share to impute the benefits received by Catalans from the SCA in some cases that would result in larger benefits.
40 See, Stop Espoli (2012).

The political economy of Catalan independence
106
Moreover, out of two obvious ways that can be used to neutralize the SCA deficit, the Catalan government chooses raising taxes rather than reducing expenditures. Since Catalonia’s contribution share is much larger than Catalonia’s return share, neutralizing raising taxes artificially inflates CFD. Vilalta (2012) shows that CFD falls from 16,409 to 12,261 million using the MF methodology and from 11,261 to 8,429 million in 2009 employing the C/B methodology. Thus, even accepting the adjustments made by the Catalan government of the SCA budget and the incidence hypothesis and rough indicators used to impute contributions and returns, the CFD is just 6.34 and 4.36 percent of Catalonia´s GDP.41 Polo (2014) calculates that when the actual SCA budget figures instead of the observed ones are employed, the CFD is 8,415.78 million with the MF methodology and 7,972.11 million with the C/BF methodology or 4.35 and el 4.13 percent of Catalonia’s GDP. These figures could be even smaller were more appropriate incidence hypothesis and imputation criteria be used.
6.5. The independence’s manna
There is no guarantee whatsoever that the estimated CFD will be at the disposal of the Catalan state after achieving independence. As we have shown, the deficit figures calculated by the Catalan government are obtained making rather arbitrary adjustments to the SCA budget figures, adopting questionable incidence hypothesis and rough indicators to impute Catalan’s contributions and returns, and include fictitious contributions that Catalans have never made effective in the State Fiscal Agency. It is simply not true that 16,000 million or 8 percent of Catalonia’s GDP are taken away by the State every year. Catalans are in all probability net contributors to the State and that is what one would expect given that their GDP per capita is 25 percent larger than the rest of Spaniards’ GDP per capita.
Not only are questionable the figures produced by the Catalan government, but even more doubtful is the notion that the revenues imputed will be at the disposal of the Catalan government once achieved the independence. For that to be true, it is necessary to assume that Catalonia’s imputed contributions to the SCA will undergo no changes after independence and the Catalan government would provide the same returns to Catalans with the expenditures imputed to the SCA. Both assumptions are heroic. If Catalonia is out of the EU and the Euro zone for several years, exports, production, value added and employment will fall, Catalan companies and financial entities will move their head offices and even production facilities out of Catalonia, households and firms will locate their wealth in safer countries and there will be less direct foreign investment. All these changes will have in turn a dramatic effect on tax basis and tax revenues collected by the Catalan government. On the other hand, the zero or meagre expenditures imputed to the SCA in Catalonia will have to be supplemented by the Catalan government to provide Catalans with the same services (defence and police, foreign service, justice, social security, infrastructure investment, etc.) now provided by the State.
None of the economists in favour of independence have taken seriously the task of estimating the revenues and the expenditures of the Catalan state in a realistic setting. As a general rule, they assume that the same revenues now imputed to the SCA by the Catalan government will be available to the new State after independence and they clearly undervalued the expenditures required to run a totally independent public administration whose institutions are not even clearly defined. It is rather hilarious to hear from the actual president of Catalonia that the Catalan state will have no army of its own but it will hire the services of the Spanish or the French armies to
41 Vilalta (2012). According to my own calculations the figure is 8,415.8 instead of 8,429 million.

Catalonia: The secessionist challenge and the economic consequences of independence
107
guarantee its defence. He did not say how much is willing to pay for! But not much more credit deserves the frivolous calculations done by economists in favour of independence.42
7. General conclusions
The first main conclusion which arises from our brief overview of Catalonia’s economic history
is that Catalonia is one of the most prosperous regions of Spain and the EU today. As economic historians have exhaustively documented, the main driving force of its successful development has been the emergence of a national market, ten times larger than its own domestic market, since 1714 onwards. A national market, let us recall, protected by high custom duties and other barriers to trade until thirty years ago, where Catalan companies could sell their manufactures and industrial products in advantageous conditions. Catalan traders, producers, and entrepreneurs also benefited of the trading opportunities that offered the Spanish American colonies, including the profitable slave trading, especially after 1765 and 1778 when they could legally trade with the colonies directly from Catalan ports.43 It was thanks to the Spanish market how Catalonia turned into the ‘workshop of Spain’ and its more prosperous region by the end of the 19th century. Unfortunately, there are not estimates of Catalonia’s trade surpluses with the rest of Spain at the time when Catalonia’s economic pre-eminence and dependency on the Spanish market reached its peak, although the probably amounted to 20 percent of GDP. Even at the start of the 21st century, the trade surplus is close to 10 percent of GDP, figure substantially above the biased and inflated MF estimates of Catalonia’s fiscal deficit with the Central Administration.
Second, the unilateral declaration of Catalonia’s independence will have important economic consequences for Catalonia and the well being of its citizens. Assuming that the Spanish government does not adopt the appropriate measures to re-establish the constitutional order, Catalonia will be a new state excluded from the EU and other international organizations.44 Looking at the experience of recent disintegration processes in Europe, it is rather natural to assume that breaking the political ties with Spain will have a very negative impact on Catalonia’s economic basis. Assuming exports to the ROS were halved within the next five years following independence, production would fall 25 percent in the primary and industrial sectors and 19 percent in the private service sectors. To these effects one has to add the fall of exports to other EU states, the likely contraction of national and international arrivals of tourists, and likely changes in head offices and even production facilities of Spanish and other multinational companies. Economists in favour of independence contend that it is not in the interest of Spain and the EU to break up their economic ties of Catalonia. They seem to forget that is Catalonia the least interested of all in breaking the close economic ties with Spain and being left out of the EU. Catalonia would be the big looser of the game, while the damages to other EU countries, including Spain, would be relatively smaller and easily reversible.
42 In addition to the already mentioned studies CCB (2014) and Bosch and Espasa (2014), one can mention Ros Serra (2013) manuscript. The common thread in all these analysis is that they accept the revenue figures calculated by the Catalan government and assume they will be at the disposal of the Catalan state. 43 Martínez Shaw (1980) documented that Aragoneses and Catalans, notwithstanding the centralization of the traffic with the colonies in Seville and Cadiz, actively participated in the colonial trade from the very moment of their discovery. 44 This is, in my view, a rather artificial scenario since I take for certain the Spanish government and the Senate will stand by and adopt the appropriate measures to keep the constitutional order.

The political economy of Catalan independence
108
Third, the impact of staying out of the EU would also be dramatic for Catalonia’s financial sector. Financial entities with head offices in Catalonia will move their main headquarters to Spain where they already hold licenses to operate and create subsidiaries to run its operations in Catalonia. Of course, they will declare and pay taxes for the bulk of their profits in Spain. Uncertainty on the economic prospects of an economy out of the EU with no political and administrative experience running the Treasury and the Central Bank will raise the risk premium households, companies and the public administration have to pay for credits. Furthermore, all private agents will also look for safer harbours for their assets in other EU countries setting in motion an outflow of capitals that may end up with the establishment of capital controls as a first step towards the introduction of currency on its own.
Fourth, the notion that Catalonia’s fiscal deficit with the State Central Administration (SCA) will become the independence manna is untenable. To begin with, the deficit figure is obtained using questionable incidence hypothesis and applying rough and biased indicators with the purpose of inflating Catalonia’s contributions to the SCA and reducing to its minimal expressions the returns Catalans receive from the SCA. But even accepting their imputations, it is enough to include all revenues and expenditures of the SCA and neutralize the public deficit lowering expenditures instead of raising taxes to obtain a fiscal deficit inferior to 4.5 percent of GDP instead of 8.0 percent using the MF methodology. This result reinforces the conclusions drawn by Uriel and Barberán (2007) and De la Fuente (2014) that suggest that when one compares the fiscal deficits and the relative income per capita of Spain’s autonomous Communities, it turns out that Catalonia falls just on the regression line. In other words, Catalonia has the fiscal deficit one could expect from its relatively high income per capita. As already mentioned, the fiscal deficit is also well below the most recent estimates of Catalonia’s trade surplus with other regions (9.5 % of GDP in 2013). Even if a were an apostle of Catalonia’s independence, the first thing I would do is to obtain more reliable estimates of the revenues Catalans actually contribute to the SCA and the returns they actually receive from the SCA, employing more reliable incidence hypothesis, subtler and less biased indicators and neutralization rules. Then, I would make an objective assessment of how independence would affect the economic activity and the financial system, without cheating oneself and facing the grim fact that Catalonia will stay out of the EU for several years. Next, I would estimate the impact of the aforementioned changes in economic activity on the revenues collected by the Catalan state. Finally, I would make a fair assessment of the administrative costs of setting up a national administration capable of collecting citizens’ contributions and providing all the services they receive now. If I am right in my assessment of how independence would cut down exports and production and reshuffle Catalonia’s financial system, there is not the slightest chance that the Catalan state may uphold the promises made to improve public services, pensions and infrastructures with the contributions ‘taken away’ from Catalonia now.45
Fifth, the conceptual and practical difficulties to dissolve and liquidate the political and economic union hold for the last 300 hundred years are insurmountable. It will be very complex to
45 Economists in favor of independence also maintain that the Catalan Social Security system will be viable. As usual, they take for granted that the upward biased revenue and downward biased expenditure figures concocted by the Catalan government provide a reliable guide of revenues and expenditures of the Catalan Social Security system after independence. They also point to the higher occupation and lower unemployment rates of Catalonia to back their conclusion that the Catalan state will have financial capacity to maintain the Social Security system. They, of course, discard the possibility that Social Security contributions and other tax revenues might drastically fall along with production, employment and value added; they also fail to account for the additional expenditures required to run the system. Politicians, however, seem to be in the retreat. In a recent TV interview, the Catalan president conceded that cuts in public services and pensions will be upheld after independence, contrary to his initial promises; and the journalist replied to him: ‘I am not very interested in your new state’.

Catalonia: The secessionist challenge and the economic consequences of independence
109
compile the list of common assets and debts accumulated, but even more so to accord how they should be valued to determine the net position of the two ‘shareholders’ and agree on a practical scheme to dissolve the union.46 Let me just mention a few problems. Will the list of assets include all hospitals, schools and universities, infrastructures, etc., gratuitously transferred by the Central government to the autonomous Catalan government since 1978? Will the Catalan state honoured the pension benefits acquired by Spaniards that worked in Catalonia before the secession? Will the Catalan government commit itself to pay economic reparations to those Spaniards who want to emigrate leaving their homes, jobs, businesses and properties in Catalonia? Will the delicate financial condition of the new state allow it to issue its own debt in order to assume its share of Spain’s public debt? Will the Catalan government guarantee the free access of Spaniards to infrastructures build as networks during the last 300 years? On these important issues, economists in favour of independence have made no constructive proposals until now. Instead, Sala i Martin (2012) has openly threatened to close Catalonia’s highways to blockade Spanish products bounded to Europe and to repudiate Catalonia’ share of the Central State debt, unless Spain backs the entrance of Catalonia into the EU. The most radical advocates of independence even welcome the possibility that Catalans who consider themselves Spaniards rush out of Catalonia, like the Jews and Moorish in the 16th century, leaving behind their jobs and properties without receiving any compensation for them.
Economists who do not share the self-complacent picture drawn by those in favour of independence are not a bunch of ‘fear agitators’, as they like to call us, but professionals used to distinguish facts from fancy that employ standard economic reasoning and models to assess the likely consequences of independence. An independent Catalonia, in the unlikely case that the Spanish Government and Senate did not abort the insurrection, would stay out of the EU for a considerable period of time, and serious economists should accept this fact instead of assuming that business will go on as usual. All the attempts of the Catalan government to seek out some complicity from EU leaders and institutions or to obtain some international reconnaissance of Catalonia’s right to independence have ended in resounding failures. Only ideological compulsion and the need to present a rosy picture of the prospects of the Catalan economy after independence, promising Catalans immediate gains to gather popular support for the adventure, explain the desperate efforts of economists in favour of independence to minimize the negative impacts of independence on the real economy and the financial system, and to inflate Catalonia’s fiscal deficit and the fiscal dividend of independence.
Conclusions drawn taking for granted that Catalonia will remain in the EU and the economic and monetary ties with Spain, the rest of the EU and the ECB will be preserved after independence are as irrelevant as the calculations of the altitude reached by a rocket ignoring air friction. The process of setting up the institutions and the administration of the new state after a unilateral declaration of independence will raise political instability and generate considerable uncertainty for companies and investors. With Catalonia out of the EU, its exports to Spain and other EU countries will fall dramatically and companies and financial entities will move their head offices and production facilities to locations within the EU boundaries. Households and companies will pay higher risk premiums on credits in Catalonia and they will look for safer places to hold their assets. It is only a matter of time until the Catalan government will set capital controls up and end up introducing its own currency. Historical experience shows that secession processes are very
46 For a more detailed discussion see Polo (2013b).

The political economy of Catalan independence
110
risky adventures: one knows when they start but not how and when they end up. Catalans have nothing to gain and much to lose.
Catalonia: The secessionist challenge and the economic consequences of independence
111
References
Albareda i Salvadó, J., Història de la Catalnya Moderna, Universidad Oberta de Catalunya,
Barcelona, 1999. Alcaide Inchausti, A. (2003), Evolución económica de las regiones y provincias españolas en el siglo
XX, Fundación BBVA: Bilbao. Antràs, P and Ventura J. (2012): “Dos más dos son mil. Los efectos comerciales de la independencia”, http://wilson.cat/es/comunicats-conjunts/item/215-dos-m%C3%A9s-dos-s%C3%B3n-mil-els-efectes-comercials-de-la-independ%C3%A8ncia.html. Bustelo, “La población de Cataluña en el siglo XVIII”, Hacienda Pública Española, núm. 38, 1976, pp. 81-91. Berg, A. and E. Boresztein (2000), “The pros and cons of full dollarization”, IMF WP/00/50. Bosch, N. and M. Espasa, “La viabilidad Económica de una Cataluña independiente” en Revista de Economía Aplicada, núm. 64 (v. 22), 2014, pp. 135-162. Carreras, A. (1990), “Cataluña primera región industrial de España” in J. Nadal y A. Carreras (direction and coordination), Pautas regionales de la industrialización española (siglos XIX y
XX), Chp. 9, pp. 259-295. Ariel: Barcelona. Carreras, A. (2005), “Industria” in Carreras, A. y X. Tafunell (Coords.), Estadísticas Históricas
de España (second edition revised and extended, v. I., Chp. 5, pp. 357-453. Fundación BBVA: Bilbao. Carreras, A. and J.R. Rosés (2005), “Renta y Riqueza” in Carreras, A. y X. Tafunell (Coords.), Estadísticas Históricas de España, v. III, second edition, revised and enlarged, Chp. 17, pp. 1297-1376. Fundación BBVA: Bilbao.
CCC (2014) Cambra de Comerç de Barcelona, “El sector public a Catalunya i Espanya. Impacte Econòmic de differents escenaris polítics”, Document de Treball 28/03/14, Cambra de Comerç de Barcelona, Barcelona, pp. 1-81. CIS (2013): Postelectoral de Cataluña, Elecciones Autonómicas 2012, Avance de Resultados. Estudio nº 2970, noviembre de 2012 - febrero de 2013. De la Fuente, Á. (2013): “¿Está Cataluña maltratada fiscalmente?” en La cuestión catalana II.
Balanzas fiscales y tratamiento fiscal de Cataluña, pp. 11-29. Barcelona: Instituto de Análisis Económico. Feliu, G, Història econòmica de Catalunya, Editorial Base, Barcelona, 2012. Fidrmuc, J. y Fidrmuc, J. (2003): “Desintegration and Trade”, Review of International Economics, 11(5), 811-829.
Fidrmuc, J. and Horváth, J. (1998): “Stability of monetary unions: Lessons from the break-up of
Czecholovaquia”, manuscrito, Tilburg University. Fontana, J., 4ª ed., Cambio económico y actitudes políticas en la España del siglo XIX, Ariel,
Barcelona, 1981. Fundación BBVA (1999), Renta nacional de España y su distribución provincial. Serie homogénea.
Años 1955 a 1993 y avances 1996 a 1999. Fundación BBV: Bilbao. Fundación BBVA (2000), Renta nacional de España y su distribución provincial. Serie homogénea.
Años 1955 a 1993 y avances 1994 a 1997. Fundación BBV: Bilbao. Galí, J., “Estat propi i euro”, 19 de marzo 2013. http://www.wilson.cat/es/mitjans-escrits/articles-dels-membres/item/222-estat-propi-i-euro.html Martínez Shaw, C. (1980), “Cataluña y el comercio con América. El fin de un debate”, Boletín
Americanista, 30, pp. 223-235.

The political economy of Catalan independence
112
Maluquer de Motes, J. (1998), Historia Econòmica de Catalunya. Universitat Oberta de Catalunya-Proa: Barcelona. Nadal Oller, J. (1985), “Cataluña, fábrica de España” en Nadal Oller, J. and J. Maluquer de Motes, Catalunya la fàbrica d’Espanya. Un siglo de industrialización catalana (1833-1936). Ayuntamiento de Barcelona: Barcelona. Nadal, J. (1987), “La industria fabril española en 1900. Una aproximación” en J. Nadal, A. Carreras y C. Sudriá (compiladores), La Economía española en el siglo XX. Una perspectiva histórica, 5ª edición, 1990, pp. 23-61. Ariel: Barcelona. Nadal Oller, J. and J. Maluquer de Motes (1985), Catalunya la fàbrica d’Espanya. Un siglo de
industrialización catalana (1833-1936). Barcelona: Ayuntamiento de Barcelona. Nadal, J. (1985), “Un siglo de industrialización en España, 1833-1930”, en La modernización
Económica de España 1839-193. Madrid: Alianza Universidad. Nadal, J. y G. Tortella (1974), Agricultura, comercio colonial y crecimiento económico en la España
contemporánea. Ariel: Barcelona. Polo, C. (2013a): “El peso de las exportaciones en la economía catalana” en La cuestión
catalana, hoy, pp. 65-84. Madrid: Instituto de Estudios Económicos. Polo, C. (2013b): “La eurización de la economía catalana” en La cuestión catalana, hoy, pp. 85-102.Madrid: Instituto de Estudios Económicos. Polo, C. (2013c): “El capital público y la deuda pública: dos facturas olvidadas por los independentistas” en La cuestión catalana, hoy, pp. 103-118. Madrid: Instituto de Estudios Económicos. Polo, C. (2014a), “Panorámica del argumentario economicista a favour de la independencia” en La cuestión catalana II, IEE, Madrid, 2014, pp. 29-93. Polo, C. and E. Valle (2009), “Estimating tourism impacts using input-output and SAM model in the Balearic Islands”, in Advances in Tourism Economics. New developments, Matias A., P. Nijkamp and M. Sarmiento (eds.), 121-143. Heildelberg: Pysica-Verlag. A Springer Company. Polo, C. and E. Valle (2012), “Input-output and SAM models”, in Handbook of research
methods in tourism, Dwyer, L., A. Gill and N. Seetaram (eds.), 227-260. Cheltenham: Edward Elgar Publishing Limited. Rodríguez Mora, J.V., “Los costes de romper España” en El coste de la No-España. Razones para un proyecto de vida en común, Fundación Progreso y Democracia, Madrid, 2013, pp. 79-112. Ros Serra, D. (2013): “Hisenda i Pressupostos del nou estat”, Sectorial d’Economia de l’Asamblea Nacional Catalana, Documents de Treball d’Economía, Sant Cugat del Vallès, pp. 1-55. http://economistes.assemblea.cat/wp/wp-content/uploads/2013/02/Hisenda-i-pressupostos-del-nou-Estat.pdf.
Sala i Martín, X., “Dos imágenes que demuestran que Catalunya independiente estará en Europa”, 4 de noviembre 2012, http://salaimartin.com/randomthoughts/item/467-dos-im%C3%A1genes-que-demuestran-que-catalunya-independiente-estar%C3%A1-en-la-ue.html. Simón i Tarrés, A. (1995), “La població de Catalunya a principis del segle XVIII. Velles i noves estimacions”, en Simón i Tarrés, A. La població catalana a l’edat moderna. Deu estudis, Universitat Autónoma de Barcelona Barcelona, pp. 77-88. SIJ (2010), Soberanía i Justícia, “Informe sobre la viabilitat econòmica de la independència de Catalunya”, Associació independentista, Barcelona, 2010, pp. 1-40, http://mailing.pukkas.com/es_members/9242/ftp/informe_3.0.pdf.
Stop ESPOLI (2013) https://www.youtube.com/watch?v=JJQkmRnLjeE.

Catalonia: The secessionist challenge and the economic consequences of independence
113
Tena, A. (2005), “Sector exterior” in A. Carreras y X. Tafunell (Coords.) Estadísticas Históricas
de España. Siglos XIX y XX, v. 2, pp. 573-644. Fundación BBVA: Bilbao. Torras, J. (1984), “Especialización agrícola e industria rural en Cataluña en el siglo XVIII”, Revista de Historia Económica, 3, 1984, pp. 113-127. Torras, J. (1985), “Fabricants sense fàbrica. Estudi d’una empresa llanera d’Igualada (1726-1765), Recerques, 5, pp. 145-160. Torras, J. y M. Duran (1983), “La industria lanera en Cataluña, siglo XVIII”, paper presented in the III Congreso de Historia Económica, Segovia. Torras, J. y M. Duran (1987), “Los mercados de una empresa pañera catalana en la segunda mitad del siglo XVIII. La casa Torelló de Igualada, 1759-1796”, paper presented in the XII Simposio de Análisis Económico, Barcelona. Tortella, G., (1997) El desarrollo de la España contemporánea, 3ª edición. Alianza Universidad Textos: Madrid. Uriel, E. (2012): “El saldo de la Balanza Fiscal de Cataluña con la Administración Pública Central”. http://decigarrasyhormigas.com/2012/11/05/balanza-fiscal-cataluna/. Uriel, E. and R. Barberán (2007): Las balanzas fiscales de las comunidades autónomas con la Administración Pública Central (1991-2005), Bilbao: Fundación BBVA. http://www.uv.es/uriel/publicaciones/NBF2007.pdf. Vilalta, M., “Balanzas fiscales: metodología, resultados”, Institut de Dret Públic, Barcelona, 2012, http://idpbarcelona.blogspot.com.es/2012/12/balanzas-fiscales-metodologia.htlm. Wolff, E.N. (1994). “Productivity measurement within an input-output framework”, Regional Science and Urban Economics, 24, 75-92. Zabalza, A. (2012): “Malentendidos del saldo fiscal catalán”, El País, 19 de noviembre.

The political economy of Catalan independence
114
Appendix 1. The input-output model
The weight of Catalan exports can be calculated employing the open input-output (IO)
model developed by Leontief (1943). The results have been obtained employing two versions of the model. First, production sectors are the only endogenous variables and all components of final demand are exogenous. Second, the production technology is extended to include consumption that is considered an additional productive activity whose output is used as an intermediate product by the production sectors.
The standard IO model distinguishes goods and services flows according to their origin. The basic equilibrium equation
II dyAy += (1)
states that the domestic output vector, y , is the sum of the vector of intermediate inputs required
to produce the output vector, yA I , and the exogenous final demand vector of domestic origin, Id . IA stands for the matrix of unitary intermediate inputs of domestic origin.
In order to calculate the weight of exports of domestic origin to the rest of Spain (ROS) o rto
the rest of the world, I
XROWd , equation (1) is solved using the vector either I
XROSd or I
XROWd instead of Id . As indicated, the results have been obtained for two specifications of the unitary requirement
matrix47. First, I
SA is a 65x65 square matrix where each column provides the unitary requirements
(or technical coefficients) of each of the 65 sectors included in Catalonia’s input-output table constructed by the IDESCAT for 2005. Second, the matrix IA is a 66x66 square matrix where the
last column includes the unitary requirements to produce one unit of the ‘consumption’ good and the entries of the 66th row the unitary consumption requirements of each of the 65 production sectors:
=
0' I
II
SI
cl
cAA
where 'l is the row vector of unitary labor requirements and L
Cc
II
= is the average consumption
of domestic origin per unit of labor. Notice that all coefficients are defined using only domestic flows. In the first model, the equilibrium conditions becomes
I
XROW
XROWI
S
XROW
I
XROS
XROSI
S
XROS
dyAy
dyAy
+=
+= (2)
47 See, Wolff (1994) and Polo and Valle (2009 y 2012).

Catalonia: The secessionist challenge and the economic consequences of independence
115
and the output vector is obtained pre-multiplying the exports vector by Leontief’s inverse:
( )
( ) I
XRDM
I
S
XRDM
I
XRDE
I
S
XRDE
dAIy
dAIy
1
1
−
−
−=
−=- (3)
The equilibrium conditions for the second model are given by
+
=
00'
I
XRDE
I
XRDE
I
II
S
I
XRDE d
C
y
cl
cA
C
y (4)
+
=
00'
I
XRDM
I
XRDM
I
II
S
I
XRDM d
C
y
cl
cA
C
y
where Ic are the consumption shares of domestic origin, and IC total domestic consumption. The production vectors required to satisfy exports are
−
−−=
−
01
!
'
I
XROS
I
II
SXROS d
cl
cAI
C
y
(5)
−
−−=
−
01
!
'
I
XROW
I
II
SXROW d
cl
cAI
C
y
Value added and employment effects can be obtained multiplying the corresponding vector of unitary coefficients, 'l and '
ν , by the production vectors obtained in (3) or (5).
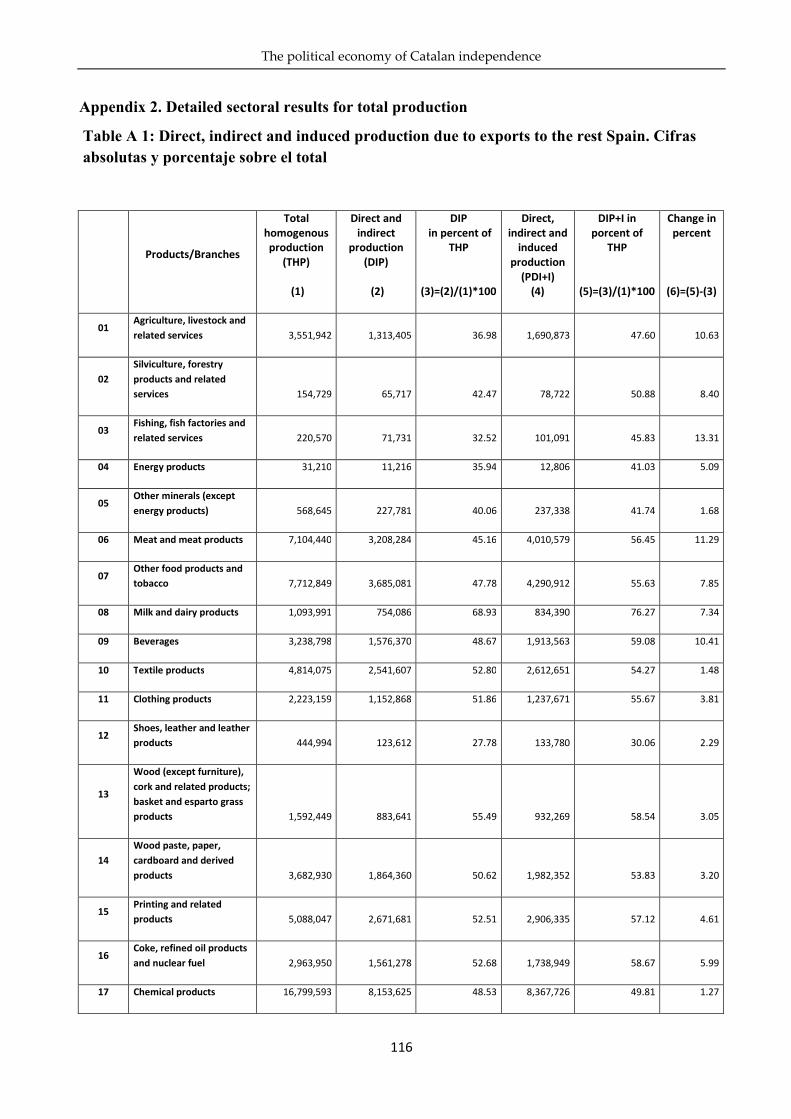
The political economy of Catalan independence
116
Appendix 2. Detailed sectoral results for total production
Table A 1: Direct, indirect and induced production due to exports to the rest Spain. Cifras
absolutas y porcentaje sobre el total
Products/Branches
Total
homogenous
production
(THP)
(1)
Direct and
indirect
production
(DIP)
(2)
DIP
in percent of
THP
(3)=(2)/(1)*100
Direct,
indirect and
induced
production
(PDI+I)
(4)
DIP+I in
porcent of
THP
(5)=(3)/(1)*100
Change in
percent
(6)=(5)-(3)
01 Agriculture, livestock and
related services 3,551,942 1,313,405 36.98 1,690,873 47.60 10.63
02
Silviculture, forestry
products and related
services 154,729 65,717 42.47 78,722 50.88 8.40
03 Fishing, fish factories and
related services 220,570 71,731 32.52 101,091 45.83 13.31
04 Energy products 31,210 11,216 35.94 12,806 41.03 5.09
05 Other minerals (except
energy products) 568,645 227,781 40.06 237,338 41.74 1.68
06 Meat and meat products 7,104,440 3,208,284 45.16 4,010,579 56.45 11.29
07 Other food products and
tobacco 7,712,849 3,685,081 47.78 4,290,912 55.63 7.85
08 Milk and dairy products 1,093,991 754,086 68.93 834,390 76.27 7.34
09 Beverages 3,238,798 1,576,370 48.67 1,913,563 59.08 10.41
10 Textile products 4,814,075 2,541,607 52.80 2,612,651 54.27 1.48
11 Clothing products 2,223,159 1,152,868 51.86 1,237,671 55.67 3.81
12 Shoes, leather and leather
products 444,994 123,612 27.78 133,780 30.06 2.29
13
Wood (except furniture),
cork and related products;
basket and esparto grass
products 1,592,449 883,641 55.49 932,269 58.54 3.05
14
Wood paste, paper,
cardboard and derived
products 3,682,930 1,864,360 50.62 1,982,352 53.83 3.20
15 Printing and related
products 5,088,047 2,671,681 52.51 2,906,335 57.12 4.61
16 Coke, refined oil products
and nuclear fuel 2,963,950 1,561,278 52.68 1,738,949 58.67 5.99
17 Chemical products 16,799,593 8,153,625 48.53 8,367,726 49.81 1.27
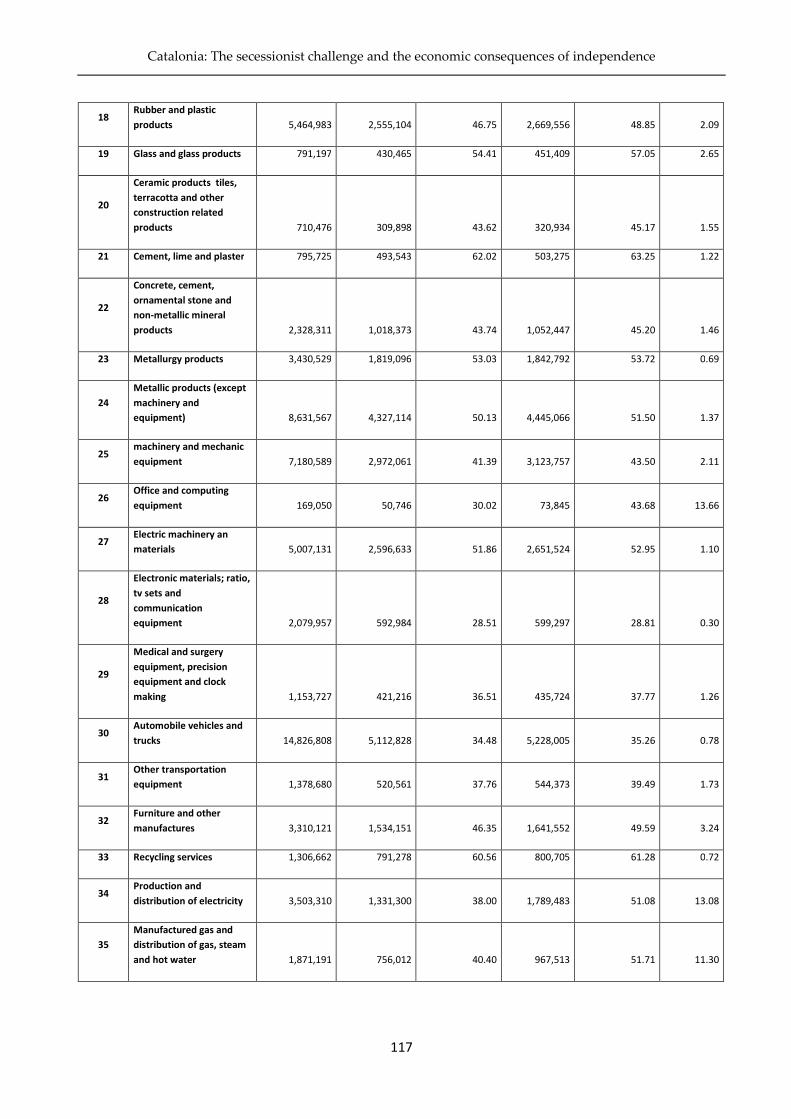
Catalonia: The secessionist challenge and the economic consequences of independence
117
18 Rubber and plastic
products 5,464,983 2,555,104 46.75 2,669,556 48.85 2.09
19 Glass and glass products 791,197 430,465 54.41 451,409 57.05 2.65
20
Ceramic products tiles,
terracotta and other
construction related
products 710,476 309,898 43.62 320,934 45.17 1.55
21 Cement, lime and plaster 795,725 493,543 62.02 503,275 63.25 1.22
22
Concrete, cement,
ornamental stone and
non-metallic mineral
products 2,328,311 1,018,373 43.74 1,052,447 45.20 1.46
23 Metallurgy products 3,430,529 1,819,096 53.03 1,842,792 53.72 0.69
24
Metallic products (except
machinery and
equipment) 8,631,567 4,327,114 50.13 4,445,066 51.50 1.37
25 machinery and mechanic
equipment 7,180,589 2,972,061 41.39 3,123,757 43.50 2.11
26 Office and computing
equipment 169,050 50,746 30.02 73,845 43.68 13.66
27 Electric machinery an
materials 5,007,131 2,596,633 51.86 2,651,524 52.95 1.10
28
Electronic materials; ratio,
tv sets and
communication
equipment 2,079,957 592,984 28.51 599,297 28.81 0.30
29
Medical and surgery
equipment, precision
equipment and clock
making 1,153,727 421,216 36.51 435,724 37.77 1.26
30 Automobile vehicles and
trucks 14,826,808 5,112,828 34.48 5,228,005 35.26 0.78
31 Other transportation
equipment 1,378,680 520,561 37.76 544,373 39.49 1.73
32 Furniture and other
manufactures 3,310,121 1,534,151 46.35 1,641,552 49.59 3.24
33 Recycling services 1,306,662 791,278 60.56 800,705 61.28 0.72
34 Production and
distribution of electricity 3,503,310 1,331,300 38.00 1,789,483 51.08 13.08
35
Manufactured gas and
distribution of gas, steam
and hot water 1,871,191 756,012 40.40 967,513 51.71 11.30

The political economy of Catalan independence
118
36 Water production and
distribution 1,067,343 85,642 8.02 355,067 33.27 25.24
37 Construction 37,981,820 793,141 2.09 1,876,082 4.94 2.85
38 Distribution and repair of
automobile vehicles 5,719,301 1,386,495 24.24 2,394,361 41.86 17.62
39 Wholesale trade (except
motor vehicles) 23,626,352 7,996,481 33.85 10,330,674 43.73 9.88
40 Retail commerce (except
motor vehicles) 9,327,941 72,754 0.78 2,903,771 31.13 30.35
41 Hotels and other lodging 2,592,963 61,814 2.38 855,248 32.98 30.60
42 Restaurant, bars, canteens
and prepared food 16,156,916 50,445 0.31 5,251,056 32.50 32.19
43 Railroad transportation
services 367,811 64,088 17.42 139,583 37.95 20.53
44 Other land transportation
services 7,875,741 3,057,665 38.82 3,716,734 47.19 8.37
45 Maritime and fluvial
transportation services 218,393 59,658 27.32 67,237 30.79 3.47
46 Air transport services 1,662,387 831,049 49.99 887,630 53.39 3.40
47 Related transport services 7,404,426 3,685,531 49.77 4,095,011 55.30 5.53
48 Travel agencies and tour
operator services 1,704,826 69,442 4.07 540,664 31.71 27.64
49
Mail and
telecommunication
services 6,498,906 1,245,820 19.17 2,408,413 37.06 17.89
50
Financial intermediation
services (except insurance
and pension plans) 7,220,638 1,770,121 24.51 3,002,765 41.59 17.07
51
Insurance and pension
plans (except Social
Security) 2,504,032 404,743 16.16 954,226 38.11 21.94
52 Auxiliary financial
intermediation services 1,627,936 291,850 17.93 631,661 38.80 20.87
53 Real-estate services 23,001,664 1,227,974 5.34 6,741,686 29.31 23.97
54 Renting machinery and
consumption durables 1,688,907 465,972 27.59 741,574 43.91 16.32
55 Computing services 3,139,638 1,198,887 38.19 1,298,561 41.36 3.17
56 Research and
development services 1,622,474 406,742 25.07 449,340 27.69 2.63

Catalonia: The secessionist challenge and the economic consequences of independence
119
57 Other services to
companies 20,954,160 6,813,901 32.52 8,407,724 40.12 7.61
58
General public
administration, defense
and Social Security 7,922,968 0 0.00 0 0.00 0.00
59 Education services 7,024,758 121,616 1.73 878,441 12.50 10.77
60 Health, veterinary and
social services 11,886,893 60,061 0.51 1,180,693 9.93 9.43
61 Public sanitation services 1,480,185 160,349 10.83 278,090 18.79 7.95
62 Non-profit organization
services 532,556 45,062 8.46 67,493 12.67 4.21
63 Recreational, cultural and
sportive services 6,937,821 1,333,144 19.22 2,631,025 37.92 18.71
64 Other personal services 1,722,100 33,732 1.96 556,282 32.30 30.34
65 Household services with
domestic employees 1,376,833 0 0.00 449,433 32.64 32.64
Total 348,075,070 91,293,882 26.23 126,313,790 36.29 10.06
Note: Similar sectoral results are available on demand for employment and value added.
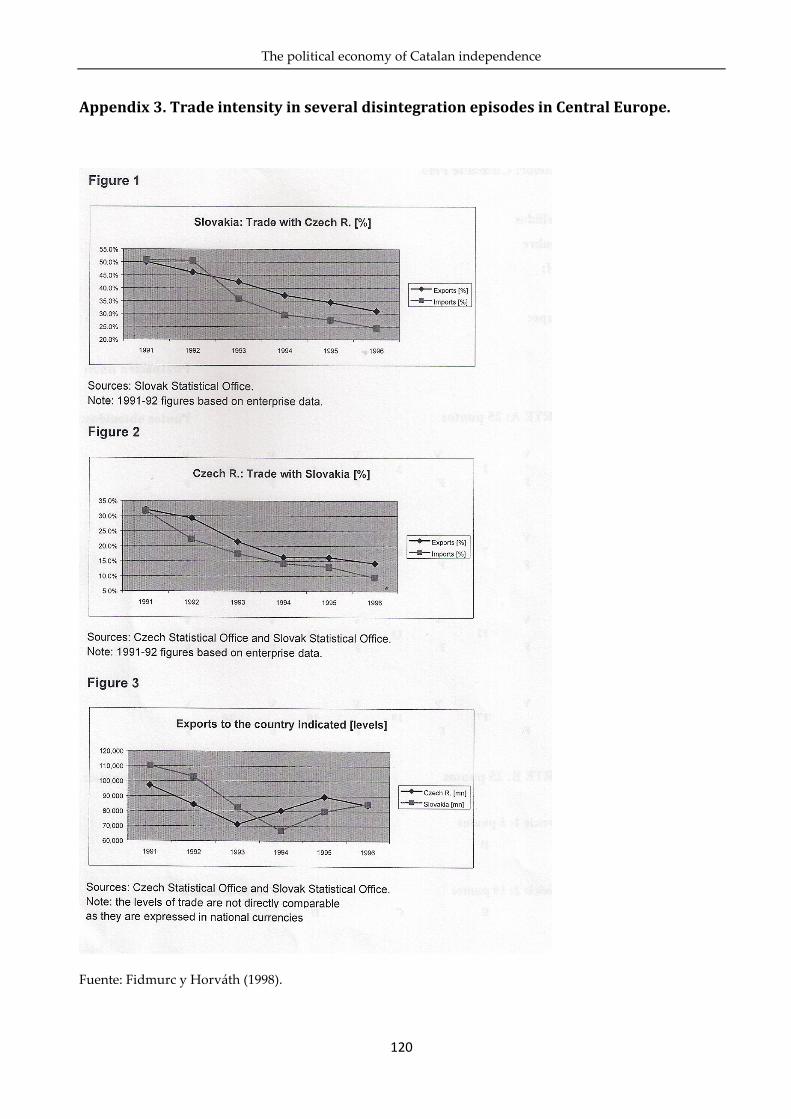
The political economy of Catalan independence
120
Appendix 3. Trade intensity in several disintegration episodes in Central Europe.
Fuente: Fidmurc y Horváth (1998).

Catalonia: The secessionist challenge and the economic consequences of independence
121
Fuente: Fidmurc y Fidmurc (2003).


INSTITUTO DE ESTUDIOS ECONÓMICOS
THE POLITICAL ECONOMY
OF CATALAN INDEPENDENCE
SEPTEMBER 2014
INSTITUTO DE ESTUDIOS ECONÓMICOSCastelló, 128, 6ª 28006 Madrid
Tel.: (34) 91 782 05 80. Fax: 91 562 36 [email protected]