Embed Size (px)
Citation preview
The political economy of inequality, redistribution
and
boom-bust cycles in Turkey
Őzlem Onaran University of Greenwich
And
Cem Oyvat University of Greenwich
Year: 2015
No: GPERC16
[2]
Abstract: There has been a remarkable continuity in the main characteristics that determined the growth
regime in Turkey in the last two decades despite seemingly significant political changes. This neoliberal
speculation and finance-led growth regime has proved to be both socially and economically unstable, as
shown by the post-Great Recession developments as well as the recent history of Turkey, which is marked
by regular boom and bust cycles. In the recent global crisis, Turkey had one of the severest recessions in
2009 –deeper than other major emerging economies. The recovery since 2009 is as fragile as before. In the
last decade insecurity has increased for all segments of the working people bare the poorest. The structural
changes in the economy and the policies of ruling government of the last decade has initiated a redistribution
towards the poorest of the society; but the source of this redistribution was income scrapped from the
organized blue collar and white-collar/professional working people rather than taxes on corporate profits
and the rich. Turkey’s growth model dependent on cheap labour, speculative financial capital inflows, a
construction boom and a high trade deficit, would have experienced a crisis sooner or later even without
the Great Recession.
Keywords: Turkey, boom-bust cycles, crisis, inequality
JEL Classification: E24, E25, E6
Acknowledgements: The authors are grateful to Philip Arestis and Malcolm Sawyer for very helpful
comments on an earlier version.
Corresponding Author: Őzlem Onaran: University of Greenwich, Business School, Park Row,
Greenwich, London, SE10 9LS, UK, email: [email protected]
Cem Oyvat: University of Greenwich, Business School, Park Row, Greenwich, London, SE10 9LS, UK,
e-mail:email: c.oyvat@ greenwich.ac.uk
[3]
1. Introduction
This paper aims to discuss the implications of the growth pattern in Turkey for inequality and
labour in the post-1980s period, and contextualize the developments since the Great Recession
within this longer term structural problems of the country. The adjustment of wages and changes
in functional income distribution in favour of capital has played a central role in relieving the
pressures over profits during Turkey’s integration to the global economy since the 1980s.
Furthermore the episodes of currency crises resulted in further distributional shocks at the expense
of labour. Turkey’s post-1980 growth pattern has been dependent on speculative financial capital
flows and has been marked by continuous cycles of boom and bust, as in the cases of the crises of
1994 and 2001 and most recently 2009. The distributional outcomes of these crises have not been
neutral for labour vs. capital.
This paper will discuss the dynamics behind these distributional shocks and their
persistence by analyzing the trends in wages, employment, and income distribution, the
distributional and labour market consequences of financial crises and boom and bust cycles
following capital flows, and the consequences for the growth regime in Turkey. The main
hypothesis of the paper is that there has been a striking continuity in terms of the distributional
policy of different governments from the 1980s to 2000s. The major institutional and political
changes after the 2001 crisis has brought up no break in the neoliberal line and anti-labour (pro-
capital) incomes policy of Turkey. Lack of industrial policy, dependence on low wages for
competitiveness, and hence dependence on imports and speculative capital inflows for growth has
been the common problems in economic policy in the neoliberal era. These policies have been
unable to tackle the structural problems of Turkey.
Risks due to both domestic and international financial fragility had already been creating
new economic turbulences in Turkey since 2006. Given its structural problems, Turkey would
have had a currency crisis and recession even without the global crisis. The Great Recession has
[4]
been the final shock that turned turbulences into a deep recession in 2009. Turkey has experienced
the crisis deeper than other emerging markets due to its heavy reliance of foreign capital inflows
as well as delayed policy responses of the AKP government and Central Bank of the Republic of
Turkey (CBRT) to the crisis. In the aftermath of the Great Recession Turkey has been one of the
most fragile emerging markets to the reversals in capital flows following planned changes in
quantitative easing in the US.
The rest of the paper is organized as follows: Section two discusses the growth regime, the
centrality of capital inflows, and the boom and bust cycles in Turkey. Section three discusses the
trends in inequality in terms of both functional income distribution with a focus on the share of
wages and personal income distribution. Section four discusses the changes in the capitalist class
in Turkey and the emergence of ‘Islamic Capital’. Section five presents the employment and
unemployment trends. Section six discusses the labour market institutions and their link to
inequality. Section seven presents the link between rising inequality and low growth in Turkey by
shedding light on the wage-led character of the growth regime. Section eight concludes.
2. Speculation-led growth regime in Turkey, the boom-bust cycles and the Great
Recession
Turkey experienced a major structural change in the 1980s by shifting from an import- substituting
industrialization strategy to an export-oriented growth model via implementing an orthodox
structural adjustment program, as typically prescribed by the IMF and the World Bank (Onaran,
2009a). The program has been ‘orthodox’ in terms of its strong reference to neoclassical economic
theory as well as the shock therapy style reversal in the development strategy as well as the strong
pro-capital redistributive policy stance. Since then, the strategy of diverse governments has been
guided by economic policies that include the dismantling of government regulations in financial,
[5]
goods and labour markets, as well as openness to trade, foreign direct investment and financial
capital flows. Pro-capital redistribution of income accompanied by a military coup in 1980 and a
change in the labour code was a major tool that facilitated the export-oriented strategy. A drastic
initial decline in the wage share in the early years of the structural adjustment programme, as we
will discuss in more detail in Section 3 below, moderated the competitive pressures over capital at
a time of increased exposure to international markets. The promise of these policies has been that
liberalized markets and specialization in the comparative advantages of the country will increase
efficiency, exports, and growth, attract foreign capital, and the positive effects will eventually
trickle down to provide fairer distribution, where each factor of production receive a return
consistent with its marginal productivity, and eventually the returns to labour would also increase.
After the initial phase of liberalization in domestic markets and foreign trade, Turkey also
liberalized its capital account in 1989 as the second stage of its integration to the world economy.
The capital flows consisted mostly of volatile portfolio investments and short-term credit, with the
share of Foreign Direct Investment (FDI) in total financial account being limited to a range of 10-
20 percent apart from several exceptional years of FDI, like 1989, 2002, and finally 2006-8.
Speculative and short-term capital inflows have led to a fragile growth pattern and created phases
of boom, which then were typically followed by a bust (Yenturk, 1999; Onaran, 2007). Figure 1
below shows the growth in GDP and capital inflows as a ratio to GDP, illustrating the dependency
of growth on speculative financial flows.
[Figure 1]
Shortly after the liberalization of the capital account in 1989, the accumulated risks associated with
a high current account deficit, combined with the mismanagement of the domestic borrowing
policy by the government, which had the infeasible obsession to try to reduce the interest rates on
the eve of the elections in 1993, ended up triggering a massive capital outflow in 1994. This first
[6]
currency crisis after the liberalization of the capital account led to a depreciation of the currency
by 23.9 per cent in one year and a severe recession with GDP declining by 6.1 per cent in 1994.
It did not take long until the international investors started to enjoy the deflated asset prices
in the stock and bond markets and the low exchange rate risk that came with the already
depreciated currency (Onaran, 2009a). The capital inflows continued during much of the 1995-
2000 period. At the end of 1999, Turkey repeated the former mistake of many other developing
countries by adopting a currency peg in 2000 as part of an anti-inflation programme. However, the
experience in 2000 proved that the exchange rate as a single nominal anchor was only partially
successful to control inflation, as had also been the case in many other countries, and the decline
in inflation was not enough to prevent a significant real appreciation of the currency by -15.9 per
cent in just one year in 2000. At the same time, the current account deficit reached 3.7 per cent of
GDP. The questions regarding the sustainability of the current account deficit accompanied by
financial risks in the private banking sector invited a series of pessimistic speculative expectations,
and Turkey had an even more severe crisis in 2001.1 In 2001 the overall capital outflow amounted
to 8.5 per cent of GDP; and GDP decreased by 5.7 per cent.
Overall, the strategy of integration to the world economy was based mainly on increasing
competitiveness via a sharp decline in wages. This has led to a significant contraction of domestic
demand, as will be discussed in more detail below. However this policy has been unable to
stimulate a higher growth potential via higher investments.
The dramatic financial crisis of 2001 and its implications for wage and employment losses
have certainly been an important aspect in the election victory of the Justice and Development
Party (AKP) in 2002. All three establishment parties of the ruling coalition during the crisis were
excluded from the parliament, since the electoral support for each of them was below the 10%
threshold. Despite the political break with the legacy of the former establishment, regarding the
1 See Yeldan (2002), Boratav and Yeldan (2006), Akyuz and Boratav (2003) and Uygur (2001) for a more detailed discussion.
[7]
economic policy, the AKP government has followed a solely neo-liberal program, serving the
interests of the large-scale domestic capitalists as well as international investors.
The neo-liberal programme of the AKP government was also originally supported by the
IMF and the EU. Indeed the economic policy stance of the government remained in the same line
as the previous coalition’s programme after the crisis, which was also supported by the IMF.
Economic policy in general has been a rather conflict-free area between the government, business
circles, and the military elite, despite the political conflicts between them (Onaran, 2009a).
Nevertheless, AKP’s aim at creating and supporting a more conservative and Islam oriented
capitalist class2 and bureaucratic cadres has also provoked the old ruling elite establishment,
including both the major corporations of Turkey as well as the military and the former bureaucrats,
who tried to maintain their own power in politics and share in the wealth of the country.
The government has developed a discourse that builds on a selective narrative of economic
statistics, in particular high growth with low inflation for a long period, and the FDI inflows at
historical highs. However, these facts disguise the fragility as a result of the high current account
deficit and domestic and external private debt, the question about the sustainability of the capital
flows, inability of the economy to create sufficient jobs, and persistent inequality and poverty. The
so-called success of low inflation has been achieved at the expense of declining real wages, which
have barely recovered since the 2001 crisis as we will discuss in more detail below. The obsession
with inflation as the sole target of macroeconomic policy and the ignorance about employment
and incomes policy is also part of a conscious anti-labour policy stance. Most importantly the high
growth performance proved to be hiding the deep structural problems involved with debt-led
growth, and was sure to be reversed with or without the global Great Recession. Last but not least,
Turkey failed to combine FDI policy with industrial policy during the 2000s as well as before; the
2 The AKP has tight relations with the Independent Industrialists' and Businessmen's Association (MÜSİAD) which has a strong
Muslim background. Indeed, it is widely thought that MÜSİAD is an abbreviation for “Muslim Businessmen's Association”. In
an interview conducted by Milliyet Newspaper (April 10th, 2004), the first chairman of MÜSİAD, Erol Yarar, accepts that this
common knowledge reflects the position of MÜSİAD well. He says that “being called as Muslim Businessmen's Association never
disturbed me. Indeed, this is an honour for us”.
[8]
very low share of FDI in manufacturing made productivity, technology, employment, or wage
spill-over unlikely. Hoping that FDI would be a safe means of financing the huge current account
deficit also proved to be unrealistic in an environment of global credit crash and collapse in
investments after the Great Recession. These points are the evidence of a continuity of the
neoliberal policy package from the 1980s to 2000s.
By and large, the economic policy stance of the government has brought the support of the
large-scale employers’ organization to AKP despite hesitations due to political pressures from the
military establishment. The balance of power changed significantly after 2008, and AKP overall
came as the winner of its battle with the military and juridical establishment after steering and
winning a series of major law suits against high ranking officers over alleged military coup d’etat
plans.
It is true that after the 2001 crisis, Turkey enjoyed an uninterrupted and high growth era,
with a 7.2 per cent average annual rate of growth in GDP during 2002-20063. High capital inflows
prompted by high real interest rates offered by Turkey have been the determining source of finance
for achieving this growth rate; however without a strong effect on real investment. The deflated
prices in the asset markets and the immediate and high depreciation of the currency after the 2001
crisis not only lowered asset prices once again in terms of foreign currency, but also decreased the
likelihood of further depreciation in the coming period, and even created the possibility of an
appreciation after the over-shooting of the exchange rate in summer 2001. This provided a
favourable environment for international portfolio investors. Additionally, the EU anchor was a
significant factor in securing the capital flows in the period after 2001.4 During this period,
there have also been also significant inflows of FDI, which were facilitated by the EU-anchor, the
political push for privatization or deregulation and by high rates of depreciation of the local
3 This corresponds to 5.9% growth in per capita GDP. 4 In the period after 2001, EU turned into an important anchor in partnership with the IMF to determine the direction of economic
change as well as to signal the credibility of the programs to the international investors (Öniş and Bakır, 2005; Ataçand Grünewald
2006). The targets of IMF programmes and the steps to be taken to fulfill the economic conditions of membership overlapped, and
EU’s role in terms of auditing Turkey started to include economic aspects in addition to political aspects.
[9]
currency, which had led to a dramatic decline in asset prices. The result of this new wave of capital
inflows was typically a continuous appreciation in currency: at the end of 2006 the current account
deficit had reached a historically high level of 6.0 per cent of GDP. Nevertheless, the market
sentiments celebrated this period as a completely new era, where the EU anchor was playing an
important role in decreasing political risks, and creating the potential for a higher FDI and financial
capital inflow. The optimists also emphasized that the current account deficit was financing new
private investments, which would eventually improve competitiveness and exports. The
government mostly cited the effect of increasing oil prices in 2006 as an excuse for the increase in
current account deficit, and seemed to particularly trust the corrective capacity of the flexible
exchange rate system, which was implemented in parallel with inflation-targeting after the 2001
crisis, to tame speculative expectations. Meanwhile, little attention was paid to the increased
foreign debt of the private sector, and the exchange rate risk that it was exposed to.
The optimism about the start of a new era in the Turkish economy was already disturbed
by the global turbulences in the world economy in May-June 2006 (Onaran, 2006). At that time,
the concerns were centred around the effects of a possible recession in the US on the emerging
economies via the contraction in export markets, decrease in the risk appetite, increase in the risk
perceptions, and consequently increased volatility in the private capital flows towards ‘riskier’
markets. Turkey and Hungary were seen among the most vulnerable countries due to the high
degree of indebtedness, a large share of foreign currency denominated debt, exchange rate
overvaluation, high external financing needs, and their dependence on capital flows (Goldstein,
2005).
The initial shock in 2006 slowly faded away, but Turkey remained fragile to other shocks
afterwards (Onaran 2006 and 2007a). With respect to the real economy, the risks of dependency
on volatile international flows were already demonstrated by the immediate slowdown in growth
in the third quarter of 2006 which went on in 2007. The high growth performance of the years after
2002 is presented as an indicator of success by the ruling AKP; however the fragility of this period
[10]
has been fiercely tested by the turbulences in the global financial markets particularly since July
2007. When the global financial turmoil started in 2007, Turkey was already in the short list of
countries to be affected the most. The current account deficit, which was 6.0% as a ratio to GDP
in 2006, only moderately decreased to 5.8% of GDP in 2007 despite slower growth; and was as
high as 5.8% as of 2008.
The dependency of the country to external finance became a more serious problem during
the global credit squeeze in 2008. The speculation and finance-led growth model once again
proved to be economically unsustainable. With significant capital outflows in autumn 2008, the
recession started in the fourth quarter of 2008, dragging the growth rate to 0.7% in 2008 (Table 2).
Turkey had one of the severest recessions in 2009 with a contraction of 4.8% – deeper than other
major emerging economies such as Argentina, Brazil, South Korea and Thailand (Öniş and Güven,
2011)5. Accordingly between 2007 and 2009, GDP per capita in Turkey contracted by 3.33%,
which is significantly worse than the average growth in GDP per capita in lower-middle and upper-
middle income countries.
[Table 2]
The difference of 2009 to the former crises in Turkey was that it was part of a global financial
crisis. As international surplus capital was in search of safe havens in its escape from the toxic
assets in the headquarters of the international finance in the US and Europe, there was at the very
beginning of the crisis after July 2007 until mid-2008 a wave of volatile and shorter-term capital
inflows to emerging markets including Turkey, which however were soon followed by outflows.
The previous hopes that Turkey’s capital inflows were now more stable proved to be wishful
5 GDP growth rates in 2009 were 0.9% in Argentina, -0.2% in Brazil, 0.2% in South Korea and 2.3% in Thailand (Öniş and
Güven, 2011)
[11]
thinking as the share of FDI inflows in capital inflows decreased rapidly to 12.7% in 2010 amidst
a global collapse in investment; the ratio stands at the same level as of 2014.
Due to the global nature of the Great Recession, different from an isolated currency crisis,
the nominal depreciation has been more limited, which was later followed by appreciation; overall
the Turkish Lira (TL) had depreciated by 27.9% with respect to the US Dollar and 9.6% with
respect to the Euro by the end of 2009 compared to August 2008. The pass through from
devaluation to inflation was also lower than in previous crises due to the global deflationary
environment.
Still, the Great Recession affected the Turkish economy very negatively through several
channels. First of all, as a reflection of large current account deficits, the private savings/GDP ratio
in Turkey was around 4.4% less than the private investments/GDP ratio in 2007 (Yükseker, 2013).
Accordingly, the bank credits in Turkey were very dependent on the foreign finance. Therefore,
the significant decline of capital inflows in 2008 and 2009 suddenly restricted the availability of
domestic credits (Uygur, 2010), which were crucial for domestic investments. Second, the high
volatility in capital inflows generated uncertainty and reduced the confidence of investors (Cömert
and Çolak, 2014). The real sector confidence index, which was reported as 110.5 in December
2007 declined to 58.5 in November 2008. The decline in economic confidence together with
tightening availability of domestic credits decreased the gross fixed capital formation by 6.2% in
2008 and 19% in 2009 (Table 2). Considering that the gross fixed capital formation in 2007 had
a share of 25.2% in overall GDP, its contraction was a major source of reduction in Turkey’s GDP
during the Great recession.
The Great Recession also temporary pulled Turkey’s export revenues down by 20%
through the period 2007Q4-2008Q3. The main reason behind this decline is the collapse of demand
in the EU countries, as Turkey’s exports heavily relied on the EU-28 (Uygur, 2010). Turkey’s
heavy dependency on the EU exports is an outcome of the Customs Union agreement between
Turkey and the EU, which became effective in 1996. During the Great Recession, the EU-28’s
[12]
share in total exports declined from 56.6% in 2007 to 46.2% in 20096. Accordingly, a part of
exports shifted to Middle Eastern, Asian and African countries. AKP government’s trade policies
such as mutual easing of visa requirements and bilateral trade agreements between Asian, African
and Middle Eastern countries also helped the diversification in export markets (Öniş and Güven,
2011).
On the other hand, the imports of goods and services also declined by 4.1% in 2008 and
14.3% in 2009, which slightly eased the Great Recession’s negative outcomes on Turkey. The
contraction in GDP significantly reduced the imports, as the pre-crisis production in Turkey was
highly dependent on imports of intermediate and capital goods (Yeldan et. al, 2012). Moreover,
Turkey is a major energy (oil, natural gas and coal) importer. The massive decline in oil prices
reduced the energy imports of Turkey from 5.1 billion USD in July 2008 to 1.9 billion USD in
April 2009 (Uygur, 2010).
The policy responses of the AKP government and CBRT to the Great Recession were very
limited during the months of the recession (Uygur, 2010; Öniş and Güven, 2011). Although the
Great Recession started to damage Turkey’s economic growth in the third quarter of 2008, the
AKP government insisted on its optimism on future growth forecasts and did not implement any
serious countercyclical policies until the late 2008. The consumption expenditures of government
increased only by 1.7% in 2008, and the primary budget balance declined mildly from 4.2% in
2007 to 3.5% in 2008 (Uygur, 2010). This fiscal policy response was very weak compared to the
fiscal stimulus in Argentina, Brazil, Russia and South Korea that constituted around 5-6% of their
GDPs in 2008 (Öniş and Güven, 2011).
During the late 2008, the AKP government finally started to implement significant
countercyclical policies. In December 2008, the maximum limit of export rediscount credits of the
Eximbank in Turkey was doubled from $500 million to $1 billion and the eligibility criterions for
6 Own calculations based on data supplied by the TUIK.
[13]
Eximbank credits were eased (Uygur, 2010). Starting from March 2009, the AKP government
introduced tax cuts on real estate, vehicles and many consumer goods including electronics, white
goods, office equipments and furniture. These tax cuts continued until the end of September 2009.
A public subsidy program supporting part-time employment was implemented in January 2009.
Moreover, a new scheme against unemployment was introduced in June 2009. According to this
scheme, the private investments on import-dependent industries and in economically backward
regions were subsidized by the government through tax cuts, cheap credits and social security
premium reductions (Cumhuriyet, 2009, June 3rd). Although, these measures mostly aimed to
recover the losses of entrepreneurs, they still supported Turkey’s recovery through increasing the
consumption expenditures of government by 7.8% in 2009 (Table 2).
The policy response of the Central Bank of the Republic of Turkey(CBRT) was also
delayed during the first months of the Great Recession. During the summer of 2008, the CBRT
continued its emphasis on inflation targeting. It increased its policy rate from 15.25% in May 2008
to 16.75% in June 2008, and maintained it until November 2008 (Uygur, 2010). Nevertheless, as
the declining demand eased the concerns on inflation, the CBRT significantly reduced the policy
rate from 16.75% in November 2008 to 6.25% in October 2009 (Cömert and Çolak, 2014).
Moreover, starting from late 2008, the CBRT stopped accumulating foreign exchange reserves and
started to drain its reserves by selling 15 billion USD until the second half of 2009. Similar to
fiscal policies of the AKP government, the late monetary policy response of the CBRT also
delayed the recovery of the Turkish economy.
The recovery since the Great Recession is as fragile as before. Following the Great
Recession, Turkey implemented a number of macroprudential measures- a gradual increase in
reserve requirements, restrictions on consumer loans, and the introduction of credit-growth caps.
These measures were very limited compared to the capital-account regulations that other emerging
economies like Brazil, India and Indonesia introduced after the Great Recession (Erten and
Ocampo, 2014). As a result, growth in Turkey continued to be highly dependent on speculative
[14]
financial capital inflows and financial sector grew significantly faster than the industry sector
(Rodrik, 2013). Figure 2 shows the share of information, communication and industry sectors as
compared to the share of financial and insurance services in GDP. The production share of
information, communication and industry sectors in GDP which was 28.2% in 2007, only slightly
increased to 29.0% in 2014. During the same period, financial and insurance services continued
its on-going significant growth and their share in GDP jumped from 16% to 22.5% during 2007-
2014. Moreover, Turkey’s production is significantly dependent on the imports of intermediate
and capital goods (Yeldan, 2013a). Between 2009 and 2013, the share of imports in GDP increased
from 25% to 29%7. The imports of intermediate and capital goods constitute greater than 85% of
these imports8 (Yeldan et al, 2012). A genuine developmentalist industrial policy is remarkably
missing in AKP’s economic policy mix.
[Figure 2]
The AKP has taken pride in having paid the last instalment of its debt to the IMF in 2013. However,
the foreign debt of the private sector has reached previously unseen levels; in the last decade firms
in Turkey have borrowed increasingly more in the international financial markets (Yeldan, 2013b).
Growth has been driven by debt accumulated by both private firms and households. Short-term
private debt/GDP has more than doubled and is 18.4% as of 2014; and long-term private debt/GDP
is 19.0%.9 Karacimen (2012) shows that household debt has also increased significantly from 7.3%
in 2003 to 37.7% in 2009 as a ratio to household income.
In 2006, Onaran (2006) had asked “Can it happen again?” to remind the risk of a Minskian
bust due to a shock followed by a sudden shift in expectations and capital outflows. It happened
7 Own calculations based on data supplied by the TUIK. 8 In 2011, the share of intermediate goods in total imports was as high as 71.9%, while the shares of consumption and capital goods
in total imports were 15.5%and 12.3% respectively (Yeldan et al, 2012). 9 Own calculations based on data supplied by the Central Bank of the Republic of Turkey.
[15]
again. The next bust and crisis in Turkey is not a question of “if” but “when”, and the international
financial investors will make that decision as is the case in all economies dependent on capital
flows. The foreign capital outflows from Turkey in 2013 after the rise in political instability was
already a signal in this direction. As major protests had erupted against the government’s
authoritarian regime at the Gezi Park in Istanbul, the government had labelled the protests as a
conspiracy of the international actors and “interest rate lobby,” and in response to the wave of
capital outflows the government initiated an official inquiry about the sales of shares in the stock
market, particularly by the foreigners. Recep Tayyip Erdogan, the then Prime Minister, has been
in conflict with the CBRT ever since regarding the Bank’s attempts to moderate capital outflows
by increasing interest rates. Sadly, this concern about capital outflows has not turned into a genuine
interest in regulating capital flows, but an excuse to support a conspiracy discourse to shed doubts
on an authentic social movement.
A further wave of volatility in capital flows came after the announcement of the Federal
Reserve Board of the US that they could consider gradually phasing out the quantitative easing
programme (the injection of money into the markets) in summer 2013. The aggressive
expansionary monetary policy of the world’s major central banks since 2008 has helped to
maintain capital inflows to emerging markets like Turkey, offering high speculative returns. The
negative effect of the announcement of the FED on international capital flows was similar across
the world, but the effect was particularly tougher in Turkey. Overall nominal depreciation of the
TL with respect to the US Dollar reached 95% and 61% with respect to the Euro in 2014 compared
to August 2008. Accounting for inflation, the real exchange rate depreciated by 10.1% in 2014
compared to 2008. March 2015 saw further volatility in capital outflows from Turkey and the
exchange rate due to the expectation of increases in the US interest rates; again Turkey has been
one of the most affected emerging economies with a depreciation of 12% in early March 2015.
The pass-through effect of depreciation is increasing inflationary pressures along with a slowdown
in output, and the world demand is still weak after the recession the positive effects of depreciation
[16]
on exports remain limited; the imported intermediate input content of export goods is also
moderating the competitiveness effects of depreciation. The pressure of President Erdogan to keep
interest rates low in an effort to maintain the popularity of the party ahead of the Summer elections,
who accused the governor of the Central Bank, Erdem Başçı by “selling out the homeland” to the
“interest-rate lobby”, has contributed to uncertainty and capital outflows (The Economist, 2015).
In the meantime, the EU anchor has completely lost its relevance for Turkey after the Great
Recession. The relations with the EU cooled down subsequent to the 2004 EU enlargement. After
the Great Recession, the loss in appetite for further enlargement on the side of the EU coincided
with AKP’s reorientation towards the US internationally, and a clearly more authoritarian regime
domestically. This removed one anchor that was often referred to in the financial markets regarding
the stability of the capital flows to Turkey.
Overall, Turkey’s fragility after the Great Recession is a continuity of its long known
structural problems related to a speculation-led/debt-led growth model, dependent on capital
inflows and susceptive to boom-bust cycles. This model takes the country through endogenous
cycles of over optimism and pessimism, and cycles of stability and instability a la Minsky.
3. Inequality and wages during the boom-bust cycles and the Great Recession
This section discusses the trends in inequality during the boom-bust cycles in the neoliberal era.
We first start with changes in functional income distribution, i.e. the distribution of income
between wages and profits.
The labour share declines in all countries that have experienced currency crises during the
two-three years following the crisis (Onaran 2007b and 2009a), and this decline in labour share
then compensates for the increase in financial costs due to higher interest rates or depreciation for
industrial firms. Evidence also suggests that industrial firms find the chance to increase their
[17]
returns from financial activities (Istanbul Chamber of Industry, 2003). Indeed, the financial gains
of non-financial firms are not only related to episodes of currency crises (Atac and Gruenewald,
2006). Epstein and Power (2003) report that in Turkey, Mexico and Korea, the share of the rentier
in national income has increased following the periods of financial liberalization; but this increase
has not come at the expense of profit shares accruing to non-financial corporations, suggesting that
there is a material basis for common cause, rather than rivalry, between industrial and financial
capital. This result is obviously related to the decline in labour shares, which compensates for the
increase in financial costs for industrial firms as well as their ability to increase their returns from
financial activities. The government’s fiscal policy choice regarding pro-capital tax policies and
infrastructure investment based on domestic and foreign borrowing at high interest rates played a
particular role in this process. As the share of wages in government expenses contracts, the share
of interest payments increases in most developing countries as well as in Turkey (Onaran 2007b).
While the demands for international and domestic borrowers are met, wages and social
expenditures and investment have to take their shares of budget cuts.
Strikingly, the whole era of Turkey’s liberalization and integration into the world economy
since 1980 has been a period of decline in the wage share. While the race to the bottom in the wage
share has been a global trend, the decline in the labour share in Turkey has been the highest in the
G20 countries along with Mexico (Onaran and Galanis, 2014). Figure 3 shows the adjusted wage
share in Turkey.10
[Figure 3]
10 Wages are adjusted labour compensation, calculated as real compensation per employee multiplied by total employment. In the
national accounts, all income of the self-employed are classified as operating surplus. However, since part of this mixed income is
a return to the labour of the self-employed, the simple (unadjusted) share of labour compensation in GDP underestimates the labour
share. This is a particular problem for the developing countries that have a significant share of self-employed workers due to the
informal nature of employment. Thus the adjusted wage share allocates a labour compensation for each self-employed person
equivalent to the average compensation of the dependent employees. This methodology is used by the OECD and AMECO for
calculating adjusted labour share. Turkey has national accounts by income approach since 1987; AMECO uses this information.
OECD Stat reports estimates for the period before. We link the two series based on the % change in the AMECO data for the period
after 2006.
[18]
The major negative shock to labour’s share took place in the early phase of neo-liberal structural
adjustment in 1980 and the recoveries in the later stages were minor and short-lived, and were
reversed by financial crises of 1994 and 2001. Turkey, which based its international
competitiveness during the era of liberalization on low wages, experienced a significant decline in
the manufacturing wage share.
The short period of increase in the wage share following the significant labour
mobilizations during 1989 to 1991 was reversed by the 1994 crisis. The crises of both 1994 and
2001 have led to a clear and long lasting decline in the wage share in Turkey. After the crises of
1994, the fall in the wage share continued also in 1995, with a cumulative decline of 27.0 per cent
compared to 1993. A strong economic recovery takes place right after the currency crises of 1994
and 2001, with production returning to its pre-crisis level within a year, however the fall in the
wage share continues for much longer. The slow recovery in the wage share in Turkey after the
1994 crisis was again reversed in 2001. The shock in 2001 was more dramatic: the wage share has
continued to decline throughout eight years that followed including 2008, which also includes five
years of AKP regime. The decline reached finally to a cumulative fall of 22.0 per cent in 2008
compared to 2000.
The initial year after the currency crises is always associated with a decline in the wage
share, and the percentage decrease in the wages by far exceeds the rate of decline in production
during the currency crises. After a crisis, declines in private sector wages follow as the fear of job
loss grows due to possible downsizing or bankruptcies. Employers’ organizations push labour
unions to accept dramatic wage cuts or compulsory unpaid leaves to avoid job losses. Eventually,
profits are restored and when the crisis is long past, it is labour that carries the burden of
adjustment. The crisis also creates a hysteresis effect that destroys the bargaining power of labour
for a long period afterwards. The trauma of the crisis and the ultimate need to keep the export
sector competitive becomes part of the employer discourse. The unions have a hard time to recover
following the loss of employment after the crisis; the remaining members often find themselves
[19]
burdened with increased debt and dramatic losses in living standards, which does not facilitate
militant bargaining even after the crises. This is a common destiny shared by labour in other
countries as well: Diwan (2001) defines crises as episodes of distributional fights, which leave
‘distributional scars’. Furthermore Crotty and Lee (2004) emphasize the importance of the crisis
episodes for facilitating the radical neoliberal restructuring, which could not be achieved through
democratic process under normal economic times. Right after the crisis, IMF conditionality is
usually accepted, and the initial bail-out credit to save international firms arrives. Public debt
increases as guarantees to the financial systems and large firms are satisfied and running primary
surpluses becomes the major duty of nation-states. Privatization, mostly in the form of a cheap
sell-out to foreign capital supplies the additional resources for the country to pay back its ever
growing debt. Since governments choose or are obliged to choose not to raise taxes or default on
their creditors sufficiently, public deficits end up being paid by labour. In the meantime, public
wages suffer from significant cuts.
Overall, the major source of the decline in the wage share during the currency crisis years
is the decline in real wages, which owes itself partly to the inflation shock due to depreciation and
partly to a loss in the bargaining power as shrinks. Figure 4 shows the real wage index (deflated
by CPI) in manufacturing industry.
[Figure 4]
Employment has also declined in all crisis years, except for 1980, when the crisis was associated
with the military coup, which also banned lay-offs (Onaran, 2009b). During all crisis years, the
decline in the real wage is much higher than the change in employment, the difference reaching
rather dramatic levels during the 1994 and 2001 crises. This difference indicates that the wages
adjust rather flexibly to changes in the labour market conditions. During the crises both
productivity and real wages decline with the latter decreasing at a significantly higher rate.
[20]
Following the crisis years, productivity recovers, but real wages continue to decline for three more
years after the crisis.11 The rate of decline in real wages following the 1994 and 2001 crises have
reached to 30.0 and 24.5 per cent, respectively, in three years. The recovery after 2004 was
negligible, and before the Great Recession hit in 2009 and as of 2008 real wages were still 14.2%
lower than in 2000 and 34.3% lower than their peak level in 1991.
In addition to the decline in overall growth of the economy and bargaining power of
workers during a crisis, inflationary shocks during these currency crises set the stage for the
decline in wages and thereby labour’s share (Onaran, 2009b). Due to the high import dependency
of Turkey, depreciation creates a large increase in the price of the imported goods, and thus in
overall input costs. The pass-through effect of currency depreciation on prices generates dramatic
increases in inflation, albeit at lower rates than the nominal depreciation. The magnitude of this
shock is related to the import dependency of the economy and the oligopolistic power of the firms
to pass on import price changes to consumers. These shocks are not only unexpected but also
difficult for the workers to reflect to their wages due to the magnitude of the shock. The workers
confronted with the threat of job loss during a crisis mostly fail to pass the consequent price shocks
to their nominal wages. In the meantime, utilizing the imbalance of power relations, the firms
compensate the increase in input costs by a decline in labour costs. The rate of depreciation of the
Turkish Lira against the dollar reached as high as 169.5% and 96.0% in 1994 and 2001,
respectively. The outcome was a radical deterioration in the real wage, and consequently wage
share during currency crises. Estimation results indicate that a 10 percentage point increase in the
depreciation rate leads to a 2.2 percentage point decrease in the growth rate of the wage share
(Onaran 2007a). Indeed, similar episodes were also experienced during the early phase of opening
up in the early 1980s, which was accompanied by huge devaluations of the domestic currency with
the aim of achieving higher international competitiveness. The reverse of this story was also true
11 The only exception is the 1981 recovery in wages after the military coup of 1980.
[21]
during episodes of capital inflow, and currency appreciation, when employers became more
accommodating towards wage demands. The 1989-93 episode is a case in point. However, this
was soon disturbed by the currency crisis in 1994.
The recession in 2009 was another major shock to wages, and in this case nominal wages
declined by 3.2%. Furthermore different from the currency crisis, in the deflationary global
environment of the Great Recession, the inflation rate did not hike as much, and remained limited
to 6.2%. This overall limited the real wage loss by 8.9% in 2009. There have been some gains in
real wages in the following years, but again compared to the peak in 1991, real wages are still
18.6% lower, and are just 5.3% above their level in 1979 before the structural adjustment
programmes, despite the significant increases in productivity during these almost three decades.
The 2009 recession was also unique in the sense that the fall in labour productivity was
higher than the fall in real wages, and hence wage shares moved counter-cyclically, i.e. increased
during 2009. Turkey’s and other developing countries’ currency crises experiences with high
inflationary shocks and consequently pro-cyclical wage share is quite different from the experience
in a recession without a major devaluation, as has been the case during the Great Recession. After
2009, the wage share nevertheless declined during the recovery during 2010-11, and the recovery
since 2012 has been dismal. Overall, as of 2013 the wage share is 37.1%, and is still dramatically
lower than the wage share at its peak in 1991 by a rate of 55.0%, 21.8% lower compared to 2000,
and even 34.8% lower than its level in 1979.
Apart from the crisis episodes, the recovery in the wage share is also very weak. This
constitutes a sharp contrast with the expectations of the orthodox economic theory from trade
liberalization, which argues that increased openness leads to more employment and eventually
higher wages in a labour abundant country. Turkey opened up its economy extensively in the
1980s, and experienced a literal boom in manufacturing exports first in the 1980s, and then further
in the 1990s following the Customs Union with the EU (Onaran, 2009a). The increase in exports
[22]
was also followed by a significant increase in imports as a result of a reduction in tariffs. The trade
deficit in manufacturing, which was already very high during the import substitution era, increased
remarkably in the 1990s due to the appreciated exchange rate as well as the Customs Union with
the EU in 1995.
One interesting puzzle is the widespread support for the ruling government in Turkey
despite ongoing stagnation in wages. Interestingly the discontent about the government manifested
itself in mass protests in summer 2013, but the starting point was not explicitly economic
inequality or wage stagnation. The obvious injustice and police brutality in Gezi Park in May 2013
was the last drop in a long process of accumulation of discontent against an authoritarian
government, their social policies pushing for a conservative Islamic-life style threatening in
particular women and the youth, criminalization and imprisoning of oppositional groups ranging
from seculars to Kurds, socialists, and trade unionists, and last but not least neoliberal policies,
which increasingly commercialized public services, created areas of rent for large corporations,
destroyed the ecological environment. 27 May, and the mobilizations that followed, marked a
historic moment for the collective memory of the movements in Turkey. This has been ever since
the spontaneous mobilization of a new generation, which has been brought up by the conservative
neoliberal authoritarian AKP regime for a decade. It has been a source of inspiration with the
creativity and sense of humour of the young people involved. It has been a broad movement
bringing together first time activists of all ages -young and old, trade unions, civil society
organizations, and political groups from a wide spectrum.
Despite the mass protests, it is also true that Turkey is much divided in terms of the
sentiment about the AKP regime, and there is still a significant support for the government, even
after the corruption scandal that erupted in December 2013. First the government has managed to
play the religion card, especially through the head scarf dispute, with its efforts to remove the ban
against the head scarf for female students at the universities. Such strategies helped the government
to shift the emphasis from living standards to identity, and sustain hopes in the majority of the
[23]
working people that, once economic stability can be maintained the benefits will trickle down to
the majority eventually.
Second, the capital flows to emerging economies significantly increased in 2000s
(Vasudevan, 2009; Akyüz, 2012), which generated booms that would lead to higher growth rates
in the emerging economies including Turkey. During the 2002-2013 period the average growth in
GDP per capita more than doubled in lower, lower-middle and upper-middle income countries
compared to 1990-2002 period (Table 1). The growth of GDP per capita in Turkey followed a
similar trend. The average annual growth in GDP per capita increased from 1.44% in 1990-2002
to 3.54% in 2002-2013. This is particularly an outcome of high growth rates in the boom periods,
as the average annual growth in GDP per capita were 5.49% and 4.67% between 2002-2007 and
2009-2013 respectively. The higher growth rates observed after the economic crisis of 2001 were
conceived as AKP government’s success in economic policy rather than the influence of the
changing global trends.
Third from a political economy perspective, there are important distributional dynamics in
the background of both the discontent about the regime as well as the support for it. AKP has
initiated a redistribution towards the poorest of the society via both populist in-kind transfers of
food and coal, in particular in the eve of the elections, as well as some institutional pro-poor
changes12. AKP government centralised the three existing social security funds (Emekli Sandığı,
SSK, Bağ-Kur) in a single institution (Social Security Institution) and all employees started to
access the same health coverage as the government employees who previously had the largest and
best quality coverage (Tekgüç and Atalay, 2015). Moreover, a larger part of unemployed and
informally employed individuals received ‘Green Card’, which grants partial access to public
health services. Indeed, AKP government aims to privatise the health services through subsidizing
12 According to Eder (2013), the decentralised and non-systematic structure of the poverty aids also support creation of crony
economic and political chains. First, a large part of these aids are supplied by local municipalities, which are also allowed to use
private services and charities for various services and funding. Nevertheless, the funding supplied by charities can also function as
a substitute for bribery that would have a return on an infrastructure investment bid. Second, in-kind transfers of coal and food
serve as a tool of political patronage. These in-kind transfers are inherently unstable and are not granted citizens as a social right.
[24]
private healthcare. Accordingly, the share of General Practitioner doctors in private healthcare
services increased from 5.5% in 2002 to 16.6% in 2012 (Tekgüç and Atalay, 2015). Nevertheless,
at the moment the role of private healthcare services is still small in Turkey. Moreover, the
healthcare services are mainly financed by public social security funds. These policies increased
access for the poor and the informal sector workers. Furthermore, the share of social transfers, in
particular transfers other than pensions and survivors' benefits, have doubled as a ratio to GDP
from 0.9% in 2006 to 1.8% in 2010; as of 2013 they constitute 1.5% of GDP.13 Relative poverty
rate (the ratio of individuals below 50% of the median value of the consumption expenditures per
equivalent individual) declined from a level of 18.5% in 2002 to 16.0% in 2011.14
Minimum wages have also received a significant boost in real terms, and increased from
0.61 as a ratio to the median wage of full-time workers in 2002 to 0.71 in 2012 (0.69 as of 2013),
and minimum wages as a ratio to average wages increased from 0.32 to 0.38 in 2013.15 Albeit still
at a low rate, the increase in minimum wages is remarkable.
During 2002-2013 the Gini coefficient in Turkey also decreased according to the official
statistics, as can be seen in Table 3. Gini coefficient measuring income inequality between
households declined from 0.44 in 2002 to 0.40 in 2010 and stayed at a constant level of 0.40
between 2010-201316. Nevertheless, these statistics should be interpreted with caution, as Gini
coefficient data is not entirely reliable. Between 60-67% of total income in Turkey cannot be
captured by household budget or income and living conditions surveys17. Moreover, during the
period of 2005-2006 the Gini coefficient increases by 0.05 points; which is a sign of poorness
13 Data supplied by Turkiye Istatistik Kurumu (TUIK) on distribution of annual incomes by types of income. 14 Own calculations linking the poverty data before and after 2006 supplied by TUIK. 15 Own calculations based on data supplied by http://stats.oecd.org. 16 The income inequality in Turkey has historically been lower than the majority of the Latin American and Sub-Saharan African
countries. The Latin American and Sub-Saharan countries have a colonial history, which led to inegalitarian agrarian structures
and concentration in the control of natural resources. As opposed, Turkey was not colonised by European countries, it’s relatively
resource poor and the land Gini coefficients in Turkey have been lower than the land Gini coefficients in the majority of the Latin
American and Sub-Saharan African countries. This also kept the income Gini coefficients in Turkey at lower levels (Oyvat, 2014) 17 Own calculations based on data supplied by TUIK. Data problems on the estimation of inequality are commonly observed in the
developing economies. According to Ravallion (2003)’s estimates, in developing countries, the consumption per capita from the
national accounts deviates largely from the per capita expenditures based on national sample surveys.
[25]
according to the quality standards that Deininger and Squire (1996) introduced for income
distribution data.18
[Table 3]
Nevertheless, there may be plausible factors that would reduce the Gini coefficient during the
period of 2002 to 2013. According to data from household budget or income and living conditions
surveys, the share of revenues from transfer in total income significantly increased from 17.5% in
2002 to 22.2% in 201319. The higher share of transfer revenues possibly contributed to a decline
in the Gini coefficient. Moreover, higher minimum wage/average wage ratio and reduction in the
share of informal activities would redistribute the inequality within labourers and hence reduce the
overall inequality.
Overall, there has been a redistribution of income towards the poorer since 2002. However,
the source of this redistribution was the income losses of the organized blue collar and white-
collar/professional working people rather than taxes on corporate profits and the rich. This
redistribution helps to increase the profits of the employers without hurting the poorest further.
Between 2006 and 2013 the share of the bottom 40% as well as the top 20% within the total wage
income has increased, whereas the share of the middle 40% decreased.20 The share of the bottom
40% of the households within the total wage income increased from 10.7% in 2006 to 12.0% in
201321; the share of the top 20% of the households within the total wage income increased from
51.7% in 2006 to 53.1% in 2013, while the share of the middle 40% decreased from 37.6% in 2006
18 In their cross-country income inequality database, Deininger and Squire (1996) classify the inequality data as doubtful if Gini
coefficients differ by 0.05 or more than 0.05 compared to the closest observation. 19 Own calculations based on TUIK’s household budget and income and living conditions data. 20 Own calculations based on data supplied by Turkiye Istatistik Kurumu (TUIK) on distribution of annual incomes by types of
income. 21 The increase in the share of bottom 40% wage earners is partially due to homogenisation of labour markets followed by higher
economic growth in 2000s, and a fall in the share of informal employment, as we will discuss in more detail below.
[26]
to 34.9% in 2013. This may also partly explain the diverse class composition of the mass, albeit
shaky, electoral support for the AKP.
In the last decade insecurity has increased for all segments of the working people except
for the poorest. Interestingly, this dynamic of redistribution under a conservative neoliberal regime
shows a remarkable resemblance to the trends in Brazil. In the case of Brazil, the governing Labour
Party, a progressive party quite different from AKP, has implemented some pro-poor policies such
as child benefits to the poor families and an unprecedented increase in the minimum wage
(Fishlow, 2011; Neri, 2010). However, this was coupled by AKP government’s very hostile
approach on labour movements and unions and its continuous aim of deregulating the labour
markets.
4. The changing structure of Turkey’s capitalist class
This section examines the changing structure of the capitalist class in Turkey and the rise of
conservative and Islam oriented bourgeoisie22 that emerged around the economic chains generated
by the conservative AKP government. It is widely claimed that (e.g. Acemoğlu and Robinson,
2013) there has been a conflict between secular, mostly Istanbul based entrepreneurs, and
relatively smaller Anatolian based conservative and predominantly Muslim entrepreneurs, and the
AKP government opened opportunities for the conservative and Islamic entrepreneurs.23 The
large-scale secular entrepreneurs are associated with the Turkish Industrialists and Businessmen's
Association (TÜSİAD) and the conservative, Islam oriented entrepreneurs, are represented by the
22 Along with the Islamic political movements, an Islamic capitalist class formed by small and middle scale entrepreneurs started
to emerge in 1970s. Unlike the bourgeois of the previous period, these entrepreneurs were against the Western World and had close
ties with the Islamic “National Vision” movement. In the beginning of 2000s, a group that is separated from the “National Vision”
generated a new Islamic movement around AKP. Unlike the “National Vision”, this new Islamic movement sympathized with
Turkey’s EU membership, securing the political relationships with the USA and NATO and the flows of international capital. With
the emergence of AKP, the Islamic capitalists also transformed and generated strong connections with the AKP (Balkan, et. al.
2014). 23 These arguments are also wide spread in the mainstream media in Turkey (Oyvat, 2015).
[27]
Independent Industrialists’, the Business Persons’ Association (MÜSİAD), the Turkish
Industrialists’, the Business Persons’ Confederation (TUSKON) and Anatolian Businessmen
Association (ASKON). The associations of conservative, Islam oriented entrepreneurs, also had
strong connections with the AKP government.24
Privatisations and public auctions for investments like bridges, ports, highways and
railroads were AKP government’s major tools for supporting the growth of conservative and Islam
oriented capitalist class. For this purpose, AKP government changed the ‘Public Auctions Law’
29 times between 2003 and 2013 and significantly relieved the controls on the public auctions.
Following the changes in law, 19.12% of total value of public auctions was conducted through
restricted and negotiated procedures rather than open tender method in 2012. Moreover, in 2012,
11.18% of total value of public actions was conducted without publication of notice and was
granted to selected specific contractors. This allowed the AKP government to grant a larger share
of public auctions to the entrepreneurs in its own circle (Buğra and Savaşkan, 2014).
A mutually beneficial relationship between these entrepreneurs and the AKP government
was formed through public auctions; some of these entrepreneurs bought a number of media
companies that were being controlled by the Savings Deposit Insurance Fund of Turkey.25
Following mid-2000s, Savings Deposit Insurance Fund of Turkey took control of several failed
media companies including the TV channels ATV, Kanal 24, Sky Türk 360 and Sabah, Star,
Güneş, Takvim and Akşam newspapers. In 2013, a pro-government businessman Ethem Sancak
bought Akşam and Sky Türk 360 from Savings Deposit Insurance Fund of Turkey. In 2007, ATV
and Sabah were sold to Çalık Holding whose CEO was the then prime minister Erdoğan’s son-in-
law, Berat Albayrak (Corke et. al, 2014). It was claimed that the purchase of Sabah and ATV was
24 TUSKON is associated with the religious Gülen movement, which had a close relationship with the AKP government and
controlled some of the key positions in Turkish bureaucracy. Following the corruption scandal in 2013, the connection between
AKP and the Gülen movement changed into a severe conflict. The AKP government explicitly declared its hostility to the Gülen
movement (Financial Times, March 18th) , as the police and prosecutors that initiated the corruption charges are widely associated
with the Gülen movement. Naturally, the relationship between TUSKON and AKP significantly changed following the corruption
scandal. 25 Savings Deposit Insurance Fund of Turkey (TMSF) is a public institution that aims to recover highly indebted companies and
failed financial institutions.

[28]
financed with the loans provided by two public banks (Buğra and Savaşkan, 2014). Nevertheless,
Çalık Holding’s financial situation deteriorated in 2013 and the company had to sell ATV and
Sabah to the Kalyon Group - a construction company that is involved in several recent large scale
public projects including the construction of the third airport in İstanbul (T24, December 20th,
2013). The main opposition party- Republican People's Party claimed that the sale of ATV and
Sabah was organised by Erdoğan (Hürriyet, February 1st, 2014).
On the other hand, Erdoğan had a series of disputes with the Turkish Industrialists and
Businessmen's Association (TÜSİAD), which represents secular and mostly Istanbul-based large
capitalists in Turkey. The conflict between TÜSİAD and Erdoğan on the constitutional referendum
conducted in 2010 is a noticeable example of this. Prior to the referendum, Erdoğan threatened to
destroy the TÜSİAD capitalists, who opposed Erdoğan by advocating a ‘no’ vote (Savran, 2015).
During the Gezi Protests, Divan Hotel of Koç Group- one of the largest Turkish conglomerates
that is historically associated with the secular Republican People's Party (Dündar, 2006)- gave
shelter to demonstrators fleeing police violence. Following this Erdoğan blamed Koç Group for
‘cooperating with the terrorists’ and a tax investigation on Koç Group’s energy companies started.
Nevertheless, the political disputes between TÜSİAD capitalists and Erdoğan did not
prevent TÜSİAD capitalists from benefiting from the economic policies of the AKP government.
In 2013, Koç Group was still the largest shareholder of five of the largest ten industrial companies
(Tüpraş, Ford-Otosan, Tofaş, Aygaz and Arçelik) in Turkey.26 Among these companies, Tüpraş,
the oil refinery company, was purchased by a consortium led by Koç Group for 4.14 billion dollars
through a privatisation conducted by the AKP government. Through 1993-2013, Tüpraş has
consistently been Turkey’s largest industrial enterprise. In 2012, it produced 8.5% of value added
in the whole industry sector and 18.1% of total value added of top 500 industrial enterprises. Koç
26 The ranking is based on Top 500 industrial enterprises list compiled by the İstanbul Chamber of Industry (İSO). Koç Group owns
the largest shares of Tüpraş, Ford-Otosan, Tofaş, Aygaz and Arçelik that in 2013 were among the ten industrial companies with
the largest net sales.
[29]
Group’s other four companies (Ford-Otosan, Tofaş, Aygaz and Arçelik) share in top 500 industrial
enterprises’ total value added increased from 3.7% in 2002 to 5.8% in 2012.27
Many TÜSİAD entrepreneurs engage in crony capitalist relationships similar to those
formed between conservative and Islam oriented capitalist class and the AKP government. An
example of this would be Doğuş Group, whose chairman Ferit Şahenk also served as the vice-
chairman of TÜSİAD. In 2000s, Doğuş Group took part in the construction of many public
infrastructure projects in Turkey and significantly increased its revenues (Buğra and Savaşkan,
2014). Following AKP government’s success in the constitutional referendum of 2011, Doğuş
Group’s TV channel, NTV, significantly changed their broadcasting policy and the programme
producers, who are relatively critical of the AKP government, were forced to resign. The new
broadcasting policy of NTV was strongly protested during the Gezi Park Demonstrations in front
of its headquarters (Euronews, June 3rd, 2013). The protestors were specifically critical of NTV’s
limited coverage on the Gezi Park demonstrations. It is noticeable that the demonstration happened
two weeks after one of the top ten ports in Europe, Istanbul Salıpazarı Port Area (Galataport), was
privatised to Doğuş Group (Hürriyet Daily News, May 16th, 2013).
There have been several attempts to measure the income mobility within Turkey’s capitalist
class during the AKP regime. Tanyılmaz (2015) exhibits that the number of MÜSİAD member
companies in the top industrial 500 enterprises list increased from 4 in 2003 to 31 in 2009 and the
number of TUSKON and ASKON member companies in the top industrial 500 enterprises list
were 45 and 31 respectively in 2009.28 Nevertheless, these numbers should be interpreted
cautiously since during the AKP regime there might be greater incentives for being a member of
an association that is associated with Islamic capitalists. Indeed, the number of MÜSİAD member
companies increased from 1387 in 2000 to more than 6500 in 2012. (Tanyılmaz, 2015).
27 Own calculations based on data supplied by the TUIK and İstanbul Chamber of Industry. 28 The number of TUSKON and ASKON member companies in the top 500 industrial enterprises list was not exhibited for the
previous years (Tanyılmaz, 2015).
[30]
Buğra and Savaşkan (2014) exhibit the change in regional distribution of industry during 2000s as
it is often claimed that the conservative and Islamic capitalists were widely based in Anatolia rather
than in larger city centres like Istanbul or İzmir (e.g. Acemoğlu and Robinson, 2013; Tanyılmaz,
2015). Buğra and Savaşkan show that the largest five cities’ share29 in total exports declined from
84.5% in 2002 to 80.1% in 2008 and to 77.1% in 2012, while the share of emerging five Anatolian
cities’ (Kayseri, Denizli, Konya, Gaziantep, Kahramanmaraş) export share increased from 5.3%
in 2002 to 6.1% in 2008 and to 7.9% in 201230. Hence, during the first years of AKP regime, the
relative share of emerging Anatolian cities in total exports grew at the expense of larger city centres
and this trend continued following the Great Recession of 2008.
Most of the industrial enterprises that were the largest before the AKP regime kept their
dominant economic position and indeed increased their share in total value added during the 2000s.
Figure 5 shows the value added shares of 38 of the 50 private enterprises that were the largest
before the election of AKP government. The value added share of these 38 enterprises in total
industry increased from 10.1% in 2002 to 14.2% in 2012. Although during the AKP regime,
several cities emerged as the new economic centres and some of the conservative and Islam
oriented capitalists increased their revenues, the concentration of income in the largest pre-AKP
capitalists increased.
[Figure 5]
5. Employment and unemployment
Contrary to promises, after almost three decades of extensive liberalization in Turkey, functional
income distribution is changing at the expense of labour as shown above. Moreover, the
29 In their analysis, Buğra and Savaşkan (2014) consider Istanbul and Kocaeli jointly as one city. 30 Nevertheless, Buğra and Savaşkan (2014) also interpret these results cautiously as MÜSİAD, TUSKON and ASKON also work
very actively in larger cities like Istanbul and Izmir.
[31]
persistence of high unemployment and a slowdown in the employment creation capacity of the
economy goes hand in hand with lower labour costs (Onaran, 2009a). Thus, falling labour costs
are not necessarily creating more employment in contrast to the neoliberal thesis. This is
particularly remarkable since it is taking place at a time when the labour market is becoming
increasingly more flexible, as will be discussed in more detail below. Indeed, this pattern is not
specific to Turkey; the stagnation or decline in manufacturing employment can also be observed
in Eastern Europe or Latin America (Onaran, 2008; Pollin et al, 2005). This pattern shows that the
increase in global competition has generated a decline in the employment creation capacity of
economic growth, particularly in manufacturing.
The post-2001 recovery in Turkey has been particularly devastating for labour due the
jobless growth pattern that has dominated the 2000s. After the 2001 crisis, the unemployment rate
hiked to 8.5 per cent in the country compared to a rate of 6.6% in 2000, and the effect was heavier
in the urban areas as can be seen in Figure 6.31 Urban unemployment increased to 11.9 per cent in
2001 and jumped further to 14.6 per cent in 2002. The recovery started only five years after the
crisis, and it was very short lived. The Great Recession has reversed the recovery, and
unemployment started to increase again in 2008, hiking to 13.1% in Turkey in 2009 with non-
agricultural urban unemployment reaching 17.0%. As of July 2015, seasonally adjusted
unemployment rate is as high as 10.4% in Turkey (according to last available data at the time of
writing by the Turkish Statistical Institute (TUIK).
[Figure 6]
Another important issue is the increasing number of discouraged workers. Unemployment rates
reflect only the rate of unemployed as a ratio to labour force. However Turkey also experienced
31 Data in the rest of this section is based on Household Labor Force Surveys by the Statistical Institute of Turkey.
[32]
an increase in the numbers of discouraged workers, who are ready to work, but do not look for job,
because they do not have the hope to find a job, after the crisis. Since these people are regarded as
non-participant, they are not recorded as unemployed; thus the unemployment numbers is
disguising important information. Among the male residing in urban areas, the share of
discouraged workers to non-participant male working age population was just 1.2%, and after a
hike in 2004, it reached 4.4% as of 2012 after falling only to 3.8% in 2013. If we compare the
discouraged workers to non-participant male working age population excluding the retired,
students, disabled, and those, who have not defined their reason, this ratio is as high as 44.7% as
of 2009, and as of 2013 it is still at 36.8%. In 2001 it was only 5.6%.
The problem of unemployment is even more severe for women and the youth. The rate of
unemployment reaches to a remarkable rate of 18.5% for young urban men, and 27.9% for young
women (15-24 years old) in 2013. Among the unemployed of all age groups, 20.8% of urban men
and 30.7% of urban women have been unemployed for more than a year. It is not surprising that
the mass mobilizations in summer 2013 coincided with a time of record high youth unemployment
and increasing precariousness. This is a new generation, who feels insecure about the future,
working, if at all, with fixed/short-term contracts, or part time without a choice, at times in the
informal sector, most often for low pay, and usually in jobs not matching their education levels
and aspirations.
Among the urban women the rate of unemployment (in non-agricultural sector) is 17.3 per
cent in 2013. Moreover, the labour force participation rate of urban women is strikingly low: only
28 per cent as of 2013. As a consequence of the very low female labour force participation rates,
Turkey has a very low employment rate as a ratio to its total working age population: only 43.9
per cent of the urban working age population is employed in 2013. The crisis of 2001 has led to
an increase in female labour force participation rate, which was a mere 17.2% as of 2000. This has
been basically a survival strategy by the households, relying on precarious female employment,
particularly in households, where the male breadwinner had lost his job (Baslevent and Onaran,
[33]
2003). However this increase was also accompanied by a hike in female unemployment rate from
13.0% in 2000 to 16.6% in 2001 and further to 18.7% in 2002. 2009 recession was a further shock
with urban female labour force participation rate increasing to 22.3% along with an unemployment
rate of 21.5%.
The gender-based division of labour, the dismal supply of affordable social services for
childcare, and the low wages in the labour market lead to the exclusion of many women from paid
work. Turkey is not making full use of the productive capacity of its female population. A
phenomenal indicator of the anti-women policy stance of the government is its call for women to
give birth to at least three children, and its attacks on women’s right to abortion and birth control
in an environment where urban female labour force participation is at a level, which bears no
resemblance to a developed country. Even if the women who do not have a paid market job are
still productive through the invisible domestic work, that is reflecting only part of their productive
capacity, and leading to severe inequality problems because of the exclusion of the women from
economic and social life as well as political decision-making processes. However, it is not enough
to simply encourage women to participate in the labour market. Turkey has to combine an
employment-targeting macro policy with policies targeting higher employment rates for women.
This will continue to be one of the significant issues in the process of Turkey’s economic and
social development.
6. Labour market institutions and flexibility
In Turkey and other developing as well as developed countries, low rates of employment growth
are often cited as evidence of labour market rigidities. However, the analysis of labour market
outcomes of structural adjustment above shows that labour has borne the whole burden of the
economy’s adjustment to the neoliberal outward-oriented growth model. The labour market in
Turkey, was not a hindrance to structural adjustment, quite on the contrary the drastic downward
[34]
flexibility of real wages was totally crucial for sustaining the rigidity (or the upward trend) of profit
margins (Onaran and Yentürk, 2002).
Throughout the structural adjustment history of Turkey, changes in labour legislation have
contributed significantly to losses in labour’s share. The military rule of 1980-83 banned union
activity and put an end to strikes. The 1982 Constitution and subsequent labour legislation in 1983
concerning union organization, collective bargaining, strikes and lockouts restricted the
framework of union activity. The right to strike was limited only to collective bargaining disputes.
Labour unions were also barred from engaging in political activity and establishing formal and/or
informal links with political parties. These regulations were preserved during the subsequent
parliamentary regime, as well. The severe suppression of left-wing organizations after the military
coup created an additional process of deterioration in the organizational power and political
engagement of the working class.
Turkey has changed its Labour Law in 2002, going further in the direction of a low road
labour flexibility strategy (Taymaz and Özler 2003). The new legislation has been instrumental in
changing the labour environment in a number of ways. First, it provides a legal basis for part-time
and fixed-term employment. The employers are expected to lower labour costs by switching to
fixed-term contracts and sub-contract labour. Second, it reduces the cost of lay-offs for the
employers. Third, it reduces the coverage of employment protection by excluding those
establishments employing fewer than 30 workers.
Both employment (e.g. working time arrangements) and wages have been rather flexible
in Turkey. This flexibility has removed most of the burden from employers to workers during the
initial stages of adjustment as well as the crisis episodes. The practice of unpaid vacations during
the crises has been one of the striking examples of this flexibility. Under the threat of
unemployment, workers have accepted many disadvantageous arrangements, and even given up
certain concessions obtained through the terms of contract of the formerly signed collective
agreements (Onaran, 2009a). A study by the union of metal workers has shown that job security
[35]
was more important than wages even for workers with low wages (Özuğurlu and Erten, 1999).
However, this flexibility neither has supplied more jobs to the unemployed nor improved the
working conditions of the workers in the longer run. Regarding wage flexibility, it has been shown
that wages have been highly sensitive to labour market conditions in the post-1980s such as the
level of unemployment in the formal sector (Onaran 2002; İlkkaracan and Selim 2002; İlkkaracan
and Yörükoğlu, 2004).
The low levels of trade unionization reject the claim of the employer organizations and the
neoliberal observers that unions are a source of rigidity and thus unemployment. The unionization
rate varied between 11 and 58 per cent, and the collective bargaining coverage varied between 10
and 20 per cent in the early 2000s; even taking into account these considerable sectoral variations
these were very low rates (Ilkkaracan and Levent 2006). However, union power has further
deteriorated significantly under the AKP regime. Union density has more than halved from 9.5%
in 2002 to 4.5% in 2012, and is the lowest among the OECD countries –lower than in Eastern
Europe or Mexico and Korea.32 During a decade of AKP rule the amount of workers working for
outsourced companies has more than tripled reaching to above 1.5 million.
The AKP government’s approach to the labour movements is also very hostile. The AKP
government suspended several large-scale strikes in glass, tyre and metal industries due to its
‘national security’ concerns (Oyvat, 2011; Hürriyet, March 12nd 2014). Moreover, despite the
labour unions’ demands, AKP government did not allow May Day demonstrations in 2003-2008
and 2013-2014 to be conducted in Istanbul’s main square - Taksim. During May Days in 2007,
2008 and again in 2013 and -2014, the AKP government prevented labour union’s demonstrations
in Taksim through police violence and “protected” the Taksim area by cancelling a significant part
of public transportation services in Istanbul to prevent access.
32 Data supplied by http://stats.oecd.org.
[36]
Health and safety regulation violations have also increased under the AKP regime, and almost a
thousand workers died in workplace accidents (Tellioglu, 2014). Dr. Ahmet Tellioglu, a workplace
doctor at a major factory in Istanbul, who has been sacked recently because of his objection to
serious health hazards in the practices of the factory, says that “anyone who is just above the
poorest or earning just above the minimum wage, thus any working person, who has something to
loose, feels increasingly more insecure in Turkey today” (Onaran, 2013:2).
There is also a large informal sector, which is not covered by the labour code. Recently there have
been some improvements in terms of a decline in informal employment. During 2002-2014, the
share of informal employment in the total employment declined from 52.1% to 35%33 as can be
seen in Figure 7. It is worth noting that the fall in informal employment went along with more
deregulation in the labour market and a fall in the power of trade unions, and an overall pro-capital
shift during this period. Moreover, the share of informal employment in non-agricultural
employment in Turkey has an inverted U-shaped shape; hence it slightly increases during 2000-
2005 and declines after 2005. Overall, the non-agricultural informal employment share declines
from 31.7% in 2002 to 22.3% in 2014. The inverted-U shape of the non-agricultural informal
employment share is consistent with the cross-country analyses of Rauch (1993) and Elgin and
Oyvat (2013). Moreover, the share of self-employment and unpaid family workers in non-
agricultural employment also decreased from 19.1% to 13.5% during 2003-2013.
[Figure 7]
Despite improvements, there is still a sizable informal employment. Indeed, the decline in informal
employment temporarily stopped in 2008 and 2009 (Figure 7) as during the Great Recession,
informal employment was possibly a survival strategy for many employees. Although the informal
33 This is consistent with Porta and Shleifer (2014) who exhibit that the informal employment share in total employment is larger
for poorer countries.
[37]
sector seems to be generating employment, it leads not only to loss of tax income but also to a low
productivity production structure.
7. The effect of distribution on growth
From a neoliberal perspective, the weak employment and growth performance of Turkey in an era
of low wages and increasing labour market flexibility may be seen as a puzzle. However, from a
Post-Keynesian perspective, there is evidence that employment is more sensitive to demand
increases than to wage declines (Onaran and Aydıner 2010). As discussed above in Section 2 and
3, there is a continuous deterioration in the growth performance along with the fall in the wage
share.This evidence suggests that the pro-capital redistribution of income has indeed adversely
affected the long-term growth potential of the economy.
Mainstream neoclassical macroeconomic models emphasize the supply side rather than the
demand side of the economy; and assume that demand will follow supply. Neoliberal economic
policies, which have dominated Turkey since 1980, informed by neoclassical economics treat
wages merely as a component of cost, and neglect their role as a source of demand. On the contrary,
post-Keynesian/post-Kaleckian models, as has been formally developed by Bhaduri and Marglin
(1990), reflect the dual role of wages affecting both costs and demand, and while they accept the
direct positive effects of higher profits on investment and net exports emphasized in mainstream
models, they contrast these positive effects with the negative effects on consumption. In these
models, consumption is expected to decrease when the wage share decreases, since the marginal
propensity to consume out of capital income is lower than that out of wage income. A higher
profitability (a lower wage share) is expected to stimulate investment for a given level of aggregate
demand. Also it is often argued that internal funds are an important source of finance and thus
profits may positively influence investment expenditures. However, domestic demand is also a
major factor that stimulates investments; and wages, which have been perceived as a mere cost
[38]
item by the neoliberal policies, are an important component of domestic demand. Finally, for a
given level of domestic and foreign demand, net exports will depend negatively on unit labour
costs, which are by definition closely related to the wage share. Thus, the total effect of the
decrease in the wage share on aggregate demand depends on the relative size of the reactions of
consumption, investment and net exports to changes in income distribution. If the total effect is
negative, the demand regime is called wage-led; otherwise the regime is profit-led.
Previous research by Onaran and Stockhammer (2005) and Onaran and Galanis (2014)
estimate the effect of a rise in the profit share on growth in Turkey among other countries, and find
that the growth regime in Turkey is significantly wage-led. Investments are the major locomotive
force that creates demand and thus employment, and there is no statistically significant effect of
higher profit share on private investment (Onaran and Galanis, 2014; Onaran and Yentürk, 2001).
The increase in profits has been increasingly channelled to financial investment rather than
investment in physical capital and machinery. Even the largest 500 industrial firms in Turkey have
a high and increasing share of net interest and financial income in their total revenues (Istanbul
Chamber of Industry, 2003). On the contrary, the negative effect of the rise in the profit share on
consumption is very strong and more than offset the net export effects, which are also strong.
Overall, econometric estimations by Onaran and Galanis (2014) show that the partial effect of a 1
percentage point increase in the profit share leads to a 0.49 percentage point decrease in
consumption as a ratio to GDP, and only a 0.28 percentage point increase in net exports;
incorporating the multiplier effects as well, a 1 percentage point increase in the profit share leads
to a 0.46 percentage point decrease in the growth of GDP. Onaran and Galanis (2014) further
estimate the global multiplier effects of a simultaneous 1 percentage point decrease in the wage
share in the developed and developing economies of the G20, and find that the loss in growth in
Turkey is at a very high rate by 0.72 percent in the environment of global race to the bottom.
Thus, when wages are suppressed both production and investments are suppressed, and
thereby employment. Turkey’s neoliberal economic policies since 1980 in the last 45 years have
[39]
generated a vicious circle of lower wage share, lower investment, low competitiveness, import
dependency, lower and volatile and jobless growth.
8. Conclusion
The excessive decline in the wage share and real wages are the best indicators to explain the
political economy aspect behind the three decades of neoliberalism. The stability of these policies
throughout governments ranging from centre right to centre left, including various coalitions and
the recent government is astonishing. The deterioration in the organizational power of the labour
movement in terms of both trade unions and political organizations after 1980s has made this anti-
labour consensus possible. The reversal of these policies is also most of all a political issue rather
than a technical problem.
Since 1980s the integration of Turkey to the world economy and the increase in the
profitability of the large conglomerates has been achieved primarily via the decline in the real
wages, and the contraction in domestic demand. During most of this period the increase in exports
has relied on the increased utilization of the productive capacity, which was created in the planned
era of the 1960s and 1970s, rather than new investments and technological improvement (Onaran,
2009a). The lack of investment-led improvements in productivity has also limited the possible
spill-over effects from exports to employment and wages. The subsequent increase in investments
during 2002-07 has not been able to reverse these adverse trends in employment and wages.
Furthermore, the debt-led investment behaviour dependent on financial capital flows turned out to
be an important risk for the sustainability of growth in Turkey during the years after the Great
Recession. The dependence of Turkey on international capital flows, and booms followed by busts
and crises during the post-1990s have had a clear and lasting negative effect on the wage share. In
the meantime, the large-scale entrepreneurs with different backgrounds enjoyed higher incomes
thanks to the neoliberal policies.
[40]
The global crisis and financialization has generated a general stagnation in investments and high
unemployment rates along with a declining wage share in developed as well as developing
countries. An egalitarian way out of this crisis requires a major redefinition of the rules of the
global game. In developing countries like Turkey, in the absence of a trade policy designed based
on industrial development priorities and incomes policy, the increased global competitive
pressures are being shifted onto labour. Dependence on global export markets and the destructive
effects of speculative capital flows make it also harder for countries like Turkey to preserve a
stable development path. In order to be able to realize the possible benefits of international
demand, and generate a not only sustainable but also egalitarian industrial restructuring, a
combination of industrial and trade policy as well as incomes policy is required. These outcomes
call for an alternative macroeconomic policy framework and new global institutions to provide the
proper conditions for such policies.
[41]
References
Acemoğlu and Robinson (2013). “The Political Economy of Turkey”. Why Nations Fail. Retrieved from
http://whynationsfail.com/blog/2013/2/27/the-political-economy-of-turkey.html
Akcay, C. (2008) “Turkey weekly macro comment”, Yapi Kredi Bank, Strategic Planning and Research Section,
mimeo.
Akyüz, Y. and Boratav, K. (2003) “The Making of the Turkish Crisis”, World Development, 31: 1549-1566
Akyüz, Y. (2012). “The boom in capital flows to developing countries: Will it go bust again”. Ekonomi-tek, 1(1), 63-
96.
Atac, I. and Grünewald, A. (2006) “Turkey’s Political Economy between Crisis and Strong Growth: Discussion of the
Europeanisation Dynamics in Turkey”, paper presented at ESA Workshop, Vrije Universiteit Amsterdam,
August-September.
Balkan, N., and Balkan, E. and Öncü, A. (2014). “Foreword” in N. Balkan, E. Balkan and A. Öncü (Eds.) The
Neoliberal Landscape and the Rise of Islamist Capital in Turkey. Berghahn Books.
Bhaduri, A., and Marglin, S. (1990). “Unemployment and the real wage: the economic basis for contesting political
ideologies,” Cambridge Journal of Economics, 14, 375-93
Baslevent, C. and Onaran, Ö. (2003) “Are women in Turkey more likely to become added or discouraged workers?”
, Labour, 17 (3), 439-458.
Buğra, A., and Savaşkan, O. (2014). New Capitalism in Turkey: The Relationship Between Politics, Religion and
Business. Edward Elgar Publishing.
Crotty, J. and Lee, K. (2004) “Was the IMF’s position of economic regime change in Korea justified? A critique of
the IMF’s economic and political role before and after the crisis”, Political Economy Research Institute
Working Papers, 77.
Corke, S., Finkel, A., Kramer, D. J., Robbins, C. A., and Schenkkan, N. (2014). Democracy in Crisis: Corruption,
Media, and Power in Turkey. Freedom House Special Report.
Cömert, H., and Çolak, M. S. (2014). Can Financial Stability be Maintained in Developing Countries after the Global
Crisis: The Role of External Financial Shocks? ERC-Economic Research Center, Middle East Technical
University, No. 1411.
Cumhuriyet (2009, June 3rd), “İşverene teşvik paketini seçme hakkı”, Retrieved from
http://www.cumhuriyet.com.tr/haber/diger/65540/isverene_tesvik_paketini_secme_hakki.html
Deininger K. and Squire L. (1996). “A New Data Set Measuring Income Inequality”. World Bank Economic Review.
10, No 3 Pp. 565-591
Diwan, I. (2001) “Debt as Sweat: Labor, Financial Crises, and the Globalization of Capital”, mimeo, available at
<http://info.worldbank.org/etools/docs/voddocs/150/332/diwan.pdf>
Dündar, C. (2006). Özel arşivinden belgeler ve anılarıyla Vehbi Koç. Doğan Kitap.
Eder, M. (2013). “Deepening neoliberalization and a changing welfare regime in Turkey” in in C. Rodriguez,
A.Avalos, H. Yilmaz, A. I. Planet (Eds.) Turkey's Democratization Process. Routledge.
Elgin, C., and Oyvat, C. (2013). “Lurking in the cities: Urbanization and the informal economy”, Structural Change
and Economic Dynamics, 27, 36-47
Epstein, G. and Power, D. (2003) “Rentier incomes and financial crises: an empirical examination of trends and cycles
in some OECD countries”, Political Economy Research Institute Working Papers, 57.
Erten, B., and Ocampo, J. A. (2014). “Turkey’s Hot-Money Problem“, Project Syndicate, April 4th. Retrieved from
http://www.project-syndicate.org/commentary/bilge-erten-and-jose-antonio-ocampo-show-why-domestic-
macroprudential-regulations-cannot-replace-capital-account-management
Euronews (June 3rd, 2013). “Turkey’ media under fire: Protests at NTV“. Retrieved from
http://www.euronews.com/2013/06/03/turkey-s-media-under-fire-protests-at-ntv/
Financial Times (March 18th, 2014), “Turkey: The Erdogan-Gulen showdown“, Retrieved from
http://www.ft.com/cms/s/0/1b1d4ea0-ab8e-11e3-8cae-00144feab7de.html#axzz3UEqIm2LV
Fishlow, A. (2011). Starting over: Brazil since 1985. Brookings Institution Press.
Goldstein, M. (2005): What might the next emerging-market financial crisis look like?, Institute for International
Economics, Working Paper Series, No. 0 5-7
Hürriyet (February 1st, 2014) “CHP, Sabah-atv satışını sordu”. Retrieved from
http://www.hurriyet.com.tr/ekonomi/25711821.asp
[42]
Hürriyet Daily News (May 16th, 2013).“ Doğuş wins Galataport tender with $702 million bid“. Retrieved from
http://www.hurriyetdailynews.com/dogus-wins-galataport-tender-with-702-million-
bid.aspx?pageID=238&nID=47031&NewsCatID=345
Istanbul Chamber of Industry (2003) “Turkey’s Top 500 Industrial Enterprises”, Istanbul: ICI.
Ilkkaracan, I. and Selim, R. (2003) “The role of unemployment in wage determination: further evidence on the wage
curve from Turkey”, Applied Economics, 35: 1589-1598.
Ilkkaracan, I. and Yorukoglu, A. (2004) “Wage determination process”, in S. Gursel et al. (eds.) The Institutional
Structure of the Labor Market in turkey and Unemployment, İstanbul: TÜSİAD..
Ilkkaracan I. and Levent, H. (2006) “The Role of Labor Market Institutions in Management of Economic Crises: The
Case of Collective Bargaining and Wage Setting in Turkey”, paper presented at EAEPE Annual Conference,
İstanbul, November 2006.
Karacimen E. (2012) Political Economy of Consumer Debt in Developing Countries: Evidence from Turkey, Paper
presented at the 9th Annual Conference of Historical Materialism, 8-11 November 2012, London
Milliyet (April 10th, 2004) “Muhafazakâr MÜSİAD, Metroseksüel olabilir mi?”. Retrieved from
http://www.milliyet.com.tr/2004/04/10/business/abus.html
Neri, M. C. (2010). The decade of falling income inequality and formal employment
generation in Brazil. In Tackling Inequalities in Brazil, China, India and South Africa: The Role of Labour
Market and Social Policies, OECD Publishing
Onaran, Ö. (2002a) "Adjusting the economy through labor market: the myth of rigidity", in N. Balkan and S. Savran
(eds.) Ravages of Neoliberalism: Economy, Society, and Gender in Turkey, New York: Nova Scientific.
Onaran, Ö. (2002b) “Measuring wage flexibility: the case of Turkey before and after structural adjustment”, Applied
Economics, 34: 767-781.
Onaran, Ö. (2006) “Speculation-led growth and fragility in Turkey: Does EU make a difference or can it happen
again?”, in E. Hein et al. (eds.) Macroeconomics and Macroeconomic Policies - Alternatives Approaches to
European Policies, Marburg: Metropolis.
Onaran, Ö. (2007a) “Capital Flows, Turbulences, and Distribution: The Case of Turkey” Intervention, 4: 353-374.
Onaran, Ö. (2007b) “Life after crisis for labor and capital” in E. Yeldan et al (eds.) Neoliberal Globalization as New
Imperialism: Case Studies on Reconstruction of the Periphery, New York: Nova Scientific Publishers.
Onaran, Ö. (2008) “Jobless growth in the Central and Eastern European Countries: A country specific panel data
analysis for the manufacturing industry”, Eastern European Economics, 46(4), 90-115
Onaran, Ö., 2009a. “Labor after the crisis in Turkey”, in Turkish Economy in the Post-crisis Era: The new Phase of
Neoliberal Restructuring, eds. Şenses, F. and Öniş, Z., Routledge, 243-261
Onaran, Ö. (2009b) “Wage share, globalization, and crisis: The case of manufacturing industry in Korea, Mexico, and
Turkey”, International Review of Applied Economics, 3.
Onaran, Ö. (2013). “The Political Economy of Inequality, Redistribution, and the Protests in Turkey”, Vol. II, Issue
6, pp.20-24, Centre for Policy and Research on Turkey, London, Research Turkey.
(http://researchturkey.org/?p=3717)
Onaran, Ö. and Aydıner, N. (2010) “The controversy over employment policy: Low labor costs and openness, or
demand policy? A sectoral analysis for Turkey”, Developing Economies, 48(2): 203-231
Onaran, Ö. and Galanis, G. (2014) “Income distribution and aggregate demand: National and global effects”
Environment and Planning A, 46 (10). 2489-2513
Onaran, Ö. and Stockhammer, E. (2005) “Two different export-oriented growth strategies: accumulation and
distribution in Turkey and South Korea”, Emerging Markets Finance and Trade, 41: 65-89.
Onaran, Ö. and Yentürk, N. (2002) “The mark-up rates in Turkish private manufacturing industry during trade
liberalization”, Journal of Income Distribution, 11(3-4), 21-41.
Onaran, Ö. and Yenturk, N. (2001) “Do low wages stimulate investments? An analysis of the relationship between
wages and investments in Turkish private manufacturing industry”, International Review of Applied
Economics, 15: 359-374.
Oyvat, C. (2011). “Askeri Rejim, Liberalleşme ve Sürecin Ardılları”, Birikim Dergisi-Güncel, Retrieved from
http://www.birikimdergisi.com/guncel/askeri-rejim-liberallesme-ve-surecin-ardillari
Oyvat, C. (2014). Essays on the Evolution of Inequality (Unpublished doctoral dissertation), University of
Massachusetts, Amherst
[43]
Oyvat, C. (2015). “Tuhaf bir sınıf kavramı olarak beyaz ve siyah Türklük”, In “Sınıf nerede? Sınıf ortada…”,
Sendika.Org
Özuğurlu, M. and Erten, A. N. (1999) “Research on the Identity of the Members (in Turkish)”, Trade Union of United
Metal Workers Research Series, 1, Istanbul.
Önis, Z. and Caner, B. (2005). “Turkey’s Political Economy in the Age of Financial Globalization: the Significance
of The EU Anchor” Conference on ‘Europeanization and Transformation: Turkey in the Post-Helsinki Era’
Koc University, Istanbul, December 2-3.
Önis, Z. and Senses, F. (2007) “Global Dynamics, Domestic Coalitions and a Reactive State: Major Policy Shifts in
Post-war Turkish Economic Development”, Middle East Technical University Studies in Development, 34,
(2), 251-86
Öniş, Z., and Güven, A. B. (2011). “Global crisis, national responses: The political economy of Turkish
exceptionalism”, New Political Economy, 16(5), 585-608.
Pollin, R., Burns, J. and Heintz, J., 2004. Global Apparel Production and Sweatshop Labour: Can Raising Retail Prices
Finance Living Wages?, Canadian Journal of Economics, 28: 153-171.
Porta, R. L., and Shleifer, A. (2014). “Informality and Development”, Journal of Economic Perspectives, 28, (3),
109–126
Rauch, J. E. (1993). “Economic Development, Urban Underemployment, and Income
Inequality”, Canadian Journal of Economics. vol. 26(4), pages 901-18
Rodrik, D. (2013). The Past, Present, and Future of Economic Growth, Global Citizen
Foundation, Working Paper 1
Savran, S. (2015). “Class, State and Religion in Turkey” in N. Balkan, E. Balkan and A. Öncü (Eds.) The Neoliberal
Landscape and the Rise of Islamist Capital in Turkey. Berghahn Books.
State Institute of Statistics (SIS) (1950-2001): Survey of Employment, Payments, Production and Tendencies in
Manufacturing Industry, electronic data, Ankara.
Tanyılmaz, K. (2015). “The Deep Fracture in the Big Bourgeoisie in Turkey” in N. Balkan, E. Balkan and A. Öncü
(Eds.) The Neoliberal Landscape and the Rise of Islamist Capital in Turkey. Berghahn Books.
Taymaz, E. and Ozler, S. (2005) “Labour market policies and EU accession: problems and prospects for Turkey”, in
?. Hoekman and S. Togan (eds.), Turkey: Economic Reform and Accession to the EU, Washington, DC:
World Bank and The World Bank and CEPR, pp.223-260.
T24 (2013, December 23rd) “Sabah ve ATV Kalyon İnşaat'a satıldı, işte Kalyon'un diğer projeleri”, Retrieved from
http://t24.com.tr/haber/sabah-ve-atv-kalyona-satildi-iste-kalyonun-diger-projeleri,246533
TCEA, 1999. Flexibility in Working Life (in Turkish), TİSK İnceleme Yayınları, No:190, Ankara
Tellioglu, A. (2014). “Turkey seen through the Prism of Occupational Diseases: Success Story or Hidden Disaster?”
Global Labour Column, Number 178, July 2014, Global Labour University,
http://www.global-labour university.org/fileadmin/GLU_Column/papers/no_178_Tellioglu.pdf
Tekgüç, H. and Atalay, N. (2015). “Sağlıkta Bireysel Sorumluluk ve Rekabet Toplam Maliyetleri Neden Düşürmez?”,
Amme İdaresi Dergisi, 48(1)
The Economist (2015). A frenzy about interest, 14 March.
Uygur, E. (2001). “Turkey From Crisis to Crisis: 2000 November and 2001 February Crises” (in Turkish), Turkey
Economy Institute, Working Paper, No. 2001/1.
Uygur, E. (2010). The Global Crisis and the Turkish Economy,Turkish Economic Association Discussion Paper,
2010/3
Vasudevan, R. (2009). “The credit crisis: is the international role of the dollar at stake?” Monthly Review, 60(11), 24-
35.
Yeldan, E. (2002) “On the IMF-directed disinflation program in Turkey: A program for stabilization and austerity or
a recipe for impoverishment and financial chaos?”, in in N. Balkan and S. Savran (eds.) Ravages of
Neoliberalism: Economy, Society, and Gender in Turkey, New York: Nova Scientific.
Yeldan, E. 2013a, “IMF Dönemi Bitti Aldatmacası,” Cumhuriyet, May 1st
Yeldan, E. 2013b, “Talan Ekonomisi,” Cumhuriyet, June 5th
Yeldan, E., Taşçı, K., Voyvoda, E. and Özsan, M.W. (2012) “Turkey on her way out of
middle-income growth trap: Volume I: Which Turkey? Macro and Regional
Analysis?”, Turkish enterprise and Business confederation, İstanbul
[44]
Yenturk, N. (1999) “Short-Term Capital Inflows and Their Impact on Macroeconomic Order: Turkey in the 1990s”,
Developing Economies, 37: 89-113.
Yükseker, Z. (2013). “Tasarruf-Yatırım Dengesi: Türkiye Uygulaması ve Sorunlar”,
Retrieved from
http://www.researchgate.net/profile/Zafer_Yuekseler/publication/258808662_YATIRIM-
TASARRUF_DENGES_TRKYE_UYGULAMASI/links/00463528f74aca5010000000.pdf
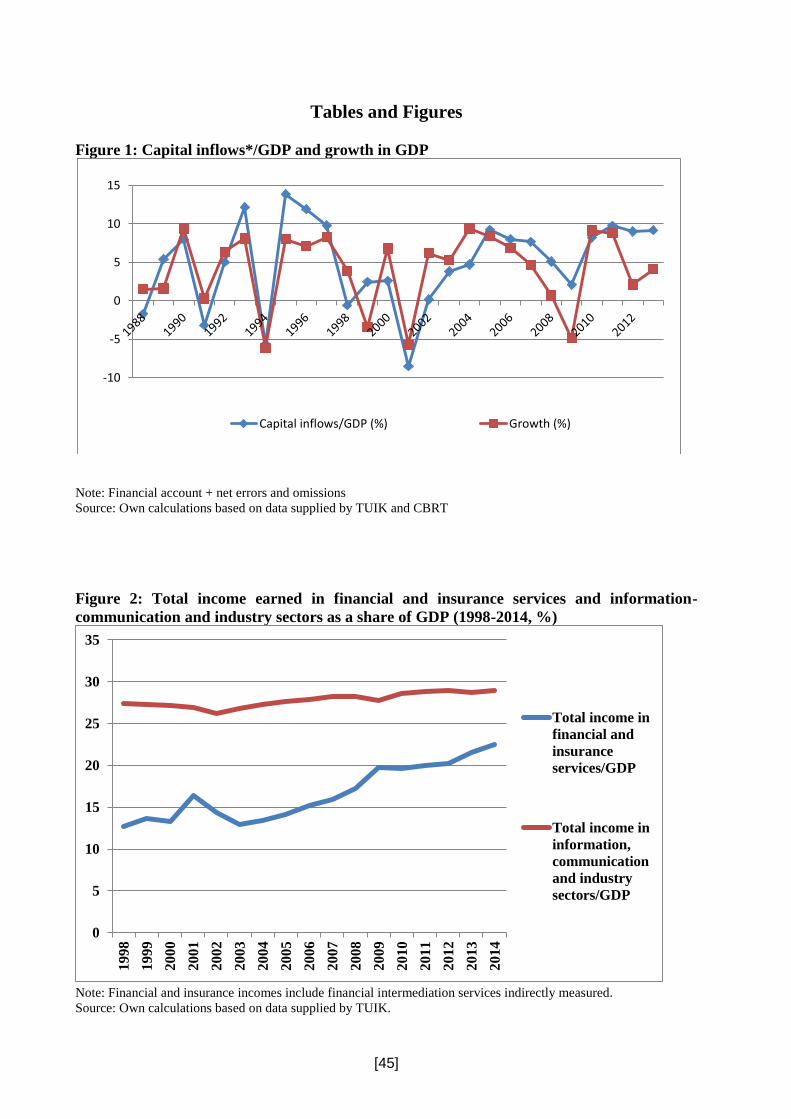
[45]
Tables and Figures
Figure 1: Capital inflows*/GDP and growth in GDP
Note: Financial account + net errors and omissions
Source: Own calculations based on data supplied by TUIK and CBRT
Figure 2: Total income earned in financial and insurance services and information-
communication and industry sectors as a share of GDP (1998-2014, %)
Note: Financial and insurance incomes include financial intermediation services indirectly measured.
Source: Own calculations based on data supplied by TUIK.
-10
-5
0
5
10
15
Capital inflows/GDP (%) Growth (%)
0
5
10
15
20
25
30
35
1998
1999
2000
2001
2002
2003
2004
2005
2006
2007
2008
2009
2010
2011
2012
2013
2014
Total income in
financial and
insurance
services/GDP
Total income in
information,
communication
and industry
sectors/GDP
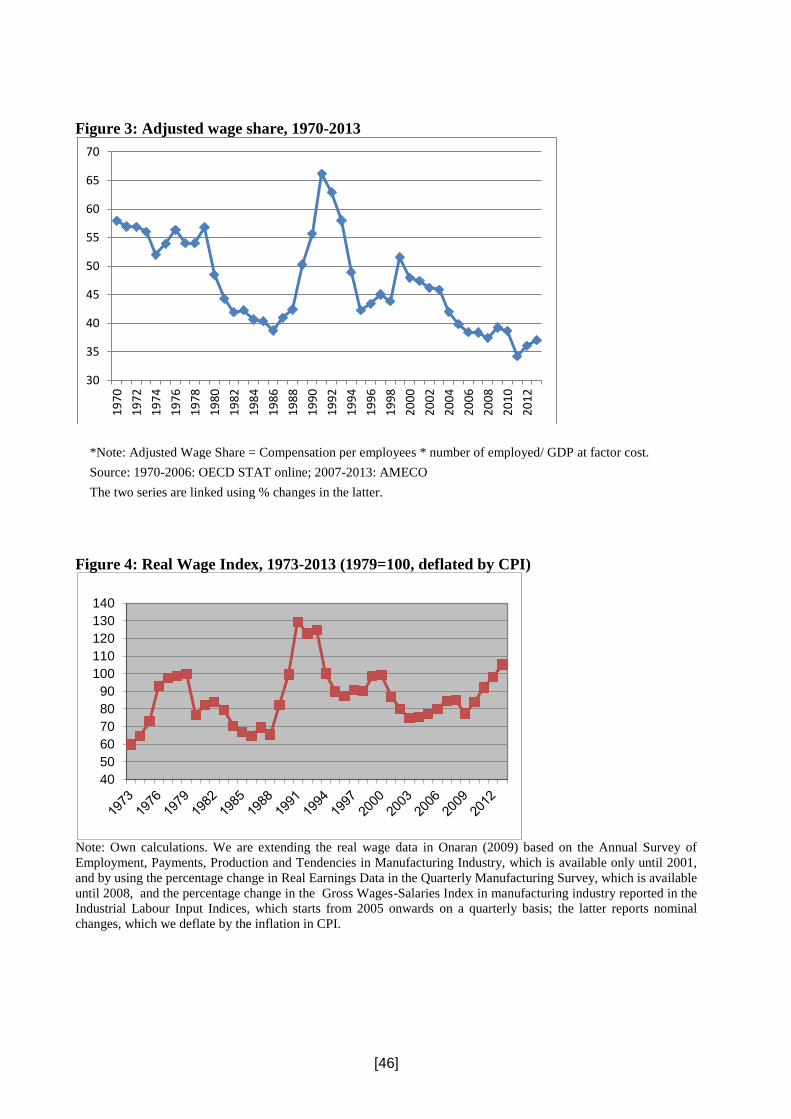
[46]
Figure 3: Adjusted wage share, 1970-2013
*Note: Adjusted Wage Share = Compensation per employees * number of employed/ GDP at factor cost.
Source: 1970-2006: OECD STAT online; 2007-2013: AMECO
The two series are linked using % changes in the latter.
Figure 4: Real Wage Index, 1973-2013 (1979=100, deflated by CPI)
Note: Own calculations. We are extending the real wage data in Onaran (2009) based on the Annual Survey of
Employment, Payments, Production and Tendencies in Manufacturing Industry, which is available only until 2001,
and by using the percentage change in Real Earnings Data in the Quarterly Manufacturing Survey, which is available
until 2008, and the percentage change in the Gross Wages-Salaries Index in manufacturing industry reported in the
Industrial Labour Input Indices, which starts from 2005 onwards on a quarterly basis; the latter reports nominal
changes, which we deflate by the inflation in CPI.
30
35
40
45
50
55
60
65
70
19
70
19
72
19
74
19
76
19
78
19
80
19
82
19
84
19
86
19
88
19
90
19
92
19
94
19
96
19
98
20
00
20
02
20
04
20
06
20
08
20
10
20
12
40
50
60
70
80
90
100
110
120
130
140
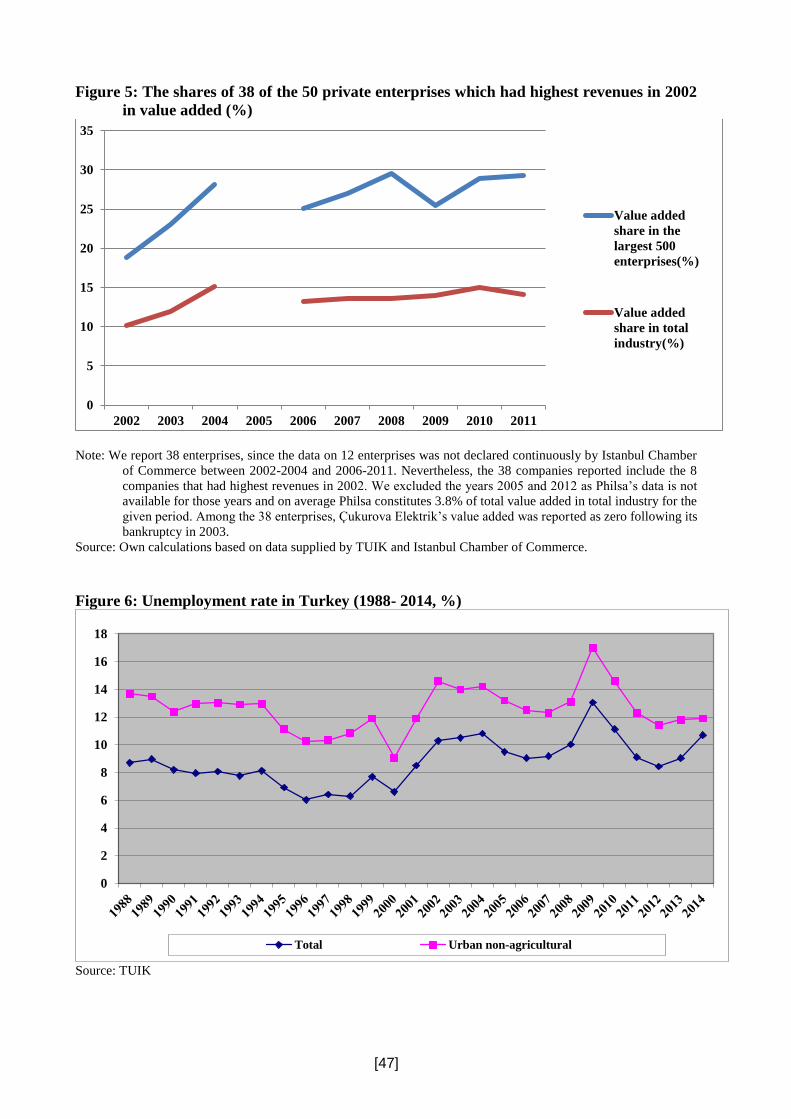
[47]
Figure 5: The shares of 38 of the 50 private enterprises which had highest revenues in 2002
in value added (%)
Note: We report 38 enterprises, since the data on 12 enterprises was not declared continuously by Istanbul Chamber
of Commerce between 2002-2004 and 2006-2011. Nevertheless, the 38 companies reported include the 8
companies that had highest revenues in 2002. We excluded the years 2005 and 2012 as Philsa’s data is not
available for those years and on average Philsa constitutes 3.8% of total value added in total industry for the
given period. Among the 38 enterprises, Çukurova Elektrik’s value added was reported as zero following its
bankruptcy in 2003.
Source: Own calculations based on data supplied by TUIK and Istanbul Chamber of Commerce.
Figure 6: Unemployment rate in Turkey (1988- 2014, %)
Source: TUIK
0
5
10
15
20
25
30
35
2002 2003 2004 2005 2006 2007 2008 2009 2010 2011
Value added
share in the
largest 500
enterprises(%)
Value added
share in total
industry(%)
0
2
4
6
8
10
12
14
16
18
Total Urban non-agricultural
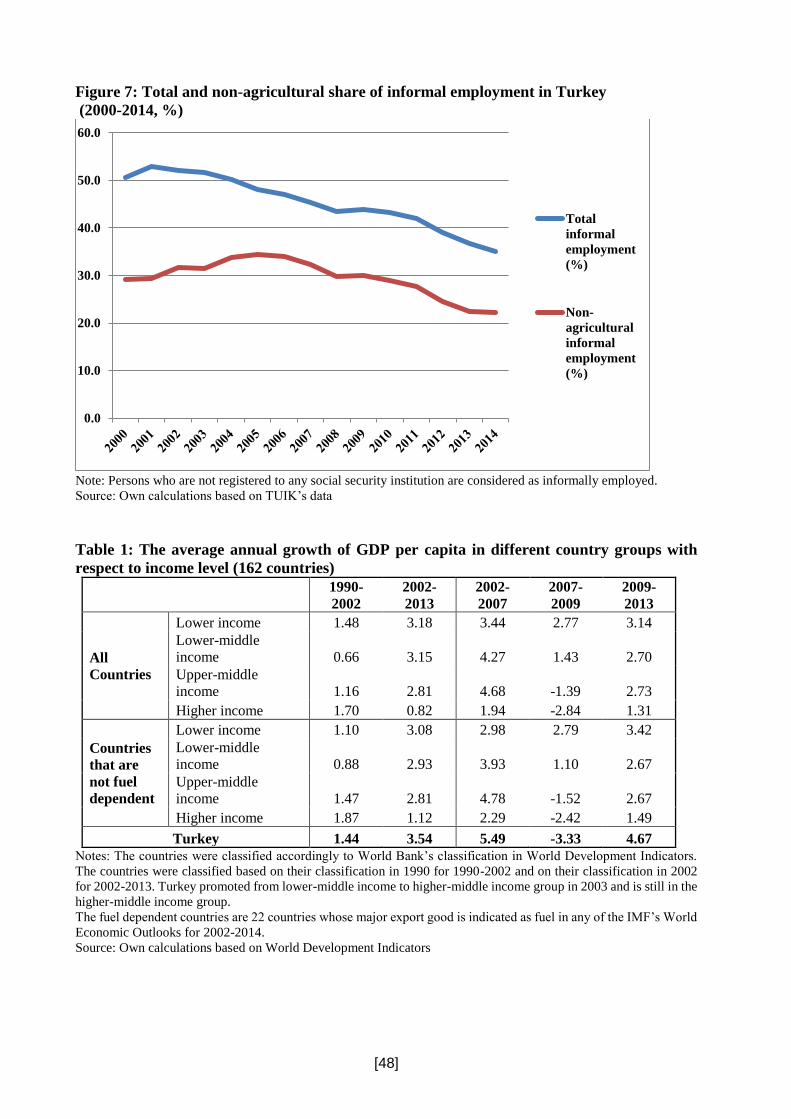
[48]
Figure 7: Total and non-agricultural share of informal employment in Turkey
(2000-2014, %)
Note: Persons who are not registered to any social security institution are considered as informally employed.
Source: Own calculations based on TUIK’s data
Table 1: The average annual growth of GDP per capita in different country groups with
respect to income level (162 countries)
1990-
2002
2002-
2013
2002-
2007
2007-
2009
2009-
2013
All
Countries
Lower income 1.48 3.18 3.44 2.77 3.14
Lower-middle
income 0.66 3.15 4.27 1.43 2.70
Upper-middle
income 1.16 2.81 4.68 -1.39 2.73
Higher income 1.70 0.82 1.94 -2.84 1.31
Countries
that are
not fuel
dependent
Lower income 1.10 3.08 2.98 2.79 3.42
Lower-middle
income 0.88 2.93 3.93 1.10 2.67
Upper-middle
income 1.47 2.81 4.78 -1.52 2.67
Higher income 1.87 1.12 2.29 -2.42 1.49
Turkey 1.44 3.54 5.49 -3.33 4.67
Notes: The countries were classified accordingly to World Bank’s classification in World Development Indicators.
The countries were classified based on their classification in 1990 for 1990-2002 and on their classification in 2002
for 2002-2013. Turkey promoted from lower-middle income to higher-middle income group in 2003 and is still in the
higher-middle income group.
The fuel dependent countries are 22 countries whose major export good is indicated as fuel in any of the IMF’s World
Economic Outlooks for 2002-2014.
Source: Own calculations based on World Development Indicators
0.0
10.0
20.0
30.0
40.0
50.0
60.0
Total
informal
employment
(%)
Non-
agricultural
informal
employment
(%)
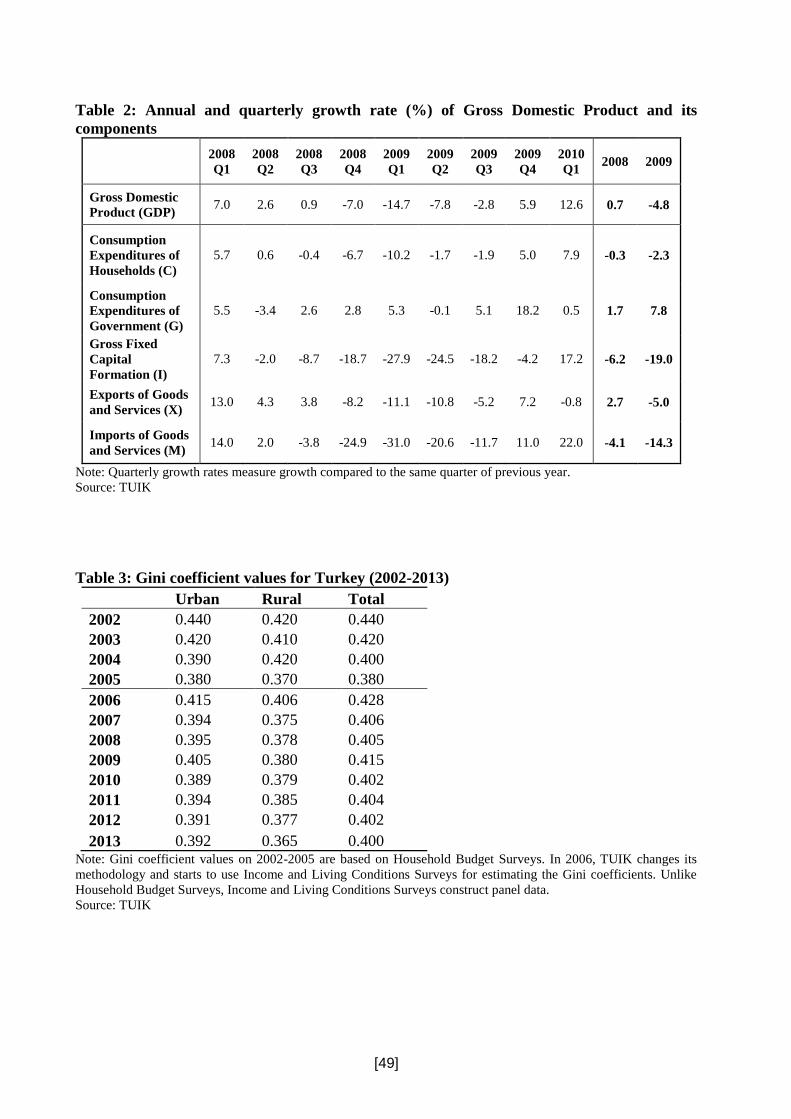
[49]
Table 2: Annual and quarterly growth rate (%) of Gross Domestic Product and its
components
2008
Q1
2008
Q2
2008
Q3
2008
Q4
2009
Q1
2009
Q2
2009
Q3
2009
Q4
2010
Q1 2008 2009
Gross Domestic
Product (GDP) 7.0 2.6 0.9 -7.0 -14.7 -7.8 -2.8 5.9 12.6 0.7 -4.8
Consumption
Expenditures of
Households (C)
5.7 0.6 -0.4 -6.7 -10.2 -1.7 -1.9 5.0 7.9 -0.3 -2.3
Consumption
Expenditures of
Government (G)
5.5 -3.4 2.6 2.8 5.3 -0.1 5.1 18.2 0.5 1.7 7.8
Gross Fixed
Capital
Formation (I)
7.3 -2.0 -8.7 -18.7 -27.9 -24.5 -18.2 -4.2 17.2 -6.2 -19.0
Exports of Goods
and Services (X) 13.0 4.3 3.8 -8.2 -11.1 -10.8 -5.2 7.2 -0.8 2.7 -5.0
Imports of Goods
and Services (M) 14.0 2.0 -3.8 -24.9 -31.0 -20.6 -11.7 11.0 22.0 -4.1 -14.3
Note: Quarterly growth rates measure growth compared to the same quarter of previous year.
Source: TUIK
Table 3: Gini coefficient values for Turkey (2002-2013)
Urban Rural Total
2002 0.440 0.420 0.440
2003 0.420 0.410 0.420
2004 0.390 0.420 0.400
2005 0.380 0.370 0.380
2006 0.415 0.406 0.428
2007 0.394 0.375 0.406
2008 0.395 0.378 0.405
2009 0.405 0.380 0.415
2010 0.389 0.379 0.402
2011 0.394 0.385 0.404
2012 0.391 0.377 0.402
2013 0.392 0.365 0.400 Note: Gini coefficient values on 2002-2005 are based on Household Budget Surveys. In 2006, TUIK changes its
methodology and starts to use Income and Living Conditions Surveys for estimating the Gini coefficients. Unlike
Household Budget Surveys, Income and Living Conditions Surveys construct panel data.
Source: TUIK