Embed Size (px)
Citation preview
The Political Economy of Energy Innovation
AIEE Energy SymposiumMilano – 2 December 2016
Shouro Dasgupta | Enrica De Cian | Elena VerdoliniFondazione Eni Enrico Mattei |
Centro Euro‐Mediterraneo per i Cambiamenti Climatici
Political Economy of Clean Energy1
1. Introduction
• IPCC AR5: It will take unprecedented levels of improvement ininstitutional quality to limit temperature rise below 2°C
• Critical to examine the determinants of energy innovation• This paper: impact of low‐carbon policies, governance
quality, political orientation, and lobbying on innovation• Two indicators of energy innovation
Industrial energy R&D ‐ innovation inputs Energy patents ‐ innovation outputs
Political Economy of Clean Energy2
2. Gaps in the Literature
• Inducement effect of institutions and political economy factorshave not been studied jointly
• Role of governance quality, government political orientation,and lobbying have only received marginal attention
Political Economy of Clean Energy3
3. Measuring Energy Innovation: R&D Expenditure
• R&D in the electricity, water, and gas distribution industry Downstream sector for energy production (power R&D)
• R&D expenditures from Electricity, water, and gas distributionindustry, and Mining Upstream and downstream for energy supply sector (energy R&D)
• Represent a lower‐bound of energy‐related innovation Embedded capital R&D to the energy supply sector not included
Political Economy of Clean Energy4
3.1. Measuring Energy Innovation: Patents
• Power Patents: related to energy generation Energy generations from renewable and non‐fossil sources Technologies improving efficiency of fossil fuels
• Green Patents: power patents and patents related to General environmental management Climate change mitigation Energy efficiency in buildings and lighting Emissions mitigation and abatement Fuel efficiency in transportation
• Environmental patents: sum of power and green patents• We scale all innovation proxies relative to the total value added
to account for the heterogeneity among countries

Political Economy of Clean Energy5
3.2. Measuring Energy Innovation: Sources
• Energy innovation: ANBERD (OECD) Sectoral information for 30 countries: 1990 ‐ 2013
• Patents: OECD Patent Statistics Database and PatentCooperation Treaty (PCT)
Political Economy of Clean Energy6
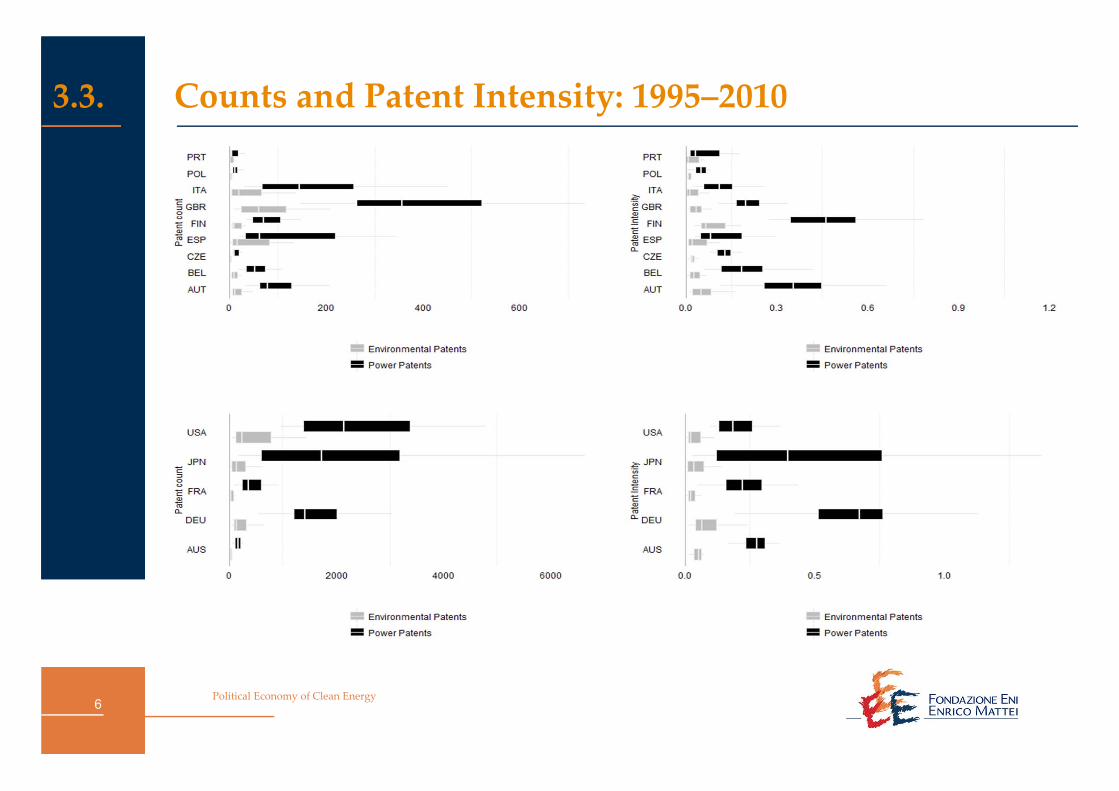
3.3. Counts and Patent Intensity: 1995–2010

Political Economy of Clean Energy7
4. Research Hypotheses
1. Environmental policy stringency results in dynamic efficiencygains and stringent regulations provide long‐term incentivesfor energy‐saving and pollution‐reducing technologies
2. Institutional quality, measured in terms of government quality,increases the incentives to invest in energy‐related innovation

Political Economy of Clean Energy8
4.1. Research Hypotheses
3. Political orientation of government influences investments inenergy innovation but its impact can be ambiguous
4. Higher share of energy intensive sectors induces market‐sizeeffect and increases lobbying power but also increasescoordination costs. Impact of resource distribution oninnovation is not clear a priori
Political Economy of Clean Energy9
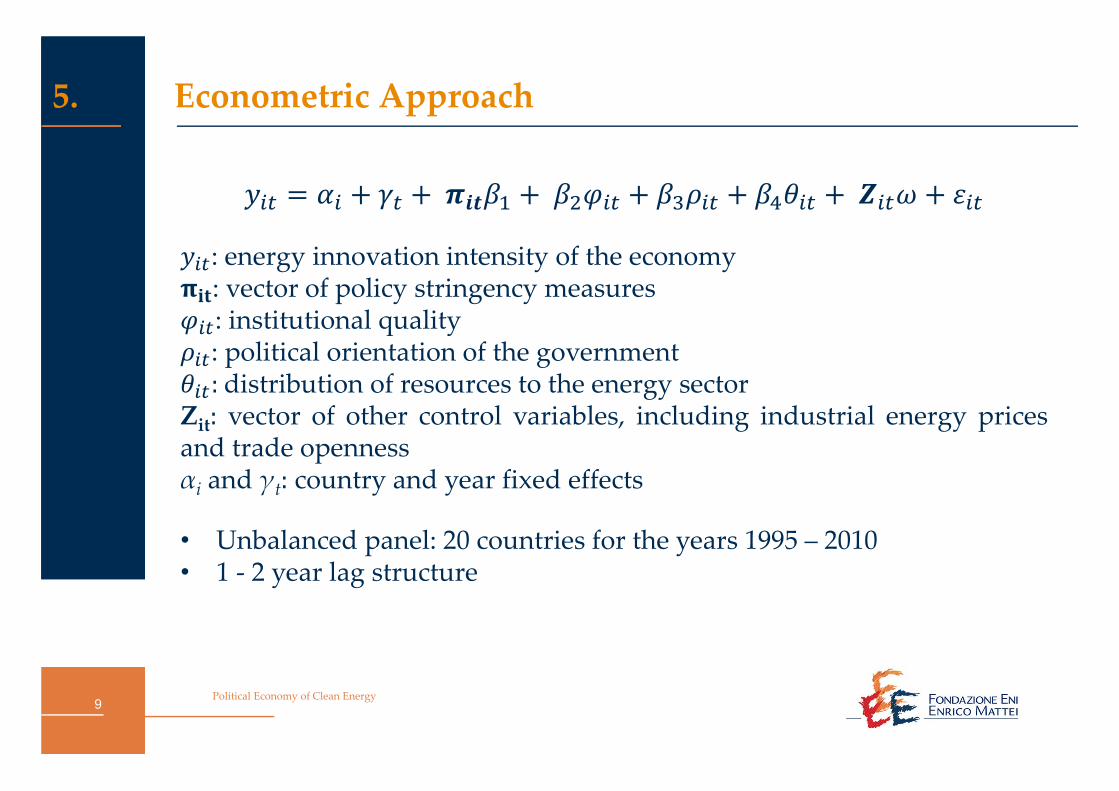
5. Econometric Approach
: energy innovation intensity of the economy: vector of policy stringency measures: institutional quality: political orientation of the government:distribution of resources to the energy sector
Zit: vector of other control variables, including industrial energy pricesand trade opennessαi and γt: country and year fixed effects
• Unbalanced panel: 20 countries for the years 1995 – 2010• 1 ‐ 2 year lag structure
Political Economy of Clean Energy10
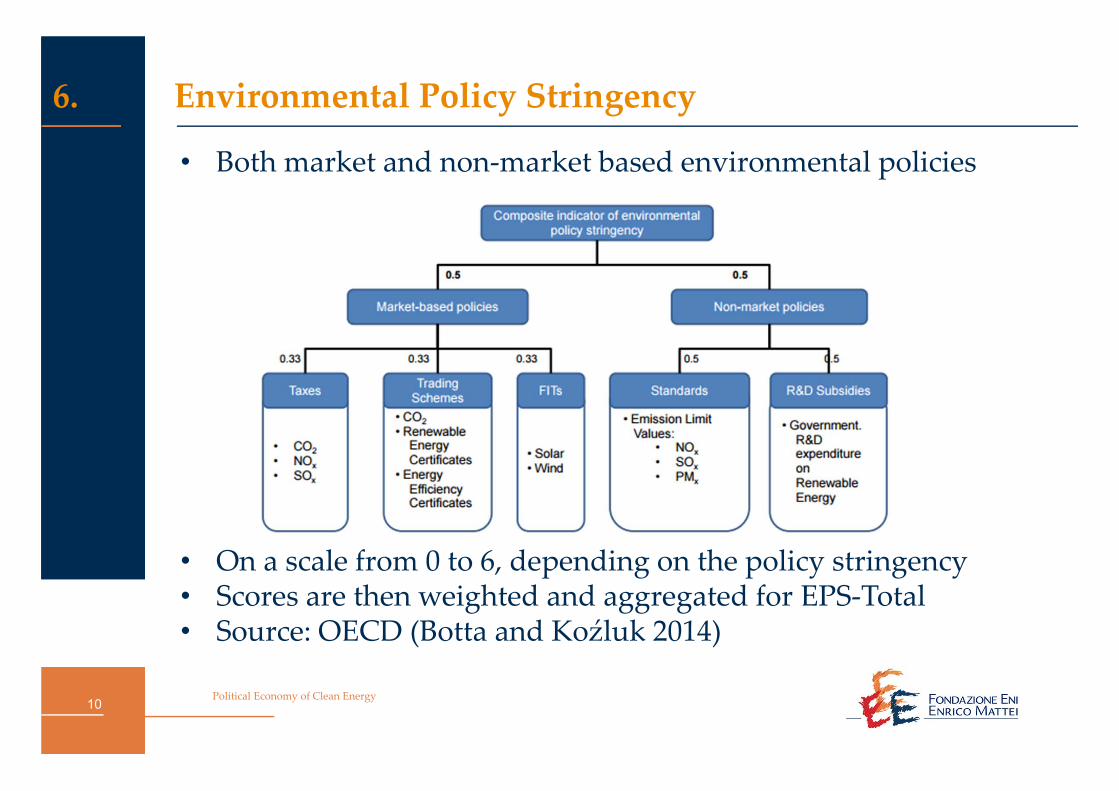
6. Environmental Policy Stringency
• Both market and non‐market based environmental policies
• On a scale from 0 to 6, depending on the policy stringency• Scores are then weighted and aggregated for EPS‐Total• Source: OECD (Botta and Koźluk 2014)
Political Economy of Clean Energy11
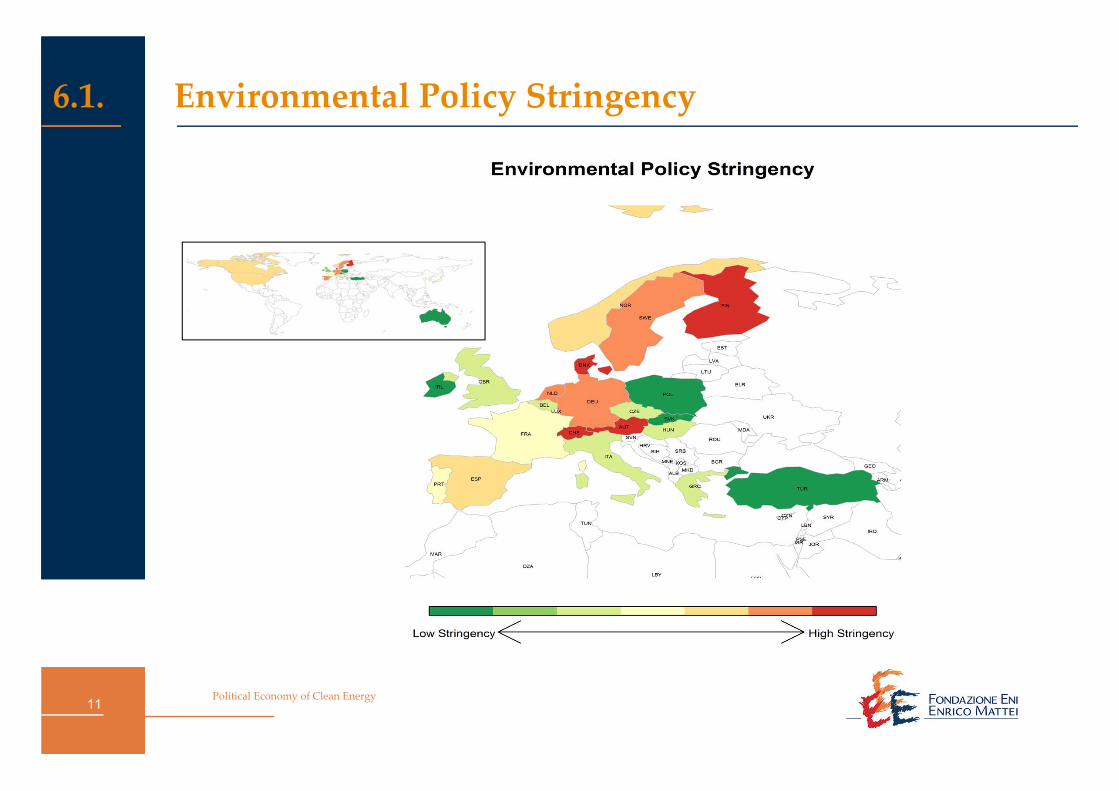
6.1. Environmental Policy Stringency
Political Economy of Clean Energy12
7. Political Economy Factors
Four institutional and political economic factors• Stringency of government support to energy innovation
EPS indicators• Quality of governance (WGI)
Government effectiveness, rule of law, and control of corruption Standardized score (‐2.5 to 2.5)
• Political orientation of the government (DPI) Left‐leaning vs. right‐leaning
• Distribution of resources across interest groups Market‐size effect and the power of the energy lobby Value added share of energy intensive industries

Political Economy of Clean Energy13
8. Variables and Hypotheses
Hypothesis Proxy Variables
Environmental policyEPS‐Market,
EPS‐Non market,EPS‐Total
GovernanceGovernance effectiveness,
Governance Average WGI indicator,Governance x EPS‐Total
Political orientationLeft‐leaning vs. right‐leaning
Lobbying
Value added share of energy‐intensive industriesValue added share of carbon‐intensive industries
Value added share of electricity
Political Economy of Clean Energy14
9. Descriptive StatisticsVariable
Mean
Std. Dev. Min Max Source
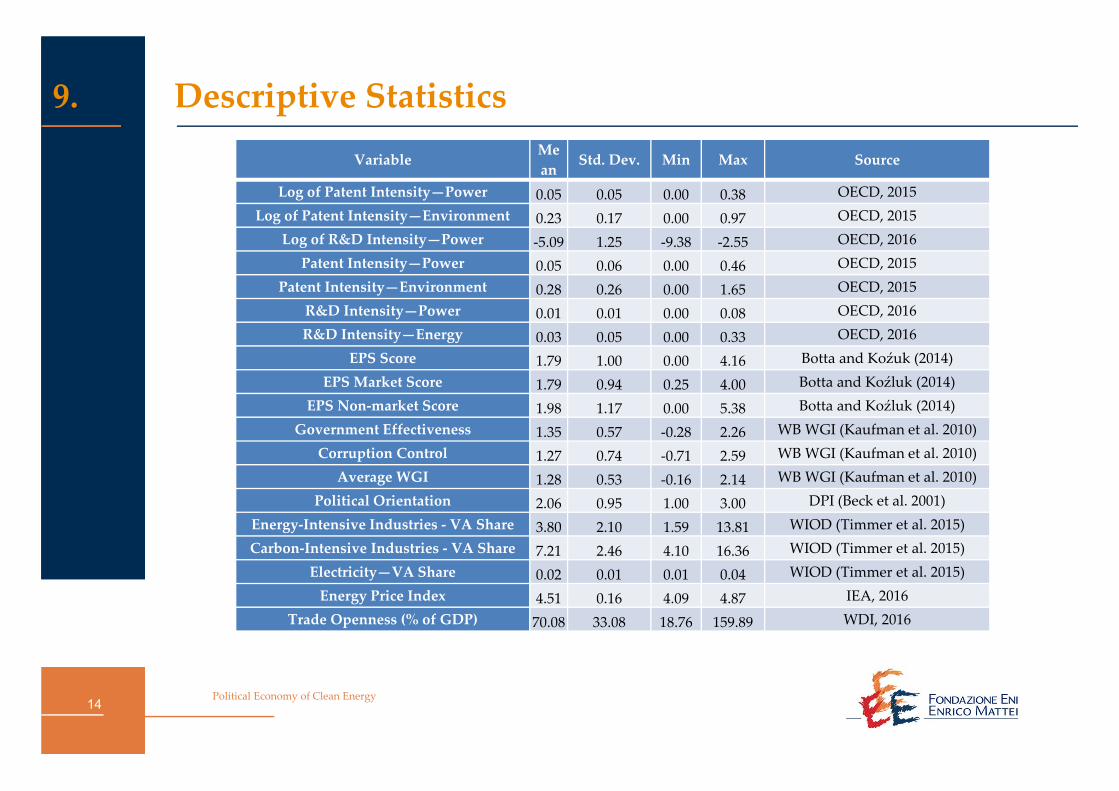
Log of Patent Intensity—Power 0.05 0.05 0.00 0.38 OECD, 2015Log of Patent Intensity—Environment 0.23 0.17 0.00 0.97 OECD, 2015
Log of R&D Intensity—Power ‐5.09 1.25 ‐9.38 ‐2.55 OECD, 2016Patent Intensity—Power 0.05 0.06 0.00 0.46 OECD, 2015
Patent Intensity—Environment 0.28 0.26 0.00 1.65 OECD, 2015R&D Intensity—Power 0.01 0.01 0.00 0.08 OECD, 2016R&D Intensity—Energy 0.03 0.05 0.00 0.33 OECD, 2016
EPS Score 1.79 1.00 0.00 4.16 Botta and Koźuk (2014)EPS Market Score 1.79 0.94 0.25 4.00 Botta and Koźluk (2014)
EPS Non‐market Score 1.98 1.17 0.00 5.38 Botta and Koźluk (2014)Government Effectiveness 1.35 0.57 ‐0.28 2.26 WB WGI (Kaufman et al. 2010)
Corruption Control 1.27 0.74 ‐0.71 2.59 WB WGI (Kaufman et al. 2010)Average WGI 1.28 0.53 ‐0.16 2.14 WB WGI (Kaufman et al. 2010)
Political Orientation 2.06 0.95 1.00 3.00 DPI (Beck et al. 2001)Energy‐Intensive Industries ‐ VA Share 3.80 2.10 1.59 13.81 WIOD (Timmer et al. 2015)Carbon‐Intensive Industries ‐ VA Share 7.21 2.46 4.10 16.36 WIOD (Timmer et al. 2015)
Electricity—VA Share 0.02 0.01 0.01 0.04 WIOD (Timmer et al. 2015)Energy Price Index 4.51 0.16 4.09 4.87 IEA, 2016
Trade Openness (% of GDP) 70.08 33.08 18.76 159.89 WDI, 2016

Political Economy of Clean Energy15
10. Results: R&D Intensity
Political Economy of Clean Energy16
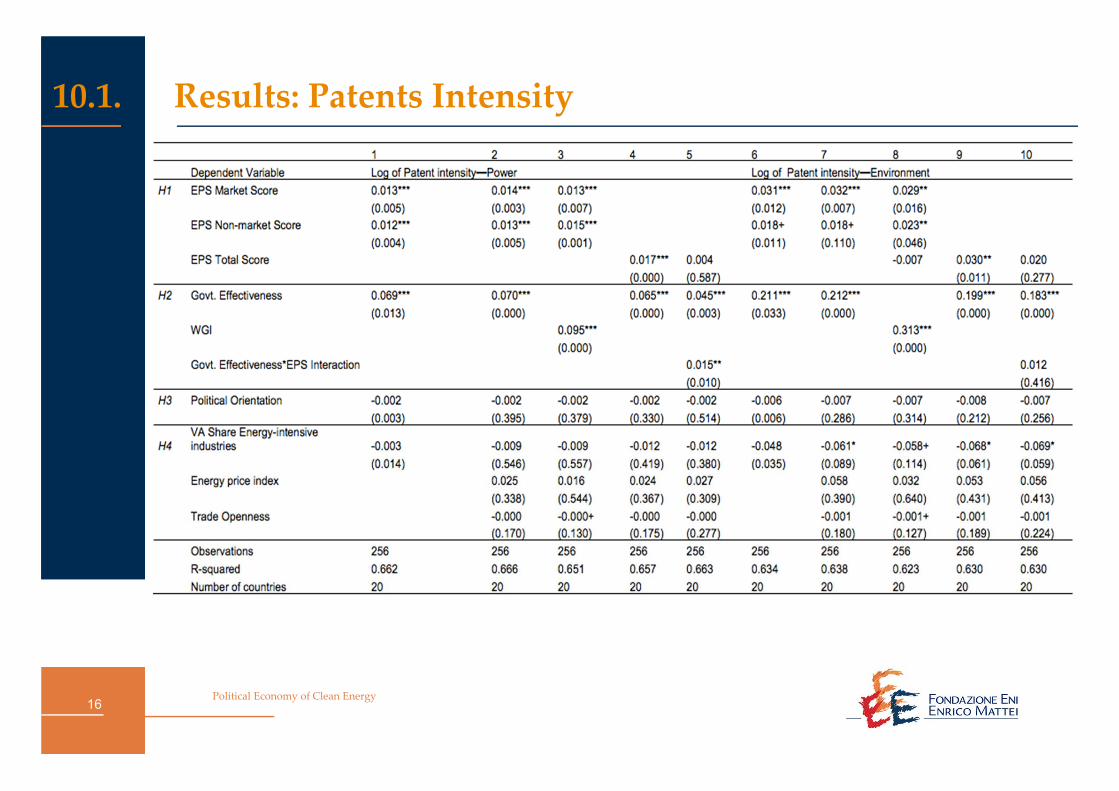
10.1. Results: Patents Intensity

Political Economy of Clean Energy17
10.2. Results
Role of Environmental Policy Stringency• Effect is weaker for energy‐related R&D compared to patents
EPS has a positive and significant effect only on electricity R&D• Inducement effect of market‐based instruments is larger for
environmental patents (broader definition)• One unit increase in EPS (one IQR change)
Market based: increases power patents intensity by between 1.3% ‐1.4%; and environmental patent intensity by between 3% ‐ 3.2%
Non‐market based: increases power patents intensity by between1.2% ‐ 1.5%; and environmental patents intensity by 2.3%
• Stringent policies do result in efficiency gains
Political Economy of Clean Energy18
10.3. Results
Role of Good Governance• Critical driver of energy innovation• One unit increase in governance indicators increases
Power R&D intensity by 62% ‐ 96.4% Patent intensity 6.5% ‐ 31.3%
• 1 unit change: Portugal (1.02) to that of Sweden (2.01) in 2010• Good governance enhances the effect of environmental policies
Role of Political orientation• Significant impact only on R&D intensity• Change from right to left orientation increases industrial R&D
11% (power) and 22% (energy)• Portugal changed to left‐leaning government in 1995, while
Canada and Sweden went the opposite direction
Political Economy of Clean Energy19
10.4. Results
Role of Resource Distribution, Market‐size effect, and Lobbying• Positive impact on R&D intensity
A larger energy sector can lobby for larger R&D allocation• 1% increase in the value added share of energy intensive
industries increases power R&D intensity by 0.54% ‐ 0.83%• Lobbying has greater effect on inward‐oriented sectors – power• Do not result in higher number of cleaner patents
Role of Other Factors• Energy price has a negative effect on power and energy R&D• Trade openness reduces incentives for R&D innovation
Political Economy of Clean Energy20
11. Summary
• Both market and non‐market based incentives result in dynamicefficiency gains
• Better governance promotes energy innovation• Left‐wing governments are more likely to devote R&D
resources to the energy sector Does not translate into higher power‐related patent intensity
• A larger distribution of resources toward energy intensivesectors can induce market‐size effects
Political Economy of Clean Energy21
11.1 Conclusion
• Political economy factors can act as barriers even in the presenceof stringent environmental policy
• To move towards a greener economy, countries should combineenvironmental policy with Improved institutional quality Consider the influence of government’s political orientation Size of energy intensive sectors in the economy which affect both
the lobbying structure and the demand for energy innovations• Focus on the determinants of energy innovation and go beyond
environmental policy instruments

http://www.pathways‐project.eu/ email: [email protected] PATHWAYS_EU
THIS PROJECT HAS RECEIVED FUNDING FROM THE EUROPEAN UNION’S SEVENTH FRAMEWORK PROGRAMME FOR RESEARCH, TECHNOLOGICAL DEVELOPMENT AND DEMONSTRATION UNDER
GRANT AGREEMENT NO 603942

Political Economy of Clean Energy
Backup Slides
Political Economy of Clean Energy
Upper‐bound of Energy R&D
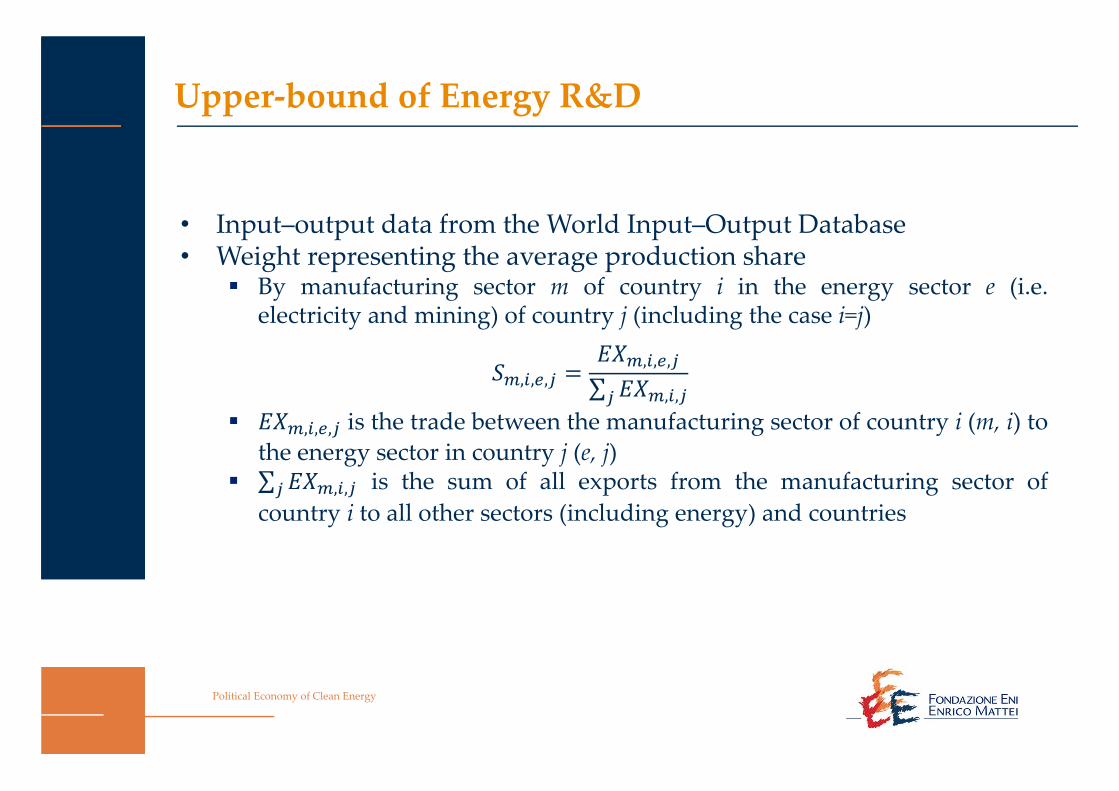
• Input–output data from the World Input–Output Database• Weight representing the average production share
By manufacturing sector m of country i in the energy sector e (i.e.electricity and mining) of country j (including the case i=j)
, , ,, , ,
∑ , , , , , is the trade between the manufacturing sector of country i (m, i) to
the energy sector in country j (e, j) ∑ , , is the sum of all exports from the manufacturing sector of
country i to all other sectors (including energy) and countries
Political Economy of Clean Energy
Upper‐bound of Energy R&D
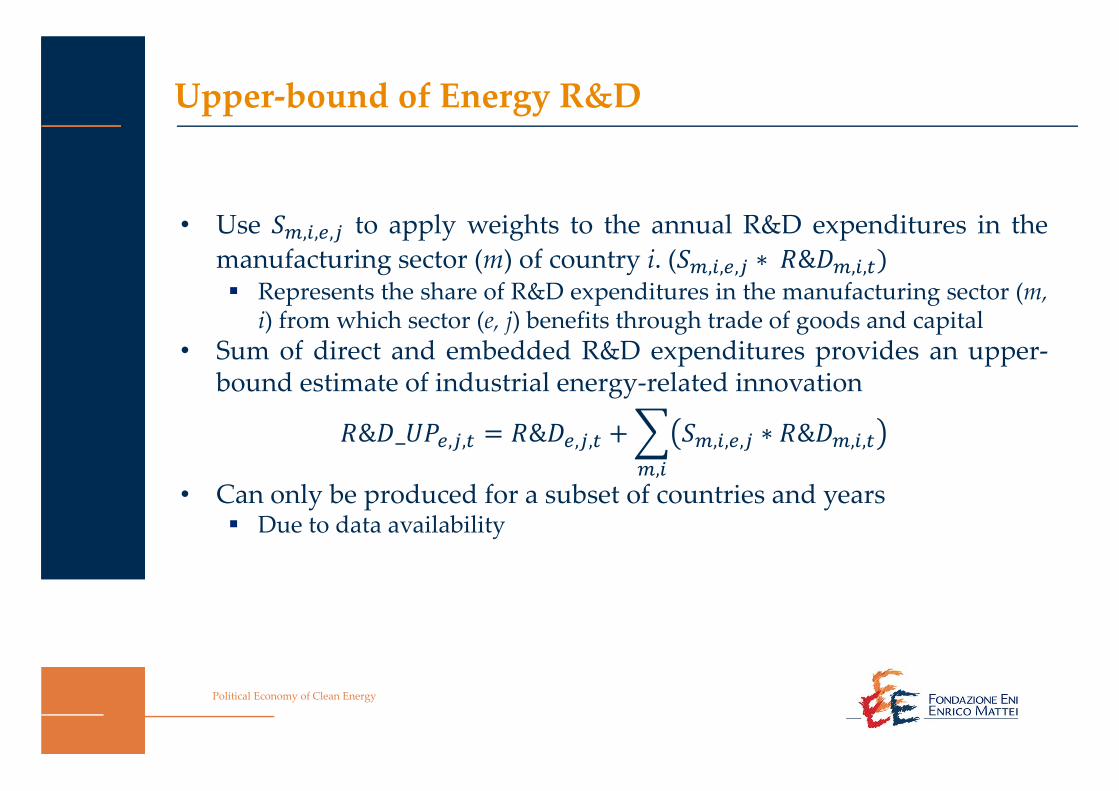
• Use , , , to apply weights to the annual R&D expenditures in themanufacturing sector (m) of country i. ( , , , ∗ & , , Represents the share of R&D expenditures in the manufacturing sector (m,i) from which sector (e, j) benefits through trade of goods and capital
• Sum of direct and embedded R&D expenditures provides an upper‐bound estimate of industrial energy‐related innovation
& _ , , & , , , , , ∗ & , ,,
• Can only be produced for a subset of countries and years Due to data availability
Political Economy of Clean Energy
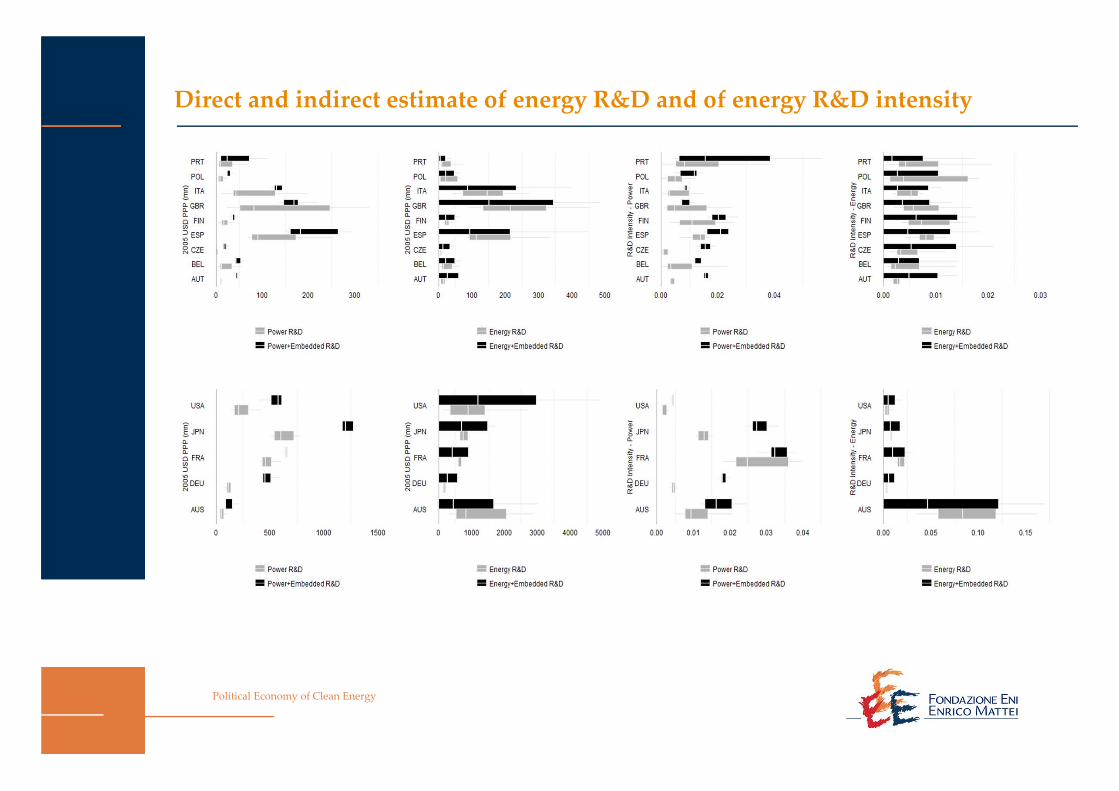
Direct and indirect estimate of energy R&D and of energy R&D intensity