Embed Size (px)
Citation preview

ADULT MORBIDITY ANDMORTALITY PROJECT
MINISTRY OF HEALTHUnited Republic of Tanzania
THE POLICY IMPLICATIONS OF TANZANIA’S MORTALITY BURDEN
Field Operations and Validation StudiesVolume 3
ADULT MORBIDITY ANDMORTALITY PROJECT
MINISTRY OF HEALTHUnited Republic of Tanzania
THE POLICY IMPLICATIONS OF TANZANIA’S M
ORTALITY BURDENVolum
e 3 Field Operations and Validation StudiesA
DU
LT MO
RBIDITY A
ND
MO
RTALITY PRO
JECT

THE POLICY IMPLICATIONS OF TANZANIA’S MORTALITY BURDENVOLUME 1: A TEN-YEAR COMMUNITY-BASED PERSPECTIVE
Foreword by the Honourable Minister of Health
Table of Contents
Acknowledgements/Shukran
From the Project Director
From the Assistant Director-General, Evidence and Information for Policy,World Health Organization
List of Abbreviations
The Policy Implications of Tanzania’s Mortality Burden: Introduction
Part I. The Information Environment in Tanzania, 1997 – 2003Chapter 1 The Purpose of AMMP-2: Health and Demographic Information
Systems in Tanzania, 1997–2003Chapter 2 Costs and Results of Information Systems for Health Sector
Reform, Poverty Monitoring, and Local Government Reform in Tanzania
Chapter 3 The Vision of a National Sentinel Surveillance System of Linked Demographic Surveillance Sites for Health and Poverty Monitoring in Tanzania
Chapter 4 The Impact of AMMP on Evidence-Based Policy and Practice
Part II. Description of Sentinel Area Populations and Representativeness of a ‘National Sentinel Population’
Chapter 5 Description of Population Structures and Components of Change in Sentinel Areas
Chapter 6 How Representative Are Pooled Sentinel Area Data for National Estimates? A Comparison of Demographic and Housing Indicators in a National Sentinel Population with Alternative Data Sources
Part III. The Policy Implications of Inequalities in Tanzania’s Mortality BurdenChapter 7 Progress Toward National Health Sector, Poverty Reduction, and
Millennium Development Goals: Inequalities in Key IndicatorsChapter 8 Inequalities in Intervention-Addressable Mortality and Health
Service Use: How Would Health Service Priorities Based on Burdens in the Poorest Sentinel Villages and Wards Differ from Those of the Least Poor?
Chapter 9 Trends in Cause-Specific Mortality: Main Findings and Implications of Mortality Inequalities
Contributors and Acknowledgements, Volume 1
Table of Contents

THE POLICY IMPLICATIONS OF TANZANIA’S MORTALITY BURDENVOLUME 2: COLLECTED PUBLICATIONS AND REPORTS
Table of Contents
Introduction to Volume 2
Part I: Articles, Book Chapters, and Correspondence
1. Kitange, HM and ABM Swai, The Tanzanian WHO Interhealth Project.Practical Diabetes Digest, 1990. 1: p. 148-149.
2. McLarty, DG, C Pollitt, and ABM Swai, Diabetes in Africa. Diabetic Medicine,1990. 7(8): p. 670-684.
3. Ramaiya, KL, ABM Swai, DG McLarty, et al., Improvement in glucose toleranceafter one year of follow-up in a Hindu community in Africa. Diabetes Research andClinical Practice, 1990. 10: p. 245-255.
4. Swai, ABM, DG McLarty, F Sherrif, et al., Diabetes and impaired glucose tolerance in an Asian community in Tanzania. Diabetes Research and Clinical Practice, 1990. 8: p. 227-234.
5. Mwaluko, GMP, ABM Swai, and DG McLarty, Non-communicable disease, inHealth and Disease in Tanzania, G. Mwaluko, W. Kilama, P. Mandara, et al.,Editors. 1991, Harper Collins Academic: London. p. 219-237.
6. Ramaiya, KL, AB Swai, DG McLarty, et al., Prevalences of diabetes and cardiovascular disease risk factors in Hindu Indian subcommunities in Tanzania.BMJ, 1991. 303: p. 271-276.
7. Ramaiya, KL, ABM Swai, DG McLarty, et al., Impaired glucose tolerance and diabetes mellitus in Hindu immigrants in Dar es Salaam. Diabetic Medicine, 1991.8: p. 738-744.
8. Swai, AB, H Kitange, DG McLarty, et al., No deterioration of oral glucose toleranceduring pregnancy in rural Tanzania. Diabetic Medicine, 1991. 8: p. 254-257.
9. Swai, AB, DG McLarty, HM Kitange, et al., Study in Tanzania of impaired glucose tolerance: methodological myth? Diabetes, 1991. 40: p. 516-520.
10. Swai, ABM, HM Kitange, G Masuki, et al., Is diabetes mellitus related to undernutrition in rural Tanzania? BMJ, 1992. 305: p. 1057-1062.
11. Swai, AB, DG McLarty, BL Mtinangi, et al., Diabetes is not caused by cassava toxicity. A study in a Tanzanian community. Diabetes-Care, 1992. 15(10): p.1378-1385.
12. Kitange, H, ABM Swai, PM Kilima, et al., Anaemia is a major public health problem in Tanzania. Health Policy and Planning, 1993. 8: p. 413-418.
13. Kitange, HM, AB Swai, G Masuki, et al., Coronary heart disease risk factors in sub-Saharan Africa: studies in Tanzanian adolescents. Journal of Epidemiology andCommunity Health, 1993. 47(4): p. 303-307.
14. Kitange, H, ABM Swai, DG McLarty, et al., Schistosomiasis prevalence after

administration of praziquantel to school children in Melela village, Morogoro region,Tanzania. East African Medical Journal, 1993. 70: p. 782-786.
15. Mlingi, NV, VD Assey, ABM Swai, et al., Determinants of cyanide exposure fromcassava in a konzo-affected population in northern Tanzania. International Journalof Food Science and Nutrition, 1993. 44(13): p. 137-144.
16. Swai, ABM, DG McLarty, HM Kitange, et al., Low prevalence of risk factors forcoronary heart disease in rural Tanzania. International Journal of Epidemiology,1993. 22(651-659).
17. Kitange, H, ABM Swai, G Masuki, et al., Perinatal mortality in rural Tanzania.World Health Forum, 1994. 15: p. 82-84.
18. Kitange, HM, H Machibya, J Black, et al., Outlook for survivors of childhood mortality in sub-Saharan Africa: Adult Mortality in Tanzania. BMJ, 1996. 312: p.216-220.
19. Aspray,T, H Kitange, P Setel, et al., Disease Burden in sub-Saharan Africa (letter).Lancet, 1998. 351(April): p. 9110.
20. Kitange, H, F Mugusi, and P Setel, The burden of non-communicable diseases.Africa Health, 1998. 20( July): p. 17-18.
21. Unwin, N, G Alberti, T Aspray, et al., Economic globalisation and its effect on health. BMJ, 1998. 316: p. 1401-1402.
22. Smide, B, DR Whiting, F Mugusi, et al., Self-perceived health in urban diabetic patients in Tanzania. East African Medical Journal, 1999. 76(2): p. 67-70.
23. Quigley, MA, D Chandramohan, P Setel, et al., Validity of data-derived algorithms for ascertaining causes of adult death in two African sites using verbal autopsy. Tropical Medicine and International Health, 2000. 5(1): p. 33-39.
24. Rashid, S, TJ Aspray, R Edwards, et al., The pitfalls of measuring changes in smoking habits. Tropical Doctor, 2000. 30: p. 160-161.
25. Setel, P, Y Hemed, N Unwin, et al., Six-Year Cause-Specific Adult Mortality in Tanzania: Evidence from Community-based Surveillance in Three Districts 1992-1998. Morbidity and Mortality Weekly Report., 2000. 49(19): p. 416-419.
26. Setel, P, D Whiting, Y Hemed, et al., Educational status is related to mortality atthe community level in three areas of Tanzania, 1992-1998. Journal of Epidemiology and Community Health, 2000. 54: p. 936-937.
27. Walker, RW, DG McLarty, HM Kitange, et al., Stroke mortality in urban and rural Tanzania. Lancet, 2000. 355(9216): p. 1684-1687.
28. Alberti, G, Non-communicable diseases: tomorrow’s pandemics. Bulletin of the World Health Organization, 2001. 79(10): p. 907.
29. Boulle, A, D Chandramohan, and P Weller, A case study of using artificial neuralnetworks for classifying cause of death from verbal autopsy. International Journal ofEpidemiology, 2001. 30: p. 515-520.
30. Chandramohan, D, B Greenwood, J Cox, et al., Relationship between malaria endemicity and acute febrile illness mortality in children. Bulletin of the World
Health Organization, 2001. 79(4): p. 375-376.
31. Chandramohan, D, P Setel, and M Quigley, Misclassification error in verbal autopsy: can it be adjusted? International Journal of Epidemiology, 2001. 30(3): p.509-514.
32. Moshiro, C, R Mswia, K Alberti, et al., The importance of injury as a cause of deathin sub-Saharan Africa: results of a community-based study in Tanzania. Public Health, 2001. 115: p. 96-102.
33. Setel, P, Y Hemed, D Whiting, et al., The worst of two worlds: Adult mortality inTanzania. Insights Health, 2001. 1(March): p. 3-4.
34. Unwin, N, P Setel, S Rashid, et al., Non-communicable diseases in sub-Saharan Africa: where do they feature in the health research agenda? Bulletin of the World Health Organization, 2001. 79(10): p. 947-953.
35. Bovet, P, AG Ross, J-P Gervasoni, et al., Distribution of blood pressure, body massindex, smoking habits, and associations with socio-economic status in Dar es Salaam,Tanzania. International Journal of Epidemiology, 2002. 31: p. 240-247.
36. Jagoe, K, R Edwards, F Mugusi, et al., Tobacco smoking in Tanzania, East Africa: population-based smoking prevalence using expired alveolar carbon monoxide as a validation tool. Tobacco Control, 2002. 11: p. 210-214.
37. Mswia, R, D Whiting, G Kabadi, et al., Dar es Salaam Demographic SurveillanceSystem, in Population and Health in Developing Countries. Volume 1: Population,Health, and Survival in INDEPTH Sites, The INDEPTH Network, Editor.2002, International Development Research Centre: Ottawa. p. 143-150.
38. Mswia, R, D Whiting, G Kabadi, et al., Hai District Demographic Surveillance System, in Population and Health in Developing Countries. Volume 1: Population,Health, and Survival in INDEPTH Sites, The INDEPTH Network, Editor.2002, International Development Research Centre: Ottawa. p. 151-158.
39. Mswia, R, D Whiting, G Kabadi, et al., Morogoro Rural Demographic Surveillance System, in Population and Health in Developing Countries. Volume 1:Population, Health, and Survival in INDEPTH Sites, The INDEPTH Network, Editor. 2002, International Development Research Centre: Ottawa.p. 165-172.
40. Mwageni, E, D Momburi, Z Juma, et al., Rufiji Demographic Surveillance System, in Population, Health and Survival in Developing Countries. Volume 1:Population, Health, and Survival in INDEPTH Sites, The INDEPTH Network, Editor. 2002, International Development Research Centre: Ottawa.p. 173-181.
41. Mswia, R, M Lewanga, C Moshiro, et al., Community-based Monitoring of SafeMotherhood in the United Republic of Tanzania. Bulletin of the World Health Organization, 2003. 81(2): p. 87-94.
42. Setel, P, Non-Communicable Diseases, Political Economy and Culture in Africa:Anthropological Applications in an Emerging Pandemic. Ethnicity and Disease,2003. 13[suppl2]: p. 149-153.
43. Setel, P and Y Hemed, Box 1.1: Sentinel vital registration in the United Republic

of Tanzania, in World Health Report 2003. Shaping the Future, World Health Organization, Editor. 2003, World Health Organization: Geneva. p. 7.
44. Whiting, DR, L Hayes, and NC Unwin, Challenges to health care for diabetes inAfrica. Journal of Cardiovascular Risk, 2003. 10: p. 103-110.
45. Bryce, J., Victora, C.G., Habicht, J.-P., et al., The Multi-Country Evaluation ofthe Integrated Management of Childhood Illness Strategy: Lessons for the Evaluationof Public Health Interventions. American Journal of Public Health, 2004. 94(3):p. 406-415.
46. Setel, PW, L Saker, NC Unwin, et al., Is it Time to Reassess the Categorization ofDisease Burdens in Low-Income Countries? American Journal of Public Health,2004. 94(3): p. 384-388.
Part II: Theses and Selected Reports, Working Papers and Presentations
List of Theses
1. Amaro, RA, An Assessment of the Causes of Maternal Mortality for Tanzania Women: A Case Study of Hai District. MSc. 1998, Queen Margaret College:Edinburgh.
2. Boulle, A, The role of neural networks in public health practice: a case study in causeof death classification. MSc. 1999, University of London School of Hygeine andTropical Medicine: London.
3. Dawson, SG, Developing Location-Specific Measures of Socio-Economic Status in Partially Subsistent Economies. PhD. 1997, University of Liverpool: Liverpool.
4. Kissima, J.G.N, An Analysis of Under-Five Mortality Rates and their Causes in Developing Countries: Implications for Hai District, Tanzania. MSc. 1995, QueenMargaret College: Edinburgh.
5. Makundi, A. Community Social Valuation: Disability and Disease in Two Selected Communities: Temeke and Moshi Districts, Tanzania. MSc. 2000, University of Bergen: Bergen.
6. Madden, M, Assigning Adult Causes of Death via Verbal Autopsy using Data-derived Algorithms, MS. 2002, Brigham Young: Provo.
7. Masawe, GJ, Measurement of the Prevalence of Arthritis in the Hai District,Tanzania, MSc. 1994, Queen Margaret College: Edinburgh.
8. Mayunga, J.S. Handling health data in a GIS environment: geo-referencing and analysis: the case study of Dar es Salaam, Tanzania. MSc. International Institute for Geo-Information Science and Earth Observation: Enschede, The Netherlands.
9. Mkamba, M.S.A. The Measurement of Determinants of Injury due to Road TrafficAccidents in Tanzania. MSc. 1995, Queen Margaret’s College: Edinburgh.
10. Nguluma, M. An Anti-Smoking Health Education Project for the Morogoro Districtof Tanzania. Diploma in Primary Health Care. 1992, Queen Margaret’s College: Edinburgh.

11. Smide, B. Self-care, foot problems and health in Tanzanian diabetic patients and comparisons with matched Swedish diabetic patients. PhD. 1999, Uppsala University: Uppsala.
Selected Reports, Working Papers, and Presentations
1. Ministry of Health and AMMP Team, The Policy Implications of Adult Morbidity and Mortality. End of Phase 1 Report. (Executive Summary). 1997,United Republic of Tanzania: Dar es Salaam.
2. Ministry of Health and AMMP Team, The Intervention-Addressable Burden ofMortality Among Children Under 5 in AMMP Districts (July 1992-June1998).Preliminary Analysis. (Technical Report No. 5). 1999, Ministry of Health,United Republic of Tanzania: Dar es Salaam.
3. Setel, P, N Mndeme, M Lewanga, et al., Analysis of Newsletter Readership in AMMP Demographic Surveillance System Areas 1998-1999. Technical Report No. 6. 2000, Ministry of Health, Adult Morbidity and Mortality Project & Health Information and Research Section, Department of Policy and Planning:Dar es Salaam.
4. Adult Morbidity and Mortality Project and National Sentinel Surveillance Teams (Tanzanian Ministry of Health), Seminar on Poverty and the Burden ofDisease in Tanzania, March 5-8, 2001. Summary of Proceedings. 2001, Ministryof Health, United Republic of Tanzania: Dar es Salaam.
5. Mwinyi, HA. Information for Strengthening Health Reforms: A Tanzanian Perspective. A Speech by the Honourable Dr Hussein Ali Mwinyi (MP),Deputy Minister of Health, United Republic of Tanzania to the Commonwealth Regional Health Secretariat Health Ministers Meeting October 23 – 26, 2001. Speech given at Commonwealth Regional Health Secretariat Health Ministers Meeting. 2001. Dar es Salaam.
6. National Sentinel Surveillance System and Adult Morbidity and Mortality Project, Progress in Safe Motherhood in Tanzania during the 1990s: findings basedon NSS/AMMP monitoring. (Working Paper No. 1). 2001, Adult Morbidity andMortality Project, Ministry of Health: Dar es Salaam.
7. Setel, P, V Mkusa, and and the AMMP Team, Comprehension of Swahili Verbal Autopsy Forms. AMMP Technical Report No. 7. 2001, Adult Morbidity and Mortality Project & Health Information and Research Section,Department of Policy and Planning, Ministry of Health, United Republic of Tanzania: Dar es Salaam.
8. Abeyasekera, S and P Ward, Models for Predicting Expenditure per Adult Equivalent for AMMP sentinel surveillance sites. 2002, Adult Morbidity and Mortality Project, Tanzanian Ministry of Health: Dar es Salaam.
9. National Sentinel Surveillance System and Adult Morbidity and Mortality Project Team, Setting Priorities in Health Care: use of diverse information perspectives at the district level in Tanzania. (Working Paper No. 4). 2002, UnitedRepublic of Tanzania Ministry of Health: Dar es Salaam.

10. National Sentinel Surveillance System and Adult Morbidity and Mortality Project Team, Community-Level Trends and Inequalities in Acute Febrile Illness mortality in Tanzania 1996-2001: a case for ‘socio-geographic’ targeting ofinterventions? (Working Paper No. 6). 2002, United Republic of Tanzania Ministry of Health: Dar es Salaam.
11. Clark, S, P Setel, K Kahn, et al. The Role of AIDS/TB in Mortality Patterns in East and Southern Africa: Evidence from Four Demographic Surveillance Sites.Paper presented at Empirical Evidence for the Demographic and Socio-economic Impacts of AIDS. 2003. Durban, South Africa.
12. National Sentinel Surveillance System and Adult Morbidity and Mortality Project Team, Suitability of Participatory Methods to Generate Variables for Inclusion in an Income Poverty Index. (Working Paper No. 9). 2003, United Republic of Tanzania Ministry of Health: Dar es Salaam.
13. Setel, P, O Sankoh, C Mathers, et al., Improving Systems for Monitoring and Measurement of Vital Events. An issues paper prepared for the Health Metrics Task Force Meeting, World Health Organization, Glion, Switzerland,November 2003. 2003, World Health Organization, Evidence and Informationfor Policy: Geneva.
Contributors and Acknowledgements, Volume 2

THE POLICY IMPLICATIONS OF TANZANIA’S MORTALITY BURDENVOLUME 3: FIELD OPERATIONS AND VALIDATION STUDIES
Table of Contents
11 Introduction to Volume 3
13 Part I. Methods, Forms, and Capacity Requirements14 Chapter 1 Baseline and Update Household Enumeration Surveys:
Procedures, Sample Enumeration Forms, and Capacity Requirements
36 Chapter 2 Conducting Mortality Surveillance: Data Collection,Coding Procedures, Core VA Forms, ICD-10 Coding,and Proposed Tabulation List
78 Chapter 3 Surveillance Package/Open Source Software and Data Set Guide
103 Part II. Modelling, Validation and Cross-Comparison of Tools104 Chapter 4 Estimating the Optimum Size for Sentinel Mortality
Surveillance Sites109 Chapter 5 Development, Validation, and Performance of a Rapid
Consumption Expenditure Proxy for Measuring Income Poverty in AMMP/National Sentinel Surveillance System Areas
134 Chapter 6 Preliminary Results of Validation Study on Core Verbal Autopsy Forms
139 Contributors and Acknowledgements, Volume 3

THE POLICY IMPLICATIONS OF TANZANIA’S MORTALITY BURDENVOLUME 4: MORTALITY BURDEN PROFILES FROM SENTINEL SITES, 1994-2002
Table of Contents
Introduction to Volume 4
Dar es Salaam – Dar es Salaam Sentinel Surveillance Area Mortality BurdenProfiles, 1994-2002
Chapter 1 1994Chapter 2 1995Chapter 3 1996Chapter 4 1997Chapter 5 1998Chapter 6 1999Chapter 7 2000Chapter 8 2001Chapter 9 2002
Hai District– Northern Sentinel Surveillance Area Mortality Burden Profiles,1994-2002
Chapter 10 1994Chapter 11 1995Chapter 12 1996Chapter 13 1997Chapter 14 1998Chapter 15 1999Chapter 16 2000Chapter 17 2002Chapter 18 2002
Morogoro District – East-Central Sentinel Surveillance Area Mortality BurdenProfiles, 1994-2002
Chapter 19 1994Chapter 20 1995Chapter 21 1996Chapter 22 1997Chapter 23 1998Chapter 24 1999Chapter 25 2000Chapter 26 2001Chapter 27 2002
Annex 1 Cause Groups and ICD CodesAnnex 2 Allocation of Causes to Broad Cause, Broad Care Need, and
Intervention-Addressable Categories
Contributors and Acknowledgements Volume 4

THE POLICY IMPLICATIONS OF TANZANIA’S MORTALITY BURDENCD-ROMS
Disk 1 The Policy Implications of Tanzania’s Mortality Burden (Volumes 1-4)Disk 2 Surveillance Package Open Source (SPOS V.1.0) Installation CDDisk 3 AMMP-2 Analysis Module and Baseline Data (Bootable CD)
This publication is an output of the Adult Morbidity and Mortality Project (AMMP).AMMP is a project of the Tanzanian Ministry of Health, funded by the Department forInternational Development (UK), and implemented in partnership with the University ofNewcastle upon Tyne. The views expressed are not necessarily those of DFID.

The aim of this third volume of the final report of the AdultMorbidity and Mortality Project Phase 2 is to provide anaccount of the methods used by the project and, where relevant,the results of validation studies that demonstrate theirreliability. Part I consists of a series of technical chapters thatdescribe the field methods for conducting demographic andmortality surveillance, data management, and softwaredeveloped under the project. Part II contains validation studiesof the census, the AMMP poverty measurement tool,modeling of optimal sentinel site size, and preliminary findingsfrom the validation of the AMMP/MOH core verbal autopsyforms. Taken together, these chapters provide a thoroughdocumentation of the tools and techniques used to generate thedata presented in Volume 1.
11Volume 3: Field Operations and Validation Studies
Introduction


Part 1Methods, Forms, and CapacityRequirements

This chapter begins with an overview of the principles of thecensus system including baseline and update census rounds,capacity requirements and data management procedures.This isfollowed by a discussion of the planning process leading up toconducting a census. The final section consists of a user manualfor enumerators, the front-line workers in the census system.
Baseline CensusesIn the absence of a recent national census or sample frame, aninitial household listing may be carried out with relevant localofficials and community leaders in areas designated forsurveillance. The baseline census is taken to determine who ispresent in each household under surveillance, and establish thesize and structure of the surveillance population denominatorsfor the calculation of mortality rates. The initial census round inDar es Salaam, for example, was carried out in 1992 when it wasdecided that neither vital registration nor the 1988 NationalCensus provided an accurate basis for estimating populationdenominators. It included 7 areas in the two districts of Dar esSalaam with a population of about 67,000 people. A single formis used for each household. A sample baseline form (in Swahili)is included in Annex 1.
Regular Update RoundsAfter baseline, the same administrative areas are re-enumeratedannually (rural areas) or semi-annually (urban areas). In eachcensus update round the information from the previous round isprinted on new forms for each household. Each household isvisited and an adult member of the household is interviewed.Existing data are verified and where necessary updated by theenumerators. New households that are identified, either bymigration into the area or the splitting of existing households(for example by marriage) are registered on new householdforms. Key informants, such as local leaders, identify thesehouseholds. Vital events (births and deaths) and migrations arerecorded for each household. Sample update forms (in Englishand Swahili) are included in Annex 2.
14 The Policy Implications of Tanzania’s Mortality Burden: AMMP-2 Final Report
Baseline and Update Household EnumerationSurveys: Procedures, Sample EnumerationForms, and Capacity Requirements
1
INTRODUCTION
OVERVIEW OF THECENSUS SYSTEM1

The following items of data are recorded for each individualduring a household visit:• name• age• sex• relationship to head of household• main occupation• marital status• drinking and smoking habits• date of entry into the household• mode of entry• date of exit• mode of exit and parental survivorship.
Other questions relating to social context, such as religion, mayalso be considered where these will not be considered sensitiveor divisive. Migration tracking is limited to recording the dateof entry and exit from the area and the district of origin ordestination; we do not track individuals who migrate out of thesurveillance area and back in again.This means that we are ableto determine who is resident at any point in time (and thereforecalculate denominators) but we only estimate the total timeeach individual has spent in the surveillance area (‘person yearsof observation’).
Capacity Requirements and TrainingThe human, equipment, time, and financial resources requiredto conduct a census are highly dependent on the size of thepopulation under surveillance and the geography of the area.Densely populated areas can be enumerated more quickly andsupervision is easier, so the field team can be smaller. Sparselypopulated areas on the other hand may require large teams toeffectively enumerate the population in a reasonable amount oftime. A baseline is considerably more work than an updatebecause each form has to be filled-out in full by hand.Registering a household takes around 30 minutes, althoughthis varies depending on the number of people in thehousehold. In sparsely populated rural areas, the amount oftime required to travel between households can addconsiderably to this time.
AMMP experience suggests that 8 to 12 people can enumeratea densely populated urban area of around 70,000 people in twomonths. In rural areas, a single enumerator is often sufficient toenumerate each village, although some larger villages, especiallythose that cover large areas, may require more than oneenumerator.
15Volume 3: Field Operations and Validation Studies

The number of supervisors required to manage the field workwill also depend on the geography of the area. Supervisorsshould be able to meet with each enumerator once a weekduring the data collection period. In geographically small,densely populated areas a single supervisor can do this. Whenthe surveillance area is larger and the enumerators more widelydistributed a larger team, with transport, is required.
In the case of a rural surveillance area with a population of100,000 or more, a field team of between 50 and 80enumerators and 4 to 5 supervisors will be required. Theenumerators require bicycles and the supervisors needmotorcycles. In addition to the field supervisors a co-ordinator,responsible for the day-to-day running of the system, is needed.This person will also require a motorcycle as he or she will visitthe field frequently in order to monitor the work of both theenumerators and the supervisors.
Training should take place shortly before the census is due tostart (ideally during the week immediately preceding fieldactivities). In some areas where the field team is large and coversa wide area it is necessary to hold two training sessions, in othersit is more efficient to train everybody together. Training for thebaseline takes a minimum of five days. For update rounds, ifmost of the enumerators are the same as in the previous year oryears, training can be reduced to two days. New enumerators aregiven an extra two-day pre-training orientation by thesupervisors. Per diems and transport costs can mean thattraining can be an expensive exercise.
In addition, there may be nested sample surveys within thesurveillance area (e.g. health examination surveys) or additionalperiodic data to be collected from all households (e.g.consumption expenditure data). This will necessitate additionaltraining and practicum days to accustom enumerators (many ofwhom may have quite basic literacy skills) to new forms,questions, and proper protocol. Annex 3 contains the baselinepoverty monitoring questionnaire administered to allhouseholds (Swahili version).
Data Management and Analysis
Data handlingDuring the census a field supervisor reviews all completedforms.Those containing errors or inconsistencies are returned tothe enumerators for correction. Those that pass inspection aresent to the data centre in Dar es Salaam and are entered into acomputer. All census forms with errors detected during dataentry are logged and returned to the field for correction. Once
16 The Policy Implications of Tanzania’s Mortality Burden: AMMP-2 Final Report

the corrected forms are returned to the office they are loggedback in and the problems are resolved.
Data processingThe data are entered into microcomputers using a data entrysystem by data entry staff trained in the use of the program.(AMMP used software designed specifically for the projectusing MySQL as the database server with a front-end writtenin Java.2) The data entry clerks are instructed on how thecensus forms should have been filled in so that during entrythey can also spot errors or inconsistencies in addition to theprogrammed validation rules.The programmed validation rulesrange from simple range checks to inconsistencies acrosshousehold members. For example, a child whoserecorded/reported age would imply an implausibly young or oldage of the father in the household would be flagged as a dataerror for checking.
Data quality assurance and links to the fieldSeveral methods are employed to ensure data quality. Theseinclude checks in the field and in the data entry processes.Supervisors visit a random sample of the households to verifyentries on the census forms, to check that all the householdsvisited have been included in the census, and that no non-existent households have been included. Following each censusre-interviews of a sample of households for each enumeratorare also conducted. Due to the large amount of data collectedduring a single census it is not possible to double-enter all datafor verification purposes. Instead, a five to ten percent randomsample is taken and the forms are checked against the data thatwere entered.
Careful planning is an essential part of running a successfulcensus round. There are several steps that must take place insequence. To facilitate the planning process we developed aspreadsheet that produces a list of tasks with dates, indicatingwhen each should be done. These tasks include budgeting,informing the appropriate authorities, purchasing consumables,preparing forms, training enumerators, and the preparation ofthe census newsletter to be distributed to all the householdsparticipating in surveillance. This spreadsheet can be found onthe CDROMs accompanying this report.
The following series of figures show each page of the censusplanning tool. The final figure is the dated list of tasks toperform to ensure that the census field work will start on therequired date.
17Volume 3: Field Operations and Validation Studies
PLANNING A CENSUS

18 The Policy Implications of Tanzania’s Mortality Burden: AMMP-2 Final Report
DISTRICT COUNCIL CENSUS PLANNING TOOL
Welcome to the Census Planning Tool. With this tool you will be able to make a checklist oftasks that will help you to complete the preparation and execution of a census using fieldsmethods developed under AMMP.
There are just 5 questions to answer to produce a checklist for your census.Click on "Go to Step 1" to begin…
NATIONAL SENTINEL SURVEILLANCE (NSS) SYSTEM
Figure 1.1 The Census Planning Tool Introduction Screen
Figure 1.2 Step 1: Setting the Date that Planning Starts
DISTRICT COUNCIL CENSUS PLANNING TOOL
Step 1. The planning start datePlease enter date that you are starting to plan the census. This will help me to make sure thatyour computer is setup correctly.
This year is:This month is:
The day today is:
Date that census planning started:
(please use a 4-digit number, e,g, 2002, not 02)(please use a number, e.g. 3 not March)
20044
21
April 21, 2004

19Volume 3: Field Operations and Validation Studies
DISTRICT COUNCIL CENSUS PLANNING TOOL
Step 3. Follow the planYou have now done all you need to do in order to make a plan for the census. Go to the nextsheet to review your plan. You can print a copy or you can update it in this file. Once the datefor each task has passed the background will be shaded.
Figure 1.3 Step 2: Entering Information About the Surveillance Area
Figure 1.4 Step 3: Follow the Plan
DISTRICT COUNCIL CENSUS PLANNING TOOL
Step 2. Census detailsPlease answer the following questions about this census:
2.1 Roughly how many households are there in the census area now?33,000
2.2 When do you want to start census field work?Year 2004
Month 7Day 3
Census field activities will start on: July 3, 2004
2.3 How long will the training be in total? 3 Days
2.4 On average, how many hours will be spent each day printing the census forms? 6 roughly hours per day
This means that you will have to start printing 23 days before the census starts (i.e.10/6/2004). We will assume that printing will only happen from Monday to Friday (ie not at theweekends).

20 The Policy Implications of Tanzania’s Mortality Burden: AMMP-2 Final Report
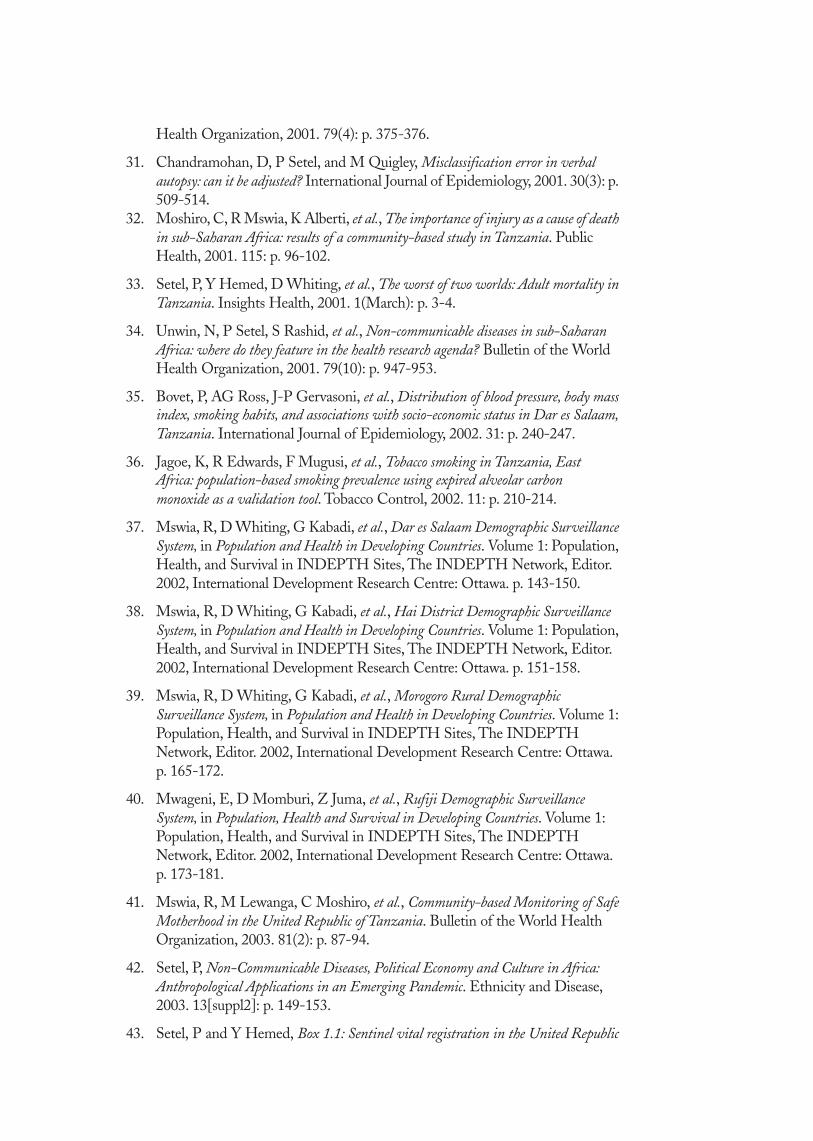
Figure 1.5 The List of Tasks with Completion Dates
DISTRICT COUNCIL CENSUS PLANNING TOOL
Census start date Number of householdsJuly 3, 2004 33,000
The date today is: 21/4/2004
Step / Activity / Task StartStatus1 Prepare budget for census and discuss it with DMO May 11, 2004District2 Send budget to AMMP for approval May 18, 2004District3 DMO to send the budget to District Treasurer and DED May 18, 2004District4 Collect information for newsletter May 19, 2004District5 Get 3 quotes from printers for production of newsletters and
new-household forms May 22, 2004District6 Send funds to Account #6 May 23, 2004AMMP7 Select printers which made the best quote for production of newsletters May 27, 2004District8 Obtain funds from District Accounts department May 31, 2004District9 Advise Enumerators on dates for training & census June 2, 2004District10 Prepare first draft of newsletter & circulate to others for
comments eg. DHMT members June 2, 2004District11 Prepare Balozi list June 2, 2004District12 Create new census file from previous census file June 2, 2004District13 Send letters to get permission for enumerators June 2, 2004District14 Buy photocopy paper (number of households/500 + 5%) = 69 reams June 2, 2004District15 Order/buy laser printer toner: Part Number: 92298A. Quantity = 5 toners June 2, 2004District16 Send new household form to printer for production June 5, 2004District17 Prepare final draft of newsletter & send to selected printer for production June 5, 2004District18 Follow up letters June 5, 2004District19 Send letters with dates of training to Enumerators June 14, 2004District20 Print the new census forms June 10, 2004District21 Print new household forms June 11, 2004District22 Prepare training materials June 18, 2004District23 Train enumerators June 28, 2004District24 Start census in the field July 3, 2004District25 Census supervision July 10, 2004District26 Supervision and weekly enumerators' meeting July 16, 2004District27 Collection of census forms August 18, 2004District28 Enter data August 21, 2004AMMP29 Select random sample September 1, 2004AMMP30 Prepare the reinterview forms September 2, 2004District31 Print reinterview September 2, 2004District32 Send reinterview forms to enumerators September 3, 2004District33 Conduct validation reinterview September 4, 2004District34 Enter validation data September 15, 2004AMMP35 Compare 1st and 2nd interview forms September 17, 2004AMMP36 Compare census deaths with VA deaths September 19, 2004AMMP37 Procure funds for remuneration September 22, 2004District38 Pay of Enumerators after census September 22, 2004District39 Prepare analysis report September 22, 2004AMMP40 Pay of Enumerators after reinterview September 22, 2004District41 Archive census forms September 29, 2004District42 Archive census file September 29, 2004District

21Volume 3: Field Operations and Validation Studies
Introduction This is the manual for Census Enumerators in the TanzaniaMinistry of Health’s National Sentinel Surveillance system(NSS).
National Sentinel Surveillance system (NSS) The National Sentinel Surveillance system is a community-based program of the Ministry of Health that contributesessential information for the improvement of health services.The NSS consists of demographic surveillance sites (DSSs)chosen to represent the country. Demographic surveillanceconsists of the continuous and complete enumeration of alldemographic events (births, deaths, and migrations) in ageographically defined population. In Tanzania, DSS iscombined with mortality surveillance to provide crucialinformation about the health of the population.
Information from this system is used to inform national healthpolicy and priorities for district health plans. The NSS providescommunity-based information on population health, Tanzania’sburden of premature death, and health service use before death.These data complements data from other systems andprograms, such as the health facility-based Health ManagementInformation System (HMIS/MTUHA).
There are two main components to the NSS system:1. A census of the population in the sentinel areas that provides
demographic information. Census update rounds are conducted once or twice a year, depending on the area.
2. A continuous, active reporting system to ascertain the numbers of deaths in the NSS area and to determine their probable cause.
Objective of this Manual The objective of this manual is to provide Census Enumeratorswith a description of their role in the NSS and information onhow to interview households.
The Actors There are several actors involved in the Census. These aredescribed below:
EnumeratorThe enumerator is a person who usually lives in the surveillancearea and is responsible for interviewing the residents in his orher enumeration area. In the rural NSS sites, Enumerators arealso responsible for acting as Key Informants reporting deaths tothe mortality surveillance system.
ENUMERATOR TRAININGMANUAL

Respondent The respondent is an adult who is resident in the householdbeing enumerated. The respondent must be someone who isable to give reliable and accurate information regarding themembers of the household.
Census supervisorCensus Supervisors co-ordinate the activities of theenumerators and are responsible for making sure that the fieldsoperations run smoothly and efficiently. The Supervisors areoften members of the Council Health Management Team(CHMT) and report directly to the NSS District Co-ordinator. They will usually also be responsible for supervisingthe Verbal Autopsy activities.
District NSS co-ordinatorThe District NSS Co-ordinator is usually a member of theCHMT and is responsible for the smooth operation of boththe census update rounds and the mortality surveillance. TheCo-ordinator reports directly to the District Medical Officer(DMO).
Enumerator Role Description and EquipmentEnumerators must be able to:• Walk, ride a bicycle or use another means of transport to
visit every household in his or her enumeration area.• Complete census forms accurately and neatly.
Enumerators require the following equipment:• a sufficient quantity of new household forms• census update forms for each household that is registered in
his or her area• a summary list of the codes used in the census• a pen and a pencil• access to appropriate transportation• Rain coat and bag for protecting the forms
The Data Collection ProcessOnce the planning and preparation steps have been completed(as outlined above), the process of census data collection is asfollows:• The process begins with the Enumerator reviewing the
physical boundaries of his or her area. In many cases this willbe the village boundary.
• The enumerator then visits each household in sequence. InTanzania households are grouped into small units known asShinas and field work is facilitated by liaising with the leaderof the shina (balozi), or larger units called mitaa led by a chairperson (mwenyekiti).
22 The Policy Implications of Tanzania’s Mortality Burden: AMMP-2 Final Report

23Volume 3: Field Operations and Validation Studies
• At the household the Enumerator introduces him or herself,explains the work of the census and asks permission from anadult member of the household to enumerate the household.A newsletter containing information about the National Sentinel Surveillance system and health education messagesis given to the respondent.
• If permission is given, the Enumerator completes the form starting with the top section which contains information regarding the location of the household.
• Next the Enumerator updates the status of each variable of each individual by asking the respondent explicitly about each item.
• Once the status of each person has been updated, the Enumerator asks if any people have moved into the household (with the intention to stay) since the last enumeration round, or if any child has been born to a member of the household. Any new additions to the household are added to the form and all details are recorded.
• All interviews should be completed in a single visit with a respondent.
Some of the questions may seem to be very personal or embarrassthe respondent. For this reason, the Enumerator must use politeand gentle language, show respect, and be patient and humble.
• When it is difficult to get a reliable respondent, the Enumerator must arrange to visit the household on anotherday when a more informed respondent will be available. Upto three attempts should be made to conduct an interview. Ifthe information given is incomplete after three visits, the Enumerator should complete the form with the informationthat is available. A note that the interview is incomplete dueto the absence of reliable respondents should be made at the bottom of the form.
DefinitionsThe following are the definitions of two key entities within theNational Sentinel Surveillance system. It is very important toensure that you understand these definitions.
HouseholdA household is defined as a group of people who ‘eat from thesame pot.’
ResidentA resident is defined as ‘a person who intends to stay (for theforeseeable future).’ This definition is used to avoid thedifficulties encountered when attempting to define residency interms of spending a specified amount of time in an area.

Overview of the Census FormThis section provides an overview of the census form used inthe NSS system. The census form contains two main sections:a header section with information about the household, such asits location, and a body that consists of one row for eachmember of the household.
How to Fill in a Census FormsThis section of the manual tells the Enumerator how tocomplete the census form.
Header Section
Location information (Region, District and Village)Write the name of each level in the hierarchy, for exampleregion, district and village, in the spaces next to these labels.These items identify where the household is located. Write thefull name of the local leader. It is advisable to write three namesof the local leader and to use upper-case.This may be the balozi(in areas where they are still common), or the name of themwenye kiti wa serikali za mitaa.
Household InformationNext fill in the information that is specific to the household,such as the plot number or owner of the house. This part of theform also contains the name of the Enumerator and date ofinterview.
Note: In Tanzania it is important to use all 3 names as there areoften several people with similar first and last names in thesame village.
Census form bodyIn the body of the census form there is one row for eachmember of the household. Start with the person you areinterviewing and update the status of each item listed. Gothrough the items in the order they are printed on the censusform to make sure that nothing is missed accidentally.
RespondentThe first item to fill in identifies the respondent(s). This isuseful when conducting the next update round. Indicate this byputting a tick next to the name of the respondent.
NameFill in the complete name of each person in the household. Itis advisable to write down three names of the individual to helpdistinguish between others with similar names.
24 The Policy Implications of Tanzania’s Mortality Burden: AMMP-2 Final Report

25Volume 3: Field Operations and Validation Studies
Date of birth Very often people, especially adults, in Tanzania know the yearthey were born but not their age. The respondent will oftencalculate the age of each by subtracting the year of birth fromthe current year (i.e. the year of death). To reduce the chances ofincorrectly calculating the age, you should ask for the year inwhich the individual was born and fill it in the relevant space. Ifthe year is not known but the age is known, write his/her agewith the word “age’’ written in front of the age to indicate thatthis is an age and not the year of birth.
Example, if the individual was born in 1967, write 1967 inthe space provided. If the date of birth is not known, andyou have been told that the individual was fifty years old,write “age 50 yrs’’.
If the day or the month of birth is not known, only fill in theinformation that is known and use a dash ( - ) to indicate whatis not known.
Example: If the respondent can only tell you that theindividual was born in March 1999, write “ - 3 1999’’.
The child’s date of birth is usually written on the MCH card soyou should ask for the MCH card to get the exact date of birth.
SexIf the individual is a boy or man, write 1. Write 2 for a girl orwoman.
Relationship to head of householdThe relationship of each individual is recorded relative to thehead of the household. Note that if the head of the householdchanges, it is possible that the relationship code of all membersof the household will change. The codes for relationship are asfollows:1=Head of household2=Husband or wife of head of household3=Child of head of household or step-child4=Other relative of head of household5=No relationship to head of household
EducationEducation level is recorded using the coded list provided. Forexample, if the individual has completed primary education upto Standard seven, write the number 7 (seven) in the appropriatespace. If the individual has reached Form three, write thenumber 11.

For secondary education the codes are as follows:9=Form one10=Form two11=Form three12=Form four13=Form five14=Form six
For higher levels of education use the following codes:15=University16=College after primary school17=College after secondary school18=Adult education19=No education
Occupation (Description, Income, Time)Occupation is recorded as a simple description and also as acode using the occupation and income coding scheme inAnnex 4.
The description is the type of occupation, such as “clerk”, or“cleaner”, and often also includes the name of the employer forthose who are employed, such as “NBC bank”.
The coding scheme consists of two components: theindividual’s main source of income and the occupation that usesmost of the individual’s time. In many cases these will be thesame, for example, someone who was a farmer with no othersource of income would have the same code for income and fortime used.
There are other people, though, who have more than one job orsource of income. For example, someone might be employed asa clerk in a small company on a minimum salary and makemore money as a petty-trader selling used clothing part-time.To represent this, you should write two numbers in theoccupation space separated by a dash. The first number shouldbe the code for the main source of income and the secondnumber (code) for the main use of time. So, for example, if theindividual is a clerk for a government office but gets most of herincome from selling second-hand clothes you will write “10-16.’’ Appendix 3 contains the full list of codes (Swahiliversion).
Date of Birth or Migration into the HouseholdThis is the date of entry into the household i.e. the date theperson became eligible for inclusion on the specific censusform. Thus, if a person moves from one household to another,
26 The Policy Implications of Tanzania’s Mortality Burden: AMMP-2 Final Report

27Volume 3: Field Operations and Validation Studies
the date of entry at the new household is not the date of entryinto the village, but the date they moved to the new household.If the person is given the same date of entry at the newhousehold as at the original household, the person will beincluded twice in analyses.
Mode of Entry (Birth or Migration)The mode of entry determines whether the person migratedinto the area, was born to a woman resident in the area, at homeor in a health facility, or was present before the first census.11=Birth (unspecified)12=Birth at home (skilled health worker availability unspecified)13=Birth at home with skilled health worker present14=Birth at home with a trained TBA15=Birth without a TBA16=Birth at health facility21=Migration (reason unspecified)22=Migration—code available for use for other reasons23=Migration for education24=Migration for illness25=Migration for work26=Migration to stay with family27=Migration to prison28=Migration—code available for use for other reasons71=Resident before the baseline census99=Missing or bad value
Alcohol UseAsk if the individual drinks alcohol. For some people this can bea sensitive question, and we have found that it is best asked likethis: “Does this person drink a little alcohol now and then?” Ifthe response is “yes” it is possible to then try to determine, askhow much they drink. This information is recorded in a simple,subjective manner as follows:1=Does not use alcohol2=Drinks a little3=Average 4=A lot9=Don’t know
Some respondents may answer you in a different style but themeaning is the same as above. Read the following examples andsee how they are interpreted:“He/she did not drink alcohol at all”: 1=did not use alcohol“He/she drinks only during public holidays/parties”: 2=a little“He/she drinks only on weekends”: 3=average“He/she drinks most days each week”: 4=a lot

Tobacco useThere are two fields on the census form used to record if theindividuals use tobacco in any form. The first part determinesif the person smokes, and if they do, the second part is used torecord the number of cigarettes.Here is the complete list of codes:1=Smokes (quantity of cigarettes is known)2=Smokes (quantity of cigarettes is not known)3=Uses snuff or smokes a pipe4=Does not use tobacco of any kind9=Don’t know
Example: If the individual smokes about a packet ofcigarettes each day write the number 1 in the first spaceand 20 in the second space provided (as this is the numberof cigarettes in a packet).
If the individual does not smoke or he uses snuff or smokes apipe write the number 3. If the individual did not use tobaccoof any kind, write the number 4.
As with other questions, it is possible that the respondent doesnot know in detail about the amount the individual smokes. Inthese cases use the following to indicate what is known aboutthe smoking habits of the individual:
If the respondent knows that the individual smokes but doesnot know the number cigarettes smoked each day, write ‘2—number not known’.If the respondent does not know if the individual use anykind of tobacco (i.e. cigarettes, snuff or pipe), write ‘9—don’tknow’.
Marital StatusCurrent marital status is recorded using the codes shownbelow:Father Alive, Mother AliveThese next fields record whether the individual’s father andmother are alive. This is to provide estimates of orphanhood.1=alive 2=dead9=don’t know
Date of Death or MigrationFill in the day, month and year of death or migration in theappropriate space provided. If the respondent can only tell youpart of the date, for example if the day or month is unknown,put a dash (-) to indicate what is not known and complete therest.
28 The Policy Implications of Tanzania’s Mortality Burden: AMMP-2 Final Report

29Volume 3: Field Operations and Validation Studies
Example: If the respondent tells you that the individualdied sometime in May 2000 but is not able to tell you theexact day, write “- 5 2000”.
Mode of Exit (Death or Migration)People leave households in two ways: they either move toanother household, or they die. When people move to anotherhousehold, especially if they move to another district or region,it can be useful to know the reason for migration. If there aremultiple reasons for migration, use the one the respondentconsiders to be the most important.11=Died 21=Migration (reason unspecified)22=Migration nyumba - code available for use for other reasons23=Migration for education24=Migration because of illness25=Migration for work26=Migration to join family27=Migration to prison28=Migration-code available for use for other reasons99=Missing or bad value
After completing the formOnce you have completed filling in the census form, take a shortwhile to review the whole form and make sure everything hasbeen completed correctly. Once you are happy that the form iscomplete, thank the respondent for giving the time andinformation about their household.
1 Much of this section of Chapter 1 is taken directly from the text of Mswia, R.,Whiting, D., Kabadi, G. et al., Dar es Salaam Demographic Surveillance System,in Population and Health in Developing Countries. Volume 1: Population,Health, and Survival in INDEPTH Sites, The INDEPTH Network, Editor.2002, International Development Research Centre: Ottawa. p. 143-150.
2 See Chapter 3 in this Volume for more details.
NOTES

30 The Policy Implications of Tanzania’s Mortality Burden: AMMP-2 Final Report
Annex 1. Baseline Household Enumeration Form

31Volume 3: Field Operations and Validation Studies
Annex 2. Household Update Form-=NSSCensusForm
=-Householddetailsform
CountryTANZANIA
Plotnumber
KASULU1
RegionKIGOMA
Houseowner
SAIDALLYOMARY
DistrictKIGOMAURBAN
Interviewdate01/10/2002
WardMAJENGO
Fieldworker
20-NuruSadiqBashange
VillageRUSIMBIB
Ham
letRUSIMBIB
Ten
CellLeader
MUSSAIBRAHIMNTURASARA
Resp
Indiviual
DoB
Sex
Rela
Edu
Reli-
gion
Occupation
Occ
(t)
In-
come
Entrydate
Entry
Bths
Drink
Smok
eCigs
Mari
Father
Mothe
rEx-date
Exm
Warningsandcommentsfollows
enteredby:
checkedby:
1SAIDALLYOMARY
1947
11
72
KILIMO
126
01/10/2002
111
40
22
2
TATUALLYOMARY
1963
22
192
KILIMO
126
01/10/2002
111
40
21
1
ALLYALLYOMARY
1984
13
42
MWANAFUNZI
2126
01/10/2002
111
40
11
1
IBRAHIMALLY
OMARY
1986
13
42
MWANAFUNZI
2126
01/10/2002
111
40
11
1
ZUHURAALLY
OMARY
1995
23
12
MWANAFUNZI
2126
01/10/2002
111
40
11
1
HAWAALLYOMARY
14/01/1998
23
192
MTOTO
2626
01/10/2002
111
40
11
1
CHAUSIKUALLY
OMARY
22/06/1999
23
192
MTOTO
2626
01/10/2002
111
40
11
1

32 The Policy Implications of Tanzania’s Mortality Burden: AMMP-2 Final Report
-==NSSPopulationSam
pleSurveillance==-
Kayadetailsform
NchiTANZANIA
Nam
bayanyumba/kiwanjaKASULU1
MkoaKIGOMA
JinalamwenyenyumbaSAIDALLYOMARY
Wilaya
KIGOMAURBAN
Tareheyakusaili01/10/2002
KataMAJENGO
Enumerator20-NuruSadiqBashange
KijijiRUSIMBIB
KitongojiRUSIMBIB
BaloziMUSSAIBRAHIMNTURASARA
Resp
Jina
Tareheya
kuzaliwa
Jinsia
Uhu-
siano
Elim
uDini
Ainayakazi
Shugh
uli(muda
)
Shugh
uli(kipat
o)
Kuingia
tarehe
Kuin-
gianam
na
jifun-
gua/
zaa
Pomb
eSigaraSigaraJinsiaBaba
hai
Mam
ahai
Kutoka
Terehe
Ku-
toka
Nam
na
Warningsandcommentsfollows
enteredby:
checkedby:
1SAIDALLYOMARY
1947
11
72
KILIMO
126
01/10/2002
111
40
22
2
TATUALLYOMARY
1963
22
192
KILIMO
126
01/10/2002
111
40
21
1
ALLYALLYOMARY
1984
13
42
MWANAFUNZI
2126
01/10/2002
111
40
11
1
IBRAHIMALLY
OMARY
1986
13
42
MWANAFUNZI
2126
01/10/2002
111
40
11
1
ZUHURAALLY
OMARY
1995
23
12
MWANAFUNZI
2126
01/10/2002
111
40
11
1
HAWAALLYOMARY
14/01/1998
23
192
MTOTO
2626
01/10/2002
111
40
11
1
CHAUSIKUALLY
OMARY
22/06/1999
23
192
MTOTO
2626
01/10/2002
111
40
11
1

33Volume 3: Field Operations and Validation Studies
Annex 3. Consumption Expenditure Proxy Form�����������������������
��� �������������������������
����
����
��
�� �
���
�� �
����
����
����
����
����
�����
����
���
����
���
��
��
��
��
��
��
��
��
��
��
��
���
����
����
����
���
��
����
���
����
����
����
��
���
��
����
����
����
����
��
����
����
��
���
���
��!
�"
#$
$��%
����
����
����
��
���
����
����
����
����
�!�
����
!��
����
��
�!�
"�
&
���
��"
�
!��
���
���!
'�"
$��
���
���
����
� �
�
����
� ��
��!'
�"
&�
���
"�
�()*
)*+
)(�,
��--
.���
� ��
��!'
�"
"�
� '"
$
�.
)�-,
)*��
.45
��
� ��
��
��!'�
"6
�����
�"
�5
.
����
�7��
���
�"
89�
�/��
����
����
����
��
���
���
�
����
����
��
���
��
��
��
��
��
��
��
$
����
���
����
�"
98�
��-��
5���
����
���
��!
����
���
����
� �
����
�����
����
����
��
�����
������
������
������
������
������
������
���
5.
&��%
����
����
����
���
����
�!��
��� �
����
���
����
����
���
�:�
�/��
����
����
����
��
���
���
�
����
� ���
���!
'�'�
���
���
��
��
����
��
��
��
��
��
$
� �!
���!
��"
�9�
��-��
5���
����
���
��!
����
���
����
� �
����
�����
����
����
��
�����
������
������
������
������
������
������
���
����
�!�
�� �
���
"
$
�()*
)*+
)(�,
��--
.�
��
"&
�.
)�-,
)*��
.45
���
� �
���
""
�#��/
���
����
�� �
���
����
� �
����
����
����
� �
�!�
���
�!�
���
5.
����
���
����
�"
6�
��
��
��
��
���
��
����
����
��
���
����
� �;�
�"
�$
���
"�
$
����/
���
����
�� �
����
���
�� �
����
����
����
� �
�!�
���
�!�
���
5.
"��%
����
����
����
���
����
�!��
����
����
����
��
����
� ��
���
����
����
���
��
���
���
����
�� �
��
����
��7
����
���
"�
$
����
��
����
����
����
"�
���
����
���
"�
$
����
��
����
����
���
����
����
���
"$
!��
��
����
���
����
��"
&�$
��%��
����
����
���<
����
���!
����
��!�
���
���
����
����
���
�
�()*
)*+
)(�,
��--
./
-01
,)��2
32��
.��
���!
�� �
��
"
"��
��
����
�!�
���
"�
�
�.
)�-,
)*��
.45
��
����
�!��
��
�
"6
�()*
)*+
)(�,
��--
./
-01
,)��2
32��
.��
��
� ���
���!
'���
� �!
��"
$8
����
�!��
���
���
"�
�.
)�-,
)*��
.45
���
��
�!��
��!�
���
"&
9
���
���!
�� �
����
�"
8��
��
7���
��"
":
����
����
�� ��
���
!�"
9�
��
����
���
���
����
��"
6
���
����
���
���
���
":
����
����
����
��
��
��
��
��
��
"�#
���
����
��"
�#
����
���
����
�"
���
��
��
��
��
�&��/
����
���
����
����
��
��
��
����
����
� �
��
��5
.
��!
! �
"�
$
! �!
'���
�� �
����
��
�"
�$
6��%
����
'�
����
��� �
�� �
����
� ��
���
����
����
���
���
����
���!
�� ��
���
�!��
�!"
�$
��
���
� ���
����
��
"�
"�
$
�()*
)*+
)(�,
��--
./
-01
,)��2
32��
.��
�� �
���
�"
$��
��7
�� �
��!�
����
��"
�$
�.
)�-,
)*��
.45
���
�� �
�� �
����
���
�����
���
���
�=->
�"
&��
���
�"
�$
���
����
���7
���
�� �
�"
"��
����
��"
�$
����
���
����
�"
6�
��
��
��
��
����
�!�
�7��
� �
���
"�
$
& �����
&������������
8��/
���
����
�� �
����
��'�
���
���
���
� �
��
� �
����
����
���
���
����
����
����
��
���
���
����
����%
(-,
)�,�
)�.
?*
+)(
��@�
/1
5A�
,�1
,�5�
?(
���
?A
)��
4/��
1/
�)10
��
�@�
,�)�
@��
/A
,?@@
�*).
,-�
.)/
�@�
(�,
�)�
41A
,�%
))B
�
"����������������������������
������������������������������
&������ ��!�����"
&#$������
&��%�������&����
&'�����
��
��

34 The Policy Implications of Tanzania’s Mortality Burden: AMMP-2 Final Report
Annex 4. Occupation Codes


This chapter provides essential information required to establishand operate mortality surveillance using the tools developedunder AMMP Phases 1 and 2. It includes descriptions ofrelevant fieldwork activities, role descriptions of key positions inthe mortality surveillance system, and quality assuranceprocedures. It also provides samples of the core NSS verbalautopsy (VA) forms, guidelines for coding VA to a tabulation listbased on the International Classification of Diseases, TenthRevision (ICD-10) [1], and the tabulation list used by AMMPto code VA in the context of the VA validation study conductedat the end of Phase 2. The forms, coding procedures, andtabulation lists presented here comprise one of the mostextensive and widely used VA toolkits yet developed.
The three forms (for deaths to neonates; deaths to childrenbetween one month and five years of age; and deaths to personsaged five years and above) were initially developed as part of theTanzanian Ministry of Health’s Adult Morbidity and MortalityProject (AMMP), and later modified and adopted by theMinistry of Health as the core VA forms to be used in DSS inTanzania contributing data to the NSS [2]. They are intendedto:• Be easy to use in a sustainable national system of sentinel
demographic surveillance;• Capable of generating causes of death based on a tabulation
list derived from the (ICD-10);• Elicit signs and symptoms likely to be reliably and
accurately recalled and reported by those who cared for the deceased [3], and necessary for the dependable and replicable attribution of cause of death;
• Collect relevant contextual and supporting information such as use of health facilities in the period immediately before death, and any documentary evidence available from the household of the deceased;
• Amenable to the development of data-derived algorithms to determine the probable cause of death [4, 5].
Between 1992 and 2004, versions of these VA tools have beenimplemented in community-based sentinel demographicsurveillance by several demographic surveillance sites in
36 The Policy Implications of Tanzania’s Mortality Burden: AMMP-2 Final Report
Conducting Mortality Surveillance: DataCollection, Coding Procedures, Core VA Forms,ICD-10 Coding, and Proposed Tabulation List
2
SUMMARY
DEVELOPMENT OF CORE VERBAL
AUTOPSY FORMS

Tanzania, producing a total of more than 50,000 registereddeaths. Since 2000, core Tanzanian forms have been furtherdeveloped with reference to other existing and recommendedtools [2], and translated for use in the Chinese DiseaseSurveillance Point System, the Indian Sample RegistrationSystem (neonatal form), and demographic surveillance sites inMalawi, Ethiopia, and Cameroon. The Swahili and Chineseversions of the core forms are also the subject of the largestvalidation study of verbal autopsy instruments yet undertaken,the results of which will be available later in 2004.
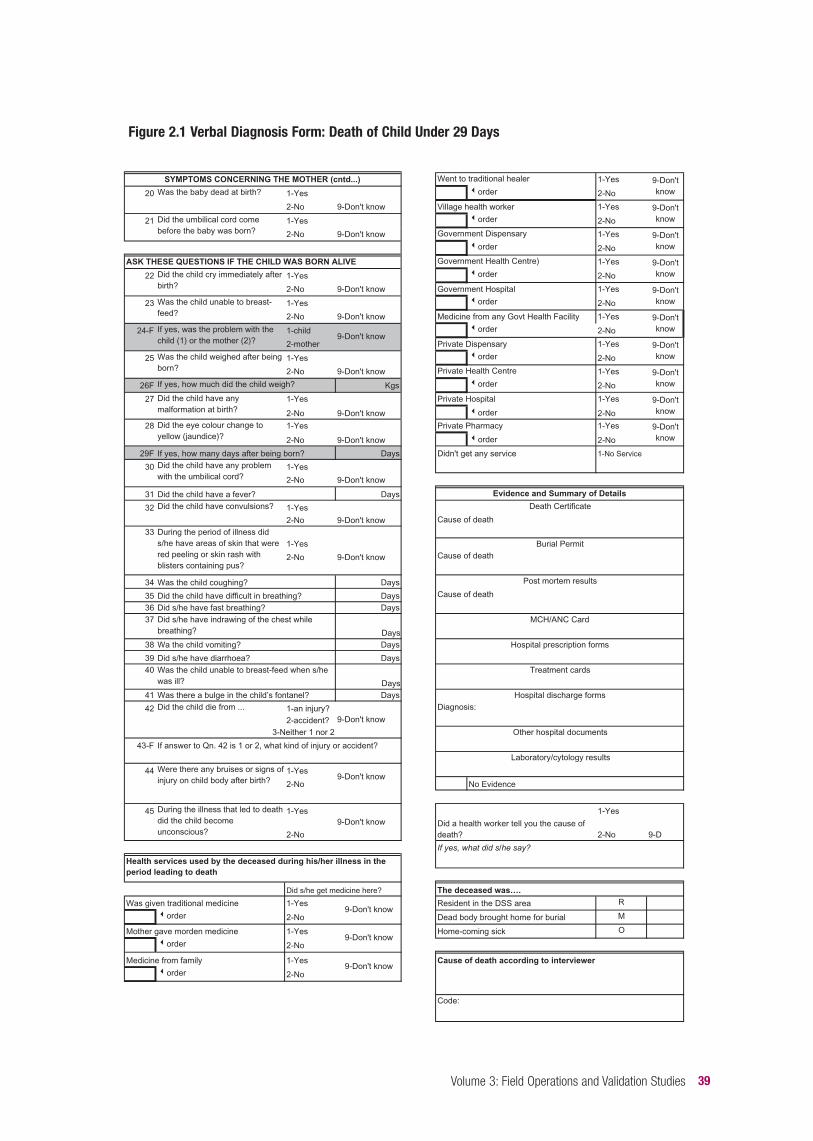
Core VA Forms Figures 2.1-2.3 present the English versions of the core VAforms currently being validated in Tanzania. The layout andquestion flow of all three forms follows a few overridingprinciples. First, for reasons of cost and ease of implementation,all forms were intended to fit on no more than three sides ofA4-sized pages. Second, skip patterns were avoided unlessabsolutely necessary in order to facilitate use by both medicallyand non-medically trained interviewers with differing levels ofliteracy. Third, all forms are structured similarly. Commonsections are:• Identifying information, including place of death;• Cause of death according to respondent;• Short narrative history;• Symptom duration checklist;• Health services used in the period before death;• Any medical evidence available at the household, including
whether a health worker informed the respondent of the cause of death.
Other sections pertain to the age and sex of the deceased and,for the neonatal form, the condition of the mother during andafter pregnancy and birth. The questions contained in thesymptom duration checklist are arranged loosely aroundanatomical systems, and are intended to be as informative aspossible in leading to a positive diagnosis of probable cause ofdeath, and the confident exclusion of differential diagnoses.The core VA forms may be freely duplicated and modifiedunder the terms of the GNU Free Documentation Licensecontained in Annex 1. The forms are discussed in greater detailon the next pages.
37Volume 3: Field Operations and Validation Studies

38 The Policy Implications of Tanzania’s Mortality Burden: AMMP-2 Final Report
Figure 2.1 Verbal Diagnosis Form: Death of Child Under 29 Days
Area Serial Number
Interviewer
Village/Branch 1 1-healthy, fine
2-she is sick
Name of ten cell leader 3-died 9-Don't know
2 Was it a difficult birth? 1-Yes
Name of head of household 2-No 9-Don't know
3 1-Yes
1-Father 2-Mother 3-Spouse 2-No 9-Don't know
4-Sibling 5-Child 4 1-Yes
6-Other relative 7-No relation 2-No
1-Yes 9-Don't know
2-No 5 1-Yes
2-No 9-Don't know
Name of deceased 6 1-Diabetes
2-Heart disease
3-TB
4-Epilepsy
5-None 9-Don't know
N-Home
H-HEalth facility
O-Other7 Where did the mother give
birth? 2-Health facility1-Home 3-In transit 9-Don't know
4-Other place
81-none
9-Don't know
3-Trained TBA 4-Health professional
9 1-Yes
2-No 9-Don't know
10
(number)
11 Was the child ... 1-a singleton?
History of events leading to death 2-twin 9-Don't know
12 1-Yes
2-No 9-Don't know
13 1-Yes
2-No 9-Don't know
14 1-Yes
2-No 9-Don't know
15 1-Yes
2-No
9-Don't know
16 1-Yes
2-No 9-Don't know
17F Months
Weeks
18 1-Yes2-No
9-Don't know
19 1-Yes
2-No 9-Don't know
"Excuse me, I will ask you some questions concerning symptoms that the deceased had/showed when s/he was ill.Some of these questions may not appear to be directly related to his/her death. Please bear with me and answer all the questions. They will help us to get clear picture of all possible symptoms that the deceased had"Date of interview
SYMPTOMS CONCERNING THE MOTHER
How is the child's mother now?
Did the mother have fits before giving birth?Relationship of
respondent to the deceased
Did/does the mother have high blood pressure?
Did you live with the respondent in the period leading to death?
Did the mother have a febrile illness at the time of delivery?
Did thechild's mother suffer from any of these conditions?
Sex Date of birth
1-Male 2-FemaleDay Month Year
Place of deathEVENTS DURING BIRTH OF A CHILD
Date of deathDay Month Year
Who assisted the birth?
What do you think was the cause of death?
(Write exactly as the respondent tells you) 2-Untrained TBA
Had the mother received Tetanus Toxoid vaccination(TT)?If yes, how many TT injections did she receive?
Was it a forceps or vacuum delivery?
Was it a caesarian delivery?
Did the baby stop ‘playing’ in the womb before labour?
If no, did the baby breathe at all after delivery?
Was it a prolonged labour?
Did waters break 1 day or more before contractions during late pregnancy, labour or delivery?
Was the child premature?
If yes, how many months or weeks?
39Volume 3: Field Operations and Validation Studies
Figure 2.1 Verbal Diagnosis Form: Death of Child Under 29 Days
Went to traditional healer 1-Yes
20 1-Yes order 2-No
2-No 9-Don't know Village health worker 1-Yes
21 1-Yes order 2-No
2-No 9-Don't know Government Dispensary 1-Yes
order 2-No
Government Health Centre) 1-Yes
22 1-Yes order 2-No
2-No 9-Don't know Government Hospital 1-Yes
23 1-Yes order 2-No
2-No 9-Don't know Medicine from any Govt Health Facility 1-Yes
24-F 1-child order 2-No
2-mother Private Dispensary 1-Yes
25 1-Yes order 2-No
2-No 9-Don't know Private Health Centre 1-Yes
26F Kgs order 2-No
27 1-Yes Private Hospital 1-Yes
2-No 9-Don't know order 2-No
28 1-Yes Private Pharmacy 1-Yes
2-No 9-Don't know order 2-No
29F If yes, how many days after being born? Days Didn't get any service 1-No Service
30 1-Yes
2-No 9-Don't know
31 Did the child have a fever? Days
32 1-Yes
2-No 9-Don't know Cause of death
331-Yes
2-No 9-Don't know Cause of death
34 Was the child coughing? Days
35 Did the child have difficult in breathing? Days Cause of death
36 Did s/he have fast breathing? Days37
38 Wa the child vomiting? Days
39 Did s/he have diarrhoea? Days40
41 Was there a bulge in the child’s fontanel? Days
42 Did the child die from ... 1-an injury?2-accident?
3-Neither 1 nor 2
43-F If answer to Qn. 42 is 1 or 2, what kind of injury or accident?
44 1-Yes
2-No No Evidence
45 1-Yes 1-Yes
2-No 2-No 9-D
If yes, what did s/he say?
Did s/he get medicine here? The deceased was….
Was given traditional medicine 1-Yes Resident in the DSS area R
order 2-No Dead body brought home for burial M
Mother gave morden medicine 1-Yes Home-coming sick O
order 2-No
Medicine from family 1-Yes Cause of death according to interviewer
order 2-No
Code:
ASK THESE QUESTIONS IF THE CHILD WAS BORN ALIVE
Did the child cry immediately after birth?
Was the child unable to breast-feed?
9-Don't know
SYMPTOMS CONCERNING THE MOTHER (cntd...) 9-Don'tknowWas the baby dead at birth?
9-Don'tknowDid the umbilical cord come
before the baby was born?
Did the child have any malformation at birth?
If yes, how much did the child weigh?
9-Don'tknow
9-Don'tknow
Did the eye colour change to yellow (jaundice)?
9-Don'tknow
9-Don'tknow
9-Don'tknow
9-Don'tknow
9-Don'tknow
9-Don'tknow
If yes, was the problem with the child (1) or the mother (2)?
Was the child weighed after being born?
Did the child have any problem with the umbilical cord?
Evidence and Summary of Details
Did the child have convulsions? Death Certificate
During the period of illness did s/he have areas of skin that were red peeling or skin rash with blisters containing pus?
Burial Permit
Post mortem results
Did s/he have indrawing of the chest while breathing? Days
MCH/ANC Card
Hospital prescription forms
Was the child unable to breast-feed when s/he was ill? Days
Treatment cards
Hospital discharge forms
9-Don't know
Diagnosis:
Other hospital documents
Laboratory/cytology resultsWere there any bruises or signs of injury on child body after birth? 9-Don't know
During the illness that led to death did the child become unconscious?
9-Don't know Did a health worker tell you the cause of death?
9-Don't know
9-Don't know
Health services used by the deceased during his/her illness in the period leading to death
9-Don't know

40 The Policy Implications of Tanzania’s Mortality Burden: AMMP-2 Final Report
Figure 2.2 Verbal Diagnosis Form: Death of Child from 29 Days to 5 Years
Area Number
Interviewer
Village/Branch 1 1-Yes2-No
Name of the ten cell leader 2 Was the child born premature? 1-Yes2-No
Name of head of household 3-F
1-Father 2-Mother 3-Wife/Husb 4 Was the child breast-feeding? 1-Yes4-Bro/Sister 5-Child 2-No6-Other relative 7-No relation 5-F 1-Yes
1-Yes 2-No2-No 6
Name of deceased7-F Was the fever…. 1-continuos
2-on and off9-Don't know
8 Did s/he have convulsion?
N-HomeH-Hospital 9 Did s/he have a cough?O-Other place
10-F 1-dry 9-Don't know2-productive3-with blood
11
12
13
14 Did s/he vomit?
History of events leading to death 15-F Did s/he vomit blood?
16
17 Did s/he have abdominal distension?
18-F Did the distension start…. 1-suddenly 9-Don't know
19 Did s/he have diarrhoea?
20 Did s/he have bloody diarrhoea? 1-Yes2-No
21
22 Did s/he weight loss?
23
24
months
months days
9-Don't know
SYMPTOMS
Place of death (circle)
Was the child too small at birth?9-Don't know
9-Don't know
weeks
If yes, did the child stop just before death? 9-Don't know
Did s/he have fever?
If yes, how many weeks or months of pregnancy?
1-Male 2-Female
Relation of the respondent to the deceased (circle)
Month Year
Did you live with the deceased during his/her illness before death?
(Write exact words as given by the respondent)
Sex Date of birth
Did s/he have breathing difficulties?
Did s/he have fast breathing?
Did s/he have indrawing of chest while breathing?
Date of interview
Date of death
Cause of death according to the respondent?
Day Month Year
Day
Did s/he have mouth sores?
months days
months days
months days
months days
months
Did s/he look pale? (on fingers or feet soles)
Did s/he have a mass in the abdomen?
2-gradually as days went by
9-Don't know
Did s/he abdominal pain?
months days
months days
months
months days
months days
months days
"Excuse me, I will ask you some questions concerning symptoms that the deceased had/showed when s/he was ill. Some of these questions may not appear to be directly related to his/her death.Please bear with me and answer all the questions. They will help us to get clear picture of all possible symptoms that the deceased had"
days
months days
days
months days
months days
If yes, was the cough…..

41Volume 3: Field Operations and Validation Studies
Figure 2.2 Verbal Diagnosis Form: Death of Child from 29 Days to 5 Years
Went to traditional healer 1-Yes
25 Did s/he have puffiness of order 2-No
the face? Village health worker 1-Yes
26 Did s/he have swelling of order 2-No
the whole body? Government Dispensary 1-Yes
27 order 2-No
Government Health Centre) 1-Yes
28 order 2-No
Government Hospital 1-Yes
29 order 2-No
Medicine from any Govt Health Facility 1-Yes9-Don'tknow
30 Did s/he have measles? order 2-No
Private Dispensary 1-Yes
31 order 2-No
Private Health Centre 1-Yes
32 order 2-No
Private Hospital 1-Yes
33 order 2-NoPrivate Pharmacy 1-Yes
34 Did s/he have headache? order 2-NoDidn't get any service 1-No Service
35 Did s/he develop stiffness
of the whole body?
36 Did s/he have loss of
consciousness?37 Cause of death
38 Did s/he have paralysis of Cause of death both legs?
39Cause of death
40
41 Did a dog bite him/her?
42
43-F
44
45
46No Evidence
1-Yes2-No 9-D
Did s/he get medicine here? If yes, what did s/he say?
Was given traditional medicine 1-Yesorder 2-No
Mother gave morden medicine 1-Yes The deceased was….
order 2-No Resident in the DSS area R
Medicine from family 1-Yes Dead body brought home for burial Morder 2-No Home-coming sick O
Cause of death according to interviewer
Code:
9-Don'tknow
9-Don'tknow
9-Don'tknow
9-Don'tknow
9-Don'tknow
9-Don'tknow
Did s/he pass blood in urine?
Health services used by the deceased during his/her illness in the period leading to death
9-Don't know
9-Don't know
If Y what type of animal/insect? (mention the name)
Was s/he injured in a road accident?
Was s/he bitten by another animal or insect?
Was s/he injured intentionally by someone?
Did s/he suffer any other accidental injuries before death?
months
9-Don't know
months days
months days
months days
months days
months
Was s/he unable to pass urine?
Was s/he unusually sleepy?
Did s/he have neck pain?
Did s/he have fits?
SYMPTOMS (contd...)
Did the eye colour change to yellow (jaundice)?
Did she have ankle swelling? (Show that part of body)
Did s/he have swelling of joints?
months days
months days
months days
Did s/he have any other skin disease? months days
months
months days
months days
days
months days
days
months days
months days
MCH/ANC Card
Diagnosis:
months days
months days
Hospital prescription forms
Treatment cards
months days
Hospital discharge forms
Laboratory/cytology results
days
months days
months days
Did a health worker tell you the cause of death?
Other hospital documents
Evidence and Summary of DetailsDeath Certificate
Burial Permit
9-Don'tknow
9-Don'tknow
9-Don'tknow
Post mortem results

42 The Policy Implications of Tanzania’s Mortality Burden: AMMP-2 Final Report
Figure 2.3 Verbal Diagnosis Form: Death of Person Aged 5 Years and Above
Area Number
Interviewer1 Did s/he had fever?
Village/Branch2-F Was the fever…. 1-continuos
Name of ten cell leader 2-on and off 9-Don't know3
Name of head of household4
1-Father 2-Mother 3-Wife/Husb4-Bro/Sister 5-Child 5 Did S/he have palpitations?6-Other relative 7-No relation
1-Yes 62-No
Name of deceased 7 Did S/he have a cough?
8-F 1-dry 9-Don't know
2-productive
3-with blood
9 Did S/he have chest pain?
1-never married 3. > 1husband/wife 5-divorced2-One wife/husband 4-separated 6-widow/er 10-F 1-Yes
2-No
N-Home 11-F Did the pain start…. 1-suddenly 9-Don't knowH-Hospital 2-graduallyO-Other place 12 Did S/he have diarrhoea?
13-F
14-F Did s/he have bloody diarrhoea? 1-Yes
2-No15 Did S/he have poor appetite?
Months Months 16
Diabetes
TB17 Did S/he have difficulty in
swallowing?
AsthmaLeprosy 18 Did S/he have headache?
History of events leading to death19 Did S/he pass blood in urine?
20
21
22
23
24
25-F 1-upper 9-Don't know2-lower3-all over the abdomen
days
days
days
months days
days
months days
months
months
Did S/he have wheezing?
Was s/he breathless on lying flat?
days
months days
days
months
" Excuse me, I will ask you some questions concerning symptoms that the deceased had/showed when s/he was ill. Some of these questions may not appear to be directly related to his/her death.Please bear with me and answer all the questions. They will help us to get clear picture of all possible symptoms that the deceased had."
1-Male 2-Female
Relation of the respondent to the deceased (circle):
Did you live with the deceased during his/her illness before death?
(write year of birth here)
months
SYMPTOMS
Date of interview
Did S/he complain pain on swallowing?
Marital Status
Occupation
Place of death (circle)
Date of deathDay Month Year
(Write exactly as the respondent tells you)
Previously diagnosed medical conditions:
months
months
months days
months
Sex Year of birth
If yes, was the pain localised near the sternum?
What do you think was the cause of death?
If yes, how many times a day?
months days
Was s/he breathless on light work?months days
months daysIf yes, was the cough….
months days
9-Don't know
months days
months days
days
Number of times
months days
9-Don't know
If yes, was the pain….
Did S/he pass urine too many times a day?
Did S/he have abdominal pain?
Did S/he have pain during passing urine?
Was S/he unable to pass urine?
Did S/he have a sensation of pins and needles in the feet?
Heart disease
Other chronic illnessCancer of __________
Hypertension

43Volume 3: Field Operations and Validation Studies
Figure 2.3 Verbal Diagnosis Form: Death of Person Aged 5 Years and Above
49-F 1-Yes26 Did S/he have abdominal 2-No
distension?27-F If yes, did the distension start… 50-F 1-Yes
2-No
51-F 1-Yes9-Don't know 2-No
28 Did S/he vomit? 52-F 1-Yes2-No
29 Did S/he vomit blood? 53-F 1-Yes2-No
30 54-F 1-Yes2-No
31 55-F 1-Yes2-No
32 Did S/he have loss of consciousness? 56-F 1-Yes
33-F 1-suddenly 9-Don't know 2-No57-F How is the baby? 1-Alive
2-Born dead34
35 Did S/he have paralysis of both legs?
36 Did S/he develop stiffness of months daysthe whole body?
37 Did S/he have neck pain? months days58 Did she have an abortion recently? 1-Yes
38 Did S/he have fits? 2-No59-F
39-F Days
6040
6141
62 Did S/he have Weight loss? months days
42 63
months days 6443-F
6544 Did she have abnormal vaginal
discharge? 66 Did S/he have puffiness of face?
67
45 Was she pregnant? 1-Yes 682-No
6946-F If yes, how many months?
47 Je alijifungua hivi karibuni? 1-Yes2-No 70
48-F71 Did a dog bite him/her?
9-Don't know
9-Don't know
Did S/he look pale?
days
Months:
days
days
--- ALL WOMEN (AGED 13 TO 49 YEARS OF AGE) ---
If yes, did she have too much vaginal bleeding? months
months days
SYMPTOMS(contd…)
months days
Did she have too much bleeding after delivering the baby?
Did she have excessive vaginal bleeding during her menstrual period?
Did she have vaginal bleeding on other days apart from her menstrual period?
If yes, how many days before death?
Days:
days
days
months
months
months
If yes, when it was severe, how many times did s/he have fits in a day? no. of times
--- ASK FOR ALL WOMEN (AGED 13 YEARS AND ABOVE) ---Did she have an ulcer or swelling in breast? months days
If yes, did s/he become unconscious…. 2-gradually as days went
by…
Was s/he paralysed on one side of the body? months days
Did she have difficulty in delivering the baby?
Did she have excessive bleeding in the beginning of labour pains?
Did she have excessive bleeding during labour (before delivering the baby)?
months
monthsDid S/he suffer any other accidental injuries recently before death?
Was S/he injured intentionally by someone?
months
Did the eye colour change to yellow (jaundice)?
Was S/he injured in a road accident?
months days
months days
1-suddenly within few days
2-gradually over the weeks
Did S/he have a mass in the abdomen?
Did S/he become mentally confused?
months days
months days
months days
days
months days
months days
months days
days
days
days
days
days
months daysDid S/he have any skin disease?
Did S/he have ankle swelling?
Did S/he have swelling of joints?
Did S/he have mouth sores?
months
months
months
months
3-died within 7 days of birth
4-died after 7 days after birth
9-Don't know
----- OTHER SIGNS (ALL ADULTS) -----
5-twin birth, one died
If yes, how many days before death?
9-Don't know
9-Don't know
9-Don't know
9-Don't know
9-Don't know
9-Don't know
9-Don't know
9-Don't knowDid she have difficulty in delivering placenta?
Did she have a prolonged labour?
Did she have a cesarean operation for delivery?
Did she have a forceps or vacuum delivery?

44 The Policy Implications of Tanzania’s Mortality Burden: AMMP-2 Final Report
Figure 2.3 Verbal Diagnosis Form: Death of Person Aged 5 Years and Above
72 Was the deceased smoking? 0-never smoked77-pipe or tobacco88-number unknown
73-F 99-don't know
741-never drank2-low3-moderate
75 Did S/he commit suicide? 1-Yes 4-high2-No 99-unknown
Je, alipata dawa hapa? Cause of deathWas given traditional medicine 1-Yes
order 2-No
Mother gave modern medicines 1-Yes Cause of death
order 2-NoMedicine from family 1-Yes
order 2-No Cause of death
Went to traditional healer 1-Yes
order 2-NoVillage health worker 1-Yes
order 2-No
Government dispensary 1-Yesorder 2-No
Government Health Centre 1-Yesorder 2-No
Government Hospital 1-Yesorder 2-No
Medicine from any Govt Health facility 1-Yesorder 2-No
Private dispensary 1-Yesorder 2-No
Private Health Centre 1-Yes Noneorder 2-No
Private Hospital 1-Yes 1-Yesorder 2-No 2-No
Private pharmacy 1-Yes If yes, what did s/he say?order 2-No
Didn't get any service 1-No service
2-Had serv. The deceased was….Resident in the DSS area R
Dead body brought home for burial M
1 5 Home-coming sick O2 6
3 7 Cause of death according to interviewer4 8
9-form I 12-form IV
10-form II 13-form V Code:
11-form III 14-form VI15
College after Primary education 16College after secondary education 17Adult education 18No education 19
9-Don'tknow
Death certificate
Burial permit
months days
9-Don'tknow
9-Don'tknow
9-Don'tknow
9-Don'tknow
MCH/ANC card
Laboratory/cytology results
Post-mortem results
If yes, what type of animal or insect (Mention the name)
Evidence and Summary of details
Hospital prescription forms
Treatment cards
Diagnosis
Other hospital documents
Hospital discharge forms
Primary education (std/class)
University
Secondary education (form)
Did a health worker tell you the cause of death?
9-Don'tknow
9-Don'tknow
EDUCATION
-- TOBACCO USAGE --
(write the number of sticks above)
-- ALCOHOL USAGE --Was the deceased taking alcohol? If yes, how much did s/he consume on average?
Health services used by the deceased during his/her illness in the period leading to death
9-Don't know
9-Don't know
9-Don't know
9-Don't know
9-Don't know
9-Don'tknow
9-Don't know
9-Don'tknow
9-Don'tknow
OTHER SYMPTOMS(contd….)
Did S/he encounter any accidental poisoning (including alcohol)?
months days
Did any other animal or insect bite him/her? (how long before his/her death?)

Introduction These are the guidelines used to train for Verbal AutopsyInterviewers (VAIs) in the Tanzania Ministry of Health’sNational Sentinel Surveillance system (NSS).
National Sentinel Surveillance System (NSS) The National Sentinel Surveillance system is a community-based program of the Ministry of Health that contributesessential health information for the improvement of healthservices. The NSS consists of demographic surveillance sites(DSSs) chosen to represent the country. Demographicsurveillance consists of the continuous and completeenumeration of all demographic events (births, deaths, andmigrations) in a geographically defined population. In Tanzania,DSS is combined with mortality surveillance to provide crucialinformation about the health of the population.
Information from this system is used to inform national healthpolicy and priorities for district health plans. The NSS providescommunity-based information on population health, Tanzania’sburden of premature death, demographic profiles and healthservice use before death. These data complements data fromother systems and programs, such as the health facility-basedHealth Management Information System (HMIS/MTUHA).
There are two main components to the NSS system:1. A census of the population in the sentinel areas that
provides demographic information. Census update rounds are conducted once or twice a year, depending on the area.
2. A continuous, active reporting system to ascertain the numbers of deaths in the NSS area and to determine their and probable cause.
The NSS and the Adult Morbidity and Mortality Project(AMMP) teams, with input from other experts, have spent over10 years developing and refining the Verbal Autopsy tools forthe NSS. Three questionnaires, or ‘VA forms’ have beendesigned based on age at death. Separate forms have beendeveloped for:• Children aged younger than 29 days (“Under 1 month”) • Children aged 29 days to 5 years (“Under 5”) • Those aged 5 years and above (“5-plus”) See Figures 2.1-2.3
above.
Objective The objective of these guidelines is to provide Verbal AutopsyInterviewers (VAIs) with a complete description of their role inthe NSS and complete information on how to administer verbalautopsy questionnaire forms.
45Volume 3: Field Operations and Validation Studies
VERBAL AUTOPSYINTERVIEWERTRAINING GUIDELINES

The Actors There are several actors involved in the mortality surveillanceprocess. These are described below:
Key Informant (KI)The KI is a person who lives in the surveillance area and isresponsible for recording and reporting any deaths that occur.Usually KIs are people who are known in their communities andhave similar cultural bacground. KIs help the VA Interviewermake appointments to meet with bereaved families. In the ruralNSS sites, KIs are also responsible for acting as enumeratorsduring census update rounds.The KI keeps a record of all deathsthat take place in the area.
VA Interviewer (VAI) VAIs are usually members of the District or Council health staffand often have medical training to the clinical officer level. TheVAI is informed about new deaths by the KI and conductsVerbal Autopsy interviews. VAIs report to the Verbal AutopsySupervisors.
Respondent The ‘respondent’ is an individual who is resident in or closelyassociated with the household of a deceased resident of thesentinel surveillance site. Respondents are those who knowabout the circumstances leading to the death. Ideally,respondents are those who cared for the deceased during theagonal phase (i.e. in the period leading up to individual’s death).
VA Supervisor (VAS) VASs co-ordinate the activities of the VAIs and are responsiblefor making sure that the field operations run smoothly andefficiently. VASs are often member of the Council HealthManagement Team (CHMT) and report directly to the NSSDistrict Co-ordinator.
District NSS Co-ordinatorThe District NSS Co-ordinator is usually a member of theCHMT and is responsible for the smooth operation of both thecensus update rounds and the mortality surveillance. The Co-ordinator reports directly to the District Medical Officer(DMO).
VAI Role Description and EquipmentVAIs must be able to:• Check the records of the Key Informants;• Plan visits to bereaved families;• Conduct a VA interview; and• Complete the VA forms accurately and neatly
46 The Policy Implications of Tanzania’s Mortality Burden: AMMP-2 Final Report

The VAI requires the following equipment:• A sufficient quantity of the three types of VA forms;• The list of codes used to code the cause of death;• A notebook to use as a register;• A pen and a pencil;• Access to appropriate transportation; and
The data collection process
The process of collection of VA data by the VAI is as follows:• The process begins with a report of a death occurring to a
resident of the DSS area. KIs receive these reports, and keeprecords of deaths that occur in their areas in a notebook or register. VAIs visit KIs regularly on a rotating basis.
• The KI helps the VAI to arrange an appointment with thefamily of the deceased to conduct the VA interview. On theagreed day the interviewer must arrive at the residence of the deceased at the agreed time. Keeping appointments is vital as it is crucial to the success of the surveillance systemto maintain the good will of the community.
• At the start of the interview, the VAI must correctly determine the age of death of the deceased in order to selectthe correct VA form to use.
• VA forms must be filled during the interview with the bereaved family, preferably at the deceased’s residence. VA forms should never be completed either before or after an interview has taken place, and should not be completed by anyone other than the VAI him- or herself.
• With very few exceptions, VA interviews should be completed in a single visit with a respondent. Therefore it iscrucial that all questions be asked in the order they appear on the VA form. This point cannot be stressed strongly enough. A cause of death cannot be properly determined from incomplete forms, and returning to the household of the deceased to correct or fill in missing information is an imposition on the bereaved family that is to be avoided.Theusefulness to the health system of information from incomplete VA forms is thus greatly reduced.
• Some of the questions may seem to be very personal or embarrass the respondents. For this reason, the VAI must use polite and gentle language, show respect, and be patientand humble. Children should not be present during the VAinterview process.
• When it is difficult to get a reliable respondent, the VAI must arrange to visit the household on another day when amore informed respondent will be available. Up to three attempts should be made to conduct an interview. If the information given is incomplete after three visits, the VAI should complete the VA form with the information that is available. This might be as little as name, approximate age
47Volume 3: Field Operations and Validation Studies
and sex, and perhaps the place of death. A note that the interview is incomplete due to the absence of reliable respondents should be made on the form in the ‘history of events’ section. These events will still be counted as deaths inthe system, although the cause of death will remain unknown.
• Again, every section of the form must be filled accurately before the form is submitted to the VAS for onward processing.
Overview of the Verbal Autopsy Forms The VA forms are divided into various sections. Some of thesections are common to all of the forms, while other sections arespecific to certain forms. The contents of the forms are asfollows:
Verbal Diagnosis Form: Death of Child Under 29 Days (NSS Form VA2002-1) This form is used to record all children aged less than 29 days atthe time of death. It is also to be used for all stillbirths from theseventh month of pregnancy. The form has eight sections:• Personal information of the deceased;• Narrative history of events leading to death;• Symptom-duration checklist of symptoms concerning
mother;• Events during the birth of the child;• Health services used by the deceased during his/her illness in
the period leading to death;• Summary of confirmatory evidence;• Information related to residence in the surveillance area; and• Cause of death according to the VAI.
Verbal Diagnosis Form: Death of Children aged 29 Days to 5 years(NSS Form VA2002-2) This form is used to record the deaths of children from 29 daysup to the age of 5 years. This form has seven main sections:• Personal information of the deceased;• Narrative history of events leading to death;• Symptom-duration checklist;• Health services used by the deceased during his/her illness in
the period leading to death;• Summary of confirmatory evidence;• Information related to residence in the surveillance area; and• Cause of death according to the VAI.
Verbal Diagnosis Form: Death of Person Aged 5 years and Above(NSS Form VA2002-3) This form is used to record the deaths of those who havereached aged 5 years and above. This form has 14 sections:
48 The Policy Implications of Tanzania’s Mortality Burden: AMMP-2 Final Report

• Personal information of the deceased;• Previously diagnosed (chronic) medical conditions;• Narrative history of events leading to death;• General symptom-duration checklist;• Checklist of symptoms and their duration specific to
women (age 13 years and above);• Checklist of symptoms and their duration specific to
women of child-bearing age (13 to 49 years old);• Health services used by the deceased during his/her illness
in the period leading to death;• Simple risk factors section;
- Educational level of the deceased;- Tobacco usage (cigarettes, pipe and snuff );- Alcohol usage;
• Summary of confirmatory evidence;• Residence in the surveillance area; and • Cause of death according to the VAI.
How to fill in Sections Common to all FormsThis section tells the VA Interviewer how to complete the partsof the VA forms that are common to all three types of VAforms.
Personal identification information Area (Region and District): Write the name of the region andthe district of the NSS surveillance area.
Number: This is a unique ID number for each VA within thedistrict and should be filled in only by the VAS and never by theVAI. The VAS has a register of numbers already used and issuesnew numbers from the register. There should never be two VAforms from the same district with the same number.
Date of interview: Write the date on which the interview takesplace. The date, month and year should be filled in thespaces/boxes provided.
Interviewer: Write the full name of the VAI (i.e. your name) inthis box.
Village: Fill in the full name of the DSS village in which thedeceased person was resident, for example KIA, KEKO,MWISI, or BANGWE. This is not necessarily the samevillage or area in which s/he was buried. If the deceased livedinside the DSS area, but was buried outside of the DSS area,this space would contain the name of the village of residencebefore death.
49Volume 3: Field Operations and Validation Studies

Name of the ten-cell leader: Write the full name of the local leader.It is advisable to write three names of the local leader and to useupper-case, for example: SAID SEIF MOHAMED. This maybe the balozi (in areas where they are still common), or the nameof the mwenye kiti wa serikali za mitaa.
Name of head of household: Write the full name of the householdhead, for example, JUMA ALI MPONA. It is important to useall 3 names as there are often several people with similar first andlast names in the same village.
The relationship of the respondent to the deceased: There are sevenoptions for this question listed on the form. These optionsdescribe the relationship between the respondent and thedeceased. These are:1=Father2=Mother3=Wife/Husband4=Brother/Sister5=Child6=Another relative7=No relationship
In this section you should circle the number that corresponds tothe relationship between the respondent and the deceased. Forexample, if the respondent is the mother of the deceased, thenyou would circle 2=mother. In the 5-plus form all seven optionsavailable. In both of the child forms, you will see that numbers3=wife or husband and 5=child have been omitted because arenot logical choices for deceased children. (A child under 5cannot have a spouse or a child.)
Did you live with the deceased during his/her illness beforedeath? If the respondent lived with the deceased during his/herillness or before the death the answer is 1=Yes. If s/he did notlive with the deceased, the answer is 2=No.
Name of the deceased: Fill in the complete name of the deceasedin this space. Write the full name of the individual who has died.It is important to make sure you are given the name that thedeceased used during medical treatment. It is advisable to writedown three names of the deceased to help distinguish betweenothers with similar names. Examples: PILI ALI MPONA,MOHAMED JUMA OMARY, MOHAMED JUMASHABAN.
Sex: If the deceased was a boy or man, circle 1=male. Circle2=female for a girl or woman.
50 The Policy Implications of Tanzania’s Mortality Burden: AMMP-2 Final Report

Date of birth: Very often people, especially adults, know the yearthey were born but not their age. The respondent will oftencalculate the age of the deceased by subtracting the year of birthfrom the current year (i.e. the year of death). To reduce thechances of incorrectly calculating the age, you should ask for theyear in which the deceased was born and fill it in the relevantspace. If the year is not known but the age is known, writehis/her age with the word “age” written in front of the age toindicate that this is an age and not the year of birth.
For example, if the deceased was born in 1967, write 1967in the space provided. If the date of birth is not known,and you have been told that the deceased was fifty yearsold, write “age 50 yrs”.
When using the Under 1 month and Under 5 years forms askfor the complete date of birth of the child. Fill in the date,month and year in the boxes provided. If the day or the monthof birth is not known, only fill in the information that is knownand use a dash ( - ) to indicate what is not known.
Example: If the respondent can only tell you that thechild was born in March 1999, write “ - 3 1999”.
The child’s date of birth is usually written on the MCH card soyou should ask for the MCH card to get the exact date of birth.
Place of Death: This is recorded as home, health facility or other.Ask the respondent where the deceased died, and circle theappropriate choice. If the death occurred in hospital, there is aspace after the word hospital where you write the name of thehospital, health centre or dispensary where the death tookplace.
Date of Death: Fill in the date, month and year of death in theappropriate spaces/boxes provided. If the respondent can onlytell you part of the date, for example if the day or month isunknown, put a dash (-) to indicate what is not known andcomplete the rest.
Example: If the respondent tells you that the deceaseddied sometime in May 2000 but is not able to tell you theexact day, write “- 5 2000.”
Cause of death according to the respondent: Ask therespondent what he or she thinks caused the death. Writeexactly what the respondent says, even if it is in vernacular (locallanguage), do not try to interpret it. It is important to ensure
51Volume 3: Field Operations and Validation Studies

that the reason written in this section is that which has been saidby the respondent and not otherwise.
Example: If the respondent says he/she was bewitched,then write “bewitched,” even if you think it would havebeen better to add or modify the reason.
Narrative history of events leading to death: Write the history ofevents leading to the death as told by the respondent in thissection. This is a “story” about what caused the death and not amedical history. The history might be the sequence ofsymptoms of diseases and patient’s health in general beforehis/her death or it might be the events that caused the death ofthe deceased.
Symptom-duration checklist: This section describes how to askquestions about the presence of various symptoms and how longthey lasted. There are four types of questions and responses onthis part of the form:• “Yes/No/don’t know” type questions. For example, “Was
the child born prematurely?”• Questions that relate to symptoms that lasted for a period
of time. For example, the duration of a symptom like fever.• Questions that relate to a potentially catastrophic event that
happened before death. For example, the number of days before death that an accident occurred or the deceased was bitten by an animal.
• Questions that relate to a symptom that happened repeatedly during a day. For example, the number of stools passed each day by someone suffering from diarrhoea.
There are some questions that might seem to be a littleembarrassing, and that you think might not be directly relatedto the death, but it is important to ask all questions in order tomake the coding process work properly.
You must ask every question that is written in the questionnairewithout skipping a single question, unless specifically directed todo so on the form. You must ask every question even if the causeof death seems obvious to you. The forms themselves indicatethe only places where you can, in certain circumstances, skipquestions.These are called ‘filter’ questions.They are shaded andhave the letter “F” after the question number. For example,questions related to women aged 13 years and above have beengrouped together. Questions concerning only women child-bearing age (13 and 49 years) are also grouped together. Thesewill not be asked if the deceased was a man.
52 The Policy Implications of Tanzania’s Mortality Burden: AMMP-2 Final Report

Further Instructions on ‘Yes/No/Don’t know’-typequestions In the form used for a death to a child under 29 days (neonate),most of the questions take the following answers: “Yes”, “No” or“Don’t know.” For these sorts of questions circle the responsegiven by the respondent. Although most common on theneonate form, the questions of this type are also found on theother forms as well.
Example: Question 16 on the neonate form is: “Was thebaby born prematurely?” Circle 1=Yes (If the answer isyes), 2=No (if the answer is no) or 9=Don’t know (if therespondent doesn’t know).
There are other questions that have answers of a similar typeoffering a small number of choices. These questions usuallyseek to clarify specific details.
Example: Question 33-F on the 5-plus form asks “If yes,did he/she lose consciousness suddenly, or slowly?” Thepossible answers to this question are 1=suddenly, 2=slowlyor 9=don’t know.
Further Instructions about Questions Asking about thePresence and Duration of Symptoms For many of the symptoms, where present, we must know howlong the symptom lasted, in days, weeks or months. Look atQuestion 1 on the form for deaths to persons over 5. At the topof the two columns on the right you see the words Months andDays. This type of question has two parts:
First, you find out if the deceased had the symptom at all.Second, if they did have the symptom, you ask the amount oftime that symptom was present. So, for Question 1 on the formfor those over 5 years you ask “Did he/she have a fever?” If theanswer is “yes”, you then ask, “How long did he/she have fever?”If the fever lasted for one week, write 7 in the “Days” box and0 in the “Months” box.
If the deceased did not have the symptom, you should write ‘0’in both boxes.
Sometimes the respondent might be uncertain about asymptom. S/he may not be certain whether a symptom waspresent at all, and/or s/he may not be certain how long thesymptom was present.
53Volume 3: Field Operations and Validation Studies

In these situations, use the following codes:• If it the respondent does not not known whether the
deceased had this symptom or not, write ‘99’• If the deceased had the symptom, but the duration is not
known, write ‘88’• If this symptom did not concern the deceased, write ‘N/A’
(for ‘Not Applicable’). (For example, symptoms relating to pregnancy do not concern men, so when completing a formfor a man, write N/A in the section on maternal causes.)
There are very few circumstances when ‘N/A’ is a correct entrycode for symptom/duration question. Be sure you understandexactly under what circumstances you are permitted to enter thiscode.
Further Instructions About Questions Concerning theInterval Between an Event and DeathThere are some questions that relate to an event such as aninjury that happened to the deceased. In these cases, we need toknow how long before death the event occurred.
Example: In the form for deaths in people over 5 years,Question 71 is: “Did a dog bite him/her?” If the answer is“Yes”, ask: “How long before he/she died was he/she bittenby the dog?” If the respondent answers “one month” write“1” in the box in the months column.
Further Instructions About Questions Concerning theFrequency of Symptoms There are other questions that relate to how often a symptomoccurred. These are usually indicated on the forms by questionswith the phrase “How many times...”
Example: Question 13-F on the form for deaths in peopleover 5 is related to Question 12 concerning diarrhoea.Question 12 asks: “Did he/she have diarrhoea?” If theanswer to this question is “Yes”, then you ask question 13-F: “If yes, how many times per day?” Write the number oftimes that the deceased passed stools per day in the box.
Further Instructions about Filter Questions Filter questions are questions that are only asked depending onthe answer to a previous question. As mentioned above, thereare some questions on the symptoms of diseases checklist wherethe question number is followed by the letter “F”. This indicatesa ‘filter’ question. Examples of filter questions are 24-F on theneonate form, 5-F on the form for 29 days to 5 years, and 13-Fon the form for those over 5 years.
54 The Policy Implications of Tanzania’s Mortality Burden: AMMP-2 Final Report

Health Service Use In this section we record the health services used by thedeceased during the period before death. The empty table onthe form lists a number of different types of health services thatmight have been used, including traditional healers andgovernment and private health facilities at dispensary, healthcentre and hospital level.Valid options under this section alsoinclude ‘self-medication/treatment’ and ‘no service.’
Ask the respondent to identify all the specific types of servicesused by the deceased to seek help for their illness in the periodleading to death. Indicate the order in which health serviceswere sought using numbers, writing 1 for the first place theyvisited, 2 for the next and so on. For each place visited, ask therespondent if the deceased obtained any medication from thatservice.
Example: If the deceased went to a traditional healer firstand was given some medication, then went to a privatedispensary but did not get any medication there and lastlywent to a government hospital where he received somemedication before his death, then this section will be filledas follows:Traditional healer 1=YesGovernment Hospital3=Yes Private Dispensary 2=No
Confirmatory Evidence In the two forms for use in children, the section onconfirmatory evidence comes after the section about healthservices used by the deceased. In the form for those over 5 yearsthis section follows the section on risk factors (questions abouteducation, drinking and smoking).
In this part of the form, you will record summary details of anywritten evidence that might aid in the assignment of theprobable cause of death. There are several suggested types ofsupporting evidence, including: burial permit, in or out-patient records, prescriptions or even a death certificate if available.
Only write down information from written records ordocuments available at that household that you actually seeyourself. For example, if see the burial certificate, carefully copythe reason for death as it is written in the burial certificate.
Residence In the mortality surveillance system a resident is a person whowas living in the DSS area and was intending to stay
55Volume 3: Field Operations and Validation Studies

indefinitely. If someone was living outside of the DSS area (andthen dies) and their body is brought to a village in the NSS areafor burial, they are not considered to be a resident (even if theyhave traditional rights there). They are coded as ‘2 - dead bodybrought for burial.’
A resident does not include people who were just visiting ahousehold in the DSS area and happened, unfortunately, to dieduring their stay. This person would be called a non-resident. AVA is not normally performed for non-residents.
In some cases, adults who have been resident outside the DSSarea and who have fallen seriously ill with long-term conditionslike TB or AIDS will return home in the period before death.These people will be categorised as ‘3=home-coming sick.’
Cause of Death According to the Interviewer VAIs who have medical training you may record what theybelieve to be the cause of death. The most useful way to do thisis to use the coding scheme used by the official verbal autopsycoders so that comparisons can be made to later codes. Thiscoding scheme can be found in Table 1, and training on how touse the codes should be provided to you.
Sections Found Only on the Form for Deaths of People Over the Age of 5There are some sections that are only applicable to those overthe age of 5 and in particular to adults. These are questionsrelating for example to maternal health, education, occupation,drinking and smoking.
Marital status Circle the correct answer from the listed choices: 1=nevermarried, 2=married (monogamous), 3=married (polygynous),4=separated, 5=divorced, 6=widow or widower.
Example: If the deceased had already lost her husband,then circle ‘6=widow.’
Occupation You should use the occupation and income coding scheme asused in the NSS census system. (See Chapter 1 in this Volume.)The coding scheme consists of two components: the deceased’smain source of income and the occupation that used most of thedeceased’s time. In many cases these will be the same, forexample, someone who was a farmer with no other source ofincome would have the same code for income and for time used.There are other people, though, who have more than one job orsource of income. For example, someone might be employed as
56 The Policy Implications of Tanzania’s Mortality Burden: AMMP-2 Final Report

a clerk in a small company on a minimum salary and makemore money as a petty-trader selling used clothing part-time.
To represent this, you should write two numbers in theoccupation box separated by a dash.The first number should bethe code for the main source of income and the second number(code) for the main use of time. So, for example, if the deceasedwas a clerk for a government office but got most of her incomefrom selling second-hand clothes you will write ‘10-16.’
Previously diagnosed conditions In this section fill in the duration in months for each of themedical problems the deceased was known to have sufferedfrom. In this case the ‘duration’ is the period of time betweenthe diagnosis of the disease and death.
Example: If the deceased was diagnosed with high bloodpressure, and that diagnosis was made 6 months beforedeath, write the number ‘6’ in the space provided in frontof the phrase blood pressure.
Example: If the respondent says that the deceased hadhigh blood pressure for 6 years before s/he died, write ‘72’(i.e. 6 year x 12 months) in the empty space provided nextto the phrase blood pressure. If the deceased wasdiagnosed with cancer, specify the type of cancer.
Checklist of Symptoms for Women Aged 13 Years and Above Questions 40 to 44 are to be asked for all women aged 13 yearsand above. They are not to be asked of girls below the age of13, and are obviously not relevant to males.These questions canbe very sensitive or embarrassing for the respondents to answerand need to be asked with tact and care. Because the questionsdeal with intimate matters, you should try to ensure that youspeak with a respondent who is likely to know the answers tothese questions, for example the husband, mother or motherin-law, sisters, or aunts of the deceased. Other adults in thehousehold may be less likely to be able to answer the questionsaccurately.
Checklist of symptoms for Women Aged 13 to 49 Years Questions 45 to 59-F are to be asked of all women ofreproductive age (i.e. age 13 to 49 years). They may be asked ofwomen over the age of 50 if there is a suspicion on your partthat the age of the deceased may not be entirely accurate (i.e.that she was actually younger than 50 at death), or if there is anindication that a woman over 50 was continuing to havechildren. Many of them are filter questions.
57Volume 3: Field Operations and Validation Studies
Education Education level is recorded using a coded list. Circle the numberthat corresponds to the highest level of education achieved bythe deceased. For example, if the deceased had completedprimary education up to Standard seven, circle the number ‘7’ inthe row labelled ‘Primary school education.’ If the deceasedreached Form three, circle number 11 on the row labelledSecondary education. For secondary education the codes are asfollows:
Form one=9, Form two=10, Form three=11 ... Form six=14.
For higher levels of education use the following codes (as listedon the form):
University=15; College after primary school=16; College after secondary school=17; Adult education=18; No education=19.
Simple Risk Factors There are a few questions on this form that gather informationabout the educational attainment and some risk factors thatmight have contributed to the death. We have decided to selectthe commonly-used factors of education, smoking and drinkinghabits.
Tobacco UseIn this section ask if the deceased used tobacco in any form.If the deceased smoked cigarettes, circle then write the numberof cigarettes he or she used to smoke per day in the spaceprovided.
Example: If the deceased used to smoke a packet ofcigarettes each day write the number ‘20’ in the spaceprovided (as this is the number of cigarettes in a packet).
If the deceased did not smoke or he was using snuff or smokinga pipe circle ‘3=pipe or snuff.’ If the deceased did not use tobaccoof any kind, circle ‘4=did not use or smoke.’
As with other questions, it is possible that the respondent doesnot know in detail about the amount the deceased used tosmoke. In these cases use the following to indicate what isknown about the smoking habits of the deceased. If therespondent knows that the deceased used to smoke but does notknow the number cigarettes smoked each day, circle ‘2=numbernot known.’ If the respondent does not know if the deceased wasusing any kind of tobacco (i.e. cigarettes, snuff or pipe), circle‘9=don’t know.’
58 The Policy Implications of Tanzania’s Mortality Burden: AMMP-2 Final Report

59Volume 3: Field Operations and Validation Studies
Alcohol UseAsk this question as phrased on the form. If the deceased diddrink alcohol of any type, ask how much they drank. Theoptions for this question are:1=did not use alcohol2=drank a little3=average4=a lot9 =don’t know.
Some respondents may answer you in a different style but themeaning is the same as above. Read the following examples andsee how they are interpreted:He/she did not drink alcohol at all: 1=did not use alcoholHe/she drank only during public holidays/parties: 2=a littleHe/she drank only on weekends: 3=averageHe/she drank most days each week: 4=a lot
ICD-10 Coding Applied to VABecause they often serve as the best, or even sole evidence oncause of death for many of the world’s poorest, internationalcomparability is important in the application of the VA forms.Therefore, it is recommended that VA be coded to the core, orthree-character, level of the Tenth revision of the ICD-10 usinga three-line death certificate conforming to the specifications fora death certificate contained in the ICD-10, Volume 2. Incertain cases (e.g. injuries) it may be possible to code to thefourth digit. Although ICD-10 encompasses a wide range ofconditions including the ill-defined ones its use, in areas wheredefinitive diagnoses are rarely reached and post-mortemexamination seldom take place to confirm causes of deaths,needs special considerations. Modifications/special exceptionrules need to be made, therefore, to suit our local clinicalpractices. Similarly, it is necessary to re-examine the ICDcoding rules in the context of their application to VA, with theaim of using them as a guideline to suit local clinical practicesand needs. The use of ICD-10 was delayed in the United Statesto allow coding modifications and one of the issues was toenhance the consistency with accepted clinical practices in theUnited States.
Based on experiences in coding the core VA forms presentedhere, and cross-comparing the ICD coding of numerousphysicians, the majority of death certificates contained only asingle cause.This reflects some of the inherent limitations of theverbal autopsy method in collecting precise, and sufficientlydetailed information to permit the coding of multiple causes ofdeath in most cases. Conditions found to cause confusionamong coders were those presenting with multiple

diagnoses/sequalae within one individual, stillbirths withknown/unknown underlying maternal cause as well as theexternal causes of injuries. In conducting ICD coding of VA theGeneral Principle, Linkage Rule, and Selection Rule 3 havebeen the most commonly used ICD guidelines [6].
Experiences in the use of ICD-10 cause of deaths for causeof death certificates in the verbal autopsy validation study inTanzaniaThe AMMP system of demographic surveillance conductscensuses 1-2 times per year in selected districts, records incidentdeaths during the year through an active reporting system, anddetermines cause of death through a verbal autopsy (VA)interview. The key to the AMMP system is the use of the VAinterviews in the analysis of community-level mortalitysurveillance.The VA techniques offer the best hope of recordingthe causes of death in areas like Tanzania where vital registrationsystem is rudimentary. However, the accuracy of the verbalautopsy tool has been an area of concern and the validation ofthe tool has been one of the major task of the Ministry of healththrough the AMMP-2
The need to validate the verbal autopsy tool has been moreurgent as a result of the AMMP system role in serving as partof a WHO-proposed ‘prototype’ for mortality surveillance inother settings where vital registration data do not allow forreliable assessment of overall or cause-specific mortality.
The validation of the verbal autopsy tool required a comparisonwith a ‘gold standard’ that represents a true or accurate cause ofdeath. Since autopsy of deceased are rarely performed inTanzania, medical records of the deceased have been used toserve as the ‘gold standard.’ The Intentional Classification ofdiseases and related health problems has been used for thesystematic recording, analysis interpretation and comparison ofover 3000 deaths. The data of these deaths from records of theverbal autopsy system and from health facility medical recordsof the deceased in AMMP DSS areas. The comparison will beused to estimate the sensitivity and specificity of the verbalautopsy tool.
One of the first tasks in classifying causes of mortality was toidentify personnel whose skills would be enhanced in recordingthe train of events that lead to the death of the individual andproduce a death certificate with cause(s) of death and ultimatelyassigning an ICD-10 cause of death.
Physicians were identified and trained in the following areas:• The use of the Verbal Autopsy (VA) as a tool for collecting
60 The Policy Implications of Tanzania’s Mortality Burden: AMMP-2 Final Report

community -based mortality data• The concept of Verbal Autopsy Validation (VAV), and the
use of Medical Abstraction & Medical records (MR) in thiscontext
• Skills in assigning a ‘Cause of Death’ and to correctly fill ina death certificate
• Classifying the cause of death and assigning an appropriatecode and cause of death according to the International Classification of Diseases Version 10 (ICD-10).
Formal course of instruction was provided that was guided bythe Volume 2 of the ICD-10. The courses provided practicalinstructions for mortality cause of death and guidelines for thepresentation and interpretation of data. The instruction wasaugmented with extensive practice on sample records and bydiscussion of the problems.
In addition to the theoretical work, participants were givenadequate opportunity to practice the skills obtained throughextensive exercises both in cause of death assignment andclinical cause of death using ICD-10. The final day of theworkshop was used to practice identifying cause of death workusing ‘real’ VA and medical record forms. These were thensubjected to a quality analysis, after which common errors andmistakes were identified and reviewed.
Despite the use of comprehensive instructions (contained inthe ICD-10 volumes 1-3) and training several problems werediscovered and were resolved locally. The causes of death ruleswere studied and were used as a guide to set locally applicablerules to suit our clinical practices. A summary of ICD 10 Vol.2 prepared by the Project ( June 2003) was a great help in thatprocess. Most of the problems that were encountered were aresult of availability of limited information, stillbirths withknown/unknown underlying maternal cause as well as theexternal causes of injuries. These situations causeddiscrepancies in assigning a cause of death and reaching a finalcause of death.
Although ICD 10 encompasses a wide range of conditionsincluding the ill-defined ones, its use in our setting, wheredefinitive diagnoses are rarely made and in the absence of post-mortem to confirm causes of deaths, needs specialconsiderations. Modifications and special exception had to bemade to suit our local clinical practices. After betterunderstanding of general principles, selection rules,modification rules and other rules [1, pp 32-68], it was clear thatthere is room for differential reasoning among the cause ofdeath, explaining reasons for some of he discrepancies observed.
61Volume 3: Field Operations and Validation Studies

The ICD 10 cause of death of Verbal Autopsies (VA’s) andMedical records in AMMP Verbal Autopsy Validation (VAV)study, has been done basing on those rules and has proved asignificant improvement in level of agreement between cause ofdeath.
Special cases and exceptions in AMMP ICD 10 cause of death
MalariaThe ICD is suitable for malaria cause of death but the lack ofsufficient details in the clinical notes does not allow theinclusion of some forms of malaria. The ICD 10 classificationof ‘Cerebral Malaria’ falls under the category of Malaria causedby Plasmodium falciparum. Since this level of details (a thinblood slide prepared in such a way as to identify Plasmodiumfalciparum malaria species) is unlikely to be found in our verbalautopsy or medical records, the diagnosis or cause of death as‘Cerebral Malaria’ cannot be made based on the symptoms andsigns alone.
In our situation the possible codes for malaria deaths aretherefore (a) and (b) and not (c):(a) B54—Unspecified malaria / clinically diagnosed malaria
without parasitological confirmation.(b) B53.8—Parasitological confirmed malaria, Not
Otherwise Specified).(c) B50, B51, B52 and B53.0 and B53.1 requires specification
of Plasmodium species which is rarely made and was not encountered in over 3000 medical records of the deceased
HIV Disease and tuberculosisHIV disease can present with many complications andinfections, each having its own unique cause of death and code(B20 to B24). It has been noted in the ICD-10 the fourthsubcategories of B20-B23 are provided only for optional usewhere it is not possible or desired to use multiple cause of deathto identify the specific condition. However, considering thepublic health importance of Tuberculosis, and in order tomaintain uniformity of the cause of deaths assigned, thefollowing cause of deaths and codes have been used for HIVdisease:
B20.0—HIV disease resulting in Tuberculosis. This code wasgiven priority as the underlying cause of death where the historyor findings indicate evidence of tuberculosis.
B22.0—HIV disease resulting in encephalopathy or dementia.This cause of death and code was used where there was history
62 The Policy Implications of Tanzania’s Mortality Burden: AMMP-2 Final Report

of confusion, dementia, and loss of conscious of more than oneday or other CNS manifestations such as stroke associated withHIV. This is one of the commonest presentation of terminalHIV disease in Tanzania
B20.7—HIV disease resulting in multiple infections. Thiscause of death and code was used where there is evidence ofmore than a single infection with HIV (e.g. Candidiasis,mycoses, parasitic diseases etc). The use of this cause of deathwhen there is more than one infection avoids assigning severalcause of deaths for each type of associated infection, buildsuniformity and enhances consensus between different coders.
However where there is evidence of Tuberculosisinfection/disease, the cause of death B20.0 (HIV withTuberculosis) has been used. In cases of HIV disease with onlyone infection identified e.g. Candidiasis only then the cause ofdeath that was assigned was ‘HIV with Candidiasis’ B20.4.
When a case of HIV disease with TB presented with CNSmanifestations, the cause of death ‘HIV with encephalopathy’has been used as immediate clinical symptoms suggesting HIVdisease followed by ‘HIV with TB’ as the underlying cause ofdeath. Where HIV presents with Kaposi sarcoma, thiscomplication was not coded separately but was included in themultiple infection categories. However in cases where Kaposisarcoma was the sole complication of HIV disease then theappropriate cause of death and code was used as in the ICD-10book. This is because Kaposi sarcoma is multicentric and isregarded as a malignancy with a viral infectious origin.
Paediatric HIVICD-10 does not provide specific classification and cause ofdeath of HIV disease in children. Due to difficulty indiagnosing HIV in children, the following guidelines have beenused to assign cause of death in children who presented withHIV disease:• Clinical symptoms suggesting HIV disease in the absence
of other obvious causes of immune suppression (e.g.malnutrition)
• Clinical symptoms suggesting HIV disease and a family and social history suggestive of HIV e.g. parental death due to HIV disease including cases where the child’s mother was sick at the time of death of the child.
• Clinical symptoms suggesting HIV disease and the attending physician had requested an HIV test to confirm the diagnosis.
63Volume 3: Field Operations and Validation Studies

TuberculosisDefinitive diagnosis of tuberculosis (TB) can only be madewhere AFB can be identified, usually, from sputum. Howeversuch information has not been available in most of the medicalrecords of the deceased. Diagnosis of TB from the record wasmade based on:• Sputum positive for AFB• A chest X-ray suggestive of PTB• Current history of taking anti-TB drugs • History suggestive of TB e.g. prolonged cough for more
than 1 month, wasting and prolonged fevers.
However it was difficult to differentiate between TB and HIVdisease
The following are not exceptions but only rules to qualify thecause of death process:
Stillbirths/fetal deaths/intra-uterine foetal deaths.The term ‘Stillbirth’ or ‘fetal death’ was used (not intra-uterinefoetal deaths) since the death is recorded after birth of the deadfoetus and not while in utero. There is no difference in cause ofdeath between stillbirths recorded as ‘fresh’ or ‘macerated.’Where a fetal death or stillbirth can be attributed to a particularcause (e.g. APH, maternal infection, EPH), the cause of deaththat was recorded as: ‘stillbirth’ (fetal death) due to ‘theappropriate obstetric cause.’ Where there is no possible cause forthe stillbirth (from the history), the appropriate cause of deathwill be: Stillbirth due to unspecified cause—P95.
Neonatal deathsIf there was evidence in the records of life after birth of the fetus,with death occurring later, such a death was classified as aneonatal death. If the neonatal death could be attributed to aparticular cause, the cause of death was classified and recordedas ‘ Neonatal death due to ... appropriate cause’.
Often the causes of deaths and their codes for fetal and neonatalperiod that are attributed to a particular cause are the same e.g.‘Stillbirth due to maternal eclampsia—P00.0’ and ‘Neonataldeath due to maternal eclampsia—P00.0’ have similar codes.
Obstetric deathsA maternal death due to obstetric causes is recorded with theletter ‘O’ at the beginning. Obstetric cause may result in deathof the mother in which case they are classified and recorded as‘cause of death with the appropriate cause of death O … ’Where an obstetric cause results in a fetal or neonatal death,they will be classified as explained above.
64 The Policy Implications of Tanzania’s Mortality Burden: AMMP-2 Final Report

Other special cases
Convulsions: The cause of death for ‘febrile convulsions’ was notbe used, as this is a diagnosis of exclusion. Instead ‘convulsions’was used as the cause of death.
Undetermined/Unknown causes: If the cause of death wasunknown or Initially there was confusion between morbidityand mortality in ICD-10 classification. In cases where thecause was Undetermined, the cause of death for ‘Undeterminedcause of mortality - R99’ was used and not ‘morbidity cause ofdeath - R69.’
Instantaneous death/found dead: ICD-10 allows for classifyingdiseases and health problems even in cases where there are onlysymptom and signs that are recorded without a definitiveclinical diagnosis. Any presenting symptom (when cause ofdeath could not be determined) was used for coding e.g.‘abdominal pain that led to unspecified disease.’
Diagnosing cholera: A ‘working diagnosis’ was developed andused to assign cause of death as a case of cholera where:• the deceased had history of being taken to a cholera
centre/Treatment Unit after onset of the disease.• there was a sudden onset of diarrhoea +/- vomiting for a
short period of time that led to death.
ICD-10 Tabulation Lists and Core Code GlossaryFor the purposes of mortality tabulation and reporting, theICD recommends the use of an approved 103-item or 80-itemcondensed list. The ICD also sanctions the development oflocally-relevant tabulation lists. Table 1 consists of a proposedICD VA tabulation list and a glossary mapping the tabulationlist to the ICD 103-cause condensed list, and to ranges of ICDcore (three digit) codes.
65Volume 3: Field Operations and Validation Studies

66 The Policy Implications of Tanzania’s Mortality Burden: AMMP-2 Final Report
Table 1. Proposed 42-item ICD-10 VA tabulation List
Proposed 42-item ICD-10 VAtabulation list ICD-10 103-item condensed list1 ICD-10 core code1
1.0 Unspecified communicable diseases 1-013, 1-025 A49, A64, B34, B49, B64, B89, B991.1 Acute Febrile Illness 1-021:1-023, 1-025, 1-059, 1-061 A38, A86:A87, B50:B56, G00, G03:G041.2 Acute respiratory infections 1-009:1-010, 1-074:1-075, 1-077 A36:A37, J00:J06, J12:J18, J20:J22, J36, J391.3 Hepatitis 1-019 B15:B191.4 Tuberculosis/AIDS 1-005:1-006, 1-020, 1-025 A15:A19, B20:B24, B901.5 Diarrhoeal diseases 1-002:1-004 A00, A03, A091.6 Tetanus 1-008 A33:A351.7 Rabies 1-015, 1-017 A821.9 All other spec. communicable diseases 1-004, 1-007, 1-011:1-014, 1-
016:1-018, 1-023:1-025, 1-061:1-063, 1-073, 1-076:1-077, 1-082:1-083, 1-086
A01:A02, A04:A08, A20:A28, A30:A32, A39:A44,A46, A48, A50:A60, A63, A65:A71, A74:A75,A77:A81, A83:A85, A88:A96, A98:A99, B00:B09,B25:B27, B30, B33, B35:B48, B57:B60, B65:B83,B85:B88, B91:B92, B94, G06:G08, H00:H01, H10,H46, H60, J10:J11, J31:J32, J37, J40:J43, J65,J85:J86, L00:L02, L08, M01, M03, N45, N49, N61,N70:N73, N75:N77
2.0 Unspec. direct maternal causes 1-088:1-089, 1-091 O02, O26, O28:O29, O95:O962.1 Abortion 1-088:1-089 O03:O07, O202.2 Eclampsia 1-089 O152.3 Ante/postpartum haemorrhage 1-089 O44:O46, O722.4 Obstructed labour 1-089 O64-O662.5 Puerperal sepsis 1-089 O85:O862.9 Other spec. direct maternal causes 1-089:1-091 O10:O14, O16, O21:O25, O30:O36, O40:O43,
O47:O48, O60:O71, O73:O75, O87:O92, O97:O993.0 Unspecified non-communicable causes 1-054 E883.1 Cardiovascular Disorders 1-065:1-071 I00:I02, I05:I13, I20:I25, I27, I30:I40, I42:I51,
I60:I74, I77:I89, I95, I97:I993.2 Chronic Obstructive PulmonaryDisease
1-076:1-077 J44:J47, J80:J82, J84
3.3 Liver diseases 1-080 K70:K763.4 Acute abdominal conditions 1-081, 1-088 K35:K36, K56, K65, K85, O003.5 Diabetes 1-052 E10:E143.6 Neoplasms 1-027:1-047 C00:C26, C30:C34, C37:C41, C43:C58, C60:C85,
C88, C90:C97, D00:D07, D09:D483.7 Renal disorders 1-085:1-086 N00:N08, N10:N15, N17:N23, N25:N36, N39:N413.8 Central Nervous system disorders 1-056:1-057, 1-060:1-063, 1-083 F01:F07, F09:F25, F28:F34, F38:F45, G05,
G09:G12, G20:G25, G30:G32, G35:G37, G40:G41,G45:G47, G50:G58, G60:G63, G70:G72, G80:G83,G90:G98, H47, H49:H51, H55, M54
3.9 All other specified noncommunicablediseases
1-050, 1-054, 1-057, 1-061:1-063,1-068, 1-077, 1-079, 1-081:1-083,1-086, 1-088, 1-093
D73, D86, E00:E07, E15:E16, E20:E32, E34, E85,F48, F50:F55, F59:F66, F68:F73, F78:F84,F88:F95, F98:F99, G64, H02, H04:H05, H11, H13,H15:H22, H25:H28, H30:H31, H33:H36, H40,H43:H45, H52:H54, H57, H61, H65:H66, H68:H75,H80:H81, H83, H90:H93, I26,I28, J30, J33:J35,J38, J60:J64, J66:J70, J90:J96, J98, K00:K14,K20:K22, K25:K31, K37:K38, K40:K46, K50:K52,K55, K57:K63, K66, K80:K83, K86:K87, K90:K92,L03:L05, L10:L13, L20:L30, L40:L44, L50:L53,L55:L60, L63:L68, L70:L75, L80:L85, L87:L95,L97:L98, M00, M02, M05:M25, M30:M36,M40:M43, M45:M51, M53, M60:M63, M65:M68,M70:M72, M75:M77, M79:M96, M99, N42:N44,N46:N48, N50:N51, N60, N62:N64, N80:N98, O01,Q39, Q79
4.0 All other spec. symptoms, signs andsyndromes
1-094 R00-R94
4.1 Anaemia 1-049 D50:D53, D55:D64

67Volume 3: Field Operations and Validation Studies
Table 1. Proposed 42-item ICD-10 VA tabulation List
Proposed 42-item ICD-10 VAtabulation list ICD-10 103-item condensed list1 ICD-10 core code1
4.9 All other spec. symptoms, signs andsyndromes
1-050, 1-054, 1-061, 1-094 D65:D72, D74:D76, D80:D84, D89, G43:G44,R05:R07, R09:R23, R25:R27, R29:R36, R39:R64,R68:R87, R89:R95
5.0 Unspecified external causes 1-103 Y10, Y20:Y36, Y59, Y87:Y895.1 Unintentional Injuries 1-096:1-100, 1-103 V01:V06, V09:V99, W00:W45, W49:W60,
W64:W70, W73:W81, W83:W94, W99, X00:X06,X08:X54, X57:X59, Y11:Y19, Y40:Y58, Y60:Y66,Y69:Y86
5.2 Intentional Injuries 1-101:1-102 X60:X99, Y00:Y096.0 Undetermined 1-094 R95-R96; R98; R9910.0 Still Birth 1-092 P9511.0 Birth injury and/or asphyxia 1-092 P10-P15; P2112.0 Prematurity and/or low birth weight 1-089 O60; O36.513.0 Congenital abnormalities 1-093:1-094 Q00:Q07, Q10:Q18, Q20:Q28, Q30:Q38, Q40:Q45,
Q50:Q56, Q60:Q78, Q80:Q87, Q89:Q93, Q95:Q99,R00:R04, R96, R98:R99
14.0 All other perinatal causes 1-089, 1-092 O80:O84, P00:P05, P07:P08, P10:P15, P20:P29,P35:P39, P50:P61, P70:P72, P74:P78, P80:P81,P83, P90:P96
15.0 Neonatal tetanus 1-008 A3318.0 Malnutrition 1-053:1-054 E40:E46, E50:E56, E58:E61, E63:E68, E70:E80,
E83:E84, E86:E8719.0 Measles 1-018 B0520.0 All other specified diseases 1-094 R95-R96; R98; R99Note:1 source: World Health Organization, International statistical classification of diseases and related health problems. Tenth Revision. Volume 2. 1993, Geneva:World Health Organization.

The use of these core forms in settings where the cause structureof mortality is likely to differ substantially from that of this EastAfrican country should be accompanied by a process of carefulreview and consultation with knowledgeable public healthexperts. This should be followed by rigorous translation, andback-translation in the language(s) of the populations amongwhom they are intended for use. It is also advisable to seek theinput of medical anthropologists or sociologists to assure localcomprehension of the forms by populations among whom VAinterviews are to be conducted [3].
VA is a fairly crude tool to determine cause of death, relying asit does on family member and caregiver information across alimited number of questions, rarely supported by any clinicalevidence or laboratory findings. Therefore it cannot be expectedto reliably and repeatedly determine death to the core code levelacross all causes of death. In order to preserve the benefits ofICD coding while accepting the inherent limitations of the tool,causes of death at the core level should be aggregated into larger‘cause groups’ for tabulation and presentation.
In some quarters a desire has been expressed to establish a set ofstandard VA tools to be applied internationally. Given thediffering disease ecologies among the countries where VA islikely to be useful, and the fact that the cause structure ofmortality affects the performance of a given VA instrument [4],perhaps the most that can be sought is a set of core guidelinessuch as the ones offered here.
It is our hope that others may benefit from the experience andeffort that has gone into the development and use of these tools.
1. World Health Organization, International statistical classification ofdiseases and related health problems.Tenth Revision. Volume 2. 1993,Geneva: World Health Organization.
2. National Sentinel Surveillance System, Report of Workshop on Drafting Core Verbal Autopsy Tools for use by sites contributing mortality data to the NSS. 2001, Department of Policy and Planning, Ministry of Health, United Republic of Tanzania: Dar es Salaam, Tanzania.
3. Setel, P., Mkusa, V., and and the AMMP Team, Comprehension ofSwahili Verbal Autopsy Forms. AMMP Technical Report No. 7. 2001,Adult Morbidity and Mortality Project & Health Information andResearch Section, Department of Policy and Planning, Ministry ofHealth, United Republic of Tanzania: Dar es Salaam.
4. Boulle, A., Chandramohan, D., and Weller, P., A case study of usingartificial neural networks for classifying cause of death from verbal autopsy. International Journal of Epidemiology, 2001. 30: p. 515-520.
68 The Policy Implications of Tanzania’s Mortality Burden: AMMP-2 Final Report
DISCUSSION
REFERENCES

5. Madden, M., Assigning Adult Causes of Death via Verbal Autopsy using Data-derived Algorithms, in statistics. 2002, Brigham Young:Provo.
6. World Health Organization, International statistical classification ofdiseases and related health problems. Tenth Revision. Volume 1.1993, Geneva: World Health Organization.
69Volume 3: Field Operations and Validation Studies
DefinitionsFor the purposes of the GNU Free Documentation Licenseunder which these core verbal autopsy forms are being released,the following definitions pertain:1. “The Document”
a. The core verbal autopsy forms are considered a single document.
2. “Secondary Sections”a. Acknowledgement:This document (is/is based upon Core
Verbal Autopsy Forms,) an output of the Adult Morbidityand Mortality Project of the Tanzanian Ministry of Health (AMMP). AMMP was funded by the UK Department for International Development (DFID) andimplemented in partnership with the University of Newcastle upon Tyne. The views expressed are not necessarily those of DFID.
b. Suggested reference: Adult Morbidity and Mortality Project, Tanzanian Ministry of Health. Conducting Mortality Surveillance
3. “Invariant Sections”a. None.
4. “Front Cover Text”a. Core Verbal Autopsy Forms
It is requested that anyone reproducing, translating and/ormodifying these verbal autopsy forms and reproducing them inquantities of 100 or more include in any publication arisingfrom their use either or both of the Secondary Sections citedabove with the deletion of the words “is” or “is based upon CoreVerbal Autopsy Forms” in the acknowledgement, asappropriate. This should appear part of the references sectionor in the form of an acknowledgement.
GNU Free Documentation License Version 1.2, November2002 Copyright (c) 2000,2001,2002 Free Software Foundation,Inc. 59 Temple Place, Suite 330, Boston, MA 02111-1307
ANNEX1. GNU FREEDOCUMENTATIONLICENSE

USA. Everyone is permitted to copy and distribute verbatimcopies of this license document, but changing it is not allowed.
PreambleThe purpose of this License is to make a manual, textbook, orother functional and useful document “free” in the sense offreedom: to assure everyone the effective freedom to copy andredistribute it, with or without modifying it, either commerciallyor noncommercially. Secondarily, this License preserves for theauthor and publisher a way to get credit for their work, while notbeing considered responsible for modifications made by others.
This License is a kind of “copyleft”, which means that derivativeworks of the document must themselves be free in the samesense. It complements the GNU General Public License,which is a copyleft license designed for free software.
We have designed this License in order to use it for manuals forfree software, because free software needs free documentation: afree program should come with manuals providing the samefreedoms that the software does. But this License is not limitedto software manuals; it can be used for any textual work,regardless of subject matter or whether it is published as aprinted book. We recommend this License principally forworks whose purpose is instruction or reference.
Applicability and DefinitionsThis License applies to any manual or other work, in anymedium, that contains a notice placed by the copyright holdersaying it can be distributed under the terms of this License.Such a notice grants a world-wide, royalty-free license,unlimited in duration, to use that work under the conditionsstated herein. The “Document”, below, refers to any suchmanual or work. Any member of the public is a licensee, and isaddressed as “you”. You accept the license if you copy, modify ordistribute the work in a way requiring permission undercopyright law.
A “Modified Version” of the Document means any workcontaining the Document or a portion of it, either copiedverbatim, or with modifications and/or translated into anotherlanguage.
A “Secondary Section” is a named appendix or a front-mattersection of the Document that deals exclusively with therelationship of the publishers or authors of the Document to theDocument’s overall subject (or to related matters) and containsnothing that could fall directly within that overall subject.(Thus, if the Document is in part a textbook of mathematics, a
70 The Policy Implications of Tanzania’s Mortality Burden: AMMP-2 Final Report

Secondary Section may not explain any mathematics.) Therelationship could be a matter of historical connection with thesubject or with related matters, or of legal, commercial,philosophical, ethical or political position regarding them.
The “Invariant Sections” are certain Secondary Sections whosetitles are designated, as being those of Invariant Sections, in thenotice that says that the Document is released under thisLicense. If a section does not fit the above definition ofSecondary then it is not allowed to be designated as Invariant.The Document may contain zero Invariant Sections. If theDocument does not identify any Invariant Sections then thereare none.
The “Cover Texts” are certain short passages of text that arelisted, as Front-Cover Texts or Back-Cover Texts, in the noticethat says that the Document is released under this License. AFront-Cover Text may be at most 5 words, and a Back-CoverText may be at most 25 words.
A “Transparent” copy of the Document means a machine-readable copy, represented in a format whose specification isavailable to the general public, that is suitable for revising thedocument straightforwardly with generic text editors or (forimages composed of pixels) generic paint programs or (fordrawings) some widely available drawing editor, and that issuitable for input to text formatters or for automatic translationto a variety of formats suitable for input to text formatters. Acopy made in an otherwise Transparent file format whosemarkup, or absence of markup, has been arranged to thwart ordiscourage subsequent modification by readers is notTransparent. An image format is not Transparent if used forany substantial amount of text. A copy that is not“Transparent” is called “Opaque”.
Examples of suitable formats for Transparent copies includeplain ASCII without markup, Texinfo input format, LaTeXinput format, SGML or XML using a publicly available DTD,and standard-conforming simple HTML, PostScript or PDFdesigned for human modification. Examples of transparentimage formats include PNG, XCF and JPG. Opaque formatsinclude proprietary formats that can be read and edited only byproprietary word processors, SGML or XML for which theDTD and/or processing tools are not generally available, andthe machine-generated HTML, PostScript or PDF producedby some word processors for output purposes only.
The “Title Page” means, for a printed book, the title page itself,plus such following pages as are needed to hold, legibly, the
71Volume 3: Field Operations and Validation Studies

material this License requires to appear in the title page. Forworks in formats which do not have any title page as such, “TitlePage” means the text near the most prominent appearance ofthe work’s title, preceding the beginning of the body of the text.
A section “Entitled XYZ” means a named subunit of theDocument whose title either is precisely XYZ or contains XYZin parentheses following text that translates XYZ in anotherlanguage. (Here XYZ stands for a specific section namementioned below, such as “Acknowledgements”, “Dedications”,“Endorsements”, or “History”.) To “Preserve the Title” of such asection when you modify the Document means that it remainsa section “Entitled XYZ” according to this definition.
The Document may include Warranty Disclaimers next to thenotice which states that this License applies to the Document.These Warranty Disclaimers are considered to be included byreference in this License, but only as regards disclaimingwarranties: any other implication that these WarrantyDisclaimers may have is void and has no effect on the meaningof this License.
Verbatim CopyingYou may copy and distribute the Document in any medium,either commercially or noncommercially, provided that thisLicense, the copyright notices, and the license notice saying thisLicense applies to the Document are reproduced in all copies,and that you add no other conditions whatsoever to those of thisLicense. You may not use technical measures to obstruct orcontrol the reading or further copying of the copies you make ordistribute. However, you may accept compensation in exchangefor copies. If you distribute a large enough number of copies youmust also follow the conditions in section 3.
You may also lend copies, under the same conditions statedabove, and you may publicly display copies.
Copying in QuantityIf you publish printed copies (or copies in media that commonlyhave printed covers) of the Document, numbering more than100, and the Document’s license notice requires Cover Texts,you must enclose the copies in covers that carry, clearly andlegibly, all these Cover Texts: Front-Cover Texts on the frontcover, and Back-Cover Texts on the back cover. Both coversmust also clearly and legibly identify you as the publisher ofthese copies. The front cover must present the full title with allwords of the title equally prominent and visible. You may addother material on the covers in addition. Copying with changeslimited to the covers, as long as they preserve the title of the
72 The Policy Implications of Tanzania’s Mortality Burden: AMMP-2 Final Report

Document and satisfy these conditions, can be treated asverbatim copying in other respects.
If the required texts for either cover are too voluminous to fitlegibly, you should put the first ones listed (as many as fitreasonably) on the actual cover, and continue the rest ontoadjacent pages.
If you publish or distribute Opaque copies of the Documentnumbering more than 100, you must either include a machine-readable Transparent copy along with each Opaque copy, orstate in or with each Opaque copy a computer-networklocation from which the general network-using public hasaccess to download using public-standard network protocols acomplete Transparent copy of the Document, free of addedmaterial. If you use the latter option, you must take reasonablyprudent steps, when you begin distribution of Opaque copies inquantity, to ensure that this Transparent copy will remain thusaccessible at the stated location until at least one year after thelast time you distribute an Opaque copy (directly or throughyour agents or retailers) of that edition to the public.
It is requested, but not required, that you contact the authors ofthe Document well before redistributing any large number ofcopies, to give them a chance to provide you with an updatedversion of the Document.
ModificationsYou may copy and distribute a Modified Version of theDocument under the conditions of sections 2 and 3 above,provided that you release the Modified Version under preciselythis License, with the Modified Version filling the role of theDocument, thus licensing distribution and modification of theModified Version to whoever possesses a copy of it. Inaddition, you must do these things in the Modified Version:
A. Use in the Title Page (and on the covers, if any) a titledistinct from that of the Document, and from those of previousversions (which should, if there were any, be listed in theHistory section of the Document). You may use the same titleas a previous version if the original publisher of that versiongives permission. B. List on the Title Page, as authors, one ormore persons or entities responsible for authorship of themodifications in the Modified Version, together with at leastfive of the principal authors of the Document (all of itsprincipal authors, if it has fewer than five), unless they releaseyou from this requirement. C. State on the Title page thename of the publisher of the Modified Version, as the
73Volume 3: Field Operations and Validation Studies

publisher. D. Preserve all the copyright notices of theDocument. E. Add an appropriate copyright notice for yourmodifications adjacent to the other copyright notices. F.Include, immediately after the copyright notices, a license noticegiving the public permission to use the Modified Version underthe terms of this License, in the form shown in the Addendumbelow. G. Preserve in that license notice the full lists ofInvariant Sections and required Cover Texts given in theDocument’s license notice. H. Include an unaltered copy of thisLicense. I. Preserve the section Entitled “History”, Preserve itsTitle, and add to it an item stating at least the title, year, newauthors, and publisher of the Modified Version as given on theTitle Page. If there is no section Entitled “History” in theDocument, create one stating the title, year, authors, andpublisher of the Document as given on its Title Page, then addan item describing the Modified Version as stated in theprevious sentence. J. Preserve the network location, if any, givenin the Document for public access to a Transparent copy of theDocument, and likewise the network locations given in theDocument for previous versions it was based on. These may beplaced in the “History” section. You may omit a networklocation for a work that was published at least four years beforethe Document itself, or if the original publisher of the version itrefers to gives permission. K. For any section Entitled“Acknowledgements” or “Dedications”, Preserve the Title of thesection, and preserve in the section all the substance and tone ofeach of the contributor acknowledgements and/or dedicationsgiven therein. L. Preserve all the Invariant Sections of theDocument, unaltered in their text and in their titles. Sectionnumbers or the equivalent are not considered part of the sectiontitles. M. Delete any section Entitled “Endorsements”. Such asection may not be included in the Modified Version. N. Donot retitle any existing section to be Entitled “Endorsements” orto conflict in title with any Invariant Section. O. Preserve anyWarranty Disclaimers.
If the Modified Version includes new front-matter sections orappendices that qualify as Secondary Sections and contain nomaterial copied from the Document, you may at your optiondesignate some or all of these sections as invariant. To do this,add their titles to the list of Invariant Sections in the ModifiedVersion’s license notice. These titles must be distinct from anyother section titles.
You may add a section Entitled “Endorsements”, provided itcontains nothing but endorsements of your Modified Version byvarious parties—for example, statements of peer review or thatthe text has been approved by an organization as theauthoritative definition of a standard.
74 The Policy Implications of Tanzania’s Mortality Burden: AMMP-2 Final Report

You may add a passage of up to five words as a Front-CoverText, and a passage of up to 25 words as a Back-Cover Text, tothe end of the list of Cover Texts in the Modified Version.Only one passage of Front-Cover Text and one of Back-CoverText may be added by (or through arrangements made by) anyone entity. If the Document already includes a cover text forthe same cover, previously added by you or by arrangementmade by the same entity you are acting on behalf of, you maynot add another; but you may replace the old one, on explicitpermission from the previous publisher that added the old one.
The author(s) and publisher(s) of the Document do not by thisLicense give permission to use their names for publicity for orto assert or imply endorsement of any Modified Version.
Combining DocumentsYou may combine the Document with other documentsreleased under this License, under the terms defined in section4 above for modified versions, provided that you include in thecombination all of the Invariant Sections of all of the originaldocuments, unmodified, and list them all as Invariant Sectionsof your combined work in its license notice, and that youpreserve all their Warranty Disclaimers.
The combined work need only contain one copy of thisLicense, and multiple identical Invariant Sections may bereplaced with a single copy. If there are multiple InvariantSections with the same name but different contents, make thetitle of each such section unique by adding at the end of it, inparentheses, the name of the original author or publisher ofthat section if known, or else a unique number. Make the sameadjustment to the section titles in the list of Invariant Sectionsin the license notice of the combined work.
In the combination, you must combine any sections Entitled“History” in the various original documents, forming onesection Entitled “History”; likewise combine any sectionsEntitled “Acknowledgements”, and any sections Entitled“Dedications”. You must delete all sections Entitled“Endorsements”.
Collections of DocumentsYou may make a collection consisting of the Document andother documents released under this License, and replace theindividual copies of this License in the various documents witha single copy that is included in the collection, provided thatyou follow the rules of this License for verbatim copying ofeach of the documents in all other respects.
75Volume 3: Field Operations and Validation Studies

You may extract a single document from such a collection, anddistribute it individually under this License, provided you inserta copy of this License into the extracted document, and followthis License in all other respects regarding verbatim copying ofthat document.
Aggregation with Independent WorksA compilation of the Document or its derivatives with otherseparate and independent documents or works, in or on avolume of a storage or distribution medium, is called an“aggregate” if the copyright resulting from the compilation is notused to limit the legal rights of the compilation’s users beyondwhat the individual works permit. When the Document isincluded in an aggregate, this License does not apply to theother works in the aggregate which are not themselvesderivative works of the Document.
If the Cover Text requirement of section 3 is applicable to thesecopies of the Document, then if the Document is less than onehalf of the entire aggregate, the Document’s Cover Texts may beplaced on covers that bracket the Document within theaggregate, or the electronic equivalent of covers if the Documentis in electronic form. Otherwise they must appear on printedcovers that bracket the whole aggregate.
TranslationTranslation is considered a kind of modification, so you maydistribute translations of the Document under the terms ofsection 4. Replacing Invariant Sections with translationsrequires special permission from their copyright holders, but youmay include translations of some or all Invariant Sections inaddition to the original versions of these Invariant Sections. Youmay include a translation of this License, and all the licensenotices in the Document, and any Warranty Disclaimers,provided that you also include the original English version ofthis License and the original versions of those notices anddisclaimers. In case of a disagreement between the translationand the original version of this License or a notice or disclaimer,the original version will prevail.
If a section in the Document is Entitled “Acknowledgements”,“Dedications”, or “History”, the requirement (section 4) toPreserve its Title (section 1) will typically require changing theactual title.
TerminationYou may not copy, modify, sublicense, or distribute theDocument except as expressly provided for under this License.
76 The Policy Implications of Tanzania’s Mortality Burden: AMMP-2 Final Report
Any other attempt to copy, modify, sublicense or distribute theDocument is void, and will automatically terminate your rightsunder this License. However, parties who have received copies,or rights, from you under this License will not have theirlicenses terminated so long as such parties remain in fullcompliance.
Future Revision of this LicenseThe Free Software Foundation may publish new, revisedversions of the GNU Free Documentation License from timeto time. Such new versions will be similar in spirit to thepresent version, but may differ in detail to address newproblems or concerns. See http://www.gnu.org/copyleft/.
Each version of the License is given a distinguishing versionnumber. If the Document specifies that a particular numberedversion of this License “or any later version” applies to it, youhave the option of following the terms and conditions either ofthat specified version or of any later version that has beenpublished (not as a draft) by the Free Software Foundation. Ifthe Document does not specify a version number of thisLicense, you may choose any version ever published (not as adraft) by the Free Software Foundation.
77Volume 3: Field Operations and Validation Studies

Surveillance Package/Open Source (SPOS) is a collection of‘open source’1 data entry and analysis tools for operating thedemographic and mortality surveillance, and povertymeasurement methods developed under AMMP. This chaptercontains documentation for the components that make upSPOS. In some cases we have been able to include completedocumentation, while in others we have included summaries oflonger documents that can be found on the SPOS CDROMthat accompanies this report. The first sections of this chapterare user guides that provide instruction on how to install and usethe Poverty and Health Analysis Tool (PHAT), the Census andVerbal Autopsy Data Entry systems, and the associatedmanagement tools.
These guides are followed by a technical description of thetables in PHAT and issues that affect the interpretation of theanalysis outputs (e.g. indicator packages or graphs). Theremaining sections cover system design and modification.
All of the software used in these systems is freely available andcan be distributed without the need to purchase licences.2 Thesource code for all of the software created by AMMP isprovided freely under the terms of the GNU General PublicLicence. Copies of this licence are contained on the CDs. Thislicence ensures the freedom of anyone to use and change anypart of the software.
IntroductionPHAT is a web-based tool for analysing demographic andmortality data. In this case, the data come from sentineldemographic and mortality surveillance and povertymeasurement. The tool is designed to run on a stand alonecomputer, local area network or the internet.
The design of PHAT is based on collections of indicators intopackages. For example, the indicators in Tanzania’s PovertyMonitoring Master Plan (PMMP) for monitoring povertyalleviation include “the proportion of working age not currentlyworking”, “the proportion of orphans” and “the proportion ofchildren in labor force not going to school.” This tool provides asimple interface to produce these indicators with just a fewclicks of a mouse button.
78 The Policy Implications of Tanzania’s Mortality Burden: AMMP-2 Final Report
Surveillance Package/Open SourceSoftware and Data Set Guide
3
INTRODUCTION
POVERTY AND HEALTHANALYSIS TOOL (PHAT)
USER GUIDE

In order for PHAT to work properly, however, the desiredoutput must be clearly and carefully specified. It istherefore important to know indicator definitions andinterpretations well. To do this, start by asking: “how is myindicator defined?”• Is it a rate, proportion or ratio?• Does the indicator apply to specific age groups? • Does the indicator apply to one sex only, do you need a
break down by sex, or is sex irrelevant and therefore males and females can be combined?
If your indicator is part of a specific package required forthe monitoring and evaluation of a national program (e.g.Maternal Mortality Ratio) you can access it by goingstraight to the desired package. If you are not sure whichpackage your indicator belongs to you can display ‘AllIndicators’ and click on the indicator of interest. You willbe taken through steps with options for you to choose andthese choices will be used to retrieve data and display theresults accordingly.
PHAT has been designed to be flexible so that variationson a particular indicator can be handled without the needto reprogram the system. There are also several indicatorsin different packages which are very similar and thisflexible, generalized design allows the same indicator to beused in different packages. The only differentiating factorwill be the selections you make.
Using the Poverty and Health Analysis ToolPHAT is very simple to use. You will be guided through afew steps where you will choose:1. The time-period2. Poverty quantiles (if required)3. Area (regions, districts, villages)4. Sex5. Cause of death (where relevant)6. Type of output (tables or charts)
Main pagePHAT is a web-based application that can be accessedusing any web browser (e.g. Internet Explorer, Netscape,Opera, etc.). To access the main page, open a web browserand type the URL of the index page, for examplehttp://SERVER_NAME/PHATOn the main page you will see a quick introduction toAMMP and the navigation menu with the followingchoices: Home, Indicator Packages and Documents.
79Volume 3: Field Operations and Validation Studies

Indicator PackagesIf you click on Indicator Packages (Figure 3.2) you will seea page containing a list of available packages and an optionto display All Indicators regardless of the indicatorpackage. In each indicator package you will see a list ofindicators that are specific to the selected package.
Some of the indicators appear in similar forms in differentpackages, usually with slight variations in how they aredefined or how they are named. Within each package eachindicator is defined and named correctly for the package.Under the All Indicators page each of the indicators has ageneric name, for example Cause-specific Proportion.
The names of the packages are abbreviated in the followingway:• PHSPP = Public Health Sector Performance Profile• PMMP = Poverty Monitoring Master Plan• PHDR = Poverty and Human Development Report• TACAIDS = Tanzania Commission for HIV/AIDS• Stop TB = Stop TB• District Book = District Book • RBM = Roll Back Malaria• MDG = Millennium Development Goals
80 The Policy Implications of Tanzania’s Mortality Burden: AMMP-2 Final Report
Figure 3.1 The Poverty and Health Analysis Tool Homepage

All IndicatorsIf you choose to display All Indicators you will seeindicators grouped according to the type of calculationthey perform (Figure 3.3). There are indicators forcalculating proportions or percents, ratios, rates per 1,000or 100,000 and trends in proportions, ratios or rates foreach year between two time periods.
81Volume 3: Field Operations and Validation Studies
Figure 3.2 Indicator Package List

Input optionsAfter identifying and selecting an indicator, the next stageis to provide inputs that PHAT will use to perform theanalysis. As we mentioned in the previous section you willneed to clearly define what you would like PHAT toproduce for you. Table 3.1 is an example of how you canspecify your inputs before starting to use PHAT.
This information will make it easier for you to go throughthe steps or you can give this information to somebody elseto produce the output.
82 The Policy Implications of Tanzania’s Mortality Burden: AMMP-2 Final Report
Figure 3.3 List of All Indicators

Time period and poverty quantilesThis page lets you specify the start and end of a timeperiod for the analysis (Figure 3.4). You can select day,month and year. If you do not specify an exact date theanalysis tool will select it for you. For example if you selectstart year 1997 and 1998 end year, the system will set thestart date to be 01/01/1997 and end date to be31/12/1998.
83Volume 3: Field Operations and Validation Studies
Table 3.1 Input Options and Indicator Output Specification
Input Option Example
Time period All deaths in the year 2000
Poverty breakdown Poorest and least poor quartiles
Sex Both sexes in one table
Area Hai district and Morogoro Rural
Age groups Broad age groups (0-4, 5-14, 15-59, 60+ years)
Cause of death group Narrow cause group
Specific cause of death Acute febrile illness
Output type Table/chart
Figure 3.4 Specifying the Time Period

On this page you can also choose to analyse by povertygroup. If you want to analyse by poverty groups select thepoverty quantiles you want (terciles, quartiles or quintiles).If you do not want to breakdown by poverty group select nopoverty breakdown.
Poverty levelThis page will only appear if you have chosen to break youranalysis down by poverty quantiles and will display a list ofpoverty levels from the selected group. You can select one ormore poverty levels from the list. This page will be skippedif you do not select a poverty group (Figure 3.5).
Area selectionSelect one or more regions from the list (Figure 3.6). Onlyregions for which there are data in the system will beshown. Once you have selected the region(s) if you wishyou can further refine your selection of geographical area byselecting specific district(s) by clicking on Select District,or you can just continue.
If you decide to refine your selection you will see a list ofdistricts from the chosen region(s). Again you can refineyour selection of by selecting specific village(s). Thesmallest geographical area you can select is village.
84 The Policy Implications of Tanzania’s Mortality Burden: AMMP-2 Final Report
Figure 3.5 Selecting Poverty Quartile

Disaggregate (break down) by areaIf you select more that one area you will be given thechance to disaggregate (break down your results) by area orcombine the areas together (Figure 3.7).
85Volume 3: Field Operations and Validation Studies
Figure 3.6 Selecting a Region
Figure 3.7 Choosing whether to Disaggregate the Results by Area

SexThe next screen gives you the opportunity to select andeither aggregate or disaggregate the results by sex (Figure3.8). You will be given options for selecting males orfemales only, combine both sexes together in one table ordisaggregate sex in different tables. This screen does notappear for indicators where sex is part of the definition as,for example, with maternal mortality rates.
Age groupThe tool displays a list of age groups available and a briefdescription of each age group (Figure 3.9). If you do notwhat to specify age grouping click none and age groups willbe ignored. For age specific indicators, for example theUnder Five Mortality Rate, you will not see this pagebecause the age is already defined as part of the indicator.
86 The Policy Implications of Tanzania’s Mortality Burden: AMMP-2 Final Report
Figure 3.8 Choosing How to Combine or Disaggregate Sex

87Volume 3: Field Operations and Validation Studies
Figure 3.9 Selecting Age Groups

Cause groups and probable cause of deathCauses of death are grouped into Narrow, Intermediate andBroad cause groups (Figure 3.10). General cause of deathindicators, such as the Ten Leading Causes, require you tospecify the cause group. For cause-specific indicators youwill also specify a cause of death (Figure 3.11). Note that inthis case only one cause can be specified at a time. Forexample, if you are interested in mortality due to AcuteFebrile Illness (including malaria), you would choose the
88 The Policy Implications of Tanzania’s Mortality Burden: AMMP-2 Final Report
Figure 3.10 Selecting the Cause of Death Group
Figure 3.11 Specifying a Specific Cause of Death

89Volume 3: Field Operations and Validation Studies
“Intermediate” cause group and for the specific cause youwould select “Acute Febrile Illness.”
Output typeMany of the outputs can be produced as a set of eithertables or charts and you specify which of these you wouldlike in this final stage (Figure 3.12). Charts are not anappropriate form of output for some indicators and if theoutput can only be presented as a table the button forselecting charts will be disabled.
The last step is to press the Finish button. Please click thisbutton just once and then wait for a response. Some of theindicators require PHAT to perform calculations on largeamounts of data so some results take a minute or two toappear. If you click the Finish button again, the dataretrieval and analysis process will be restarted and you willhave to wait longer for your outputs.
Figure 3.12 The Final Input Screen—Choosing Tables or Charts

Example outputs
ChartsSome indicators are presented as vertical bar charts andothers as horizontal bar charts. For example HealthService Usage is presented using vertical bar chart, andleading causes of deaths are presented using horizontal barcharts.
90 The Policy Implications of Tanzania’s Mortality Burden: AMMP-2 Final Report
Figure 3.13 An Example of Vertical Bar Charts Produced by PHAT

91Volume 3: Field Operations and Validation Studies
Figure 3.14 An Example of Horizontal Bar Charts Produced by PHAT

TablesPHAT can also produce HTML tables as an output. Beforeeach table there is a label that tells you about the datacontained in each table.
92 The Policy Implications of Tanzania’s Mortality Burden: AMMP-2 Final Report
Figure 3.15 An Example of Tables Produced by PHAT

Tips for including outputs in a documentWe conclude this section with a few tips that will help youto include outputs from the Analysis Tool in your reportsand documents.1. If you want to get tables from PHAT into a
spreadsheet, such as Excel or OpenOffice, you can justselect the whole page, Copy, go to a spreadsheet and then Paste. This will create tables with the labels and values. If you want to use keyboard short cuts, this process is Control-A, Control-C, switch to the spreadsheet then Control-V.
2. You can copy the charts as graphics and then save them or paste them into a word processor, presentationpackage or spreadsheet.
3. You can save the page with images as an HTML file and open the file is MS Word or OpenOffice.
First selectionIn some indicators you will need to make other selectionsfirst before specifying time period, for example girls/boysratio in primary education the first selection you make iseducation level, leading causes of deaths you specify thenumber of causes you want, etc.
AMMP has collected demographic and health data for 10years. During this time many outputs have been producedand, as demonstrated in Volume 1 Chapter 4, used toinform planning at district and national levels. Theamount of data that AMMP has collected is considerableand it is inevitable that there will be useful analyses thathave not yet been produced. We therefore have made thecensus and verbal autopsy analysis tables available througha simple web-based user interface (see the PHAT manualabove). For those in Tanzania who do not have internetaccess we have also created a standalone application, an“appliance”, that turns any PC into an analysis tool withoutthe need to install any software. This has been achieved bymodifying a specialised version of the GNU/Linuxoperating system called Knoppix (www.knoppix.org). Wehave called this appliance PHAT LIVE!. To run PHATLIVE! all you need to do is put the CD into yourCDROM drive, shutdown your computer, and reboot,telling your computer to reboot from the CDROM drive(instead of the hard drive). When the computer boots fromthe PHAT LIVE! CD you will be brought to a browser atthe homepage of the PHAT analysis tool, described above,from which you can easily perform a variety of analyses.
93Volume 3: Field Operations and Validation Studies
PHAT LIVE! USER GUIDE

Once you have your results, either as charts or tables, youcan print them or save them to your hard drive or to afloppy disk. Please note that when you are using PHATLIVE! you are not using Windows so you cannot run Wordor Excel. When you have finished your analyses you canshutdown your computer, take out the CD and restart yourcomputer as usual.
Note that PHAT LIVE! does not install any programs onyour hard drive. In fact, you can even use it on computerswithout a hard drive.
With some older computers it can be difficult to start froma CD. If you cannot convince your computer to start fromthe CD, open the CD in a file manager. You will see abutton to push that will create a “boot floppy” which youcan use to start the system. PHAT LIVE! should run onany computer with at least 64Mb of memory, preferably120Mb of memory, and a 300 MHz processor.
The Verbal Autopsy Data Entry System Installation andUser Guide is provided in full on the CDROM. It providesa step-by-step guide to the installation of the verbal autopsydata entry system including the MySQL database serverthat is used to store the data and the Java software forrunning the data entry interface. The installation process ishandled by an installer program and in most cases shouldonly involve making a series of simple selections with theclick of a button.
Both single-user and network installation scenarios arecovered. If MySQL and/or Java are already installed, forexample if the Census data entry system or Analysis toolhave been installed, then the installation of the VerbalAutopsy data entry system is very simple indeed. Screenshots of each step provide reassurance that the installationprocess is proceeding correctly.
The next part of this guide describes how to enter data oncethe system has been installed, covering starting the system,selecting the form to be entered and how to enter data.
This document is also on the CDROM and contains astep-by-step guide to the installation of the softwarerequired to run the census data entry system and the use ofthe census system once installation has been completed.The topics covered include hardware requirements,
94 The Policy Implications of Tanzania’s Mortality Burden: AMMP-2 Final Report
VERBAL AUTOPSY DATAENTRY SYSTEM
INSTALLATION AND USERGUIDE

installation scenarios, and how to initialise the system forthe establishment of a new surveillance site.
The user guide describes the three main panels of thesystem used for navigation and data entry, includingshortcut keys that facilitate rapid data entry.
Administrative tasks such as printing census forms forupdate rounds and adding new field workers through theinterface are also described.
There a several management tools covering the Census,Verbal Autopsy and Analysis systems that are used by theData Manager. These include: a tool that produces lists ofverbal autopsies for coding; a tool that processes cause ofdeath codes to produce final probable causes of death fromthe Verbal Autopsy system; and a tool to create theanalysis_va table for the Analysis Tool. Detailedinformation on how to use these and other tools can befound in the more extensive User Guide on the CDROM.
The tables in the Census and Verbal Autopsy data entrysystems are described in the system design documents foreach of the systems. The data in these tables are processedto produce the small set of manageable analysis tables thatform the Analysis Tool. Identifiers, such as name, areremoved from the analysis tables.
Most users of the analysis tool will be able to produce andinterpret outputs without needing to read this section.Other users will want to know details regarding how thedata were collected and processed, and the implications ofthe assumptions made in the design of the analysis tables.This section aims to provide that information.
Tables in the Analysis ToolThe tables in the Analysis Tool are the product ofprocessing the data from the Verbal Autopsy and Censusdata entry systems. Some of these are static tables ofreference values, while others are updated on a periodicbasis, for example after batches of Verbal Autopsy orcensus data entry. Table 3.2 contains a list and explanationof tables found in the Analysis tool:
The next sections discuss issues related to theinterpretation of data from the main tables.
95Volume 3: Field Operations and Validation Studies
CENSUS DATA ENTRY SYSTEMINSTALLATION AND USER GUIDE
MANAGEMENT TOOLSUSER GUIDE
ANALYSIS TOOL (PHAT) DATA SET GUIDE

ResidentsThe residents table is the main table generated from thecensus data entry system. Each row represents a singleindividual who was resident on a particular date. Thecharacteristics of each individual include age (in years), sex,location information, marital status, education, andoccupation. All fields are listed in the PHAT DesignDocument. There are currently over 3 million records inthis table, each record representing a single person-year inthe National Sentinel System. As each record representsone individual during one year there are multiple recordsfor individuals who are resident for more than one year.
There are certain issues that result from the field operationsand the way questions are asked during update rounds. Thefield methods are given in more detail in Chapter 1 of thisVolume. Briefly each household is visited periodically,usually after every 6 or 12 months. During these visits, thecurrent status of each individual is updated. This meansthat for most data items there is a date on which an event,for example a marriage, takes place and a date on whichthat information is collected. In all cases, except for births,deaths, and migrations into and out of the household thedate on which the event took place is not recorded andtherefore not known to the system. This means that inpractice many data items are collected in a cross-sectionalmanner.
Census rounds take place at different times of the year ineach of the areas and usually take around 2 months tocomplete-therefore few households are visited on the same
96 The Policy Implications of Tanzania’s Mortality Burden: AMMP-2 Final Report
Table 3.2 Tables in Poverty and Health Analysis Tool
Table name Description Type
age_groups A table of age groups. Each row is one level in an agegroup.
Static, reference
analysis_va The main table of information from the Verbal Autopsydata entry system. Each row represents one death.
Updated periodically
births A table of births from the census system. Each rowcontains the count of births in each combination ofyear, sex, village, and place of birth.
Updated periodically
causes Each row in this table is one cause of death that canbe selected by coders. Each column is a cause ofdeath group.
Static, reference
occupationList A list of occupations. Static, reference
residents The main table from the census system. Each rowrepresents an individual resident in a particular year.
Updated periodically
yll A table of Years of Life Lost (YLLs) for each age andsex group.
Static, reference

day. We must therefore choose a date that can beconsidered to represent a sentinel site during a particularyear. We have selected a date that is as close as possible tothe date on which the data were collected. The rationalefor this is that this minimizes the time between datacollection and the date that the data are supposed torepresent. One consequence of this is that the date for eachsite and each year might differ. The date itself is recordedin the field denom_date in the residents table. Forexample, the representative date for Dar es Salaam in 1995was the 3rd of October 1995 (just before the census fieldwork began, with values on this date determined from datacollected during the mid-October to mid-Decembercensus) and the date for Hai in 2000 was the 3rd of June2000 (again, just before the field work began).
Issues Relating to Specific FieldsThe occupation field contains information on the currentoccupation of each individual. AMMP collectedinformation from 2001 onwards regarding both the mainsource of income of each individual and the main use oftime (as these may differ). The occupation field in theresidents table is based on the main source of income,except in cases such as children who are at school. Themain employment categories in the analysis tool are:employed in the agricultural sector, wage employment innon-agricultural sector, and unemployed. Information onoccupation is not available for years before 2001.
Orphans are encoded using a two-character code in whichthe first character refers to the father and the second to themother. The codes are A=alive, D=dead. Orphans whohave lost both parents therefore have the code “DD” andchildren who have lost neither parent are coded “AA.”
BirthsThe structure of the births table is different to that of theresidents table. Each record in the births table represents acombination of village, sex, year and conditions of birth.For each combination the number of births in the group isrecorded. Therefore to determine the number of births ina year, regardless of village, sex and conditions of birth onemust sum the number_of_births column.
The AMMP system records births as a mode of entry intoa household. This means that children who are born andthen die soon after birth (neonatal deaths) should, intheory, be recorded as having been resident (for a veryshort period of time). Stillbirths are not recorded in the
97Volume 3: Field Operations and Validation Studies

AMMP census system, but they are recorded in the VerbalAutopsy system.
For most years and areas birth conditions were recorded as“at home” or “at a health facility.” In Dar es Salaam thisdistinction was introduced slightly later, in 1995. From2001 further detail was collected to determine if, and bywhom, births at home were assisted. The categories usedare: “Health Worker”, “Trained Traditional BirthAttendant” or “Untrained Traditional Birth Attendant.”Unfortunately, for Hai, this information is available for2001 only.
analysis_vaEach record in this table represents the death of anindividual from one of the surveillance areas. Fields includeage in years, age in days (for the analysis of neonataldeaths), sex, location information, probable cause of death,and use of health services.
The death reporting system involves interviewers visitinghouseholds, often at remote locations. Occasionally theinterviewer establishes that the deceased was either notresident in, or only recently returned to, the area. Theinterviewer records the residential status of the deceased aseither “resident”, “home-coming sick” or “body broughthome for burial.” All Verbal Autopsy records are present inthe analysis_va table. For analyses performed by theAnalysis tool, however, we have chosen to include thosewho were resident or home-coming sick and exclude thosewho were resident elsewhere and brought home for burial.
Poverty analysis of Verbal Autopsy data takes place at anecological level. Each village is assigned a poverty quantileand all deaths in that village are given the same povertyquantile value. Details regarding the assignment of povertyquantiles can be found in Volume 1, Chapter 7. In theanalysis_va table poverty terciles, quartiles and quintiles arestored in the fields pov3, pov4, pov5 respectively. Pleasenote that these quantiles are determined within eachsentinel site: deaths from the first quartile in Dar es Salaamshould not, for example, be combined with deaths the firstquartile from Morogoro.
Health service use information is condensed togovernment, private, traditional, self-treatment, and “noservice” and is recorded as “yes” or “no” for each type ofservice. It is very common for people to use multiple typesof service in the period before death. The period before
98 The Policy Implications of Tanzania’s Mortality Burden: AMMP-2 Final Report

death is not rigidly defined in terms of weeks or months.To ensure that health services for chronic illnesses, such ascancer or HIV/AIDS/TB, are also captured, even if theywere not used immediately before death, the respondent isencouraged to recall health services used in the periodduring which he or she is aware that the deceased was ill.
This document can be found on the CDROM anddescribes the design of the Verbal Autopsy data entrysystem, including the hardware requirements andsupporting software required. Detail is provided on datacommunications and an architectural diagram describesthe overall structure of the system. Complete tablestructures list every variable in the system. The final part ofthe document outlines the modules of the system andincludes a series of class diagrams that demonstrate theinter-relationships of the Java classes.
This document (and the following) are highly technicaldocuments of use to system designers and programmersand can be found on the CDROM. The first was writtento define the requirements of the census data entry systemand provides an overview of the key modules that wereconsidered necessary for the system. The actualimplementation followed this definition closely, althoughnot exactly.
This second requirement document, also on the CDROM,specifies in more detail exactly how the system was tooperate. In particular it contains many “use cases” thatdemonstrate what is expected to happen and theconditions required to satisfy these expectations.
The Census Data Entry System Design Documentdescribes the high-level design of the census data entrysystem covering the system managers for configuration,context, data, persistence, and validation. The system isbased on the concept of generic units that fit together in ahierarchical manner, as described in the section about theData Model. The final part of the design documentdescribes the table structures. As with the other largertechnical documents this can be found on the CDROM.
99Volume 3: Field Operations and Validation Studies
VERBAL AUTOPSY DATA ENTRY SYSTEMDESIGN DOCUMENT
CENSUS DATA ENTRY SYSTEMREQUIREMENTDEFINITION
CENSUS DATA ENTRY SYSTEMREQUIREMENTSPECIFICATION
CENSUS DATA ENTRY SYSTEM DESIGN DOCUMENT

The Analysis Tool is designed to run on a stand alonecomputer, local area network or the internet and is based oncollections of indicators into packages. This documentprovides the design specification for the Analysis Tool(PHAT). The introduction describes the background,document overview and skills required to support the tool.The architectural design section outlines the structure ofthe system and directory structure. The same section alsolists the Java Server Pages and Servlet files and theirfunctions. Finally the section about the Data Modeldescribes the structure of each table.
The Census and Verbal Autopsy Data Entry systems havebeen designed to be easy to adapt to other languages. Alllabels on the screen and on the printed census update formsare controlled by a properties file. All you need to do tochange the language of the system is create a properties filefor your language. The easiest way to explain how to do thisis to show an example. Below we show the first few linesfrom nss_census.properties, the properties file for thecensus data entry system. Any line that begins with a hash(#) symbol is a comment and is ignored by the program.The properties file consists of variable=label pairs, wherethe variable is used internally by the software and the labelis what is seen on the screen or form. These are entered asvariable=label with no quotes. Here are some examples ofvariable=label pairs that control what system messagesappear:
# Properties file for NSS_CENSUS Data Management System
# Title for the main windowmain.window.title=National Sentinel Surveillance(NSS)system: Census Module
# Greeting to the user on sign on splashwindow welcome.user=Welcome to the NSSCensus module choose.your.role=Pleaseenter your name (role)want.to.delete=Are you sure you want to delete?
These indicate that the title of the main window will be:“National Sentinel Surveillance (NSS) system: CensusModule” and if the user presses the Delete button a windowwill popup and ask the user “Are you sure you want todelete?”Here are some more examples:
# Level denominationscountry=Countryregion=Region
100 The Policy Implications of Tanzania’s Mortality Burden: AMMP-2 Final Report
PHAT DESIGN DOCUMENT
CUSTOMISING THELANGUAGE OF SPOS

district=Districtward=Wardvillage=Villagesubvillage=Hamlet
These determine what labels will appear on the data entryscreen in the panel that displays the household locationinformation. If we wanted to translate the system toSwahili, for example, we would use these instead:
# Level denominationscountry=Nchiregion=Mkoadistrict=Wilayaward=Katavillage=Kijijisubvillage=Kitongoji
There are separate variable=label pairs for the printedcensus update forms, such as:
# Census update formsprint.country.name=Countryprint.region.name=Regionprint.district.code=Districtprint.ward.name=Wardprint.village.name=Village
The easiest way to translate the entire data entry system isto start with an existing properties file, copy it (use a newfile name) and then change all of the labels to the languagerequired. Once you have a complete file, you rename itaccording to the following scheme: use the first part of theproperties file name, followed by an underscore character,and then the international standard language identifier asdefined by ISO 639. Lists of these can be found on theinternet, for example at http://www.w3.org/WAI/ER/IG/ert/iso639.htm.The code for Swahili is sw, so the swahili properties file iscalled nss_census_sw.properties, for French it is fr, so thefile would be called nss_census_fr.properties, and the codefor Old Persian (ca 600 - 400 B.C.) is peo, and theproperties file would be nss_census_peo.properties.
Once the properties file has been setup the language can beselected by changing nss_start.bat, as described in theCensus User Manual, by specifying the language code afterthe Java application name, for example:java -cp ../lib/classes;../lib/mm.mysql-2.0.14-bin.jar;../lib/saxon.jar;../lib/fop.jar org.nss.census.Main sw
101Volume 3: Field Operations and Validation Studies

There is one properties file for the Census Data Entrysystem and that can be found in the directory:NSS_CENSUS/bin/resources/nss_census.properties
There are several properties files in the Verbal AutopsyData Entry system and these are found in the directory:NSS_VA/classes
The English versions of the files are:MessageLabels_en.propertiesOtherLabels_en.propertiesPersonalQuestions_en.propertiesQuestionLabels_en.propertiesQuestionLabels_form2_en.propertiesQuestionLabels_form3_en.properties
1The definition of Open Source can be found here:http://www.opensource.org/docs/definition.php
2 This does not mean that there is no licence-they are licenced under the
GNU General Public Licence. See www.gnu.org for details.
102 The Policy Implications of Tanzania’s Mortality Burden: AMMP-2 Final Report
NOTES
Part 2Modelling, Validation and Cross-Comparison of Tools

Sentinel demographic surveillance combined with verbalautopsy (VA) has been proposed as a means of providinginformation for planning, monitoring, and evaluation insituations where vital registration systems are weak, ineffectiveor absent [1]. The aim of this document is to explore anapproach to estimate the optimum size of sentinel surveillancesites.
The modelling exercise undertaken in this chapter assumes thata sentinel site should be able to provide robust estimates of thefive leading causes of mortality within one year, and the tenleading causes within two years of commencing surveillanceactivities. In this document an estimate of the five or ten leadingcauses is considered to be robust when its 95 percent confidenceintervals are within a specified range. Here, this range isspecified in terms of a percentage and for the purposes of thisdocument is called the tolerance. So, for example, a tolerance of20 percent means that an estimate for which the upperconfidence interval is no more than 20 percent larger than theactual proportion is robust.Thus, if the proportion of deaths dueto cause X is 5 percent, and set out tolerance at 20 percent, wewill accept a sentinel population size that gives a proportion offive percent of mortality due to cause X with a 95 percentconfidence interval range of four percent to six percent.
The confidence interval is calculated based on the proportion ofdeaths due to cause X and the total number of deaths in thesentinel population. The total number of deaths is determinedby the underlying mortality rate. In this version of the model theunderlying mortality rate is assumed to be 10 per 1,000.
As we are interested in accurately ascertaining the correct fiveleading causes of mortality for the first year of surveillance, weonly need to perform these calculations for least common cause;causes that are ranked higher will have larger proportions andtherefore tighter confidence intervals.
The proportion of deaths due to each cause in each year for theperiod 1994 to 2002 and each AMMP surveillance site wascalculated. Deaths for which no cause could be determined wereexcluded from the analysis. For each combination of area and
104 The Policy Implications of Tanzania’s Mortality Burden: AMMP-2 Final Report
Estimating the Optimum Size for SentinelMortality Surveillance Sites
4
INTRODUCTION
METHODS

year, the proportions were ranked in descending order. Theproportion of deaths due to the fifth most common cause wastaken as the reference, and the minimum number of totaldeaths required to produce a confidence interval range that waswithin the specified tolerance was calculated. In the first part ofthis analysis a tolerance of 30 percent was used. From this wecan interpolate the necessary size of sentinel or samplemortality surveillance sites to obtain stable estimates of thecause of death structure in a population under varyingassumptions of total mortality rates.
In the second part of this analysis the effect of using differenttolerances was tested.
Figure 4.1 shows the distribution of population sizes requiredto produce robust estimates of the five leading causes assuminga confidence interval tolerance of 30 percent. At this tolerance,the mean population size required was 69,580 and the medianwas 70,390 (interquartile range: 57,440 to 80,200).The mean of the proportion of deaths due to the fifth mostcommon cause was 6 percent.
105Volume 3: Field Operations and Validation Studies
RESULTS
Figure 4.1 Population sizes required for the 5 leading causes

Our model used the following assumptions:• A definition of robustness as falling with the 95 percent
confidence interval for a given tolerance level around a truecause-specific mortality proportion;
• An arbitrary tolerance of 30 percent for the true proportion;• A requirement of reproducing a robust estimate of the five
leading causes of death based on the assumptions above;• A reference proportion for the fifth most common cause of
death;• A total mortality rate for extrapolating the necessary
sentinel site size.
These parameters were chosen because they reflect the data thedata needs of a sentinel mortality surveillance system, and reflectthe mortality measurements in Tanzania over eight years ofsurveillance. The fifth most common cause of death accountedfor 3.9 percent to 8.2 percent of deaths in each year and AMMPsite (mean 6 percent, median 5.7 percent). Thus, our toleranceof 30 percent meant estimates ranging from 4.2 percent to 7.8
106 The Policy Implications of Tanzania’s Mortality Burden: AMMP-2 Final Report
0.2 0.4 0.6 0.8
0
100
200
300
400
500
600
Tolerance
Mea
n re
quire
d po
pula
tion
size
(th
ousa
nds)
Figure 4.2 Effect of different tolerances on mean requiredpopulation size
DISCUSSION,SENSITIVITY ANALYSIS AND
CONCLUSIONS

percent of deaths due to this cause would be considered robust.Figure 4.2 and Table 4.1 show that as the tolerance drops below0.4 (40 percent) the mean population size required rapidlyincreases. In the current example, the mean proportion was 6percent. With a tolerance of 40 percent the confidence intervalrange would be 3.6 percent to 8.4 percent and would require apopulation size of 39,141 people. Decreasing the tolerance to20 percent would result in a confidence interval range of 4.8percent to 7.2 percent and would require a population size ofaround 156,564 people.
Table 4.1 Mean population sizes required for various tolerance values
Sentinel demographic surveillance systems involve costs thatdo not scale in a linear manner, with efficiencies of scale beingpossible up to a certain point. The data presented here showthat increases in population size over 100,000 are likely to resultin diminishing returns in improved accuracy (when judged bythe criterion of producing robust estimates of the five leadingcauses). It would also appear that in mortality regimesresembling those of Tanzanian, reasonable estimates of the fiveleading causes can obtained with populations as low as 40,000people under surveillance.
107Volume 3: Field Operations and Validation Studies
Tolerance Mean Population Size
0.10 626,257
0.12 434,901
0.14 319,519
0.16 244,631
0.18 193,289
0.20 156,564
0.22 129,392
0.24 108,725
0.26 92,641
0.28 79,879
0.30 69,584
0.40 39,141
0.50 25,050
0.60 17,396
0.70 12,780
0.80 9,785
0.90 7,731

1. Setel, P., Sankoh, O., Mathers, C., et al. Improving Systems for Monitoring and Measurement of Vital Events. An issues paper prepared for the Health Metrics Task Force Meeting, World Health Organization, Glion, Switzerland, November 2003.2003, World Health Organization, Evidence and Information for Policy: Geneva.
108 The Policy Implications of Tanzania’s Mortality Burden: AMMP-2 Final Report
REFERENCES


Attacking poverty and its connections with health anddevelopment has become a major global priority [1, 2]. High-profile programs such as the Highly Indebted PoorCountries/Poverty Reduction Strategy Paper (HIPC/PRSP)initiative of multilateral debt forgiveness and the MillenniumDevelopment Goals require the development of nationalpoverty reduction strategies that can be evaluated, as well asquantifiable indicators for measuring progress against thosegoals. It has become increasingly apparent that targets expressedsimply as national averages are probably inadequate to ensurethat the poorest citizens of poor countries benefit from povertyreduction measures [3]. Unless specific safeguards are taken totarget and track conditions among the poorest of the poor, it ispossible that countries may achieve their targets withoutsignificantly improving conditions among this group. In orderto assess whether the needs of the poorest of the poor are beingmet, a sound method for identifying them is required.
The need for poverty monitoring and impact data could not begreater. Yet there is still a great deal of debate and explorationabout best practice with respect to rapid, reliable, validated, andfeasible tools to measure poverty and health equity indeveloping countries [4-7].
Here we describe the production and validation of the rapidconsumption expenditure proxy (CEP) tool for measuringincome poverty at the household level. We also compare theperformance of the CEP to other current approaches used innational and large-sample poverty and health studies, namely toan asset index developed using the types of variables commonlyfound in Demographic and Health Surveys and recommendedin World Bank publications [8].
The work was undertaken through the Adult Morbidity andMortality Project, Phase 2 (AMMP-2). AMMP is a project ofthe Tanzanian Ministry of Health and district/municipalcouncils, funded by the U.K. Department for InternationalDevelopment (DFID) and implemented in partnership with
110 The Policy Implications of Tanzania’s Mortality Burden: AMMP-2 Final Report
Development, Validation, and Performance ofa Rapid Consumption Expenditure Proxy forMeasuring Income Poverty in AMMP/NationalSentinel Surveillance System Areas
5
INTRODUCTION

the University of Newcastle upon Tyne. One of AMMP’s mainactivities is to support the Ministry of Health and local councilsto operate several demographic surveillance sites (DSS). In ourcontext DSS consists of: (a) annual updates of all demographicevents (including poverty status of newly establishedhouseholds); (b) continuous cause-specific mortalitymonitoring; and (c) the periodic implementation of system-wide and sub-sample morbidity, risk factor, or other ad hocsurveys (e.g., for program impact evaluation).
The demographic and mortality surveillance methodsdeveloped under the project and the five DSS sites supportedby AMMP form the basis of the project’s other main activity,which is aiding the Ministry of Health to link AMMP andnon-AMMP DSS sites into a National Sentinel SurveillanceSystem for health and poverty monitoring. One of the chiefaims of the NSS is to use these sites to provide accuratecommunity-based evidence about the major causes of ill healthand death among the poorest members of Tanzanian societyand to contribute to equitable development in the country [9].
In Tanzania, NSS/AMMP data are used to generate a largenumber of routine indicators for the Health SectorPerformance Profile, the annual Health Statistics Abstract andthe National Poverty Monitoring Master Plan for assessing theprogress of the Poverty Reduction Strategy [10, 11]. With theaddition of the income poverty data from the poverty proxytool, these indicators can be produced in a way that allows acomparison of outcomes and trends for the poorest and leastpoor members of Tanzanian society.
To date, most calls for ensuring an equity perspective innational monitoring and evaluation efforts in Tanzania havefocussed on research questions and not on the development ofequity measures as part of routine monitoring and evaluationsystems [12]. In order to fill this need, publications and reportshave been produced on trends in maternal and AIDS/TBmortality [13, 14], equity analyses of trends in AIDS/TB andacute febrile illness/malaria mortality [15, 16], nationalmortality burden estimates [17], poverty monitoring masterplan indicators (Volume 1, Chapter 7 of this report), andTanzania’s burden of disease from an equity perspective(Volume 1, Chapters 8 and 9 of this report). Most of these havebeen structured around indicators that will be routinelyupdated by the NSS.
It is hoped that the approach taken in Tanzania may be of useto those engaged in the development of similar measurement
111Volume 3: Field Operations and Validation Studies

tools for other developing countries. In particular, it may be ofuse for those who seek to use DSS sites (or some other type ofsample registration scheme or large sample surveys as a platformfor generating data on poverty and equity. The rapid povertymeasurement tool described here can also be used as an add-onto smaller research projects or monitoring activities with apredominantly qualitative or participatory approach. In this wayqualitative/participatory and quantitative information gatheringstrategies can be used to gain a better understanding of thecontextual issues so central to the success or failure of socialprograms.
It also should be noted that replicating the methods describedhere requires a recent household budget, living standardsmeasurement survey, or similar large-sample household surveywith a measure of consumption expenditure as an output. Evenif this is lacking, some of the principles of the developmentprocess we used may still be useful. The full text of theconsultant reports by Antoninis et al. and Abeyasekera et al.describing these methods [18-20] can be found on the projectwebsite at http://www.ncl.ac.uk/ammp.
Defining an ApproachAs anyone who has braved the waters of poverty measurementis aware, they run fast and deep. Theoretical constructs aboundand proliferate, as do methods for their measurement [21]. Thefirst task then, was to decide how to determine the most suitableapproach for integration into the DSS work. We first consideredthe general context of information need and then identified thepoverty construct best suited to it. We then reviewed theliterature on options for measuring that construct, and lastlyconsidered any overriding practical constraints to measuring thedesired poverty construct in a technically ideal manner. Theseconstraints included considerations such as ease ofimplementation and integration into the DSS operations,resource needs, and existing in-country experience. Our criteriafor selecting an approach can be summed up as follows:• Data capable of being analysed from an equity perspective;• Data sets comparable to other national sources;• Indicators useful to those outside the health sector; and• Methods draw upon the experience of experts in income
poverty measurement and do not divert the project fromprimary health-oriented objectives.
The Context of Information NeedAMMP is rooted in the Health Sector and in health sectorreform. Three core principals of health reform in Tanzania towhich AMMP and the NSS contribute are:
112 The Policy Implications of Tanzania’s Mortality Burden: AMMP-2 Final Report

• Supporting evidence-based policy and planning at thedistrict and national levels;
• Supporting the decentralisation process in which districtsare primarily responsible for delivering care and forplanning, and the central ministry is responsible for steering policy and setting guidelines for practice; and
• Improving health system accountability to locally servedpopulations and enhancing equity and service to the poorest and most vulnerable members of society.
Health reform, however, is itself embedded in wider programsof national reform and in multi-sectoral initiatives. Forexample, at the district level health reform is subsumed withina country-wide process of government reform based ondevolution to local council authority that has been underwaysince the mid 1990s. Local government reform is being steeredby the President’s Office. More recently, the country hascommitted itself to meeting and monitoring progress towardtargets set in the Poverty Reduction Strategy Paper and PovertyMonitoring Master Plans [10, 22]. The PRSP process and themonitoring and evaluation effort are located in the VicePresident’s Office. In addition, Tanzania’s renewedcommitment to fight the AIDS epidemic was made in 2000with the establishment of the Tanzanian AIDS Commission inthe Prime Minister’s Office.
All of these national reforms and initiatives, based as they are athigh levels of Ministerial, Presidential, Vice-Presidential, andPrime-Ministerial office, each have their own urgent needs forpoverty, demographic, and health data. The most cogentstatement about how all these needs are to be met in a resource-poor setting like Tanzania comes from the Poverty MonitoringMaster Plan. It states that ‘Tanzania is moving towards a co-ordinated national-level approach to data and informationcollection, analysis, and dissemination ... [and] ... away fromsingle-purpose information generation toward a multi-purposeand interlinked approach at the national level’ (p 3). The toolwe have developed, then, attempts to contribute to this aim.
A Suitable Poverty ConstructThe PRSP also contains the most explicit definitions of what ismeant by ‘poverty’ and who are ‘the poor.’ Other programs aremuch less clear. The two constructs most germane to thepoverty reduction spelled out in the PRSP are income and non-income poverty [23].The former is defined principally in termsof the international poverty line of those who live on one U.S.dollar per day, while the latter is defined as the degree of accessto social and community services like schools and a safe water
113Volume 3: Field Operations and Validation Studies

supply.The domain of non-income poverty is represented by theconstruct of social capital, defined as the ‘range of formal andinformal organisations, groups and networks which [people]take part in for the greater good of everybody’ (p 6).
The first decision the project made, then, was to focus on themeasurement of income poverty. Even though there has been agreat deal of recent literature on the measurement of socialcapital [24], and the development of a reliable and validatedmeasure of it could enhance monitoring and evaluation work,fundamental theoretical issues about its use and interpretation,particularly in the health context, remain unresolved [25, 26].Therefore, measurement of non-income poverty, as importantas it is, was temporarily put aside.
For reasons described below, the construct of ‘householdconsumption expenditure per adult equivalent’ was selected asthe most desirable to measure. This variable may be the mostappropriate measure of long-term income for developingcountries, particularly for the types of demographic applicationsthat are at the heart of AMMP and the National SentinelSystem [5, 27].
Selection of Method and Practical ConstraintsConsumption expenditure is one of the principle outcomevariables in national household budget (or similar) surveys andis often used in the calculation of national poverty lines andindicators [28]. Such surveys, however, are large and expensiveundertakings in and of themselves. It would not have beenpractical to consider replicating them within the context of atechnically simple DSS administered primarily by district-levelhealth staff, particularly if measures were wanted from everyhousehold.
Therefore, we elected to pursue the general approach of a rapidvalidated measure of socioeconomic status proposed by Morriset al. [4]. We also developed collaborative links with theNational Bureau of Statistics and their technical advisors whoworked on the National Household Budget Survey. Theultimate aim was a tool to derive a validated consumptionexpenditure proxy measure, or what we have termed a ‘CEP’tool.
MethodsDevelopment of the CEP tool for measuring income poverty atthe household level in AMMP project areas was carried out intwo phases. First came initial model development usingpreliminary household budget survey data, fieldwork, and datacollection using the preliminary models. Second, we undertook
114 The Policy Implications of Tanzania’s Mortality Burden: AMMP-2 Final Report

validation of the CEP model using variables collected byAMMP and the complete household budget survey data set.The second phase also included a process of CEP modelminimisation (i.e., elimination of variables found not toimprove the estimates of consumption expenditure), and testsof the performance of the final model. This reliability testingincluded measures of how well the final model predicted truehousehold consumption expenditure, how accurately itallocated households to poverty terciles and quintiles, and howwell it predicted the status and proportions of poor and non-poor households vis a vis the basic needs poverty line.
As mentioned, the approach we have taken requires access todata from a recent national household budget survey (HBS) orliving standards measurement-type survey, and preferably todata from sampling clusters in or near the geographic locationof the DSS site or sites for which the proxy is to be developed.In addition, the input of a qualified statistician is required toreplicate the approach described here. This input is needed toproduce and test the CEP models with appropriate adaptationsto local conditions and data sources. Once the CEP data havebeen collected in the field, estimates of household consumptionexpenditure can be derived.
AMMP Demographic Surveillance System SitesThe urban and rural DSS sites operated under AMMP since1992 and the methods employed carrying out the surveillancework have been described in detail elsewhere [29-31]. Thesesites are located in the Temeke and Ilala Municipalities in Dares Salaam Region (14,000 households), Hai District inKilimanjaro Region (31,000 households), and MorogoroDistrict in Morogoro Region (29,000 households). They wereoriginally selected because they were geographically dispersedand, according to data available at the time, thought torepresent a range of urban and rural living standards. In 2002-2003, the Ministry of Health established two additional sites inIgunga (Tabora Region) and Kigoma Urban/Ujiji (KigomaRegion) using AMMP DSS methods and a variant of theAMMP poverty proxy tool. For the purposes of the presentdiscussion, it is important to note that the collection of povertyproxy data is incorporated into routine census update rounds asdescribed in the references cited.
Preliminary CEP Model Development and Data CollectionSeparate CEP models were developed for the two rural DSSsites and for the urban DSS site by Antoninis using apreliminary data set of the HBS made available through thecollaboration with the National Bureau of Statistics [18, 19].For the rural areas, Antoninis was provided with the first
115Volume 3: Field Operations and Validation Studies

available data of the 2000-2001 HBS collected from May toAugust 2000. The sample size of 1,308 households was a smallfraction of the 22,000 households that were eventuallycontacted during the course of a twelve-month period.However, these were the only data available at the time AMMPrequired work to begin on the development of the povertymeasurement tool. For the urban model, data on only 280households collected between May and July 2000 were available.
Potential questions and variables to be included in the CEPwere drawn from the entire range of data collected on the HBS.In addition, we considered the intrinsic importance of certainvariables to health (e.g., a household’s water source) and thelocal importance of various commodities or assets to wealthstatus in the different sentinel areas (e.g., ownership of livestocksuch as cattle).
The preliminary CEP models contained approximately 50items each, most of which required single-response or yes/noresponse categories. In the 2000 AMMP census update roundsfor the three sentinel areas existing at the time, data werecollected from 13,223 households in the urban NSS/AMMPDSS area and 59,755 households in the two rural sites. After themodel minimisation process using the full HBS data set(discussed below), these data were used to generate the mainoutcome of interest: an estimate of monthly householdconsumption expenditure per adult equivalent. The minimisedmodels were then slightly modified in light of a national proxymodel development effort [32] and used in 2002 to collect datafrom approximately 37,000 households in two additional DSSsites, one urban and one rural.
Analytical Method for CEP Model Finalisation and ValidationThe objective of the second phase of work was to take the largerpreliminary models and further reduce them to the set ofvariables that best predicted consumption expenditure. At thispoint it should be mentioned that for analytical reasons theCEP models actually produced estimates of the logarithm ofconsumption expenditure that were then transformed back intoa monetary value in Tanzanian Shillings (TSh). For the sake ofsimplicity we will refer to this measurement as ‘consumptionexpenditure’ or ‘expenditure.’ The final minimal models weredeveloped using the full set of data available from the HBS,although analysis was restricted to proxy variables that werecollected for the AMMP households.
Selection of explanatory variables for inclusion in the model wasthe first step in the final CEP model development. A variety of
116 The Policy Implications of Tanzania’s Mortality Burden: AMMP-2 Final Report

considerations were taken into account in doing so. Theseincluded statistical (e.g., discriminatory power), non-statistical(e.g., intrinsic importance), and pragmatic (e.g., ease andreliability of repeated measurement) criteria. In terms ofstatistical selection criteria, the preliminary models reliedheavily on the ‘coefficient of determination’ (R2). Thismeasures the proportion of variation in expenditure that isexplained by the set of predictor variables. In other words, itindicates how well the variation in expenditure is accounted forby candidate predictor variables for inclusion in the model.Thecandidate predictors included variables such as housingmaterials, consumption of meat in the last week, andexpenditures on fertiliser.
Analysis was performed on the HBS data for each of theregions where sentinel sites were located. To start with, all thevariables from the preliminary AMMP CEP models wereincluded from the data on the HBS households. The candidatevariables were then dropped one-by-one from the CEPregression model to see if their exclusion had a significant effecton the final prediction of expenditure. If removing a variablesubstantially changed the expenditure estimate, that variablewas left in the final CEP model.
Before the CEP model was used for predictive purposes,additional analytical steps had to be taken to validate it. Thefirst step in the validation process involved looking atdifferences between the actual values (from the HBS data set)and predicted values (i.e., the output of the CEP model).Plotting actual values against predictions gives an assessment ofhow well the model can be used for predictive purposes. Inorder to do this we used a set of observations from the HBSthat were held out of the model building process. It isimportant to use a new set of observations because applying theCEP model to the same set of observations that generated itwill, of course, be expected to give better results than if the CEPwere applied to the ‘hold-back’ sample mentioned above. Wethen reversed this process, using the original hold-back sampleto determine the final CEP model and validating it on theoriginal data.
Another useful method that provides a comparison betweenalternative models involves fitting the selected model N times(N = number of households in the data set) with N-1 cases,each time omitting one household in turn and predicting itsexpenditure from the model fitted without its inclusion. Thesquared differences in predicted and observed expenditure forall of the individual households are then summed to assessmodel performance.
117Volume 3: Field Operations and Validation Studies

Model ResultsThe AMMP data were available for the sentinel surveillancesites in Temeke/Ilala (Dar es Salaam) and in Hai andMorogoro districts. These are located in the Dar es Salaam,Kilimanjaro and Morogoro regions, respectively.Therefore, datafrom the HBS for these three regions were separately modelledusing the logarithm of consumption expenditure as the responsevariable and the proxy variables identified in the previous phaseof work as potential explanatory variables. After a series ofiterations involving fitting and evaluating models with differentgroups of predictors (i.e., variables from the HBS data) the mostsuitable models for predicting expenditure were determined foreach region. Predictor variables that were found to be commonacross the three regions were as follows (Where not self-explanatory, HBS variable names in parentheses):• Household size (hhsize);• Education level of head of household in four classes, i.e., 1
= none; 2 = primary; 3 = secondary; 4 = tertiary and above(edu); and
• Number of days meat eaten in past week (qmeat).
Other predictor variables included in the models for these threeregions were as follows:
Dar es Salaam (urban):• Whether household owned an iron, an electric/gas stove, an
automobile (iron, elecstov, motvehic);• Construction materials of walls in two classes, i.e., 1 =
modern; 2 = not modern (walls);• Number of days in past week when milk products were
consumed (qmilk); and• In past month whether household paid money to purchase
wheat flour (wheatf ), cooking bananas (cookban), potatoes,fresh fish (fishfr), beer, newspapers (newspa), poultryproducts (poulpur), eggs, a snack or beverage outsidehousehold (bevsnak).
Kilimanjaro (rural):• Age of household head (age);• Area of land used for farming/pastoralism (landarea);• Whether household spent money to purchase seeds in the
past 12 months (seed);• Whether household spent money to purchase fertiliser or
manure in the past 12 months (fert);• Whether household owned a bicycle, a sofa, or lamp• Main source of cash income in the following four classes: 1
= sale of cash/food crops; 2 = sale of livestock or livestockproducts; 3 = business/wages/salaries; 4 = other sources,
118 The Policy Implications of Tanzania’s Mortality Burden: AMMP-2 Final Report
FINDINGS

such as fishing, casual cash earnings, cash remittances,other (income2).
Morogoro (rural):• Sex of household head;• Age (in years) of household head;• Number of persons employed in household (including self
employed) (empl);• Dependency ratio (number of dependants ÷ number of
non-dependants) (depratio);• Number of persons per sleeping room (p_room);• Whether household spent money to purchase fertiliser or
manure in the past 12 months (fert);• Main source of drinking water in four classes: 1 = piped in
house; 2 = piped outside house; 3 = protected water; 4 =non-protected water (water);
• construction materials of walls in two classes, i.e., 1 =modern; 2 = not modern (walls);
• toilet facility available, i.e., 1 = none; 2 = not modern; 3 =modern (toil);
• main fuel used for lighting, i.e., 1 = electricity; 2 =kerosene/paraffin; 3 = other (fuelght3); and
• whether household owned a bicycle, a bed net (mosqtnet).
The adjusted R2 values for the above models were 65 percentfor Kilimanjaro region, 56 percent for Morogoro region and 63percent for Dar es Salaam region.
Model ValidationSummary statistics that provide an assessment of the validity ofthe fitted models when applied to an external data set areshown in Tables 5.1-5.3 below for each region. Each row
119Volume 3: Field Operations and Validation Studies
Table 5.1 Summary Statistics of True Values and Predictions for Households Remaining inSubset B, from Results of Model Fitted to Data of a Random Subset A (N = 611; Dar es Salaamregion)
Mean Std. Dev Min Maxy = loge (expenditure) 9.65 0.644 6.18 11.59
y prediction 9.73 0.517 8.14 11.02% error in prediction 3.46 2.76 0.0011 16.47True minus predicted -0.0316 0.404 -1.31 1.29
Table 5.2 Summary Statistics of True Values and Predictions for Households Remaining inSubset B, from Results of Model Fitted to Data of a Random Subset A (N = 511; Kilimanjaroregion)
Mean Std. Dev Min Maxy = loge (expenditure) 9.44 0.617 7.75 11.60
y prediction 9.47 0.470 8.48 11.19% error in prediction 3.44 2.94 0.00013 15.91True minus predicted -0.0325 0.420 -1.343 1.146

represents a summary across individual household values. Thepercent error in prediction has been calculated as {|true -predicted|/true}x100.
In all three regions, the mean of actual values and the mean ofpredicted values are very close. There is also a closecorrespondence between actual and predicted values at thehousehold level, as is observed in Figure 5.1 for Morogororegion (below). The measure of linear association between thepredicted and true expenditure values (expressed by thecorrelation coefficient ‘r’) was 0.72. This indicates a relativelyhigh degree of association. Similar graphs were obtained forKilimanjaro and Dar es Salaam regions.
The percent error in the predictions is also quite small andbelow 17 percent, but this must be treated with some cautionsince it relates to log values. Reverse transformation into TSh is
120 The Policy Implications of Tanzania’s Mortality Burden: AMMP-2 Final Report
Table 5.3 Summary Statistics of True Values and Predictions for Households Remaining inSubset B, from Results of Model Fitted to Data of a Random Subset A (N = 526; Morogoro region)
Mean Std. Dev Min Maxy = loge (expenditure) 9.51 0.614 7.44 11.86
Y prediction 9.48 0.506 8.25 10.88% error in prediction 3.56 2.86 0.0082 16.89true minus predicted 0.0350 0.432 -1.430 1.633
LN
(Exp
en
ditu
re)
Predictions for set B households8 9 10 11
7.5
8.5
9.5
10.5
11.5
Figure 5.1 True values vs. Predictions for (Remaining) Subset B of Households Using ModelFitted to a Random Subset (A) of Households (Morogoro region, N=526; r = 0.72).

simpler to interpret using the actual differences betweenpredicted and true expenditure (shown in the last row of Tables5.1-5. 3).The worst scenario is in Table 5.3 (Morogoro). Whenconverted to TSh, the maximum of the differences betweentrue and predicted values (1.633) gives a value 5.1. This meansthat at worst, there is a five-fold error in the predictions.However, the mean difference, as before, converts to a value of0.966, i.e. virtually a 1:1 correspondence in means between thetrue and predicted values.
Model PerformanceThere are several ways to assess model performance. In Table5.4 below we present results showing different performanceindicators.The first two columns show the actual percentage ofthe population below the poverty line and the correspondingpercents as predicted from the model. Although the initialpercent below the poverty line produced by the model appearsto be a substantial under-estimate, applying the procedurerecommended by Hentschel et al. (2000) produced much closerestimates (see third numerical column in Table 5.4). The finaltwo columns of the table give the percentage of householdscorrectly classified by the poverty line and the percentageclassified into the correct tercile. These results are as good ascan be expected, given that only about 60 percent of thevariability in the consumption expenditure is explained by thesemodels.
CEP Method Compared to an Additive and PrincipalComponents-Based Asset Indices
Some concerns about asset indicesIn this section of the paper, we compare the performance of theCEP with two other, more familiar approaches to povertymeasurement. As mentioned above, the search is on for bestpractice with respect to rapid measures of poverty. One of theleading contenders (albeit described as being the ‘least worst’)[33, 34] is a listing of household assets, housing materials, andwater source information which is often analysed usingprincipal component analysis (PCA). In its analysis of socio-economic differences in health, population, and nutrition inTanzania, for example, World Bank analysts applied an asset-
121Volume 3: Field Operations and Validation Studies
Table 5.4 Indicators of Model Performance
Region
Actual %below poverty
line
Predicted %below
poverty line
% below poverty lineapplying Hentschel
approach afterprediction
% correctlyclassified bypoverty line
% classified intothe correct
tercileDar es Salaam 11.0 4.9 11.4 90.9 62.8
Kilimanjaro (Hai) 18.9 13.5 18.1 87.0 60.7Morogoro 21.3 12.8 22.9 83.9 60.3

based index derived from PCA to define the wealth status ofhouseholds [8]. In an annex, this PCA method and itscomponent variables is explained and offered for use in other in-country surveys. The variables included in the index come frominformation gathered in the Demographic and Health Surveys(DHS) household questionnaire and concern householdownership of a number of consumer items, dwellingcharacteristics, type of water source, and other characteristicsrelated to health status.
If capable of producing equivalent results to the CEP as a proxyfor appropriate income poverty constructs such as consumptionexpenditure, a PCA-based asset index such as the one publishedfor Tanzania would be preferable as it is generally easier toimplement and does not require the presence of a recent HBS-type data set for development. Our concerns with the asset-index approach are two-fold. They stem from the localvariability of items that can serve as effective proxies forexpenditure (as demonstrated in the CEP models) and theappropriateness in this particular application of the PCAmethod.
First, a decision has to be made regarding which variables toinclude in the asset index. The World Bank team use all assetsincluded in the DHS questionnaire. There is some indicationthat the assets included in the DHS survey were not originallyselected with the primary aim of distinguishing wealth statusbut with demographic behaviour [35]. Questions abouttelevision and radio ownership, for example, were includedprimarily to assess the proportions of the population who mightbe reached by mass media and mass media health education orfamily planning campaigns. The consequences of extending theuse of this asset list to an assessment of wealth constructs suchas permanent wealth or consumption expenditure need to beconsidered carefully. Ownership of a television, refrigerator,motorcycle, or car may be good for differentiating wealth at theupper end of the wealth spectrum, but since these items areowned by very few households in poor rural areas, theirdiscriminatory power at the lower end of the wealth spectrummay be questionable.
With respect to the application of PCA to this asset index data,we assume that the index values correspond to the first principalcomponent (This is not explicitly stated.). This is a summarymeasure from the PCA that captures the maximum variabilityin the assets data. The variables used in the Wold Bank analysisare largely binary. This is not a major problem if PCA isregarded as a purely mathematical tool for constructing an index
122 The Policy Implications of Tanzania’s Mortality Burden: AMMP-2 Final Report

that summarises the variability amongst variables included inthe analysis. What is important is to ensure that all variablescorrespond to an ordinal scale with one end of the scaleattributable to ‘poor.’ In addition, the use of PCA with anyparticular subset of assets makes the assumption that assetshaving high variability are more important as indicators ofwealth than those which have lower variability. The variance ofa binary variable is p(1-p) where p = proportion owning theasset. A particular asset will have highest variability when thepopulation splits 50:50. So when using a set of assets as a meansof constructing a wealth quintile, it is important to considerwhether the PCA approach is appropriate for the set of assetsunder consideration, given that the first PCA is in the directionof maximum variance.
To guide the user, the authors of the Bank report provide scores(weights) to be attributed to each asset and the wealth quintilecut-offs. They make it clear that these have been based on acountry-wide population sample and would work best for aprogram that is national. They suggest that the analysis berepeated if households are to be ranked within specific sub-populations. While we agree with the latter suggestion, we haveconcerns using the former approach for a national programme,since to apply one set of scores applied universally, given thewide diversity of a country’s population, may not be veryeffective. If PCA is to be used, we would recommend that thepopulation be stratified first into suitable strata and then thePCA conducted within each stratum. In other words, analysis atthe sub-population level (as the authors have suggested) wouldbe a better option than applying one set of scores to all strata.
We have attempted to explore the effectiveness of the PCA-analysed asset index by:1) Using the same set of variables included by the authors of
the Bank report in the derivation of the asset index;2) Carrying out the PCA separately for three districts in
Tanzania, these being sentinel surveillance sites where theAdult Morbidity and Mortality Project is operating;
3) Using codes 1, 2, 3 ... for levels of each categorical variableto represent an ordering from poorest to wealthiest; and
4) Noting the percent of variability accounted for by the firstprinciple component to assess its ability to summarise theoverall variability in the population.
Comparison of CEP and Asset Indices We compare three methods:• PCA to construct an asset-index based on variables
recommended in the World Bank publication cited;
123Volume 3: Field Operations and Validation Studies

• An unweighted total index calculated by a simple additionof the binary variables used in the World Bank publication;and
• The CEP model described in this paper.
The PCA method and the unweighted additive index arecompared with the CEP modelling approach by assuming thatconsumption expenditure, as derived from results of the HBS, isan appropriate indicator to identify wealth quintiles in each ofour chosen three districts. Tables 5.5, 5.7 give results from PCAand unweighted additive asset indices and our CEP modellingapproach for Kilimanjaro region in Tanzania. These arefollowed by Figures 5.2-5.4, which show the relationship ofeach of the three indicators and consumption expenditure, againfor Kilimanjaro region.
124 The Policy Implications of Tanzania’s Mortality Burden: AMMP-2 Final Report
Figure 5.2 Graph of log (Consumption Expenditure) vs. PCA-Derived Asset Index (KilimanjaroRegion; r = 0.46)
log (
to b
ase e
) of expenditure
p
First PC-3.63011 5.23297
7.4827
11.7477

125Volume 3: Field Operations and Validation Studies
Figure 5.3 Graph of log (Consumption Expenditure) vs. the Unweighted Additive Index(Kilimanjaro Region, r = 0.42)
log (
to b
ase e
) of expenditure
p
unwindex4 16
7.74929
11.7232
log
(to
ba
se
e)
of
exp
en
ditu
re p
Linear prediction8.47489 11.1315
7.74929
11.7232
Figure 5.4 Graph of log(Consumption Expenditure) vs Model Predictor (Kilimanjaro Region, r = 0.76)

It is important for readers to note that the PCA asset index wasnot developed as a proxy for consumption expenditure per seand should therefore not be expected to perform well whencross-compared to this measure. The PCA-index is, however,intended to relate to permanent income [35]. Unfortunately welacked measures of permanent income from the HBS. Becausewe believe that some form of cross-comparison with gold-standard data sets is inherently desirable when assessing optionsfor rapid assessment models, and at the risk of comparing applesand oranges, we have proceeded with the analysis as described.
These results demonstrate that none of the three methods arevery reliable in correctly classifying households into the correctquintile, but of the three the modelling approach gives muchbetter results (see Table 5.8) below. The CEP approach followedby the application of an adjustment procedure developed byHentschel et al. [36], however, does give good estimates for theheadcount ratio, a common poverty indicator (Table 5.4). Itwould be difficult to use the PCA approach in deriving this ratio.
126 The Policy Implications of Tanzania’s Mortality Burden: AMMP-2 Final Report
Table 5.5 Quintiles of Consumption Expenditure vs. Quintiles of First Principle Component (the PCA-analysed asset index)
Quintiles of the firstprincipal component
1 2 3 4 5
Total % in correctquintilea
1 75 56 41 24 9 205 36.62 53 54 45 33 18 203 26.63 38 48 29 49 40 204 14.24 22 32 47 52 49 202 25.7
Quintiles oftrue
expenditure5 16 14 41 46 87 204 42.6
Total 204 204 203 204 203 1018a Percentage for each row = (diagonal element/total)*100
Table 5.6 Quintiles of Consumption Expenditure vs. Quintiles of Unweighted Additive Index
Quintiles of the unweighted index1 2 3 4 5
Total % in correctquintilea
1 75 87 20 17 6 205 36.62 55 92 22 18 17 204 45.13 46 61 31 26 41 205 15.14 36 63 44 20 42 205 9.8
Quintiles oftrue
expenditure5 20 45 30 27 83 205 40.5
Total 232 348 147 108 189aPercentage for each row = (diagonal element/total)*100
Table 5.7 Quintiles of Consumption Ependiture vs. Quintiles of CEP Model Predictors
Quintiles of the unweighted index1 2 3 4 5
Total % in correctquintilea
1 121 46 29 9 1 206 58.72 56 74 47 21 7 205 36.13 22 50 63 43 27 205 30.74 6 28 47 83 41 205 40.5
Quintiles oftrue
expenditure5 1 7 19 49 129 205 62.9
Total 206 205 205 205 205 1026aPercentage for each row = (diagonal element/total)*100

We also note that there is little difference between using a PCAcompared to using an unweighted index. The latter is simple tocalculate and easily understood by those with limited statisticalknowledge. However, as others have noted in other settings,both the PCA asset index and the unweighted additive indexperform quite badly overall. This is not surprising given thatthe percentage of variability in the data explained by the firstprincipal component is quite low in all three districts. Thispercentage is 24.6 percent in Dar es Salaam, 22.9 percent inKilimanjaro, and 30.2 percent in Morogoro.
Making good predictions of consumption expenditure on thebasis of objective criteria measured on households is a difficulttask because households are very diverse in their livelihoodstrategies. It would be impossible to find a single model thatwould make nearly perfect predictions. The results reportedhere are, on the whole, as good as can be realistically expected.
The AMMP CEP tool resulted from an explicit process thathad several objectives and worked within several constraints.Chief among these were the need to address the indicatorrequirements of a multi-sectoral audience and to provide atechnically sound poverty measure with results that could becompared to other data sets.This led us to attempting to modelconsumption expenditure and to link our efforts to the analysisof the National Household Budget Survey.
Our regional CEPs required both the presence of the HBS dataand needed separate modelling exercises for each locale.However, the results can be directly compared to each otherand to any other measure that estimates consumptionexpenditure (or refers to poverty lines derived from it). As anext step it will be instructive to compare the performance ofthe AMMP site-specific CEPs to the national proxy developedby Ward et al. [32].
The regional CEPs predicted log values of consumptionexpenditure extremely well. The models are at their best whenpredicting values around the mean. At their worst, whentransformed into real values of TSh, one of our models(Morogoro) had up to a five-fold error in the prediction of thecorrect value. Because these models are intended to identify and
127Volume 3: Field Operations and Validation Studies
Table 5.8. Percentage of Households Classified into the Correct Quintile
Dar es Salaam Kilimanjaro MorogoroPCA – asset index 27.4 29.2 29.0Unweighted index 26.1 29.4 28.8Model predictor 48.0 45.8 44.1
CONCLUSIONS ANDDISCUSSION

chart the experiences of the poor, it will be important to look atways of improving model accuracy for the lower end of theexpenditure distribution.
The models performed reasonably well with respect topredictions of mean expenditure estimates for groups ofhouseholds and can therefore be reliably applied when model-based consumption expenditure values are averaged to thecommunity level. Use of these model predictions that do notinvolve any averaging process but rely on individual householdlevel consumption expenditure figures must be regarded withsome caution, since misclassification errors were quite high forindividual households close to the boundary of the poverty line.
It is worth noting, however, that the CEP correctly identifiedthe poorest third of the population with about 60 percentaccuracy and the poorest 20 percent of the population withgreater than 50 percent accuracy. In addition, misclassificationof households into non-neighbouring quintiles was extremelylow.
When compared to two other candidates for povertymeasurement, PCA and additive asset indices, the CEPapproach performed much better in all regards. For example, theasset indices correctly identified the 20 percent poorest with lessthan 40 percent accuracy and misclassified up to 10 percent ofthe poorest households into the top quintile. As stated above,this assumes that we have made a fair comparison. A furtherstep might be to compare the PCA and additive asset indices tothe Ward et al.’s national proxies.
It should be noted that our CEP performed much better atpredicting expenditure than models developed by Montgomeryet al. for Tanzania. Despite being ‘the best of a poorlyperforming group’ as the researchers termed their own model,the proxies performed well enough to allow a robust analysis ofthe relationship of poverty, schooling, and fertility. Theyattribute the success in using these weak models to the savinggrace of the large sample sizes typical of demographic surveyresearch. Given this finding, it can be safely assumed that theAMMP CEP models will perform as well if not considerablybetter than any practical and immediately available alternativefor monitoring, impact evaluation, and even research purposes.
It is important to note that the analysis here is based onassuming that consumption expenditure has been measuredwithout error and that it is the best indicator of poverty. Weneed to question whether it is appropriate to use it to calibratethe suitability of the asset index and the model predictor when
128 The Policy Implications of Tanzania’s Mortality Burden: AMMP-2 Final Report

consumption expenditure is largely a measure of financialcapital. The asset index on the other hand measures largelyphysical capital, while the model predictor captures largelyphysical and financial capital, with some minor representationsof social and/or natural capital. More work is needed toproduce an index that will bring together in a morecomprehensive way all aspects of livelihoods, i.e., physical,social, natural, human and financial capitals as emphasised inDFID’s sustainable livelihoods framework.
Our approach to the development of a rapid CEP tool formeasuring income poverty has several features that may be ofuse and interest to those engaged in similar work in otherdeveloping countries. We would make the followingrecommendations:
• Tanzania’s approach to multi-purpose informationgeneration makes maximal and rational use of scarce resourcesfor poverty reduction and health sector monitoring and shouldbe emulated. This is especially true of countries where thehealth sector will be expected to produce equity- and poverty-sensitive indicators, and those outside the health sector areexpected to produce indicators about major health-relatedissues.
• The development of a CEP-type of rapid measurement toolwithin the health sector can be used as a vehicle to bringMinistry of Health and National Bureaus of Statistics intocloser collaboration. Despite their mutual areas of interest,there is sometimes little contact and cross-development ofcapacity even at a country level.
• A CEP approach deserves careful consideration forcountries where the data exist to generate it. Assuming thepresence of competent statisticians, capacity can be put in placeto allow the process to be replicated following subsequentHBSs or LSMSs. We also believe that the apparent degree ofincreased accuracy in comparison with other options, togetherwith the ability to validate the CEP against a gold standard andto derive an absolute (and not just a relative) poverty measurejustifies the additional input of resources over reanalysis orreapplication of existing asset indices based on asset lists fromDHS surveys.
• The primary goal of the CEP is to serve social policy andbroad impact evaluation needs. We believe that it can morethan meet that objective while offering a potentially higherstandard of performance even for research applications.
129Volume 3: Field Operations and Validation Studies
RECOMMENDATIONS

1. Evans, T., Whitehead, M., Diderichsen, F., et al., eds.Challenging Inequities in Health. From Ethics to Action. 2001,Oxford University Press: New York.
2. Jha, P. and Mills, A., Improving Health Outcomes of the Poor.Report of Working Group 5 of the Commission on Macroeconomics and Health. 2002, World Health Organization: Geneva.
3. Ravallion, M., Growth, Inequality and Poverty: Looking Beyond Averages. World Development, 2001. 29(11): p. 1803-1815.
4. Morris, S.S., Carletto, C., Hoddinott, J., et al., Validity ofrapid estimates of household wealth and income for health surveys inrural Africa. Journal of Epidemiology and Community Health,2000. 54: p. 381-387.
5. Montgomery, M.R., Gragnolati, M., Burke, K.A., et al.,Measuring Living Standards with Proxy Variables. Demography,2000. 37(2): p. 155-174.
6. Anand, S., Diderichsen, F., Evans, T., et al., Measuring Disparities in Health: Methods and Indicators, in Challenging Inequities in Health. From Ethics to Action, T. Evans,Whitehead, M., et al., Editors. 2001, Oxford University Press:New York. p. 49-67.
7. Leon, D. and Walt, G., Poverty, inequality, and health in international perspective: a divided world?, in Poverty, Inequality,and Health. An International Perspective, D. Leon and Walt,G., Editors. 2001, Oxford University Press: Oxford. p. 1-16.
8. Gwatkin, D.R., Rutstein, S., Johnson, K., et al., Socio- economic Differences in Health, Nutrition, and Population in Tanzania. 2000, HNP/Poverty Thematic Group of the World Bank: Washington DC.
9. Adult Morbidity and Mortality Project and National Sentinel Surveillance Teams (Tanzanian Ministry of Health). Toward a National Sentinel Surveillance System for Health and Poverty Monitoring in Tanzania. paper presented at American Public Health Association Annual Meetings. 2001. Atlanta.
10. United Republic of Tanzania, Poverty Reduction Strategy Paper (PRSP). 2000: Dar es Salaam (Government Printers).
11. Adetunji, J., Murray, C., and Evans, T. Causes of death in Africa:a review. paper presented at Population Association of America.1996. New Orleans, LA.
12. Tsikata, Y. and Mbilinyi, M., Towards a Research Framework forPoverty Monitoring in Tanzania. 2001, Economic and Social Research Foundation: Dar es Salaam.
13. Mswia, R., Lewanga, M., Moshiro, C., et al., Progress in Safe Motherhood in Tanzania during the 1990s: findings from community-based monitoring. Bulletin of the World Health Organization, 2003. 81(2): p. 87-94.
14. Clark, S., Setel, P., Kahn, K., et al. The Role of AIDS/TB in Mortality Patterns in East and Southern Africa: Evidence from Four Demographic Surveillance Sites. paper presented at Empirical Evidence for the Demographic and Socio- economic Impacts of AIDS. 2003. Durban, South Africa.
15. Adult Morbidity and Mortality Project and National SentinelSurveillance Teams (Tanzanian Ministry of Health).
130 The Policy Implications of Tanzania’s Mortality Burden: AMMP-2 Final Report
REFERENCES

Monitoring community-level trends in HIV/AIDS/TB mortality in Tanzania: an equity perspective. paper presented at Second Multisectoral AIDS Conference in Tanzania. 2002. Arusha,Tanzania.
16. Adult Morbidity and Mortality Project and National SentinelSurveillance Teams (Tanzanian Ministry of Health).Monitoring community-level trends in Acute Febrile Illness Mortality in Tanzania: an equity perspective (poster). paper presented at Multilateral Initiative on Malaria (MIM) Conference. 2002. Arusha, Tanzania.
17. Ministry of Health and AMMP Team, National Burden ofDisease Estimates for 2001. 2002, Ministry of Health, United Republic of Tanzania: Dar es Salaam.
18. Antoninis, M., Socio-economic Status Predictors for the Adult Morbidity and Mortality Project Census in the Hai and MorogoroRural Districts. 2000, Adult Morbidity and Mortality Project,Tanzanian Ministry of Health: Dar es Salaam.
19. Antoninis, M., Socio-economic Status Predictors for the Adult Morbidity and Mortality Project Census in the Ilala and Temeke Districts of Dar es Salaam. 2000, Adult Morbidity and MortalityProject, Tanzanian Ministry of Health: Dar es Salaam.
20. Abeyasekera, S. and Ward, P., Models for Predicting Expenditureper Adult Equivalent for AMMP sentinel surveillance sites. 2002,Adult Morbidity and Mortality Project, Tanzanian Ministry ofHealth: Dar es Salaam.
21. Lynch, J. and Kaplan, G., Socioeconomic Position, in Social Epidemiology, L.F. Berkman and Kawachi, I., Editors. 2000,Oxford University Press: Oxford. p. 13-35.
22. United Republic of Tanzania, Poverty Monitoring Master Plan.2001, Dar es Salaam: Government Printers.
23. Hakikazi Catalyst, Tanzania without Poverty. A plain languageguide to Tanzania’s Poverty Reduction Strategy Paper. 2001,Arusha (Tanzania): Hakikazi Catalyst.
24. Kawachi, I. and Berkman, L., Social Cohesion, Social Capital, andHealth, in Social Epidemiology, L.F. Berkman and Kawachi, I.,Editors. 2000, Oxford University Press: Oxford. p. 174-190.
25. Astone, N.M., Nathanson, C.A., Schoen, R., et al., Family Demography, Social Theory and Investment in Social Capital.Population and Development Review, 1999. 25(1): p. 1-31.
26. Kunitz, S.J., Accounts of Social Capital: The Mixed Health Effectsof Personal Communities and Voluntary Groups, in Poverty,Inequality, and Health. An International Perspective, D. Leon and Walt, G., Editors. 2001, Oxford University Press: Oxford.p. 159-174.
27. Montgomery, M.R., Gragnolati, M., Burke, K., et al.,Measuring Living Standards with Proxy Variables. Working PaperNo 129. 1999, The Population Council: New York.
28. National Bureau of Statistics Tanzania, Household Budget Survey 2000/01. 2002, National Bureau of Statistics: Dar es Salaam.
29. Mswia, R., Whiting, D., Kabadi, G., et al., Hai District Demographic Surveillance System, in Population and Health in Developing Countries. Volume 1: Population, Health, and Survival in INDEPTH Sites, The INDEPTH Network,
131Volume 3: Field Operations and Validation Studies

Editor. 2002, International Development Research Centre:Ottawa. p. 151-158.
30. Mswia, R., Whiting, D., Kabadi, G., et al., Morogoro Rural Demographic Surveillance System, in Population and Health in Developing Countries. Volume 1: Population, Health, and Survival in INDEPTH Sites, The INDEPTH Network,Editor. 2002, International Development Research Centre:Ottawa. p. 165-172.
31. Mswia, R., Whiting, D., Kabadi, G., et al., Dar es Salaam Demographic Surveillance System, in Population and Health in Developing Countries. Volume 1: Population, Health, and Survival in INDEPTH Sites, The INDEPTH Network,Editor. 2002, International Development Research Centre:Ottawa. p. 143-150.
32. Ward, P., Owens, T., and Kahyrara, G., Developing Proxy Predictors for Household Expenditure and Income Poverty. 2002,Oxford Policy Management: Oxford.
33. Diamond, I., Matthews, Z., and Stephenson, R., Assessing the health of the poor: Towards a pro poor measurement strategy. 2001,The Health Systems Resource Center: London.
34. Falkingham, J. and Namazie, C., Identifying the poor: a critical review of alternative approaches. 2001, London School of Economics.
35. Rutstein, S. Presentation on Poverty Index Construction in DHS Data. paper presented at Equity Project. 2000. Ho,Ghana.
36. Hentschel, J., Lanjouw, J.O., Lanjouw, P., et al., Combining Census and Survey Data to Study Spatial Dimensions of Poverty: ACase Study of Ecuador. The World Bank Economic Review,2000. 14(1): p. 147-165.
132 The Policy Implications of Tanzania’s Mortality Burden: AMMP-2 Final Report


The attribution of cause of death using verbal autopsy (VA) hasbeen the central feature of the project. The use and reliability ofverbal autopsy for determining cause of death, however, is anarea of active debate, development and research [1-16].Beginning in 2002, in collaboration with the World HealthOrganization, Harvard University, and the University ofQueensland, and with additional support from the US NationalInstitute on Ageing, AMMP undertook a major VA validationstudy.The final results of that work are not available at this time,however here we are able to present a preliminary validation ofthe verbal autopsy tool for the leading causes of death.
Most validation studies focus on the question of how well a VAtool performs in diagnosing particular causes of death. Thispresentation of results focuses on answering a more generalquestion related to health policy, planning, and priority setting.Namely, we wish to know whether the VA can reliably furnishplanners with a list of the leading causes of death. If it can bedemonstrated that the VA can correctly produce evidence aboutthe leading causes of death, this on its own can be of enormousutility in moving toward evidence-based planning and priority-setting.
The correct estimation of the cause structure of mortality, or‘cause-specific mortality fractions,’ is, in fact the primarypurpose and use of VA, and other VA forms and tools in otherepidemiological settings have been proven to work well in thismanner. Hence a validated VA is referred to as a ‘communitydiagnosis tool,’ rather than an ‘individual diagnosis tool.’ No VAcan be expected to repeatedly and reliably determine cause ofdeath at the individual level.
The two sources of data in a VA validation study are: codedverbal autopsies and coded medical records, to which the verbalautopsies are compared. Naturally, the VA must be linked to themedical records of the same individual, and this must beverified. Once we are sure these items refer to the death of thesame person, they are assembled into ‘validation sets.’ At thetime of this analysis the project collected 3,100 validation setsrecords from health facilities and communities in and aroundthe sentinel DSS areas.
134 The Policy Implications of Tanzania’s Mortality Burden: AMMP-2 Final Report
Preliminary Results of Validation Studyon Core Verbal Autopsy Forms
6
INTRODUCTION
METHODS

The VAs and medical records collected for the validation studywere coded using international death certificates and theInternational statistical classification of diseases and relatedhealth problems. Tenth Revision [17-19]. Briefly, the codingprocess entailed double-blind and separate coding of all VA andmedical records to the core ICD code (three digit) level and asystematic process of reconciling discrepant codes. No codercoded both the medical records and VA of the same individual.
Tanzanian death certificates allow for the coding of theimmediate antecedent and originating antecedent conditions(often called the ‘immediate’ and ‘underlying’ causes of death).The immediate cause of death is placed on the first, or (a) lineof the death certificate. In 76 percent of VAs and 79 percent ofmedical records, where there was sufficient evidence to ascribeonly one cause of death, this single entry functions as both theunderlying and the immediate cause of death.
For the comparison presented here, we analysed final deathcertificate codes for both items in all complete validation sets(i.e. cases for which we have both a complete verbal autopsyand a photocopied medical record).The leading causes of deathbased on the (a) lines of the death certificates were calculated asa proportion of all deaths. These calculations were performedseparately for the VAs and the medical records.
Because we are considering only the entries on the (a) line ofthe death certificates this is a comparison of immediate causesof death only. The final analysis of the VA validation data willinvolve a comparison of the valid underlying causes of death.
Table 6.1 shows the results of the comparison. There iscomplete correspondence between the verbal autopsy and themedical record cause structure for the seven most commonimmediate antecedent causes. Together, the top eight causesaccount for 65 percent of deaths in the VA data set and 67percent of deaths in the medical records data set. HIV/AIDS ±tuberculosis and malaria ± convulsions were the leading causesof death by a considerable margin.
135Volume 3: Field Operations and Validation Studies
RESULTS

We began by hypothesising that if the verbal autopsy tooldeveloped by the Ministry of Health through AMMP provedto be reliable in determining the most common causes of death,the cause-specific mortality data generated by sentinelsurveillance could depended upon to be providing accurate datafor policy, planning, and priority setting.The final assessment ofthe reliability of the Ministry’s core VA forms as communitydiagnosis tools must await the completion of validation study.However, given that three fourths of all death certificatescontained only entries on the (a) line, it is possible that the finalresults will not differ dramatically from those presented here.Pending these final results, it may be reasonably presumed thatthe evidence base about cause of death provided throughsentinel surveillance is valid and dependable.
1. Chandramohan, D., et al., Verbal Autopsies for Adult Deaths: Issuesin their Development and Validation. International Journal of Epidemiology, 1994. 23(2): p. 213-222.
2. Chandramohan, D., et al., Verbal autopsies for adult deaths: their development and validation in a multi-centre study. Tropical Medicine and International Health, 1998. 3: p. 436-446.
3. Reeves, B.C. and M. Quigly, A Review of Data-Derived Methodsfor Assigning Causes of Death from Verbal Autopsy Data.International Journal of Epidemiology, 1997. 26(5): p. 1080-1096.
4. Chandramohan, D., P. Setel, and M. Quigley, Effect ofmisclassification of causes of death in verbal autopsy: can it be adjusted? International Journal of Epidemiology, 2001. 30(3): p.509-514.
136 The Policy Implications of Tanzania’s Mortality Burden
Table 6.1 Comparison of Leading Causes of Death (Immediate Causes Only)According to Verbal Autopsy and Medical Records
RankLeading causes of death,verbal autopsy (N=1,930)
% ofall
deaths
% ofall
deathsLeading causes of death,
medical records (N=2,066)1 malaria ± convulsions 19.5 22.6 HIV/AIDS ± tuberculosis2 HIV/AIDS ± tuberculosis 18.6 16.3 malaria ± convulsions3 Pneumonia 7.4 9.8 foetal death4 foetal death 7.3 7.5 Pneumonia5 Tuberculosis 5.5 4.1 Tuberculosis6 Stroke 3.5 3.5 Anaemia7 Anaemia 3.0 2.8 Stroke
Total 64.8 66.7 TotalNotes on ICD core codes and groupings:• malaria/convulsions = B54 (unspecified malaria), B53.8 (other parasitologically confirmed malaria), and R56.8
(convulsions, not elsewhere classified)• HIV/AIDS ± tuberculosis = B20.7 (Human immunodeficiency virus [HIV] disease resulting in infectious and
parasitic diseases (with multiple infections)), B22.0 (Human immunodeficiency virus [HIV] disease resulting inother specified diseases (with encephalopathy)), B20.0 (Human immunodeficiency virus [HIV] disease resultingin infectious and parasitic diseases (with TB))
• foetal death = P95 (Foetal death of unspecified cause)• pneumonia = J18.9 (Pneumonia, organism unspecified)• anaemia = D64.9 (other anaemias)• respiratory tuberculosis = A16.2 (Respiratory tuberculosis, not confirmed bacteriologically or histologically)• stroke = I64 (Stroke, not specified as hemorrhage or infarction)
DISCUSSION
REFERENCES

5. Quigley, M.A., et al., Validity of data-derived algorithms for ascertaining causes of adult death in two African sites using verbal autopsy. Tropical Medicine and International Health, 2000.5(1): p. 33-39.
6. Iriya, N., K.P. Manji, and R.L. Mbise, Verbal autopsy in establishing cause of perinatal death. East Afr Med J, 2002. 79(2):p. 82-4.
7. Rodriguez, L., et al., Validation of the verbal autopsy method to ascertain acute respiratory infection as cause of death. Indian Journal of Pediatrics, 1998. 65(4): p. 579-84.
8. Benara, S.K. and P. Singh, Validity of causes of infant death by verbal autopsy. Indian J Pediatr, 1999. 66(5): p. 647-50.
9. Anker, M., The effect of misclassification error on reported cause-specific mortality fractions from verbal autopsy. Int J Epidemiol,1997. 26(5): p. 1090-6.
10. Reeves, B.C. and M. Quigley, A review of data-derived methodsfor assigning causes of death from verbal autopsy data. Int J Epidemiol, 1997. 26(5): p. 1080-9.
11. Kamali, A., et al., Verbal autopsy as a tool for diagnosing HIV-related adult deaths in rural Uganda. International Journal of Epidemiology, 1996. 25(3): p. 679-684.
12. Nykanen, M., et al., Verbal autopsy as a technique to establish causesof infant and child mortality. East Afr Med J, 1995. 72(11): p.731-4.
13. Todd, J.E., et al., The limitations of verbal autopsy in a malaria-endemic region. Annals of Tropical Paediatrics, 1994. 14(1): p.31-6.
14. Bang, A.T. and R.A. Bang, Diagnosis of causes of childhood deathsin developing countries by verbal autopsy: suggested criteria. The SEARCH Team. Bulletin of the World Health Organization,1992. 70(4): p. 499-507.
15. Mirza, N.M., et al., Verbal autopsy: a tool for determining cause ofdeath in a community. East Afr Med J, 1990. 67(10): p. 693-8.
16. Pacque-Margolis, S., et al., Application of the verbal autopsy during a clinical trial. Soc Sci Med, 1990. 31(5): p. 585-91.
17. World Health Organization, International statistical classification of diseases and related health problems. Tenth Revision. Volume 1. 1993, Geneva: World Health Organization.
18. World Health Organization, International statistical classification of diseases and related health problems. Tenth Revision. Volume 2. 1993, Geneva: World Health Organization.
19. World Health Organization, International statistical classification of diseases and related health problems. Tenth Revision. Volume 3. 1993, Geneva: World Health Organization.
137Volume 3: Field Operations and Validation Studies


Chapter 1. Baseline and Update HouseholdEnumeration Surveys: Procedures, SampleEnumeration Forms, and CapacityRequirementsDavid Whiting, Philip Setel, Robert Mswia,Henry Mwanyika, and Veronica Mkusa wrotethe chapter. The field methods and forms weredeveloped over many years with the input oftoo many individuals to name individually.Members of the AMMP Team and colleagueswho guided the evolution of the census tools inAMMP-2 include: KGMM Alberti, RichardAmaro, Daniel Chandramohan, YusufHemed, Gregory Kabadi, Berlina Job, JudithKahama, Joel Kalula, Ayoub Kibao, JohnKissima, Henry Kitange, Regina Kutaga, MaryLewanga, Frederic Macha, Haroun Machibya,Mkamba Mashombo, Godwill Massawe,Gabriel Masuki, Louisa Masayanyika, AliMhina, Veronica Mkusa, Ades Moshy, HamisiMponezya, Robert Mswia, Deo Mtasiwa,Ferdinand Mugusi, Samuel Ngatunga, MkayNguluma, Peter Nkulila, Chalapati Rao, SeifRashid, JJ Rubona, Asha Sankole, DaudiSimba, Philip Setel, Andrew Thompkins,Nigel Unwin, David Whiting, and Basia Zaba.
Chapter 2. Conducting MortalitySurveillance: Data Collection, CodingProcedures, Core VA Forms, ICD-10Coding, and Proposed Tabulation ListPhilip Setel, Yusuf Hemed, David Whiting,Veronica Mkusa, Daniel Chandramohan, andChalapati Rao wrote the chapter. The fieldmethods and core forms were developed overmany years with the input of too manyindividuals to name individually. Members ofthe AMMP Team and colleagues who guidedthe evolution of the VA tools in AMMP-2include: KGMM Alberti, Richard Amaro,Daniel Chandramohan, Yusuf Hemed,Gregory Kabadi, Berlina Job, Judith Kahama,Joel Kalula, Ayoub Kibao, John Kissima,Henry Kitange, Regina Kutaga, Mary
Lewanga, Frederic Macha, Haroun Machibya,Mkamba Mashombo, Godwill Massawe,Gabriel Masuki, Louisa Masayanyika, AliMhina, Veronica Mkusa, Ades Moshy, HamisiMponezya, Robert Mswia, Deo Mtasiwa,Ferdinand Mugusi, Samuel Ngatunga, MkayNguluma, Peter Nkulila, Chalapati Rao, SeifRashid, JJ Rubona, Asha Sankole, DaudiSimba, Philip Setel, Andrew Thompkins,Nigel Unwin, David Whiting, and Basia Zaba.
Chapter 3. Surveillance Package/OpenSource Software and Data Set GuideHenry Mwanyika and Dave Whiting wrotethe chapter.
Chapter 4. Estimating the Optimum Sizefor Sentinel Mortality Surveillance SitesDave Whiting and Philip Setel wrote thechapter.
Chapter 5. Development, Validation, andPerformance of a Rapid ConsumptionExpenditure Proxy for Measuring IncomePoverty in AMMP/National SentinelSurveillance System Areas Philip Setel, Savitri Abeyasekera, YusufHemed, and David Whiting wrote thechapter.
Chapter 6. Preliminary Results of ValidationStudy on Core Verbal Autopsy FormsPhilip Setel, Yusuf Hemed, and DavidWhiting wrote the chapter. The work reportedin this chapter was supported by grantP10462-109/9903GLOB-2, The GlobalBurden of Disease 2000 in Aging Populations,US National Institutes of Health, NationalInstitute on Ageing.
Design & layout Petra’s Maridadi Ltd.Photo credits Philip Setel, 1991–2002
139Volume 3: Field Operations and Validation Studies
Contributors and Acknowledgments