Embed Size (px)
Citation preview
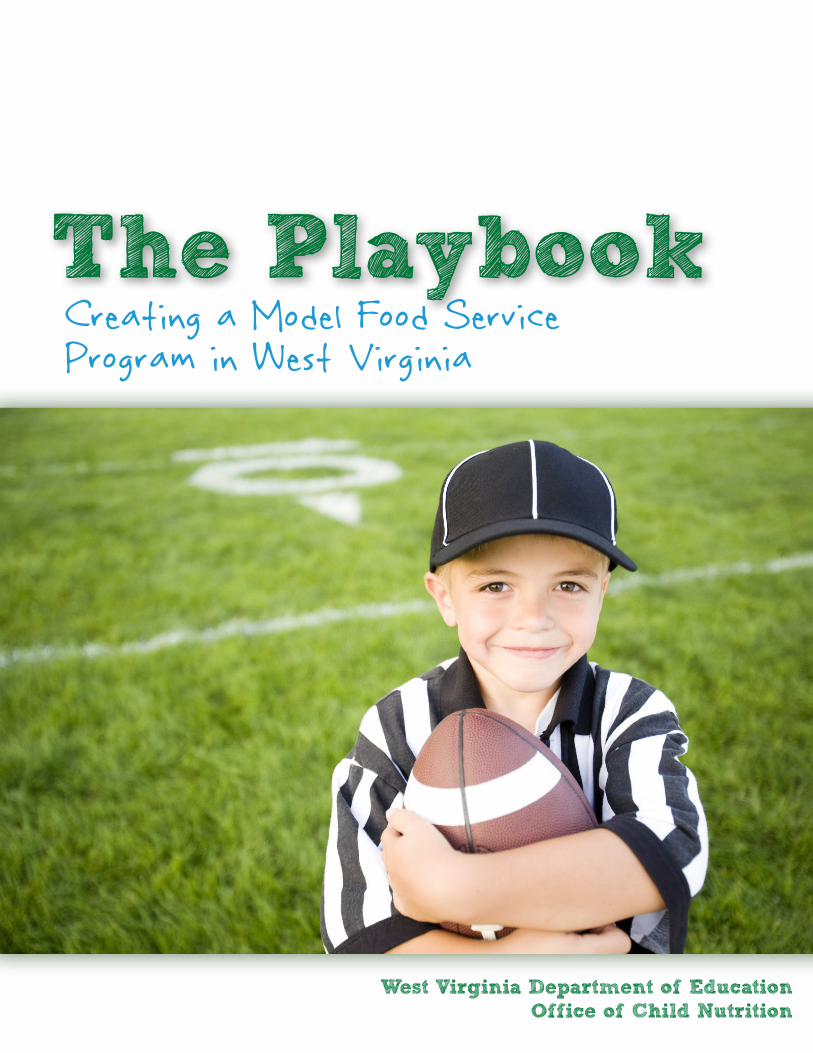
Creating a Model Food Service Program in West Virginia
The Playbook
West Virginia Department of EducationOffice of Child Nutrition
AcknowledgementsThe West Virginia Department of Education, Office of Child Nutrition would like to thank the USDA Food and Nutrition Service (FNS), the Food Research Action Center (FRAC) and the California Breakfast First Organization for the use of their developed materials in The Playbook, Creating a Model Food Service Program in West Virginia.
In accordance with Federal Law and U.S. Department of Agriculture policy, this institution is prohibited from discriminating on the basis of race, color, national origin, sex, age, or disability.
To file a complaint of discrimination, write USDA, Director, Office of Adjudication, 1400 Independence Avenue, SW, Washington, D.C. 20250-9410 or call toll free (866) 632-9992 (Voice). Individuals who are hearing impaired or have speech disabilities may contact USDA through the Federal Relay Service at (800) 877-8339; or (800) 845-6136 (Spanish). USDA is an equal opportunity provider and employer.
page iiiCreating a Model Food Service Program In West Virginia
Dear County Superintendents:The start of a new academic year brings fresh perspectives and program initiatives as we take a closer look at West Virginia’s strategic priorities for enhancing student success. The first of the four strategic priorities for action is “to meet the personal needs of each student.” As educa-tors, we cannot forget that students come to us from circumstances that may affect their ability to learn. We cannot foster academic success if we ignore the health and well-being of children enrolled in our schools. It is time we emphasize the important role the School Breakfast Program (SBP) and the National School Lunch Program (NSLP) play in addressing the correlation between proper nutrition and academic achievement. Child nutrition programs are an essential element in the process of holistic learning.
It is clear that in West Virginia, a gap in achievement exists between students in different socio-economic groups. Closing this gap and ensuring that all students are equally prepared academi-cally is the top priority for the West Virginia Department of Education (WVDE). The U.S. Depart-ment of Agriculture (USDA) recently released data reporting tragically high levels of hunger across the country. In West Virginia, 13.4% of residents live in households that sometimes run out of food and 88,610 children live below the poverty line. Research consistently shows that children who participate in school meal programs perform better in school than students who do not participate in school meal programs. Specifically, students who routinely eat a well-balanced breakfast perform better on standardized tests; have high math scores; and show lower rates of absenteeism and tardiness.
For these reasons, efforts in each county should be geared toward supporting child nutrition pro-grams and increasing breakfast and lunch participation. Any barriers hindering a child’s ability to participate should be eliminated. Keep in mind that child nutrition programs are among the few revenue – generating sources for a county. In most cases, breakfast and lunches provided by the school can be completely supported by federal and state funds. Your active support of school nutrition programs can be an advantage financially for your county; an advantage for teachers and principals in terms of student achievement; and, most importantly, and advantage for chil-dren who may be malnourished.
Effective today, I am issuing each of you a challenge of increasing participation in your break-fast and lunch programs for the upcoming school year. At my request, the Office of child Nutri-tion has identified both policy and environmental change strategies that you can implement in your county. It is my expectation that each of your will implement at least one of these strategies in each of your schools. At the conclusion of the 2011-2012 school year, the Office of Child Nutri-tion will evaluate each county’s meal participation figures and report this data to me. By work-ing together, we can ensure that every West Virginia child has access to a nutritious meal every school day.
If you have questions regarding the SBP and NSLP, including how to plan the right approach for your school, please contact the Office of Child Nutrition at (304) 558-2708.
Sincerely,
Jorea M. Marple, Ed.D.State Superintendent of Schools

page iv The Playbook
page vCreating a Model Food Service Program In West Virginia
TABLE OF CONTENTS
ABOUT THE PLAYBOOKA Guide to Creating a Model Food Service Program in West Virginia .......................................................... 1
WHY WE ARE PLAYING THE GAMEMeal Service Financial and Nutritional Benefits .......................................................................................................5
THE GAME PLANA Guide for Creating a Model Food Service Program.......................................................................................... 13
FOLLOWING THE RULESPolicies and Procedures ...................................................................................................................................................... 35
PENALTIESBarriers to a Successful Program ..................................................................................................................................39
TEAM STATISTICSCounty Level Data ..................................................................................................................................................................43
EXTRA POINTSTaking Advantage of Additional Opportunities .....................................................................................................107
WHAT’S THE SCORESelf-Assessment ...................................................................................................................................................................... 113
RESOURCES ..........................................................................................................................................................................123

page vi The Playbook

About the
Playbook
“I’ve always tried to coach people t
he way I would like to be
coached; positively and encoura
ging rather than with criticism
and fear. I’ve try to be as fair as possible.”
- Tony Dungy
A Guide for Creating a
Model Food Service Program
in West Virginia

page 2 The Playbook
page 3Creating a Model Food Service Program In West Virginia
Good nutrition is a vital component of children’s growth, development and learning, and that’s why the West Virginia Department of Education’s Office of Child Nutrition is leading the way in the fight against childhood obesity and poor eating habits. In many cases, schools provide the only nutritious meals that children receive. Because of this, we are working hard to see that every West Virginia child has at least two healthy meals and good, nutritious snacks each day. Our goal is to ensure that every child in West Virginia benefits from nutritious meals that foster better learning and a lifetime of good health. To achieve this goal we spend our time encouraging nutritious meals, supporting nutrition education and enhancing program quality and accountability. It all begins with the public school system food service program – the vehicle to feed, nurture and support the physical well-being and academic success of our children.
We know that in order to have a successful food service program, school meals need to be viewed as part of the instructional day and not as an interruption. Superintendents, food service directors, and principals need to be committed to supporting the program and providing quality, appealing and accessible meals.
In an effort to provide direction and the tools needed to create a model food service program in every county, the Office of Child Nutrition is proud to present the The Playbook – A Guide to Creating a Model Food Service Program in West Virginia. The Playbook serves as a how-to guide that features information about the nutritional and financial benefits for students, schools and the community. It provides the best national and state resources that illustrate how schools can comply with federal and state policies and regulations, empower students to make healthy food choices, and encourage school personnel and others to serve as role models.
Counties wanting to create and maintain an exemplary food service program should support and implement each of the following five Model Food Service Program components.
1. Provide Leadership and Support2. Serve Quality Meals3. Improve the School Environment4. Initiate Administrative Practices that Support School Nutrition 5. Implement Innovative Programs
To learn more about The Playbook and the Model Food Service Program components, please review and use this innovative resource. The Office of Child Nutrition stands ready to provide technical assistance in support of your efforts. Working together, members of the school community can ensure that children get consistent nutrition messages in and out of school. Please join us in championing what’s best for West Virginia’s children.
Richard J. Goff, MBAExecutive DirectorOffice of Child Nutrition West Virginia Department of EducationBld. 6 Room 248 1900 Kanawha Blvd. East Charleston, WV 25305-0330Phone: 304-558-2709 Fax: 304-558-1149E-mail: [email protected]
A Message from Richard GoffExecutive Director, Office of Child Nutrtion

page 4 The Playbook
Why We Are
Playing the
Game
“They call it coaching but it is teaching. You do not
just tell
them... you show them the reasons.” - V
ince Lombardi
Meal Service
Financial and Nutritional Benefits

page 6 The Playbook
page 7Creating a Model Food Service Program In West Virginia
WHY WE ARE PLAYING THE GAMEMeal Service Financial and Nutritional Benefits
Financial and Economic Benefits
From a financial perspective, food service programs are one of the largest programs that each county sponsors. When operated properly, the food service program can be a source of revenue for the district and the school system in general. Conversely, when operated inefficiently, the food service operation can become a financial drain for the district. Aside from meeting the dietary needs of our students, the food service program should contribute to a stable bottom line for the county’s total budget. Administrators need to understand the underlying economic structure and financial principles to be observed in the operation of the food service program in order to capitalize on the program’s financial benefits.
• The county food service program is a federally funded program that has many revenue sources. The major sources of revenue are as follows:
» Federal reimbursements; » Local collections from students and adults; » Child Nutrition state matching funds; and » County contribution (Inter-fund Transfer).
• The State Legislature appropriates funding through the funding formula for cook and substitute salaries and related fringe benefit costs. This allocation is passed on to the food service program in the form of an inter-fund transfer from the county’s general fund.
• The free and reduced priced meal application, along with direct certification efforts, is the cornerstone of the program. Individual eligibility determinations establish the federal revenue rate structure for the meal service operation.
• Once eligibility is established, student participation drives revenues and costs associated with feeding children. Increased student meal participation enables districts to maximize the federal and local revenues earned for serving reimbursable meals to children.
• There is an inverse relationship between federal revenues and the county contribution to the program. Increased meal participation results in an increase in federal and local revenues. An increase in federal and local revenues results in a decrease in amount of funding required by the county to support the program through the inter-fund transfer. The savings can be retained in the county’s general fund to be used for other non-food service related educational expenses. Student meal participation is of key importance in establishing a food service program that subsidizes the county, rather than a program that is subsidized by the county.
• When facing a county budget shortfall, reducing service positions across the board can negatively impact the food service program’s ability to maximize federal and local revenues. Rather than focus on cost-cutting measures to create a balanced budget, county administrators should focus on targeting low performing schools for increased student meal participation. This will increase federal revenues and reduce the county contribution while meeting the nutrition needs of the students.
page 8 The Playbook
The Nutritional Benefits Associated with School Breakfast and Lunch
Delivering Healthy Meals to Hungry Students
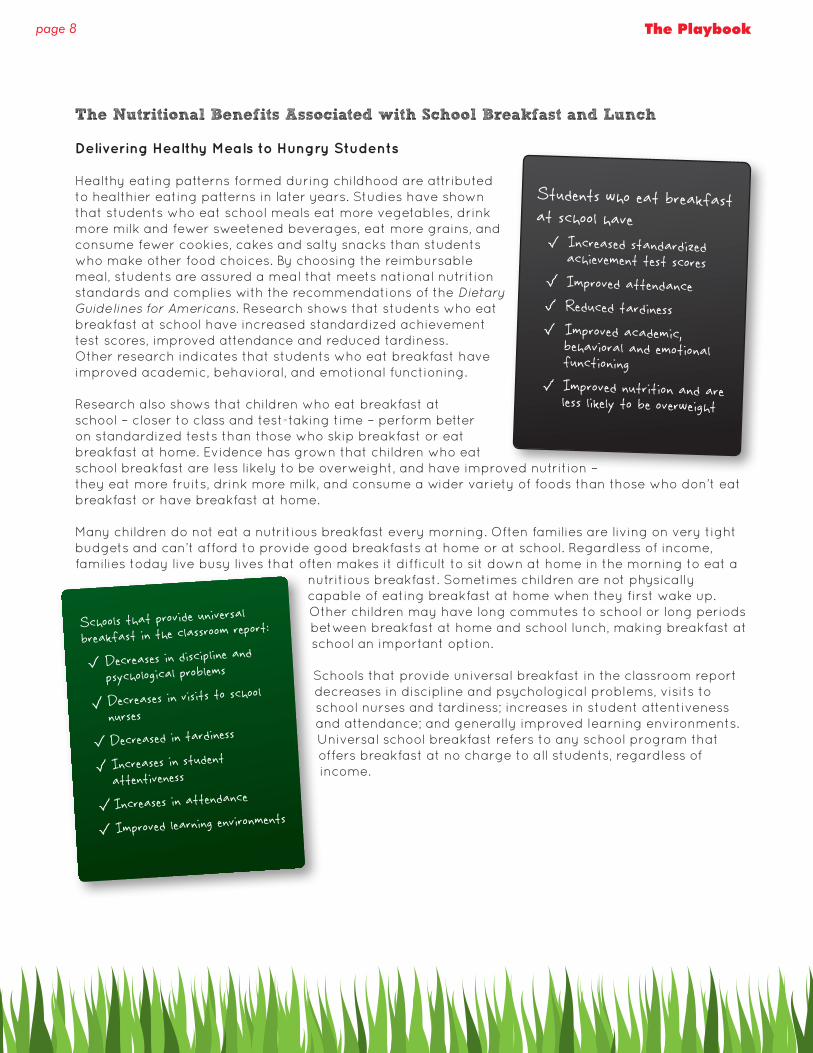
Healthy eating patterns formed during childhood are attributed to healthier eating patterns in later years. Studies have shown that students who eat school meals eat more vegetables, drink more milk and fewer sweetened beverages, eat more grains, and consume fewer cookies, cakes and salty snacks than students who make other food choices. By choosing the reimbursable meal, students are assured a meal that meets national nutrition standards and complies with the recommendations of the Dietary Guidelines for Americans. Research shows that students who eat breakfast at school have increased standardized achievement test scores, improved attendance and reduced tardiness. Other research indicates that students who eat breakfast have improved academic, behavioral, and emotional functioning.
Research also shows that children who eat breakfast at school – closer to class and test-taking time – perform better on standardized tests than those who skip breakfast or eat breakfast at home. Evidence has grown that children who eat school breakfast are less likely to be overweight, and have improved nutrition – they eat more fruits, drink more milk, and consume a wider variety of foods than those who don’t eat breakfast or have breakfast at home.
Many children do not eat a nutritious breakfast every morning. Often families are living on very tight budgets and can’t afford to provide good breakfasts at home or at school. Regardless of income, families today live busy lives that often makes it difficult to sit down at home in the morning to eat a
nutritious breakfast. Sometimes children are not physically capable of eating breakfast at home when they first wake up. Other children may have long commutes to school or long periods between breakfast at home and school lunch, making breakfast at school an important option.
Schools that provide universal breakfast in the classroom report decreases in discipline and psychological problems, visits to school nurses and tardiness; increases in student attentiveness and attendance; and generally improved learning environments. Universal school breakfast refers to any school program that offers breakfast at no charge to all students, regardless of income.
Students who eat breakfast at school have
Increased standardized achievement test scoresImproved attendanceReduced tardinessImproved academic, behavioral and emotional functioningImproved nutrition and are less likely to be overweight
Schools that provide universal breakfast in the classroom report:
Decreases in discipline and psychological problems
Decreases in visits to school nursesDecreased in tardiness
Increases in student attentiveness
Increases in attendance
Improved learning environments

page 9Creating a Model Food Service Program In West Virginia
How do we know West Virginia School Meals are Healthy?
School Meals Initiative (SMI) was implemented in 1996 by the United States Department of Agriculture (USDA). This initiative measures a county’s progress in planning, procuring, preparing and serving meals that meet the recommendations of the Dietary Guidelines as well as the appropriate nutrient standards. The WVDE, Office of Child Nutrition, monitors individual county’s selected breakfast and lunch menus to determine if the meals meet the applicable recommendations of the Dietary Guidelines for Americans and USDA’s nutrient standards.
The SMI regulations require that all NSLP and SBP sponsors provide meals that adhere to the applicable Dietary Guidelines for Americans and the United States Department of Agriculture (USDA) nutrient standards, which are age/grade appropriate.
The current Dietary Guidelines describe a healthy diet as one that:• Emphasizes a variety of fruits, vegetables, whole grains, and fat-free or low-fat milk and milk
products;• Includes lean meats, poultry, fish, beans, eggs and nuts; and• Is low in saturated fats, trans fats, cholesterol, salt (sodium) and added sugar.
The WV Meal Pattern differs from the USDA Traditional Meal Pattern by requiring:• Dried (cooked) beans at least once a week;• At least 5 servings of whole grains a week (many schools now serve all whole grains); • 1/4 c – 1/2 c fruits and vegetables at least 5 times a week (most schools are serving fresh fruits
and vegetables daily);• Breakfast and lunch meals must be served as a unit with no items sold a la carte except milk;• Water must be available with breakfast and lunch meals; and• Set nutrient targets for fiber and sodium.
West Virginia has been a national leader in child nutrition programs for the last 15 years. West Virginia has taken steps to exceed federal meal requirements to incorporate healthy eating principles in school meals. Here are some of the highlights that make West Virginia school meals stand out:• Decreased total fat in lunch meals from 37% to 27%;• Reduced saturated fat in lunch meals to 9%;• Reduced sodium from an average of 1815 mg in SY 1996-1997 to 1274 mg in SY 2010-2011; and• Reduced calories from an average of 905 calories in SY 1996-1997 to 754 calories in SY 2010-2011.
Schools Meals Initiative measures a county’s
progress in planning, procuring, preparing and serving meals that meet the recommendations of
the Dietary Guidelines as well as the appropriate
nutrient standards.
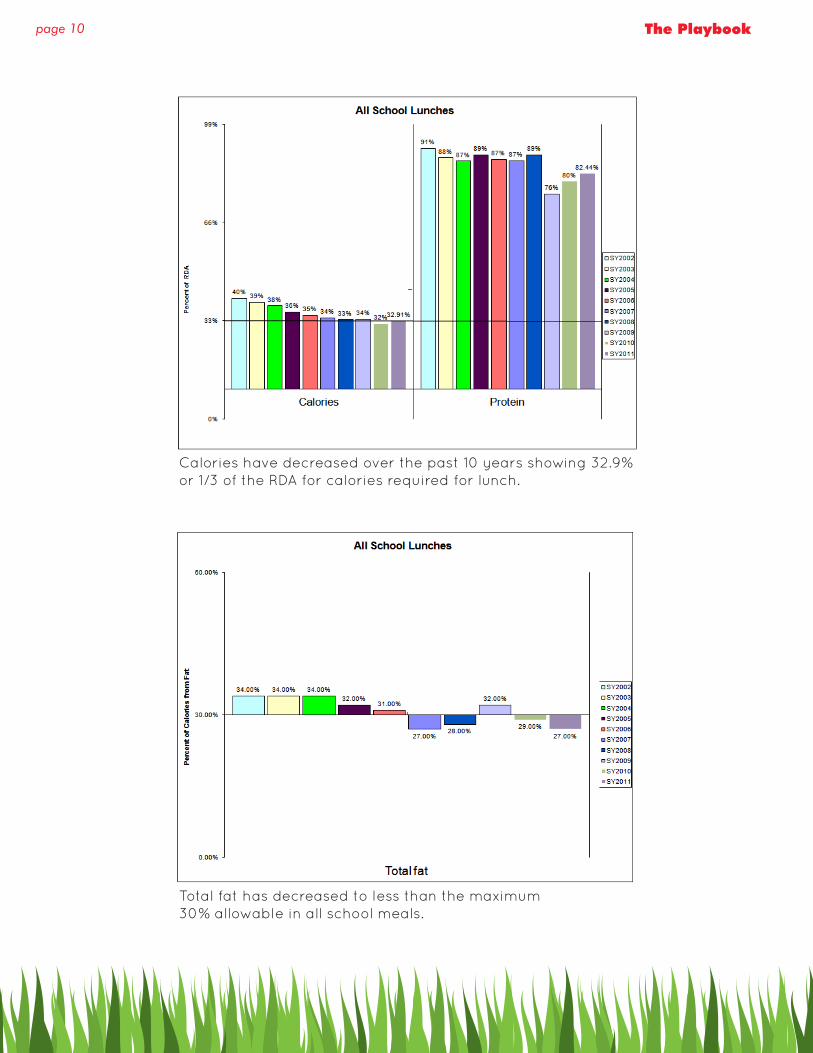
The following is a compilation of the past 10 years of monitoring. These graphs show the improvement statewide in meeting the nutrient standards.
page 10 The Playbook
Calories have decreased over the past 10 years showing 32.9%or 1/3 of the RDA for calories required for lunch.
Total fat has decreased to less than the maximum 30% allowable in all school meals.
page 11Creating a Model Food Service Program In West Virginia
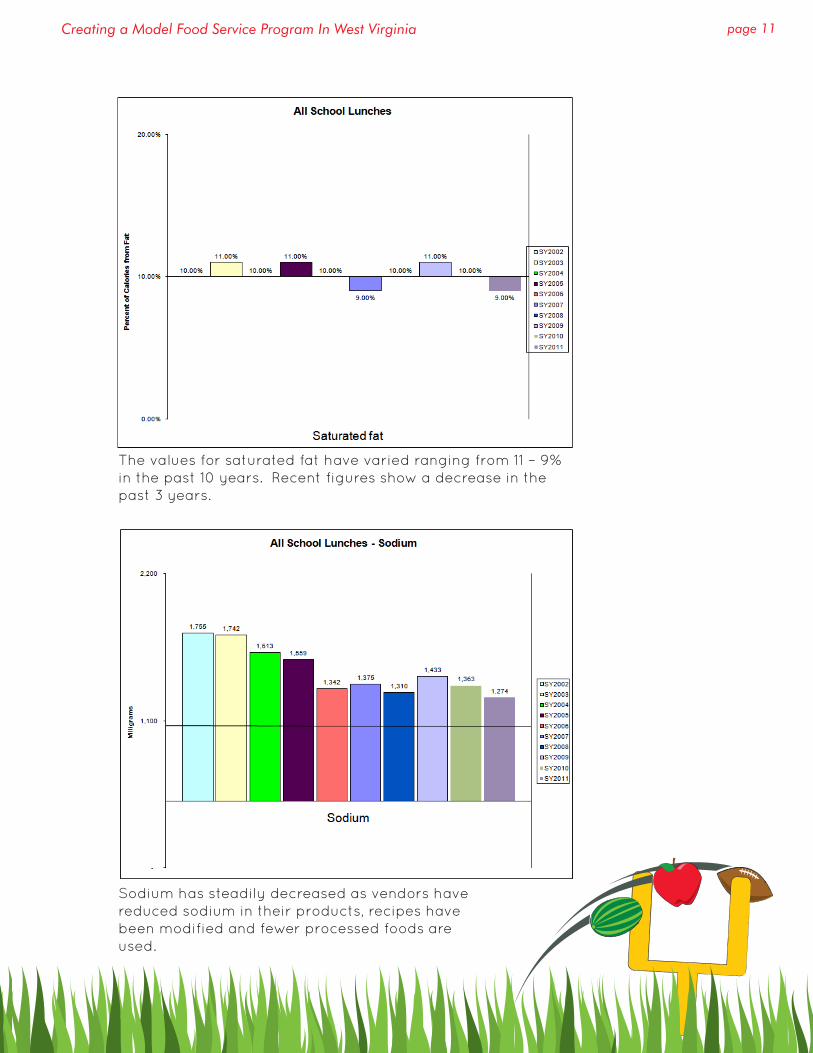
The values for saturated fat have varied ranging from 11 – 9% in the past 10 years. Recent figures show a decrease in the past 3 years.
Sodium has steadily decreased as vendors have reduced sodium in their products, recipes have been modified and fewer processed foods are used.

page 12 The Playbook

The Game Plan
“Three rules for coaching: 1) S
urround yourself with people
who
can’t live without football. 2) Recognize w
inners. They come in all
forms. 3) Have a plan for everything.” -
Bear Bryant
A Guide for Creating
a Model Food Service Program

page 14 The Playbook

page 15Creating a Model Food Service Program In West Virginia
THE GAME PLAN:A Guide to Creating a Model Food Service Program
Counties choosing to create and maintain an exemplary food service program must support and implement each of the following five Model Food Service Program components in schools.
1. Provide Leadership and SupportIt takes all three county leadership positions (superintendent, food service director and principals) working together toward the same goal to create a quality food service program. If any one of the three does not have the vision or commitment to reaching the shared goal, the program will not be as successful.
SuperintendentSupport:• Provide administrative leadership and support to ensure that every school in the district offers
breakfast and every student has the opportunity to eat;• Develop and implement effective School Wellness Policies that ensure that no child begins the
school day hungry;• Include school breakfast participation as a measure of success for each school building
administrator;• Employ a credentialed, full-time Food Service Director who meets WVDE staffing qualifications;
and • Garner basic knowledge about the program and overtly support the food service operations in
the county.
Resources:• Ensure there are enough resources (e.g. cooks for each school, adequate kitchens, and updated
equipment) for the food service program; and • Eliminate “across the board” programmatic cuts that negatively impact food service.
Communication:• Seek input from food service staff on the timing of breakfast and lunch to ensure maximum
participation;• Maintain high levels of communication with the Food
Service Director and Treasurer; and • Request that the Office of Child Nutrition speak to
principals annually and reinforce the significance of a quality program.
1. Provide Leadership and Support
2. Serve Quality Meals
3. Improve the School Environment
4. Initiate Administrative Practices that Support Child Nutrition
5. Implement Innovative Programs
page 16 The Playbook
1. Provide Leadership and Support (cont’d)
Food Service DirectorTraining, Reporting and Monitoring:• Attend Office of Child Nutrition meetings and trainings; • Call or email the Office of Child Nutrition for assistance when you have questions or are uncertain
how to accomplish a task; • Submit federal reports within the required timeframe;• Ensure that monthly claims for federal meal reimbursement are properly submitted and
reconciled;• Stay current on state and federal regulations; and • Monitor your program, as required by February 1 each year. Thoroughly examine all kitchen
operations: purchasing practices, inventories, food safety and temperature logs, record keeping and productive records, cafeteria environment, etc.
Management:• Manage and analyze the food service program like a for-profit business. Manage costs and target
revenues;• Initiate efforts to give every eligible child the opportunity to receive a meal;• Examine participation levels at each school and determine why some schools levels are low.
Remove barriers to participation; • Scrutinize all purchases at the school level and require cooks to buy only what is listed on the
county market list; • Discontinue the purchase of heat and serve items and require cooks to prepare school-made
entrees;• Require a salad bar each day; • Discontinue the practice of purchasing plastic or Styrofoam plates and utensils;• If eligible, participate in the Fresh Fruits and Vegetable Program (FFVP);• Offer the After School At-Risk Snack or Supper Program to children throughout the school year
and sponsor the Summer Food Service Program when school is not in session; • Initiate Farm to School efforts whenever possible; • Utilize commodity foods available to counties through the West Virginia Department of
Agriculture; • Maintain a centralized billing operation; and • Engage in a rigorous outreach campaign each year to get meal applications from all potentially
eligible families and to promote the healthfulness of school meals.
Supervision:• Maintain adequate cook ratios at each school in order to maintain or increase participation;• Be involved in the evaluation of food service personnel at the school level;• Examine procedures for feeding adults at each school; understand the difference between
program and non-program adults. Ensure that adults are categorized correctly; and• Protect food service staff from potential staff abuses (e.g. special requests, additional staff
portions, etc). Do not feed non-program adults for free.
page 17Creating a Model Food Service Program In West Virginia
PrincipalPositive Administrative Practices:• All administrative practices should encourage meal participation. Discourage administrative
practices that compete with the food service program (e.g. selling foods in competition with lunch, marketing vending items to discourage lunch participation, excessive wait times, schedules that do not allow time to eat);
• Include information about school breakfast in the packet of materials that go to parents at the beginning of the school year. Feature easy-to-access information about school breakfast on the school website that highlights the fact that qualifying for free or reduced-price meals includes breakfast, not just lunch;
• Promote breakfast frequently in emails, robo-calls (automated voicemails), on school district radio/TV stations when available, social media outlets such as Facebook and Twitter, and other communications with parents;
• Mail postcards to families to encourage them to participate;• Conduct promotional activities (e.g. contests, celebrity appearances, special themes) that
encourage students to participate; • Inform teachers by scheduling the School Breakfast Program as an in-service topic to heighten
awareness of the academic benefits of participation, barriers to participation, and ways that teachers can help encourage students to participate in breakfast;
• Enlist teachers to encourage students to participate by providing effective strategies to accomplish this task (e.g. modeling good eating behaviors, scheduling before-school activities in the cafeteria during breakfast);
• Know your school breakfast participation rates and set goals to increase your percentage each year; and
• Promote and serve breakfast and lunch on amended schedule days. Snow days cost the school nutrition program thousands of dollars and cannot be good financial sense. Cooks are paid regardless if they cook or not. If you fail to prepare to serve a breakfast and a lunch on amended schedule days, you are crippling your food service budget.
“Principals should have the same sense of urgency for students’ good nutrition EVERY DAY that they have during WESTEST week.”
Richard Goff, Executive Director, Office of Child Nutrition

page 18 The Playbook
Principal (cont’d)Child Nutrition Policy/Regulation Implementation and Enforcement:• Follow WV State Board Policy 4321.1, Standards for School Nutrition in regards to food and
beverages sold, served or distributed throughout the school day (e.g. vended items, fundraising, and school parties);
• Eliminate program abuses. Asking or requiring cooks to prepare additional food items for service and teaching staff amounts to federal program fraud. Do not ask cooking staff to prepare “special” items for staff that are not part of the school nutrition program. Do not expect staff to receive additional portions of food. Meals that adults receive are comparable to the high school portion of food components. With an epidemic of obesity in this state, adults—and children--do not need additional entrée items. Most schools offer salad bars and student and staff have the opportunity to select additional fruits and vegetables as part of their meal. Although the cost to children is subsidized, the purchase price for adult meals should be no less than the cost to produce the meal. Staff members have the resources to pay and should be expected to pay for their meal. Please keep in mind, regardless of the price of adult meals, staff could not purchase a comparable meal outside of the school for the same amount;
• Understand the difference between a program and a non-program adult. Do not expect non-program adults—including you—to be fed at no cost. In West Virginia, counties spend so much money feeding staff that they could more than feed all reduced price children FREE meals in the state; and
• Conduct cook personnel evaluations in collaboration with the county Food Service Director.
Good Nutrition Practices:• Form student nutrition committees to taste new items and promote the program among peers;• Be a role model and encourage staff to model good nutritional practices at school (e.g.
participate in the lunch program, discourage fast food in school, and eliminate soda consumption in school cafeteria and classrooms);
• If you have not already done so, go “DRY” (i.g., eliminate soda sales from school). If your county is “dry,” make sure you adhere to your county policy by eliminating sodas from your schools;
• View the food service program as part of the instructional day; understand and embrace the link between nutrition and learning; and
• Encourage students and their families to take advantage of the benefits of school meals through multiple communications throughout the school year.
Counties spend so much money feeding staff that they could more than feed all of the reduced price children for FREE!

page 19Creating a Model Food Service Program In West Virginia
2. Serve Quality Meals
Schools throughout West Virginia are working hard to create healthier school nutrition environments for all students. To reach program goals, child nutrition personnel must know how to plan, prepare, and serve meals that meet recommended nutrient levels for optimum health and nutrition while also managing a cost-effective operation. Child nutrition programs can encourage children to make healthy choices by providing a variety of nutritious foods with plenty of fruits, vegetables and whole grain products, while limiting excessive fat, sodium and sugars.
The model food service program should emphasize quality meal production and service, time management skills and optimal nutrition. The food service program should be the primary source of nutrition during the school day. Nutrition influences how well children grow develop and learn. Good nutrition provides the necessary energy and nutrients needed to succeed physically, mentally, socially and academically. A model child nutrition program can increase a student’s potential for success.
Good nutrition is more than food. It incorporates the value of selecting nutrient rich foods plus educating about the benefits of a healthy lifestyle. Good eating practices are also encouraged when adults model healthy eating behaviors. A goal of all school personnel and adults should be to increase student participation and have students receive the nutritional benefits available to them through the child nutrition program.
A model food
service program
should emphasize
quality meal
service, time
management
skills and optimal
nutrition.
page 20 The Playbook
Cooks need to cook Cooking from scratch offers many positive benefits to planning, preparing and serving healthier school meals. Variety in the school menu means so much to students. The choices offered are tastier than the prepackaged or processed alternatives. Children enjoy eating a variety of freshly prepared meals that have a unique flavor. Scratch cooking incorporates basic ingredients using the skills and expertise of the cooks. It allows more variety in the choices that are offered to students. Items chosen for the menu can include main dishes, sandwiches, side dishes, breads and grains, breakfast items and fruit and vegetable bars.
The cost of the meal can be lower as well. Using the same ingredients allows the school kitchen to initially stock up on the basic ingredients. These items can be less expensive and also be purchased in quantity since they will be reused over and over.
Scratch cooking can also make the menu healthier. Fats, sodium, sugar and preservatives can be eliminated or reduced in the recipe. Recipes can be reviewed and tested adding herbs and spices to provide a distinctive taste. If cycle menus are utilized, the food service staff becomes accustomed to the recipes, and time spent in preparing the new products will decrease. Food service staff takes pride in the food they prepare and share their cooking successes with the students, encouraging them to try new items. “Practice makes perfect” and the end result will be a delicious meal that is well accepted by students.
In West Virginia, cooking from scratch should be the “norm” and not the exception. One way to limit or eliminate the amount of ‘heat and serve’ products is to scrutinize the purchases made at the school level. Cooks should only be purchasing items that the county food service director has approved and these items should not include convenience products.
If food service staff is going to be expected to cook from scratch, they should be properly trained, have the equipment necessary to prepare meals, and be sufficiently staffed to meet the county’s expectations. Requiring cooks to prepare school made products without sufficient equipment, labor and training is a recipe for failure.
“The cooking staff of Cabell County schools has worked very hard to provide students with healthy school meals that are cooked from scratch. The process has been difficult during this past school year, but the outcome has been very rewarding and well worth the extra effort. We feel that our students are receiving healthier school meals by adding many fresh ingredients to our school recipes. This has given our cooks much deserved pride in the quality of meals they are serving to so many children each day.”
Rhonda McCoy, Director of Food Services, Cabell County Schools
Children enjoy eating a variety of freshly prepared meals that have a unique flavor
page 21Creating a Model Food Service Program In West Virginia
How do Schools Improve the Meals they are serving? In order to ensure the Dietary Guidelines and nutrient standards are met, the following practices should be incorporated into your child nutrition program.
1. Menu Planning: The menu drives the success of the child nutrition program and affects every facet of the operation. Make sure to consider these menu planning essentials:• Variety: Plan a cycle menu that offers a variety of fresh fruits, vegetables, whole grains, low-
fat or non-fat dairy and wholesome foods.• Color, texture and aroma: Stimulate the appetite and make the meal more appetizing and
interesting for students.• Portions: Serve portions that are appropriate for the age/grade level of the student.• Arrangement: Pay attention to how food looks on the tray. It should look fresh, delicious and
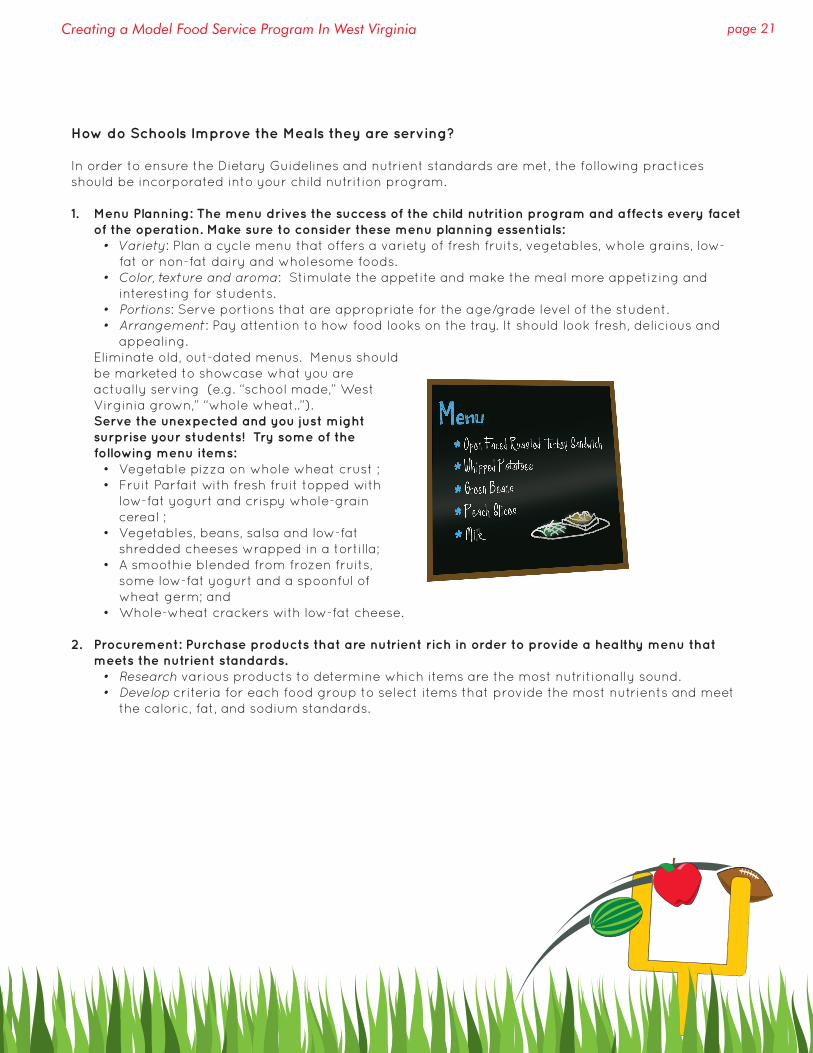
appealing.Eliminate old, out-dated menus. Menus should be marketed to showcase what you are actually serving (e.g. “school made,” West Virginia grown,” “whole wheat..”).Serve the unexpected and you just might surprise your students! Try some of the following menu items: • Vegetable pizza on whole wheat crust ;• Fruit Parfait with fresh fruit topped with
low-fat yogurt and crispy whole-grain cereal ;
• Vegetables, beans, salsa and low-fat shredded cheeses wrapped in a tortilla;
• A smoothie blended from frozen fruits, some low-fat yogurt and a spoonful of wheat germ; and
• Whole-wheat crackers with low-fat cheese.
2. Procurement: Purchase products that are nutrient rich in order to provide a healthy menu that meets the nutrient standards.• Research various products to determine which items are the most nutritionally sound.• Develop criteria for each food group to select items that provide the most nutrients and meet
the caloric, fat, and sodium standards.
page 22 The Playbook
3. Recipe Modification: Making simple changes to recipes can help decrease unnecessary fat, sugar, sodium and calories. Here are 3 ways to improve the nutritional value of your recipe without cutting taste:1. Omit and/or reduce unnecessary ingredients. Sometimes ingredients (e.g. sugar) may be
omitted or reduced in a recipe, improving the nutritional quality, and still taste great.2. Substitute ingredients. Making simple ingredient substitutions (e.g. applesauce for butter) in
recipes can cut the amount of fat, sodium, sugar and calories, making them healthier without sacrificing taste.
3. Alter the preparation method. Changing the preparation method can significantly reduce calories and fat and make the food item much healthier.• Baking instead of frying.• Steaming vegetables using water instead of sautéing in oil. • Other healthy preparation methods include boiling, broiling, grilling, poaching, roasting,
stir-frying and microwaving.
Always test recipes to ensure a high quality product when modifying a recipe.
4. Cycle Menus: Carefully planning a set of menus that are rotated on definite intervals, such as a 4 or 6 week cycle, can have many benefits, including:• Offering variety with less repetition;• Saved time and energy;• Improved cost control; and• Staff satisfaction.
Cycle menus can be modified to accommodate available supplies, seasonal fruits and vegetables, and special events. Menus can consist of as many weeks or months as needed. Choosing the best cycle length will be determined by the frequency of deliveries and the size of storage areas.
The following pages include examples of menus planned using good menu planning principles.
page 23Creating a Model Food Service Program In West Virginia
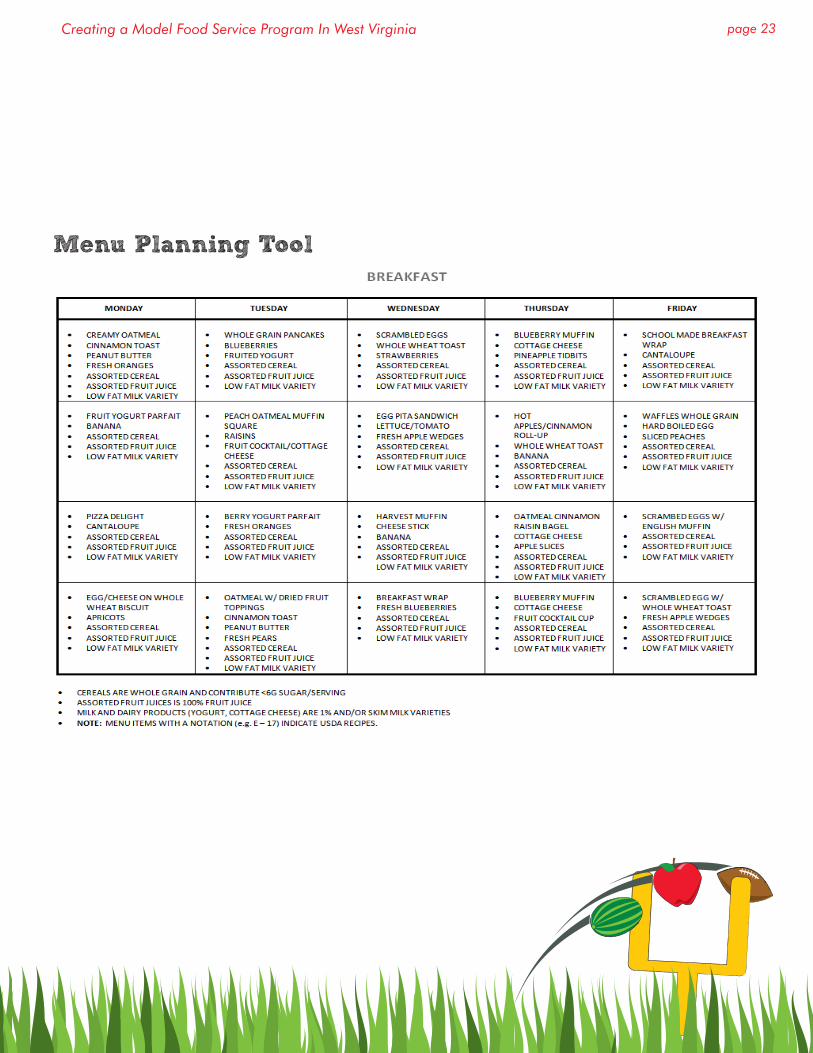
Menu Planning Tool
page 24 The Playbook
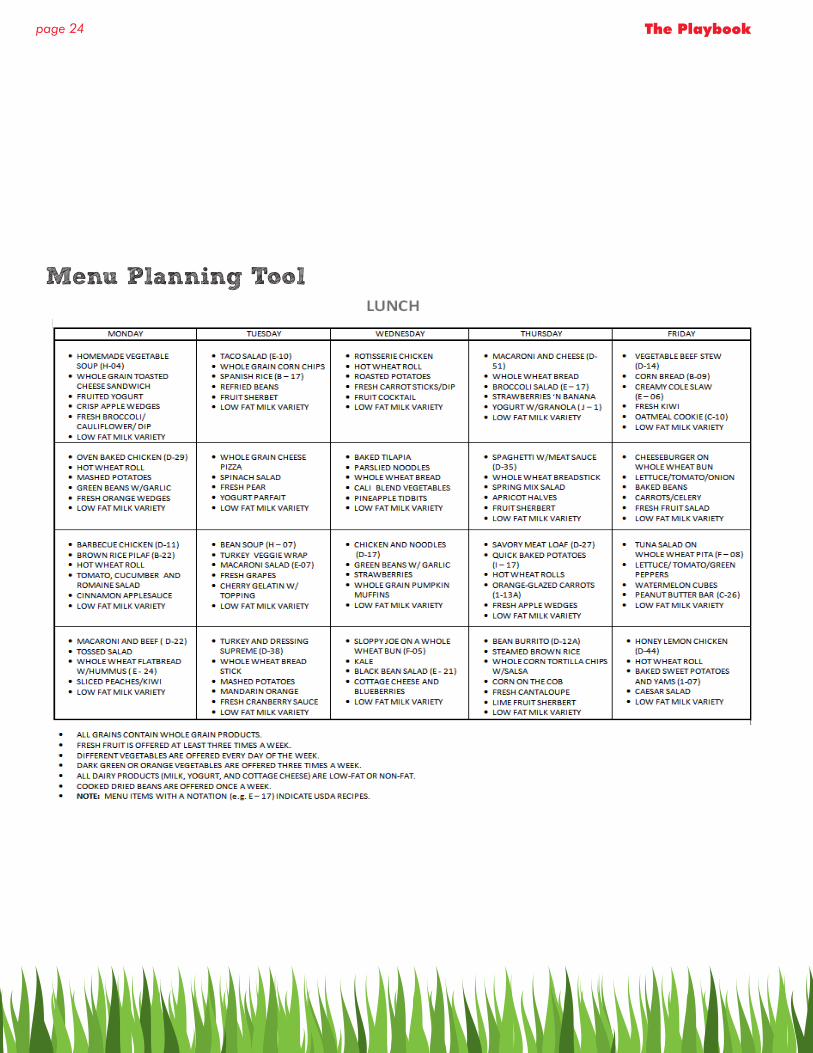
Menu Planning Tool

page 25Creating a Model Food Service Program In West Virginia
3. Improve the School Nutrition Environment
The school cafeteria should be a pleasant, clean, and welcoming place to eat. There should be plenty of time for enjoying a meal. State board policy requires 10 minutes for breakfast and 20 minutes for lunch. This requirement means the clock starts ticking from the time the child receives a meal—not bell to bell.
The cafeteria should have plenty of space for the child to sit and eat; wait lines should be minimal. If too many children are pushed through one meal service, it discourages participation. Consider adding additional meal service sessions, opening additional areas where meals are served, and grab-and-go opportunities. Additional cafeteria areas outside on picnic tables during summer months give children options regarding their dining experience.
Children should be allowed to socialize and talk while they consume their meal. They should not be subjected to excessive “quiet” requirements, loud whistles, or traffic signals that stifle socialization and, thereby, meal consumption.
Brighten and enlighten the cafeteria (and students!) by displaying student artwork, nutrition facts, nutrition information and posters throughout the dining area.
page 26 The Playbook
4. Initiate, Expect, and Model Administrative Practices that Support Child Nutrition
Administrative practices at the school or county level can often create as many barriers to program participation as the meals themselves. Counties should implement the following administrative practices if they are not already doing so:
Purchasing:• Participate in a cooperative purchasing group. Co-ops give counties the best products at the
most competitive prices; and • Utilize commodity foods available to counties through the West Virginia Department of
Agriculture.
Billing:• Maintain student billing and collection efforts at the central
county office—not in the school. By removing child nutrition funds from schools, theft and loss are minimized;
• Employ adequate support staff for the Food Service Director. In most cases, Food Service Directors are overseeing hundreds of thousands if not millions of dollars annually. Their duties are many: they are expected to collect the eligibility status of every child, implement direct certification, ensure bills are sent and money collected, maintain the electronic counting and claiming systems, submit the claim for federal reimbursement, manage the purchase of food at the school level and ensure that quality meals are produced and served to all children. Food Service Directors must also maintain efforts to increase participation in their schools by marketing and serving well-balanced reimbursable meals that appeal to students. They need administrative assistance to successfully oversee all facets of the child nutrition program;
• Consider hiring a full-time staff person to collect outstanding student debt, as opposed to contracting with a collection agency. There is a tradeoff between federal revenue and bad debt. Do not undermine your ability to obtain federal meal reimbursements by initiating practices that compromise participation;
• Mail lunch bills to family and do not send them home with students; and • Accept credit card payments from families for lunch bills.
Charging:• Develop a policy regarding charging privileges that includes a threshold that families cannot
exceed; discontinue charge privileges when this amount is reached; • Eliminate charging of second meals. There is no reimbursement for a second meal. Free students
will receive a lunch bill, parents will assume it is a mistake and no payment will be made; and • Eliminate overtly identifying students by their meal eligibility status by collecting minimal
amounts of money on the line.
Priority #1: Support your
Food Service Director

page 27Creating a Model Food Service Program In West Virginia
5. Implement Innovative Programs
All efforts in the county should be geared toward increasing participation. High participation in the school breakfast and lunch program is a “win” for everyone involved: nutritionally for the children, the principals in terms of student achievement and financially for the county. The best and easiest way to increase participation is to implement innovative programs. Innovative programs can be considered in two categories: environmental and policy change strategies.
Environmental program change strategies involve school-level nutrition programs that affect the overall school environment. Environmental change strategies include: Breakfast after First, Grab ‘N’ Go and Breakfast in the Classroom.
Policy change strategies involve county-level decisions that affect every child in every school. Policy strategies include: Eliminating the reduced price meal category and universal free breakfast and/or lunch.
Environmental Change Strategies
Breakfast after First:
How Does Breakfast after First Period Work?
This model is also called a nutrition break or second chance breakfast. As the name implies, students eat breakfast during a break in the morning, usually between 9:00 am and 10:00 am. Reimbursable breakfasts are individually packaged in grab ‘n’ go bags. These are usually offered from mobile carts or tables located in high traffic areas where there are many students. Breakfasts can be hot or cold, depending on school facilities. Foods that are easy to eat or hand held are popular and more convenient.
Many schools already offer a break from classes in the morning. By serving a reimbursable meal at this time, students who were not hungry first thing in the morning or those who ate breakfast very early now have a chance to eat a healthy meal. Serving a reimbursable meal is a healthy choice compared to ala carte options. Reimbursable meals also accommodate students who may not have the money to purchase vending.
Students are responsible for discarding their own trash. Extra trash cans in the area where students congregate between classes help to ensure that trash is discarded properly.
Why Serve Breakfast after First Period?
When you offer a mid-morning nutrition break, more students eat breakfast. Many middle and high school students are not interested in eating breakfast first thing in the morning. A mid-morning nutrition break is a great way to reach these students as well as those who do not have time to eat before school, or who ate very early in the morning. In some cases, schools do not have available space to serve breakfast. Serving breakfast from carts outside of the cafeteria eliminates this problem. A mid-morning nutrition break can be prepared quickly with few staff.
BreakfastAfter1st
The best and easiest way to increase participation is to implement innovative programs such as
Breakfast after First, Grab ’N’ Go and Breakfast in the Classroom.

page 28 The Playbook
Breakfast after First (cont’d):When Does Breakfast after First Period Work Best?
Breakfast after first period works well in many different schools; the following qualities help make the breakfast after first period option successful in schools:
• A milk break or other break in the morning already exists; • Buses arrive just before classes begin; • There is no time to serve breakfast before classes; • Students rely on vending machines for snacks in the morning; • Teachers are supportive of breakfast and realize its importance to learning; • There is no space to serve breakfast; and/or • The cafeteria is centrally located.
SAMPLE High School Schedule for Grab ‘N’ Go Breakfast AFTER First Period
BREAKFAST 7 a.m.
TeachersSign-In 7:15 a.m.
Students to Lockers 7:30 a.m.
Homeroom Tardy Bell 7:45 a.m.
Homeroom Dismissal 7:54 a.m.
1st Mod/1st Block Tardy Bell 8:01 a.m.
1st Mod Dismissal 8:50 a.m.
2nd Mod Tardy Bell 8:57 a.m.
2nd Mod Dismissal Bell 9:46 a.m.
AM BREAKGRAB ‘N’ GO BREAKFAST SERVED
Break Warning Bell 9:53 a.m.
3rd Mod Tardy Bell 10 a.m.
3rd Mod Dismissal 10:49 a.m.
4th Mod Tardy Bell (Group B) 1st Lunch Break (10:49-11:26) Group A(Sections A, B, C, D)Warning Bell—Return to class Group A
10:56 a.m.
11:19 a.m.
4th Mod Tardy Bell (Group A) 2nd Lunch Break (11:45-12:22) Group B(Sections E, F, G, H)
11:26 a.m.11:45 a.m.
4th Mod Dismissal Bell (Ends 2nd Lunch also) 12:15 p.m.
5th Mod Tardy Bell 12:22 p.m.
5th Mod Dismissal Bell 1:11 p.m.
6th Mod Tardy Bell 1:18 p.m.
6th Mod Dismissal Bell(6th Mod has 2 extra minutes for evening announcements)
2:09 p.m.
7th Mod Tardy Bell 2:16 p.m.
Student Dismissal 3:05 p.m.
Teacher Dismissal 3:15 p.m.

page 29Creating a Model Food Service Program In West Virginia
Breakfast in the Classroom:Breakfast in the classroom has emerged as the most effective strategy to get school breakfast to the large number of students who need it. It is especially effective for those schools with high concentrations of free and reduced price eligible students that can serve breakfast in the classroom to all students for free.
At participating schools, breakfast participation levels have increased and additional federal reimbursements are helping food service accounts. Students participating in Breakfast in the Classroom don’t struggle through mornings on empty stomachs and experience significant academic and health benefits.
Research has been done on breakfast in the classroom indicating that children who participate are less likely to be absent, have fewer visits to the school nurse, and are less likely to be overweight. They eat more fruit, drink more milk and consume a wider variety of foods.
How does Breakfast in the Classroom Work?
The program has three critical components:
1. Delivery – the most common options for getting breakfast to the classroom are:• School food service staff, students, or volunteers deliver it to classrooms;• Students pick up bagged breakfasts from hallway carts or kiosks; or• Students pick up breakfast from the cafeteria and bring it to the classroom.
2. Accountability – There must be a system in place to keep track of which students participate in breakfast each day. This can be done in a number of ways; the delivery model usually determines the best approach. For example:• In a model where breakfast is delivered to the classroom, teachers can check off which
students participate on a roster and return it to the school food service department; or• In a “Grab ‘N’ Go” model, students can swipe their cards or enter pin numbers on an
electronic key pad.
3. Clean Up – After breakfast is consumed, trash is disposed of and classroom surfaces are wiped, if necessary. Strategies that work well include:• Students place all breakfast trash in one receptacle which is then put outside the
classroom in the hallway. Custodians collect the breakfast trash from each hallway (It may seem like more work for custodians, but the trade off is that they no longer have to clean the cafeteria after breakfast);
• Each classroom has a spray bottle and roll of paper towels in case of spills; and• Students have responsibility for cleaning up their own desk after breakfast.
page 30 The Playbook
Breakfast in the Classroom (cont’d):
Classroom Activities and Instructional Time during Breakfast in the Classroom
• Breakfast in the classroom generally takes about 10 minutes to serve and eat, and is often done during morning activities, such as announcements, turning in homework or individual reading time; no instructional time is lost. Usually it takes time for children to settle in at the beginning of the day, and many teachers find that classroom breakfast is a successful transitional activity. Teachers report they have actually gained instructional time due to fewer nurse visits, and less tardiness and absenteeism.
• Recognizing the importance of morning nutrition to learning and performance on standardized tests, numerous State Superintendents of Education have recently issued policy memos clarifying that classroom breakfast meets the requirements of instructional time.
Garnering Support for Breakfast in the Classroom
• Work with your school nutrition director to create a menu of nutrient-rich, student-appealing breakfast choices. Offer conveniently packaged and easy-to-clean-up foods including fruits, vegetables, whole grains and low-fat or fat-free dairy foods.
• Speak with teachers and encourage them to use Breakfast in the Classroom as an opportunity to teach about healthy eating and the importance of breakfast.
• Consider local grocery stores, restaurants, or farms that might be willing to provide food samples and ideas.
• Spread the word about Breakfast in the Classroom. Create posters to put up in high-traffic areas, distribute flyers in classrooms and advertise your program in the school newsletter and website. Encourage everyone at your school to make healthy eating choices in the morning and to eat breakfast every day.
Grab ‘N’ Go Breakfast:Organize a Grab ‘N’ Go Breakfast Station at a high-traffic location in school where students can get breakfast before school—or an event such as a “last chance breakfast” break after first period to make breakfast a fun, fast option for everyone!
How Does a Grab ‘N’ Go Breakfast Work?
Grab ‘N’ Go breakfasts are packaged in paper bags, boxes or trays. Students pick up their breakfast and eat it when and where they want, within school guidelines. Food service staff packs reimbursable breakfasts into individual paper bags, usually the day before, or purchase prepackaged reimbursable breakfasts in boxes. These foods are served with milk the next morning. Breakfasts are usually cold, but can include hot items as well.
Grab ‘N’ Go breakfasts can be served first thing in the morning, between classes, or at a mid-morning break. Bags can be served from mobile service carts located in high traffic areas such as the school entrance, cafeteria, hallways, or near the gym. Students can take the breakfast and eat it outside, in the hall, in class, or in the cafeteria, depending on what the school decides is appropriate. The serving carts usually have a computer or point of service machine. A school food service staff member operates the cart before school, during morning break, or between classes. There is a great deal of flexibility with this method of serving breakfast, depending on the school’s needs. Students are responsible for following the school’s guidelines as to where and when they can eat and for throwing out their trash.
Grab ‘n’
GoGrab ‘n’
Go
page 31Creating a Model Food Service Program In West Virginia
Grab ‘N’ Go Breakfast (cont’d):
Why Serve a Grab ‘N’ Go Breakfast?
Grab ‘N’ Go breakfasts bring breakfast to the student, making it easier for them to choose to eat breakfast. Many middle and high school students are not hungry first thing in the morning or they want to hang out with friends. Grab ‘N’ Go breakfasts allow students the flexibility and choice to eat breakfast where and when they want. Grab ‘N’ Go breakfasts are convenient for food service staff and prepackaged breakfasts can take less time to prepare than traditional breakfasts.
Why Use Mobile Serving Carts?
Schools find that by bringing breakfast to the students on carts, participation increases because students do not need to leave their friends. Offering Grab ‘N’ Go breakfast from mobile carts allows schools to serve breakfast quickly to more students.
When Does a Grab ‘N’ Go Breakfast Work Best?
Grab ‘N’ Go breakfasts work particularly well in middle and high schools because older students enjoy the flexibility and choice that Grab ‘N’ Go provides. Here are some other qualities where Grab ‘N’ Go breakfasts are likely to be successful:
• The cafeteria or gym is crowded or not available for breakfast; • A large number of students have to eat in a short amount of time; • Buses arrive just before the start of classes; • Teachers and custodial staff are supportive of breakfast and realize its importance to
learning; • Students rely on ala carte and convenience foods from outside the school for breakfast; • The cafeteria isn’t located where students enter the building or hang out; and/or • The breakfast menu can easily offer Grab ‘N’ Go options.
Other Grab ‘N’ Go Ideas
• Work with your school cafeteria manager and principal to choose a location for your Grab-n-Go Breakfast Station. Consider locations where students tend to gather in the morning, such as a lobby or foyer, outside the library or gym, outside the front doors or near the bus loop.
• What tasty, appealing, healthy foods will your station offer? Consider polling students for comments about which choices they like and dislike. Ask them to suggest other nutritious breakfast options to offer in the future.
• Work with your school nutrition professionals to create a menu of nutrient-rich breakfast choices. Offer conveniently packaged and easy-to-grab foods that include low-fat or fat-free dairy products, whole grains, fruits and vegetables.
• Brainstorm design ideas for your Grab-n-Go Breakfast Station. Is it a table? A cart on wheels? A refrigerated station? As another option, work with school nutrition professionals to offer these more convenient and nutritious choices in the cafeteria breakfast line, for students who eat breakfast in the school cafeteria. Consider using “to go” containers so students can still “grab-n-go.”
• Spread the word about your Grab-n-Go Breakfast Station! Create posters to put up in high-traffic areas, distribute flyers in classrooms and advertise your program during morning announcements.
• Consider local grocery stores, local farms or restaurants that may be willing to donate healthy foods or containers for your program.
• Plan your activities and secure donations or funding.

page 32 The Playbook
Breakfast Carts: How Do Breakfast Carts Work?
Breakfast carts act as mobile serving areas for breakfast. Instead of having the students come to the cafeteria for breakfast, breakfast is brought to students. Grab ‘N’ Go breakfast work best with a breakfast cart. Breakfast can be prepackaged; however, some schools offer choices from their breakfast cart. The general rule is the food has to be portable and easy to grab.
Schools typically put their breakfast carts in high traffic areas such as the main entrance, hallway, outside the front door, or near the gymnasium. Wherever the students hang out is where the cart is located. Carts usually have a computer or point of service machine. A school food service staff operates the cart before school, during morning break, or between classes, depending on the school.
Carts can be purchased for a reasonable cost, but remember, you will have to also fund the portable milk coolers. Students are responsible for their trash and following school rules as to where they can eat their breakfast.
Why Use Breakfast Carts?
Schools find that by bringing breakfast to the students more students eat breakfast because they do not need to leave their friends to get breakfast. Breakfast carts mean that students do not need to choose between socializing and eating breakfast. Breakfasts served from a cart are convenient for food service staff and take less time to prepare than traditional breakfasts. Because breakfasts are Grab ‘N’ Go, breakfast carts allow schools to serve breakfast quickly to more students.
When Does Using a Breakfast Cart Work Best?
Using a breakfast cart works particularly well in middle and high schools, but it has also been successful in elementary schools. Here are some other qualities where using a breakfast cart is likely to be particularly successful:
• The cafeteria is located apart from where students hang out • Environment service staff are supportive of serving breakfast at school • The breakfast menu can easily be made into Grab ‘N’ Go breakfasts • There is one main area of the school where students tend to gather • The cafeteria tends to be congested or is too small to serve breakfast
page 33Creating a Model Food Service Program In West Virginia
Policy Change Strategies
Eliminating the Reduced Price Fee for Breakfast and/or Lunch:
How Does the Elimination for Reduced Price Breakfast Work?
Schools that eliminate reduced price for breakfast only offer their students two prices for breakfast – free and full price. Students that qualify for reduced price meals receive their breakfast for free in this model. This works well in schools with a high percentage of students that qualify for free and reduced price meals, but have low participation of reduced price students.
The school serves reimbursable breakfasts as it normally does. The only difference is that a breakfast is offered at no charge to students who qualify for reduced price meals. Even though the school only uses two categories for charging students, the school still receives federal reimbursement at the correct income category for each student. No additional money is provided from the Federal government to cover the cost of the reduced price students that are provided free meals.
Schools that eliminate reduced price charges for breakfasts often see an increase in participation in the lunch program, too. Many schools find that federal reimbursements are enough to cover the cost of serving free breakfast to this group of students.
Why Eliminate Reduced Price Breakfasts?
When you eliminate reduced price charges for breakfasts, more students eat breakfast. Offering breakfast for free to students that qualify for reduced price meals removes any financial barrier that these students may experience. The more students who eat breakfast the better their overall diet quality, attendance, tardiness, behavior and test scores. In addition, more revenue is generated from the federal government if more students eat breakfast.
When Does Eliminating Reduced Price for Breakfast Work Best?
Eliminating reduced price for breakfasts works well in schools with low breakfast participation from reduced price students. Here are some other qualities where eliminating reduced price breakfasts are likely to be successful:
• High free and reduced approval rate at school; • Additional staffing is not necessary to handle the increase in participation; • Staff are supportive of breakfast and realize its importance to learning; and• Breakfast is easily accessible to students.

page 34 The Playbook
Universal Free Breakfast Programs: Providing breakfast at no charge to all students, often called “universal free”, helps remove the stigma for low-income children of participation in the school breakfast program.
Why have universal free breakfast programs?
Many children do not eat a nutritious breakfast every morning.
• Many families are living on very tight budgets and can’t afford to provide good breakfasts at home every day, nor the money to buy them at school.
• Regardless of income, families today live busy lives, with long commutes and long and nontraditional work hours that often make it difficult to sit down at home in the morning to eat a nutritious breakfast.
Universal School Breakfast increases student participation in breakfast.
• Many students who are eligible for free or reduced price school breakfast do not participate because they do not wish to identify themselves as low-income by eating school breakfast. Providing breakfast at no charge to all students helps remove the stigma for low-income children of participation in the school breakfast program.
• Nationally, only 47 children eat federally-funded free or reduced price school breakfasts for every 100 who receive free or reduced price school lunch. Studies show that Universal School Breakfast programs dramatically increase student participation in school breakfast.
• Some Universal School Breakfast programs provide breakfast in the classroom when school starts in the morning, rather than in the cafeteria before school starts, which makes it easier for children to participate.
Universal School Breakfast improves student achievement, diets and behavior.
• Studies conclude that students who eat school breakfast at the start of the school day show a general increase in math and reading scores as well as improvement in their speed and memory on cognitive tests.
• Children who eat breakfast at school – closer to class and test-taking time – perform better on standardized tests than those who skip breakfast or eat breakfast at home.
• Children who have school breakfast eat more fruit, drink more milk, and consume a wider variety of foods than those who don’t eat breakfast or have breakfast at home.
• Schools that provide breakfast in the classroom at no cost to all students report decreases in discipline and psychological problems, visits to school nurses and tardiness; increases in student attentiveness and attendance; and generally improved learning environments.

“Without self-discipline, succ
ess is impossible,
period.” - Lou Holtz
Policies and Procedures

page 36 The Playbook
page 37Creating a Model Food Service Program In West Virginia
Child nutrition programs in West Virginia have federal regulations, state board policies and state code that govern the operations in our schools. This playbook contains what you need to know in order to have a model food service program.
Code of Federal Regulation (7CFR) Subchapter A
Subchapter A of 7CFR sets forth the requirements for participation in the National School Lunch and Commodity School Programs. It specifies Program responsibilities of State and local officials in the areas of program administration, preparation and service of nutritious lunches, payment of funds, use of program funds, program monitoring, and reporting and recordkeeping requirements.
West Virginia Board of Education Policy 4320, Policies of Operations Manual
This procedural rule establishes operational policy that enhances child nutrition and provides for efficient operation of the programs. These procedures relate to the school breakfast, school lunch, special milk, after-school care and nutrition education programs.
The mission of the Office of Child Nutrition is to enhance learning and quality of life through nutrition education and nutrition services. The primary purpose of the food service program is to provide the opportunity to meet each participant’s nutritional needs: the child in school, the child in institutional surroundings, the special needs child, the child in day care and the functionally impaired adult in day care. An effective nutrition program makes available to all participants a nutritionally adequate, affordable breakfast and lunch that support health and learning. Snacks are added as needed for the participants.
All meal service in the dining area shall conform to the nutritional standards prescribed and shall be priced and served as a unit. Any other food or beverage served at any time during the day shall provide protein, vitamins and minerals in a satisfactory balance with calories in order to contribute to the nutritional quality of the meals served.
West Virginia Board of Education Policy 4321.1, Standards for School Nutrition
This legislative rule establishes nutrition standards for foods sold, served and/or distributed to students in schools during the school day. The procedures relate both to nutritional standards of school meals and other foods and beverages sold, served or distributed to students. Further, this rule includes recommendations pertaining to all foods sold, served or distributed on school premises.
Research has shown that schools play an important role in shaping student health behaviors. Students spend a major part of their day in the school environment. It is vital that this environment support the development of a healthy lifestyle, offer opportunities for students to make healthy and informed selections, and prepare students for academic success. In West Virginia schools, federally funded school nutrition programs are available to provide nutritious foods to all students. It is intended that these child nutrition programs be the main source of foods and beverages available at school. These programs have specific requirements to ensure that adequate nutrients are offered to promote health. Other foods and beverages, when available, should also provide necessary nutrients and contribute to an overall healthy eating environment. Schools are uniquely positioned to model and reinforce these healthful eating behaviors. This policy reflects an integrated approach to ensuring a school environment that promotes optimal nutrition for all students. The intent of this policy is to encourage and enable schools to provide students with nutritious food and beverage choices that will enhance learning and promote healthy behaviors that can be maintained throughout life.
FOLLOWING THE RULES:Policies and Procedures

page 38 The Playbook
In short, this comprehensive guideline is helping schools lay a healthy foundation for our students’ success by implementing policies that encourage them to eat breakfast and lunch at school, create opportunities for successful and healthy fundraisers, provide healthy snack choices, support academic achievement with alternatives other than food as a reward and hosting classroom celebrations that are healthy and fun! We challenge superintendents, principals, teachers, parents and communities to get more involved.
www.wvsmartfoods.com
The Smart Food = Smarter Kids campaign was designed to bring the policy to life by enabling local nutrition directors to take the lead in engaging parents, students, schools and community leaders in improving school nutrition. An online toolkit, available atwww.wvsmartfoods.com, is being used by parents, students, schools and communities involved in efforts to improve school nutrition. It is organized around five key aspects of the state’s school nutrition policy: Eating at School is Cool, Fruitful Fundraising, Healthy Snacks, Rewarding Success and Let’s Party, Let’s Play. In addition, www.wvsmartfoods.com offers healthy recipes, school success stories, customized promotional tools and a food label nutrition calculator to see if various food items comply with state policy.
Healthy, Hunger-Free Kids Act of 2010 (Child Nutrition Reauthorization or CNR)
The Healthy, Hunger-Free Kids Act of 2010 (the Act), Public Law 111-296, was signed into law by the President on December 13, 2010. The Child Nutrition Reauthorization of 2010 makes many important improvements to the Child Nutrition Programs that serve millions of children across the United States each day.
The CNR provides for improved access to nutrition assistance through program expansion, outreach, and provisions that make it easier for children to get nutritious meals when they are away from home. The Act not only improves the nutrition quality of school meals, but improves the entire nutrition environment in schools. The Act enhances our understanding of the causes and consequences of hunger and food insecurity among children and helps inform future policy decisions on effective means of program delivery. The Child Nutrition Reauthorization also advances the goal of solving the problem of childhood obesity.
“I use to think that it was not fair that the kids could not enjoy a cupcake or cookie during their party. Then, after observing the parties I realized that the kids do not really care what they eat so long as they can enjoy their friends, play games, and have fun. It seems to be the parents who care. We should step out of the way and let the overall push to eat better take hold in the school. An apple is a better snack than a cupcake. I cannot imagine who would argue with that.”
Carrie Fenwick, Parent, Overbrook Elementary
PenaltiesBarriers to a
Successful Program
“Show class, have pride, and display character. If you do, winning takes care of itself.” - Bear Bryant

page 40 The Playbook

page 41Creating a Model Food Service Program In West Virginia
PENALTIES:Barriers to a Successful Program
Often, schools and administrators will directly or indirectly permit situations that undermine the opportunity for students to participate in the school meals programs. By addressing these barriers, students will be able to benefit from the nutrition programs that afford them an opportunity to be well nourished and ready to learn. Some examples of these practices are as follows:
School Parties – School parties that serve foods and beverages and are scheduled prior to the meal service periods interfere with the nutrition program’s ability to provide the student with a well-balanced nutritious meal. These parties often compete with the child’s appetite resulting in plate waste and loss of nutrients for the student. School parties should be scheduled in the afternoon, after both school breakfast and lunch have been served.
Scheduling - Many times, due to scheduling difficulties, students are not allocated enough time to eat during the meal service periods. This practice manifests itself in long wait lines and poor participation. The breakfast meal service period should be scheduled to allow each student ten minutes to consume their meal once they have been seated. The lunch meal service period should be scheduled to allow each student twenty minutes to consume their meal once they have been seated. Meal service periods should be planned in such a way as to ensure that each student is given enough time to participate and enjoy their meal.
Administrative Practices – Administrative practice should promote the nutrition program as a part of the instructional day rather than an interruption to the instructional day. Combined serving periods, limited seating, competing school sponsored activities and the lack of administrative support negatively impact participation in the school meals programs. School staff should also be encouraged to dine and interact with the students during the meal service periods.
Cafeteria Environment – The dining environment should be conducive to student participation. The cafeteria should be inviting and conducive to participation. The meal service period is a break in the day that should allow students an opportunity to refuel and socialize. Highly structured monitoring systems such as “traffic lights” and “coaching whistles” establishes a negative environment.
Detention Hall – All students must have an equal opportunity to participate in the school meals programs. Unless a student is considered a threat to the general population, student detention should occur after the student has an opportunity to have breakfast or lunch.
Fundraisers - All school fundraising activities involving foods and beverages that occur during the school day should meet the nutritional standards set forth in Policy 4321.1, Standards for School Nutrition. Additionally, all fundraising activities should not interfere or negatively impact meal times. School sponsored fundraisers such as donut sales, pizza sales, soda sales and local restaurant promotions should be avoided.
Teacher Influence – The teaching staff should encourage student participation in the school meal programs. Rewarding students with lunch privileges in the teachers’ lounge and the delivery of fast foods from outside vendors should not occur.
D-HALL

page 42 The Playbook

Home
52455829
Visitors
52455829
Stats
PassRun
Total Yards
Points
Team Statistics
“I learned that if you want to make it bad enough, n
o
matter how bad it is, you can make it.” - G
ale Sayers
County Level Data

page 44 The Playbook
page 45Creating a Model Food Service Program In West Virginia
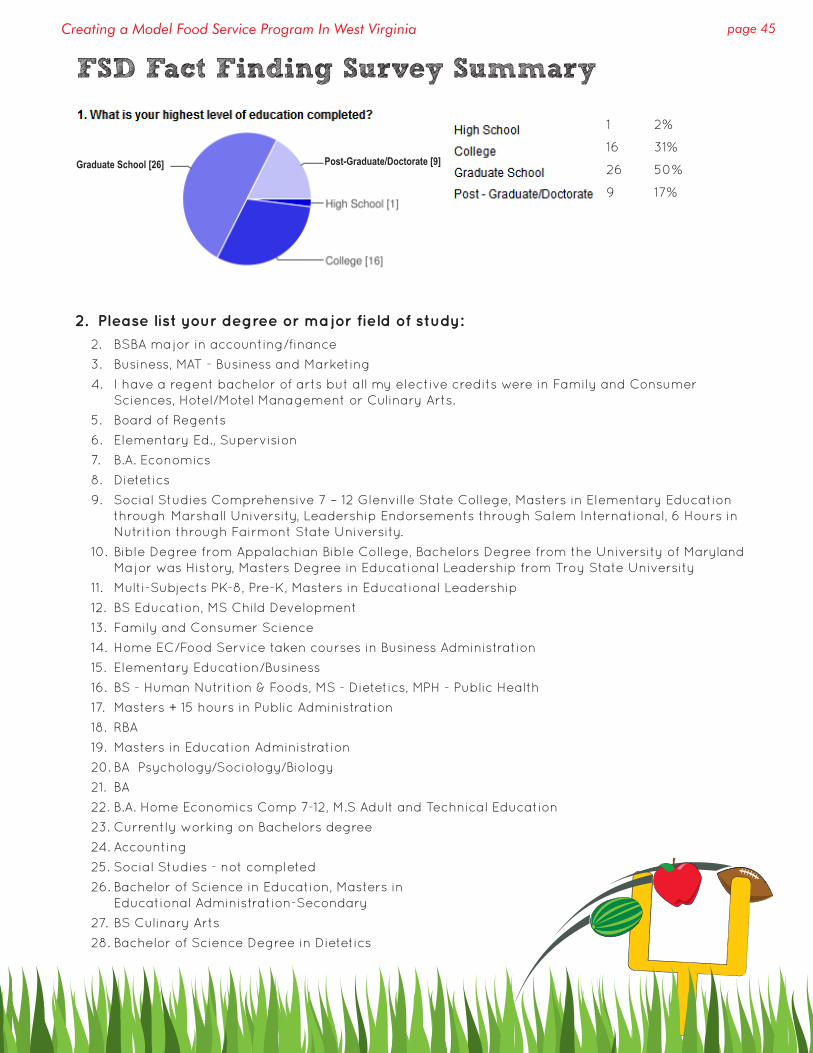
2. Please list your degree or major field of study:2. BSBA major in accounting/finance
3. Business, MAT - Business and Marketing
4. I have a regent bachelor of arts but all my elective credits were in Family and Consumer Sciences, Hotel/Motel Management or Culinary Arts.
5. Board of Regents
6. Elementary Ed., Supervision
7. B.A. Economics
8. Dietetics
9. Social Studies Comprehensive 7 – 12 Glenville State College, Masters in Elementary Education through Marshall University, Leadership Endorsements through Salem International, 6 Hours in Nutrition through Fairmont State University.
10. Bible Degree from Appalachian Bible College, Bachelors Degree from the University of Maryland Major was History, Masters Degree in Educational Leadership from Troy State University
11. Multi-Subjects PK-8, Pre-K, Masters in Educational Leadership
12. BS Education, MS Child Development
13. Family and Consumer Science
14. Home EC/Food Service taken courses in Business Administration
15. Elementary Education/Business
16. BS - Human Nutrition & Foods, MS - Dietetics, MPH - Public Health
17. Masters + 15 hours in Public Administration
18. RBA
19. Masters in Education Administration
20. BA Psychology/Sociology/Biology
21. BA
22. B.A. Home Economics Comp 7-12, M.S Adult and Technical Education
23. Currently working on Bachelors degree
24. Accounting
25. Social Studies - not completed
26. Bachelor of Science in Education, Masters in Educational Administration-Secondary
27. BS Culinary Arts
28. Bachelor of Science Degree in Dietetics
FSD Fact Finding Survey Summary
1 2%
16 31%
26 50%
9 17%
Graduate School [26] Post-Graduate/Doctorate [9]
page 46 The Playbook
29. Master of Science in Nursing
30. BUSINESS ADMINISTRATION, MASTERS, NUTRITION AND DIETETICS, BS
31. BS in Education--Home Economics, MS in Curriculum & Instruction
32. Master of Arts--Reading K-Adult, Bachelor of Arts--Home Economics Education grades 5-12
33. Masters in Educational Administration with a Food Service Certificate
34. Human Nutrition--BS Degree, Community Health Education--MS Degree
35. BS - Dietetics, MS - Foods and Nutrition
36. Masters of ED. Elementary Ed. K-6, Special Ed. K-12
37. B.S. HOME ECONOMICS with electives done on Food Service., M.A. HOME ECONOMICS EDUCATION
38. BS in Family Resources, MA in Home Economics
39. BS - DIETETICS, MA - EDUCATION
40. Bachelors of Science -- Vocational Home Economics -- Concord, Masters of Education -- Vocational Education --Marshall
41. Educational Leadership
42. BS in Elem Ed and Multi Cat, MA in Educational Leadership
43. BA in Education (teaching fields - Family & Consumer Science, General Science, Math through Algebra I), MA in Education (Curriculum & Instruction, Educational Leadership)
44. Administrative k-adult, Masters Special Education k-adult, BA Elementary Education
45. Family and Consumer Science B.S, Reading M.A., Administration
46. Family & Consumer Science AB grades 5-12, Family & Consumer Science Masters with emphasis on early ed. and counseling, Administration Certification
47. Social Work, Art , Leadership
48. Nutrition & Dietetics
49. Bachelor of Science in Hospital Dietetics, Master of Science in Health Care Administration
50. Bachelor Degree in Business Administration
51. Regents Bachelor of Arts - plus approximately 9 hrs of Nutrition classes at the Graduate level.
52. Industrial Arts 7 - 12, 5 - 6 endorsements, Education Administration 7 - 12, Child Nutrition (renewed yearly) (6 hours graduate credit)
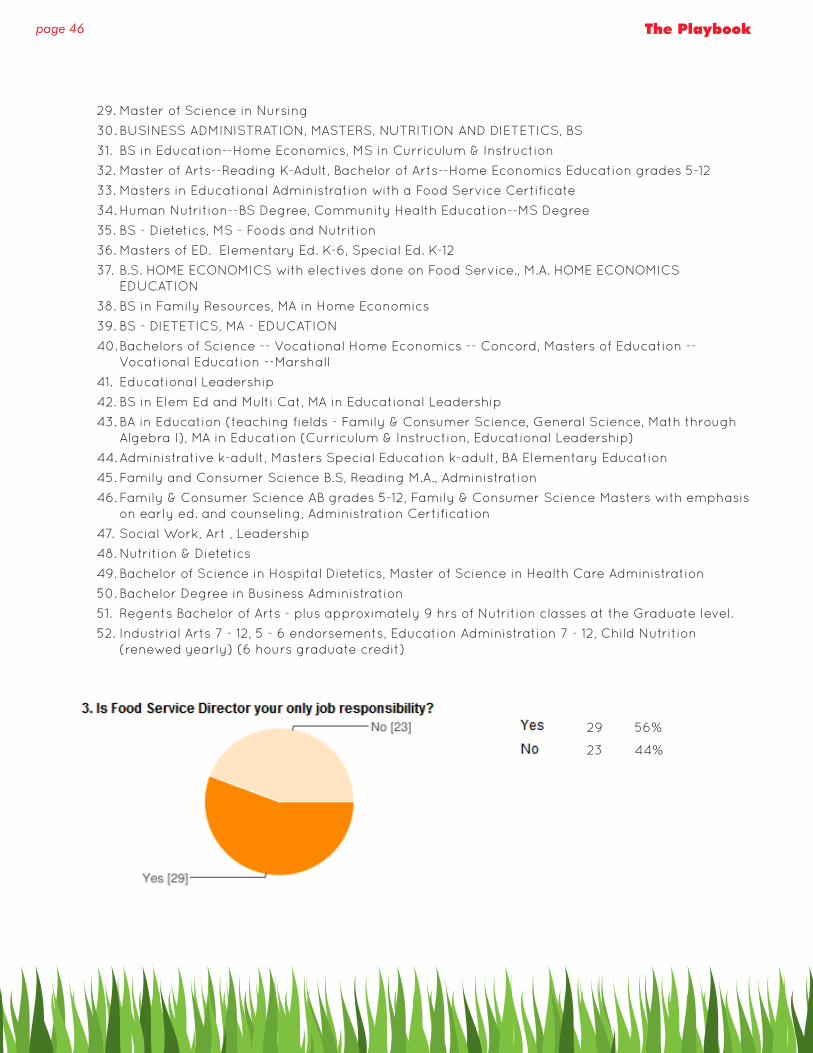
29 56%
23 44%

page 47Creating a Model Food Service Program In West Virginia
4. If your answer to question 3 “was no” what other titles or key responsibilities do you have? (Please List.)
1. Ex. Secretary to the Superintendent, Food Service Director, Certification clerk, Call-out Person for service personnel substitutes, Fingerprinting for all new employees, Grievance person - tape and transcribe, Board Members secretary, Other duties as assigned
2. None
3. Director Career and Technical Education
4. My answer was yes but it made me put an answer in order to get out of survey!
5. Public Relations
6. Head Start Director, Title IX
7. Co-coordinator of Staff Development for service personnel.
8. x
9. Transportation Director
10. Operations Director.
11. Transportation Director, Staff Development for Service Personnel
12. Coordinator of Health and Physical Education
13. Service personnel staff development
14. none
15. Administer the CACFP in five counties
16. I answered yes to #3, but it wouldn’t let me go on. This is my only responsibility.
17. N/A
18. My answer was yes... this is enough to do!!!!
19. General Supervisor, WVEIS Contact, School Calendar Coordinator,Policy Coordinator, Discipline Coordinator, Community School Relations Coordinator
20. N/A
21. Staff Development
22. None
23. N/A
24. Food service is the only responsibility
25. None
26. Food Service IS my only job Responsibility
27. None
28. None
29. NA
30. Answer was yes
31. County Test Coordinator
32. Child Nutrition, Supervise School Nurses/Health Services, Title IV, Textbook Adoption, PASS Program, Science Fair
33. Food Service Director, Technology Director, Elementary Educational Supervisor of some schools, E-Rate
34. None
35. Part time - 110 days
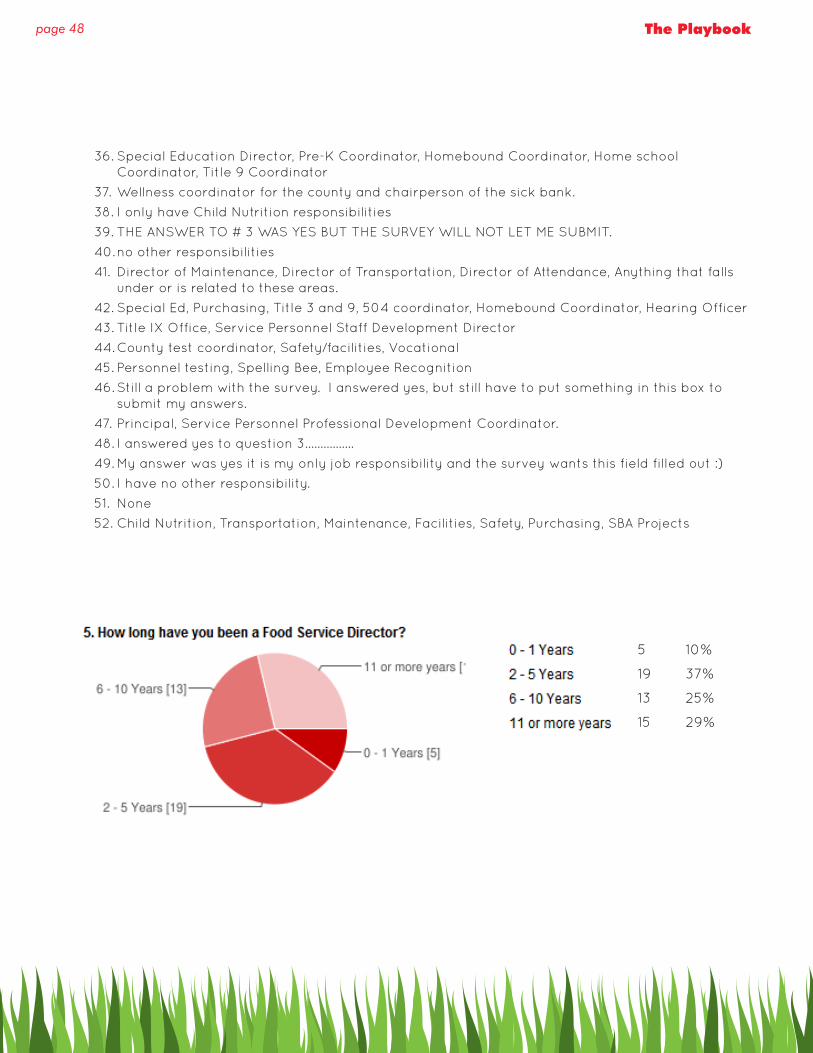
page 48 The Playbook
36. Special Education Director, Pre-K Coordinator, Homebound Coordinator, Home school Coordinator, Title 9 Coordinator
37. Wellness coordinator for the county and chairperson of the sick bank.
38. I only have Child Nutrition responsibilities
39. THE ANSWER TO # 3 WAS YES BUT THE SURVEY WILL NOT LET ME SUBMIT.
40. no other responsibilities
41. Director of Maintenance, Director of Transportation, Director of Attendance, Anything that falls under or is related to these areas.
42. Special Ed, Purchasing, Title 3 and 9, 504 coordinator, Homebound Coordinator, Hearing Officer
43. Title IX Office, Service Personnel Staff Development Director
44. County test coordinator, Safety/facilities, Vocational
45. Personnel testing, Spelling Bee, Employee Recognition
46. Still a problem with the survey. I answered yes, but still have to put something in this box to submit my answers.
47. Principal, Service Personnel Professional Development Coordinator.
48. I answered yes to question 3................
49. My answer was yes it is my only job responsibility and the survey wants this field filled out :)
50. I have no other responsibility.
51. None
52. Child Nutrition, Transportation, Maintenance, Facilities, Safety, Purchasing, SBA Projects
5 10%
19 37%
13 25%
15 29%
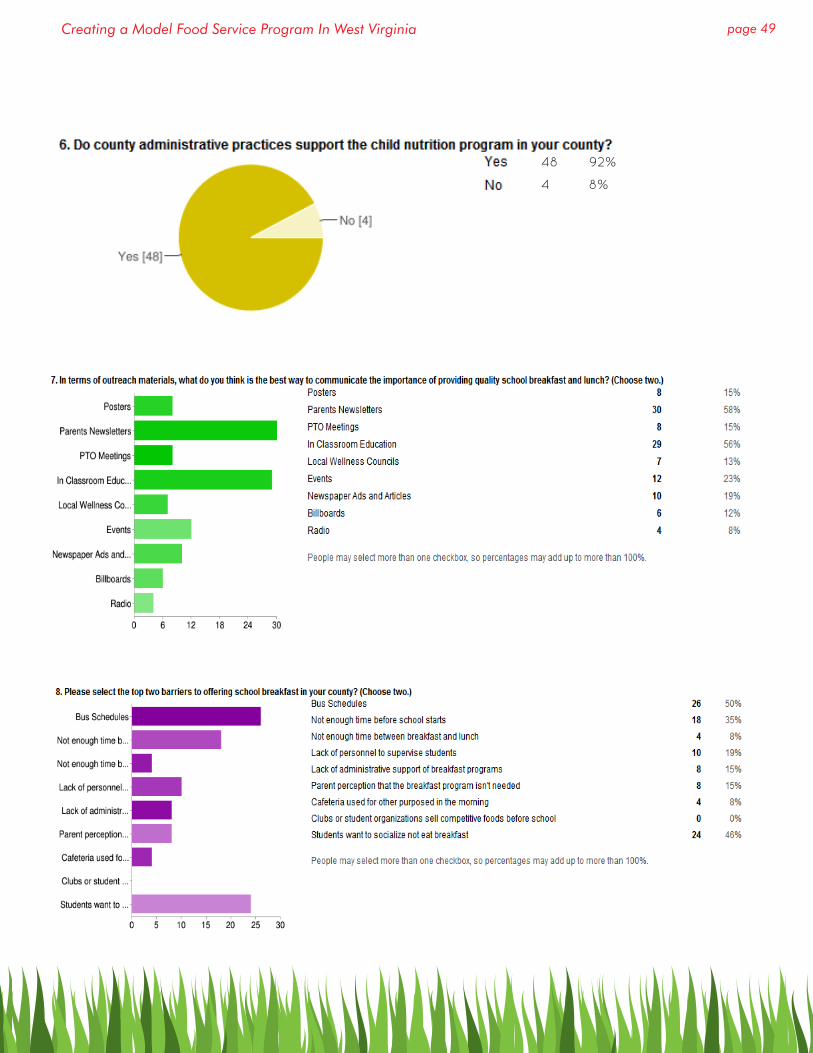
page 49Creating a Model Food Service Program In West Virginia
48 92%
4 8%

page 50 The Playbook
1
0
7
44
1 2%
0 0%
7 13%
44 85%
0 0%
0 0%
5 10%
47 90%
5 10%
0 0%
7 13%
40 77%
5 10%
0 0%
7 13%
40 77%
5 10%
0 0%
7 13%
40 77%
None of the Schools [44]
None of the Schools [47]
None of the Schools [30]
None of the Schools [40]

page 51Creating a Model Food Service Program In West Virginia
13. What is the most challenging thing about being a Food Service Director?1. Wearing too many hats - you only scratch the surface of one hat and then you move to the
next hat. Not being able to be out in the schools. No support from principals - When you are in their school they are on the same page with you, but when you leave they let things go against the policy you have just spoken to them on. Some time you are not respected by higher up because you do not have a degree.
2. Convincing the cooks to prepare food and present food that the students will want to eat
3. Not having enough time to fulfill all of the responsibilities of the job.
4. There is more than one “big” challenge. The first being responsible for the Wellness Policy and all food sold and served in the school in addition to all of the other duties we have. If it is done correctly the wellness policy could easily consume nearly 50% of your time.
5. Getting administrators on board with the child nutrition program.
6. Preparing Menus that meet requirements time for monitoring adequately
7. Trying to get the products that the students like and still meet the child nutrition guidelines and menus.
8. The time factor to keep all the different programs running smoothly.
9. Trying to meet the demands of a nutritious student meal and keep it within budget. Also, trying to educate the parents and students to eat more balanced and healthy meals.
10. Collecting lunch bills, universal feeding would make everyone’s job easier and allow us to concentrate on the more important aspect of feeding healthier and more nutritious meals
11. Menu
12. SMI - staying within the guidelines for sodium, fat, calories, etc. Balancing the many aspects of the job. Wellness is becoming a full time job.
13. Jumping from one issue to another.
14. Meeting all the federal regulations because they are constantly changing.Not enough staffing in certain areas.Completion of reports overseeing schools while at the same time running a dept- ordering, equipment breakdown pos problems, parentproblems financial etc
15. Health and Wellness
16. Lack of training regarding responsibilities.
17. Getting students to eat the healthier food.
18. No support from superior administration. (Too many chiefs and not enough WORKERS!!) We are a growing county with no help in sight.
19. The idea of Child Nutrition not being important.
20. Time to complete all that is needed. I love my profession. I have a deep passion for feeding students and wish I had more time to devote to doing more than is expected and really make a difference.
21. Having quality time to plan, organize, and promote the school breakfast and lunch program.
22. Misinformation and a lack of understanding about the requirements we have to meet.
23. Having the time to adequately give each aspect of my job the proper attention. Our office is staffed with 2 people and 8200 students.
24. Time
25. All the required paper work.
26. Feeding students, foods they will eat while meeting state and federal guidelines.
27. Offer Vs Serve (Clarification)

page 52 The Playbook
28. Getting teachers and some principles to understand the importance of our foodservice program.
29. The time to get everything done and the paperwork involved is the most challenging.
30. Parents who believe their students are “ENTITLED” to free meals but refuse to apply or are ABOVE the eligibility guidelines and REFUSE to pay when their student receives meals.
31. Planning meals that students will eat and meeting state regulations for salt. Collecting bills from parents.
32. Collection of debt--time consumingPrimero Edge--requires a lot of my time to provide support to schools/county levels of daily reconciling sessions, deposits, end of month closings, etc--most of the secretaries do not have accounting backgrounds. NutriKids—I like the information—program is very invasive and not really user friendly, requires a lot of time to build menus/recipes.
33. Finding the time to do all the food service responsibilities.
34. Having time to get everything that is required of us done. Personnel issues take up so much of my time that it is hard to get much of anything else done each day.
35. Local Wellness
36. Enough time to be productive
37. Lunch bills and the time that it takes to deal with parent complaints.Working with school staff and their lack of knowledge about nutrition and the school meal program.
38. Everything in this program is very challenging! Working with Principals about the importance of having more than one lunch period so more kids can eat, working with Parents on paying for their lunch bills, working with nurses and parents on special diets, learning the program of Primero, planning wellness events or activities for 22 schools, making HACCP procedures different for each school building in your district, how to handle Pre-K/Daycare sites.
39. GETTING ENOUGH STAFF FOR THE CHILD NUTRITION OFFICE TO SUPPORT THE PROGRAMS.
40. Having both county and school administrators consider Child Nutrition as a valuable part of a child’s education and part of their school day.
41. Trying to balance all the hats I wear with the job of Food Service. Also, meeting the current guidelines while getting ready for the more restrictive guidelines coming. Also, trying to make sure the new guidelines will allow us to serve food that students will eat so it doesn’t taste like wall paper paste but within budgetary limits with labor and supply and material costs.
42. Too many duties/hats that I cannot devote the time truly needed to promote/support the program as it should be.
43. The balancing act between the business side and the nutrition side
44. Time
45. Implementing change at the school level.
46. Time. It seems that more responsibility is taken from the schools, but put on this office with no additional help in this office. I work many long hours and often take work home. I put in no less than 10-12 hour days. Various times throughout the year those hours are longer.
47. Other Responsibilities
48. Collecting lunch bills
49. Being ignored by Principals when it comes to compliance with Policy 4321.1.
50. Menu planning.
51. Wellness Policy - we cannot commit our counties to additional expense due to the need for more educational materials or additional Phys. Ed. teachers in order to increase activity time. Our teachers have increased their activity time on their own but it is still not at the level that it should be.
52. Nutritionals, menu planning
page 53Creating a Model Food Service Program In West Virginia
14. What is the most rewarding thing about being a Food Service Director?1. Knowing that you are providing two healthy meals to children that may not receive a meal
after they leave at the end of a school day.
2. The smile on a student’s face when they enter the cafeteria
3. Feed children
4. I feel good knowing that we give the kids the highest quality meal possible with the resources we have. We have too many hungry kids when they return to school from a weekend or week at home. They will tell you that their Mom or often it is the Dad does not cook!
5. Watching children eat healthy meals!
6. Being part of a program that provides food to children.
7. Knowing that the students who may not really get a nourishing meal at home - do get one here at school.
8. Knowing that children receive two nutritional meals per day while they are in our care.
9. Knowing at the end of the day that 2100 students had the opportunity to receive both a healthy, nutritious breakfast and lunch.
10. At the end of the day our efforts, however feeble or frustrating, have gone toward feeding students healthy and nutritious meals
11. Once children and people buy into the new healthier choices or ideas
12. At last we’re finally making progress and getting people’s attention concerning nutrition and physical activity.
13. Working with the cooks; feeding the kids
14. Feeding children who home life is terrible.
15. Knowing that some students, who otherwise do not have nutritionally balanced meals at home, are offered a variety of foods through our lunch program.
16. Making a difference and implementing healthier options
17. Interaction with the students when getting feedback on the meals & when they give me suggestions for new foods to try.
18. It’s rewarding to see improvements and to see things turn around. However, the amount of work is overwhelming.
19. ?
20. Watching chances take place that can last a lifetime!
21. Everything. My passion for this position far outweighs the time needed to just make it by. I want to see these children thrive well after they leave the school system! I will take things home just to be sure I can get all that is needed to do the best I can for these children and my staff.
22. Feeding those children that you know have not been fed at home.
23. Knowing that at the end of the day the students have had a nutritious meal that they may not receive at home.
24. Feeding students
25. Knowing that I make a difference in the lives of students who depend on the school meal program for their nutritional needs.
26. Seeing happy healthy students in our schools.
27. Feeding the students and seeing their smiling faces.
28. Providing the kids with a well balanced meal every day.
29. Feeding healthy meals to those children you know are hungry.

page 54 The Playbook
30. Providing the students of the county with nutritious and appetizing meals. Working with an outstanding group of hardworking and sometime unappreciated Cafeteria Managers and Cooks.
31. Getting rewarded for excelling.
32. Providing nutrition lessons to PTO, LSIC councils and students
33. Knowing that we provide the nutritional values for most children who would not normally receive a nutritional meal at home.
34. Seeing the children eating well and enjoying the food that is served!
35. Enabling and assisting school foodservice staff to feed children
36. Working in a program which can help all the students
37. Knowing that the meals that are being offered are health, plentiful and available to any child that is hungry.
38. Seeing hungry kids eat.
39. SEEING STUDENTS MAKING HEALTHY CHOICES! WE ARE NOW SEEING THIS WITH THE OLDER STUDENTS WHO WERE INTORDUCED TO FRESH FRUITS AND VEGETABLES IN THE ELEMENTARY SCHOOLS. YEA!!!!
40. Working with the children, visiting the schools and speaking with them about what they eat and why.
41. Seeing kids eat and enjoy the food being served.
42. I know that my decisions impact the kids and kids who need fed are greeting good meal choices.
43. Feeding the children - well-fed children learn and behave better
44. Ability to help students
45. Getting to try things like breakfast after first.
46. Knowing that I have assisted in putting a nutritious meal in front of a child that may otherwise not receive either a nutritious meal or a meal at all.
47. Wonderful staff
48. That I have a Job
49. The most rewarding part of my job is the little things. Like the child who gets to taste a fresh strawberry for the first time in their life. Or the child who tells you how much they love the cooks at their school and how good the meals are. Or the parent or grandparent, who is so grateful when you help lift one more burden from their shoulders by helping them qualify for meal benefits for their children.
50. Watching a student eat a breakfast or lunch. You can see on their faces the enjoyment. Some students this may be the only meal they will be receiving for that day.
51. Seeing that students are nourished during the school day as we know that some students have very limited access to foods at home.
Increased awareness contributing to childhood obesity.
22 42%
18 35%
42 81%
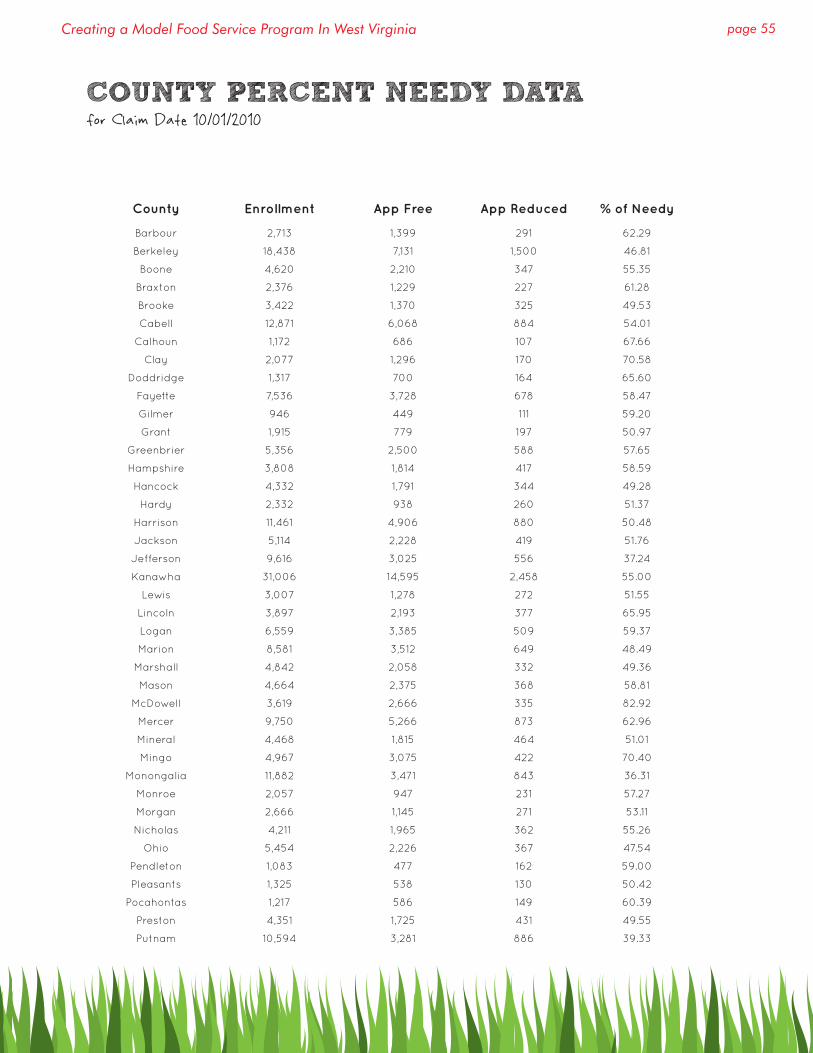
page 55Creating a Model Food Service Program In West Virginia
COUNTY PERCENT NEEDY DATAfor Claim Date 10/01/2010
County Enrollment App Free App Reduced % of Needy
Barbour 2,713 1,399 291 62.29
Berkeley 18,438 7,131 1,500 46.81
Boone 4,620 2,210 347 55.35
Braxton 2,376 1,229 227 61.28
Brooke 3,422 1,370 325 49.53
Cabell 12,871 6,068 884 54.01
Calhoun 1,172 686 107 67.66
Clay 2,077 1,296 170 70.58
Doddridge 1,317 700 164 65.60
Fayette 7,536 3,728 678 58.47
Gilmer 946 449 111 59.20
Grant 1,915 779 197 50.97
Greenbrier 5,356 2,500 588 57.65
Hampshire 3,808 1,814 417 58.59
Hancock 4,332 1,791 344 49.28
Hardy 2,332 938 260 51.37
Harrison 11,461 4,906 880 50.48
Jackson 5,114 2,228 419 51.76
Jefferson 9,616 3,025 556 37.24
Kanawha 31,006 14,595 2,458 55.00
Lewis 3,007 1,278 272 51.55
Lincoln 3,897 2,193 377 65.95
Logan 6,559 3,385 509 59.37
Marion 8,581 3,512 649 48.49
Marshall 4,842 2,058 332 49.36
Mason 4,664 2,375 368 58.81
McDowell 3,619 2,666 335 82.92
Mercer 9,750 5,266 873 62.96
Mineral 4,468 1,815 464 51.01
Mingo 4,967 3,075 422 70.40
Monongalia 11,882 3,471 843 36.31
Monroe 2,057 947 231 57.27
Morgan 2,666 1,145 271 53.11
Nicholas 4,211 1,965 362 55.26
Ohio 5,454 2,226 367 47.54
Pendleton 1,083 477 162 59.00
Pleasants 1,325 538 130 50.42
Pocahontas 1,217 586 149 60.39
Preston 4,351 1,725 431 49.55
Putnam 10,594 3,281 886 39.33
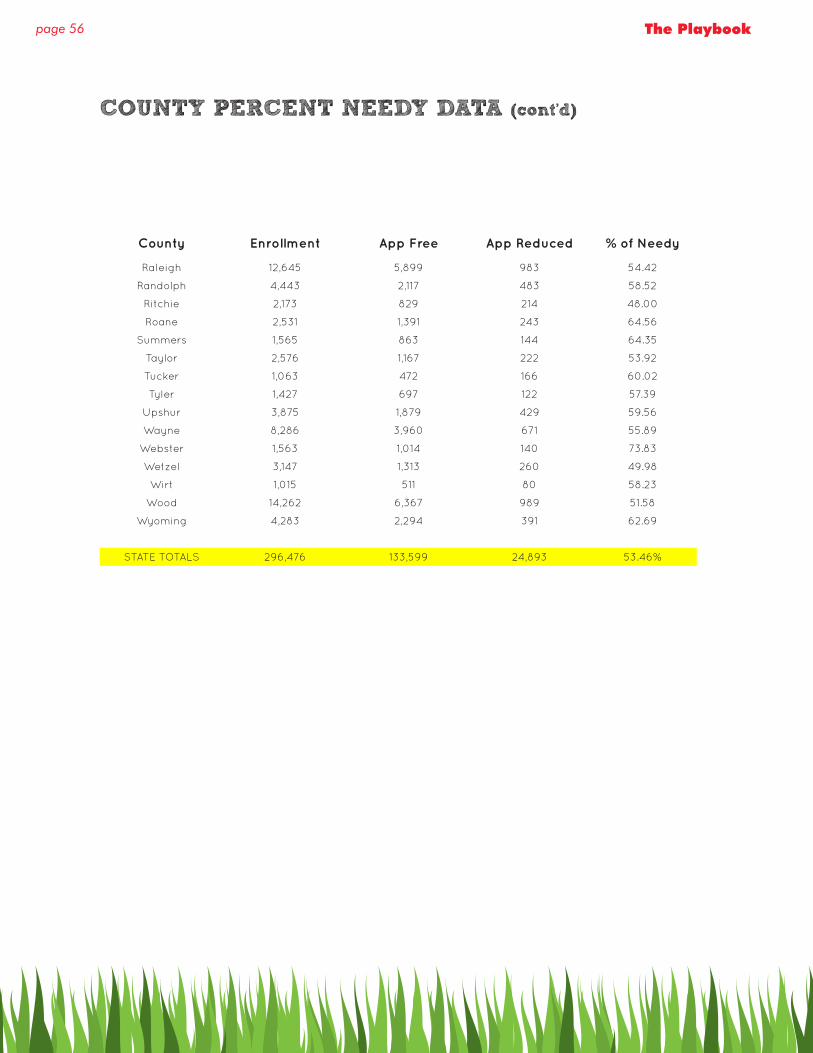
page 56 The Playbook
COUNTY PERCENT NEEDY DATA (cont’d)
County Enrollment App Free App Reduced % of Needy
Raleigh 12,645 5,899 983 54.42
Randolph 4,443 2,117 483 58.52
Ritchie 2,173 829 214 48.00
Roane 2,531 1,391 243 64.56
Summers 1,565 863 144 64.35
Taylor 2,576 1,167 222 53.92
Tucker 1,063 472 166 60.02
Tyler 1,427 697 122 57.39
Upshur 3,875 1,879 429 59.56
Wayne 8,286 3,960 671 55.89
Webster 1,563 1,014 140 73.83
Wetzel 3,147 1,313 260 49.98
Wirt 1,015 511 80 58.23
Wood 14,262 6,367 989 51.58
Wyoming 4,283 2,294 391 62.69
STATE TOTALS 296,476 133,599 24,893 53.46%

page 57Creating a Model Food Service Program In West Virginia
County School Enrollment App Free App Reduced % of Needy
Barbour Belington Elementary 375 186 41 60.53
Barbour Belington Middle Sch 297 153 43 65.99
Barbour Junior Elementary 141 85 11 68.09
Barbour Kasson Elem. & Middl 204 79 25 50.98
Barbour Mount Vernon Elem. S 74 48 8 75.68
Barbour Philip Barbour High 819 413 100 62.64
Barbour Philippi Elementary 469 254 35 61.62
Barbour Philippi Middle Scho 257 135 21 60.70
Barbour Volga-Centry Element 77 46 7 68.83
TOTAL 2,713 1,399 291 62.29
Berkeley BACK CREEK VALLEY 145 67 13 55.17
Berkeley BEDINGTON ELEMENTARY 262 125 26 57.63
Berkeley BERKELEY HEIGHTS SCH 870 461 53 59.08
Berkeley BUNKER HILL ELEMENTA 401 148 35 45.64
Berkeley BURKE STREET ELEM SC 174 128 6 77.01
Berkeley EAGLE SCHOOL INTERME 737 380 67 60.65
Berkeley GERRARDSTOWN ELEMENT 269 105 23 47.58
Berkeley HEDGESVILLE ELEMENTA 662 233 54 43.35
Berkeley HEDGESVILLE HIGH SCH 1769 471 119 33.35
Berkeley HEDGESVILLE MIDDLE S 697 209 55 37.88
Berkeley INWOOD PRIMARY SCHOO 166 59 5 38.55
Berkeley MARLOWE ELEMENTARY 389 116 23 35.73
Berkeley MARTINSBURG HIGH SCH 1808 713 132 46.74
Berkeley Martinsburg North Mi 565 312 49 63.89
Berkeley MARTINSBURG SOUTH MI 897 405 75 53.51
Berkeley MILL CREEK INTERMEDI 562 227 51 49.47
Berkeley Mountain Ridge Inter 344 123 38 46.80
Berkeley MUSSELMAN HIGH SCHOO 1642 456 136 36.05
Berkeley MUSSELMAN MIDDLE SCH 1208 400 133 44.12
SCHOOL PERCENT NEEDY DATAfor Claim Date 10/01/2010

page 58 The Playbook
County School Enrollment App Free App Reduced % of Needy
Berkeley OPEQUON ELEMENTARY S 466 207 50 55.15
Berkeley ORCHARD VIEW INTERME 607 283 52 55.19
Berkeley POTOMACK INTERMEDIAT 657 248 64 47.49
Berkeley ROSEMONT ELEMENTARY 468 180 20 42.74
Berkeley SPRING MILLS MIDDLE 688 237 67 44.19
Berkeley TOMAHAWK INTERMEDIAT 627 212 52 42.11
Berkeley TUSCARORA ELEM SCHOO 376 209 25 62.23
Berkeley VALLEY VIEW ELEMENTA 603 214 54 44.44
Berkeley WINCHESTER AVENUE 379 203 23 59.63
TOTAL 18,438 7,131 1,500 46.81
Boone ASHFORD-RUMBLE ELEME 102 55 13 66.67
Boone BROOKVIEW ELEMENTARY 538 258 40 55.39
Boone JEFFREY SPENCER ELEM 117 64 10 63.25
Boone MADISON ELEMENTARY 409 185 12 48.17
Boone MADISON MIDDLE SCHOO 596 274 39 52.52
Boone NELLIS ELEMENTARY SC 115 83 8 79.13
Boone RAMAGE GRADE SCHOOL 263 161 16 67.30
Boone SCOTT HIGH SCHOOL 651 265 45 47.62
Boone SHERMAN ELEMENTARY 505 233 53 56.63
Boone SHERMAN HIGH SCHOOL 666 300 78 56.76
Boone VAN ELEMENTARY 105 62 5 63.81
Boone VAN JUNIOR SENIOR HI 253 121 10 51.78
Boone WHARTON ELEMENTARY 132 62 9 53.79
Boone WHITESVILLE ELEMENTA 168 87 9 57.14
TOTAL 4,620 2,210 347 55.35
Braxton Braxton County High 712 309 60 51.83
Braxton Braxton County Middl 653 323 76 61.10
Braxton Burnsville Schol 137 85 16 73.72
Braxton Davis Elementary 179 82 16 54.75
Braxton Flatwoods Elementary 210 102 24 60.00
Braxton Frametown Elementary 169 110 10 71.01
Braxton Little Birch Elem. 104 79 7 82.69
Braxton Sutton Elementary Sc 212 139 18 74.06
TOTAL 2,376 1,229 227 61.28
SCHOOL PERCENT NEEDY DATA (cont’d)
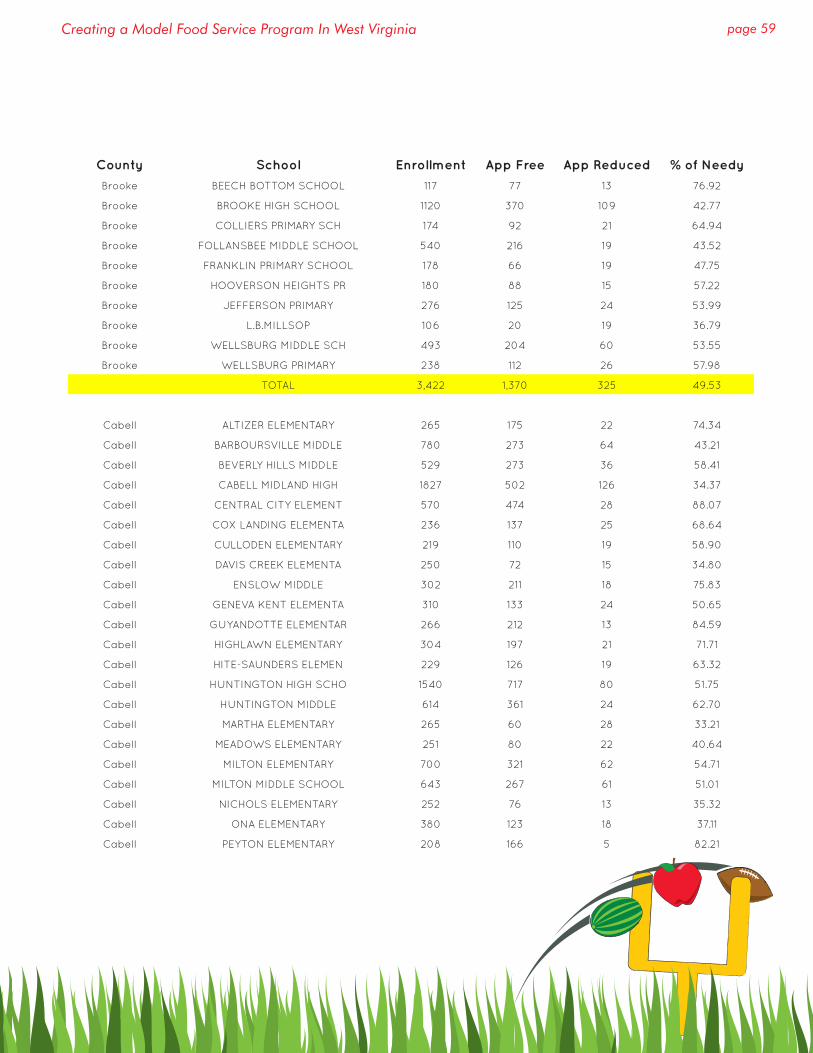
page 59Creating a Model Food Service Program In West Virginia
County School Enrollment App Free App Reduced % of Needy
Brooke BEECH BOTTOM SCHOOL 117 77 13 76.92
Brooke BROOKE HIGH SCHOOL 1120 370 109 42.77
Brooke COLLIERS PRIMARY SCH 174 92 21 64.94
Brooke FOLLANSBEE MIDDLE SCHOOL 540 216 19 43.52
Brooke FRANKLIN PRIMARY SCHOOL 178 66 19 47.75
Brooke HOOVERSON HEIGHTS PR 180 88 15 57.22
Brooke JEFFERSON PRIMARY 276 125 24 53.99
Brooke L.B.MILLSOP 106 20 19 36.79
Brooke WELLSBURG MIDDLE SCH 493 204 60 53.55
Brooke WELLSBURG PRIMARY 238 112 26 57.98
TOTAL 3,422 1,370 325 49.53
Cabell ALTIZER ELEMENTARY 265 175 22 74.34
Cabell BARBOURSVILLE MIDDLE 780 273 64 43.21
Cabell BEVERLY HILLS MIDDLE 529 273 36 58.41
Cabell CABELL MIDLAND HIGH 1827 502 126 34.37
Cabell CENTRAL CITY ELEMENT 570 474 28 88.07
Cabell COX LANDING ELEMENTA 236 137 25 68.64
Cabell CULLODEN ELEMENTARY 219 110 19 58.90
Cabell DAVIS CREEK ELEMENTA 250 72 15 34.80
Cabell ENSLOW MIDDLE 302 211 18 75.83
Cabell GENEVA KENT ELEMENTA 310 133 24 50.65
Cabell GUYANDOTTE ELEMENTAR 266 212 13 84.59
Cabell HIGHLAWN ELEMENTARY 304 197 21 71.71
Cabell HITE-SAUNDERS ELEMEN 229 126 19 63.32
Cabell HUNTINGTON HIGH SCHO 1540 717 80 51.75
Cabell HUNTINGTON MIDDLE 614 361 24 62.70
Cabell MARTHA ELEMENTARY 265 60 28 33.21
Cabell MEADOWS ELEMENTARY 251 80 22 40.64
Cabell MILTON ELEMENTARY 700 321 62 54.71
Cabell MILTON MIDDLE SCHOOL 643 267 61 51.01
Cabell NICHOLS ELEMENTARY 252 76 13 35.32
Cabell ONA ELEMENTARY 380 123 18 37.11
Cabell PEYTON ELEMENTARY 208 166 5 82.21
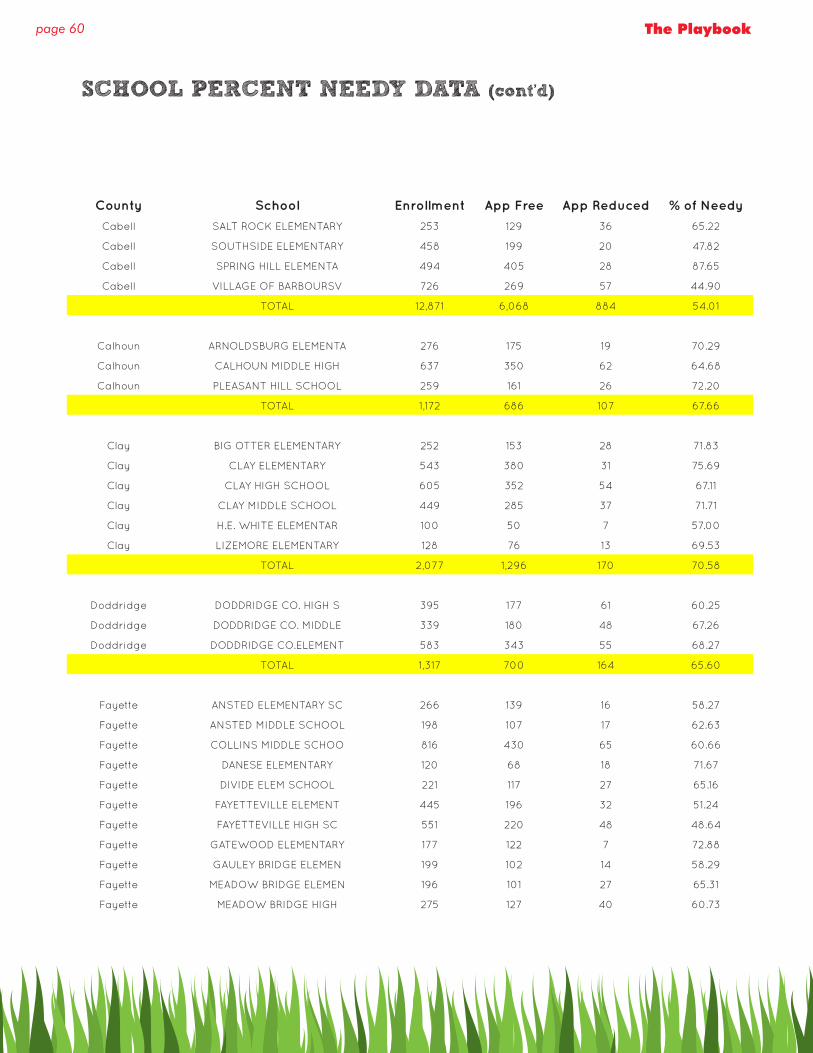
page 60 The Playbook
County School Enrollment App Free App Reduced % of Needy
Cabell SALT ROCK ELEMENTARY 253 129 36 65.22
Cabell SOUTHSIDE ELEMENTARY 458 199 20 47.82
Cabell SPRING HILL ELEMENTA 494 405 28 87.65
Cabell VILLAGE OF BARBOURSV 726 269 57 44.90
TOTAL 12,871 6,068 884 54.01
Calhoun ARNOLDSBURG ELEMENTA 276 175 19 70.29
Calhoun CALHOUN MIDDLE HIGH 637 350 62 64.68
Calhoun PLEASANT HILL SCHOOL 259 161 26 72.20
TOTAL 1,172 686 107 67.66
Clay BIG OTTER ELEMENTARY 252 153 28 71.83
Clay CLAY ELEMENTARY 543 380 31 75.69
Clay CLAY HIGH SCHOOL 605 352 54 67.11
Clay CLAY MIDDLE SCHOOL 449 285 37 71.71
Clay H.E. WHITE ELEMENTAR 100 50 7 57.00
Clay LIZEMORE ELEMENTARY 128 76 13 69.53
TOTAL 2,077 1,296 170 70.58
Doddridge DODDRIDGE CO. HIGH S 395 177 61 60.25
Doddridge DODDRIDGE CO. MIDDLE 339 180 48 67.26
Doddridge DODDRIDGE CO.ELEMENT 583 343 55 68.27
TOTAL 1,317 700 164 65.60
Fayette ANSTED ELEMENTARY SC 266 139 16 58.27
Fayette ANSTED MIDDLE SCHOOL 198 107 17 62.63
Fayette COLLINS MIDDLE SCHOO 816 430 65 60.66
Fayette DANESE ELEMENTARY 120 68 18 71.67
Fayette DIVIDE ELEM SCHOOL 221 117 27 65.16
Fayette FAYETTEVILLE ELEMENT 445 196 32 51.24
Fayette FAYETTEVILLE HIGH SC 551 220 48 48.64
Fayette GATEWOOD ELEMENTARY 177 122 7 72.88
Fayette GAULEY BRIDGE ELEMEN 199 102 14 58.29
Fayette MEADOW BRIDGE ELEMEN 196 101 27 65.31
Fayette MEADOW BRIDGE HIGH 275 127 40 60.73
SCHOOL PERCENT NEEDY DATA (cont’d)
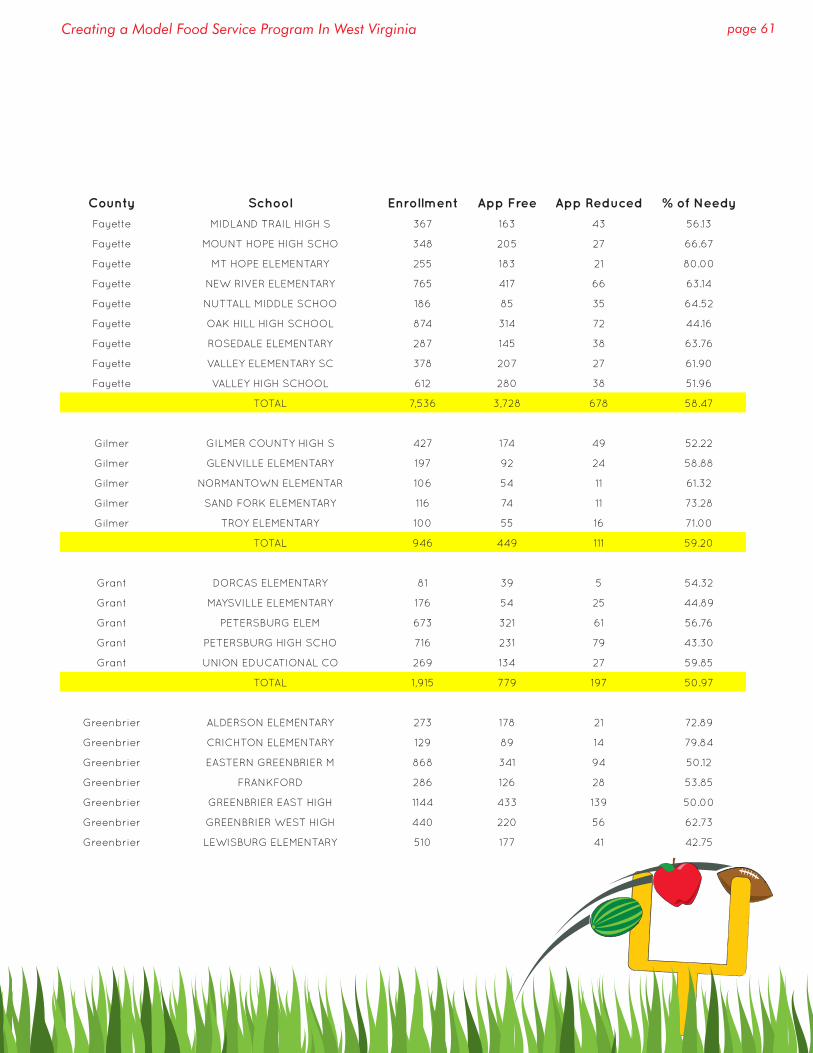
page 61Creating a Model Food Service Program In West Virginia
County School Enrollment App Free App Reduced % of Needy
Fayette MIDLAND TRAIL HIGH S 367 163 43 56.13
Fayette MOUNT HOPE HIGH SCHO 348 205 27 66.67
Fayette MT HOPE ELEMENTARY 255 183 21 80.00
Fayette NEW RIVER ELEMENTARY 765 417 66 63.14
Fayette NUTTALL MIDDLE SCHOO 186 85 35 64.52
Fayette OAK HILL HIGH SCHOOL 874 314 72 44.16
Fayette ROSEDALE ELEMENTARY 287 145 38 63.76
Fayette VALLEY ELEMENTARY SC 378 207 27 61.90
Fayette VALLEY HIGH SCHOOL 612 280 38 51.96
TOTAL 7,536 3,728 678 58.47
Gilmer GILMER COUNTY HIGH S 427 174 49 52.22
Gilmer GLENVILLE ELEMENTARY 197 92 24 58.88
Gilmer NORMANTOWN ELEMENTAR 106 54 11 61.32
Gilmer SAND FORK ELEMENTARY 116 74 11 73.28
Gilmer TROY ELEMENTARY 100 55 16 71.00
TOTAL 946 449 111 59.20
Grant DORCAS ELEMENTARY 81 39 5 54.32
Grant MAYSVILLE ELEMENTARY 176 54 25 44.89
Grant PETERSBURG ELEM 673 321 61 56.76
Grant PETERSBURG HIGH SCHO 716 231 79 43.30
Grant UNION EDUCATIONAL CO 269 134 27 59.85
TOTAL 1,915 779 197 50.97
Greenbrier ALDERSON ELEMENTARY 273 178 21 72.89
Greenbrier CRICHTON ELEMENTARY 129 89 14 79.84
Greenbrier EASTERN GREENBRIER M 868 341 94 50.12
Greenbrier FRANKFORD 286 126 28 53.85
Greenbrier GREENBRIER EAST HIGH 1144 433 139 50.00
Greenbrier GREENBRIER WEST HIGH 440 220 56 62.73
Greenbrier LEWISBURG ELEMENTARY 510 177 41 42.75
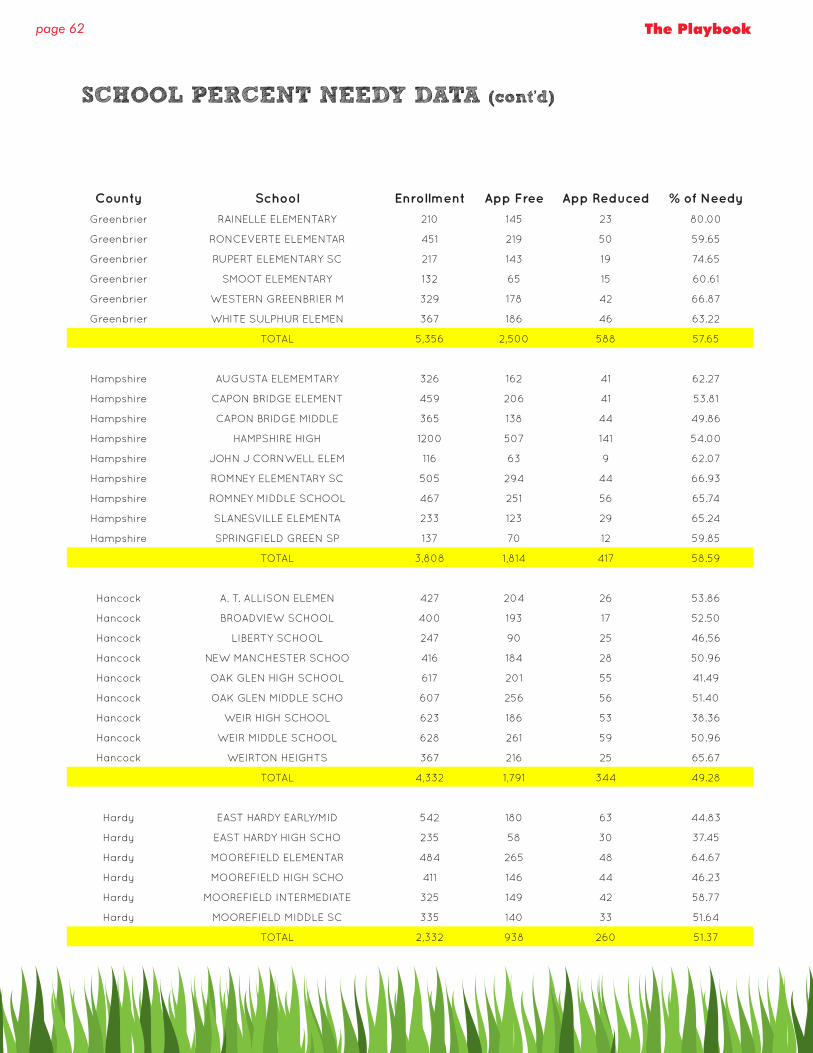
page 62 The Playbook
County School Enrollment App Free App Reduced % of Needy
Greenbrier RAINELLE ELEMENTARY 210 145 23 80.00
Greenbrier RONCEVERTE ELEMENTAR 451 219 50 59.65
Greenbrier RUPERT ELEMENTARY SC 217 143 19 74.65
Greenbrier SMOOT ELEMENTARY 132 65 15 60.61
Greenbrier WESTERN GREENBRIER M 329 178 42 66.87
Greenbrier WHITE SULPHUR ELEMEN 367 186 46 63.22
TOTAL 5,356 2,500 588 57.65
Hampshire AUGUSTA ELEMEMTARY 326 162 41 62.27
Hampshire CAPON BRIDGE ELEMENT 459 206 41 53.81
Hampshire CAPON BRIDGE MIDDLE 365 138 44 49.86
Hampshire HAMPSHIRE HIGH 1200 507 141 54.00
Hampshire JOHN J CORNWELL ELEM 116 63 9 62.07
Hampshire ROMNEY ELEMENTARY SC 505 294 44 66.93
Hampshire ROMNEY MIDDLE SCHOOL 467 251 56 65.74
Hampshire SLANESVILLE ELEMENTA 233 123 29 65.24
Hampshire SPRINGFIELD GREEN SP 137 70 12 59.85
TOTAL 3,808 1,814 417 58.59
Hancock A. T. ALLISON ELEMEN 427 204 26 53.86
Hancock BROADVIEW SCHOOL 400 193 17 52.50
Hancock LIBERTY SCHOOL 247 90 25 46.56
Hancock NEW MANCHESTER SCHOO 416 184 28 50.96
Hancock OAK GLEN HIGH SCHOOL 617 201 55 41.49
Hancock OAK GLEN MIDDLE SCHO 607 256 56 51.40
Hancock WEIR HIGH SCHOOL 623 186 53 38.36
Hancock WEIR MIDDLE SCHOOL 628 261 59 50.96
Hancock WEIRTON HEIGHTS 367 216 25 65.67
TOTAL 4,332 1,791 344 49.28
Hardy EAST HARDY EARLY/MID 542 180 63 44.83
Hardy EAST HARDY HIGH SCHO 235 58 30 37.45
Hardy MOOREFIELD ELEMENTAR 484 265 48 64.67
Hardy MOOREFIELD HIGH SCHO 411 146 44 46.23
Hardy MOOREFIELD INTERMEDIATE 325 149 42 58.77
Hardy MOOREFIELD MIDDLE SC 335 140 33 51.64
TOTAL 2,332 938 260 51.37
SCHOOL PERCENT NEEDY DATA (cont’d)

page 63Creating a Model Food Service Program In West Virginia
County School Enrollment App Free App Reduced % of Needy
Harrison ADAMSTON ELEMENTARY 498 245 30 55.22
Harrison ALTERNATIVE LEARNING 119 77 12 74.79
Harrison BIG ELM ELEMENTARY S 675 354 37 57.93
Harrison BRIDGEPORT HIGH SCHO 796 98 31 16.21
Harrison BRIDGEPORT MIDDLE 540 90 35 23.15
Harrison JOHNSON ELEMENTARY 633 108 25 21.01
Harrison LIBERTY HIGH SCHOOL 628 283 71 56.37
Harrison LINCOLN HIGH SCHOOL 636 258 73 52.04
Harrison LOST CREEK ELEMENTAR 186 97 17 61.29
Harrison LUMBERPORT ELEMENTAR 358 212 29 67.32
Harrison LUMBERPORT MIDDLE SC 438 208 34 55.25
Harrison MOUNTAINEER MIDDLE S 475 253 52 64.21
Harrison NORTH VIEW ELEMENTAR 289 187 20 71.63
Harrison NORWOOD ELEMENTARY 351 139 15 43.87
Harrison NUTTER FORT INTERMED 536 292 37 61.38
Harrison NUTTER FORT PRIMARY 720 398 37 60.42
Harrison ROBERT C. BYRD 776 349 74 54.51
Harrison SALEM ELEMENTARY SCH 345 162 49 61.16
Harrison SIMPSON ELEMENTARY 387 86 18 26.87
Harrison SOUTH HARRISON HIGH 426 156 46 47.42
Harrison SOUTH HARRISON MIDDL 307 133 31 53.42
Harrison WASHINGTON IRVING MI 636 333 55 61.01
Harrison WEST MILFORD ELEMENT 453 228 30 56.95
Harrison WILSONBURG ELEMENTAR 253 160 22 71.94
TOTAL 11,461 4,906 880 50.48
Jackson COTTAGEVILLE ELEMENT 147 83 10 63.27
Jackson EVANS ELEMENTARY 156 54 20 47.44
Jackson FAIRPLAIN ELEMENTARY 224 112 5 52.23
Jackson GILMORE ELEMENTARY 220 116 13 58.64
Jackson HENRY J. KAISER ELEM 369 216 16 62.87
Jackson KENNA ELEMENTARY SCH 357 148 25 48.46
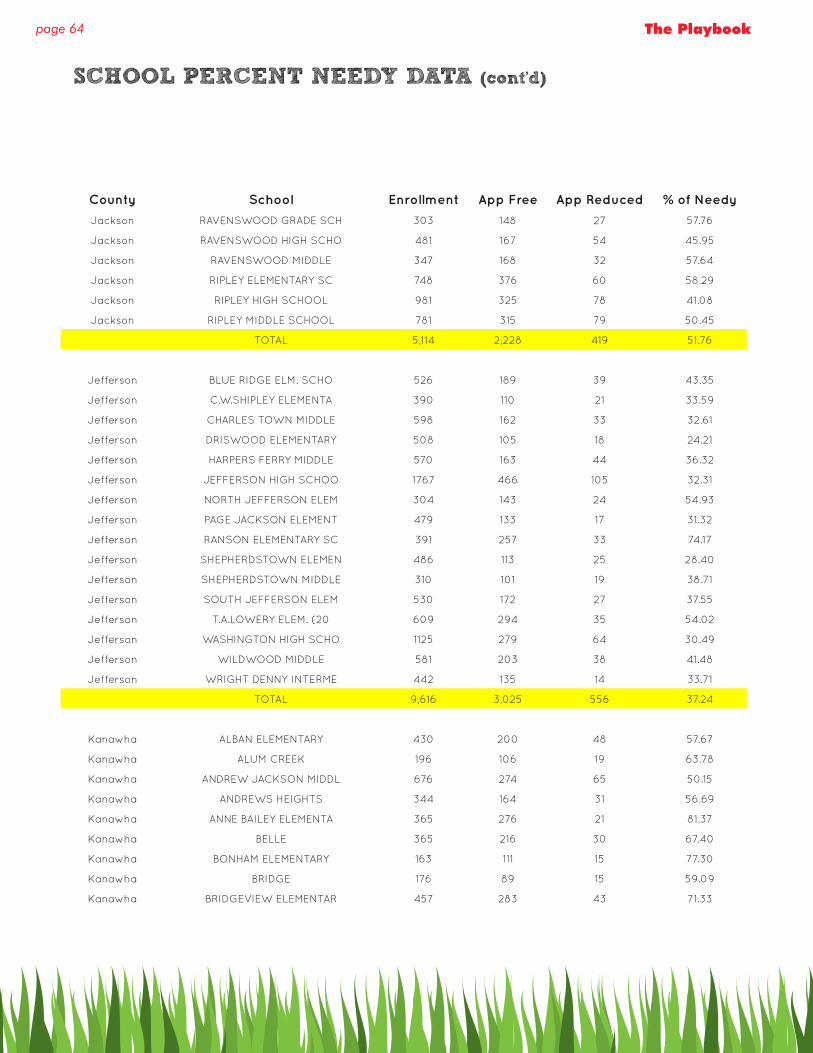
page 64 The Playbook
County School Enrollment App Free App Reduced % of Needy
Jackson RAVENSWOOD GRADE SCH 303 148 27 57.76
Jackson RAVENSWOOD HIGH SCHO 481 167 54 45.95
Jackson RAVENSWOOD MIDDLE 347 168 32 57.64
Jackson RIPLEY ELEMENTARY SC 748 376 60 58.29
Jackson RIPLEY HIGH SCHOOL 981 325 78 41.08
Jackson RIPLEY MIDDLE SCHOOL 781 315 79 50.45
TOTAL 5,114 2,228 419 51.76
Jefferson BLUE RIDGE ELM. SCHO 526 189 39 43.35
Jefferson C.W.SHIPLEY ELEMENTA 390 110 21 33.59
Jefferson CHARLES TOWN MIDDLE 598 162 33 32.61
Jefferson DRISWOOD ELEMENTARY 508 105 18 24.21
Jefferson HARPERS FERRY MIDDLE 570 163 44 36.32
Jefferson JEFFERSON HIGH SCHOO 1767 466 105 32.31
Jefferson NORTH JEFFERSON ELEM 304 143 24 54.93
Jefferson PAGE JACKSON ELEMENT 479 133 17 31.32
Jefferson RANSON ELEMENTARY SC 391 257 33 74.17
Jefferson SHEPHERDSTOWN ELEMEN 486 113 25 28.40
Jefferson SHEPHERDSTOWN MIDDLE 310 101 19 38.71
Jefferson SOUTH JEFFERSON ELEM 530 172 27 37.55
Jefferson T.A.LOWERY ELEM. (20 609 294 35 54.02
Jefferson WASHINGTON HIGH SCHO 1125 279 64 30.49
Jefferson WILDWOOD MIDDLE 581 203 38 41.48
Jefferson WRIGHT DENNY INTERME 442 135 14 33.71
TOTAL 9,616 3,025 556 37.24
Kanawha ALBAN ELEMENTARY 430 200 48 57.67
Kanawha ALUM CREEK 196 106 19 63.78
Kanawha ANDREW JACKSON MIDDL 676 274 65 50.15
Kanawha ANDREWS HEIGHTS 344 164 31 56.69
Kanawha ANNE BAILEY ELEMENTA 365 276 21 81.37
Kanawha BELLE 365 216 30 67.40
Kanawha BONHAM ELEMENTARY 163 111 15 77.30
Kanawha BRIDGE 176 89 15 59.09
Kanawha BRIDGEVIEW ELEMENTAR 457 283 43 71.33
SCHOOL PERCENT NEEDY DATA (cont’d)
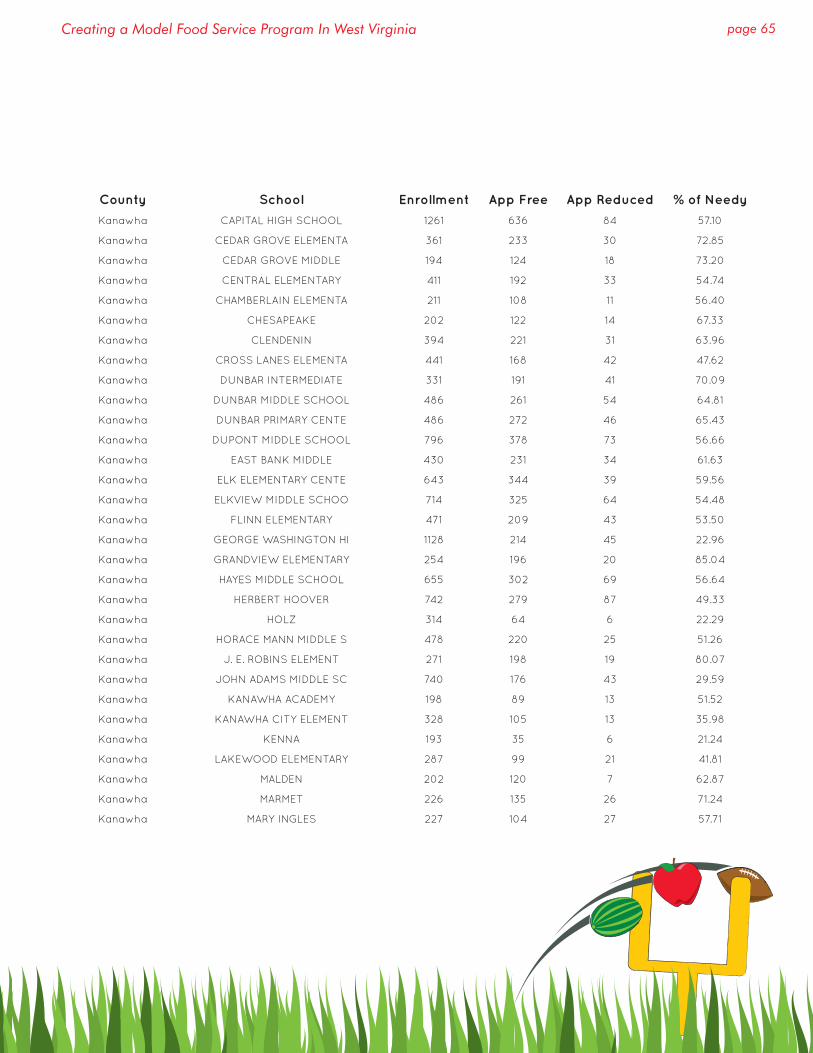
page 65Creating a Model Food Service Program In West Virginia
County School Enrollment App Free App Reduced % of Needy
Kanawha CAPITAL HIGH SCHOOL 1261 636 84 57.10
Kanawha CEDAR GROVE ELEMENTA 361 233 30 72.85
Kanawha CEDAR GROVE MIDDLE 194 124 18 73.20
Kanawha CENTRAL ELEMENTARY 411 192 33 54.74
Kanawha CHAMBERLAIN ELEMENTA 211 108 11 56.40
Kanawha CHESAPEAKE 202 122 14 67.33
Kanawha CLENDENIN 394 221 31 63.96
Kanawha CROSS LANES ELEMENTA 441 168 42 47.62
Kanawha DUNBAR INTERMEDIATE 331 191 41 70.09
Kanawha DUNBAR MIDDLE SCHOOL 486 261 54 64.81
Kanawha DUNBAR PRIMARY CENTE 486 272 46 65.43
Kanawha DUPONT MIDDLE SCHOOL 796 378 73 56.66
Kanawha EAST BANK MIDDLE 430 231 34 61.63
Kanawha ELK ELEMENTARY CENTE 643 344 39 59.56
Kanawha ELKVIEW MIDDLE SCHOO 714 325 64 54.48
Kanawha FLINN ELEMENTARY 471 209 43 53.50
Kanawha GEORGE WASHINGTON HI 1128 214 45 22.96
Kanawha GRANDVIEW ELEMENTARY 254 196 20 85.04
Kanawha HAYES MIDDLE SCHOOL 655 302 69 56.64
Kanawha HERBERT HOOVER 742 279 87 49.33
Kanawha HOLZ 314 64 6 22.29
Kanawha HORACE MANN MIDDLE S 478 220 25 51.26
Kanawha J. E. ROBINS ELEMENT 271 198 19 80.07
Kanawha JOHN ADAMS MIDDLE SC 740 176 43 29.59
Kanawha KANAWHA ACADEMY 198 89 13 51.52
Kanawha KANAWHA CITY ELEMENT 328 105 13 35.98
Kanawha KENNA 193 35 6 21.24
Kanawha LAKEWOOD ELEMENTARY 287 99 21 41.81
Kanawha MALDEN 202 120 7 62.87
Kanawha MARMET 226 135 26 71.24
Kanawha MARY INGLES 227 104 27 57.71
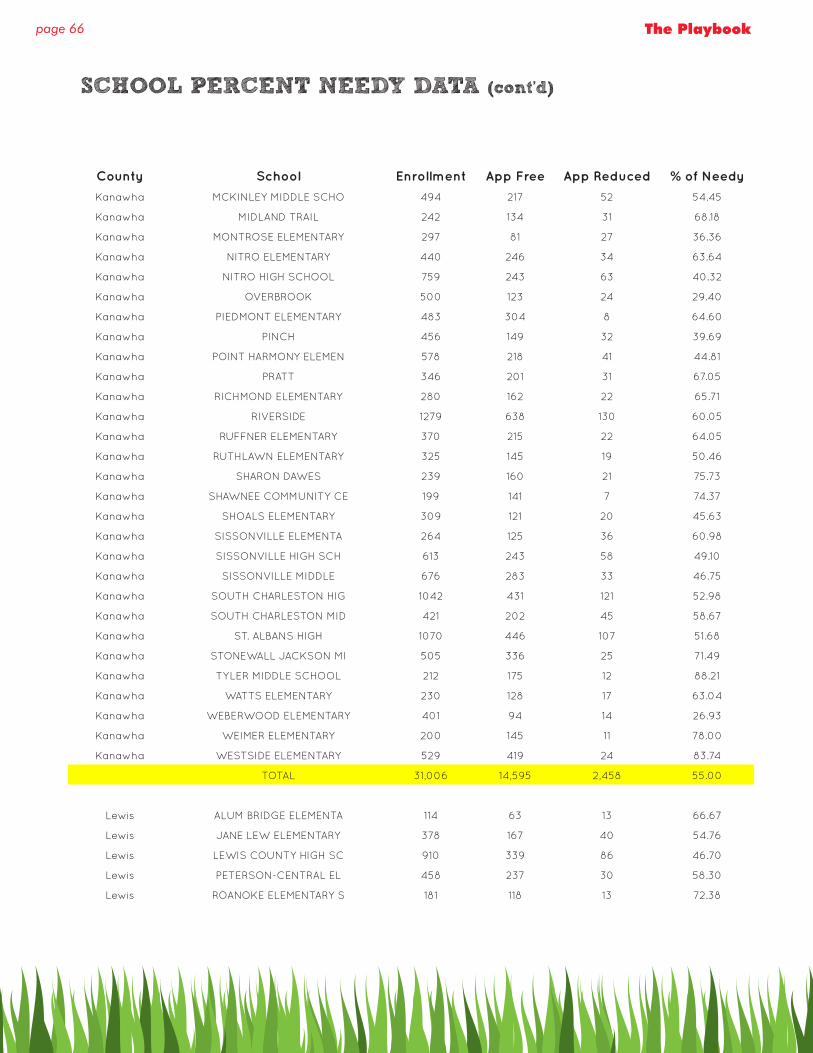
page 66 The Playbook
County School Enrollment App Free App Reduced % of Needy
Kanawha MCKINLEY MIDDLE SCHO 494 217 52 54.45
Kanawha MIDLAND TRAIL 242 134 31 68.18
Kanawha MONTROSE ELEMENTARY 297 81 27 36.36
Kanawha NITRO ELEMENTARY 440 246 34 63.64
Kanawha NITRO HIGH SCHOOL 759 243 63 40.32
Kanawha OVERBROOK 500 123 24 29.40
Kanawha PIEDMONT ELEMENTARY 483 304 8 64.60
Kanawha PINCH 456 149 32 39.69
Kanawha POINT HARMONY ELEMEN 578 218 41 44.81
Kanawha PRATT 346 201 31 67.05
Kanawha RICHMOND ELEMENTARY 280 162 22 65.71
Kanawha RIVERSIDE 1279 638 130 60.05
Kanawha RUFFNER ELEMENTARY 370 215 22 64.05
Kanawha RUTHLAWN ELEMENTARY 325 145 19 50.46
Kanawha SHARON DAWES 239 160 21 75.73
Kanawha SHAWNEE COMMUNITY CE 199 141 7 74.37
Kanawha SHOALS ELEMENTARY 309 121 20 45.63
Kanawha SISSONVILLE ELEMENTA 264 125 36 60.98
Kanawha SISSONVILLE HIGH SCH 613 243 58 49.10
Kanawha SISSONVILLE MIDDLE 676 283 33 46.75
Kanawha SOUTH CHARLESTON HIG 1042 431 121 52.98
Kanawha SOUTH CHARLESTON MID 421 202 45 58.67
Kanawha ST. ALBANS HIGH 1070 446 107 51.68
Kanawha STONEWALL JACKSON MI 505 336 25 71.49
Kanawha TYLER MIDDLE SCHOOL 212 175 12 88.21
Kanawha WATTS ELEMENTARY 230 128 17 63.04
Kanawha WEBERWOOD ELEMENTARY 401 94 14 26.93
Kanawha WEIMER ELEMENTARY 200 145 11 78.00
Kanawha WESTSIDE ELEMENTARY 529 419 24 83.74
TOTAL 31,006 14,595 2,458 55.00
Lewis ALUM BRIDGE ELEMENTA 114 63 13 66.67
Lewis JANE LEW ELEMENTARY 378 167 40 54.76
Lewis LEWIS COUNTY HIGH SC 910 339 86 46.70
Lewis PETERSON-CENTRAL EL 458 237 30 58.30
Lewis ROANOKE ELEMENTARY S 181 118 13 72.38
SCHOOL PERCENT NEEDY DATA (cont’d)
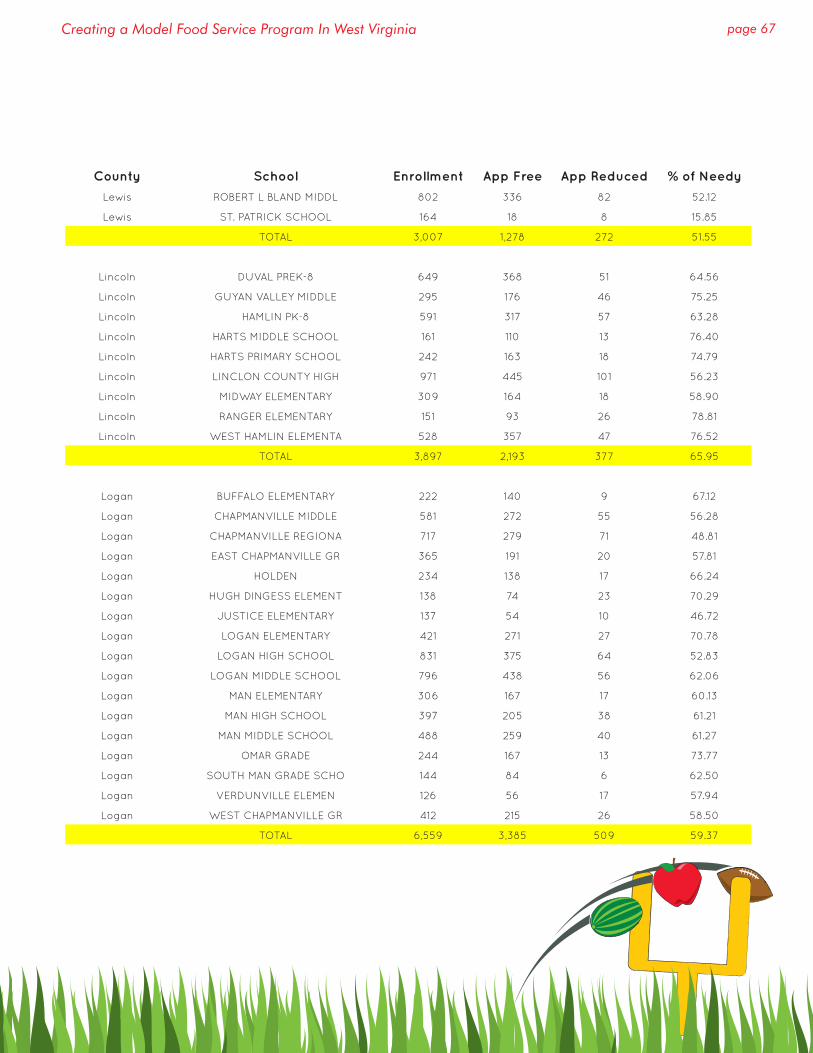
page 67Creating a Model Food Service Program In West Virginia
County School Enrollment App Free App Reduced % of Needy
Lewis ROBERT L BLAND MIDDL 802 336 82 52.12
Lewis ST. PATRICK SCHOOL 164 18 8 15.85
TOTAL 3,007 1,278 272 51.55
Lincoln DUVAL PREK-8 649 368 51 64.56
Lincoln GUYAN VALLEY MIDDLE 295 176 46 75.25
Lincoln HAMLIN PK-8 591 317 57 63.28
Lincoln HARTS MIDDLE SCHOOL 161 110 13 76.40
Lincoln HARTS PRIMARY SCHOOL 242 163 18 74.79
Lincoln LINCLON COUNTY HIGH 971 445 101 56.23
Lincoln MIDWAY ELEMENTARY 309 164 18 58.90
Lincoln RANGER ELEMENTARY 151 93 26 78.81
Lincoln WEST HAMLIN ELEMENTA 528 357 47 76.52
TOTAL 3,897 2,193 377 65.95
Logan BUFFALO ELEMENTARY 222 140 9 67.12
Logan CHAPMANVILLE MIDDLE 581 272 55 56.28
Logan CHAPMANVILLE REGIONA 717 279 71 48.81
Logan EAST CHAPMANVILLE GR 365 191 20 57.81
Logan HOLDEN 234 138 17 66.24
Logan HUGH DINGESS ELEMENT 138 74 23 70.29
Logan JUSTICE ELEMENTARY 137 54 10 46.72
Logan LOGAN ELEMENTARY 421 271 27 70.78
Logan LOGAN HIGH SCHOOL 831 375 64 52.83
Logan LOGAN MIDDLE SCHOOL 796 438 56 62.06
Logan MAN ELEMENTARY 306 167 17 60.13
Logan MAN HIGH SCHOOL 397 205 38 61.21
Logan MAN MIDDLE SCHOOL 488 259 40 61.27
Logan OMAR GRADE 244 167 13 73.77
Logan SOUTH MAN GRADE SCHO 144 84 6 62.50
Logan VERDUNVILLE ELEMEN 126 56 17 57.94
Logan WEST CHAPMANVILLE GR 412 215 26 58.50
TOTAL 6,559 3,385 509 59.37
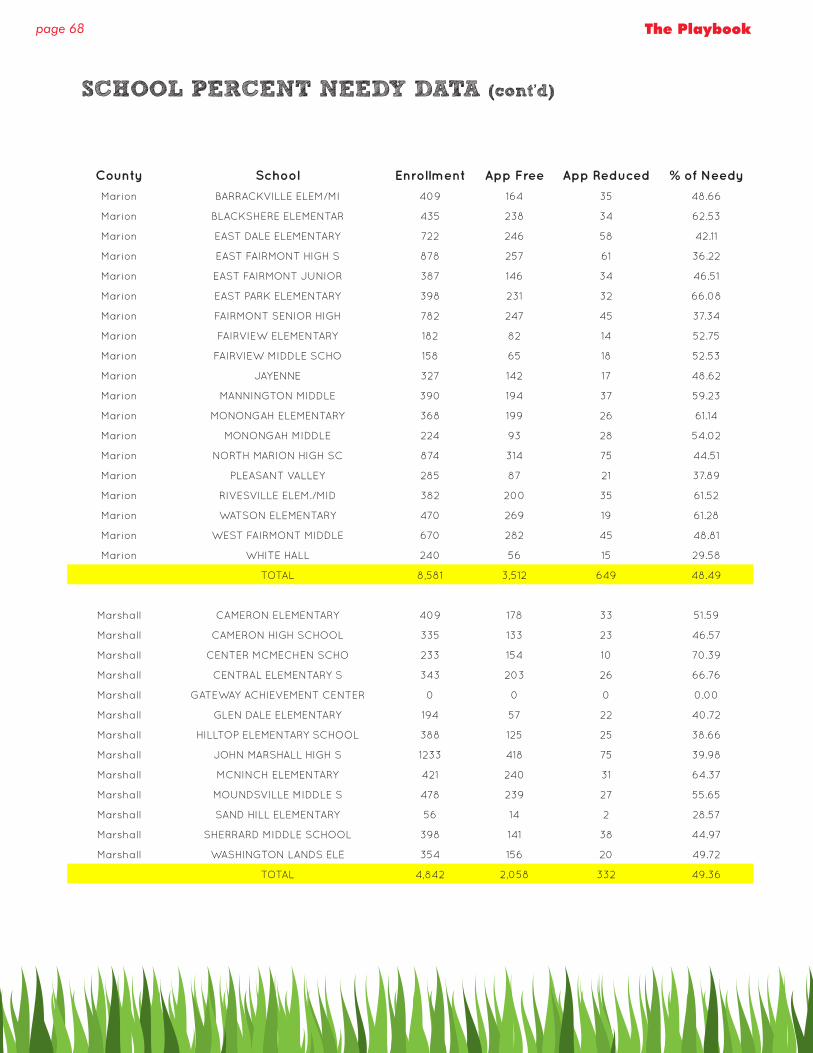
page 68 The Playbook
County School Enrollment App Free App Reduced % of Needy
Marion BARRACKVILLE ELEM/MI 409 164 35 48.66
Marion BLACKSHERE ELEMENTAR 435 238 34 62.53
Marion EAST DALE ELEMENTARY 722 246 58 42.11
Marion EAST FAIRMONT HIGH S 878 257 61 36.22
Marion EAST FAIRMONT JUNIOR 387 146 34 46.51
Marion EAST PARK ELEMENTARY 398 231 32 66.08
Marion FAIRMONT SENIOR HIGH 782 247 45 37.34
Marion FAIRVIEW ELEMENTARY 182 82 14 52.75
Marion FAIRVIEW MIDDLE SCHO 158 65 18 52.53
Marion JAYENNE 327 142 17 48.62
Marion MANNINGTON MIDDLE 390 194 37 59.23
Marion MONONGAH ELEMENTARY 368 199 26 61.14
Marion MONONGAH MIDDLE 224 93 28 54.02
Marion NORTH MARION HIGH SC 874 314 75 44.51
Marion PLEASANT VALLEY 285 87 21 37.89
Marion RIVESVILLE ELEM./MID 382 200 35 61.52
Marion WATSON ELEMENTARY 470 269 19 61.28
Marion WEST FAIRMONT MIDDLE 670 282 45 48.81
Marion WHITE HALL 240 56 15 29.58
TOTAL 8,581 3,512 649 48.49
Marshall CAMERON ELEMENTARY 409 178 33 51.59
Marshall CAMERON HIGH SCHOOL 335 133 23 46.57
Marshall CENTER MCMECHEN SCHO 233 154 10 70.39
Marshall CENTRAL ELEMENTARY S 343 203 26 66.76
Marshall GATEWAY ACHIEVEMENT CENTER 0 0 0 0.00
Marshall GLEN DALE ELEMENTARY 194 57 22 40.72
Marshall HILLTOP ELEMENTARY SCHOOL 388 125 25 38.66
Marshall JOHN MARSHALL HIGH S 1233 418 75 39.98
Marshall MCNINCH ELEMENTARY 421 240 31 64.37
Marshall MOUNDSVILLE MIDDLE S 478 239 27 55.65
Marshall SAND HILL ELEMENTARY 56 14 2 28.57
Marshall SHERRARD MIDDLE SCHOOL 398 141 38 44.97
Marshall WASHINGTON LANDS ELE 354 156 20 49.72
TOTAL 4,842 2,058 332 49.36
SCHOOL PERCENT NEEDY DATA (cont’d)
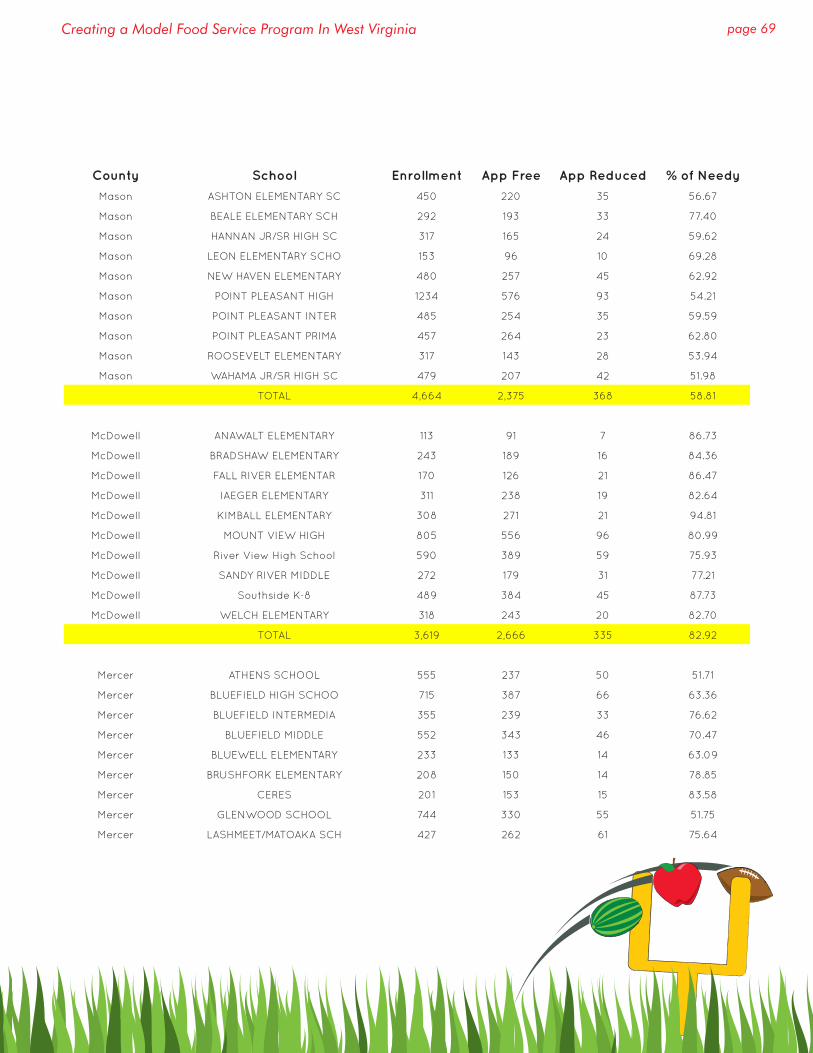
page 69Creating a Model Food Service Program In West Virginia
County School Enrollment App Free App Reduced % of Needy
Mason ASHTON ELEMENTARY SC 450 220 35 56.67
Mason BEALE ELEMENTARY SCH 292 193 33 77.40
Mason HANNAN JR/SR HIGH SC 317 165 24 59.62
Mason LEON ELEMENTARY SCHO 153 96 10 69.28
Mason NEW HAVEN ELEMENTARY 480 257 45 62.92
Mason POINT PLEASANT HIGH 1234 576 93 54.21
Mason POINT PLEASANT INTER 485 254 35 59.59
Mason POINT PLEASANT PRIMA 457 264 23 62.80
Mason ROOSEVELT ELEMENTARY 317 143 28 53.94
Mason WAHAMA JR/SR HIGH SC 479 207 42 51.98
TOTAL 4,664 2,375 368 58.81
McDowell ANAWALT ELEMENTARY 113 91 7 86.73
McDowell BRADSHAW ELEMENTARY 243 189 16 84.36
McDowell FALL RIVER ELEMENTAR 170 126 21 86.47
McDowell IAEGER ELEMENTARY 311 238 19 82.64
McDowell KIMBALL ELEMENTARY 308 271 21 94.81
McDowell MOUNT VIEW HIGH 805 556 96 80.99
McDowell River View High School 590 389 59 75.93
McDowell SANDY RIVER MIDDLE 272 179 31 77.21
McDowell Southside K-8 489 384 45 87.73
McDowell WELCH ELEMENTARY 318 243 20 82.70
TOTAL 3,619 2,666 335 82.92
Mercer ATHENS SCHOOL 555 237 50 51.71
Mercer BLUEFIELD HIGH SCHOO 715 387 66 63.36
Mercer BLUEFIELD INTERMEDIA 355 239 33 76.62
Mercer BLUEFIELD MIDDLE 552 343 46 70.47
Mercer BLUEWELL ELEMENTARY 233 133 14 63.09
Mercer BRUSHFORK ELEMENTARY 208 150 14 78.85
Mercer CERES 201 153 15 83.58
Mercer GLENWOOD SCHOOL 744 330 55 51.75
Mercer LASHMEET/MATOAKA SCH 427 262 61 75.64

page 70 The Playbook
County School Enrollment App Free App Reduced % of Needy
Mercer MCELC-BLUEFIELD 191 166 9 91.62
Mercer MCELC-PRINCETON 170 99 9 63.53
Mercer MELROSE ELEMENTARY 241 111 12 51.04
Mercer MEMORIAL ELEMENTARY 209 147 13 76.56
Mercer MERCER SCHOOL 346 168 35 58.67
Mercer MONTCALM ELEMENTARY 318 206 42 77.99
Mercer MONTCALM HIGH SCHOOL 341 196 36 68.04
Mercer OAKVALE SCHOOL 205 126 25 73.66
Mercer PIKE VIEW HIGH SCHOO 719 290 78 51.18
Mercer PRINCETON HIGH SCHOO 1094 426 93 47.44
Mercer PRINCETON MIDDLE 590 296 47 58.14
Mercer PRINCETON PRIMARY 565 343 53 70.09
Mercer SPANISHBURG SCHOOL 293 150 43 65.87
Mercer STRALEY SCHOOL 198 132 14 73.74
Mercer SUN VALLEY SCHOOL 128 67 3 54.69
Mercer WHITETHORN ELEMENTAR 152 109 7 76.32
TOTAL 9,750 5,266 873 62.96
Mineral BURLINGTON PRIMARY 166 85 23 65.06
Mineral ELK GARDEN PRIMARY/M 100 61 11 72.00
Mineral FORT ASHBY PRIMARY 237 69 23 38.82
Mineral FOUNTAIN PRIMARY SCH 179 88 22 61.45
Mineral FRANKFORT HIGH SCHOO 539 145 56 37.29
Mineral Frankfort Intermedia 323 107 26 41.18
Mineral FRANKFORT MIDDLE SCH 559 168 53 39.53
Mineral KEYSER HIGH SCHOOL 731 296 77 51.03
Mineral KEYSER PRIMARY-MIDDL 1300 682 139 63.15
Mineral NEW CREEK PRIMARY SC 158 53 11 40.51
Mineral WILEY FORD PRIMARY 176 61 23 47.73
TOTAL 4,468 1,815 464 51.01
Mingo BURCH ELEMENTARY 586 392 46 74.74
Mingo BURCH HIGH SCHOOL 356 195 31 63.48
Mingo DINGESS ELEMENTARY 186 151 12 87.63
Mingo GILBERT ELEMENTARY 458 291 40 72.27
Mingo GILBERT HIGH SCHOOL 363 163 31 53.44
Mingo KERMIT K8 342 204 31 68.71
SCHOOL PERCENT NEEDY DATA (cont’d)

page 71Creating a Model Food Service Program In West Virginia
County School Enrollment App Free App Reduced % of Needy
Mingo LENORE K-8 562 334 52 68.68
Mingo MATEWAN ELEMENTARY 305 225 23 81.31
Mingo MATEWAN HIGH SCHOOL 429 283 38 74.83
Mingo RIVERSIDE ELEMENTARY 443 315 29 77.65
Mingo TUG VALLEY HIGH SCHO 497 250 59 62.17
Mingo WILLIAMSON HIGH 440 272 30 68.64
TOTAL 4,967 3,075 422 70.40
Monongalia BROOKHAVEN SCHOOL 544 198 35 42.83
Monongalia CHEAT LAKE ELEMENTARY 863 156 23 20.74
Monongalia CLAY-BATTELLE HIGH S 543 150 73 41.07
Monongalia EASTON ELEMENTARY SC 235 60 22 34.89
Monongalia MASON-DIXON ELEMENTA 408 150 43 47.30
Monongalia MORGANTOWN HIGH SCHO 1795 410 121 29.58
Monongalia MOUNTAINEER MIDDLE 554 116 20 24.55
Monongalia MOUNTAINVIEW ELEMENT 839 324 52 44.82
Monongalia MYLAN PARK ELEMENTAR 569 234 60 51.67
Monongalia NORTH ELEMENTARY SCH 786 196 42 30.28
Monongalia RIDGEDALE SCHOOL 462 152 22 37.66
Monongalia SKYVIEW ELEMENTARY 522 224 46 51.72
Monongalia SOUTH MIDDLE SCHOOL 766 248 59 40.08
Monongalia SUNCREST MIDDLE 521 127 18 27.83
Monongalia SUNCREST PRIMARY 264 52 13 24.62
Monongalia UNIVERSITY HIGH SCHO 1443 348 116 32.16
Monongalia WESTWOOD MIDDLE 464 185 50 50.65
Monongalia WOODBURN ELEMENTARY 304 141 28 55.59
TOTAL 11,882 3,471 843 36.31
Monroe JAMES MONROE HIGH SC 595 235 73 51.76
Monroe MOUNTAINVIEW SCHOOL 586 318 58 64.16
Monroe PETERSTOWN ELEMENTAR 514 235 54 56.23
Monroe PETERSTOWN MIDDLE SC 362 159 46 56.63
TOTAL 2,057 947 231 57.27
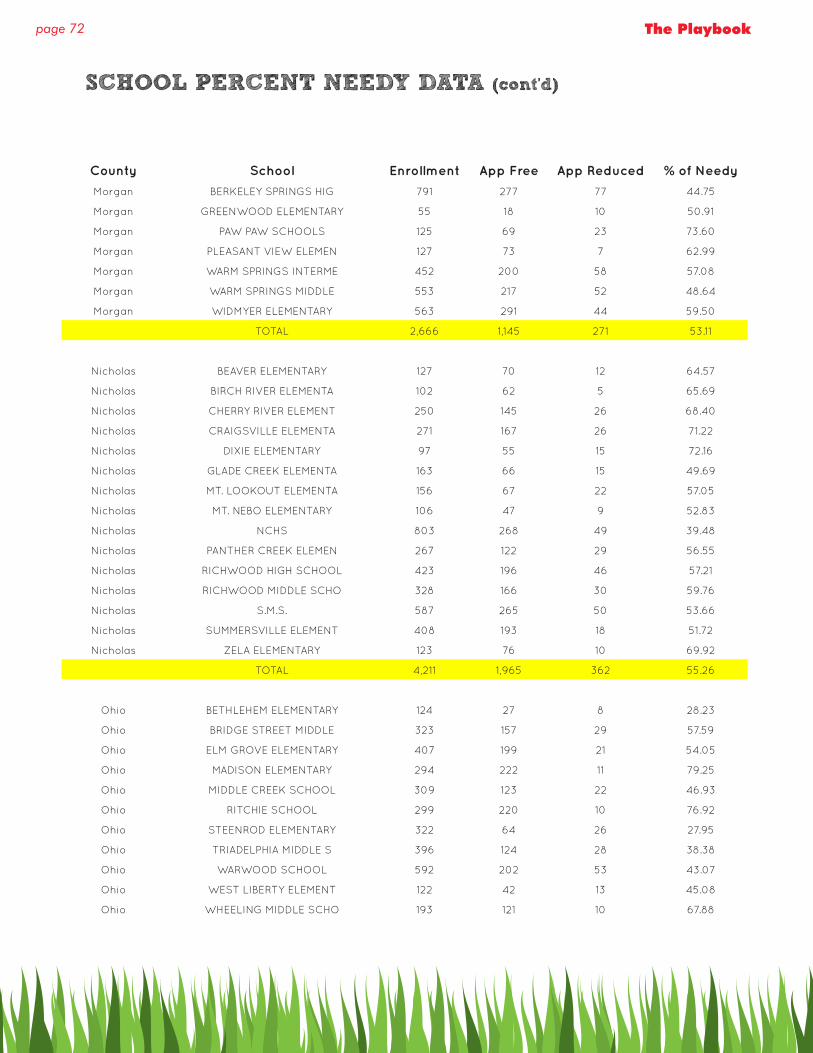
page 72 The Playbook
SCHOOL PERCENT NEEDY DATA (cont’d)
County School Enrollment App Free App Reduced % of Needy
Morgan BERKELEY SPRINGS HIG 791 277 77 44.75
Morgan GREENWOOD ELEMENTARY 55 18 10 50.91
Morgan PAW PAW SCHOOLS 125 69 23 73.60
Morgan PLEASANT VIEW ELEMEN 127 73 7 62.99
Morgan WARM SPRINGS INTERME 452 200 58 57.08
Morgan WARM SPRINGS MIDDLE 553 217 52 48.64
Morgan WIDMYER ELEMENTARY 563 291 44 59.50
TOTAL 2,666 1,145 271 53.11
Nicholas BEAVER ELEMENTARY 127 70 12 64.57
Nicholas BIRCH RIVER ELEMENTA 102 62 5 65.69
Nicholas CHERRY RIVER ELEMENT 250 145 26 68.40
Nicholas CRAIGSVILLE ELEMENTA 271 167 26 71.22
Nicholas DIXIE ELEMENTARY 97 55 15 72.16
Nicholas GLADE CREEK ELEMENTA 163 66 15 49.69
Nicholas MT. LOOKOUT ELEMENTA 156 67 22 57.05
Nicholas MT. NEBO ELEMENTARY 106 47 9 52.83
Nicholas NCHS 803 268 49 39.48
Nicholas PANTHER CREEK ELEMEN 267 122 29 56.55
Nicholas RICHWOOD HIGH SCHOOL 423 196 46 57.21
Nicholas RICHWOOD MIDDLE SCHO 328 166 30 59.76
Nicholas S.M.S. 587 265 50 53.66
Nicholas SUMMERSVILLE ELEMENT 408 193 18 51.72
Nicholas ZELA ELEMENTARY 123 76 10 69.92
TOTAL 4,211 1,965 362 55.26
Ohio BETHLEHEM ELEMENTARY 124 27 8 28.23
Ohio BRIDGE STREET MIDDLE 323 157 29 57.59
Ohio ELM GROVE ELEMENTARY 407 199 21 54.05
Ohio MADISON ELEMENTARY 294 222 11 79.25
Ohio MIDDLE CREEK SCHOOL 309 123 22 46.93
Ohio RITCHIE SCHOOL 299 220 10 76.92
Ohio STEENROD ELEMENTARY 322 64 26 27.95
Ohio TRIADELPHIA MIDDLE S 396 124 28 38.38
Ohio WARWOOD SCHOOL 592 202 53 43.07
Ohio WEST LIBERTY ELEMENT 122 42 13 45.08
Ohio WHEELING MIDDLE SCHO 193 121 10 67.88

page 73Creating a Model Food Service Program In West Virginia
County School Enrollment App Free App Reduced % of Needy
Ohio WHEELING PARK HIGH S 1694 595 116 41.97
Ohio WOODSDALE ELEMENTARY 379 130 20 39.58
TOTAL 5,454 2,226 367 47.54
Pendleton BRANDYWINE ELEMENTAR 163 62 31 57.06
Pendleton FRANKLIN ELEMENTARY 339 178 40 64.31
Pendleton NORTH FORK ELEMENTAR 110 55 22 70.00
Pendleton PENDLETON COUNTY MID 471 182 69 53.29
TOTAL 1,083 477 162 59.00
Pleasants PCMS 611 273 65 55.32
Pleasants ST MARYS ELEMENTARY 270 123 27 55.56
Pleasants St. Marys High School 444 142 38 40.54
TOTAL 1,325 538 130 50.42
Pocahontas GREEN BANK 285 131 36 58.60
Pocahontas HILLSBORO SCHOOL 104 49 10 56.73
Pocahontas MARLINTON ELEMENTARY 229 136 21 68.56
Pocahontas MARLINTON MIDDLE 238 119 41 67.23
Pocahontas POCAHONTAS COUNTY HS 361 151 41 53.19
TOTAL 1,217 586 149 60.39
Preston AURORA SCHOOL 118 59 14 61.86
Preston BRUCETON SCHOOL 576 168 53 38.37
Preston FELLOWSVILLE ELEMENT 110 52 13 59.09
Preston KINGWOOD ELEMENTARY 544 214 61 50.55
Preston PRESTON HIGH SCHOOL 1353 444 138 43.02
Preston ROWLESBURG 155 91 17 69.68
Preston TERRA ALTA/EAST PRES 420 210 47 61.19
Preston TUNNELTON-DENVER ELE 332 174 28 60.84
Preston VALLEY ELEMENTARY 521 228 43 52.02
Preston WEST PRESTON 222 85 17 45.95
TOTAL 4,351 1,725 431 49.55
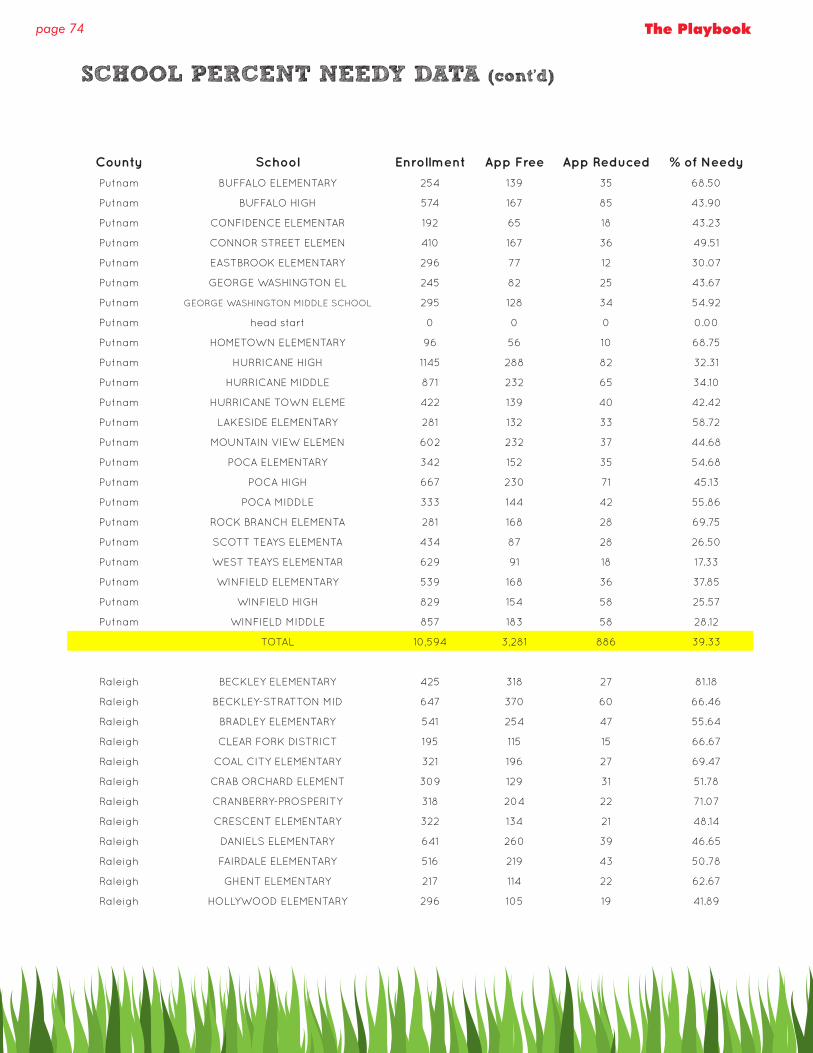
page 74 The Playbook
SCHOOL PERCENT NEEDY DATA (cont’d)
County School Enrollment App Free App Reduced % of Needy
Putnam BUFFALO ELEMENTARY 254 139 35 68.50
Putnam BUFFALO HIGH 574 167 85 43.90
Putnam CONFIDENCE ELEMENTAR 192 65 18 43.23
Putnam CONNOR STREET ELEMEN 410 167 36 49.51
Putnam EASTBROOK ELEMENTARY 296 77 12 30.07
Putnam GEORGE WASHINGTON EL 245 82 25 43.67
Putnam GEORGE WASHINGTON MIDDLE SCHOOL 295 128 34 54.92
Putnam head start 0 0 0 0.00
Putnam HOMETOWN ELEMENTARY 96 56 10 68.75
Putnam HURRICANE HIGH 1145 288 82 32.31
Putnam HURRICANE MIDDLE 871 232 65 34.10
Putnam HURRICANE TOWN ELEME 422 139 40 42.42
Putnam LAKESIDE ELEMENTARY 281 132 33 58.72
Putnam MOUNTAIN VIEW ELEMEN 602 232 37 44.68
Putnam POCA ELEMENTARY 342 152 35 54.68
Putnam POCA HIGH 667 230 71 45.13
Putnam POCA MIDDLE 333 144 42 55.86
Putnam ROCK BRANCH ELEMENTA 281 168 28 69.75
Putnam SCOTT TEAYS ELEMENTA 434 87 28 26.50
Putnam WEST TEAYS ELEMENTAR 629 91 18 17.33
Putnam WINFIELD ELEMENTARY 539 168 36 37.85
Putnam WINFIELD HIGH 829 154 58 25.57
Putnam WINFIELD MIDDLE 857 183 58 28.12
TOTAL 10,594 3,281 886 39.33
Raleigh BECKLEY ELEMENTARY 425 318 27 81.18
Raleigh BECKLEY-STRATTON MID 647 370 60 66.46
Raleigh BRADLEY ELEMENTARY 541 254 47 55.64
Raleigh CLEAR FORK DISTRICT 195 115 15 66.67
Raleigh COAL CITY ELEMENTARY 321 196 27 69.47
Raleigh CRAB ORCHARD ELEMENT 309 129 31 51.78
Raleigh CRANBERRY-PROSPERITY 318 204 22 71.07
Raleigh CRESCENT ELEMENTARY 322 134 21 48.14
Raleigh DANIELS ELEMENTARY 641 260 39 46.65
Raleigh FAIRDALE ELEMENTARY 516 219 43 50.78
Raleigh GHENT ELEMENTARY 217 114 22 62.67
Raleigh HOLLYWOOD ELEMENTARY 296 105 19 41.89
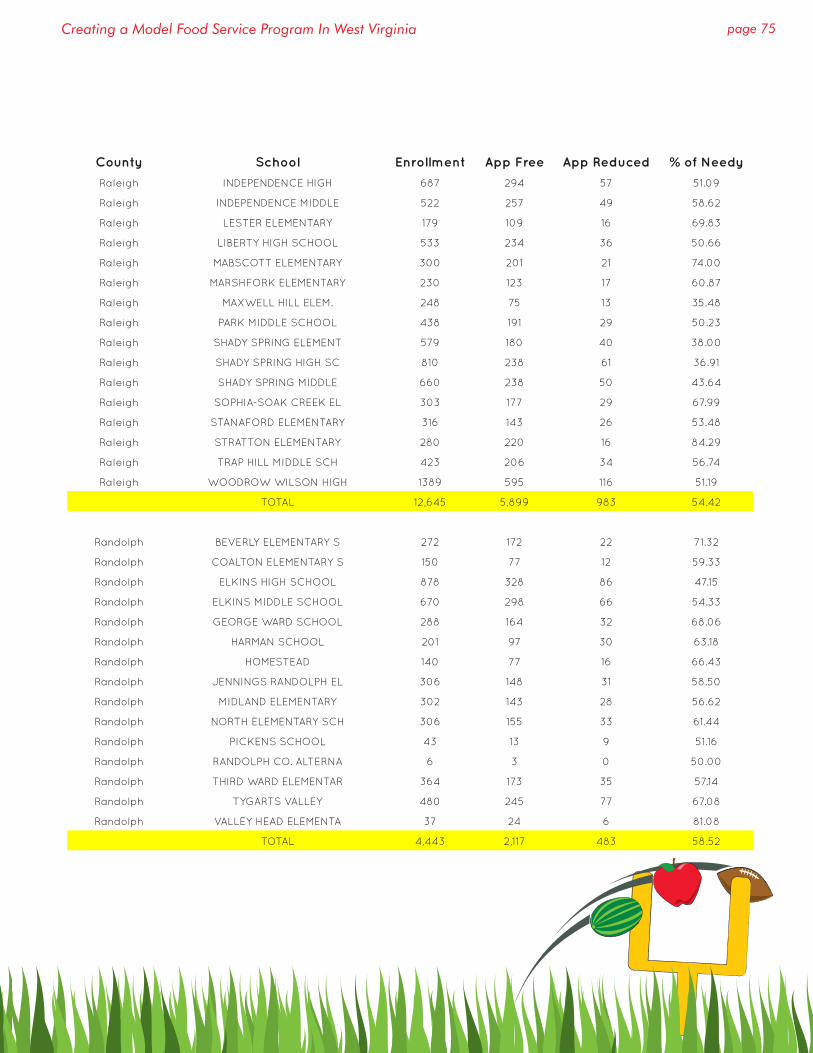
page 75Creating a Model Food Service Program In West Virginia
County School Enrollment App Free App Reduced % of Needy
Raleigh INDEPENDENCE HIGH 687 294 57 51.09
Raleigh INDEPENDENCE MIDDLE 522 257 49 58.62
Raleigh LESTER ELEMENTARY 179 109 16 69.83
Raleigh LIBERTY HIGH SCHOOL 533 234 36 50.66
Raleigh MABSCOTT ELEMENTARY 300 201 21 74.00
Raleigh MARSHFORK ELEMENTARY 230 123 17 60.87
Raleigh MAXWELL HILL ELEM. 248 75 13 35.48
Raleigh PARK MIDDLE SCHOOL 438 191 29 50.23
Raleigh SHADY SPRING ELEMENT 579 180 40 38.00
Raleigh SHADY SPRING HIGH SC 810 238 61 36.91
Raleigh SHADY SPRING MIDDLE 660 238 50 43.64
Raleigh SOPHIA-SOAK CREEK EL 303 177 29 67.99
Raleigh STANAFORD ELEMENTARY 316 143 26 53.48
Raleigh STRATTON ELEMENTARY 280 220 16 84.29
Raleigh TRAP HILL MIDDLE SCH 423 206 34 56.74
Raleigh WOODROW WILSON HIGH 1389 595 116 51.19
TOTAL 12,645 5,899 983 54.42
Randolph BEVERLY ELEMENTARY S 272 172 22 71.32
Randolph COALTON ELEMENTARY S 150 77 12 59.33
Randolph ELKINS HIGH SCHOOL 878 328 86 47.15
Randolph ELKINS MIDDLE SCHOOL 670 298 66 54.33
Randolph GEORGE WARD SCHOOL 288 164 32 68.06
Randolph HARMAN SCHOOL 201 97 30 63.18
Randolph HOMESTEAD 140 77 16 66.43
Randolph JENNINGS RANDOLPH EL 306 148 31 58.50
Randolph MIDLAND ELEMENTARY 302 143 28 56.62
Randolph NORTH ELEMENTARY SCH 306 155 33 61.44
Randolph PICKENS SCHOOL 43 13 9 51.16
Randolph RANDOLPH CO. ALTERNA 6 3 0 50.00
Randolph THIRD WARD ELEMENTAR 364 173 35 57.14
Randolph TYGARTS VALLEY 480 245 77 67.08
Randolph VALLEY HEAD ELEMENTA 37 24 6 81.08
TOTAL 4,443 2,117 483 58.52
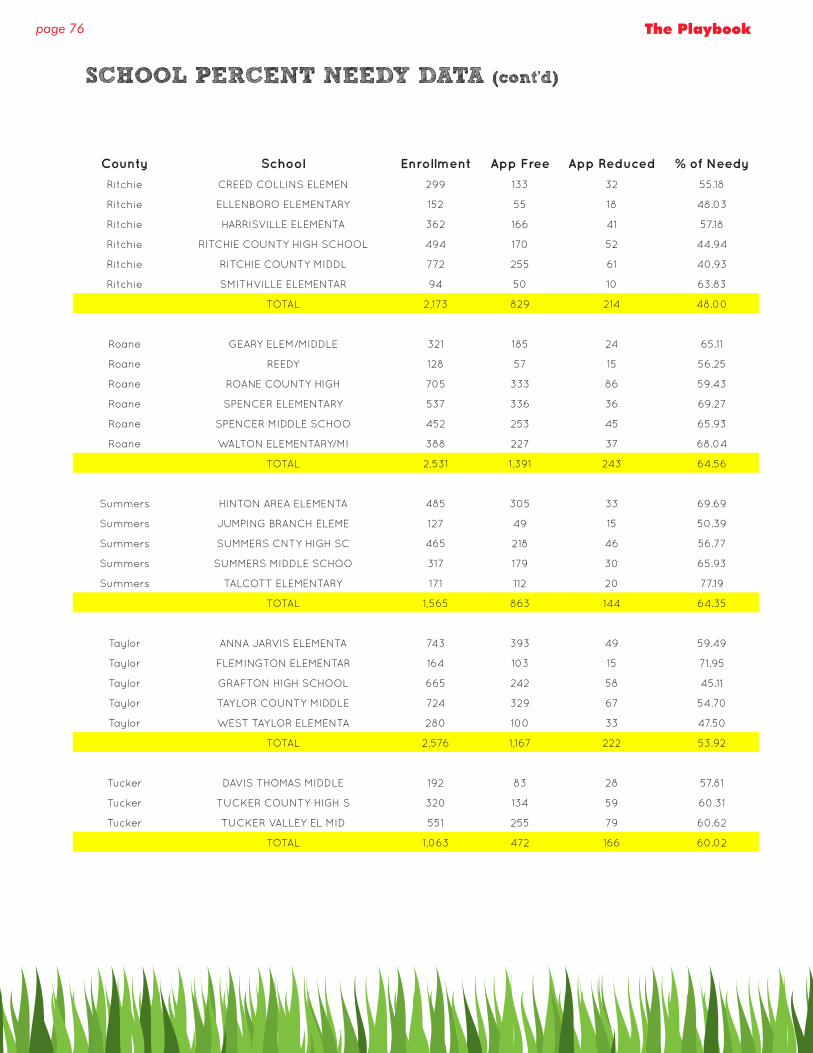
page 76 The Playbook
SCHOOL PERCENT NEEDY DATA (cont’d)
County School Enrollment App Free App Reduced % of Needy
Ritchie CREED COLLINS ELEMEN 299 133 32 55.18
Ritchie ELLENBORO ELEMENTARY 152 55 18 48.03
Ritchie HARRISVILLE ELEMENTA 362 166 41 57.18
Ritchie RITCHIE COUNTY HIGH SCHOOL 494 170 52 44.94
Ritchie RITCHIE COUNTY MIDDL 772 255 61 40.93
Ritchie SMITHVILLE ELEMENTAR 94 50 10 63.83
TOTAL 2,173 829 214 48.00
Roane GEARY ELEM/MIDDLE 321 185 24 65.11
Roane REEDY 128 57 15 56.25
Roane ROANE COUNTY HIGH 705 333 86 59.43
Roane SPENCER ELEMENTARY 537 336 36 69.27
Roane SPENCER MIDDLE SCHOO 452 253 45 65.93
Roane WALTON ELEMENTARY/MI 388 227 37 68.04
TOTAL 2,531 1,391 243 64.56
Summers HINTON AREA ELEMENTA 485 305 33 69.69
Summers JUMPING BRANCH ELEME 127 49 15 50.39
Summers SUMMERS CNTY HIGH SC 465 218 46 56.77
Summers SUMMERS MIDDLE SCHOO 317 179 30 65.93
Summers TALCOTT ELEMENTARY 171 112 20 77.19
TOTAL 1,565 863 144 64.35
Taylor ANNA JARVIS ELEMENTA 743 393 49 59.49
Taylor FLEMINGTON ELEMENTAR 164 103 15 71.95
Taylor GRAFTON HIGH SCHOOL 665 242 58 45.11
Taylor TAYLOR COUNTY MIDDLE 724 329 67 54.70
Taylor WEST TAYLOR ELEMENTA 280 100 33 47.50
TOTAL 2,576 1,167 222 53.92
Tucker DAVIS THOMAS MIDDLE 192 83 28 57.81
Tucker TUCKER COUNTY HIGH S 320 134 59 60.31
Tucker TUCKER VALLEY EL MID 551 255 79 60.62
TOTAL 1,063 472 166 60.02
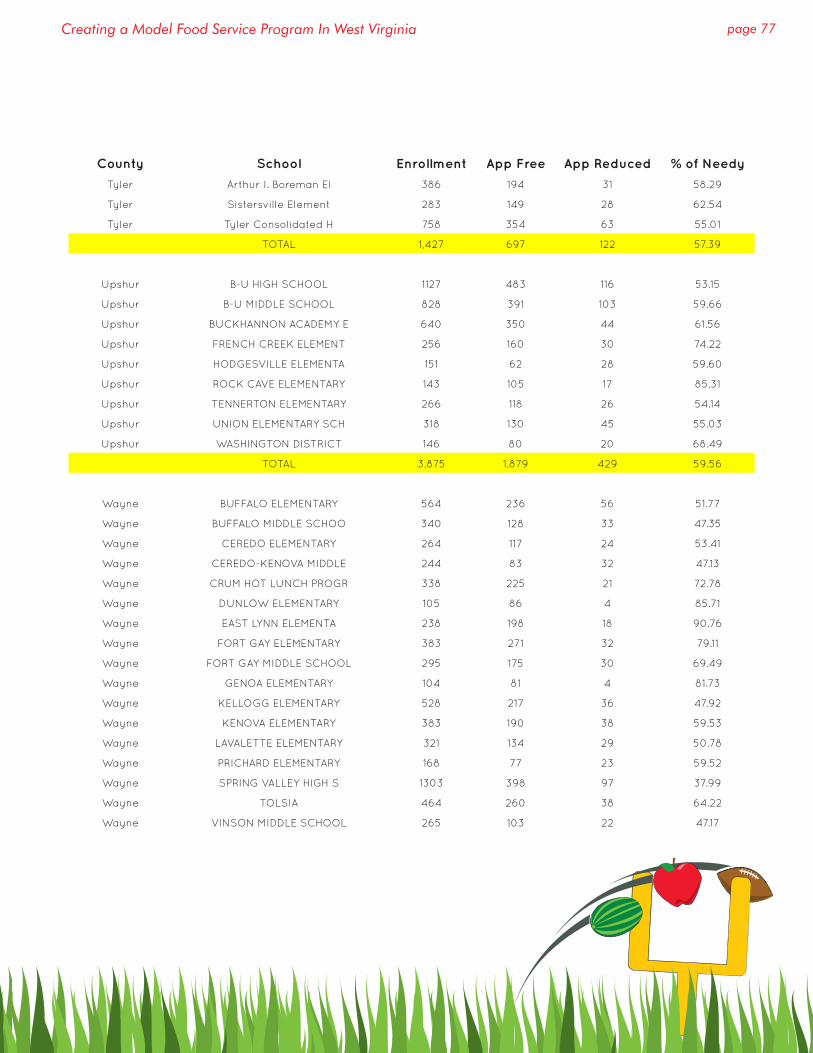
page 77Creating a Model Food Service Program In West Virginia
County School Enrollment App Free App Reduced % of Needy
Tyler Arthur I. Boreman El 386 194 31 58.29
Tyler Sistersville Element 283 149 28 62.54
Tyler Tyler Consolidated H 758 354 63 55.01
TOTAL 1,427 697 122 57.39
Upshur B-U HIGH SCHOOL 1127 483 116 53.15
Upshur B-U MIDDLE SCHOOL 828 391 103 59.66
Upshur BUCKHANNON ACADEMY E 640 350 44 61.56
Upshur FRENCH CREEK ELEMENT 256 160 30 74.22
Upshur HODGESVILLE ELEMENTA 151 62 28 59.60
Upshur ROCK CAVE ELEMENTARY 143 105 17 85.31
Upshur TENNERTON ELEMENTARY 266 118 26 54.14
Upshur UNION ELEMENTARY SCH 318 130 45 55.03
Upshur WASHINGTON DISTRICT 146 80 20 68.49
TOTAL 3,875 1,879 429 59.56
Wayne BUFFALO ELEMENTARY 564 236 56 51.77
Wayne BUFFALO MIDDLE SCHOO 340 128 33 47.35
Wayne CEREDO ELEMENTARY 264 117 24 53.41
Wayne CEREDO-KENOVA MIDDLE 244 83 32 47.13
Wayne CRUM HOT LUNCH PROGR 338 225 21 72.78
Wayne DUNLOW ELEMENTARY 105 86 4 85.71
Wayne EAST LYNN ELEMENTA 238 198 18 90.76
Wayne FORT GAY ELEMENTARY 383 271 32 79.11
Wayne FORT GAY MIDDLE SCHOOL 295 175 30 69.49
Wayne GENOA ELEMENTARY 104 81 4 81.73
Wayne KELLOGG ELEMENTARY 528 217 36 47.92
Wayne KENOVA ELEMENTARY 383 190 38 59.53
Wayne LAVALETTE ELEMENTARY 321 134 29 50.78
Wayne PRICHARD ELEMENTARY 168 77 23 59.52
Wayne SPRING VALLEY HIGH S 1303 398 97 37.99
Wayne TOLSIA 464 260 38 64.22
Wayne VINSON MIDDLE SCHOOL 265 103 22 47.17
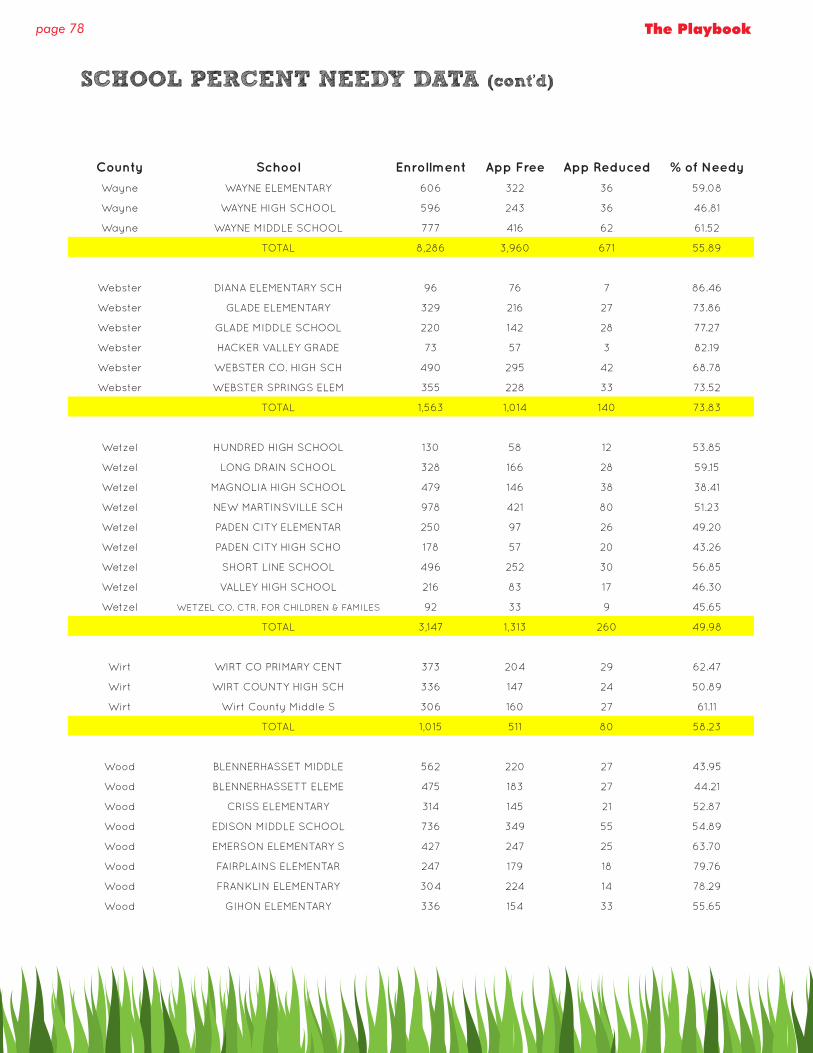
page 78 The Playbook
SCHOOL PERCENT NEEDY DATA (cont’d)
County School Enrollment App Free App Reduced % of Needy
Wayne WAYNE ELEMENTARY 606 322 36 59.08
Wayne WAYNE HIGH SCHOOL 596 243 36 46.81
Wayne WAYNE MIDDLE SCHOOL 777 416 62 61.52
TOTAL 8,286 3,960 671 55.89
Webster DIANA ELEMENTARY SCH 96 76 7 86.46
Webster GLADE ELEMENTARY 329 216 27 73.86
Webster GLADE MIDDLE SCHOOL 220 142 28 77.27
Webster HACKER VALLEY GRADE 73 57 3 82.19
Webster WEBSTER CO. HIGH SCH 490 295 42 68.78
Webster WEBSTER SPRINGS ELEM 355 228 33 73.52
TOTAL 1,563 1,014 140 73.83
Wetzel HUNDRED HIGH SCHOOL 130 58 12 53.85
Wetzel LONG DRAIN SCHOOL 328 166 28 59.15
Wetzel MAGNOLIA HIGH SCHOOL 479 146 38 38.41
Wetzel NEW MARTINSVILLE SCH 978 421 80 51.23
Wetzel PADEN CITY ELEMENTAR 250 97 26 49.20
Wetzel PADEN CITY HIGH SCHO 178 57 20 43.26
Wetzel SHORT LINE SCHOOL 496 252 30 56.85
Wetzel VALLEY HIGH SCHOOL 216 83 17 46.30
Wetzel WETZEL CO. CTR. FOR CHILDREN & FAMILES 92 33 9 45.65
TOTAL 3,147 1,313 260 49.98
Wirt WIRT CO PRIMARY CENT 373 204 29 62.47
Wirt WIRT COUNTY HIGH SCH 336 147 24 50.89
Wirt Wirt County Middle S 306 160 27 61.11
TOTAL 1,015 511 80 58.23
Wood BLENNERHASSET MIDDLE 562 220 27 43.95
Wood BLENNERHASSETT ELEME 475 183 27 44.21
Wood CRISS ELEMENTARY 314 145 21 52.87
Wood EDISON MIDDLE SCHOOL 736 349 55 54.89
Wood EMERSON ELEMENTARY S 427 247 25 63.70
Wood FAIRPLAINS ELEMENTAR 247 179 18 79.76
Wood FRANKLIN ELEMENTARY 304 224 14 78.29
Wood GIHON ELEMENTARY 336 154 33 55.65
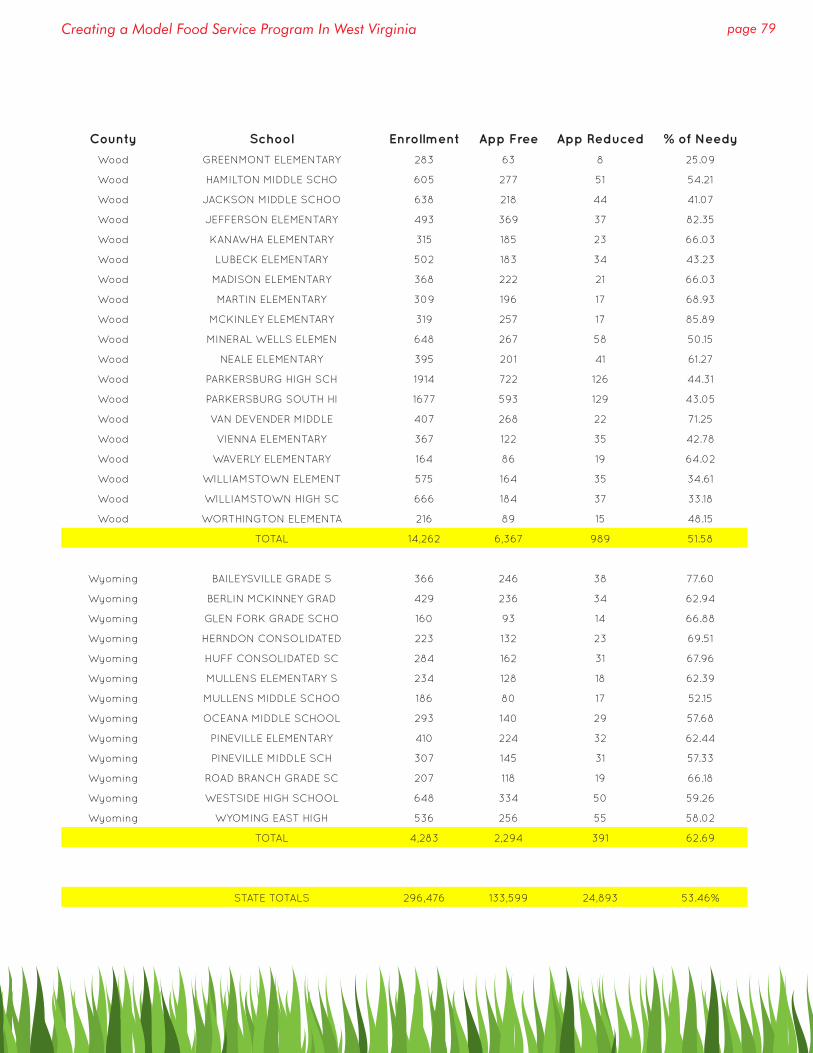
page 79Creating a Model Food Service Program In West Virginia
County School Enrollment App Free App Reduced % of Needy
Wood GREENMONT ELEMENTARY 283 63 8 25.09
Wood HAMILTON MIDDLE SCHO 605 277 51 54.21
Wood JACKSON MIDDLE SCHOO 638 218 44 41.07
Wood JEFFERSON ELEMENTARY 493 369 37 82.35
Wood KANAWHA ELEMENTARY 315 185 23 66.03
Wood LUBECK ELEMENTARY 502 183 34 43.23
Wood MADISON ELEMENTARY 368 222 21 66.03
Wood MARTIN ELEMENTARY 309 196 17 68.93
Wood MCKINLEY ELEMENTARY 319 257 17 85.89
Wood MINERAL WELLS ELEMEN 648 267 58 50.15
Wood NEALE ELEMENTARY 395 201 41 61.27
Wood PARKERSBURG HIGH SCH 1914 722 126 44.31
Wood PARKERSBURG SOUTH HI 1677 593 129 43.05
Wood VAN DEVENDER MIDDLE 407 268 22 71.25
Wood VIENNA ELEMENTARY 367 122 35 42.78
Wood WAVERLY ELEMENTARY 164 86 19 64.02
Wood WILLIAMSTOWN ELEMENT 575 164 35 34.61
Wood WILLIAMSTOWN HIGH SC 666 184 37 33.18
Wood WORTHINGTON ELEMENTA 216 89 15 48.15
TOTAL 14,262 6,367 989 51.58
Wyoming BAILEYSVILLE GRADE S 366 246 38 77.60
Wyoming BERLIN MCKINNEY GRAD 429 236 34 62.94
Wyoming GLEN FORK GRADE SCHO 160 93 14 66.88
Wyoming HERNDON CONSOLIDATED 223 132 23 69.51
Wyoming HUFF CONSOLIDATED SC 284 162 31 67.96
Wyoming MULLENS ELEMENTARY S 234 128 18 62.39
Wyoming MULLENS MIDDLE SCHOO 186 80 17 52.15
Wyoming OCEANA MIDDLE SCHOOL 293 140 29 57.68
Wyoming PINEVILLE ELEMENTARY 410 224 32 62.44
Wyoming PINEVILLE MIDDLE SCH 307 145 31 57.33
Wyoming ROAD BRANCH GRADE SC 207 118 19 66.18
Wyoming WESTSIDE HIGH SCHOOL 648 334 50 59.26
Wyoming WYOMING EAST HIGH 536 256 55 58.02
TOTAL 4,283 2,294 391 62.69
STATE TOTALS 296,476 133,599 24,893 53.46%
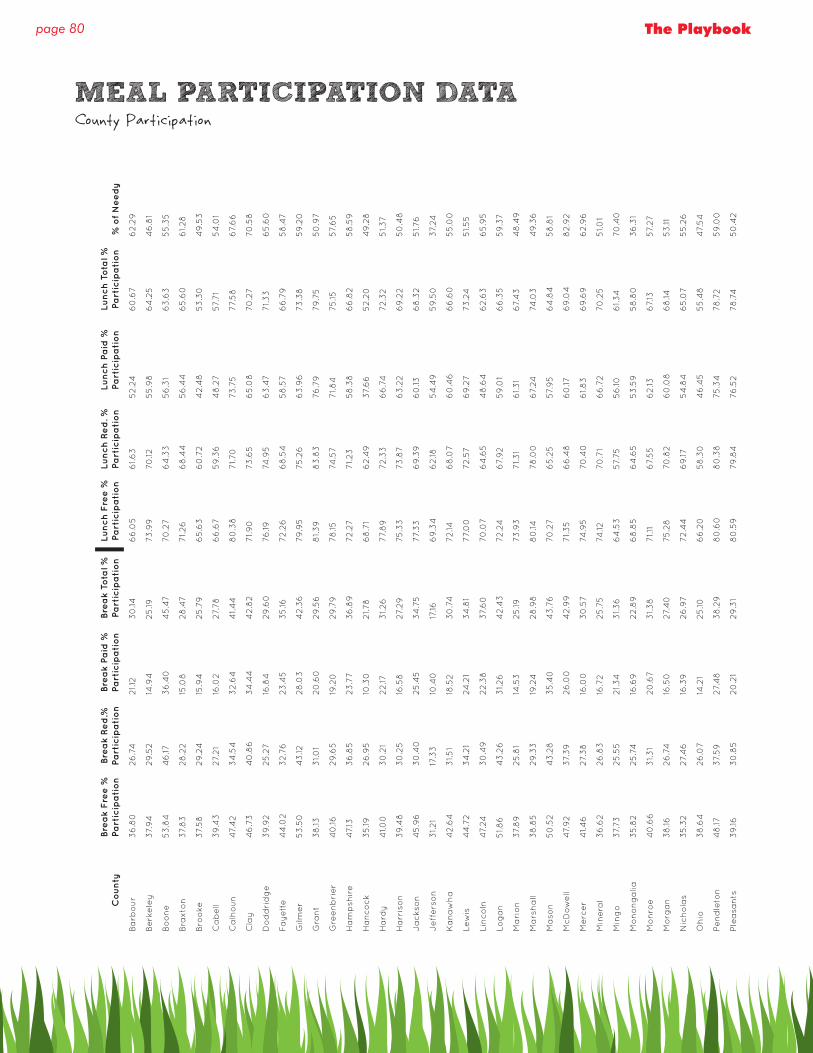
page 80 The Playbook
MEAL PARTICIPATION DATACounty Participation
Co
un
tyBre
ak
Fre
e %
Pa
rtic
ipa
tio
nBre
ak
Re
d.%
Pa
rtic
ipa
tio
nBre
ak
Pa
id %
Pa
rtic
ipa
tio
nBre
ak
Tota
l %
Pa
rtic
ipa
tio
nLu
nch
Fre
e %
Pa
rtic
ipa
tio
nLu
nch
Re
d. %
Pa
rtic
ipa
tio
nLu
nch
Pa
id %
Pa
rtic
ipa
tio
nLu
nch
To
tal %
Pa
rtic
ipa
tio
n%
of
Ne
ed
y
Ba
rbo
ur
36
.80
26
.74
21.1
23
0.14
66
.05
61.6
352.2
46
0.6
76
2.2
9
Berk
ele
y37.
94
29
.52
14.9
425
.1973
.99
70
.125
5.9
86
4.2
54
6.8
1
Bo
on
e53
.84
46
.173
6.4
04
5.4
770
.27
64
.33
56
.31
63
.63
55
.35
Bra
xto
n37.
83
28
.22
15.0
828
.47
71.26
68
.44
56
.44
65
.60
61.28
Bro
oke
37.
58
29
.24
15.9
425
.79
65
.63
60
.72
42.4
85
3.3
04
9.5
3
Ca
be
ll3
9.4
327.
21
16.0
227.
78
66
.67
59
.36
48
.27
57.
71
54
.01
Ca
lho
un
47.
42
34
.54
32.6
44
1.4
48
0.3
871.7
073
.75
77.
58
67.
66
Cla
y4
6.7
34
0.8
63
4.4
44
2.8
271.9
073
.65
65
.08
70
.27
70
.58
Do
dd
rid
ge
39
.92
25
.27
16.8
429
.60
76
.1974
.95
63
.47
71.3
36
5.6
0
Fa
yett
e4
4.0
23
2.7
623
.45
35
.1672.2
66
8.5
45
8.5
76
6.7
95
8.4
7
Gilm
er
53
.50
43
.1228
.03
42.3
679
.95
75.2
66
3.9
673
.38
59
.20
Gra
nt
38
.133
1.01
20
.60
29
.56
81.3
98
3.8
376
.79
79
.75
50
.97
Gre
en
bri
er
40
.1629
.65
19.2
029
.79
78
.1574
.57
71.8
475
.1557.
65
Ha
mp
shir
e4
7.13
36
.85
23
.77
36
.89
72.2
771.23
58
.38
66
.82
58
.59
Ha
nco
ck
35
.1926
.95
10.3
021.7
86
8.7
16
2.4
937.
66
52.2
04
9.2
8
Ha
rdy
41.0
03
0.2
122.17
31.26
77.
89
72.3
36
6.7
472.3
25
1.37
Ha
rris
on
39
.48
30
.25
16.5
827.
29
75.3
373
.87
63
.22
69
.22
50
.48
Ja
cks
on
45
.96
30
.40
25
.45
34
.75
77.
33
69
.39
60
.136
8.3
25
1.76
Je
ffers
on
31.21
17.3
310
.40
17.16
69
.34
62.18
54
.49
59
.50
37.
24
Ka
naw
ha
42.6
43
1.5
118
.52
30
.74
72.14
68
.07
60
.46
66
.60
55
.00
Lew
is4
4.7
23
4.2
124
.21
34
.81
77.
00
72.5
76
9.2
773
.24
51.5
5
Lin
coln
47.
243
0.4
922.3
837.
60
70
.07
64
.65
48
.64
62.6
36
5.9
5
Log
an
51.8
64
3.2
63
1.26
42.4
372.2
46
7.9
259
.01
66
.35
59
.37
Ma
rio
n37.
89
25
.81
14.5
325
.1973
.93
71.3
16
1.3
16
7.4
34
8.4
9
Ma
rsh
all
38
.85
29
.33
19.2
428
.98
80
.1478
.00
67.
2474
.03
49
.36
Ma
son
50
.52
43
.28
35
.40
43
.76
70
.27
65
.25
57.
95
64
.84
58
.81
McD
ow
ell
47.
92
37.
39
26
.00
42.9
971.3
56
6.4
86
0.17
69
.04
82.9
2
Merc
er
41.4
627.
38
16.0
03
0.5
774
.95
70
.40
61.8
36
9.6
96
2.9
6
Min
era
l3
6.6
226
.83
16.7
225
.75
74.12
70
.71
66
.72
70
.25
51.0
1
Min
go
37.
73
25
.55
21.3
43
1.3
66
4.5
357.
755
6.10
61.3
470
.40
Mo
no
ng
alia
35
.82
25
.74
16.6
922.8
96
8.8
56
4.6
553
.59
58
.80
36
.31
Mo
nro
e4
0.6
63
1.3
120
.67
31.3
871.1
16
7.5
56
2.13
67.
1357.
27
Mo
rga
n3
8.16
26
.74
16.5
027.
40
75.2
870
.82
60
.08
68
.145
3.11
Nic
ho
las
35
.32
27.
46
16.3
926
.97
72.4
46
9.17
54
.84
65
.07
55
.26
Oh
io3
8.6
426
.07
14.2
125
.106
6.2
05
8.3
04
6.4
55
5.4
84
7.5
4
Pe
nd
leto
n4
8.17
37.
59
27.
48
38
.29
80
.60
80
.38
75.3
478
.72
59
.00
Ple
asa
nts
39
.163
0.8
520
.21
29
.31
80
.59
79
.84
76
.52
78
.74
50
.42
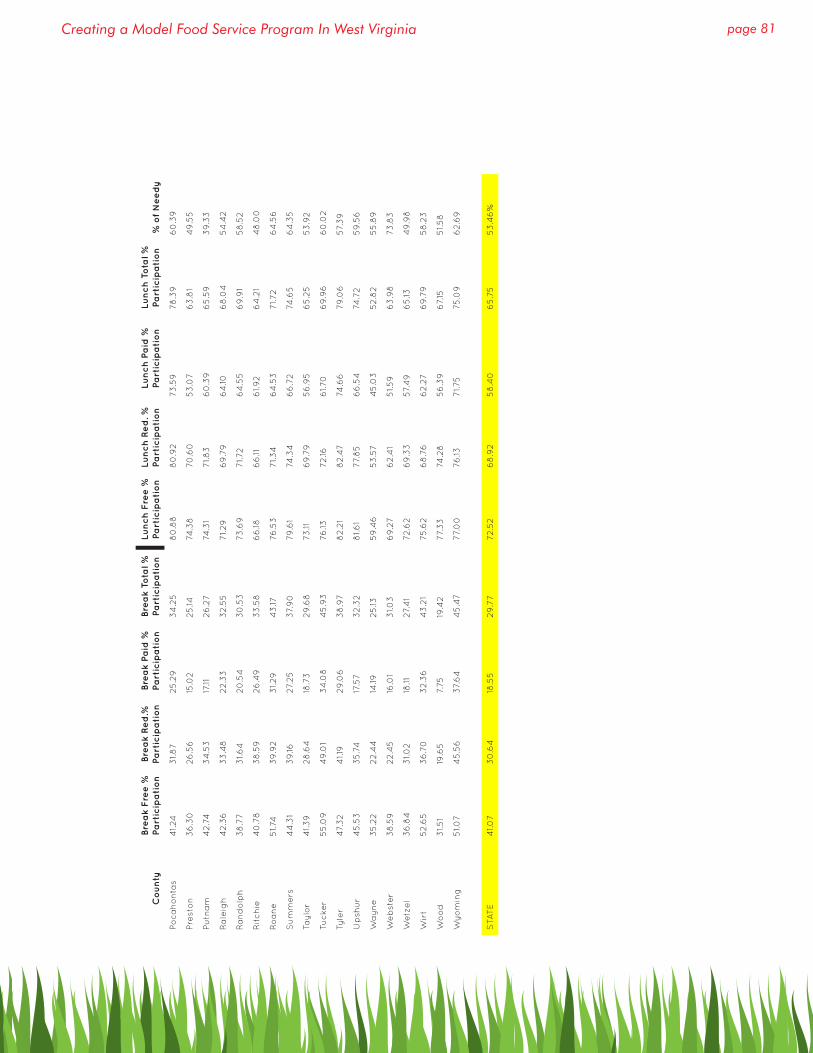
page 81Creating a Model Food Service Program In West Virginia
Co
un
tyBre
ak
Fre
e %
Pa
rtic
ipa
tio
nBre
ak
Re
d.%
Pa
rtic
ipa
tio
nBre
ak
Pa
id %
Pa
rtic
ipa
tio
nBre
ak
Tota
l %
Pa
rtic
ipa
tio
nLu
nch
Fre
e %
Pa
rtic
ipa
tio
nLu
nch
Re
d. %
Pa
rtic
ipa
tio
nLu
nch
Pa
id %
Pa
rtic
ipa
tio
nLu
nch
To
tal %
Pa
rtic
ipa
tio
n%
of
Ne
ed
y
Po
ca
ho
nta
s4
1.24
31.8
725
.29
34
.25
80
.88
80
.92
73
.59
78
.39
60
.39
Pre
sto
n3
6.3
026
.56
15.0
225
.1474
.38
70
.60
53
.07
63
.81
49
.55
Pu
tna
m4
2.7
43
4.5
317
.1126
.27
74.3
171.8
36
0.3
96
5.5
93
9.3
3
Ra
leig
h4
2.3
63
3.4
822.3
33
2.5
571.29
69
.79
64
.106
8.0
45
4.4
2
Ra
nd
olp
h3
8.7
73
1.6
420
.54
30
.53
73
.69
71.7
26
4.5
56
9.9
15
8.5
2
Rit
ch
ie4
0.7
83
8.5
926
.49
33
.58
66
.186
6.11
61.9
26
4.2
14
8.0
0
Ro
an
e5
1.74
39
.92
31.29
43
.1776
.53
71.3
46
4.5
371.7
26
4.5
6
Su
mm
ers
44
.31
39
.1627.
25
37.
90
79
.61
74.3
46
6.7
274
.65
64
.35
Tayl
or
41.3
928
.64
18.7
329
.68
73
.116
9.7
95
6.9
56
5.2
55
3.9
2
Tucke
r5
5.0
94
9.0
13
4.0
84
5.9
376
.1372.16
61.7
06
9.9
66
0.0
2
Tyle
r4
7.3
24
1.19
29
.06
38
.97
82.2
18
2.4
774
.66
79
.06
57.
39
Up
shu
r4
5.5
33
5.7
417
.57
32.3
28
1.6
177.
85
66
.54
74.7
25
9.5
6
Wa
yn
e3
5.2
222.4
414
.1925
.1359
.46
53
.57
45
.03
52.8
25
5.8
9
We
bst
er
38
.59
22.4
516
.01
31.0
36
9.2
76
2.4
15
1.59
63
.98
73
.83
Wetz
el
36
.84
31.0
218
.1127.
41
72.6
26
9.3
357.
49
65
.134
9.9
8
Wir
t52.6
53
6.7
03
2.3
64
3.2
175
.62
68
.76
62.2
76
9.7
95
8.2
3
Wo
od
31.5
119
.65
7.75
19.4
277.
33
74.2
85
6.3
96
7.15
51.5
8
Wyo
min
g5
1.07
45
.56
37.
64
45
.47
77.
00
76
.1371.7
575
.09
62.6
9
STA
TE
41.0
73
0.6
418
.55
29
.77
72.5
26
8.9
25
8.4
06
5.7
55
3.4
6%
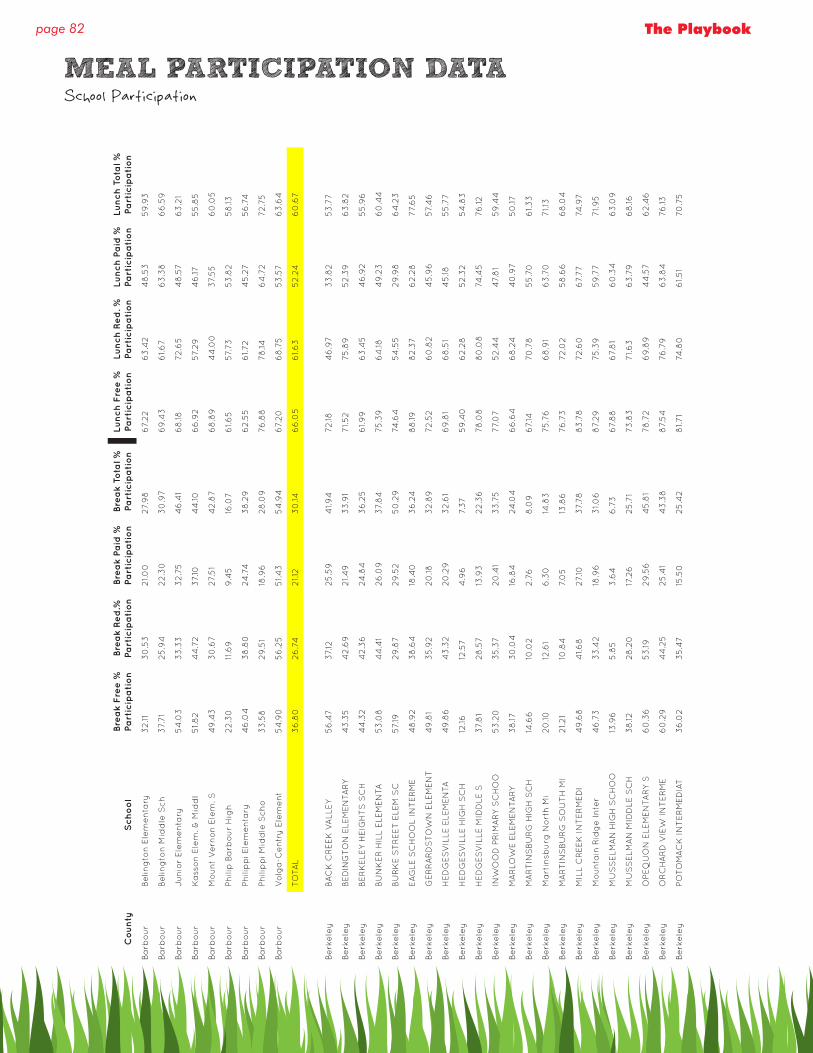
page 82 The Playbook
MEAL PARTICIPATION DATASchool Participation
Co
un
tyS
ch
oo
lBre
ak
Fre
e %
Pa
rtic
ipa
tio
nBre
ak
Re
d.%
Pa
rtic
ipa
tio
nBre
ak
Pa
id %
Pa
rtic
ipa
tio
nBre
ak
Tota
l %
Pa
rtic
ipa
tio
nLu
nch
Fre
e %
Pa
rtic
ipa
tio
nLu
nch
Re
d. %
Pa
rtic
ipa
tio
nLu
nch
Pa
id %
Pa
rtic
ipa
tio
nLu
nch
To
tal %
Pa
rtic
ipa
tio
n
Ba
rbo
ur
Be
ling
ton
Ele
me
nta
ry3
2.11
30
.53
21.0
027.
98
67.
22
63
.42
48
.53
59
.93
Ba
rbo
ur
Be
ling
ton
Mid
dle
Sch
37.
71
25
.94
22.3
03
0.9
76
9.4
36
1.6
76
3.3
86
6.5
9
Ba
rbo
ur
Jun
ior
Ele
me
nta
ry5
4.0
33
3.3
33
2.7
54
6.4
16
8.18
72.6
54
8.5
76
3.2
1
Ba
rbo
ur
Ka
sso
n E
lem
. & M
idd
l5
1.8
24
4.7
237.
104
4.10
66
.92
57.
29
46
.175
5.8
5
Ba
rbo
ur
Mo
un
t V
ern
on
Ele
m. S
49
.43
30
.67
27.
51
42.8
76
8.8
94
4.0
037.
55
60
.05
Ba
rbo
ur
Ph
ilip
Ba
rbo
ur
Hig
h22.3
011
.69
9.4
516
.07
61.6
557.
73
53
.82
58
.13
Ba
rbo
ur
Ph
ilip
pi Ele
me
nta
ry4
6.0
43
8.8
024
.74
38
.29
62.5
56
1.72
45
.27
56
.74
Ba
rbo
ur
Ph
ilip
pi M
idd
le S
ch
o3
3.5
829
.51
18.9
628
.09
76
.88
78
.146
4.7
272.7
5
Ba
rbo
ur
Vo
lga
-Ce
ntr
y E
lem
en
t5
4.9
05
6.2
55
1.4
35
4.9
46
7.20
68
.75
53
.57
63
.64
TO
TAL
36
.80
26
.74
21.1
23
0.14
66
.05
61.6
352.2
46
0.6
7
Berk
ele
yBA
CK
CR
EEK
VA
LLEY
56
.47
37.
1225
.59
41.9
472.18
46
.97
33
.82
53
.77
Berk
ele
yBED
ING
TO
N E
LEM
EN
TARY
43
.35
42.6
921.4
93
3.9
171.52
75.8
952.3
96
3.8
2
Berk
ele
yBE
RK
ELE
Y H
EIG
HT
S S
CH
44
.32
42.3
624
.84
36
.25
61.9
96
3.4
54
6.9
25
5.9
6
Berk
ele
yBU
NK
ER
HIL
L ELE
MEN
TA53
.08
44
.41
26
.09
37.
84
75.3
96
4.18
49
.23
60
.44
Berk
ele
yBU
RK
E S
TR
EET
ELE
M S
C57.
1929
.87
29
.52
50
.29
74.6
45
4.5
529
.98
64
.23
Berk
ele
yEA
GLE
SC
HO
OL
INT
ER
ME
48
.92
38
.64
18.4
03
6.2
48
8.19
82.3
76
2.2
877.
65
Berk
ele
yG
ER
RA
RD
STO
WN
ELE
MEN
T4
9.8
13
5.9
220
.183
2.8
972.5
26
0.8
24
5.9
657.
46
Berk
ele
yH
ED
GES
VIL
LE E
LEM
EN
TA4
9.8
64
3.3
220
.29
32.6
16
9.8
16
8.5
14
5.18
55
.77
Berk
ele
yH
ED
GES
VIL
LE H
IGH
SC
H12
.1612
.57
4.9
67.
37
59
.40
62.2
852.3
25
4.8
3
Berk
ele
yH
ED
GES
VIL
LE M
IDD
LE S
37.
81
28
.57
13.9
322.3
678
.08
80
.08
74.4
576
.12
Berk
ele
yIN
WO
OD
PR
IMA
RY
SC
HO
O53
.20
35
.37
20
.41
33
.75
77.
07
52.4
44
7.8
15
9.4
4
Berk
ele
yM
AR
LOW
E E
LEM
EN
TARY
38
.173
0.0
416
.84
24.0
46
6.6
46
8.2
44
0.9
75
0.17
Berk
ele
yM
AR
TIN
SBU
RG
HIG
H S
CH
14.6
610
.02
2.7
68
.09
67.
1470
.78
55
.70
61.3
3
Berk
ele
yM
art
insb
urg
No
rth
Mi
20
.1012
.61
6.3
014
.83
75.7
66
8.9
16
3.7
071.1
3
Berk
ele
yM
AR
TIN
SBU
RG
SO
UT
H M
I21.21
10.8
47.
05
13.8
676
.73
72.0
25
8.6
66
8.0
4
Berk
ele
yM
ILL
CR
EEK
IN
TE
RM
ED
I4
9.6
84
1.6
827.
1037.
78
83
.78
72.6
06
7.77
74.9
7
Berk
ele
yM
oun
tain
Rid
ge
In
ter
46
.73
33
.42
18.9
63
1.06
87.
29
75.3
959
.77
71.9
5
Berk
ele
yM
US
SELM
AN
HIG
H S
CH
OO
13.9
65
.85
3.6
46
.73
67.
88
67.
81
60
.34
63
.09
Berk
ele
yM
US
SELM
AN
MID
DLE
SC
H3
8.12
28
.20
17.2
625
.71
73
.83
71.6
36
3.7
96
8.16
Berk
ele
yO
PEQ
UO
N E
LEM
EN
TARY
S6
0.3
653
.1929
.56
45
.81
78
.72
69
.89
44
.57
62.4
6
Berk
ele
yO
RC
HA
RD
VIE
W I
NT
ER
ME
60
.29
44
.25
25
.41
43
.38
87.
54
76
.79
63
.84
76
.13
Berk
ele
yPO
TO
MA
CK
IN
TE
RM
ED
IAT
36
.02
35
.47
15.5
025
.42
81.7
174
.80
61.5
170
.75
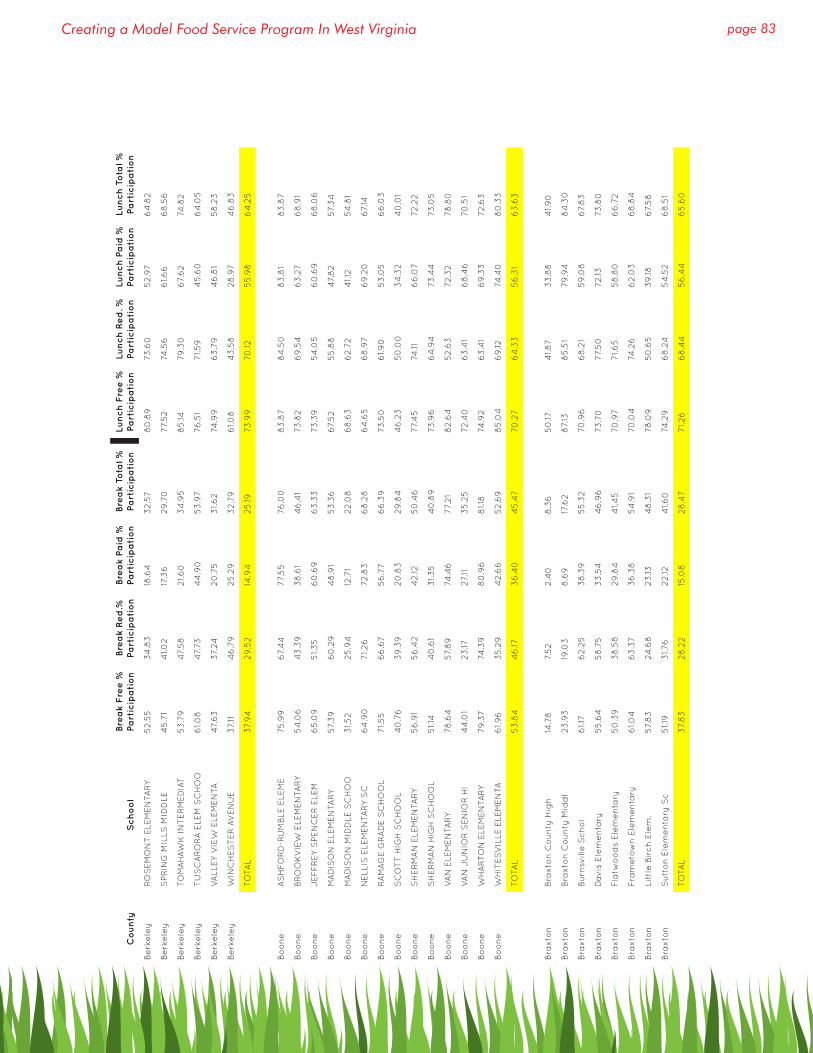
page 83Creating a Model Food Service Program In West Virginia
Co
un
tyS
ch
oo
lBre
ak
Fre
e %
Pa
rtic
ipa
tio
nBre
ak
Re
d.%
Pa
rtic
ipa
tio
nBre
ak
Pa
id %
Pa
rtic
ipa
tio
nBre
ak
Tota
l %
Pa
rtic
ipa
tio
nLu
nch
Fre
e %
Pa
rtic
ipa
tio
nLu
nch
Re
d. %
Pa
rtic
ipa
tio
nLu
nch
Pa
id %
Pa
rtic
ipa
tio
nLu
nch
To
tal %
Pa
rtic
ipa
tio
n
Berk
ele
yR
OS
EM
ON
T E
LEM
EN
TARY
52.5
53
4.8
318
.64
32.5
78
0.8
973
.60
52.9
76
4.8
2
Berk
ele
yS
PR
ING
MIL
LS M
IDD
LE4
5.7
14
1.02
17.3
629
.70
77.
52
74.5
66
1.6
66
8.5
6
Berk
ele
yTO
MA
HAW
K I
NT
ER
MED
IAT
53
.79
47.
58
21.6
03
4.9
58
5.14
79
.30
67.
62
74.8
2
Berk
ele
yT
US
CA
RO
RA
ELE
M S
CH
OO
61.0
84
7.73
44
.90
53
.97
76
.51
71.5
94
5.6
06
4.0
5
Berk
ele
yV
ALL
EY
VIE
W E
LEM
EN
TA4
7.6
337.
2420
.75
31.6
274
.99
63
.79
46
.81
58
.23
Berk
ele
yW
INC
HES
TE
R A
VEN
UE
37.
114
6.7
925
.29
32.7
96
1.08
43
.58
28
.97
46
.83
TO
TAL
37.
94
29
.52
14.9
425
.1973
.99
70
.125
5.9
86
4.2
5
Bo
on
eA
SH
FO
RD
-RU
MBLE
ELE
ME
75.9
96
7.4
477.
55
76
.00
83
.87
84
.50
83
.81
83
.87
Bo
on
eBR
OO
KV
IEW
ELE
MEN
TARY
54
.06
43
.39
38
.61
46
.41
73
.82
69
.54
63
.27
68
.91
Bo
on
eJEF
FR
EY
SPEN
CE
R E
LEM
65
.09
51.3
56
0.6
96
3.3
373
.39
54
.05
60
.69
68
.06
Bo
on
eM
AD
ISO
N E
LEM
EN
TARY
57.
39
60
.29
48
.91
53
.36
67.
52
55
.88
47.
82
57.
34
Bo
on
eM
AD
ISO
N M
IDD
LE S
CH
OO
31.52
25
.94
12.7
122.0
86
8.6
36
2.7
24
1.12
54
.81
Bo
on
eN
ELL
IS E
LEM
EN
TARY
SC
64
.90
71.26
72.8
36
8.2
86
4.6
56
8.9
76
9.2
06
7.14
Bo
on
eR
AM
AG
E G
RA
DE S
CH
OO
L71.5
56
6.6
75
6.7
76
6.3
973
.50
61.9
05
3.0
56
6.0
3
Bo
on
eS
CO
TT
HIG
H S
CH
OO
L4
0.7
63
9.3
920
.83
29
.84
46
.23
50
.00
34
.32
40
.01
Bo
on
eS
HE
RM
AN
ELE
MEN
TARY
56
.91
56
.42
42.12
50
.46
77.
45
74.11
66
.07
72.2
2
Bo
on
eS
HE
RM
AN
HIG
H S
CH
OO
L5
1.14
40
.61
31.3
54
0.8
973
.96
64
.94
73
.44
73
.05
Bo
on
eV
AN
ELE
MEN
TARY
78
.64
57.
89
74.4
677.
21
82.6
452.6
372.3
278
.80
Bo
on
eV
AN
JU
NIO
R S
EN
IOR
HI
44
.01
23
.1727.
113
5.2
572.4
06
3.4
16
8.4
670
.51
Bo
on
eW
HA
RTO
N E
LEM
EN
TARY
79
.37
74.3
98
0.9
68
1.18
74.9
26
3.4
16
9.3
372.6
3
Bo
on
eW
HIT
ES
VIL
LE E
LEM
EN
TA6
1.9
63
5.2
94
2.6
652.6
98
5.0
46
9.12
74.4
08
0.3
3
TO
TAL
53
.84
46
.173
6.4
04
5.4
770
.27
64
.33
56
.31
63
.63
Bra
xto
nBra
xto
n C
oun
ty H
igh
14.7
87.
52
2.4
08
.36
50
.174
1.8
73
3.8
84
1.9
0
Bra
xto
nBra
xto
n C
oun
ty M
idd
l23
.93
19.0
38
.69
17.6
28
7.13
85
.51
79
.94
84
.30
Bra
xto
nBu
rnsv
ille
Sch
ol
61.1
76
2.2
53
8.3
95
5.3
270
.96
68
.21
59
.08
67.
83
Bra
xto
nD
avis
Ele
me
nta
ry5
5.6
45
8.7
53
3.5
44
6.9
673
.70
77.
50
72.13
73
.80
Bra
xto
nF
latw
oo
ds
Ele
me
nta
ry5
0.3
93
8.5
829
.84
41.4
570
.97
71.6
55
8.8
06
6.7
2
Bra
xto
nF
ram
eto
wn
Ele
me
nta
ry6
1.04
63
.37
36
.38
54
.91
70
.04
74.2
66
2.0
36
8.8
4
Bra
xto
nLi
ttle
Bir
ch
Ele
m.
57.
83
24.6
823
.134
8.3
178
.09
50
.65
39
.186
7.5
8
Bra
xto
nS
utt
on
Ele
me
nta
ry S
c5
1.19
31.7
622.12
41.6
074
.29
68
.24
54
.52
68
.51
TO
TAL
37.
83
28
.22
15.0
828
.47
71.26
68
.44
56
.44
65
.60

page 84 The Playbook
Co
un
tyS
ch
oo
lBre
ak
Fre
e %
Pa
rtic
ipa
tio
nBre
ak
Re
d.%
Pa
rtic
ipa
tio
nBre
ak
Pa
id %
Pa
rtic
ipa
tio
nBre
ak
Tota
l %
Pa
rtic
ipa
tio
nLu
nch
Fre
e %
Pa
rtic
ipa
tio
nLu
nch
Re
d. %
Pa
rtic
ipa
tio
nLu
nch
Pa
id %
Pa
rtic
ipa
tio
nLu
nch
To
tal %
Pa
rtic
ipa
tio
n
Bro
oke
BEEC
H B
OT
TO
M S
CH
OO
L6
0.6
24
8.18
39
.23
53
.48
74.5
471.8
24
1.79
64
.57
Bro
oke
BR
OO
KE H
IGH
SC
HO
OL
27.
21
21.9
211
.34
17.4
36
2.0
86
3.3
45
4.0
757.
54
Bro
oke
CO
LLIE
RS
PR
IMA
RY
SC
H
52.10
50
.26
21.4
54
0.2
771.0
86
4.10
40
.26
58
.49
Bro
oke
FO
LLA
NS
BEE M
IDD
LE S
CH
OO
L3
1.6
827.
07
10.2
920
.22
62.6
25
0.9
129
.52
44
.37
Bro
oke
FR
AN
KLIN
PR
IMA
RY
SC
HO
OL
53
.70
34
.36
33
.27
41.3
374
.62
68
.71
52.6
06
2.4
0
Bro
oke
HO
OV
ER
SO
N H
EIG
HT
S P
R5
1.00
33
.33
23
.69
38
.22
68
.84
74.15
44
.59
58
.98
Bro
oke
JEF
FE
RS
ON
PR
IMA
RY
55
.61
51.1
028
.79
42.3
76
5.2
66
4.8
43
8.9
352.5
0
Bro
oke
L.B.M
ILLS
OP
52.5
93
0.5
918
.73
28
.196
7.6
74
5.2
93
5.2
44
3.6
1
Bro
oke
WELL
SBU
RG
MID
DLE
SC
H25
.65
23
.31
12.2
218
.84
64
.1557.
97
29
.41
46
.17
Bro
oke
WELL
SBU
RG
PR
IMA
RY
33
.02
28
.41
15.2
624
.97
67.
06
61.7
43
4.4
352.0
8
TO
TAL
37.
58
29
.24
15.9
425
.79
65
.63
60
.72
42.4
85
3.3
0
Ca
be
llA
LTIZ
ER
ELE
MEN
TARY
42.3
43
0.7
318
.74
34
.72
70
.98
66
.06
48
.69
64
.39
Ca
be
llBA
RBO
UR
SV
ILLE
MID
DLE
32.4
922.9
210
.76
19.0
275
.07
70
.80
68
.37
70
.90
Ca
be
llBEV
ER
LY H
ILLS
MID
DLE
27.
58
13.19
8.5
118
.41
76
.65
69
.44
59
.73
68
.91
Ca
be
llC
ABELL
MID
LAN
D H
IGH
33
.70
27.
05
19.12
23
.89
52.7
75
0.7
04
5.0
54
7.72
Ca
be
llC
EN
TR
AL
CIT
Y E
LEM
EN
T4
6.5
425
.80
25
.90
43
.1674
.54
74.2
06
0.5
772.9
2
Ca
be
llC
OX
LA
ND
ING
ELE
MEN
TA4
6.3
53
2.9
219
.05
36
.49
67.
50
61.7
34
5.7
66
0.0
6
Ca
be
llC
ULL
OD
EN
ELE
MEN
TARY
47.
59
30
.59
22.2
03
4.8
371.1
25
8.2
44
5.3
75
8.5
5
Ca
be
llD
AVIS
CR
EEK
ELE
MEN
TA37.
71
33
.1217
.89
24.9
26
5.0
45
8.4
44
1.8
24
9.9
8
Ca
be
llEN
SLO
W M
IDD
LE29
.76
20
.38
17.8
526
.91
79
.39
73
.93
78
.1579
.06
Ca
be
llG
EN
EV
A K
EN
T E
LEM
EN
TA4
7.4
825
.84
12.6
927.
92
72.6
86
5.5
55
0.6
46
0.8
3
Ca
be
llG
UYA
ND
OT
TE E
LEM
EN
TAR
51.9
128
.77
27.
04
46
.68
73
.73
64
.38
56
.86
70
.70
Ca
be
llH
IGH
LAW
N E
LEM
EN
TARY
55
.47
41.7
03
9.7
64
9.8
470
.70
60
.09
58
.66
66
.38
Ca
be
llH
ITE-S
AU
ND
ER
S E
LEM
EN
47.
1626
.60
20
.96
35
.50
68
.69
47.
34
48
.23
59
.20
Ca
be
llH
UN
TIN
GTO
N H
IGH
SC
HO
32.6
629
.98
12.4
823
.164
7.75
53
.193
6.4
84
2.8
6
Ca
be
llH
UN
TIN
GTO
N M
IDD
LE3
1.9
521.5
49
.02
22.9
46
5.6
64
3.0
84
4.3
75
6.9
2
Ca
be
llM
AR
TH
A E
LEM
EN
TARY
41.9
43
3.7
022.5
628
.20
64
.32
68
.50
55
.82
59
.21
Ca
be
llM
EA
DO
WS
ELE
MEN
TARY
49
.50
24.8
712
.93
24.7
56
9.11
59
.59
35
.88
47.
67
Ca
be
llM
ILTO
N E
LEM
EN
TARY
40
.71
34
.72
14.0
427.
756
4.6
45
8.2
04
0.8
85
3.0
5
Ca
be
llM
ILTO
N M
IDD
LE S
CH
OO
L3
1.6
120
.71
12.2
220
.74
71.1
05
9.9
75
6.3
06
2.5
4
Ca
be
llN
ICH
OLS
ELE
MEN
TARY
42.8
23
4.15
18.4
325
.90
67.
29
67.
48
53
.87
58
.34
Ca
be
llO
NA
ELE
MEN
TARY
33
.97
6.9
913
.30
19.4
16
8.11
32.8
75
0.0
05
4.9
5
Ca
be
llPEY
TO
N E
LEM
EN
TARY
49
.62
20
.00
22.4
74
6.2
479
.66
57.
146
9.6
678
.70
Ca
be
llS
ALT
RO
CK
ELE
MEN
TARY
44
.69
31.1
626
.173
5.9
772.6
96
5.5
86
0.0
66
7.0
9
Ca
be
llS
OU
TH
SID
E E
LEM
EN
TARY
42.0
73
0.0
012
.26
26
.24
70
.42
67.
06
38
.71
53
.83
Ca
be
llS
PR
ING
HIL
L ELE
MEN
TA4
4.3
03
3.8
921.6
44
0.9
872.4
56
9.0
452.5
76
9.8
4
Ca
be
llV
ILLA
GE O
F B
AR
BO
UR
SV
40
.03
23
.41
17.0
026
.08
67.
195
4.9
64
3.8
45
3.3
3
TO
TAL
39
.43
27.
21
16.0
227.
78
66
.67
59
.36
48
.27
57.
71
SCHOOL PARTICIPATION DATA (cont’d)
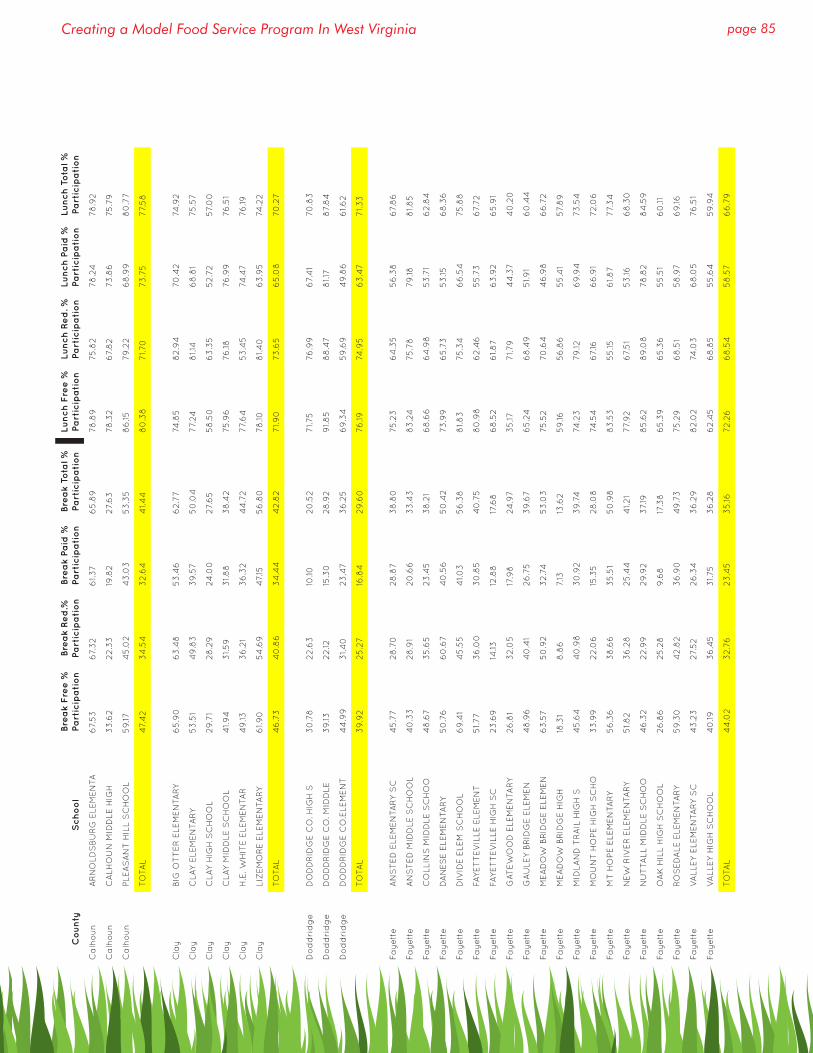
page 85Creating a Model Food Service Program In West Virginia
Co
un
tyS
ch
oo
lBre
ak
Fre
e %
Pa
rtic
ipa
tio
nBre
ak
Re
d.%
Pa
rtic
ipa
tio
nBre
ak
Pa
id %
Pa
rtic
ipa
tio
nBre
ak
Tota
l %
Pa
rtic
ipa
tio
nLu
nch
Fre
e %
Pa
rtic
ipa
tio
nLu
nch
Re
d. %
Pa
rtic
ipa
tio
nLu
nch
Pa
id %
Pa
rtic
ipa
tio
nLu
nch
To
tal %
Pa
rtic
ipa
tio
n
Ca
lho
un
AR
NO
LDS
BU
RG
ELE
MEN
TA6
7.53
67.
32
61.37
65
.89
78
.89
75.8
278
.24
78
.92
Ca
lho
un
CA
LHO
UN
MID
DLE
HIG
H3
3.6
222.3
319
.82
27.
63
78
.32
67.
82
73
.86
75.7
9
Ca
lho
un
PLE
AS
AN
T H
ILL
SC
HO
OL
59
.174
5.0
24
3.0
353
.35
86
.1579
.22
68
.99
80
.77
TO
TAL
47.
42
34
.54
32.6
44
1.4
48
0.3
871.7
073
.75
77.
58
Cla
yBIG
OT
TE
R E
LEM
EN
TARY
65
.90
63
.48
53
.46
62.7
774
.85
82.9
470
.42
74.9
2
Cla
yC
LAY
ELE
MEN
TARY
53
.51
49
.83
39
.57
50
.04
77.
248
1.14
68
.81
75.5
7
Cla
yC
LAY
HIG
H S
CH
OO
L29
.71
28
.29
24.0
027.
65
58
.50
63
.35
52.7
257.
00
Cla
yC
LAY
MID
DLE
SC
HO
OL
41.9
43
1.59
31.8
83
8.4
275
.96
76
.1876
.99
76
.51
Cla
yH
.E. W
HIT
E E
LEM
EN
TAR
49
.133
6.2
13
6.3
24
4.7
277.
64
53
.45
74.4
776
.19
Cla
yLIZ
EM
OR
E E
LEM
EN
TARY
61.9
05
4.6
94
7.15
56
.80
78
.108
1.4
06
3.9
574
.22
TO
TAL
46
.73
40
.86
34
.44
42.8
271.9
073
.65
65
.08
70
.27
Do
dd
rid
ge
DO
DD
RID
GE C
O. H
IGH
S3
0.7
822.6
310
.1020
.52
71.7
576
.99
67.
41
70
.83
Do
dd
rid
ge
DO
DD
RID
GE C
O. M
IDD
LE3
9.13
22.12
15.3
028
.92
91.8
58
8.4
78
1.17
87.
84
Do
dd
rid
ge
DO
DD
RID
GE C
O.E
LEM
EN
T4
4.9
93
1.4
023
.47
36
.25
69
.34
59
.69
49
.86
61.6
2
TO
TAL
39
.92
25
.27
16.8
429
.60
76
.1974
.95
63
.47
71.3
3
Fa
yett
eA
NS
TED
ELE
MEN
TARY
SC
45
.77
28
.70
28
.87
38
.80
75.2
36
4.3
55
6.3
86
7.8
6
Fa
yett
eA
NS
TED
MID
DLE
SC
HO
OL
40
.33
28
.91
20
.66
33
.43
83
.24
75.7
879
.188
1.8
5
Fa
yett
eC
OLL
INS
MID
DLE
SC
HO
O4
8.6
73
5.6
523
.45
38
.21
68
.66
64
.98
53
.71
62.8
4
Fa
yett
eD
AN
ES
E E
LEM
EN
TARY
50
.76
60
.67
40
.56
50
.42
73
.99
65
.73
53
.156
8.3
6
Fa
yett
eD
IVID
E E
LEM
SC
HO
OL
69
.41
45
.55
41.0
35
6.3
88
1.8
375
.34
66
.54
75.8
8
Fa
yett
eFA
YET
TEV
ILLE
ELE
MEN
T5
1.77
36
.00
30
.85
40
.75
80
.98
62.4
65
5.7
36
7.72
Fa
yett
eFA
YET
TEV
ILLE
HIG
H S
C23
.69
14.13
12.8
817
.68
68
.52
61.8
76
3.9
26
5.9
1
Fa
yett
eG
ATEW
OO
D E
LEM
EN
TARY
26
.81
32.0
517
.98
24.9
73
5.17
71.7
94
4.3
74
0.2
0
Fa
yett
eG
AU
LEY
BR
IDG
E E
LEM
EN
48
.96
40
.41
26
.75
39
.67
65
.24
68
.49
51.9
16
0.4
4
Fa
yett
eM
EA
DO
W B
RID
GE E
LEM
EN
63
.57
50
.92
32.7
453
.03
75.5
270
.64
46
.98
66
.72
Fa
yett
eM
EA
DO
W B
RID
GE H
IGH
18.3
18
.86
7.13
13.6
25
9.16
56
.86
55
.41
57.
89
Fa
yett
eM
IDLA
ND
TR
AIL
HIG
H S
45
.64
40
.98
30
.92
39
.74
74.2
379
.126
9.9
473
.54
Fa
yett
eM
OU
NT
HO
PE H
IGH
SC
HO
33
.99
22.0
615
.35
28
.08
74.5
46
7.16
66
.91
72.0
6
Fa
yett
eM
T H
OPE E
LEM
EN
TARY
56
.36
38
.66
35
.51
50
.98
83
.53
55
.156
1.8
777.
34
Fa
yett
eN
EW
RIV
ER
ELE
MEN
TARY
51.8
23
6.2
825
.44
41.21
77.
92
67.
51
53
.166
8.3
0
Fa
yett
eN
UT
TALL
MID
DLE
SC
HO
O4
6.3
222.9
929
.92
37.
198
5.6
28
9.0
878
.82
84
.59
Fa
yett
eO
AK
HIL
L H
IGH
SC
HO
OL
26
.86
25
.28
9.6
817
.38
65
.39
65
.36
55
.51
60
.11
Fa
yett
eR
OS
ED
ALE
ELE
MEN
TARY
59
.30
42.8
23
6.9
04
9.7
375
.29
68
.51
58
.97
69
.16
Fa
yett
eV
ALL
EY
ELE
MEN
TARY
SC
43
.23
27.
52
26
.34
36
.29
82.0
274
.03
68
.05
76
.51
Fa
yett
eV
ALL
EY
HIG
H S
CH
OO
L4
0.19
36
.45
31.7
53
6.2
86
2.4
56
8.8
55
5.6
45
9.9
4
TO
TAL
44
.02
32.7
623
.45
35
.1672.2
66
8.5
45
8.5
76
6.7
9
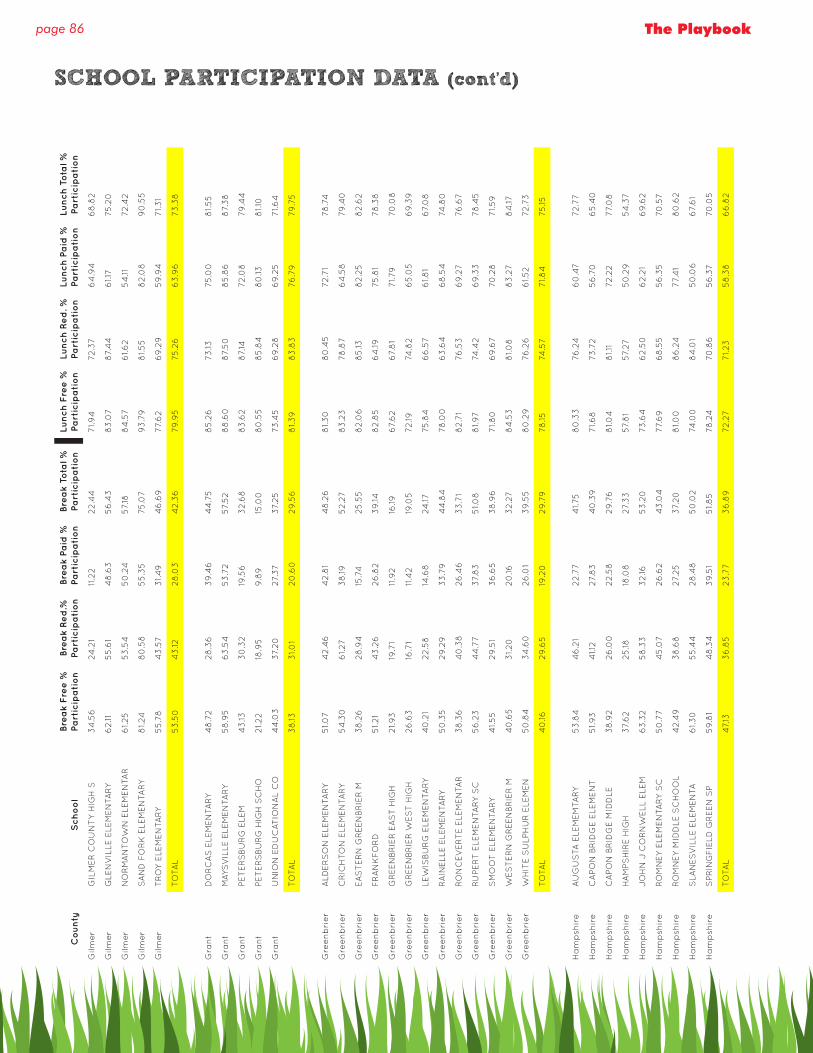
page 86 The Playbook
Co
un
tyS
ch
oo
lBre
ak
Fre
e %
Pa
rtic
ipa
tio
nBre
ak
Re
d.%
Pa
rtic
ipa
tio
nBre
ak
Pa
id %
Pa
rtic
ipa
tio
nBre
ak
Tota
l %
Pa
rtic
ipa
tio
nLu
nch
Fre
e %
Pa
rtic
ipa
tio
nLu
nch
Re
d. %
Pa
rtic
ipa
tio
nLu
nch
Pa
id %
Pa
rtic
ipa
tio
nLu
nch
To
tal %
Pa
rtic
ipa
tio
n
Gilm
er
GIL
ME
R C
OU
NT
Y H
IGH
S3
4.5
624
.21
11.2
222.4
471.9
472.3
76
4.9
46
8.8
2
Gilm
er
GLE
NV
ILLE
ELE
MEN
TARY
62.11
55
.61
48
.63
56
.43
83
.07
87.
44
61.1
775
.20
Gilm
er
NO
RM
AN
TO
WN
ELE
MEN
TAR
61.25
53
.54
50
.24
57.
188
4.5
76
1.6
25
4.11
72.4
2
Gilm
er
SA
ND
FO
RK
ELE
MEN
TARY
81.24
80
.58
55
.35
75.0
79
3.7
98
1.5
58
2.0
89
0.5
5
Gilm
er
TR
OY
ELE
MEN
TARY
55
.78
43
.57
31.4
94
6.6
977.
62
69
.29
59
.94
71.3
1
TO
TAL
53
.50
43
.1228
.03
42.3
679
.95
75.2
66
3.9
673
.38
Gra
nt
DO
RC
AS
ELE
MEN
TARY
48
.72
28
.36
39
.46
44
.75
85
.26
73
.1375
.00
81.5
5
Gra
nt
MAYS
VIL
LE E
LEM
EN
TARY
58
.95
63
.54
53
.72
57.
52
88
.60
87.
50
85
.86
87.
38
Gra
nt
PET
ER
SBU
RG
ELE
M4
3.13
30
.32
19.5
63
2.6
88
3.6
28
7.14
72.0
879
.44
Gra
nt
PET
ER
SBU
RG
HIG
H S
CH
O21.22
18.9
59
.89
15.0
08
0.5
58
5.8
48
0.13
81.1
0
Gra
nt
UN
ION
ED
UC
ATIO
NA
L C
O4
4.0
337.
20
27.
37
37.
25
73
.45
69
.28
69
.25
71.6
4
TO
TAL
38
.133
1.01
20
.60
29
.56
81.3
98
3.8
376
.79
79
.75
Gre
en
bri
er
ALD
ER
SO
N E
LEM
EN
TARY
51.0
74
2.4
64
2.8
14
8.2
68
1.3
08
0.4
572.7
178
.74
Gre
en
bri
er
CR
ICH
TO
N E
LEM
EN
TARY
54
.30
61.27
38
.1952.2
78
3.2
378
.87
64
.58
79
.40
Gre
en
bri
er
EA
ST
ER
N G
REEN
BR
IER
M3
8.2
628
.94
15.7
425
.55
82.0
68
5.13
82.2
58
2.6
2
Gre
en
bri
er
FR
AN
KFO
RD
51.21
43
.26
26
.82
39
.148
2.8
56
4.19
75.8
178
.38
Gre
en
bri
er
GR
EEN
BR
IER
EA
ST
HIG
H21.9
319
.71
11.9
216
.196
7.6
26
7.8
171.7
970
.08
Gre
en
bri
er
GR
EEN
BR
IER
WES
T H
IGH
26
.63
16.7
111
.42
19.0
572.19
74.8
26
5.0
56
9.3
9
Gre
en
bri
er
LEW
ISBU
RG
ELE
MEN
TARY
40
.21
22.5
814
.68
24.17
75.8
46
6.5
76
1.8
16
7.0
8
Gre
en
bri
er
RA
INELL
E E
LEM
EN
TARY
50
.35
29
.29
33
.79
44
.84
78
.00
63
.64
68
.54
74.8
0
Gre
en
bri
er
RO
NC
EV
ER
TE E
LEM
EN
TAR
38
.36
40
.38
26
.46
33
.71
82.7
176
.53
69
.27
76
.67
Gre
en
bri
er
RU
PE
RT
ELE
MEN
TARY
SC
56
.23
44
.77
37.
83
51.0
88
1.9
774
.42
69
.33
78
.45
Gre
en
bri
er
SM
OO
T E
LEM
EN
TARY
41.5
529
.51
36
.65
38
.96
71.8
06
9.6
770
.28
71.5
9
Gre
en
bri
er
WES
TE
RN
GR
EEN
BR
IER
M4
0.6
53
1.20
20
.163
2.2
78
4.5
38
1.08
83
.27
84
.17
Gre
en
bri
er
WH
ITE S
ULP
HU
R E
LEM
EN
50
.84
34
.60
26
.01
39
.55
80
.29
76
.26
61.52
72.7
3
TO
TAL
40
.1629
.65
19.2
029
.79
78
.1574
.57
71.8
475
.15
Ha
mp
shir
eA
UG
US
TA E
LEM
EM
TARY
53
.84
46
.21
22.7
74
1.75
80
.33
76
.24
60
.47
72.7
7
Ha
mp
shir
eC
APO
N B
RID
GE E
LEM
EN
T5
1.9
34
1.12
27.
83
40
.39
71.6
873
.72
56
.70
65
.40
Ha
mp
shir
eC
APO
N B
RID
GE M
IDD
LE3
8.9
226
.00
22.5
829
.76
81.0
48
1.11
72.2
277.
08
Ha
mp
shir
eH
AM
PS
HIR
E H
IGH
37.
62
25
.1818
.08
27.
33
57.
81
57.
27
50
.29
54
.37
Ha
mp
shir
eJO
HN
J C
OR
NW
ELL
ELE
M6
3.3
25
8.3
33
2.16
53
.20
73
.64
62.5
06
2.2
16
9.6
2
Ha
mp
shir
eR
OM
NEY
ELE
MEN
TARY
SC
50
.77
45
.07
26
.62
43
.04
77.
69
68
.55
56
.35
70
.57
Ha
mp
shir
eR
OM
NEY
MID
DLE
SC
HO
OL
42.4
93
8.6
827.
25
37.
20
81.0
08
6.2
477.
41
80
.62
Ha
mp
shir
eS
LAN
ES
VIL
LE E
LEM
EN
TA6
1.3
05
5.4
428
.48
50
.02
74.0
08
4.0
15
0.0
66
7.6
1
Ha
mp
shir
eS
PR
ING
FIE
LD G
REEN
SP
59
.81
48
.34
39
.51
51.8
578
.24
70
.86
56
.37
70
.05
TO
TAL
47.
133
6.8
523
.77
36
.89
72.2
771.23
58
.38
66
.82
SCHOOL PARTICIPATION DATA (cont’d)

page 87Creating a Model Food Service Program In West Virginia
Co
un
tyS
ch
oo
lBre
ak
Fre
e %
Pa
rtic
ipa
tio
nBre
ak
Re
d.%
Pa
rtic
ipa
tio
nBre
ak
Pa
id %
Pa
rtic
ipa
tio
nBre
ak
Tota
l %
Pa
rtic
ipa
tio
nLu
nch
Fre
e %
Pa
rtic
ipa
tio
nLu
nch
Re
d. %
Pa
rtic
ipa
tio
nLu
nch
Pa
id %
Pa
rtic
ipa
tio
nLu
nch
To
tal %
Pa
rtic
ipa
tio
n
Ha
nco
ck
A. T
. ALL
ISO
N E
LEM
EN
33
.30
24.5
58
.68
21.29
64
.81
67.
87
30
.47
48
.98
Ha
nco
ck
BR
OA
DV
IEW
SC
HO
OL
37.
93
16.6
75
.61
22.0
16
1.3
34
0.5
826
.87
44
.40
Ha
nco
ck
LIB
ER
TY
SC
HO
OL
47.
01
37.
61
16.7
029
.90
68
.70
63
.30
37.
82
51.5
5
Ha
nco
ck
NEW
MA
NC
HES
TE
R S
CH
OO
49
.03
29
.29
18.9
63
3.7
16
3.2
34
9.2
928
.45
46
.03
Ha
nco
ck
OA
K G
LEN
HIG
H S
CH
OO
L19
.33
14.9
510
.23
13.5
56
3.6
56
8.6
94
5.7
55
3.13
Ha
nco
ck
OA
K G
LEN
MID
DLE
SC
HO
28
.35
27.
41
6.4
416
.63
76
.63
65
.68
40
.105
6.3
7
Ha
nco
ck
WEIR
HIG
H S
CH
OO
L3
4.6
627.
65
11.4
219
.39
62.8
56
1.23
43
.56
50
.48
Ha
nco
ck
WEIR
MID
DLE
SC
HO
OL
28
.54
31.20
5.3
617
.01
72.5
76
8.3
93
4.16
52.6
1
Ha
nco
ck
WEIR
TO
N H
EIG
HT
S4
5.8
43
4.8
819
.09
36
.55
79
.64
56
.74
42.2
36
6.2
3
TO
TAL
35
.1926
.95
10.3
021.7
86
8.7
16
2.4
937.
66
52.2
0
Ha
rdy
EA
ST
HA
RD
Y E
AR
LY/M
ID5
6.3
35
0.8
137.
93
46
.1073
.06
72.7
757.
30
64
.79
Ha
rdy
EA
ST
HA
RD
Y H
IGH
SC
HO
36
.54
18.8
115
.1021.9
078
.65
72.7
373
.79
75.7
6
Ha
rdy
MO
OR
EF
IELD
ELE
MEN
TAR
51.6
83
8.5
23
1.21
43
.20
75.9
96
8.12
61.8
570
.33
Ha
rdy
MO
OR
EF
IELD
HIG
H S
CH
O24
.83
15.4
99
.02
15.8
873
.22
65
.88
63
.57
67.
61
Ha
rdy
MO
OR
EF
IELD
IN
TE
RM
ED
IAT
E3
3.3
316
.94
17.0
525
.33
85
.69
72.9
476
.99
81.1
0
Ha
rdy
MO
OR
EF
IELD
MID
DLE
SC
27.
40
25
.68
9.6
619
.45
83
.69
85
.52
79
.88
82.3
9
TO
TAL
41.0
03
0.2
122.17
31.26
77.
89
72.3
36
6.7
472.3
2
Ha
rris
on
AD
AM
STO
N E
LEM
EN
TARY
29
.86
30
.08
10.9
121.9
66
4.4
973
.31
38
.51
54
.07
Ha
rris
on
ALT
ER
NAT
IVE L
EA
RN
ING
32.0
316
.42
15.7
028
.04
55
.37
34
.33
43
.39
51.8
4
Ha
rris
on
BIG
ELM
ELE
MEN
TARY
S4
6.7
23
3.8
720
.29
34
.33
75.8
178
.49
63
.43
70
.52
Ha
rris
on
BR
IDG
EPO
RT
HIG
H S
CH
O17
.74
9.5
24
.166
.02
59
.89
63
.27
59
.22
59
.55
Ha
rris
on
BR
IDG
EPO
RT
MID
DLE
19.9
617
.45
9.4
511
.75
84
.32
80
.87
78
.38
79
.77
Ha
rris
on
JO
HN
SO
N E
LEM
EN
TARY
36
.54
31.0
316
.69
20
.39
70
.49
72.9
152.7
75
6.3
1
Ha
rris
on
LIB
ER
TY
HIG
H S
CH
OO
L21.22
13.8
46
.79
14.0
275
.87
73
.01
67.
61
71.9
5
Ha
rris
on
LIN
CO
LN H
IGH
SC
HO
OL
23
.1212
.1912
.90
16.9
16
7.0
26
6.2
86
4.9
76
6.16
Ha
rris
on
LOS
T C
REEK
ELE
MEN
TAR
65
.05
51.8
13
9.0
853
.24
77.
46
79
.52
62.8
771.7
1
Ha
rris
on
LUM
BE
RPO
RT
ELE
MEN
TAR
40
.79
37.
54
21.7
83
4.3
476
.118
1.73
56
.29
70
.04
Ha
rris
on
LUM
BE
RPO
RT
MID
DLE
SC
47.
39
31.9
022.5
83
4.7
879
.45
80
.98
75.7
377.
96
Ha
rris
on
MO
UN
TAIN
EE
R M
IDD
LE S
41.4
23
2.5
524
.89
34
.59
87.
34
86
.27
89
.07
88
.01
Ha
rris
on
NO
RT
H V
IEW
ELE
MEN
TAR
51.27
37.
25
20
.68
41.7
18
3.0
171.57
63
.73
76
.87
Ha
rris
on
NO
RW
OO
D E
LEM
EN
TARY
40
.60
29
.52
21.1
629
.66
71.6
76
3.2
55
5.7
76
2.6
8
Ha
rris
on
NU
TT
ER
FO
RT
IN
TE
RM
ED
35
.75
22.3
814
.25
26
.75
82.8
675
.87
67.
09
76
.55
Ha
rris
on
NU
TT
ER
FO
RT
PR
IMA
RY
36
.41
29
.01
25
.72
31.9
270
.32
66
.98
54
.89
64
.05
Ha
rris
on
RO
BE
RT
C. B
YR
D29
.90
26
.30
10.2
419
.99
71.1
473
.05
63
.40
67.
55
Ha
rris
on
SA
LEM
ELE
MEN
TARY
SC
H6
3.3
470
.23
41.3
05
6.0
378
.23
77.
21
61.8
472.0
7
Ha
rris
on
SIM
PS
ON
ELE
MEN
TARY
38
.21
31.1
49
.41
15.9
373
.90
74.2
55
3.3
45
8.3
4
Ha
rris
on
SO
UT
H H
AR
RIS
ON
HIG
H4
8.4
54
5.7
03
9.5
74
3.6
85
8.3
94
8.6
56
3.5
66
0.5
6
Ha
rris
on
SO
UT
H H
AR
RIS
ON
MID
DL
41.4
728
.1521.8
13
1.4
68
6.8
38
6.7
58
9.2
48
8.4
2
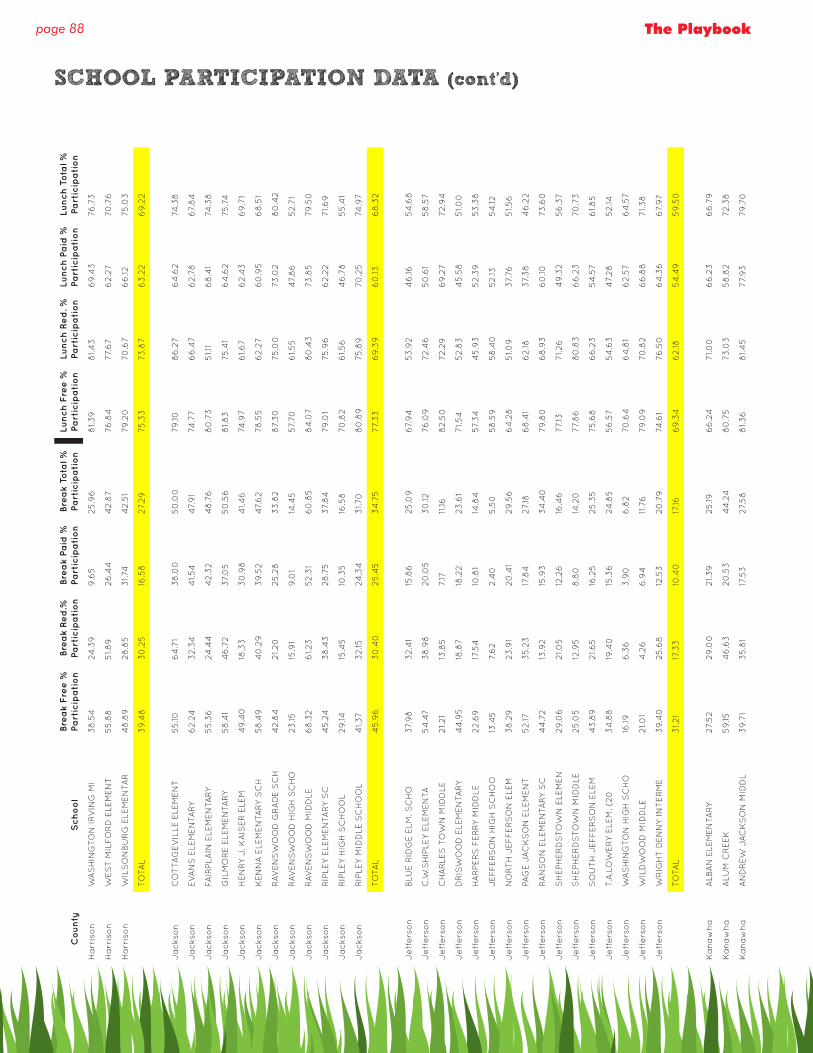
page 88 The Playbook
Co
un
tyS
ch
oo
lBre
ak
Fre
e %
Pa
rtic
ipa
tio
nBre
ak
Re
d.%
Pa
rtic
ipa
tio
nBre
ak
Pa
id %
Pa
rtic
ipa
tio
nBre
ak
Tota
l %
Pa
rtic
ipa
tio
nLu
nch
Fre
e %
Pa
rtic
ipa
tio
nLu
nch
Re
d. %
Pa
rtic
ipa
tio
nLu
nch
Pa
id %
Pa
rtic
ipa
tio
nLu
nch
To
tal %
Pa
rtic
ipa
tio
n
Ha
rris
on
WA
SH
ING
TO
N I
RV
ING
MI
38
.54
24.3
99
.65
25
.96
81.3
98
1.4
36
9.4
376
.73
Ha
rris
on
WES
T M
ILFO
RD
ELE
MEN
T5
5.8
85
1.8
926
.44
42.8
776
.84
77.
67
62.2
770
.76
Ha
rris
on
WIL
SO
NBU
RG
ELE
MEN
TAR
48
.89
28
.85
31.7
44
2.5
179
.20
70
.67
66
.1275
.03
TO
TAL
39
.48
30
.25
16.5
827.
29
75.3
373
.87
63
.22
69
.22
Ja
cks
on
CO
TTA
GEV
ILLE
ELE
MEN
T5
5.10
64
.71
38
.00
50
.00
79
.108
6.2
76
4.6
274
.38
Ja
cks
on
EV
AN
S E
LEM
EN
TARY
62.2
43
2.3
44
1.5
44
7.9
174
.77
66
.47
62.7
86
7.8
4
Ja
cks
on
FAIR
PLA
IN E
LEM
EN
TARY
55
.36
24.4
44
2.3
24
8.7
68
0.7
35
1.11
68
.41
74.3
8
Ja
cks
on
GIL
MO
RE E
LEM
EN
TARY
58
.41
46
.72
37.
05
50
.56
81.8
375
.41
64
.62
75.7
4
Ja
cks
on
HEN
RY
J. K
AIS
ER
ELE
M4
9.4
018
.33
30
.98
41.4
674
.97
61.6
76
2.4
36
9.7
1
Ja
cks
on
KEN
NA
ELE
MEN
TARY
SC
H5
8.4
94
0.2
93
9.5
24
7.6
278
.55
62.2
76
0.9
56
8.5
1
Ja
cks
on
RAV
EN
SW
OO
D G
RA
DE S
CH
42.8
421.20
25
.28
33
.82
87.
30
75.0
073
.02
80
.42
Ja
cks
on
RAV
EN
SW
OO
D H
IGH
SC
HO
23
.1515
.91
9.0
114
.45
57.
70
61.5
54
7.8
652.7
1
Ja
cks
on
RAV
EN
SW
OO
D M
IDD
LE6
8.3
26
1.23
52.3
16
0.8
58
4.0
78
0.4
373
.85
79
.50
Ja
cks
on
RIP
LEY
ELE
MEN
TARY
SC
45
.24
38
.43
28
.75
37.
84
79
.01
75.9
66
2.2
271.6
9
Ja
cks
on
RIP
LEY
HIG
H S
CH
OO
L29
.1415
.45
10.3
516
.58
70
.82
61.5
64
6.7
85
5.4
1
Ja
cks
on
RIP
LEY
MID
DLE
SC
HO
OL
41.37
32.15
24.3
43
1.70
80
.89
75.8
970
.25
74.9
7
TO
TAL
45
.96
30
.40
25
.45
34
.75
77.
33
69
.39
60
.136
8.3
2
Je
ffers
on
BLU
E R
IDG
E E
LM. S
CH
O37.
98
32.4
115
.86
25
.09
67.
94
53
.92
46
.165
4.6
8
Je
ffers
on
C.W
.SH
IPLE
Y E
LEM
EN
TA5
4.4
73
8.9
820
.05
30
.1276
.09
72.4
65
0.6
15
8.5
7
Je
ffers
on
CH
AR
LES
TO
WN
MID
DLE
21.21
13.8
57.
1711
.168
2.5
072.2
96
9.2
772.9
4
Je
ffers
on
DR
ISW
OO
D E
LEM
EN
TARY
44
.95
18.8
718
.22
23
.61
71.5
452.8
34
5.5
85
1.00
Je
ffers
on
HA
RPE
RS
FE
RRY
MID
DLE
22.6
917
.54
10.8
114
.84
57.
34
45
.93
52.3
95
3.3
8
Je
ffers
on
JEF
FE
RS
ON
HIG
H S
CH
OO
13.4
57.
62
2.4
05
.50
58
.59
58
.40
52.13
54
.12
Je
ffers
on
NO
RT
H J
EF
FE
RS
ON
ELE
M3
8.2
923
.91
20
.41
29
.56
64
.28
51.0
937.
76
51.5
6
Je
ffers
on
PAG
E J
AC
KS
ON
ELE
MEN
T52.17
35
.23
17.8
427.
186
8.4
16
2.18
37.
38
46
.22
Je
ffers
on
RA
NS
ON
ELE
MEN
TARY
SC
44
.72
13.9
215
.93
34
.40
79
.80
68
.93
60
.1073
.60
Je
ffers
on
SH
EPH
ER
DS
TO
WN
ELE
MEN
29
.06
21.0
512
.26
16.4
677.
1371.26
49
.32
56
.37
Je
ffers
on
SH
EPH
ER
DS
TO
WN
MID
DLE
25
.05
12.9
58
.80
14.2
077.
86
80
.83
66
.23
70
.73
Je
ffers
on
SO
UT
H J
EF
FE
RS
ON
ELE
M4
3.8
921.6
516
.25
25
.35
75.6
86
6.2
35
4.5
76
1.8
5
Je
ffers
on
T.A
.LO
WE
RY
ELE
M. (
20
34
.88
19.4
015
.36
24.8
55
6.5
75
4.6
34
7.28
52.14
Je
ffers
on
WA
SH
ING
TO
N H
IGH
SC
HO
16.19
6.3
63
.90
6.8
270
.64
64
.81
62.5
76
4.5
7
Je
ffers
on
WIL
DW
OO
D M
IDD
LE21.0
14
.26
6.9
411
.76
79
.09
70
.82
66
.88
71.3
8
Je
ffers
on
WR
IGH
T D
EN
NY
IN
TE
RM
E3
9.4
025
.68
12.5
320
.79
74.6
176
.50
64
.36
67.
97
TO
TAL
31.21
17.3
310
.40
17.16
69
.34
62.18
54
.49
59
.50
Ka
naw
ha
ALB
AN
ELE
MEN
TARY
27.
52
29
.00
21.3
925
.196
6.2
471.0
06
6.2
36
6.7
9
Ka
naw
ha
ALU
M C
REEK
59
.154
6.6
320
.53
44
.24
80
.75
73
.03
58
.82
72.3
8
Ka
naw
ha
AN
DR
EW
JA
CK
SO
N M
IDD
L3
9.7
13
5.8
117
.53
27.
58
81.3
68
1.4
577.
93
79
.70
SCHOOL PARTICIPATION DATA (cont’d)
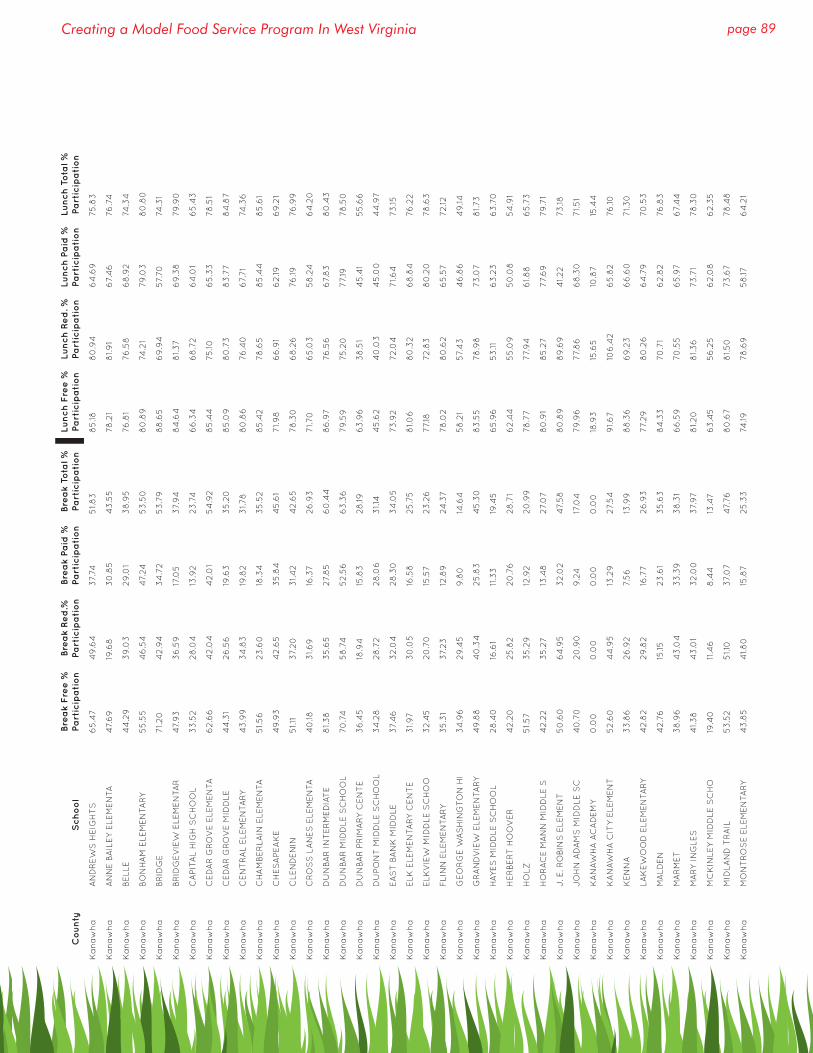
page 89Creating a Model Food Service Program In West Virginia
Co
un
tyS
ch
oo
lBre
ak
Fre
e %
Pa
rtic
ipa
tio
nBre
ak
Re
d.%
Pa
rtic
ipa
tio
nBre
ak
Pa
id %
Pa
rtic
ipa
tio
nBre
ak
Tota
l %
Pa
rtic
ipa
tio
nLu
nch
Fre
e %
Pa
rtic
ipa
tio
nLu
nch
Re
d. %
Pa
rtic
ipa
tio
nLu
nch
Pa
id %
Pa
rtic
ipa
tio
nLu
nch
To
tal %
Pa
rtic
ipa
tio
n
Ka
naw
ha
AN
DR
EW
S H
EIG
HT
S6
5.4
74
9.6
437.
745
1.8
38
5.18
80
.94
64
.69
75.8
3
Ka
naw
ha
AN
NE B
AIL
EY
ELE
MEN
TA4
7.6
919
.68
30
.85
43
.55
78
.21
81.9
16
7.4
676
.74
Ka
naw
ha
BELL
E4
4.2
93
9.0
329
.01
38
.95
76
.81
76
.58
68
.92
74.3
4
Ka
naw
ha
BO
NH
AM
ELE
MEN
TARY
55
.55
46
.54
47.
2453
.50
80
.89
74.2
179
.03
80
.80
Ka
naw
ha
BR
IDG
E71.20
42.9
43
4.7
253
.79
88
.65
69
.94
57.
70
74.3
1
Ka
naw
ha
BR
IDG
EV
IEW
ELE
MEN
TAR
47.
93
36
.59
17.0
537.
94
84
.64
81.37
69
.38
79
.90
Ka
naw
ha
CA
PIT
AL
HIG
H S
CH
OO
L3
3.5
228
.04
13.9
223
.74
66
.34
68
.72
64
.01
65
.43
Ka
naw
ha
CED
AR
GR
OV
E E
LEM
EN
TA6
2.6
64
2.0
44
2.0
15
4.9
28
5.4
475
.106
5.3
378
.51
Ka
naw
ha
CED
AR
GR
OV
E M
IDD
LE4
4.3
126
.56
19.6
33
5.2
08
5.0
98
0.7
38
3.7
78
4.8
7
Ka
naw
ha
CEN
TR
AL
ELE
MEN
TARY
43
.99
34
.83
19.8
23
1.78
80
.86
76
.40
67.
71
74.3
6
Ka
naw
ha
CH
AM
BE
RLA
IN E
LEM
EN
TA5
1.5
623
.60
18.3
43
5.5
28
5.4
278
.65
85
.44
85
.61
Ka
naw
ha
CH
ES
APEA
KE
49
.93
42.6
53
5.8
44
5.6
171.9
86
6.9
16
2.19
69
.21
Ka
naw
ha
CLE
ND
EN
IN5
1.11
37.
20
31.4
24
2.6
578
.30
68
.26
76
.1976
.99
Ka
naw
ha
CR
OS
S L
AN
ES
ELE
MEN
TA4
0.18
31.6
916
.37
26
.93
71.7
06
5.0
35
8.2
46
4.2
0
Ka
naw
ha
DU
NBA
R I
NT
ER
MED
IAT
E8
1.3
83
5.6
527.
85
60
.44
86
.97
76
.56
67.
83
80
.43
Ka
naw
ha
DU
NBA
R M
IDD
LE S
CH
OO
L70
.74
58
.74
52.5
66
3.3
679
.59
75.2
077.
1978
.50
Ka
naw
ha
DU
NBA
R P
RIM
ARY
CEN
TE
36
.45
18.9
415
.83
28
.196
3.9
63
8.5
14
5.4
15
5.6
6
Ka
naw
ha
DU
PO
NT
MID
DLE
SC
HO
OL
34
.28
28
.72
28
.06
31.1
44
5.6
24
0.0
34
5.0
04
4.9
7
Ka
naw
ha
EA
ST
BA
NK
MID
DLE
37.
46
32.0
428
.30
34
.05
73
.92
72.0
471.6
473
.15
Ka
naw
ha
ELK
ELE
MEN
TARY
CEN
TE
31.9
73
0.0
516
.58
25
.75
81.0
68
0.3
26
8.8
476
.22
Ka
naw
ha
ELK
VIE
W M
IDD
LE S
CH
OO
32.4
520
.70
15.5
723
.26
77.
1872.8
38
0.2
078
.63
Ka
naw
ha
FLIN
N E
LEM
EN
TARY
35
.31
37.
23
12.8
924
.37
78
.02
80
.62
65
.57
72.12
Ka
naw
ha
GEO
RG
E W
AS
HIN
GTO
N H
I3
4.9
629
.45
9.8
014
.64
58
.21
57.
43
46
.86
49
.14
Ka
naw
ha
GR
AN
DV
IEW
ELE
MEN
TARY
49
.88
40
.34
25
.83
45
.30
83
.55
78
.98
73
.07
81.7
3
Ka
naw
ha
HAY
ES
MID
DLE
SC
HO
OL
28
.40
16.6
111
.33
19.4
56
5.9
65
3.11
63
.23
63
.70
Ka
naw
ha
HE
RBE
RT
HO
OV
ER
42.2
025
.82
20
.76
28
.71
62.4
45
5.0
95
0.0
85
4.9
1
Ka
naw
ha
HO
LZ5
1.57
35
.29
12.9
220
.99
78
.77
77.
94
61.8
86
5.7
3
Ka
naw
ha
HO
RA
CE M
AN
N M
IDD
LE S
42.2
23
5.2
713
.48
27.
07
80
.91
85
.27
77.
69
79
.71
Ka
naw
ha
J. E
. RO
BIN
S E
LEM
EN
T5
0.6
06
4.9
53
2.0
24
7.5
88
0.8
98
9.6
94
1.22
73
.18
Ka
naw
ha
JO
HN
AD
AM
S M
IDD
LE S
C4
0.7
020
.90
9.2
417
.04
79
.96
77.
86
68
.30
71.5
1
Ka
naw
ha
KA
NAW
HA
AC
AD
EM
Y0
.00
0.0
00
.00
0.0
018
.93
15.6
510
.87
15.4
4
Ka
naw
ha
KA
NAW
HA
CIT
Y E
LEM
EN
T52.6
04
4.9
513
.29
27.
54
91.6
710
6.4
26
5.8
276
.10
Ka
naw
ha
KEN
NA
33
.86
26
.92
7.5
613
.99
88
.36
69
.23
66
.60
71.3
0
Ka
naw
ha
LAK
EW
OO
D E
LEM
EN
TARY
42.8
229
.82
16.7
726
.93
77.
29
80
.26
64
.79
70
.53
Ka
naw
ha
MA
LDEN
42.7
615
.1523
.61
35
.63
84
.33
70
.71
62.8
276
.83
Ka
naw
ha
MA
RM
ET
38
.96
43
.04
33
.39
38
.31
66
.59
70
.55
65
.97
67.
44
Ka
naw
ha
MA
RY
IN
GLE
S4
1.3
84
3.0
13
2.0
037.
97
81.20
81.3
673
.71
78
.30
Ka
naw
ha
MC
KIN
LEY
MID
DLE
SC
HO
19.4
011
.46
8.4
413
.47
63
.45
56
.25
62.0
86
2.3
5
Ka
naw
ha
MID
LAN
D T
RA
IL53
.52
51.1
037.
07
47.
76
80
.67
81.5
073
.67
78
.48
Ka
naw
ha
MO
NT
RO
SE E
LEM
EN
TARY
43
.85
41.8
015
.87
25
.33
74.19
78
.69
58
.176
4.2
1
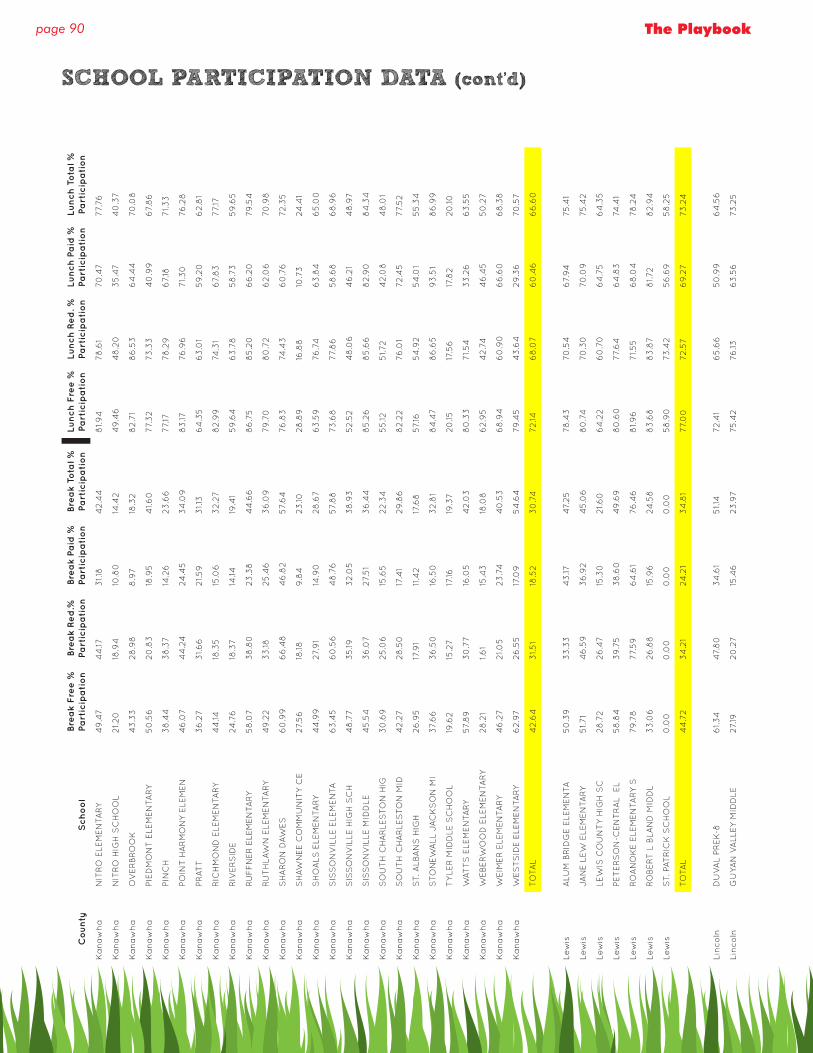
page 90 The Playbook
Co
un
tyS
ch
oo
lBre
ak
Fre
e %
Pa
rtic
ipa
tio
nBre
ak
Re
d.%
Pa
rtic
ipa
tio
nBre
ak
Pa
id %
Pa
rtic
ipa
tio
nBre
ak
Tota
l %
Pa
rtic
ipa
tio
nLu
nch
Fre
e %
Pa
rtic
ipa
tio
nLu
nch
Re
d. %
Pa
rtic
ipa
tio
nLu
nch
Pa
id %
Pa
rtic
ipa
tio
nLu
nch
To
tal %
Pa
rtic
ipa
tio
n
Ka
naw
ha
NIT
RO
ELE
MEN
TARY
49
.47
44
.173
1.18
42.4
48
1.9
478
.61
70
.47
77.
76
Ka
naw
ha
NIT
RO
HIG
H S
CH
OO
L21.20
18.9
410
.80
14.4
24
9.4
64
8.2
03
5.4
74
0.3
7
Ka
naw
ha
OV
ER
BR
OO
K4
3.3
328
.98
8.9
718
.32
82.7
18
6.5
36
4.4
470
.08
Ka
naw
ha
PIE
DM
ON
T E
LEM
EN
TARY
50
.56
20
.83
18.9
54
1.6
077.
32
73
.33
40
.99
67.
86
Ka
naw
ha
PIN
CH
38
.44
38
.37
14.2
623
.66
77.
1778
.29
67.
1871.3
3
Ka
naw
ha
PO
INT
HA
RM
ON
Y E
LEM
EN
46
.07
44
.24
24.4
53
4.0
98
3.17
76
.96
71.3
076
.28
Ka
naw
ha
PR
ATT
36
.27
31.6
621.59
31.1
36
4.3
56
3.0
15
9.2
06
2.8
1
Ka
naw
ha
RIC
HM
ON
D E
LEM
EN
TARY
44
.1418
.35
15.0
63
2.2
78
2.9
974
.31
67.
83
77.
17
Ka
naw
ha
RIV
ER
SID
E24
.76
18.3
714
.1419
.41
59
.64
63
.78
58
.73
59
.65
Ka
naw
ha
RU
FF
NE
R E
LEM
EN
TARY
58
.07
38
.80
23
.38
44
.66
86
.75
85
.20
66
.20
79
.54
Ka
naw
ha
RU
TH
LAW
N E
LEM
EN
TARY
49
.22
33
.1825
.46
36
.09
79
.70
80
.72
62.0
670
.98
Ka
naw
ha
SH
AR
ON
DAW
ES
60
.99
66
.48
46
.82
57.
64
76
.83
74.4
36
0.7
672.3
5
Ka
naw
ha
SH
AW
NEE C
OM
MU
NIT
Y C
E27.
56
18.18
9.8
423
.1028
.89
16.8
810
.73
24.4
1
Ka
naw
ha
SH
OA
LS E
LEM
EN
TARY
44
.99
27.
91
14.9
028
.67
63
.59
76
.74
63
.84
65
.00
Ka
naw
ha
SIS
SO
NV
ILLE
ELE
MEN
TA6
3.4
56
0.5
64
8.7
657.
88
73
.68
77.
86
58
.68
68
.96
Ka
naw
ha
SIS
SO
NV
ILLE
HIG
H S
CH
48
.77
35
.193
2.0
53
8.9
352.5
24
8.0
64
6.2
14
8.9
7
Ka
naw
ha
SIS
SO
NV
ILLE
MID
DLE
45
.54
36
.07
27.
51
36
.44
85
.26
85
.66
82.9
08
4.3
4
Ka
naw
ha
SO
UT
H C
HA
RLE
STO
N H
IG3
0.6
925
.06
15.6
522.3
45
5.12
51.7
24
2.0
84
8.0
1
Ka
naw
ha
SO
UT
H C
HA
RLE
STO
N M
ID4
2.2
728
.50
17.4
129
.86
82.2
276
.01
72.4
577.
52
Ka
naw
ha
ST.
ALB
AN
S H
IGH
26
.95
17.9
111
.42
17.6
857.
165
4.9
25
4.0
15
5.3
4
Ka
naw
ha
STO
NEW
ALL
JA
CK
SO
N M
I37.
66
36
.50
16.5
03
2.8
18
4.4
78
6.6
59
3.5
18
6.9
9
Ka
naw
ha
TY
LER
MID
DLE
SC
HO
OL
19.6
215
.27
17.16
19.3
720
.1517
.56
17.8
220
.10
Ka
naw
ha
WAT
TS
ELE
MEN
TARY
57.
89
30
.77
16.0
54
2.0
38
0.3
371.5
43
3.2
66
3.5
5
Ka
naw
ha
WEBE
RW
OO
D E
LEM
EN
TARY
28
.21
1.6
115
.43
18.0
86
2.9
54
2.7
44
6.4
55
0.2
7
Ka
naw
ha
WEIM
ER
ELE
MEN
TARY
46
.27
21.0
523
.74
40
.53
68
.94
60
.90
66
.60
68
.38
Ka
naw
ha
WES
TS
IDE E
LEM
EN
TARY
62.9
726
.55
17.0
95
4.6
479
.45
43
.64
29
.36
70
.57
TO
TAL
42.6
43
1.5
118
.52
30
.74
72.14
68
.07
60
.46
66
.60
Lew
isA
LUM
BR
IDG
E E
LEM
EN
TA5
0.3
93
3.3
34
3.17
47.
25
78
.43
70
.54
67.
94
75.4
1
Lew
isJA
NE L
EW
ELE
MEN
TARY
51.7
14
6.5
93
6.9
24
5.0
68
0.7
470
.30
70
.09
75.4
2
Lew
isLE
WIS
CO
UN
TY
HIG
H S
C28
.72
26
.47
15.3
021.6
06
4.2
26
0.7
06
4.7
56
4.3
5
Lew
isPET
ER
SO
N-C
EN
TR
AL
EL
58
.84
39
.75
38
.60
49
.69
80
.60
77.
64
64
.83
74.4
1
Lew
isR
OA
NO
KE E
LEM
EN
TARY
S79
.78
77.
59
64
.61
76
.46
81.9
671.5
56
8.0
478
.24
Lew
isR
OBE
RT
L B
LAN
D M
IDD
L3
3.0
626
.88
15.9
624
.58
83
.68
83
.87
81.7
28
2.9
4
Lew
isS
T. P
ATR
ICK
SC
HO
OL
0.0
00
.00
0.0
00
.00
58
.90
73
.42
56
.69
58
.25
TO
TAL
44
.72
34
.21
24.2
13
4.8
177.
00
72.5
76
9.2
773
.24
Lin
coln
DU
VA
L PR
EK
-86
1.3
44
7.8
03
4.6
15
1.14
72.4
16
5.6
65
0.9
96
4.5
6
Lin
coln
GU
YAN
VA
LLEY
MID
DLE
27.
1920
.27
15.4
623
.97
75.4
276
.136
3.5
673
.25
SCHOOL PARTICIPATION DATA (cont’d)
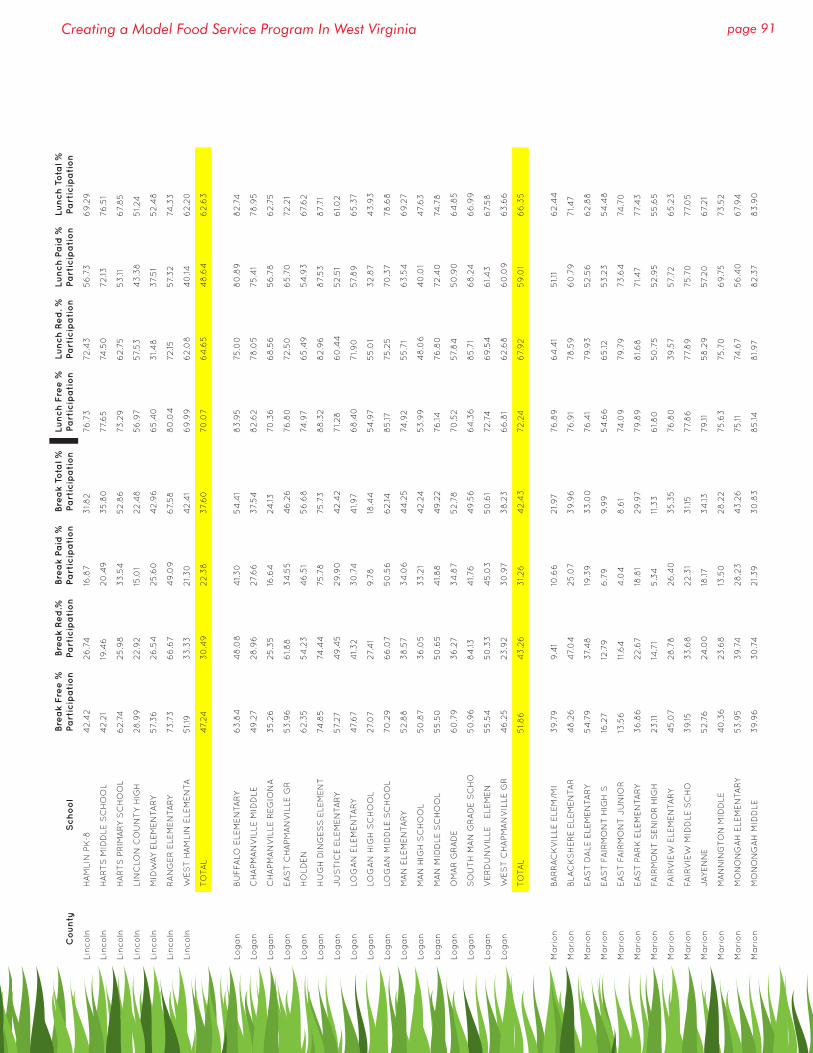
page 91Creating a Model Food Service Program In West Virginia
Co
un
tyS
ch
oo
lBre
ak
Fre
e %
Pa
rtic
ipa
tio
nBre
ak
Re
d.%
Pa
rtic
ipa
tio
nBre
ak
Pa
id %
Pa
rtic
ipa
tio
nBre
ak
Tota
l %
Pa
rtic
ipa
tio
nLu
nch
Fre
e %
Pa
rtic
ipa
tio
nLu
nch
Re
d. %
Pa
rtic
ipa
tio
nLu
nch
Pa
id %
Pa
rtic
ipa
tio
nLu
nch
To
tal %
Pa
rtic
ipa
tio
n
Lin
coln
HA
MLIN
PK
-84
2.4
226
.74
16.8
73
1.8
276
.73
72.4
35
6.7
36
9.2
9
Lin
coln
HA
RT
S M
IDD
LE S
CH
OO
L4
2.2
119
.46
20
.49
35
.80
77.
65
74.5
072.13
76
.51
Lin
coln
HA
RT
S P
RIM
ARY
SC
HO
OL
62.7
425
.98
33
.54
52.8
673
.29
62.7
55
3.11
67.
85
Lin
coln
LIN
CLO
N C
OU
NT
Y H
IGH
28
.99
22.9
215
.01
22.4
85
6.9
757.
53
43
.38
51.24
Lin
coln
MID
WAY
ELE
MEN
TARY
57.
36
26
.54
25
.60
42.9
66
5.4
03
1.4
837.
51
52.4
8
Lin
coln
RA
NG
ER
ELE
MEN
TARY
73
.73
66
.67
49
.09
67.
58
80
.04
72.15
57.
32
74.3
3
Lin
coln
WES
T H
AM
LIN
ELE
MEN
TA5
1.19
33
.33
21.3
04
2.4
16
9.9
96
2.0
84
0.14
62.2
0
TO
TAL
47.
243
0.4
922.3
837.
60
70
.07
64
.65
48
.64
62.6
3
Log
an
BU
FFA
LO E
LEM
EN
TARY
63
.84
48
.08
41.3
05
4.4
18
3.9
575
.00
80
.89
82.7
4
Log
an
CH
APM
AN
VIL
LE M
IDD
LE4
9.2
728
.96
27.
66
37.
54
82.6
278
.05
75.4
178
.95
Log
an
CH
APM
AN
VIL
LE R
EG
ION
A3
5.2
625
.35
16.6
424
.1370
.36
68
.56
56
.78
62.7
5
Log
an
EA
ST
CH
APM
AN
VIL
LE G
R53
.96
61.8
83
4.5
54
6.2
676
.80
72.5
06
5.7
072.2
1
Log
an
HO
LDEN
62.3
55
4.2
34
6.5
15
6.6
874
.97
65
.49
54
.93
67.
62
Log
an
HU
GH
DIN
GES
S E
LEM
EN
T74
.85
74.4
475
.78
75.7
38
8.3
28
2.9
68
7.53
87.
71
Log
an
JU
ST
ICE E
LEM
EN
TARY
57.
27
49
.45
29
.90
42.4
271.28
60
.44
52.5
16
1.02
Log
an
LOG
AN
ELE
MEN
TARY
47.
67
41.3
23
0.7
44
1.9
76
8.4
071.9
057.
89
65
.37
Log
an
LOG
AN
HIG
H S
CH
OO
L27.
07
27.
41
9.7
818
.44
54
.97
55
.01
32.8
74
3.9
3
Log
an
LOG
AN
MID
DLE
SC
HO
OL
70
.29
66
.07
50
.56
62.14
85
.1775
.25
70
.37
78
.68
Log
an
MA
N E
LEM
EN
TARY
52.8
83
8.5
73
4.0
64
4.2
574
.92
55
.71
63
.54
69
.27
Log
an
MA
N H
IGH
SC
HO
OL
50
.87
36
.05
33
.21
42.2
453
.99
48
.06
40
.01
47.
63
Log
an
MA
N M
IDD
LE S
CH
OO
L5
5.5
05
0.6
54
1.8
84
9.2
276
.1476
.80
72.4
074
.78
Log
an
OM
AR
GR
AD
E6
0.7
93
6.2
73
4.8
752.7
870
.52
57.
84
50
.90
64
.85
Log
an
SO
UT
H M
AN
GR
AD
E S
CH
O5
0.9
68
4.13
41.7
64
9.5
66
4.3
68
5.7
16
8.2
46
6.9
9
Log
an
VE
RD
UN
VIL
LE E
LEM
EN
55
.54
50
.33
45
.03
50
.61
72.7
46
9.5
46
1.4
36
7.5
8
Log
an
WES
T C
HA
PM
AN
VIL
LE G
R4
6.2
523
.92
30
.97
38
.23
66
.81
62.6
86
0.0
96
3.6
6
TO
TAL
51.8
64
3.2
63
1.26
42.4
372.2
46
7.9
25
9.0
16
6.3
5
Ma
rio
nBA
RR
AC
KV
ILLE
ELE
M/M
I3
9.7
99
.41
10.6
621.9
776
.89
64
.41
51.1
16
2.4
4
Ma
rio
nBLA
CK
SH
ER
E E
LEM
EN
TAR
48
.26
47.
04
25
.07
39
.96
76
.91
78
.59
60
.79
71.4
7
Ma
rio
nEA
ST
DA
LE E
LEM
EN
TARY
54
.79
37.
48
19.3
93
3.0
076
.41
79
.93
52.5
66
2.8
8
Ma
rio
nEA
ST
FA
IRM
ON
T H
IGH
S16
.27
12.7
96
.79
9.9
95
4.6
66
5.12
53
.23
54
.48
Ma
rio
nEA
ST
FA
IRM
ON
T J
UN
IOR
13.5
611
.64
4.0
48
.61
74.0
979
.79
73
.64
74.7
0
Ma
rio
nEA
ST
PA
RK
ELE
MEN
TARY
36
.86
22.6
718
.81
29
.97
79
.89
81.6
871.4
777.
43
Ma
rio
nFA
IRM
ON
T S
EN
IOR
HIG
H23
.1114
.71
5.3
411
.33
61.8
05
0.7
552.9
55
5.6
5
Ma
rio
nFA
IRV
IEW
ELE
MEN
TARY
45
.07
28
.78
26
.40
35
.35
76
.80
39
.57
57.
72
65
.23
Ma
rio
nFA
IRV
IEW
MID
DLE
SC
HO
39
.153
3.6
822.3
13
1.15
77.
86
77.
89
75.7
077.
05
Ma
rio
nJAY
EN
NE
52.7
624
.00
18.17
34
.1379
.115
8.2
957.
20
67.
21
Ma
rio
nM
AN
NIN
GTO
N M
IDD
LE4
0.3
623
.68
13.5
028
.22
75.6
375
.70
69
.75
73
.52
Ma
rio
nM
ON
ON
GA
H E
LEM
EN
TARY
53
.95
39
.74
28
.23
43
.26
75.11
74.6
75
6.4
06
7.9
4
Ma
rio
nM
ON
ON
GA
H M
IDD
LE3
9.9
63
0.7
421.3
93
0.8
38
5.14
81.9
78
2.3
78
3.9
0
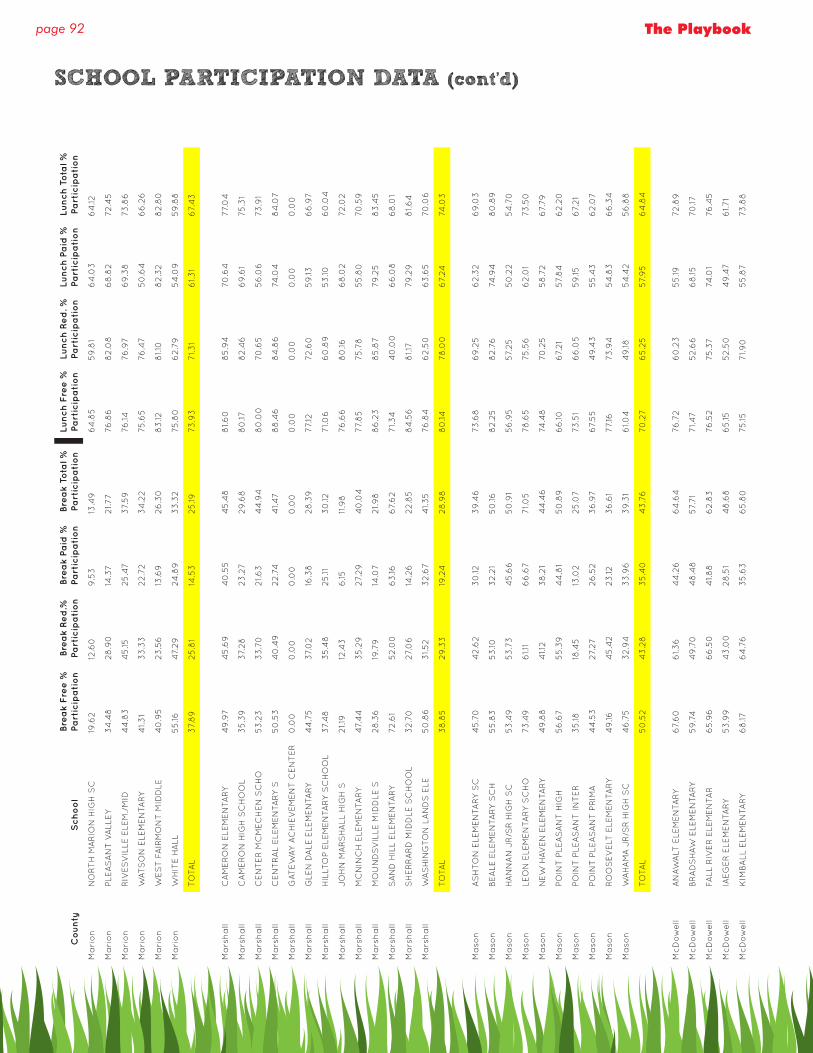
page 92 The Playbook
Co
un
tyS
ch
oo
lBre
ak
Fre
e %
Pa
rtic
ipa
tio
nBre
ak
Re
d.%
Pa
rtic
ipa
tio
nBre
ak
Pa
id %
Pa
rtic
ipa
tio
nBre
ak
Tota
l %
Pa
rtic
ipa
tio
nLu
nch
Fre
e %
Pa
rtic
ipa
tio
nLu
nch
Re
d. %
Pa
rtic
ipa
tio
nLu
nch
Pa
id %
Pa
rtic
ipa
tio
nLu
nch
To
tal %
Pa
rtic
ipa
tio
n
Ma
rio
nN
OR
TH
MA
RIO
N H
IGH
SC
19.6
212
.60
9.5
313
.49
64
.85
59
.81
64
.03
64
.12
Ma
rio
nPLE
AS
AN
T V
ALL
EY
34
.48
28
.90
14.3
721.7
776
.86
82.0
86
8.8
272.4
5
Ma
rio
nR
IVES
VIL
LE E
LEM
./M
ID4
4.8
34
5.15
25
.47
37.
59
76
.1476
.97
69
.38
73
.86
Ma
rio
nW
ATS
ON
ELE
MEN
TARY
41.3
13
3.3
322.7
23
4.2
275
.65
76
.47
50
.64
66
.26
Ma
rio
nW
ES
T F
AIR
MO
NT
MID
DLE
40
.95
23
.56
13.6
926
.30
83
.128
1.10
82.3
28
2.8
0
Ma
rio
nW
HIT
E H
ALL
55
.164
7.29
24.8
93
3.3
275
.80
62.7
95
4.0
95
9.8
8
TO
TAL
37.
89
25
.81
14.5
325
.1973
.93
71.3
16
1.3
16
7.4
3
Ma
rsh
all
CA
ME
RO
N E
LEM
EN
TARY
49
.97
45
.69
40
.55
45
.48
81.6
08
5.9
470
.64
77.
04
Ma
rsh
all
CA
ME
RO
N H
IGH
SC
HO
OL
35
.39
37.
28
23
.27
29
.68
80
.178
2.4
66
9.6
175
.31
Ma
rsh
all
CEN
TE
R M
CM
EC
HEN
SC
HO
53
.23
33
.70
21.6
34
4.9
48
0.0
070
.65
56
.06
73
.91
Ma
rsh
all
CEN
TR
AL
ELE
MEN
TARY
S5
0.5
34
0.4
922.7
44
1.4
78
8.4
68
4.8
674
.04
84
.07
Ma
rsh
all
GAT
EW
AY
AC
HIE
VEM
EN
T C
EN
TE
R0
.00
0.0
00
.00
0.0
00
.00
0.0
00
.00
0.0
0
Ma
rsh
all
GLE
N D
ALE
ELE
MEN
TARY
44
.75
37.
02
16.3
828
.39
77.
1272.6
059
.136
6.9
7
Ma
rsh
all
HIL
LTO
P E
LEM
EN
TARY
SC
HO
OL
37.
48
35
.48
25
.113
0.12
71.0
66
0.8
95
3.10
60
.04
Ma
rsh
all
JO
HN
MA
RS
HA
LL H
IGH
S21.1
912
.43
6.15
11.9
876
.66
80
.166
8.0
272.0
2
Ma
rsh
all
MC
NIN
CH
ELE
MEN
TARY
47.
44
35
.29
27.
29
40
.04
77.
85
75.7
85
5.8
070
.59
Ma
rsh
all
MO
UN
DS
VIL
LE M
IDD
LE S
28
.36
19.7
914
.07
21.9
88
6.2
38
5.8
779
.25
83
.45
Ma
rsh
all
SA
ND
HIL
L ELE
MEN
TARY
72.6
152.0
06
3.16
67.
62
71.3
44
0.0
06
6.0
86
8.0
1
Ma
rsh
all
SH
ER
RA
RD
MID
DLE
SC
HO
OL
32.7
027.
06
14.2
622.8
58
4.5
68
1.17
79
.29
81.6
4
Ma
rsh
all
WA
SH
ING
TO
N L
AN
DS
ELE
50
.86
31.52
32.6
74
1.3
576
.84
62.5
06
3.6
570
.06
TO
TAL
38
.85
29
.33
19.2
428
.98
80
.1478
.00
67.
2474
.03
Ma
son
AS
HTO
N E
LEM
EN
TARY
SC
45
.70
42.6
23
0.12
39
.46
73
.68
69
.25
62.3
26
9.0
3
Ma
son
BEA
LE E
LEM
EN
TARY
SC
H5
5.8
353
.103
2.2
15
0.16
82.2
58
2.7
674
.94
80
.89
Ma
son
HA
NN
AN
JR
/SR
HIG
H S
C53
.49
53
.73
45
.66
50
.91
56
.95
57.
25
50
.22
54
.70
Ma
son
LEO
N E
LEM
EN
TARY
SC
HO
73
.49
61.1
16
6.6
771.0
578
.65
75.5
66
2.0
173
.50
Ma
son
NEW
HAV
EN
ELE
MEN
TARY
49
.88
41.1
23
8.2
14
4.4
674
.48
70
.25
58
.72
67.
79
Ma
son
PO
INT
PLE
AS
AN
T H
IGH
56
.67
55
.39
44
.81
50
.89
66
.106
7.21
57.
84
62.2
0
Ma
son
PO
INT
PLE
AS
AN
T I
NT
ER
35
.1818
.45
13.0
225
.07
73
.51
66
.05
59
.156
7.21
Ma
son
PO
INT
PLE
AS
AN
T P
RIM
A4
4.5
327.
27
26
.52
36
.97
67.
55
49
.43
55
.43
62.0
7
Ma
son
RO
OS
EV
ELT
ELE
MEN
TARY
49
.164
5.4
223
.123
6.6
177.
1673
.94
54
.83
66
.34
Ma
son
WA
HA
MA
JR
/SR
HIG
H S
C4
6.7
53
2.9
43
3.9
63
9.3
16
1.04
49
.185
4.4
25
6.8
8
TO
TAL
50
.52
43
.28
35
.40
43
.76
70
.27
65
.25
57.
95
64
.84
McD
ow
ell
AN
AW
ALT
ELE
MEN
TARY
67.
60
61.3
64
4.2
66
4.6
476
.72
60
.23
55
.1972.8
9
McD
ow
ell
BR
AD
SH
AW
ELE
MEN
TARY
59
.74
49
.70
48
.48
57.
71
71.4
752.6
66
8.15
70
.17
McD
ow
ell
FALL
RIV
ER
ELE
MEN
TAR
65
.96
66
.50
41.8
86
2.8
376
.52
75.3
774
.01
76
.45
McD
ow
ell
IAEG
ER
ELE
MEN
TARY
53
.99
43
.00
28
.51
48
.68
65
.1552.5
04
9.4
76
1.71
McD
ow
ell
KIM
BA
LL E
LEM
EN
TARY
68
.176
4.7
63
5.6
36
5.8
075
.1571.9
05
5.8
773
.88
SCHOOL PARTICIPATION DATA (cont’d)
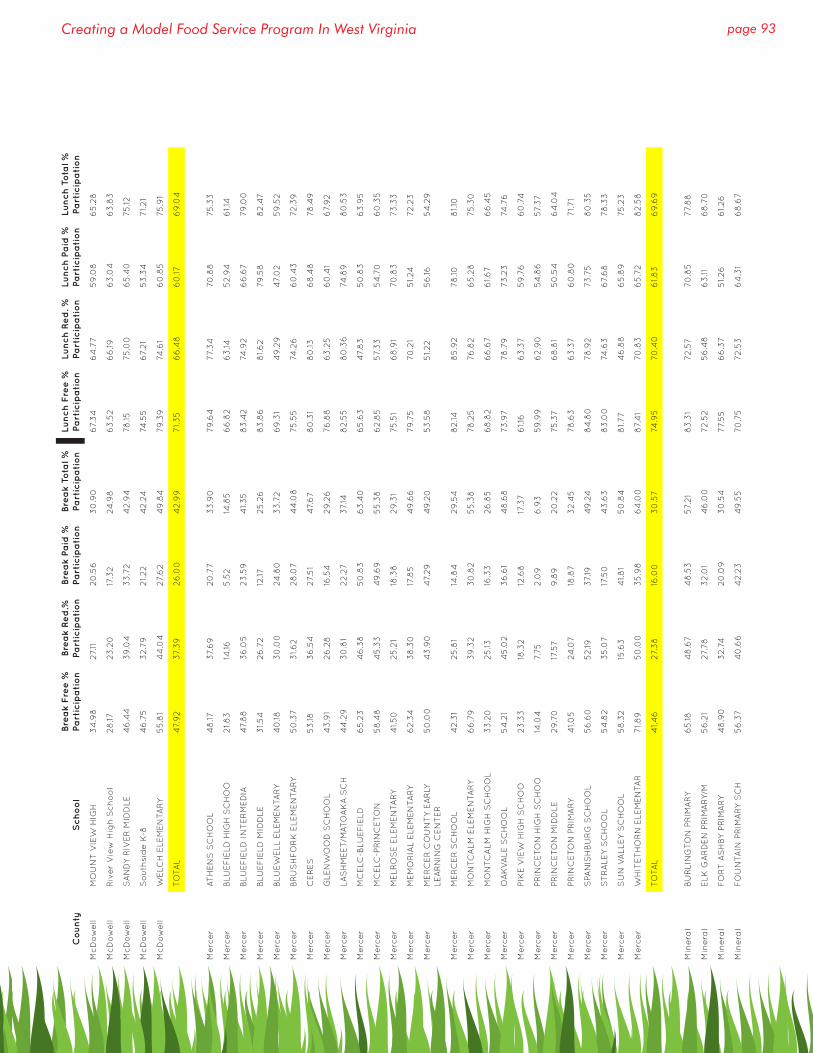
page 93Creating a Model Food Service Program In West Virginia
Co
un
tyS
ch
oo
lBre
ak
Fre
e %
Pa
rtic
ipa
tio
nBre
ak
Re
d.%
Pa
rtic
ipa
tio
nBre
ak
Pa
id %
Pa
rtic
ipa
tio
nBre
ak
Tota
l %
Pa
rtic
ipa
tio
nLu
nch
Fre
e %
Pa
rtic
ipa
tio
nLu
nch
Re
d. %
Pa
rtic
ipa
tio
nLu
nch
Pa
id %
Pa
rtic
ipa
tio
nLu
nch
To
tal %
Pa
rtic
ipa
tio
n
McD
ow
ell
MO
UN
T V
IEW
HIG
H3
4.9
827.
1120
.56
30
.90
67.
34
64
.77
59
.08
65
.28
McD
ow
ell
Riv
er
Vie
w H
igh
Sch
oo
l28
.1723
.20
17.3
224
.98
63
.52
66
.196
3.0
46
3.8
3
McD
ow
ell
SA
ND
Y R
IVE
R M
IDD
LE4
6.4
43
9.0
43
3.7
24
2.9
478
.1575
.00
65
.40
75.12
McD
ow
ell
So
uth
sid
e K
-84
6.7
53
2.7
921.22
42.2
474
.55
67.
21
53
.34
71.21
McD
ow
ell
WELC
H E
LEM
EN
TARY
55
.81
44
.04
27.
62
49
.84
79
.39
74.6
16
0.8
575
.91
TO
TAL
47.
92
37.
39
26
.00
42.9
971.3
56
6.4
86
0.17
69
.04
Merc
er
ATH
EN
S S
CH
OO
L4
8.17
37.
69
20
.77
33
.90
79
.64
77.
34
70
.88
75.3
3
Merc
er
BLU
EF
IELD
HIG
H S
CH
OO
21.8
314
.165
.52
14.8
56
6.8
26
3.14
52.9
46
1.14
Merc
er
BLU
EF
IELD
IN
TE
RM
ED
IA4
7.8
83
6.0
523
.59
41.3
58
3.4
274
.92
66
.67
79
.00
Merc
er
BLU
EF
IELD
MID
DLE
31.5
426
.72
12.17
25
.26
83
.86
81.6
279
.58
82.4
7
Merc
er
BLU
EW
ELL
ELE
MEN
TARY
40
.183
0.0
024
.80
33
.72
69
.31
49
.29
47.
02
59
.52
Merc
er
BRU
SH
FO
RK
ELE
MEN
TARY
50
.37
31.6
228
.07
44
.08
75.5
574
.26
60
.43
72.3
9
Merc
er
CE
RES
53
.183
6.5
427.
51
47.
67
80
.31
80
.136
8.4
878
.49
Merc
er
GLE
NW
OO
D S
CH
OO
L4
3.9
126
.28
16.5
429
.26
76
.88
63
.25
60
.41
67.
92
Merc
er
LAS
HM
EET/
MAT
OA
KA
SC
H4
4.2
93
0.8
122.2
737.
148
2.5
58
0.3
674
.89
80
.53
Merc
er
MC
ELC
-BLU
EF
IELD
65
.23
46
.38
50
.83
63
.40
65
.63
47.
83
50
.83
63
.95
Merc
er
MC
ELC
-PR
INC
ETO
N5
8.4
84
5.3
34
9.6
95
5.3
86
2.8
557.
33
54
.70
60
.35
Merc
er
MELR
OS
E E
LEM
EN
TARY
41.5
025
.21
18.3
829
.31
75.5
16
8.9
170
.83
73
.33
Merc
er
MEM
OR
IAL
ELE
MEN
TARY
62.3
43
8.3
017
.85
49
.66
79
.75
70
.21
51.24
72.2
3
Merc
er
ME
RC
ER
CO
UN
TY
EA
RLY
LE
AR
NIN
G C
EN
TE
R5
0.0
04
3.9
04
7.29
49
.20
53
.58
51.22
56
.165
4.2
9
Merc
er
ME
RC
ER
SC
HO
OL
42.3
125
.81
14.8
429
.54
82.14
85
.92
78
.108
1.10
Merc
er
MO
NTC
ALM
ELE
MEN
TARY
66
.79
39
.32
30
.82
55
.38
78
.25
76
.82
65
.28
75.3
0
Merc
er
MO
NTC
ALM
HIG
H S
CH
OO
L3
3.2
025
.1316
.33
26
.85
68
.82
66
.67
61.6
76
6.4
5
Merc
er
OA
KV
ALE
SC
HO
OL
54
.21
45
.02
36
.61
48
.68
73
.97
78
.79
73
.23
74.7
6
Merc
er
PIK
E V
IEW
HIG
H S
CH
OO
23
.33
18.3
212
.68
17.3
76
1.16
63
.37
59
.76
60
.74
Merc
er
PR
INC
ETO
N H
IGH
SC
HO
O14
.04
7.75
2.0
96
.93
59
.99
62.9
05
4.8
657.
37
Merc
er
PR
INC
ETO
N M
IDD
LE29
.70
17.5
79
.89
20
.22
75.3
76
8.8
15
0.5
46
4.0
4
Merc
er
PR
INC
ETO
N P
RIM
ARY
41.0
524
.07
18.8
73
2.4
578
.63
63
.37
60
.80
71.7
1
Merc
er
SPA
NIS
HBU
RG
SC
HO
OL
56
.60
52.19
37.
194
9.2
48
4.8
078
.92
73
.75
80
.35
Merc
er
ST
RA
LEY
SC
HO
OL
54
.82
35
.07
17.5
04
3.6
38
3.0
074
.63
67.
68
78
.33
Merc
er
SU
N V
ALL
EY
SC
HO
OL
58
.32
15.6
34
1.8
15
0.8
48
1.77
46
.88
65
.89
75.2
3
Merc
er
WH
ITET
HO
RN
ELE
MEN
TAR
71.8
95
0.0
03
5.9
86
4.0
08
7.4
170
.83
65
.72
82.5
8
TO
TAL
41.4
627.
38
16.0
03
0.5
774
.95
70
.40
61.8
36
9.6
9
Min
era
lBU
RLIN
GTO
N P
RIM
ARY
65
.184
8.6
74
8.5
357.
21
83
.31
72.5
770
.85
77.
88
Min
era
lELK
GA
RD
EN
PR
IMA
RY/
M5
6.2
127.
78
32.0
14
6.0
072.5
25
6.4
86
3.11
68
.70
Min
era
lFO
RT
AS
HBY
PR
IMA
RY
48
.90
32.7
420
.09
30
.54
77.
55
66
.37
51.26
61.26
Min
era
lFO
UN
TAIN
PR
IMA
RY
SC
H5
6.3
74
0.6
64
2.2
34
9.5
570
.75
72.5
36
4.3
16
8.6
7
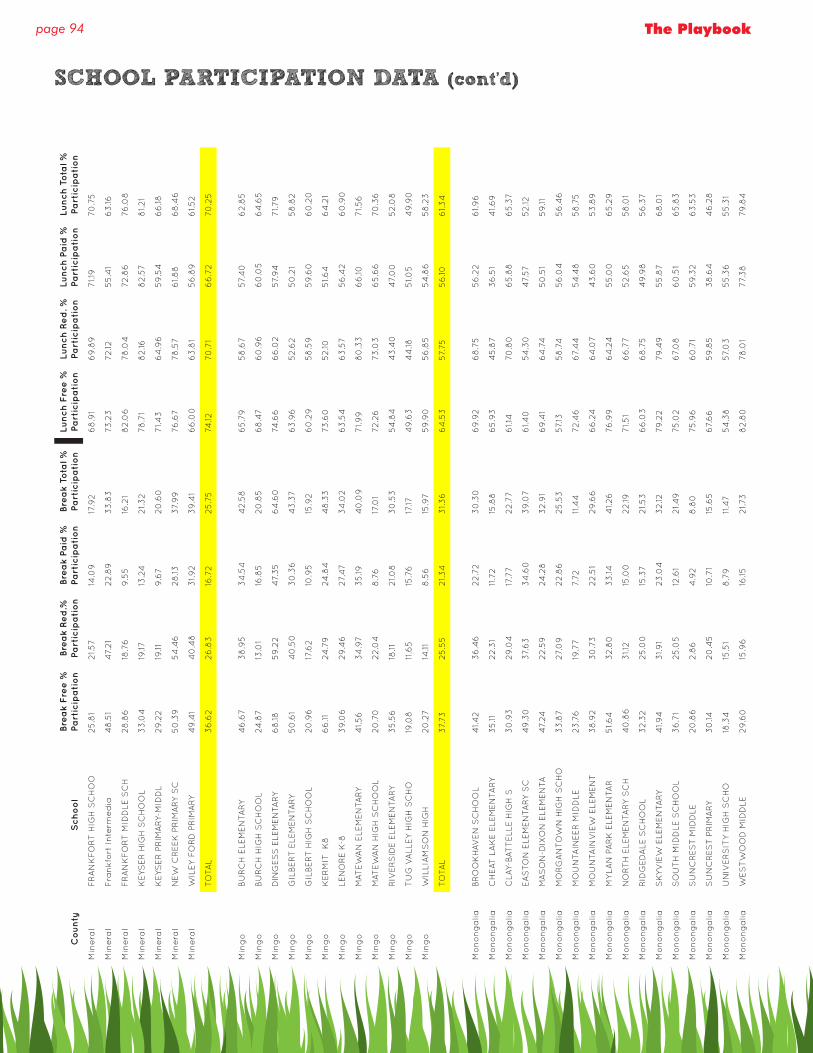
page 94 The Playbook
Co
un
tyS
ch
oo
lBre
ak
Fre
e %
Pa
rtic
ipa
tio
nBre
ak
Re
d.%
Pa
rtic
ipa
tio
nBre
ak
Pa
id %
Pa
rtic
ipa
tio
nBre
ak
Tota
l %
Pa
rtic
ipa
tio
nLu
nch
Fre
e %
Pa
rtic
ipa
tio
nLu
nch
Re
d. %
Pa
rtic
ipa
tio
nLu
nch
Pa
id %
Pa
rtic
ipa
tio
nLu
nch
To
tal %
Pa
rtic
ipa
tio
n
Min
era
lF
RA
NK
FO
RT
HIG
H S
CH
OO
25
.81
21.57
14.0
917
.92
68
.91
69
.89
71.1
970
.75
Min
era
lF
ran
kfo
rt I
nte
rme
dia
48
.51
47.
21
22.8
93
3.8
373
.23
72.12
55
.41
63
.16
Min
era
lF
RA
NK
FO
RT
MID
DLE
SC
H28
.86
18.7
69
.55
16.2
18
2.0
678
.04
72.8
676
.08
Min
era
lK
EYS
ER
HIG
H S
CH
OO
L3
3.0
419
.1713
.24
21.3
278
.71
82.16
82.5
78
1.21
Min
era
lK
EYS
ER
PR
IMA
RY-
MID
DL
29
.22
19.11
9.6
720
.60
71.4
36
4.9
65
9.5
46
6.18
Min
era
lN
EW
CR
EEK
PR
IMA
RY
SC
50
.39
54
.46
28
.1337.
99
76
.67
78
.57
61.8
86
8.4
6
Min
era
lW
ILEY
FO
RD
PR
IMA
RY
49
.41
40
.48
31.9
23
9.4
16
6.0
06
3.8
15
6.8
96
1.52
TO
TAL
36
.62
26
.83
16.7
225
.75
74.12
70
.71
66
.72
70
.25
Min
go
BU
RC
H E
LEM
EN
TARY
46
.67
38
.95
34
.54
42.5
86
5.7
95
8.6
757.
40
62.8
5
Min
go
BU
RC
H H
IGH
SC
HO
OL
24.8
713
.01
16.8
520
.85
68
.47
60
.96
60
.05
64
.65
Min
go
DIN
GES
S E
LEM
EN
TARY
68
.1859
.22
47.
35
64
.60
74.6
66
6.0
257.
94
71.7
9
Min
go
GIL
BE
RT
ELE
MEN
TARY
50
.61
40
.50
30
.36
43
.37
63
.96
52.6
25
0.2
15
8.8
2
Min
go
GIL
BE
RT
HIG
H S
CH
OO
L20
.96
17.6
210
.95
15.9
26
0.2
95
8.5
95
9.6
06
0.2
0
Min
go
KE
RM
IT K
86
6.11
24.7
924
.84
48
.33
73
.60
52.10
51.6
46
4.2
1
Min
go
LEN
OR
E K
-83
9.0
629
.46
27.
47
34
.02
63
.54
63
.57
56
.42
60
.90
Min
go
MAT
EW
AN
ELE
MEN
TARY
41.5
63
4.9
73
5.19
40
.09
71.9
98
0.3
36
6.10
71.5
6
Min
go
MAT
EW
AN
HIG
H S
CH
OO
L20
.70
22.0
48
.76
17.0
172.2
673
.03
65
.66
70
.36
Min
go
RIV
ER
SID
E E
LEM
EN
TARY
35
.56
18.11
21.0
83
0.5
35
4.8
44
3.4
04
7.0
052.0
8
Min
go
TU
G V
ALL
EY
HIG
H S
CH
O19
.08
11.6
515
.76
17.17
49
.63
44
.185
1.05
49
.90
Min
go
WIL
LIA
MS
ON
HIG
H20
.27
14.11
8.5
615
.97
59
.90
56
.85
54
.86
58
.23
TO
TAL
37.
73
25
.55
21.3
43
1.3
66
4.5
357.
755
6.10
61.3
4
Mo
no
ng
alia
BR
OO
KH
AVEN
SC
HO
OL
41.4
23
6.4
622.7
23
0.3
06
9.9
26
8.7
55
6.2
26
1.9
6
Mo
no
ng
alia
CH
EAT
LA
KE E
LEM
EN
TARY
35
.1122.3
111
.72
15.8
86
5.9
34
5.8
73
6.5
14
1.6
9
Mo
no
ng
alia
CLA
Y-BAT
TELL
E H
IGH
S3
0.9
329
.04
17.7
722.7
76
1.14
70
.80
65
.88
65
.37
Mo
no
ng
alia
EA
STO
N E
LEM
EN
TARY
SC
49
.30
37.
63
34
.60
39
.07
61.4
05
4.3
04
7.57
52.12
Mo
no
ng
alia
MA
SO
N-D
IXO
N E
LEM
EN
TA4
7.24
22.5
924
.28
32.9
16
9.4
16
4.7
45
0.5
159
.11
Mo
no
ng
alia
MO
RG
AN
TO
WN
HIG
H S
CH
O3
3.8
727.
09
22.8
625
.53
57.
135
8.7
45
6.0
45
6.4
6
Mo
no
ng
alia
MO
UN
TAIN
EE
R M
IDD
LE23
.76
19.7
77.
72
11.4
472.4
66
7.4
45
4.4
85
8.7
5
Mo
no
ng
alia
MO
UN
TAIN
VIE
W E
LEM
EN
T3
8.9
23
0.7
322.5
129
.66
66
.24
64
.07
43
.60
53
.89
Mo
no
ng
alia
MY
LAN
PA
RK
ELE
MEN
TAR
51.6
43
2.8
03
3.14
41.26
76
.99
64
.24
55
.00
65
.29
Mo
no
ng
alia
NO
RT
H E
LEM
EN
TARY
SC
H4
0.8
63
1.12
15.0
022.19
71.5
16
6.7
752.6
55
8.0
1
Mo
no
ng
alia
RID
GED
ALE
SC
HO
OL
32.3
225
.00
15.3
721.53
66
.03
68
.75
49
.98
56
.37
Mo
no
ng
alia
SK
YV
IEW
ELE
MEN
TARY
41.9
43
1.9
123
.04
32.12
79
.22
79
.49
55
.87
68
.01
Mo
no
ng
alia
SO
UT
H M
IDD
LE S
CH
OO
L3
6.7
125
.05
12.6
121.4
975
.02
67.
08
60
.51
65
.83
Mo
no
ng
alia
SU
NC
RES
T M
IDD
LE20
.86
2.8
64
.92
8.8
075
.96
60
.71
59
.32
63
.53
Mo
no
ng
alia
SU
NC
RES
T P
RIM
ARY
30
.1420
.45
10.7
115
.65
67.
66
59
.85
38
.64
46
.28
Mo
no
ng
alia
UN
IVE
RS
ITY
HIG
H S
CH
O18
.34
15.5
18
.79
11.4
75
4.3
857.
03
55
.36
55
.31
Mo
no
ng
alia
WES
TW
OO
D M
IDD
LE29
.60
15.9
616
.1521.7
38
2.8
078
.01
77.
38
79
.84
SCHOOL PARTICIPATION DATA (cont’d)
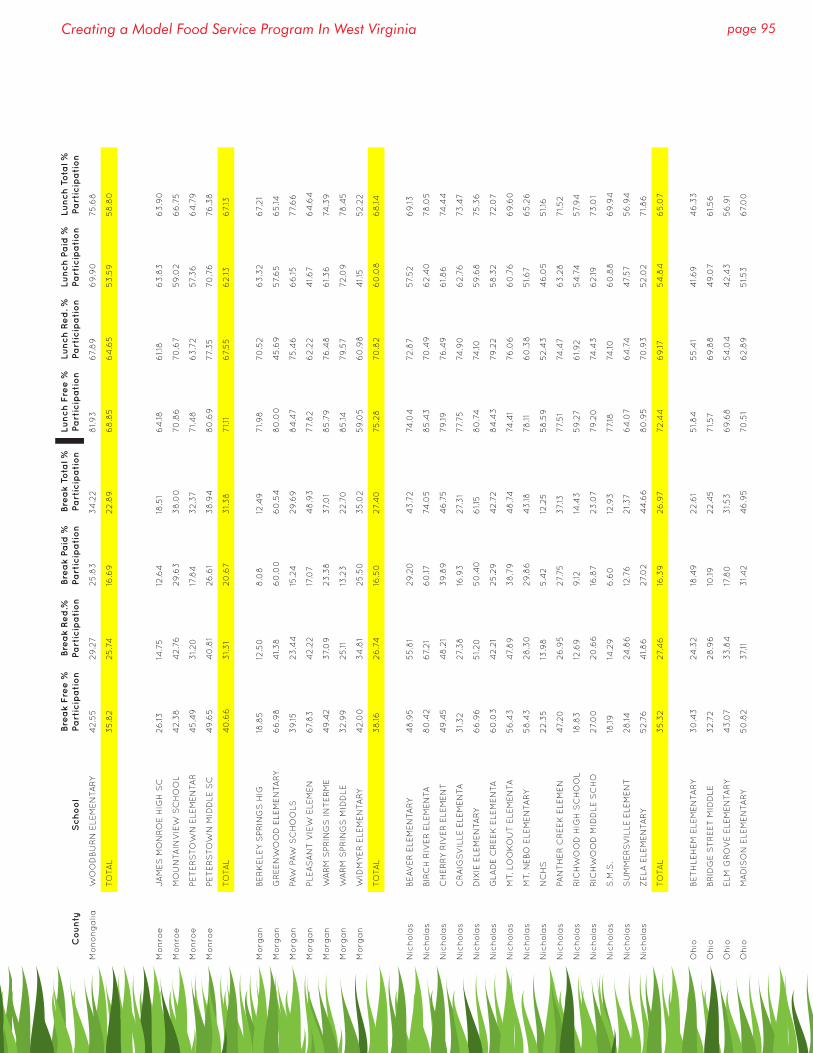
page 95Creating a Model Food Service Program In West Virginia
Co
un
tyS
ch
oo
lBre
ak
Fre
e %
Pa
rtic
ipa
tio
nBre
ak
Re
d.%
Pa
rtic
ipa
tio
nBre
ak
Pa
id %
Pa
rtic
ipa
tio
nBre
ak
Tota
l %
Pa
rtic
ipa
tio
nLu
nch
Fre
e %
Pa
rtic
ipa
tio
nLu
nch
Re
d. %
Pa
rtic
ipa
tio
nLu
nch
Pa
id %
Pa
rtic
ipa
tio
nLu
nch
To
tal %
Pa
rtic
ipa
tio
n
Mo
no
ng
alia
WO
OD
BU
RN
ELE
MEN
TARY
42.5
529
.27
25
.83
34
.22
81.9
36
7.8
96
9.9
075
.68
TO
TAL
35
.82
25
.74
16.6
922.8
96
8.8
56
4.6
55
3.5
95
8.8
0
Mo
nro
eJA
MES
MO
NR
OE H
IGH
SC
26
.1314
.75
12.6
418
.51
64
.186
1.18
63
.83
63
.90
Mo
nro
eM
OU
NTA
INV
IEW
SC
HO
OL
42.3
84
2.7
629
.63
38
.00
70
.86
70
.67
59
.02
66
.75
Mo
nro
ePET
ER
STO
WN
ELE
MEN
TAR
45
.49
31.20
17.8
43
2.3
771.4
86
3.7
257.
36
64
.79
Mo
nro
ePET
ER
STO
WN
MID
DLE
SC
49
.65
40
.81
26
.61
38
.94
80
.69
77.
35
70
.76
76
.38
TO
TAL
40
.66
31.3
120
.67
31.3
871.1
16
7.5
56
2.13
67.
13
Mo
rga
nBE
RK
ELE
Y S
PR
ING
S H
IG18
.85
12.5
08
.08
12.4
971.9
870
.52
63
.32
67.
21
Mo
rga
nG
REEN
WO
OD
ELE
MEN
TARY
66
.98
41.3
86
0.0
06
0.5
48
0.0
04
5.6
957.
65
65
.14
Mo
rga
nPA
W P
AW
SC
HO
OLS
39
.1523
.44
15.2
429
.69
84
.47
75.4
66
6.15
77.
66
Mo
rga
nPLE
AS
AN
T V
IEW
ELE
MEN
67.
83
42.2
217
.07
48
.93
77.
82
62.2
24
1.6
76
4.6
4
Mo
rga
nW
AR
M S
PR
ING
S I
NT
ER
ME
49
.42
37.
09
23
.38
37.
01
85
.79
76
.48
61.3
674
.39
Mo
rga
nW
AR
M S
PR
ING
S M
IDD
LE3
2.9
925
.1113
.23
22.7
08
5.14
79
.57
72.0
978
.45
Mo
rga
nW
IDM
YE
R E
LEM
EN
TARY
42.0
03
4.8
125
.50
35
.02
59
.05
60
.98
41.1
552.2
2
TO
TAL
38
.1626
.74
16.5
027.
40
75.2
870
.82
60
.08
68
.14
Nic
ho
las
BEAV
ER
ELE
MEN
TARY
48
.95
55
.81
29
.20
43
.72
74.0
472.8
757.
52
69
.13
Nic
ho
las
BIR
CH
RIV
ER
ELE
MEN
TA8
0.4
26
7.21
60
.1774
.05
85
.43
70
.49
62.4
078
.05
Nic
ho
las
CH
ER
RY
RIV
ER
ELE
MEN
T4
9.4
54
8.2
13
9.8
94
6.7
579
.1976
.49
61.8
674
.44
Nic
ho
las
CR
AIG
SV
ILLE
ELE
MEN
TA3
1.3
227.
38
16.9
327.
31
77.
7574
.90
62.7
673
.47
Nic
ho
las
DIX
IE E
LEM
EN
TARY
66
.96
51.20
50
.40
61.1
58
0.7
474
.105
9.6
875
.36
Nic
ho
las
GLA
DE C
REEK
ELE
MEN
TA6
0.0
34
2.2
125
.29
42.7
28
4.4
379
.22
58
.32
72.0
7
Nic
ho
las
MT.
LO
OK
OU
T E
LEM
EN
TA5
6.4
34
7.8
93
8.7
94
8.7
474
.41
76
.06
60
.76
69
.60
Nic
ho
las
MT.
NEBO
ELE
MEN
TARY
58
.43
28
.30
29
.86
43
.1878
.116
0.3
85
1.6
76
5.2
6
Nic
ho
las
NC
HS
22.3
513
.98
5.4
212
.25
58
.59
52.4
34
6.0
55
1.16
Nic
ho
las
PAN
TH
ER
CR
EEK
ELE
MEN
47.
20
26
.95
27.
7537.
1377.
51
74.4
76
3.2
871.52
Nic
ho
las
RIC
HW
OO
D H
IGH
SC
HO
OL
18.8
312
.69
9.12
14.4
359
.27
61.9
25
4.7
457.
94
Nic
ho
las
RIC
HW
OO
D M
IDD
LE S
CH
O27.
00
20
.66
16.8
723
.07
79
.20
74.4
36
2.19
73
.01
Nic
ho
las
S.M
.S.
18.19
14.2
96
.60
12.9
377.
1874
.106
0.8
86
9.9
4
Nic
ho
las
SU
MM
ER
SV
ILLE
ELE
MEN
T28
.1424
.86
12.7
621.37
64
.07
64
.74
47.
57
56
.94
Nic
ho
las
ZELA
ELE
MEN
TARY
52.7
64
1.8
627.
02
44
.66
80
.95
70
.93
52.0
271.8
6
TO
TAL
35
.32
27.
46
16.3
926
.97
72.4
46
9.17
54
.84
65
.07
Oh
ioBET
HLE
HEM
ELE
MEN
TARY
30
.43
24.3
218
.49
22.6
15
1.8
45
5.4
14
1.6
94
6.3
3
Oh
ioBR
IDG
E S
TR
EET
MID
DLE
32.7
228
.96
10.19
22.4
571.57
69
.88
49
.07
61.5
6
Oh
ioELM
GR
OV
E E
LEM
EN
TARY
43
.07
33
.84
17.8
03
1.53
69
.68
54
.04
42.4
35
6.9
1
Oh
ioM
AD
ISO
N E
LEM
EN
TARY
50
.82
37.
113
1.4
24
6.9
570
.51
62.8
95
1.5
36
7.0
0
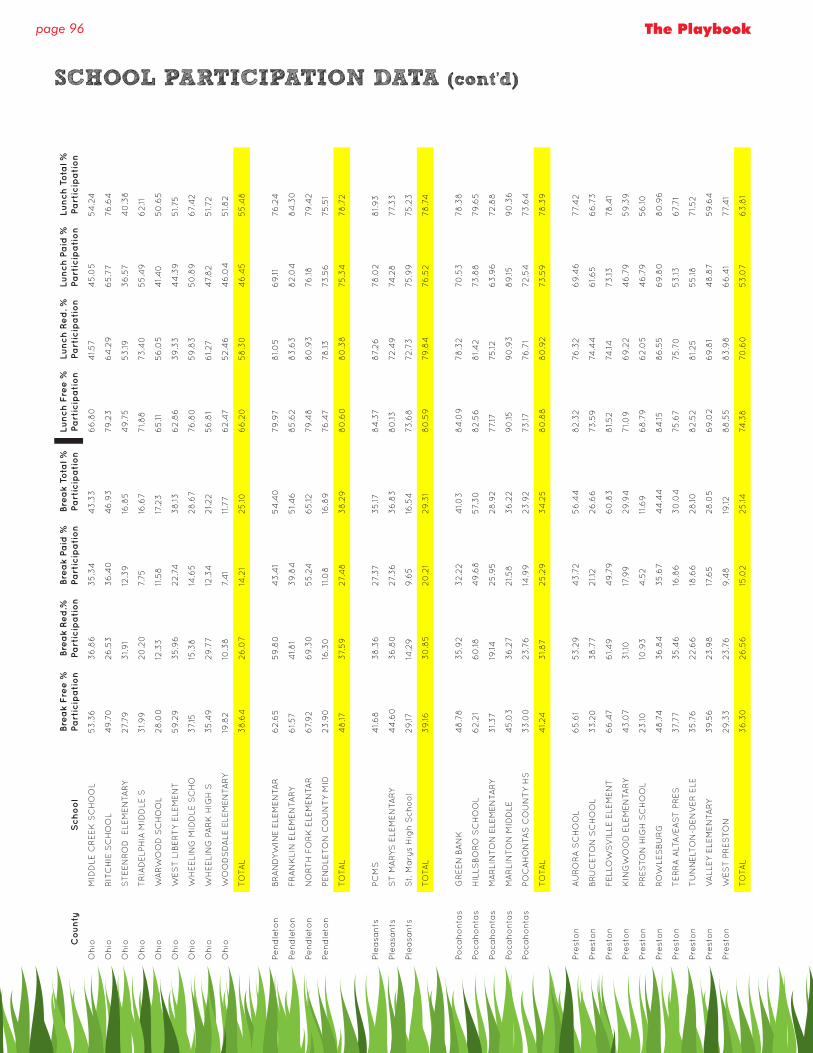
page 96 The Playbook
Co
un
tyS
ch
oo
lBre
ak
Fre
e %
Pa
rtic
ipa
tio
nBre
ak
Re
d.%
Pa
rtic
ipa
tio
nBre
ak
Pa
id %
Pa
rtic
ipa
tio
nBre
ak
Tota
l %
Pa
rtic
ipa
tio
nLu
nch
Fre
e %
Pa
rtic
ipa
tio
nLu
nch
Re
d. %
Pa
rtic
ipa
tio
nLu
nch
Pa
id %
Pa
rtic
ipa
tio
nLu
nch
To
tal %
Pa
rtic
ipa
tio
n
Oh
ioM
IDD
LE C
REEK
SC
HO
OL
53
.36
36
.86
35
.34
43
.33
66
.80
41.57
45
.05
54
.24
Oh
ioR
ITC
HIE
SC
HO
OL
49
.70
26
.53
36
.40
46
.93
79
.23
64
.29
65
.77
76
.64
Oh
ioS
TEEN
RO
D ELE
MEN
TARY
27.
79
31.9
112
.39
16.8
54
9.7
55
3.19
36
.57
40
.38
Oh
ioT
RIA
DELP
HIA
MID
DLE
S3
1.9
920
.20
7.75
16.6
771.8
873
.40
55
.49
62.11
Oh
ioW
AR
WO
OD
SC
HO
OL
28
.00
12.3
311
.58
17.2
36
5.11
56
.05
41.4
05
0.6
5
Oh
ioW
ES
T L
IBE
RT
Y E
LEM
EN
T59
.29
35
.96
22.7
43
8.13
62.8
63
9.3
34
4.3
95
1.75
Oh
ioW
HEELIN
G M
IDD
LE S
CH
O37.
1515
.38
14.6
528
.67
76
.80
59
.83
50
.89
67.
42
Oh
ioW
HEELIN
G P
AR
K H
IGH
S3
5.4
929
.77
12.3
421.22
56
.81
61.27
47.
82
51.7
2
Oh
ioW
OO
DS
DA
LE E
LEM
EN
TARY
19.8
210
.38
7.4
111
.77
62.4
752.4
64
6.0
45
1.8
2
TO
TAL
38
.64
26
.07
14.2
125
.106
6.2
05
8.3
04
6.4
55
5.4
8
Pe
nd
leto
nBR
AN
DYW
INE E
LEM
EN
TAR
62.6
559
.80
43
.41
54
.40
79
.97
81.0
56
9.11
76
.24
Pe
nd
leto
nF
RA
NK
LIN
ELE
MEN
TARY
61.57
41.8
13
9.8
45
1.4
68
5.6
28
3.6
38
2.0
48
4.3
0
Pe
nd
leto
nN
OR
TH
FO
RK
ELE
MEN
TAR
67.
92
69
.30
55
.24
65
.1279
.48
80
.93
76
.1879
.42
Pe
nd
leto
nPEN
DLE
TO
N C
OU
NT
Y M
ID23
.90
16.3
011
.08
16.8
976
.47
78
.1373
.56
75.5
1
TO
TAL
48
.1737.
59
27.
48
38
.29
80
.60
80
.38
75.3
478
.72
Ple
asa
nts
PC
MS
41.6
83
8.3
627.
37
35
.178
4.3
78
7.26
78
.02
81.9
3
Ple
asa
nts
ST
MA
RYS
ELE
MEN
TARY
44
.60
36
.80
27.
36
36
.83
80
.1372.4
974
.28
77.
33
Ple
asa
nts
St.
Ma
rys
Hig
h S
ch
oo
l29
.1714
.29
9.6
516
.54
73
.68
72.7
375
.99
75.2
3
TO
TAL
39
.163
0.8
520
.21
29
.31
80
.59
79
.84
76
.52
78
.74
Po
ca
ho
nta
sG
REEN
BA
NK
48
.78
35
.92
32.2
24
1.03
84
.09
78
.32
70
.53
78
.38
Po
ca
ho
nta
sH
ILLS
BO
RO
SC
HO
OL
62.2
16
0.18
49
.68
57.
30
82.5
68
1.4
273
.88
79
.65
Po
ca
ho
nta
sM
AR
LIN
TO
N E
LEM
EN
TARY
31.37
19.14
25
.95
28
.92
77.
1775
.126
3.9
672.8
8
Po
ca
ho
nta
sM
AR
LIN
TO
N M
IDD
LE4
5.0
33
6.2
721.5
83
6.2
29
0.15
90
.93
89
.159
0.3
6
Po
ca
ho
nta
sPO
CA
HO
NTA
S C
OU
NT
Y H
S3
3.0
023
.76
14.9
923
.92
73
.1776
.71
72.5
473
.64
TO
TAL
41.24
31.8
725
.29
34
.25
80
.88
80
.92
73
.59
78
.39
Pre
sto
nA
UR
OR
A S
CH
OO
L6
5.6
153
.29
43
.72
56
.44
82.3
276
.32
69
.46
77.
42
Pre
sto
nBRU
CETO
N S
CH
OO
L3
3.2
03
8.7
721.1
226
.66
73
.59
74.4
46
1.6
56
6.7
3
Pre
sto
nF
ELL
OW
SV
ILLE
ELE
MEN
T6
6.4
76
1.4
94
9.7
96
0.8
38
1.52
74.14
73
.1378
.41
Pre
sto
nK
ING
WO
OD
ELE
MEN
TARY
43
.07
31.1
017
.99
29
.94
71.0
96
9.2
24
6.7
95
9.3
9
Pre
sto
nPR
ES
TO
N H
IGH
SC
HO
OL
23
.1010
.93
4.5
211
.69
68
.79
62.0
54
6.7
95
6.10
Pre
sto
nR
OW
LES
BU
RG
48
.74
36
.84
35
.67
44
.44
84
.158
6.5
56
9.8
08
0.9
6
Pre
sto
nT
ER
RA
ALT
A/E
AS
T P
RES
37.
77
35
.46
16.8
63
0.0
475
.67
75.7
05
3.13
67.
71
Pre
sto
nT
UN
NELT
ON
-DEN
VE
R E
LE3
5.7
622.6
618
.66
28
.108
2.5
28
1.25
55
.1871.52
Pre
sto
nV
ALL
EY
ELE
MEN
TARY
39
.56
23
.98
17.6
528
.05
69
.02
69
.81
48
.87
59
.64
Pre
sto
nW
ES
T P
RES
TO
N29
.33
23
.76
9.4
819
.128
8.5
58
3.9
86
6.4
177.
41
TO
TAL
36
.30
26
.56
15.0
225
.1474
.38
70
.60
53
.07
63
.81
SCHOOL PARTICIPATION DATA (cont’d)

page 97Creating a Model Food Service Program In West Virginia
Co
un
tyS
ch
oo
lBre
ak
Fre
e %
Pa
rtic
ipa
tio
nBre
ak
Re
d.%
Pa
rtic
ipa
tio
nBre
ak
Pa
id %
Pa
rtic
ipa
tio
nBre
ak
Tota
l %
Pa
rtic
ipa
tio
nLu
nch
Fre
e %
Pa
rtic
ipa
tio
nLu
nch
Re
d. %
Pa
rtic
ipa
tio
nLu
nch
Pa
id %
Pa
rtic
ipa
tio
nLu
nch
To
tal %
Pa
rtic
ipa
tio
n
Pu
tna
mBU
FFA
LO E
LEM
EN
TARY
65
.48
63
.96
37.
06
56
.30
78
.65
84
.01
67.
57
76
.23
Pu
tna
mBU
FFA
LO H
IGH
31.9
627.
59
19.2
024
.52
54
.64
50
.57
52.18
52.9
6
Pu
tna
mC
ON
FID
EN
CE E
LEM
EN
TAR
63
.65
45
.93
32.11
44
.30
77.
98
65
.07
62.2
56
8.18
Pu
tna
mC
ON
NO
R S
TR
EET
ELE
MEN
38
.123
5.10
11.8
624
.43
75.8
977.
29
64
.29
70
.06
Pu
tna
mEA
ST
BR
OO
K E
LEM
EN
TARY
58
.53
29
.37
27.
90
35
.96
82.17
73
.02
58
.97
65
.65
Pu
tna
mG
EO
RG
E W
AS
HIN
GTO
N E
L4
3.6
65
1.9
018
.74
30
.43
83
.128
1.4
36
8.2
874
.71
Pu
tna
mG
EO
RG
E W
AS
HIN
GTO
N M
IDD
LE
SC
HO
OL
30
.06
20
.61
15.7
522.4
78
8.0
58
5.8
18
9.6
58
8.9
1
Pu
tna
mh
ea
d s
tart
0.0
00
.00
0.0
00
.00
0.0
00
.00
0.0
00
.00
Pu
tna
mH
OM
ETO
WN
ELE
MEN
TARY
51.29
37.
35
23
.80
42.0
674
.76
60
.24
58
.02
69
.07
Pu
tna
mH
UR
RIC
AN
E H
IGH
32.8
33
0.2
113
.67
19.0
157.
92
63
.124
9.5
452.3
1
Pu
tna
mH
UR
RIC
AN
E M
IDD
LE4
5.8
04
1.57
21.1
129
.09
80
.98
84
.88
71.8
875
.27
Pu
tna
mH
UR
RIC
AN
E T
OW
N E
LEM
E4
2.8
23
1.22
11.9
023
.27
79
.41
81.7
55
4.4
66
4.5
4
Pu
tna
mLA
KES
IDE E
LEM
EN
TARY
54
.84
53
.54
29
.73
44
.41
85
.92
85
.23
75.8
08
1.9
7
Pu
tna
mM
OU
NTA
IN V
IEW
ELE
MEN
49
.65
32.6
715
.67
29
.50
73
.34
66
.93
56
.94
63
.81
Pu
tna
mPO
CA
ELE
MEN
TARY
57.
62
57.
45
34
.09
46
.62
85
.40
83
.54
71.26
78
.68
Pu
tna
mPO
CA
HIG
H27.
59
25
.08
18.9
322.4
25
0.4
15
8.2
05
1.4
25
1.8
2
Pu
tna
mPO
CA
MID
DLE
43
.65
35
.85
27.
59
35
.63
82.7
98
1.9
48
2.14
82.6
9
Pu
tna
mR
OC
K B
RA
NC
H E
LEM
EN
TA5
3.7
94
7.78
29
.89
45
.178
5.5
28
1.11
65
.1378
.20
Pu
tna
mS
CO
TT
TEAYS
ELE
MEN
TA3
5.7
34
1.09
14.2
820
.50
79
.38
88
.37
74.7
176
.68
Pu
tna
mW
ES
T T
EAYS
ELE
MEN
TAR
35
.83
15.17
11.3
515
.01
63
.69
50
.56
57.
68
58
.51
Pu
tna
mW
INF
IELD
ELE
MEN
TARY
45
.53
21.0
211
.50
22.2
78
3.8
379
.88
63
.1770
.46
Pu
tna
mW
INF
IELD
HIG
H22.7
617
.59
9.8
512
.52
59
.67
51.5
35
1.09
52.6
2
Pu
tna
mW
INF
IELD
MID
DLE
35
.1522.0
916
.65
21.26
71.9
86
1.76
55
.34
59
.62
TO
TAL
42.7
43
4.5
317
.1126
.27
74.3
171.8
36
0.3
96
5.5
9
Ra
leig
hBEC
KLE
Y E
LEM
EN
TARY
63
.62
52.2
653
.86
61.4
277.
67
78
.20
69
.28
76
.49
Ra
leig
hBEC
KLE
Y-S
TR
ATTO
N M
ID25
.09
21.8
313
.1020
.95
78
.72
81.4
88
0.8
479
.80
Ra
leig
hBR
AD
LEY
ELE
MEN
TARY
37.
82
40
.37
19.8
929
.53
76
.59
76
.78
63
.27
70
.26
Ra
leig
hC
LEA
R F
OR
K D
IST
RIC
T70
.83
49
.24
58
.46
65
.63
76
.70
63
.64
54
.56
68
.44
Ra
leig
hC
OA
L C
ITY
ELE
MEN
TARY
50
.33
31.3
029
.08
42.6
974
.95
71.37
69
.1673
.16
Ra
leig
hC
RA
B O
RC
HA
RD
ELE
MEN
T4
4.8
93
8.7
34
3.4
04
3.8
173
.56
73
.94
70
.1972.2
2
Ra
leig
hC
RA
NBE
RRY-
PR
OS
PE
RIT
Y5
6.3
84
4.8
33
0.0
44
8.0
874
.92
75.0
06
6.4
672.6
8
Ra
leig
hC
RES
CEN
T E
LEM
EN
TARY
50
.94
37.
95
30
.37
39
.93
79
.84
73
.85
66
.38
73
.03
Ra
leig
hD
AN
IELS
ELE
MEN
TARY
54
.96
48
.39
34
.60
43
.85
75.3
16
6.0
05
9.3
16
6.3
3
Ra
leig
hFA
IRD
ALE
ELE
MEN
TARY
41.24
31.0
928
.45
34
.33
71.9
16
1.6
95
9.9
56
5.3
9
Ra
leig
hG
HEN
T E
LEM
EN
TARY
60
.21
60
.93
40
.95
53
.68
79
.27
64
.196
2.0
572.0
5
Ra
leig
hH
OLL
YW
OO
D E
LEM
EN
TARY
49
.07
33
.52
29
.36
37.
30
74.5
875
.27
59
.21
66
.33
Ra
leig
hIN
DEPEN
DEN
CE H
IGH
22.2
527.
1012
.20
17.5
759
.89
72.5
16
1.8
26
1.9
0
Ra
leig
hIN
DEPEN
DEN
CE M
IDD
LE3
5.3
023
.88
22.5
128
.76
76
.37
69
.64
71.9
674
.01
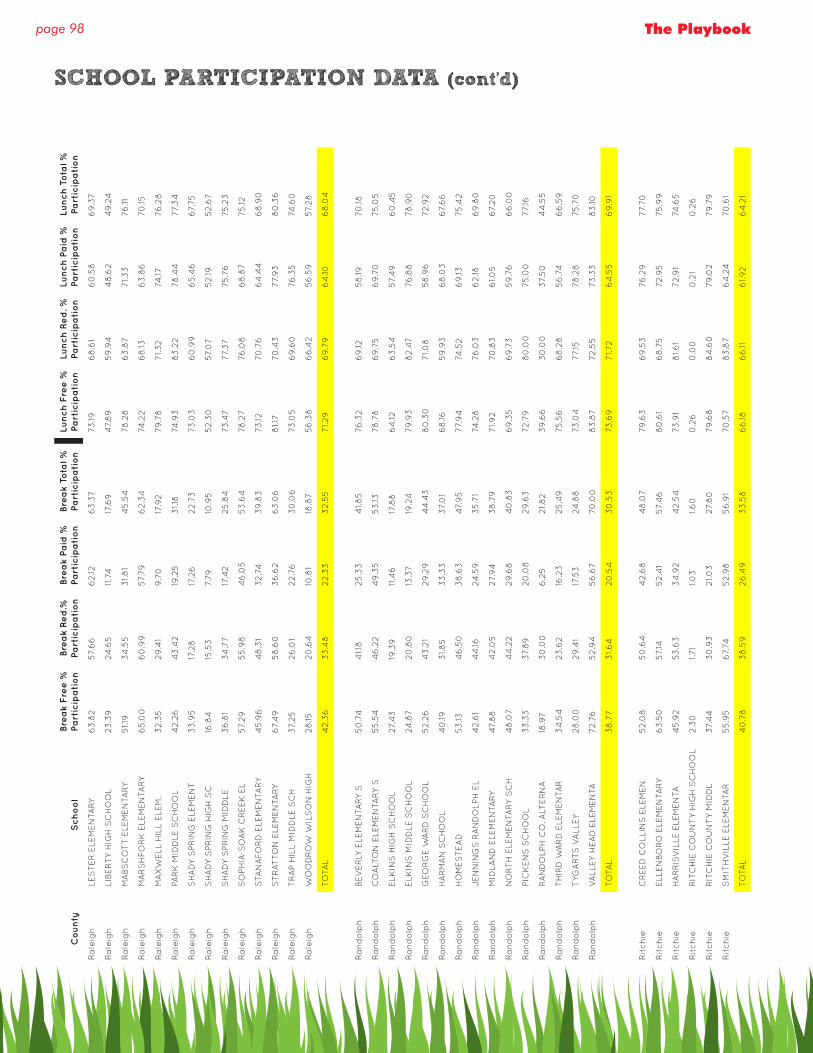
page 98 The Playbook
Co
un
tyS
ch
oo
lBre
ak
Fre
e %
Pa
rtic
ipa
tio
nBre
ak
Re
d.%
Pa
rtic
ipa
tio
nBre
ak
Pa
id %
Pa
rtic
ipa
tio
nBre
ak
Tota
l %
Pa
rtic
ipa
tio
nLu
nch
Fre
e %
Pa
rtic
ipa
tio
nLu
nch
Re
d. %
Pa
rtic
ipa
tio
nLu
nch
Pa
id %
Pa
rtic
ipa
tio
nLu
nch
To
tal %
Pa
rtic
ipa
tio
n
Ra
leig
hLE
ST
ER
ELE
MEN
TARY
63
.82
57.
66
62.12
63
.37
73
.196
8.6
16
0.5
86
9.3
7
Ra
leig
hLIB
ER
TY
HIG
H S
CH
OO
L23
.39
24.6
511
.74
17.6
94
7.8
95
9.9
44
8.6
24
9.2
4
Ra
leig
hM
ABS
CO
TT
ELE
MEN
TARY
51.1
93
4.5
53
1.8
14
5.5
478
.28
63
.87
71.3
376
.11
Ra
leig
hM
AR
SH
FO
RK
ELE
MEN
TARY
65
.00
60
.99
57.
79
62.3
474
.22
68
.136
3.8
670
.15
Ra
leig
hM
AX
WELL
HIL
L ELE
M.
32.3
529
.41
9.7
017
.92
79
.78
71.3
274
.1776
.28
Ra
leig
hPA
RK
MID
DLE
SC
HO
OL
42.2
64
3.4
219
.25
31.1
874
.93
83
.22
78
.44
77.
34
Ra
leig
hS
HA
DY
SPR
ING
ELE
MEN
T3
3.9
517
.28
17.2
622.7
373
.03
60
.99
65
.46
67.
75
Ra
leig
hS
HA
DY
SPR
ING
HIG
H S
C16
.84
15.5
37.
79
10.9
552.3
057.
07
52.19
52.6
7
Ra
leig
hS
HA
DY
SPR
ING
MID
DLE
36
.81
34
.77
17.4
225
.84
73
.47
77.
37
75.7
675
.23
Ra
leig
hS
OPH
IA-S
OA
K C
REEK
EL
57.
29
55
.98
46
.05
53
.64
78
.27
76
.08
68
.87
75.12
Ra
leig
hS
TAN
AFO
RD
ELE
MEN
TARY
45
.96
48
.31
32.7
43
9.8
373
.1270
.76
64
.44
68
.90
Ra
leig
hS
TR
ATTO
N E
LEM
EN
TARY
67.
49
58
.60
36
.62
63
.06
81.1
770
.43
77.
93
80
.36
Ra
leig
hT
RA
P H
ILL
MID
DLE
SC
H37.
25
26
.01
22.7
63
0.0
673
.05
69
.60
76
.35
74.6
0
Ra
leig
hW
OO
DR
OW
WIL
SO
N H
IGH
28
.1520
.64
10.8
118
.87
56
.38
66
.42
56
.59
57.
28
TO
TAL
42.3
63
3.4
822.3
33
2.5
571.29
69
.79
64
.106
8.0
4
Ra
nd
olp
hBEV
ER
LY E
LEM
EN
TARY
S5
0.7
44
1.18
25
.33
41.8
576
.32
69
.125
8.19
70
.18
Ra
nd
olp
hC
OA
LTO
N E
LEM
EN
TARY
S5
5.5
44
6.2
24
9.3
553
.1378
.78
69
.75
69
.70
75.0
5
Ra
nd
olp
hELK
INS
HIG
H S
CH
OO
L27.
43
19.3
911
.46
17.8
86
4.12
63
.54
57.
49
60
.45
Ra
nd
olp
hELK
INS
MID
DLE
SC
HO
OL
24.8
720
.80
13.3
719
.24
79
.93
82.4
776
.88
78
.90
Ra
nd
olp
hG
EO
RG
E W
AR
D S
CH
OO
L52.2
64
3.2
129
.29
44
.43
80
.30
71.0
85
8.9
672.9
2
Ra
nd
olp
hH
AR
MA
N S
CH
OO
L4
0.19
31.8
53
3.3
337.
01
68
.1659
.93
68
.03
67.
66
Ra
nd
olp
hH
OM
ES
TEA
D53
.134
6.5
03
8.6
34
7.9
577.
94
74.5
26
9.13
75.4
2
Ra
nd
olp
hJEN
NIN
GS
RA
ND
OLP
H E
L4
2.6
14
4.16
24.5
93
5.7
174
.28
76
.03
62.18
69
.80
Ra
nd
olp
hM
IDLA
ND
ELE
MEN
TARY
47.
88
42.0
527.
94
38
.79
71.9
270
.83
61.0
56
7.20
Ra
nd
olp
hN
OR
TH
ELE
MEN
TARY
SC
H4
8.0
74
4.2
229
.68
40
.83
69
.35
69
.73
59
.76
66
.00
Ra
nd
olp
hPIC
KEN
S S
CH
OO
L3
3.3
337.
89
20
.08
29
.63
72.7
98
0.0
075
.00
77.
16
Ra
nd
olp
hR
AN
DO
LPH
CO
. ALT
ER
NA
18.9
73
0.0
06
.25
21.8
23
9.6
63
0.0
037.
50
44
.55
Ra
nd
olp
hT
HIR
D W
AR
D E
LEM
EN
TAR
34
.54
23
.62
16.2
325
.49
75.5
66
8.2
85
6.7
46
6.5
9
Ra
nd
olp
hT
YGA
RT
S V
ALL
EY
28
.00
29
.41
17.5
324
.88
73
.04
77.
1578
.28
75.7
0
Ra
nd
olp
hV
ALL
EY
HEA
D E
LEM
EN
TA72.7
652.9
45
6.6
770
.00
83
.87
72.5
573
.33
83
.10
TO
TAL
38
.77
31.6
420
.54
30
.53
73
.69
71.7
26
4.5
56
9.9
1
Rit
ch
ieC
REED
CO
LLIN
S E
LEM
EN
52.0
85
0.6
44
2.6
84
8.0
779
.63
69
.53
76
.29
77.
70
Rit
ch
ieELL
EN
BO
RO
ELE
MEN
TARY
63
.50
57.
1452.4
157.
46
80
.61
68
.75
72.9
575
.99
Rit
ch
ieH
AR
RIS
VIL
LE E
LEM
EN
TA4
5.9
253
.63
34
.92
42.5
473
.91
81.6
172.9
174
.65
Rit
ch
ieR
ITC
HIE
CO
UN
TY
HIG
H S
CH
OO
L2.3
01.7
11.0
31.6
00
.26
0.0
00
.21
0.2
6
Rit
ch
ieR
ITC
HIE
CO
UN
TY
MID
DL
37.
44
30
.93
21.0
327.
80
79
.68
84
.60
79
.02
79
.79
Rit
ch
ieS
MIT
HV
ILLE
ELE
MEN
TAR
55
.95
67.
7452.9
85
6.9
170
.57
83
.87
64
.24
70
.61
TO
TAL
40
.78
38
.59
26
.49
33
.58
66
.186
6.11
61.9
26
4.2
1
SCHOOL PARTICIPATION DATA (cont’d)
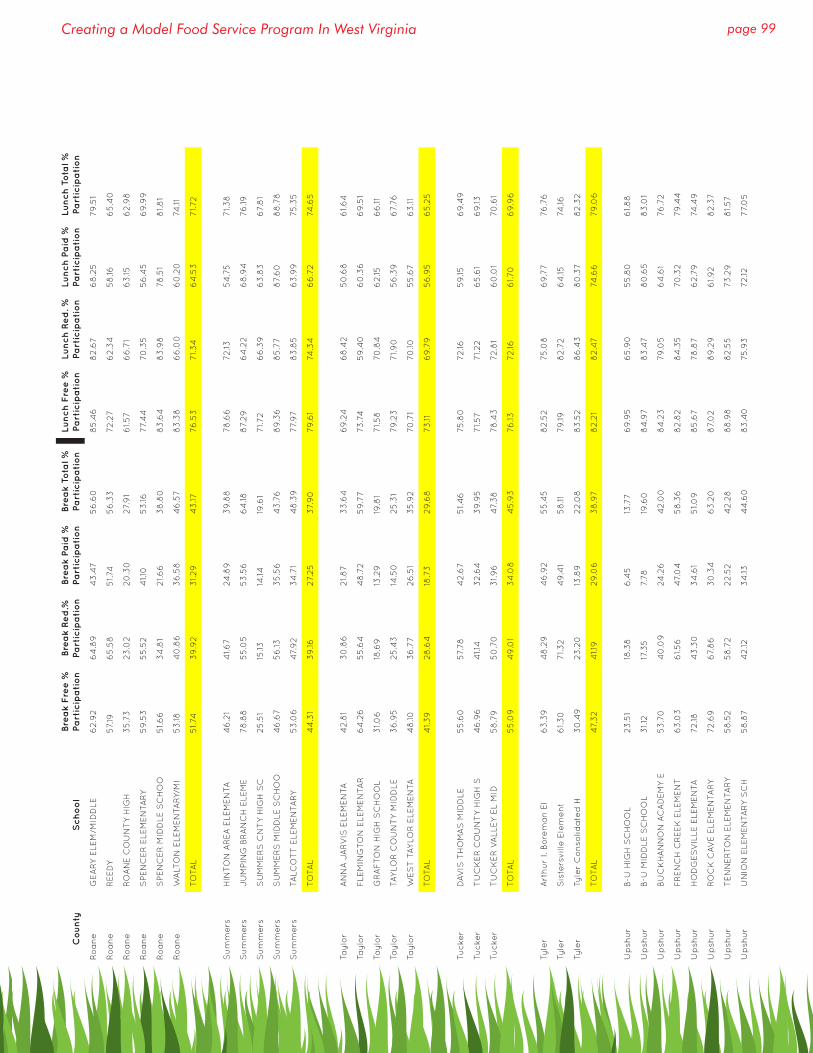
page 99Creating a Model Food Service Program In West Virginia
Co
un
tyS
ch
oo
lBre
ak
Fre
e %
Pa
rtic
ipa
tio
nBre
ak
Re
d.%
Pa
rtic
ipa
tio
nBre
ak
Pa
id %
Pa
rtic
ipa
tio
nBre
ak
Tota
l %
Pa
rtic
ipa
tio
nLu
nch
Fre
e %
Pa
rtic
ipa
tio
nLu
nch
Re
d. %
Pa
rtic
ipa
tio
nLu
nch
Pa
id %
Pa
rtic
ipa
tio
nLu
nch
To
tal %
Pa
rtic
ipa
tio
n
Ro
an
eG
EA
RY
ELE
M/M
IDD
LE6
2.9
26
4.8
94
3.4
75
6.6
08
5.4
68
2.6
76
8.2
579
.51
Ro
an
eR
EED
Y57.
196
5.5
85
1.74
56
.33
72.2
76
2.3
45
8.16
65
.40
Ro
an
eR
OA
NE C
OU
NT
Y H
IGH
35
.73
23
.02
20
.30
27.
91
61.57
66
.71
63
.156
2.9
8
Ro
an
eS
PEN
CE
R E
LEM
EN
TARY
59
.53
55
.52
41.1
053
.1677.
44
70
.35
56
.45
69
.99
Ro
an
eS
PEN
CE
R M
IDD
LE S
CH
OO
51.6
63
4.8
121.6
63
8.8
08
3.6
48
3.9
878
.51
81.8
1
Ro
an
eW
ALT
ON
ELE
MEN
TARY/
MI
53
.184
0.8
63
6.5
84
6.5
78
3.3
86
6.0
06
0.2
074
.11
TO
TAL
51.7
43
9.9
23
1.29
43
.1776
.53
71.3
46
4.5
371.7
2
Su
mm
ers
HIN
TO
N A
REA
ELE
MEN
TA4
6.2
14
1.6
724
.89
39
.88
78
.66
72.13
54
.75
71.3
8
Su
mm
ers
JU
MPIN
G B
RA
NC
H E
LEM
E78
.88
55
.05
53
.56
64
.188
7.29
64
.22
68
.94
76
.19
Su
mm
ers
SU
MM
ER
S C
NT
Y H
IGH
SC
25
.51
15.13
14.14
19.6
171.7
26
6.3
96
3.8
36
7.8
1
Su
mm
ers
SU
MM
ER
S M
IDD
LE S
CH
OO
46
.67
56
.133
5.5
64
3.7
68
9.3
68
5.7
78
7.6
08
8.7
8
Su
mm
ers
TALC
OT
T E
LEM
EN
TARY
53
.06
47.
92
34
.71
48
.39
77.
97
83
.85
63
.99
75.3
5
TO
TAL
44
.31
39
.1627.
25
37.
90
79
.61
74.3
46
6.7
274
.65
Tayl
or
AN
NA
JA
RV
IS E
LEM
EN
TA4
2.8
13
0.8
621.8
73
3.6
46
9.2
46
8.4
25
0.6
86
1.6
4
Tayl
or
FLE
MIN
GTO
N E
LEM
EN
TAR
64
.26
55
.64
48
.72
59
.77
73
.74
59
.40
60
.36
69
.51
Tayl
or
GR
AF
TO
N H
IGH
SC
HO
OL
31.0
618
.69
13.2
919
.81
71.5
870
.84
62.15
66
.11
Tayl
or
TAY
LOR
CO
UN
TY
MID
DLE
36
.95
25
.43
14.5
025
.31
79
.23
71.9
05
6.3
96
7.76
Tayl
or
WES
T T
AY
LOR
ELE
MEN
TA4
8.10
36
.77
26
.51
35
.92
70
.71
70
.105
5.6
76
3.11
TO
TAL
41.3
928
.64
18.7
329
.68
73
.116
9.7
95
6.9
56
5.2
5
Tucke
rD
AVIS
TH
OM
AS
MID
DLE
55
.60
57.
78
42.6
75
1.4
675
.80
72.16
59
.156
9.4
9
Tucke
rT
UC
KE
R C
OU
NT
Y H
IGH
S4
6.9
64
1.14
32.6
43
9.9
571.57
71.22
65
.61
69
.13
Tucke
rT
UC
KE
R V
ALL
EY
EL
MID
58
.79
50
.70
31.9
64
7.3
878
.43
72.8
16
0.0
170
.61
TO
TAL
55
.09
49
.01
34
.08
45
.93
76
.1372.16
61.7
06
9.9
6
Tyle
rA
rth
ur
I. Bo
rem
an
El
63
.39
48
.29
46
.92
55
.45
82.5
275
.08
69
.77
76
.76
Tyle
rS
iste
rsvill
e E
lem
en
t6
1.3
071.3
24
9.4
15
8.11
79
.198
2.7
26
4.15
74.16
Tyle
rTy
ler
Co
nso
lida
ted
H3
0.4
923
.20
13.8
922.0
88
3.5
28
6.4
38
0.3
78
2.3
2
TO
TAL
47.
32
41.1
929
.06
38
.97
82.2
18
2.4
774
.66
79
.06
Up
shu
rB-U
HIG
H S
CH
OO
L23
.51
18.3
86
.45
13.7
76
9.9
56
5.9
05
5.8
06
1.8
8
Up
shu
rB-U
MID
DLE
SC
HO
OL
31.1
217
.35
7.78
19.6
08
4.9
78
3.4
78
0.6
58
3.0
1
Up
shu
rBU
CK
HA
NN
ON
AC
AD
EM
Y E
53
.70
40
.09
24.2
64
2.0
08
4.2
379
.05
64
.61
76
.72
Up
shu
rF
REN
CH
CR
EEK
ELE
MEN
T6
3.0
36
1.5
64
7.0
45
8.3
68
2.8
28
4.3
570
.32
79
.44
Up
shu
rH
OD
GES
VIL
LE E
LEM
EN
TA72.18
43
.30
34
.61
51.0
98
5.6
778
.87
62.7
974
.49
Up
shu
rR
OC
K C
AVE E
LEM
EN
TARY
72.6
96
7.8
63
0.3
46
3.2
08
7.0
28
9.2
96
1.9
28
2.3
7
Up
shu
rT
EN
NE
RTO
N E
LEM
EN
TARY
58
.52
58
.72
22.5
24
2.2
88
8.9
88
2.5
573
.29
81.57
Up
shu
rU
NIO
N E
LEM
EN
TARY
SC
H5
8.8
74
2.12
34
.134
4.6
08
3.4
075
.93
72.12
77.
05
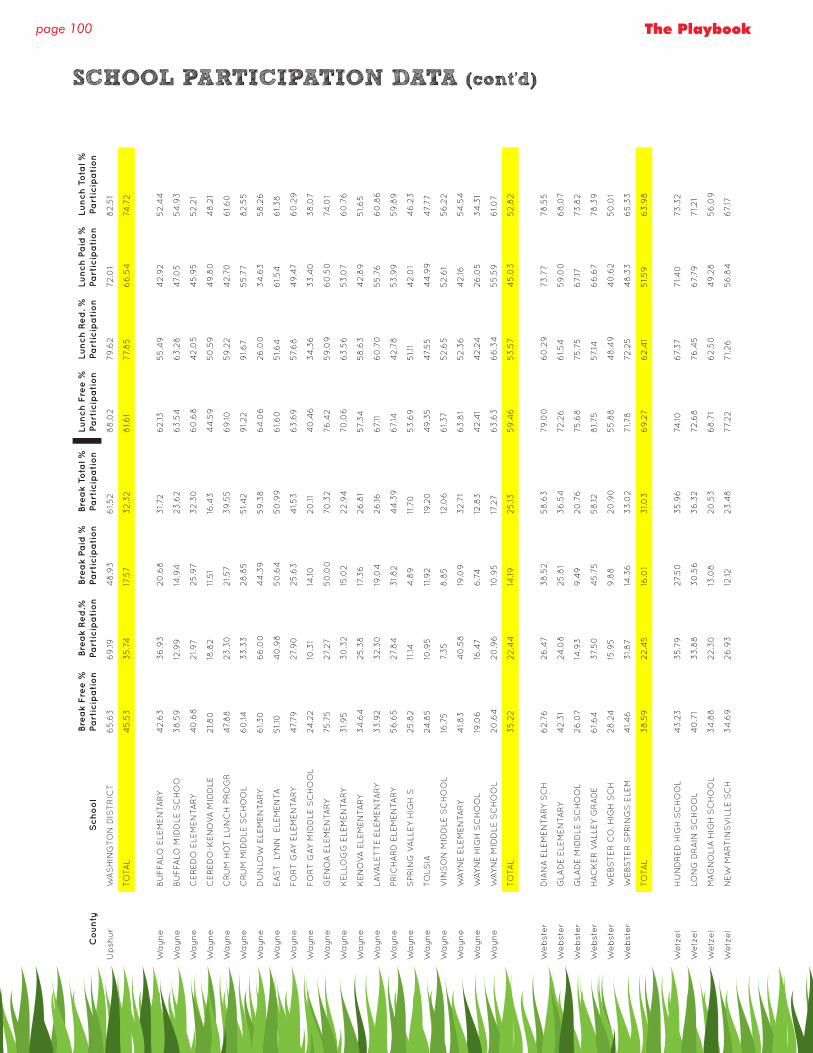
page 100 The Playbook
Co
un
tyS
ch
oo
lBre
ak
Fre
e %
Pa
rtic
ipa
tio
nBre
ak
Re
d.%
Pa
rtic
ipa
tio
nBre
ak
Pa
id %
Pa
rtic
ipa
tio
nBre
ak
Tota
l %
Pa
rtic
ipa
tio
nLu
nch
Fre
e %
Pa
rtic
ipa
tio
nLu
nch
Re
d. %
Pa
rtic
ipa
tio
nLu
nch
Pa
id %
Pa
rtic
ipa
tio
nLu
nch
To
tal %
Pa
rtic
ipa
tio
n
Up
shu
rW
AS
HIN
GTO
N D
IST
RIC
T6
5.6
36
9.19
48
.93
61.52
88
.02
79
.62
72.0
18
2.5
1
TO
TAL
45
.53
35
.74
17.5
73
2.3
28
1.6
177.
85
66
.54
74.7
2
Wa
yn
eBU
FFA
LO E
LEM
EN
TARY
42.6
33
6.9
320
.68
31.7
26
2.13
55
.49
42.9
252.4
4
Wa
yn
eBU
FFA
LO M
IDD
LE S
CH
OO
38
.59
12.9
914
.94
23
.62
63
.54
63
.28
47.
05
54
.93
Wa
yn
eC
ER
ED
O E
LEM
EN
TARY
40
.68
21.9
725
.97
32.3
06
0.6
84
2.0
54
5.9
552.2
1
Wa
yn
eC
ER
ED
O-K
EN
OV
A M
IDD
LE21.8
018
.82
11.5
116
.43
44
.59
50
.59
49
.80
48
.21
Wa
yn
eC
RU
M H
OT
LU
NC
H P
RO
GR
47.
88
23
.30
21.57
39
.55
69
.105
9.2
24
2.7
06
1.6
0
Wa
yn
eC
RU
M M
IDD
LE S
CH
OO
L6
0.14
33
.33
28
.85
51.4
29
1.22
91.6
75
5.7
78
2.5
5
Wa
yn
eD
UN
LOW
ELE
MEN
TARY
61.3
06
6.0
04
4.3
959
.38
64
.06
26
.00
34
.63
58
.26
Wa
yn
eEA
ST
LY
NN
ELE
MEN
TA5
1.10
40
.98
50
.64
50
.99
61.6
05
1.6
46
1.5
46
1.3
8
Wa
yn
eFO
RT
GAY
ELE
MEN
TARY
47.
79
27.
90
25
.63
41.53
63
.69
57.
68
49
.47
60
.29
Wa
yn
eFO
RT
GAY
MID
DLE
SC
HO
OL
24.2
210
.31
14.10
20
.114
0.4
63
4.3
63
3.4
03
8.0
7
Wa
yn
eG
EN
OA
ELE
MEN
TARY
75.7
527.
27
50
.00
70
.32
76
.42
59
.09
60
.50
74.0
1
Wa
yn
eK
ELL
OG
G E
LEM
EN
TARY
31.9
53
0.3
215
.02
22.9
470
.06
63
.56
53
.07
60
.76
Wa
yn
eK
EN
OV
A E
LEM
EN
TARY
34
.64
25
.38
17.3
626
.81
57.
34
58
.63
42.8
95
1.6
5
Wa
yn
eLA
VA
LET
TE E
LEM
EN
TARY
33
.92
32.3
019
.04
26
.166
7.11
60
.70
55
.76
60
.86
Wa
yn
ePR
ICH
AR
D E
LEM
EN
TARY
56
.65
27.
84
31.8
24
4.3
96
7.14
42.7
85
3.9
95
9.8
9
Wa
yn
eS
PR
ING
VA
LLEY
HIG
H S
25
.82
11.14
4.8
911
.70
53
.69
51.1
14
2.0
14
6.2
3
Wa
yn
eTO
LSIA
24.8
510
.95
11.9
219
.20
49
.35
47.
55
44
.99
47.
77
Wa
yn
eV
INS
ON
MID
DLE
SC
HO
OL
16.7
57.
35
8.8
512
.06
61.37
52.6
552.6
15
6.2
2
Wa
yn
eW
AY
NE E
LEM
EN
TARY
41.8
34
0.5
819
.09
32.7
16
3.8
152.3
64
2.16
54
.54
Wa
yn
eW
AY
NE H
IGH
SC
HO
OL
19.0
616
.47
6.7
412
.83
42.4
14
2.2
426
.05
34
.31
Wa
yn
eW
AY
NE M
IDD
LE S
CH
OO
L20
.64
20
.96
10.9
517
.27
63
.63
66
.34
55
.59
61.0
7
TO
TAL
35
.22
22.4
414
.1925
.1359
.46
53
.57
45
.03
52.8
2
We
bst
er
DIA
NA
ELE
MEN
TARY
SC
H6
2.7
626
.47
38
.52
58
.63
79
.00
60
.29
73
.77
78
.55
We
bst
er
GLA
DE E
LEM
EN
TARY
42.3
124
.08
25
.81
36
.54
72.2
66
1.5
459
.00
68
.07
We
bst
er
GLA
DE M
IDD
LE S
CH
OO
L26
.07
14.9
39
.49
20
.76
75.6
875
.75
67.
1773
.82
We
bst
er
HA
CK
ER
VA
LLEY
GR
AD
E6
1.6
437.
50
45
.75
58
.128
1.75
57.
146
6.6
778
.39
We
bst
er
WEBS
TE
R C
O. H
IGH
SC
H28
.24
15.9
59
.88
20
.90
55
.88
48
.49
40
.62
50
.01
We
bst
er
WEBS
TE
R S
PR
ING
S E
LEM
41.4
63
1.8
714
.36
33
.02
71.7
872.2
54
8.3
36
5.3
3
TO
TAL
38
.59
22.4
516
.01
31.0
36
9.2
76
2.4
15
1.5
96
3.9
8
Wetz
el
HU
ND
RED
HIG
H S
CH
OO
L4
3.2
33
5.7
927.
50
35
.96
74.10
67.
37
71.4
073
.32
Wetz
el
LON
G D
RA
IN S
CH
OO
L4
0.7
13
3.8
83
0.5
63
6.3
272.6
876
.45
67.
79
71.21
Wetz
el
MA
GN
OLIA
HIG
H S
CH
OO
L3
4.8
822.3
013
.08
20
.53
68
.71
62.5
04
9.2
85
6.0
9
Wetz
el
NEW
MA
RT
INS
VIL
LE S
CH
34
.69
26
.93
12.12
23
.48
77.
22
71.26
56
.84
67.
17
SCHOOL PARTICIPATION DATA (cont’d)
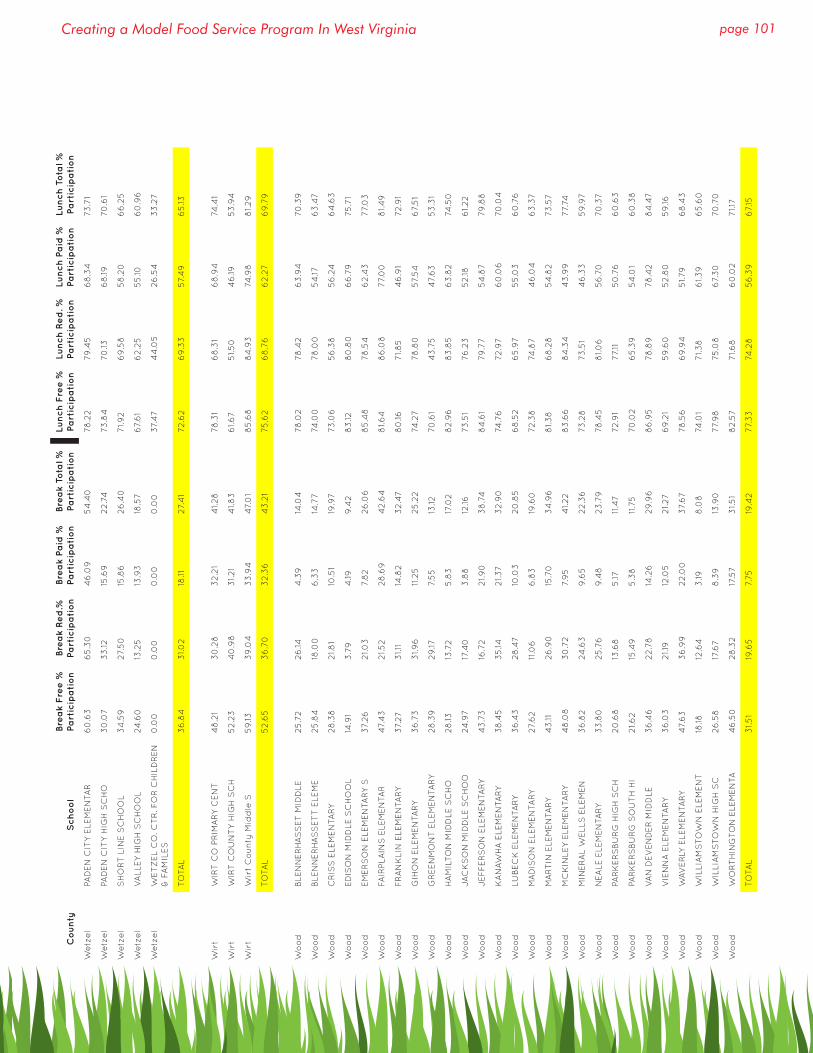
page 101Creating a Model Food Service Program In West Virginia
Co
un
tyS
ch
oo
lBre
ak
Fre
e %
Pa
rtic
ipa
tio
nBre
ak
Re
d.%
Pa
rtic
ipa
tio
nBre
ak
Pa
id %
Pa
rtic
ipa
tio
nBre
ak
Tota
l %
Pa
rtic
ipa
tio
nLu
nch
Fre
e %
Pa
rtic
ipa
tio
nLu
nch
Re
d. %
Pa
rtic
ipa
tio
nLu
nch
Pa
id %
Pa
rtic
ipa
tio
nLu
nch
To
tal %
Pa
rtic
ipa
tio
n
Wetz
el
PAD
EN
CIT
Y E
LEM
EN
TAR
60
.63
65
.30
46
.09
54
.40
78
.22
79
.45
68
.34
73
.71
Wetz
el
PAD
EN
CIT
Y H
IGH
SC
HO
30
.07
33
.1215
.69
22.7
473
.84
70
.136
8.19
70
.61
Wetz
el
SH
OR
T L
INE S
CH
OO
L3
4.5
927.
50
15.8
626
.40
71.9
26
9.5
85
8.2
06
6.2
5
Wetz
el
VA
LLEY
HIG
H S
CH
OO
L24
.60
13.2
513
.93
18.5
76
7.6
16
2.2
55
5.10
60
.96
Wetz
el
WET
ZEL
CO
. CT
R. F
OR
CH
ILD
REN
&
FA
MIL
ES
0.0
00
.00
0.0
00
.00
37.
47
44
.05
26
.54
33
.27
TO
TAL
36
.84
31.0
218
.1127.
41
72.6
26
9.3
357.
49
65
.13
Wir
tW
IRT
CO
PR
IMA
RY
CEN
T4
8.2
13
0.2
83
2.2
14
1.28
78
.31
68
.31
68
.94
74.4
1
Wir
tW
IRT
CO
UN
TY
HIG
H S
CH
52.2
34
0.9
83
1.21
41.8
36
1.6
75
1.5
04
6.19
53
.94
Wir
tW
irt
Co
un
ty M
idd
le S
59
.133
9.0
43
3.9
44
7.0
18
5.6
88
4.9
374
.98
81.29
TO
TAL
52.6
53
6.7
03
2.3
64
3.2
175
.62
68
.76
62.2
76
9.7
9
Wo
od
BLE
NN
ER
HA
SS
ET
MID
DLE
25
.72
26
.144
.39
14.0
478
.02
78
.42
63
.94
70
.39
Wo
od
BLE
NN
ER
HA
SS
ET
T E
LEM
E25
.84
18.0
06
.33
14.7
774
.00
78
.00
54
.176
3.4
7
Wo
od
CR
ISS
ELE
MEN
TARY
28
.38
21.8
110
.51
19.9
773
.06
56
.38
56
.24
64
.63
Wo
od
ED
ISO
N M
IDD
LE S
CH
OO
L14
.91
3.7
94
.199
.42
83
.128
0.8
06
6.7
975
.71
Wo
od
EM
ER
SO
N E
LEM
EN
TARY
S37.
26
21.0
37.
82
26
.06
85
.48
78
.54
62.4
377.
03
Wo
od
FAIR
PLA
INS
ELE
MEN
TAR
47.
43
21.52
28
.69
42.6
48
1.6
48
6.0
877.
00
81.4
9
Wo
od
FR
AN
KLIN
ELE
MEN
TARY
37.
27
31.1
114
.82
32.4
78
0.16
71.8
54
6.9
172.9
1
Wo
od
GIH
ON
ELE
MEN
TARY
36
.73
31.9
611
.25
25
.22
74.2
778
.80
57.
54
67.
51
Wo
od
GR
EEN
MO
NT
ELE
MEN
TARY
28
.39
29
.177.
55
13.12
70
.61
43
.75
47.
63
53
.31
Wo
od
HA
MIL
TO
N M
IDD
LE S
CH
O28
.1313
.72
5.8
317
.02
82.9
68
3.8
56
3.8
274
.50
Wo
od
JA
CK
SO
N M
IDD
LE S
CH
OO
24.9
717
.40
3.8
812
.1673
.51
76
.23
52.18
61.22
Wo
od
JEF
FE
RS
ON
ELE
MEN
TARY
43
.73
16.7
221.9
03
8.7
48
4.6
179
.77
54
.87
79
.88
Wo
od
KA
NAW
HA
ELE
MEN
TARY
38
.45
35
.1421.37
32.9
074
.76
72.9
76
0.0
670
.04
Wo
od
LUBEC
K E
LEM
EN
TARY
36
.43
28
.47
10.0
320
.85
68
.52
65
.97
55
.03
60
.76
Wo
od
MA
DIS
ON
ELE
MEN
TARY
27.
62
11.0
66
.83
19.6
072.3
874
.87
46
.04
63
.37
Wo
od
MA
RT
IN E
LEM
EN
TARY
43
.1126
.90
15.7
03
4.9
68
1.3
86
8.2
85
4.8
273
.57
Wo
od
MC
KIN
LEY
ELE
MEN
TARY
48
.08
30
.72
7.9
54
1.22
83
.66
84
.34
43
.99
77.
74
Wo
od
MIN
ER
AL
WELL
S E
LEM
EN
36
.82
24.6
39
.65
22.3
673
.28
73
.51
46
.33
59
.97
Wo
od
NEA
LE E
LEM
EN
TARY
33
.80
25
.76
9.4
823
.79
78
.45
81.0
65
6.7
070
.37
Wo
od
PAR
KE
RS
BU
RG
HIG
H S
CH
20
.68
13.6
85
.1711
.47
72.9
177.
115
0.7
66
0.6
3
Wo
od
PAR
KE
RS
BU
RG
SO
UT
H H
I21.6
215
.49
5.3
811
.75
70
.02
65
.39
54
.01
60
.38
Wo
od
VA
N D
EV
EN
DE
R M
IDD
LE3
6.4
622.7
814
.26
29
.96
86
.95
78
.89
78
.42
84
.47
Wo
od
VIE
NN
A E
LEM
EN
TARY
36
.03
21.1
912
.05
21.27
69
.21
59
.60
52.8
059
.16
Wo
od
WAV
ER
LY E
LEM
EN
TARY
47.
63
36
.99
22.0
037.
67
78
.56
69
.94
51.7
96
8.4
3
Wo
od
WIL
LIA
MS
TO
WN
ELE
MEN
T18
.1812
.64
3.19
8.0
874
.01
71.3
86
1.3
96
5.6
0
Wo
od
WIL
LIA
MS
TO
WN
HIG
H S
C26
.58
17.6
78
.39
13.9
077.
98
75.0
86
7.3
070
.70
Wo
od
WO
RT
HIN
GTO
N E
LEM
EN
TA4
6.5
028
.32
17.5
73
1.5
18
2.5
771.6
86
0.0
271.1
7
TO
TAL
31.5
119
.65
7.75
19.4
277.
33
74.2
85
6.3
96
7.15

page 102 The Playbook
Co
un
tyS
ch
oo
lBre
ak
Fre
e %
Pa
rtic
ipa
tio
nBre
ak
Re
d.%
Pa
rtic
ipa
tio
nBre
ak
Pa
id %
Pa
rtic
ipa
tio
nBre
ak
Tota
l %
Pa
rtic
ipa
tio
nLu
nch
Fre
e %
Pa
rtic
ipa
tio
nLu
nch
Re
d. %
Pa
rtic
ipa
tio
nLu
nch
Pa
id %
Pa
rtic
ipa
tio
nLu
nch
To
tal %
Pa
rtic
ipa
tio
n
Wyo
min
gBA
ILEYS
VIL
LE G
RA
DE S
59
.66
61.3
34
8.2
857.
43
82.3
28
0.9
78
2.2
88
2.3
8
Wyo
min
gBE
RLIN
MC
KIN
NEY
GR
AD
56
.08
50
.164
4.0
45
1.19
76
.80
69
.38
61.3
270
.47
Wyo
min
gG
LEN
FO
RK
GR
AD
E S
CH
O5
4.3
13
6.0
54
7.52
50
.84
80
.1776
.87
82.8
08
1.4
2
Wyo
min
gH
ER
ND
ON
CO
NS
OLID
ATED
68
.92
59
.67
64
.156
6.8
88
0.5
274
.59
70
.37
76
.97
Wyo
min
gH
UF
F C
ON
SO
LID
ATED
SC
44
.31
23
.99
34
.93
39
.52
81.0
375
.65
80
.24
80
.27
Wyo
min
gM
ULL
EN
S E
LEM
EN
TARY
S6
7.59
63
.52
41.1
757.
50
83
.32
83
.65
68
.1977.
84
Wyo
min
gM
ULL
EN
S M
IDD
LE S
CH
OO
38
.40
38
.79
19.7
629
.64
77.
28
83
.03
78
.66
79
.28
Wyo
min
gO
CEA
NA
MID
DLE
SC
HO
OL
37.
93
38
.40
26
.53
33
.07
75.16
70
.80
69
.80
72.7
5
Wyo
min
gPIN
EV
ILLE
ELE
MEN
TARY
69
.77
57.
746
6.7
96
7.9
58
0.0
071.1
36
7.0
874
.50
Wyo
min
gPIN
EV
ILLE
MID
DLE
SC
H5
0.3
65
1.15
43
.76
47.
73
83
.43
84
.92
77.
71
81.3
3
Wyo
min
gR
OA
D B
RA
NC
H G
RA
DE S
C6
0.0
34
2.0
33
4.7
14
9.3
978
.09
68
.1271.5
975
.51
Wyo
min
gW
ES
TS
IDE H
IGH
SC
HO
OL
33
.61
30
.23
27.
35
30
.63
67.
84
75.8
271.3
670
.10
Wyo
min
gW
YOM
ING
EA
ST
HIG
H3
3.18
42.9
922.7
229
.00
66
.52
76
.176
9.7
26
9.0
4
TO
TAL
51.0
74
5.5
637.
64
45
.47
77.
00
76
.1371.7
575
.09
STA
TE
41.0
73
0.6
418
.55
29
.77
72.5
26
8.9
25
8.4
06
5.7
5
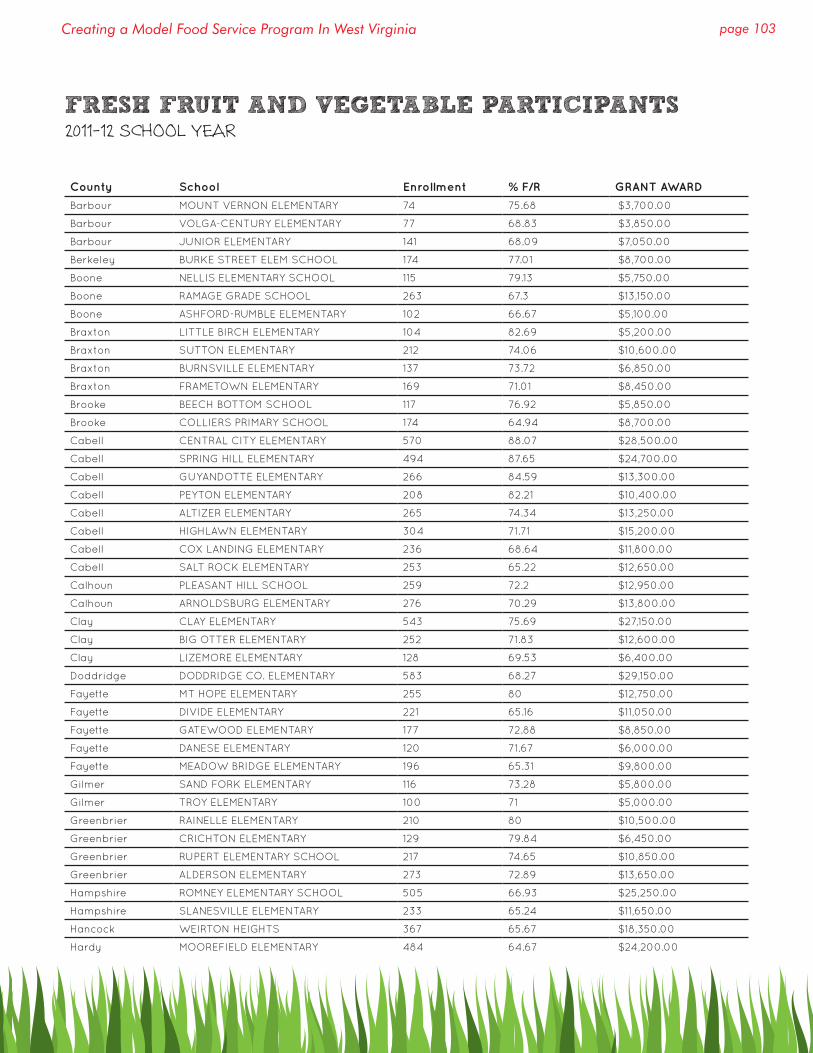
page 103Creating a Model Food Service Program In West Virginia
FRESH FRUIT AND VEGETABLE PARTICIPANTS2011-12 SCHOOL YEAR
County School Enrollment % F/R GRANT AWARD
Barbour MOUNT VERNON ELEMENTARY 74 75.68 $3,700.00
Barbour VOLGA-CENTURY ELEMENTARY 77 68.83 $3,850.00
Barbour JUNIOR ELEMENTARY 141 68.09 $7,050.00
Berkeley BURKE STREET ELEM SCHOOL 174 77.01 $8,700.00
Boone NELLIS ELEMENTARY SCHOOL 115 79.13 $5,750.00
Boone RAMAGE GRADE SCHOOL 263 67.3 $13,150.00
Boone ASHFORD-RUMBLE ELEMENTARY 102 66.67 $5,100.00
Braxton LITTLE BIRCH ELEMENTARY 104 82.69 $5,200.00
Braxton SUTTON ELEMENTARY 212 74.06 $10,600.00
Braxton BURNSVILLE ELEMENTARY 137 73.72 $6,850.00
Braxton FRAMETOWN ELEMENTARY 169 71.01 $8,450.00
Brooke BEECH BOTTOM SCHOOL 117 76.92 $5,850.00
Brooke COLLIERS PRIMARY SCHOOL 174 64.94 $8,700.00
Cabell CENTRAL CITY ELEMENTARY 570 88.07 $28,500.00
Cabell SPRING HILL ELEMENTARY 494 87.65 $24,700.00
Cabell GUYANDOTTE ELEMENTARY 266 84.59 $13,300.00
Cabell PEYTON ELEMENTARY 208 82.21 $10,400.00
Cabell ALTIZER ELEMENTARY 265 74.34 $13,250.00
Cabell HIGHLAWN ELEMENTARY 304 71.71 $15,200.00
Cabell COX LANDING ELEMENTARY 236 68.64 $11,800.00
Cabell SALT ROCK ELEMENTARY 253 65.22 $12,650.00
Calhoun PLEASANT HILL SCHOOL 259 72.2 $12,950.00
Calhoun ARNOLDSBURG ELEMENTARY 276 70.29 $13,800.00
Clay CLAY ELEMENTARY 543 75.69 $27,150.00
Clay BIG OTTER ELEMENTARY 252 71.83 $12,600.00
Clay LIZEMORE ELEMENTARY 128 69.53 $6,400.00
Doddridge DODDRIDGE CO. ELEMENTARY 583 68.27 $29,150.00
Fayette MT HOPE ELEMENTARY 255 80 $12,750.00
Fayette DIVIDE ELEMENTARY 221 65.16 $11,050.00
Fayette GATEWOOD ELEMENTARY 177 72.88 $8,850.00
Fayette DANESE ELEMENTARY 120 71.67 $6,000.00
Fayette MEADOW BRIDGE ELEMENTARY 196 65.31 $9,800.00
Gilmer SAND FORK ELEMENTARY 116 73.28 $5,800.00
Gilmer TROY ELEMENTARY 100 71 $5,000.00
Greenbrier RAINELLE ELEMENTARY 210 80 $10,500.00
Greenbrier CRICHTON ELEMENTARY 129 79.84 $6,450.00
Greenbrier RUPERT ELEMENTARY SCHOOL 217 74.65 $10,850.00
Greenbrier ALDERSON ELEMENTARY 273 72.89 $13,650.00
Hampshire ROMNEY ELEMENTARY SCHOOL 505 66.93 $25,250.00
Hampshire SLANESVILLE ELEMENTARY 233 65.24 $11,650.00
Hancock WEIRTON HEIGHTS 367 65.67 $18,350.00
Hardy MOOREFIELD ELEMENTARY 484 64.67 $24,200.00

page 104 The Playbook
County School Enrollment % F/R GRANT AWARD
Harrison WILSONBURG ELEMENTARY 253 71.94 $12,650.00
Harrison NORTH VIEW ELEMENTARY 289 71.63 $14,450.00
Harrison LUMBERPORT ELEMENTARY 358 67.32 $17,900.00
Jefferson RANSON ELEMENTARY SCHOOL 391 74.17 $19,550.00
Kanawha GRANDVIEW ELEMENTARY 254 85.04 $12,700.00
Kanawha WESTSIDE ELEMENTARY 529 83.74 $26,450.00
Kanawha ANNE BAILEY ELEMENTARY 365 81.37 $18,250.00
Kanawha J. E. ROBINS ELEMENTARY 271 80.07 $13,550.00
Kanawha WEIMER ELEMENTARY 200 78 $10,000.00
Kanawha SHARON DAWES 239 75.73 $11,950.00
Kanawha SHAWNEE COMMUNITY CENTER 199 74.37 $9,950.00
Kanawha CEDAR GROVE ELEMENTARY 361 72.85 $18,050.00
Kanawha BRIDGEVIEW ELEMENTARY 457 71.33 $22,850.00
Kanawha MARMET 226 71.24 $11,300.00
Kanawha DUNBAR INTERMEDIATE 331 70.09 $16,550.00
Kanawha MIDLAND TRAIL 242 68.18 $12,100.00
Kanawha BELLE 365 67.4 $18,250.00
Kanawha CHESAPEAKE 202 67.33 $10,100.00
Kanawha PRATT 346 67.05 $17,300.00
Kanawha RICHMOND ELEMENTARY 280 65.71 $14,000.00
Kanawha DUNBAR PRIMARY CENTE 486 65.43 $24,300.00
Lewis ROANOKE ELEMENTARY 181 72.38 $9,050.00
Lewis ALUM BRIDGE ELEMENTARY 114 66.67 $5,700.00
Lincoln RANGER ELEMENTARY 151 78.81 $7,550.00
Lincoln WEST HAMLIN ELEMENTARY 528 76.52 $26,400.00
Lincoln HARTS PRIMARY SCHOOL 242 74.79 $12,100.00
Logan OMAR GRADE 244 73.77 $12,200.00
Logan LOGAN ELEMENTARY 421 70.78 $21,050.00
Logan HUGH DINGESS ELEMENTARY 138 70.29 $6,900.00
Logan BUFFALO ELEMENTARY 222 67.12 $11,100.00
Logan HOLDEN 234 66.24 $11,700.00
Marshall CENTER MCMECHEN SCHOOL 233 70.39 $11,650.00
Marshall CENTRAL ELEMENTARY SCHOOL 343 66.76 $17,150.00
Mason BEALE ELEMENTARY SCHOOL 292 77.4 $14,600.00
Mason LEON ELEMENTARY SCHOOL 153 69.28 $7,650.00
McDowell KIMBALL ELEMENTARY 308 94.81 $15,400.00
McDowell SOUTHSIDE K-8 489 87.73 $24,450.00
McDowell ANAWALT ELEMENTARY 113 86.73 $5,650.00
McDowell FALL RIVER ELEMENTARY 170 86.47 $8,500.00
McDowell BRADSHAW ELEMENTARY 243 84.36 $12,150.00
McDowell WELCH ELEMENTARY 318 82.7 $15,900.00
McDowell IAEGER ELEMENTARY 311 82.64 $15,550.00
FRESH FRUIT AND VEGETABLE PARTICIPANTS
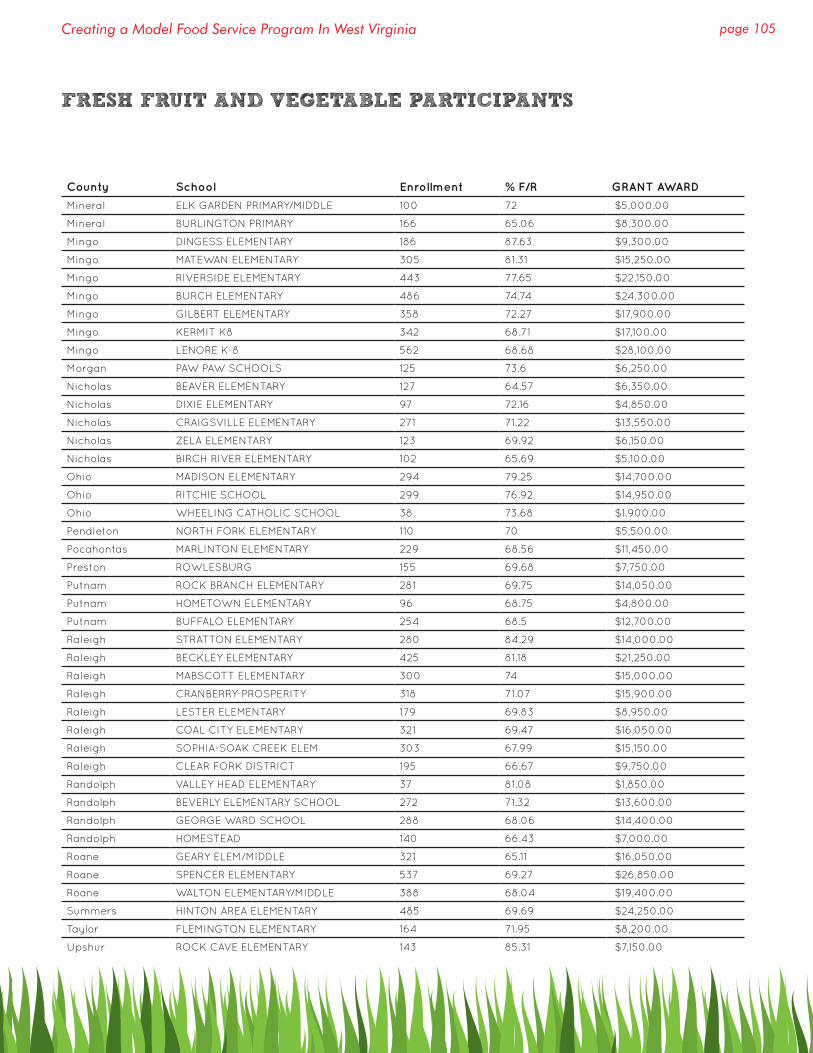
page 105Creating a Model Food Service Program In West Virginia
County School Enrollment % F/R GRANT AWARD
Mineral ELK GARDEN PRIMARY/MIDDLE 100 72 $5,000.00
Mineral BURLINGTON PRIMARY 166 65.06 $8,300.00
Mingo DINGESS ELEMENTARY 186 87.63 $9,300.00
Mingo MATEWAN ELEMENTARY 305 81.31 $15,250.00
Mingo RIVERSIDE ELEMENTARY 443 77.65 $22,150.00
Mingo BURCH ELEMENTARY 486 74.74 $24,300.00
Mingo GILBERT ELEMENTARY 358 72.27 $17,900.00
Mingo KERMIT K8 342 68.71 $17,100.00
Mingo LENORE K-8 562 68.68 $28,100.00
Morgan PAW PAW SCHOOLS 125 73.6 $6,250.00
Nicholas BEAVER ELEMENTARY 127 64.57 $6,350.00
Nicholas DIXIE ELEMENTARY 97 72.16 $4,850.00
Nicholas CRAIGSVILLE ELEMENTARY 271 71.22 $13,550.00
Nicholas ZELA ELEMENTARY 123 69.92 $6,150.00
Nicholas BIRCH RIVER ELEMENTARY 102 65.69 $5,100.00
Ohio MADISON ELEMENTARY 294 79.25 $14,700.00
Ohio RITCHIE SCHOOL 299 76.92 $14,950.00
Ohio WHEELING CATHOLIC SCHOOL 38 73.68 $1,900.00
Pendleton NORTH FORK ELEMENTARY 110 70 $5,500.00
Pocahontas MARLINTON ELEMENTARY 229 68.56 $11,450.00
Preston ROWLESBURG 155 69.68 $7,750.00
Putnam ROCK BRANCH ELEMENTARY 281 69.75 $14,050.00
Putnam HOMETOWN ELEMENTARY 96 68.75 $4,800.00
Putnam BUFFALO ELEMENTARY 254 68.5 $12,700.00
Raleigh STRATTON ELEMENTARY 280 84.29 $14,000.00
Raleigh BECKLEY ELEMENTARY 425 81.18 $21,250.00
Raleigh MABSCOTT ELEMENTARY 300 74 $15,000.00
Raleigh CRANBERRY-PROSPERITY 318 71.07 $15,900.00
Raleigh LESTER ELEMENTARY 179 69.83 $8,950.00
Raleigh COAL CITY ELEMENTARY 321 69.47 $16,050.00
Raleigh SOPHIA-SOAK CREEK ELEM 303 67.99 $15,150.00
Raleigh CLEAR FORK DISTRICT 195 66.67 $9,750.00
Randolph VALLEY HEAD ELEMENTARY 37 81.08 $1,850.00
Randolph BEVERLY ELEMENTARY SCHOOL 272 71.32 $13,600.00
Randolph GEORGE WARD SCHOOL 288 68.06 $14,400.00
Randolph HOMESTEAD 140 66.43 $7,000.00
Roane GEARY ELEM/MIDDLE 321 65.11 $16,050.00
Roane SPENCER ELEMENTARY 537 69.27 $26,850.00
Roane WALTON ELEMENTARY/MIDDLE 388 68.04 $19,400.00
Summers HINTON AREA ELEMENTARY 485 69.69 $24,250.00
Taylor FLEMINGTON ELEMENTARY 164 71.95 $8,200.00
Upshur ROCK CAVE ELEMENTARY 143 85.31 $7,150.00
FRESH FRUIT AND VEGETABLE PARTICIPANTS
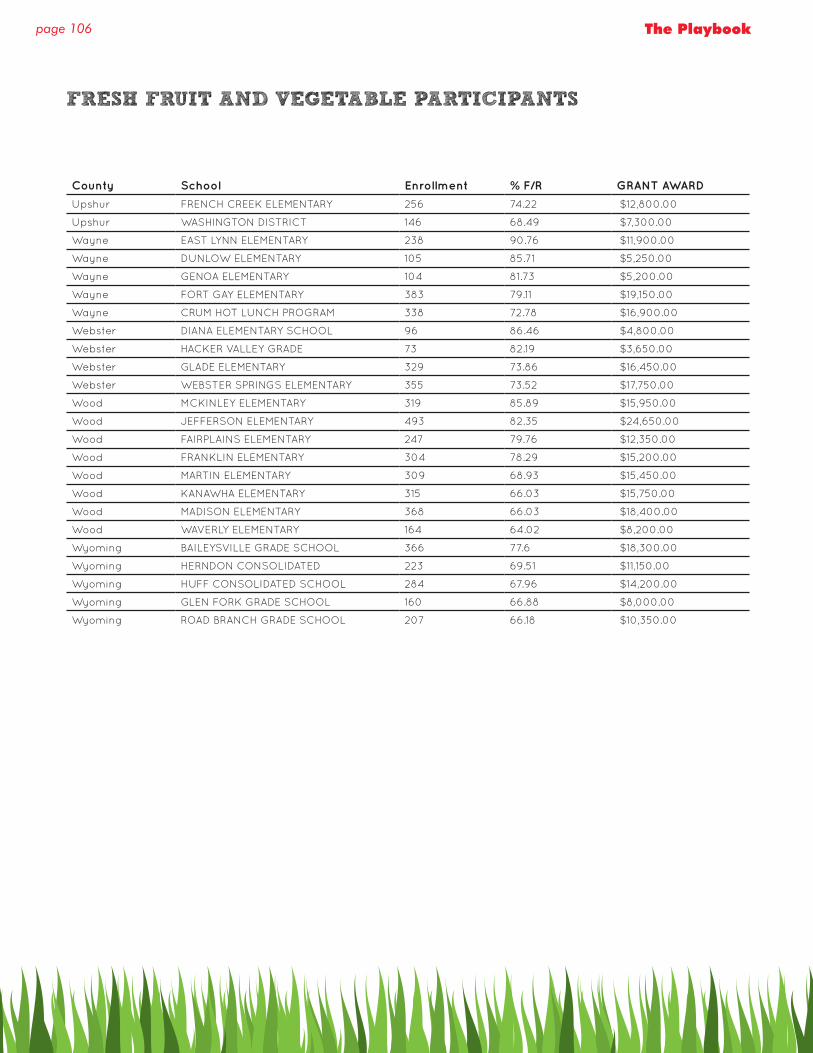
page 106 The Playbook
County School Enrollment % F/R GRANT AWARD
Upshur FRENCH CREEK ELEMENTARY 256 74.22 $12,800.00
Upshur WASHINGTON DISTRICT 146 68.49 $7,300.00
Wayne EAST LYNN ELEMENTARY 238 90.76 $11,900.00
Wayne DUNLOW ELEMENTARY 105 85.71 $5,250.00
Wayne GENOA ELEMENTARY 104 81.73 $5,200.00
Wayne FORT GAY ELEMENTARY 383 79.11 $19,150.00
Wayne CRUM HOT LUNCH PROGRAM 338 72.78 $16,900.00
Webster DIANA ELEMENTARY SCHOOL 96 86.46 $4,800.00
Webster HACKER VALLEY GRADE 73 82.19 $3,650.00
Webster GLADE ELEMENTARY 329 73.86 $16,450.00
Webster WEBSTER SPRINGS ELEMENTARY 355 73.52 $17,750.00
Wood MCKINLEY ELEMENTARY 319 85.89 $15,950.00
Wood JEFFERSON ELEMENTARY 493 82.35 $24,650.00
Wood FAIRPLAINS ELEMENTARY 247 79.76 $12,350.00
Wood FRANKLIN ELEMENTARY 304 78.29 $15,200.00
Wood MARTIN ELEMENTARY 309 68.93 $15,450.00
Wood KANAWHA ELEMENTARY 315 66.03 $15,750.00
Wood MADISON ELEMENTARY 368 66.03 $18,400.00
Wood WAVERLY ELEMENTARY 164 64.02 $8,200.00
Wyoming BAILEYSVILLE GRADE SCHOOL 366 77.6 $18,300.00
Wyoming HERNDON CONSOLIDATED 223 69.51 $11,150.00
Wyoming HUFF CONSOLIDATED SCHOOL 284 67.96 $14,200.00
Wyoming GLEN FORK GRADE SCHOOL 160 66.88 $8,000.00
Wyoming ROAD BRANCH GRADE SCHOOL 207 66.18 $10,350.00
FRESH FRUIT AND VEGETABLE PARTICIPANTS
Extra PointsTaking Advantage of
Additional Opportunites
“The difference between ordinary and extraordinary is that little ‘extra’.”
- Jimmy Johnson

page 108 The Playbook
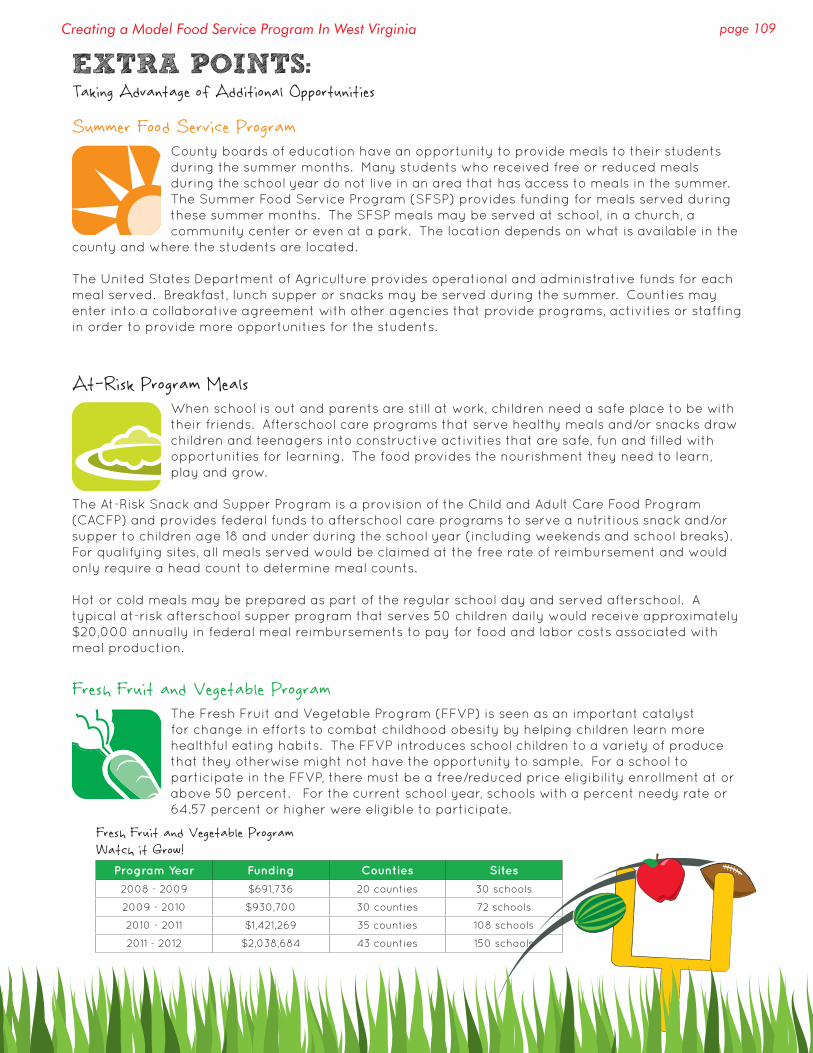
page 109Creating a Model Food Service Program In West Virginia
EXTRA POINTS:Taking Advantage of Additional Opportunities
Summer Food Service ProgramCounty boards of education have an opportunity to provide meals to their students during the summer months. Many students who received free or reduced meals during the school year do not live in an area that has access to meals in the summer. The Summer Food Service Program (SFSP) provides funding for meals served during these summer months. The SFSP meals may be served at school, in a church, a community center or even at a park. The location depends on what is available in the
county and where the students are located.
The United States Department of Agriculture provides operational and administrative funds for each meal served. Breakfast, lunch supper or snacks may be served during the summer. Counties may enter into a collaborative agreement with other agencies that provide programs, activities or staffing in order to provide more opportunities for the students.
At-Risk Program MealsWhen school is out and parents are still at work, children need a safe place to be with their friends. Afterschool care programs that serve healthy meals and/or snacks draw children and teenagers into constructive activities that are safe, fun and filled with opportunities for learning. The food provides the nourishment they need to learn, play and grow.
The At-Risk Snack and Supper Program is a provision of the Child and Adult Care Food Program (CACFP) and provides federal funds to afterschool care programs to serve a nutritious snack and/or supper to children age 18 and under during the school year (including weekends and school breaks). For qualifying sites, all meals served would be claimed at the free rate of reimbursement and would only require a head count to determine meal counts.
Hot or cold meals may be prepared as part of the regular school day and served afterschool. A typical at-risk afterschool supper program that serves 50 children daily would receive approximately $20,000 annually in federal meal reimbursements to pay for food and labor costs associated with meal production.
Fresh Fruit and Vegetable Program The Fresh Fruit and Vegetable Program (FFVP) is seen as an important catalyst for change in efforts to combat childhood obesity by helping children learn more healthful eating habits. The FFVP introduces school children to a variety of produce that they otherwise might not have the opportunity to sample. For a school to participate in the FFVP, there must be a free/reduced price eligibility enrollment at or above 50 percent. For the current school year, schools with a percent needy rate or 64.57 percent or higher were eligible to participate.
Fresh Fruit and Vegetable Program Watch it Grow!
Program Year Funding Counties Sites
2008 - 2009 $691,736 20 counties 30 schools
2009 - 2010 $930,700 30 counties 72 schools
2010 - 2011 $1,421,269 35 counties 108 schools
2011 - 2012 $2,038,684 43 counties 150 schools

page 110 The Playbook
Farm to School Many people would be surprised to learn many schools’ efforts to initiate farm to school programs in West Virginia. Although schools have long been encouraged to access local farmers to purchase foods for their schools, more and more food service directors around the state are taking it upon themselves to incorporate West Virginia produce, meat and eggs into their schools. Whether it is for the FFVP or for school salad bars, local growers are providing more fresh, local foods than ever to schools.
In addition, children are learning the entrepreneurial link of food production in school vocational programs and sales opportunities. Vocational students are growing produce in container gardens and using the experience to educate elementary school students about the process. Schools are initiating “Adopt a Farmer” programs to work with local growers directly and purchasing fresh produce in the winter from farmers using high tunnels. Finally, food service directors have the opportunity to link directly with local growers through statewide collaborative initiatives with the WVDE and other interested groups like the West Virginia Food & Farm Coalition, Extension Small Farms Center, WesMonTy RC&D, the Center for Economic Options, Appalachian Farm Research Center, and the Collaborative for 21st Century Appalachia. The opportunity to expand these exciting initiatives is without limit!
Fayette County students planting potatoes
“You have never tasted a strawberry until you have had one that was picked fresh in West Virginia and served immediately. Not like the strawberries grown out west that are raised to withstand cross country travel with minimal bumps and bruises. The two are not even the same fruit.”
David Seay, Food Service Director, Fayette County
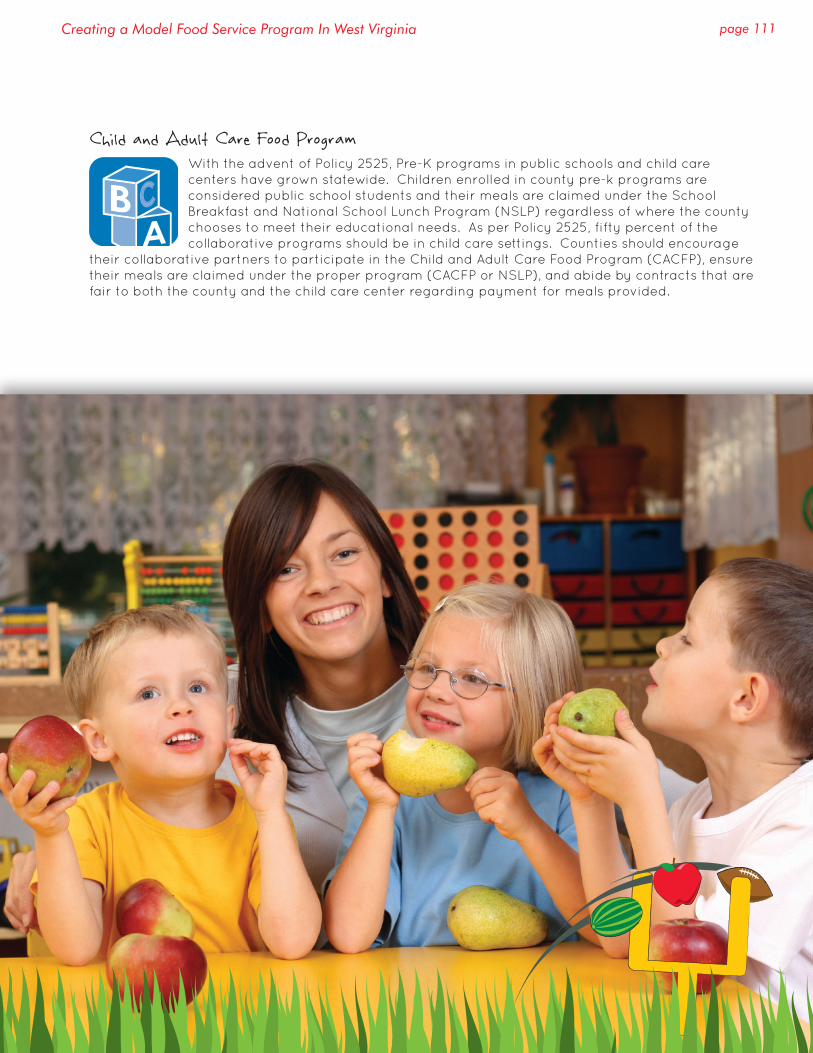
page 111Creating a Model Food Service Program In West Virginia
Child and Adult Care Food ProgramWith the advent of Policy 2525, Pre-K programs in public schools and child care centers have grown statewide. Children enrolled in county pre-k programs are considered public school students and their meals are claimed under the School Breakfast and National School Lunch Program (NSLP) regardless of where the county chooses to meet their educational needs. As per Policy 2525, fifty percent of the collaborative programs should be in child care settings. Counties should encourage
their collaborative partners to participate in the Child and Adult Care Food Program (CACFP), ensure their meals are claimed under the proper program (CACFP or NSLP), and abide by contracts that are fair to both the county and the child care center regarding payment for meals provided.

page 112 The Playbook
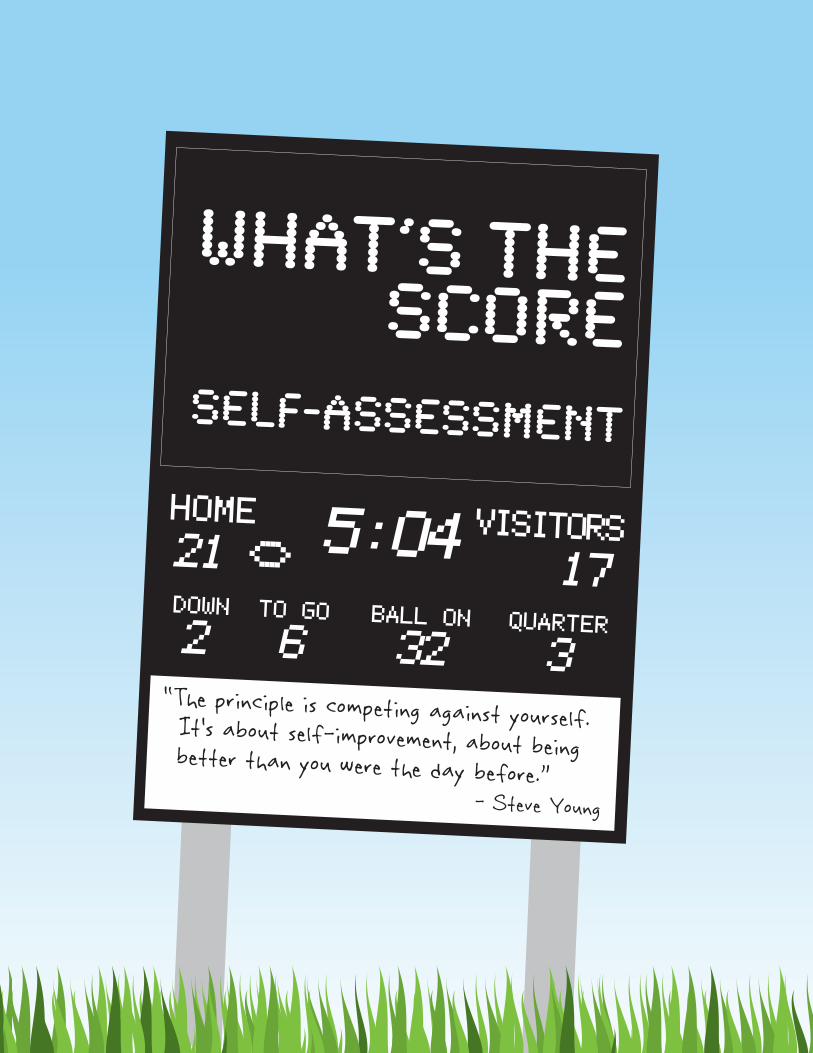
HOME VISITORS5:0421
2 6 32 3
17DOWN TO GO BALL ON QUARTER
What’s the ScoreSelf-assessment
“The principle is competing against yourself. It’s about self-improvement, about being better than you were the day before.”- Steve Young

page 114 The Playbook
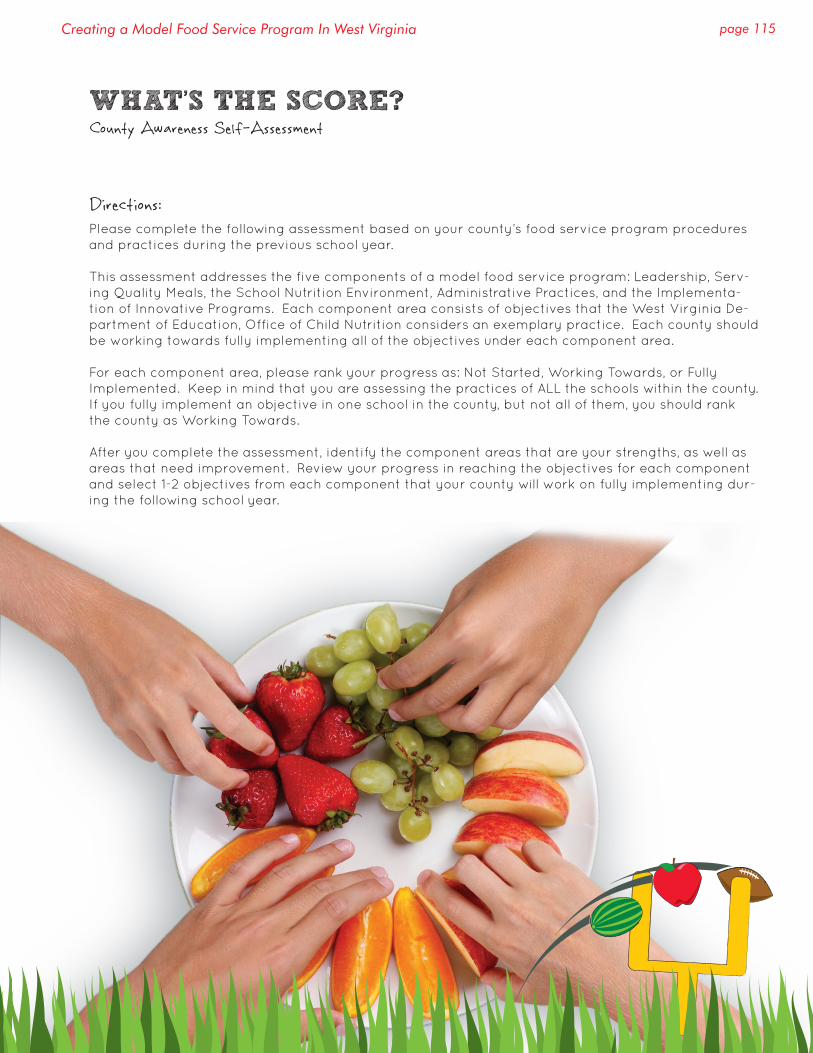
page 115Creating a Model Food Service Program In West Virginia
Directions:Please complete the following assessment based on your county’s food service program procedures and practices during the previous school year.
This assessment addresses the five components of a model food service program: Leadership, Serv-ing Quality Meals, the School Nutrition Environment, Administrative Practices, and the Implementa-tion of Innovative Programs. Each component area consists of objectives that the West Virginia De-partment of Education, Office of Child Nutrition considers an exemplary practice. Each county should be working towards fully implementing all of the objectives under each component area.
For each component area, please rank your progress as: Not Started, Working Towards, or Fully Implemented. Keep in mind that you are assessing the practices of ALL the schools within the county. If you fully implement an objective in one school in the county, but not all of them, you should rank the county as Working Towards.
After you complete the assessment, identify the component areas that are your strengths, as well as areas that need improvement. Review your progress in reaching the objectives for each component and select 1-2 objectives from each component that your county will work on fully implementing dur-ing the following school year.
WHAT’S THE SCORE?County Awareness Self-Assessment
page 116 The Playbook
County Awareness Self-Assessment
LEADERSHIPIt takes the Superintendent, Food Service Director and Principal all working towards the same goal to create a model food service program. If any one of the three does not have the vision or commitment to reaching the shared goal, the project will not be successful.
SUPERINTENDENT: The Superintendent sets the vision and expectations of the food service program for the entire county by providing support, resources and clearly communicating the expectations to the food service director and school principals.
Objective 1: SupportThe Superintendent supports the food service program by garnering basic knowledge of how the Child Nutrition Programs operate, employing a credentialed and full-time food service director and holding principals accountable to WV BOE Policy 4321.1 Standards for Child Nutrition and the Local School Wellness Policy.The Superintendent is knowledgeable of Policy 4321.1, meal pattern requirements, and the financial/administrative procedures and regulations of the food service operation. The Food Service Director meets Policy 4321.1 staffing qualifications.
□ Not Started □ Working Towards □ Fully Implemented
Objective 2: ResourcesThe Superintendent ensures there are enough financial and personnel resources, as well as adequate kitchen equipment and space to run an exemplary food service program.Financially, across the board programmatic cuts that negatively affect food service are eliminated. In regards to personnel resources, cook ratio per school is constantly under consideration. Kitchen equipment is continually updated and there is adequate dry storage, freezer, and kitchen space.
□ Not Started □ Working Towards □ Fully Implemented
Objective 3: CommunicationThe Superintendent reinforces the message regarding a quality and innovative food service program each year by maintaining an open line of communication with the food service director, treasurer, and school principals and requesting the Office of Child Nutrition to speak to the principals annually.
□ Not Started □ Working Towards □ Fully Implemented
page 117Creating a Model Food Service Program In West Virginia
LEADERSHIP (cont’d)It takes the Superintendent, Food Service Director and Principal all working towards the same goal to create a model food service program. If any one of the three does not have the vision or commitment to reaching the shared goal, the project will not be successful.
FOOD SERVICE DIRECTOR: The Food Service Director provides support, resources, and supervision to food service personnel to effectively implement the food service operation throughout the county.
Objective 1: Training, Reporting & MonitoringThe Food Service Director annually completes necessary staff development requirements, attends and utilizes the Office of Child Nutrition meetings/trainings/resources, stays current on state/federal regulations, as well as monitoring and reporting requirements, and asks for assistance when needed.Staff development requirements: Annually completes and submits 15 hours of staff development related to child nutrition programs. Monitoring requirements: Monitors program(s) as required, by February 1st each year; thoroughly examines kitchen operations – purchasing practices, inventories, food safety/temperature logs, record keeping and production records, etc.Reporting requirements: Submits required federal reports in a timely manner and ensures that monthly claims for federal meal reimbursement are properly submitted and reconciled.
□ Not Started □ Working Towards □ Fully Implemented
Objective 2: ManagementThe Food Service Director manages the food service program like a for-profit business (managing costs and targeting revenues) and continually analyzes different means to maintain and increase participation.For example, all school-level purchases are scrutinized; cooks are only authorized to buy what is listed on the county market list, etc. Participation levels at each school are annually examined and barriers to participation are identified and removed. Adequate cook ratios per school are considered in regards to participation levels. Innovative programs and methods of meal service delivery are implemented to increase participation levels.
□ Not Started □ Working Towards □ Fully Implemented
Objective 3: SupervisionThe Food Service Director provides food service personnel with adequate supervision by participating in their evaluation, providing them with adequate and timely training, ensuring they have necessary kitchen equipment, protecting them from potential school staff abuses, and maintaining an adequate cook ratio per school.Examples of school staff abuses include staff making special menu and/or food requests, requesting additional portions, pressuring food service personnel that they be fed at no cost, etc.
□ Not Started □ Working Towards □ Fully Implemented
page 118 The Playbook
LEADERSHIP (cont’d)It takes the Superintendent, Food Service Director and Principal all working towards the same goal to create a model food service program. If any one of the three does not have the vision or commitment to reaching the shared goal, the project will not be successful.
PRINCIPAL: The Principal views the food service program as part of the instructional day and actively promotes student participation, enforces the WV BOE 4321.1 Standards for School Nutrition and federal regulations, and encourages good nutritional practices at school.
Objective 1: Administrative PracticesThe Principal promotes student participation in the child nutrition program(s) by disallowing administrative practices that compete with them, serving breakfast and lunch on amended school days, and encouraging school staff to participate in the breakfast and/or lunch program(s).Administrative practices that compete with the food service program include: allowing the selling of foods in competition with breakfast/lunch, marketing vended items to discourage meal participation, excessive wait time, schedules that do not allow time to eat, etc.
□ Not Started □ Working Towards □ Fully Implemented
Objective 2: Understands, Implements, and Enforces Policy and RegulationsThe Principal understands, implements, and enforces Policy 4321.1 (in and out of the cafeteria), the Local Wellness Policy, and federal program regulations regarding program/non-program adults.The evaluation of food service personnel job performance should include objectives regarding their understanding and compliance of Policy 4321.1, the meal pattern, and the food service operation. Policy 4321.1 specifically outlines nutrition standards for food and beverages sold, served, or distributed throughout the school day. This includes fundraisers, vended items, food used as a reward, classroom/school parties, etc.Each school is encouraged to develop their own Local Wellness Policy; however, if one is not in place, the school is expected to adhere to the county Local Wellness Policy. The Principal is encouraged to participate on the Local Wellness Policy Council.Non-program adults should not be expected to be fed at no-cost; nor should they ask or require food service personnel to prepare or provide additional food items, whether it is a special request or an additional portion.
□ Not Started □ Working Towards □ Fully Implemented
Objective 3: Encourages Good Nutritional PracticesThe Principal encourages good nutritional practices by role modeling healthy eating behaviors (and expecting all school staff to do the same) and prominently displaying positive nutritional messages, posters, and educational materials in the cafeteria and throughout the school; school staff are educated on good nutritional practices, Policy 4321.1 and the Local Wellness Policy.Develop policy that prohibits staff from bringing fast food in the school, consuming soda in the school cafeteria and classrooms, etc. All schools should be “dry” (soda-free).
□ Not Started □ Working Towards □ Fully Implemented
County Awareness Self-Assessment
page 119Creating a Model Food Service Program In West Virginia
SERVING QUALITY MEALSA quality school meal is one that has been prepared using fresh and natural ingredients from recipes that have been tested and standardized and incorporated into a cycle menu that meets and exceeds the Standards for Child Nutrition as outlined in Policy 4321.1
Objective 1: Prepare and Procure Minimally Processed FoodsFoods prepared and procured for the school lunch and/or breakfast program(s) are minimally processed; the purchase of heat-and-serve items has been discontinued and the majority of the meal is made from scratch on a daily basis.
□ Not Started □ Working Towards □ Fully Implemented
Objective 2: Salad Bar Offered DailyA salad bar, providing a weekly and daily variety of fresh fruits and vegetables, is available in every school and offered to all grade levels.
□ Not Started □ Working Towards □ Fully Implemented
Objective 3: Standardized Local RecipesLocal recipes are current, documented, tested, standardized and are used throughout the county.
□ Not Started □ Working Towards □ Fully Implemented
Objective 4: Utilizing Cycle MenusSeasonal cycle menus are utilized and marketed to highlight the nutrition standards and minimally processed foods.For example, menu items such as spaghetti, apples and carrots are marketed as: Whole Grain Spaghetti, West Virginia Grown Apples, Fresh Baby Carrots, etc.
□ Not Started □ Working Towards □ Fully Implemented
Objective 5: Meeting and Exceeding the Standards for Child NutritionThe food service program meets and exceeds Policy 4321.1 Standards for School Nutrition in providing the minimum required offerings for whole grains, fresh fruits and vegetables, and in providing a variety of wholesome foods that meet the fat, sodium, and sugar requirements.For example, in regards to whole grains, Policy 4321.1 requires that at least 5 servings/week must contain at least 33% whole grain or 5 g whole grain per 1 oz. The county, understanding the importance of whole grains in the diet, exceeds this standard by incorporating whole grains into all bread and grain products served.
□ Not Started □ Working Towards □ Fully Implemented
page 120 The Playbook
SCHOOL NUTRITION ENVIRONMENTA positive school nutrition environment considers the atmosphere of the cafeteria, appropriate time anagement of the meal service period, and addresses the nutritional quality of foods and beverages served outside the school nutrition program.
Objective 1: School Cafeteria AtmosphereCounty school cafeterias are clean, well lighted, and welcoming; adequate seating and space is provided; meals are served using reusable trays and utensils (not disposable); students are allowed to socialize while they consume their meal.Students should be allowed to talk while they consume their meal. Practices such as “quiet” requirements and the use of loud whistles or traffic signals stifle socialization, and thereby, meal consumption.
□ Not Started □ Working Towards □ Fully Implemented
Objective 2: Meal Service PeriodThe meal service period is managed in a way that encourages participation in the food service program by having minimal wait times and adequate time allowed for the students to eat.Additional service lines should be added as needed to reduce wait time. Policy 4321.1 mandates at least 10 minutes for breakfast and 20 minutes for lunch from the time the student receives their meal (not from bell to bell).
□ Not Started □ Working Towards □ Fully Implemented
Objective 3: Nutrition Practices On the School PremisesFood and beverages made available on the school premises, both in and out of the classroom, adhere to the nutrition standards AND recommendations of Policy 4321.1. In addition, water is available to all students throughout the school day.Policy 4321.1 is to be implemented in regards to ALL food and beverages sold, served, or distributed throughout the school day. This includes fundraisers, vended items, food used as a reward, classroom/school parties, etc.Although WV State Code permits the sale of other juice beverages with a minimum of 20% real juice, as well as the sale of soft drinks to students in county high schools except during breakfast and lunch periods, the RECOMMENDATIONS of Policy 4321.1 - which are to be adhered to - are as follows:
» At all grade levels, it is recommended that only water, 100% fruit and/or vegetable juice and non-fat and/or 1% low-fat milk, flavored or unflavored be sold, served or distributed during the school day.
» No candy, soft drinks, chewing gum or flavored ice bars will be sold, served or distributed during the school day.It is strongly recommended that students be allowed to carry water with them throughout the school day.
□ Not Started □ Working Towards □ Fully Implemented
County Awareness Self-Assessment
page 121Creating a Model Food Service Program In West Virginia
ADMINISTRATIVE PRACTICESWhen operated efficiently, the food service program should contribute to a stable bottom line for the county’s total budget. Several purchasing, billing and charging practices need to be in place in order to capitalize on the program’s financial benefits.
Objective 1: PurchasingThe county belongs to a cooperative purchasing group and utilizes available commodity foods.
□ Not Started □ Working Towards □ Fully Implemented
Objective 2: BillingThe county maintains a centralized billing operation and employs adequate support staff for the food service director, as well as a full-time staff person to collect outstanding student debt. Food service bills are mailed to the family and credit card payments are accepted.Centralized billing removes child nutrition funds out of schools, reducing theft and loss. The Food Service Director needs administrative help to: collect the eligibility status of every student, implement direct certification, ensure bills are sent and money collected, maintain the electronic counting and claiming systems, submit the claim for federal reimbursement, manage the purchase of food, ensure that quality meals are produced and served, and work on efforts to increase participation.
□ Not Started □ Working Towards □ Fully Implemented
Objective 3: ChargingThe county has a policy regarding charging privileges and does not overtly identify students by their meal eligibility status.The charging privileges policy should include a threshold that families cannot exceed and a process to discontinue charging privileges when
the threshold is met; the charging of second meals should be eliminated - there is no reimbursement.
□ Not Started □ Working Towards □ Fully Implemented
page 122 The Playbook
IMPLEMENTING INNOVATIVE PROGRAMSAll efforts in the county should be geared toward increasing participation. This is a win nutritionally for students, a win for principals in terms of student achievement, and a win financially for the county. The best and easiest way to increase participation is by offering unconventional methods for meal delivery, promoting the food service program, and by sponsoring additional child nutrition programs at schools that are site eligible.
Objective 1: Alternative Methods of Meal DeliveryBreakfast and lunch, as well as components of meals, are delivered using methods that provide students options and make it easy for them to eat nutritiously.Examples of alternative methods of meal delivery include: breakfast after first (period), grab ‘n’ go, breakfast/lunch in the classroom, etc.Offering more than one main entrée and incorporating regularly scheduled themed salad bars provides students more options, encouraging increased participation.
□ Not Started □ Working Towards □ Fully Implemented
Objective 2: PromotionThe National School Lunch Program, School Breakfast Program and other Child Nutrition Programs in which the county participates, are promoted throughout the school and county.Promotion examples: Reading menus on school announcements, providing menus online, displaying posters, providing information in the student handbook/parent newsletters, participating in NSLP Week and SBP Week, etc.
□ Not Started □ Working Towards □ Fully Implemented
Objective 3: Additional ProgramsThe county sponsors the Fresh Fruit and Vegetable Program (FFVP) and After School At-Risk Snack and/or Supper Program at all site eligible schools throughout the school year. When school is not in session, the county sponsors the Summer Food Service Program (SFSP) at all site eligible schools. In addition, Farm-to-School efforts are initiated whenever possible.
□ Not Started □ Working Towards □ Fully Implemented
County Awareness Self-Assessment

Resources
“Sure, luck means a lot in foo
tball. Not having a
good quarterback is bad luck.” - Don Shula

page 124 The Playbook
page 125Creating a Model Food Service Program In West Virginia
RESOURCES
Team Nutrition MaterialsAll West Virginia schools can qualify to become a Team Nutrition School. Becoming a Team Nutrition School will help focus attention on the important role nutritious school meals, nutrition education and a health-promoting school environment play in helping students learn to enjoy healthy eating and physical activity. It will provide the framework for team efforts by school nutrition staff, teachers, parents, the media and other community members. Team Nutrition Schools are the first to receive new educational materials on nutrition – at no cost! How many of your county schools are enrolled in the program? Check the database to find out: http://teamnutrition.usda.gov/schoolsdb/srchpage.asp
Healthy US School Challenge The HealthierUS School Challenge (HUSSC) is a voluntary initiative established in 2004 to recognize those schools participating in the National School Lunch Program who have created healthier school environments through the promotion of nutrition and physical activity.
In February 2010, First Lady Michelle Obama introduced Let’s Move!, incorporating the HealthierUS School Challenge into her campaign to raise a healthier generation of children. At that time, monetary funds became available for each HUSSC award level: Bronze, Silver, Gold, and Gold Award of Distinction.
Since the beginning of the HealthierUS School Challenge in 2004, awards have been given to schools in 43 states. The 2011 goal of 1250 certified schools is in reach with 1103 schools currently certified.
In West Virginia, Lincoln County just received the HUSSC Gold Award of Distinction for all 9 schools in the county. It was recognized by the USDA Mid Atlantic Regional Office (MARO) as the only county in the region of nine states to have successfully accomplished this remarkable goal.
FundraisingA book entitled, Sweet Deals: School Fundraising Can Be Healthy and Profitable, is provided as a supplement to The Playbook.

page 126 The Playbook
Innovative Breakfast Program MaterialsInnovative breakfast program promotional materials and examples to support the implementation of Breakfast After First, Grab N’ Go and Breakfast in the Classroom. This section also includes sample breakfast menus.
Breakfast after First - Overview How Does Breakfast after First Period Work?
This model is also called a nutrition break or second chance breakfast. As the name implies, students eat breakfast during a break in the morning, usually between 9:00 am and 10:00 am. Reimbursable breakfasts are individually packaged in grab ‘n’ go bags. These are usually offered from mobile carts or tables located in high traffic areas where there are many students. Breakfasts can be hot or cold, depending on school facilities. Foods that are easy to eat or hand held are popular and more convenient.
Many schools already offer a break from classes in the morning. By serving a reimbursable meal at this time, students who were not hungry first thing in the morning or those who ate breakfast very early now have a chance to eat a healthy meal. Serving a reimbursable meal is a healthy choice compared to ala carte options. Reimbursable meals also accommodate students who may not have the money to purchase vending.
Students are responsible for discarding their own trash. Extra trash cans in the area where students are between classes helps to ensure that trash is discarded properly.
Why Serve Breakfast after First Period?
When you offer a mid-morning nutrition break, more students eat breakfast. Many middle and high school students are not interested in eating breakfast first thing in the morning. A mid-morning nutrition break is a great way to reach these students as well as those who do not have time to eat before school, or who ate very early in the morning. In some cases, schools do not have available space to serve breakfast. Serving breakfast from carts outside of the cafeteria eliminates this problem. A mid-morning nutrition break can be prepared quickly with few staff.
When Does Breakfast after First Period Work Best?
Breakfast after first period works well in many different schools, the following qualities help make a breakfast after first period successful in schools:
• A milk break or other break in the morning already exists • Buses arrive just before classes begin • There is no time to serve breakfast before classes • Students rely on vending machines for snacks in the morning • Teachers are supportive of breakfast and realize its importance to learning • There is no space to serve breakfast • The cafeteria is centrally locate
thebreakfastclub
page 127Creating a Model Food Service Program In West Virginia
Breakfast after First - Frequently Asked Questions by School StaffDoes Breakfast After First Impact Lunch Participation?
With proper scheduling, Second Chance Breakfast does not reduce school lunch participation. Scheduling breakfast after first at least two hours before lunch helps ensure that NSLP participation is not decreased. In fact, schools can experience an increase in breakfast and lunch participation with breakfast after first implementation.
Does Breakfast After First increase supervisory duties for teachers and administrators?
Not necessarily. Adequate supervision of students is, understandably, always a concern for administrators and teachers. Typically, schools can manage breakfast after first with little to no additional supervisory burden.
Does Breakfast After First increase work for custodial staff?
Not necessarily. Custodial staff may have to adjust their work patterns to accommodate.
How can we most efficiently move students through service lines during Breakfast after First?
Having multiple service locations around campus, such as a mobile carts placed at school entrances, can help reduce the length of lines. Multiple service locations can also help increase participation by serving students in areas where they are naturally congregate of necessarily pass through. Utilizing electronic point of sales (POS) systems that allow students to procure meals by entering a PIN number or swiping an ID card can help speed up service lines. Utilizing POS will also reduce the chances of a student charging two meals.
How are students supervised during Second Chance Breakfast and Nutrition Break?
Typically, Second Chance Breakfast and Nutrition Break are scheduled in the late morning during a recess, extended passing period, or other break between classes. Supervisory practices for Second Chance Breakfast and Nutrition Break vary by campus. Most often, supervision of breakfast participants can be incorporated into the supervision of other students (by teachers, staff, administrators, etc.) that would normally occur during these out-of-classroom periods.
page 128 The Playbook
Breakfast in the Classroom - Overview Breakfast in the classroom has emerged as the most effective strategy to get school breakfast to the large number of students who need it. It is especially effective for those schools with high concentrations of free and reduced-price eligible students that can serve breakfast in the classroom to all students for free.
At participating schools, breakfast participation levels have increased and additional federal reimbursements are helping food service accounts. Students participating in Breakfast in the Classroom don’t struggle through mornings on empty stomachs and experience significant academic and health benefits.
Research has been done on breakfast in the classroom that shows that children who participate are less likely to be absent, have fewer visits to the school nurse, and are less likely to be overweight. They eat more fruit, drink more milk and consume a wider variety of foods.
How Breakfast in the Classroom Works
The program has three critical components:
1. Delivery – the most common options for getting breakfast to the classroom are:
• School food service staff, students, or volunteers deliver it to classrooms;• Students pick up bagged breakfasts from hallway carts or kiosks; or• Students pick up breakfast from the cafeteria and bring it to the classroom.
2. Accountability – There must be a system in place to keep track of which students participate in breakfast each day. This can be done in a number of ways; the delivery model usually determines the best aproach. For example:
• In a model where breakfast is delivered to the classroom, teachers can check off which students participate on a roster and return it to the school food service department.
3. Clean Up – After breakfast is consumed, trash is disposed of and classroom surfaces are wiped, if necessary. Strategies that work well include:
• Students place all breakfast trash in one receptacle which is then put outside the classroom in the hallway. Custodians collect the breakfast trash from each hallway. It may seem like more work for custodians, but the trade off is that they no longer have to clean the cafeteria after breakfast.
• Each classroom has a spray bottle and roll of paper towels in case of spills.• Students have responsibility for cleaning up their own desk after breakfast.
thebreakfastclub

page 129Creating a Model Food Service Program In West Virginia
Classroom Activities and Instructional Time during Breakfast in the Classroom
• Breakfast in the classroom generally takes about 10 minutes to serve and eat, and is often done during morning activities, such as announcements, turning in homework or individual reading time so no instructional time is lost. Usually it takes time for children to settle in at the beginning of the day, and many teachers find that classroom breakfast is a successful transitional activity. Teachers report they have actually gained instructional time due to fewer nurse visits, and less tardiness and absenteeism.
• Recognizing the importance of morning nutrition to learning and performance on standardized tests, numerous State Superintendents of Education have recently issued policy memos clarifying that classroom breakfast meets the requirements of instructional time.
Garnering Support for Breakfast in the Classroom
• Work with your school nutrition manager to create a menu of nutrient-rich, student-appealing breakfast choices. Offer conveniently packed and easy-to-clean-up foods including fruits, vegetables, whole grains and low-fat or fat-free dairy foods.
• Speak with teacher and encourage them to use Breakfast in the Classroom as an opportunity to teach about healthy eating and the importance of breakfast. Use the information sheets and presentation tools provided below to help.
• Consider local grocery stores, restaurants, or farms that might be willing to provide food samples and ideas.
• Spread the word about Breakfast in the Classroom. Create posters to put up in high-traffic areas, distribute flyers in classrooms and advertise your program in the school newsletter and website. Encourage everyone at your school to make healthy eating choices in the morning and to eat breakfast every day.
page 130 The Playbook
Breakfast in the Classroom - Frequently Asked Questions by School StaffWhat is Breakfast in the Classroom?
As the name implies, breakfast is served to students in the classroom at the beginning of the day or during morning break time. Serving breakfast in the classroom is one of the most effective ways of increasing breakfast participation. It is often thought of as the “silver bullet” in making sure that all children have access to breakfast.
How Does Breakfast in the Classroom work?
Each day, breakfasts are packaged in rolling, insulated containers that are labeled by classroom.
Teachers or student monitors locate their coolers/containers outside the cafeteria, roll the containers to their respective classrooms, and distribute the food onto each student’s desk.
Children eat while the teacher takes roll, does review work, reads announcements, etc. The process normally takes about ten minutes. Students each get a wet wipe to clean their hands and desk before classroom instruction begins. Trash is discarded into a trash bag inside a rolling trash can that is located in the classroom. Student monitors tie off the bag, leaving it in the rolling trash can, and roll the can to the designated area. Student monitors return the rolling coolers/containers to the kitchen.
If I implement Breakfast in the Classroom will I lose instructional time?
No, because the children are engaged in education activities during this time. For example, breakfast can be eaten while the teacher takes roll, does review work, reads announcements, has the children do silent reading, etc.
What foods are served in Breakfast in the Classroom?
Sample breakfast menus will be provided to your food service director.
What are the advantages of Breakfast in the Classroom?
Breakfast in the cafeteria does not meet the needs of many students. Less than 30% of the students in our state eat breakfast at school. Students who do not eat a nourishing breakfast are not able to concentrate well, become irritable more quickly, and show hunger-related symptoms such as headaches and stomachaches. When Breakfast in the Classroom is served, every student is able to start the school day ready to learn.
Effective learning continues throughout the morning in classrooms that are free of hunger-related disruptions.
Is regular breakfast served before school in addition to Breakfast in the Classroom?
No. If Breakfast in the Classroom is selected as the breakfast option for a particular school, breakfast will not be served in the cafeteria before school begins.
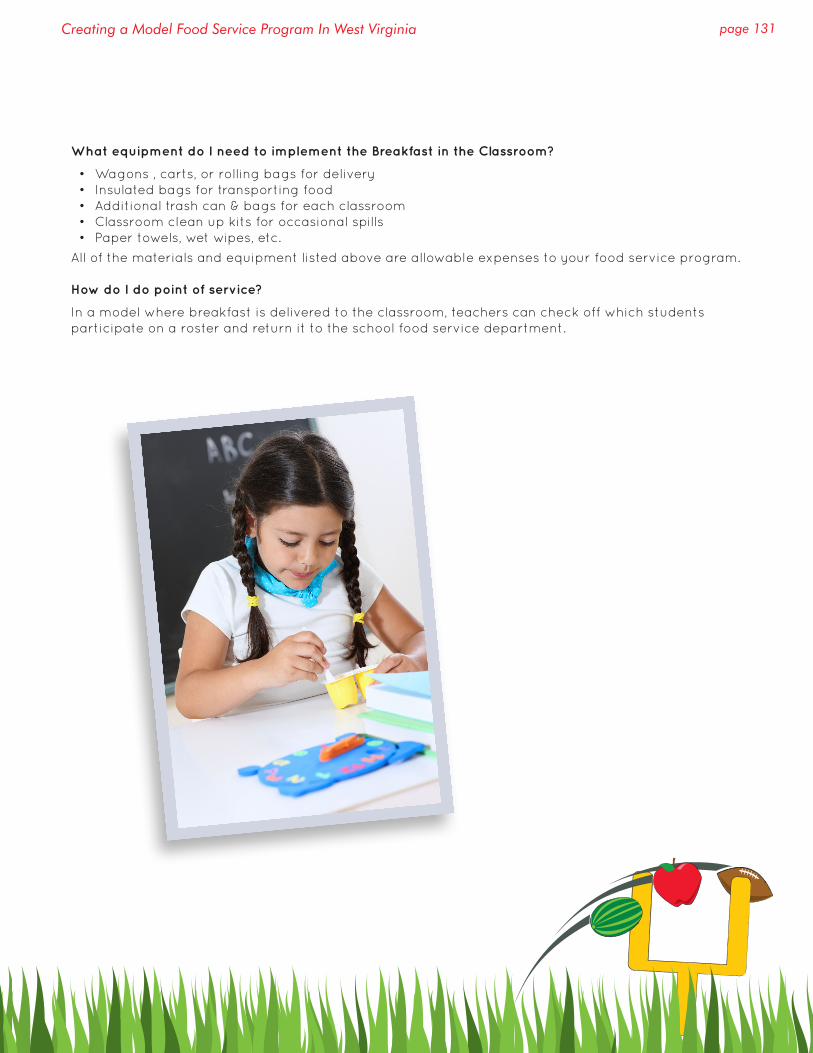
page 131Creating a Model Food Service Program In West Virginia
What equipment do I need to implement the Breakfast in the Classroom?
• Wagons , carts, or rolling bags for delivery• Insulated bags for transporting food• Additional trash can & bags for each classroom• Classroom clean up kits for occasional spills• Paper towels, wet wipes, etc.
All of the materials and equipment listed above are allowable expenses to your food service program.
How do I do point of service?
In a model where breakfast is delivered to the classroom, teachers can check off which students participate on a roster and return it to the school food service department.
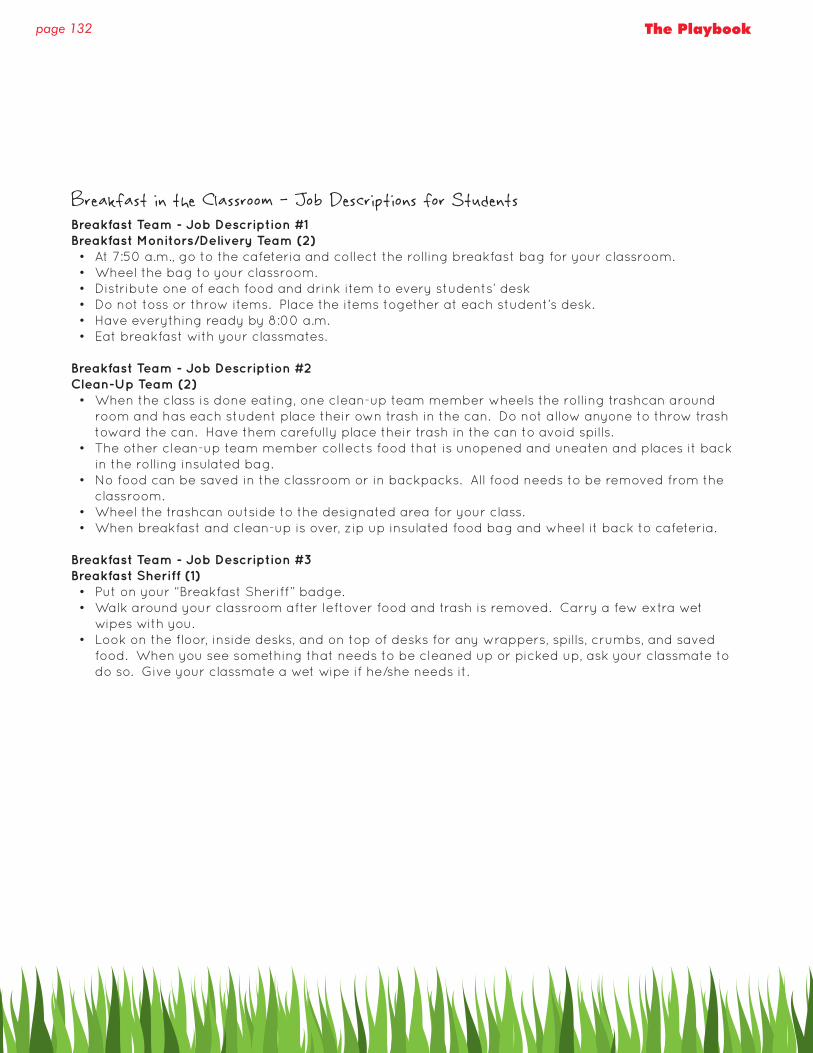
page 132 The Playbook
Breakfast in the Classroom - Job Descriptions for StudentsBreakfast Team - Job Description #1Breakfast Monitors/Delivery Team (2)• At 7:50 a.m., go to the cafeteria and collect the rolling breakfast bag for your classroom.• Wheel the bag to your classroom. • Distribute one of each food and drink item to every students’ desk• Do not toss or throw items. Place the items together at each student’s desk. • Have everything ready by 8:00 a.m.• Eat breakfast with your classmates.
Breakfast Team - Job Description #2Clean-Up Team (2)• When the class is done eating, one clean-up team member wheels the rolling trashcan around
room and has each student place their own trash in the can. Do not allow anyone to throw trash toward the can. Have them carefully place their trash in the can to avoid spills.
• The other clean-up team member collects food that is unopened and uneaten and places it back in the rolling insulated bag.
• No food can be saved in the classroom or in backpacks. All food needs to be removed from the classroom.
• Wheel the trashcan outside to the designated area for your class. • When breakfast and clean-up is over, zip up insulated food bag and wheel it back to cafeteria.
Breakfast Team - Job Description #3Breakfast Sheriff (1)• Put on your “Breakfast Sheriff” badge. • Walk around your classroom after leftover food and trash is removed. Carry a few extra wet
wipes with you. • Look on the floor, inside desks, and on top of desks for any wrappers, spills, crumbs, and saved
food. When you see something that needs to be cleaned up or picked up, ask your classmate to do so. Give your classmate a wet wipe if he/she needs it.
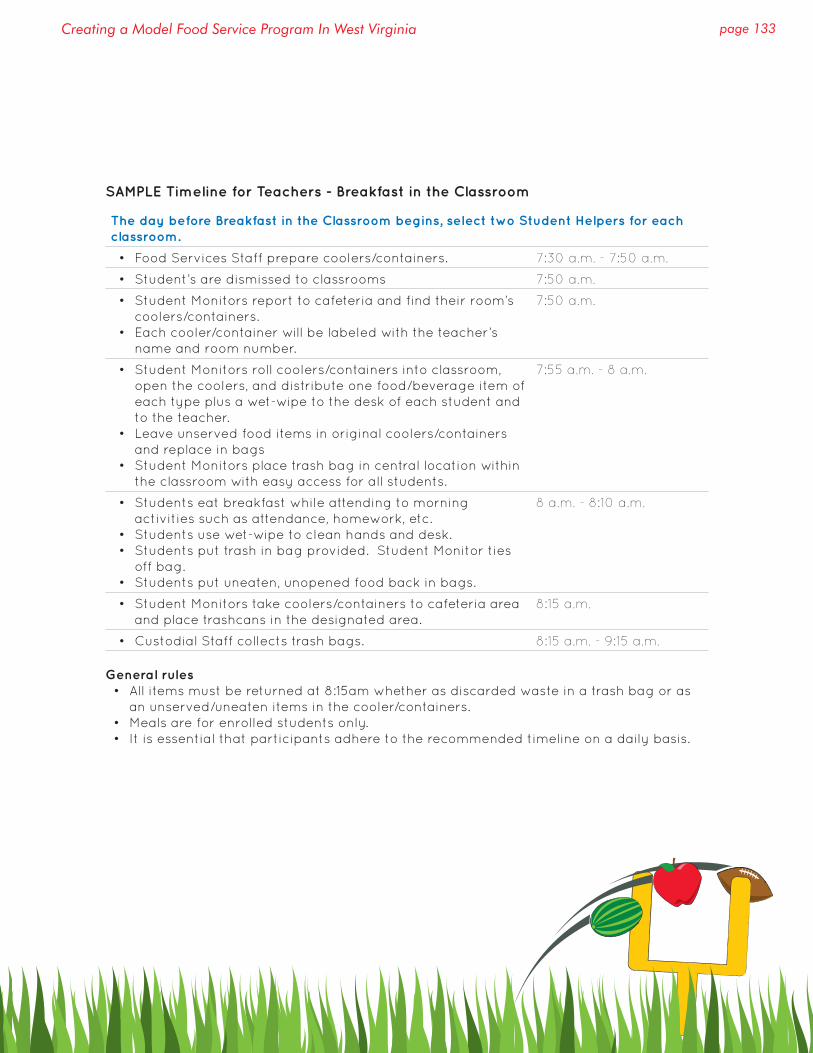
page 133Creating a Model Food Service Program In West Virginia
SAMPLE Timeline for Teachers - Breakfast in the Classroom
The day before Breakfast in the Classroom begins, select two Student Helpers for each classroom.
• Food Services Staff prepare coolers/containers. 7:30 a.m. - 7:50 a.m.
• Student’s are dismissed to classrooms 7:50 a.m.
• Student Monitors report to cafeteria and find their room’s coolers/containers.
• Each cooler/container will be labeled with the teacher’s name and room number.
7:50 a.m.
• Student Monitors roll coolers/containers into classroom, open the coolers, and distribute one food/beverage item of each type plus a wet-wipe to the desk of each student and to the teacher.
• Leave unserved food items in original coolers/containers and replace in bags
• Student Monitors place trash bag in central location within the classroom with easy access for all students.
7:55 a.m. - 8 a.m.
• Students eat breakfast while attending to morning activities such as attendance, homework, etc.
• Students use wet-wipe to clean hands and desk. • Students put trash in bag provided. Student Monitor ties
off bag.• Students put uneaten, unopened food back in bags.
8 a.m. - 8:10 a.m.
• Student Monitors take coolers/containers to cafeteria area and place trashcans in the designated area.
8:15 a.m.
• Custodial Staff collects trash bags. 8:15 a.m. - 9:15 a.m.
General rules• All items must be returned at 8:15am whether as discarded waste in a trash bag or as
an unserved/uneaten items in the cooler/containers.• Meals are for enrolled students only.• It is essential that participants adhere to the recommended timeline on a daily basis.
page 134 The Playbook
Grab-n-Go Breakfast - Overview Organize a Grab-n-Go Breakfast Station at a high-traffic location in school where students can get breakfast before school—or an event such as a “last chance breakfast” break after first period to make breakfast a fun, fast option for everyone!
How Does a Grab ‘N’ Go Breakfast Work?
Grab ‘N’ Go breakfasts are packaged in paper bags, boxes or trays. Students pick up their breakfast and eat it when and where they want, within school guidelines. Food service staff packs reimbursable breakfasts into individual paper bags. Breakfasts are usually cold, but can include hot items as well.
Grab ‘N’ Go breakfasts can be served first thing in the morning, between classes, or at a mid-morning break. Bags can be served from mobile service carts located in high traffic areas such as the school entrance, cafeteria, hallways, or near the gym. Students can take the breakfast and eat it outside, in the hall, in class, or in the cafeteria, depending on what the school decides is appropriate. The serving carts usually have a computer or point of service machine. A school food service staff operates the cart before school, during morning break, or between classes. There is a lot of flexibility with this method of serving breakfast, depending on the school’s needs. Students are responsible for following the school’s guidelines as to where and when they can eat and for throwing out their trash.
Why Serve a Grab ‘N’ Go Breakfast?
Grab ‘N’ Go breakfasts bring breakfast to the student, making it easier for them to choose to eat breakfast. Many middle and high school students are not hungry first thing in the morning or they want to hang out with friends. Grab ‘N’ Go breakfasts allow students the flexibility and choice to eat breakfast where and when they want. Grab ‘N’ Go breakfasts are convenient for food service staff and can take less time to prepare than traditional breakfasts. Because it is so easy and efficient for students to grab a bag, this method also allows schools to serve a breakfast more quickly to students.
Why Use Mobile Serving Carts?
Schools find that by bringing breakfast to the students; more students eat breakfast because they do not need to leave their friends to get breakfast. Breakfast carts mean that students do not need to choose between socializing and eating breakfast. Breakfasts served from a cart are convenient for food service staff and take less time to prepare than traditional breakfasts. Offering Grab ‘N’ Go breakfast from mobile carts allows schools to serve breakfast quickly to more students.
When Does a Grab ‘N’ Go Breakfast Work Best?
Grab ‘N’ Go breakfasts work particularly well in middle and high schools because older students enjoy the flexibility and choice that Grab ‘N’ Go provides. Here are some other qualities where Grab ‘N’ Go breakfasts are likely to be successfully:
• The cafeteria or gym is crowded or not available for breakfast • A large number of students have to eat in a short amount of time • Buses arrive just before the start of classes • Teachers and custodial staff are supportive of breakfast and realize its importance to learning • Students rely on ala carte and convenience foods from outside the school for breakfast • The cafeteria isn’t located where students enter the building or hang out • The breakfast menu can easily offer Grab ‘N’ Go options
thebreakfastclub

page 135Creating a Model Food Service Program In West Virginia
Other Grab ‘N’ Go Ideas
• Work with your food service staff and principal to choose a location for your Grab-n-Go Breakfast Station. Consider locations where students tend to gather in the morning, such as a lobby or foyer, outside the library or gym, outside the front doors or near the bus loop.
• What tasty, appealing, health y foods will your station offer? Consider polling students for comments about which choices they like and dislike. Ask them to suggest other nutritious breakfast options to offer in the future.
• Work with your school nutrition professionals to create a menu of nutrient-rich breakfast choices. Offer conveniently packed and easy-to-grab foods that include low-fat or fat-free dairy products, whole grains, fruits and vegetables.
• Brainstorm design ideas for your Grab-n-Go Breakfast Station. Is it a table? A cart on wheels? A refrigerated station? As another option, work with school nutrition professionals to offer these more convenient and nutritious choices in the cafeteria breakfast line, for students who eat breakfast in the school cafeteria. Consider using “to go” containers so students can still “grab-n-go.”
• Spread the word about your Grab-n-Go Breakfast Station! Create posters to put up in high-traffic areas, distribute flyers in classrooms and advertise your program during morning announcements.
• Consider local grocery stores, local farms or restaurants that may be willing to donate healthy foods or containers for your program.
Breakfast Carts How Do Breakfast Carts Work?
Breakfast carts act as mobile serving areas for breakfast. Instead of having the students come to the cafeteria for breakfast, breakfast is brought to students. Grab ‘N’ Go breakfast work best with a breakfast cart. Breakfast can be prepackaged; however, some schools offer choices from their breakfast cart. The general rule is the food has to be portable and easy to grab.
Schools typically put their breakfast carts in high traffic areas such as the main entrance, hallway, outside the front door, or near the gymnasium. Wherever the students hang out is where the cart is located. Carts usually have a computer or point of service machine. A school food service staff operates the cart before school, during morning break, or between classes, depending on the school.
Carts can be purchased for a reasonable cost, but remember, you will have to also fund the portable milk coolers. Students are responsible for their trash and following school rules as to where they can eat their breakfast.
When Does Using a Breakfast Cart Work Best?
Using a breakfast cart works particularly well in middle and high schools, but it has also been successful in elementary schools. Here are some other qualities where using a breakfast cart is likely to be particularly successful:
• The cafeteria is located apart from where students hang out • Environment service staff are supportive of serving
breakfast at school • The breakfast menu can easily be made into Grab ‘N’
Go breakfasts • There is one main area of the school where students
tend to gather • The cafeteria tends to be congested or is too small to
serve breakfast

page 136 The Playbook
Grab ‘N’ Go Menu Ideas & Breakfast in the Classroom
Whole Grain Mini Pancakes(Individually wrapped)BananaYogurtMilk
YogurtGranola MixFresh StrawberriesMilk
Canadian Bacon & Cheese on (WW) BagelPeach CupMilk
Toasted Cheese Sandwich (WW)Fresh Apple WedgesMilk
Oatmeal Muffin SquareMozzarella Cheese StickApplesauce CupMilk
Sun Butter or Peanut Butter on (WW)ToastFruit JuiceMilk
Breakfast Wrap(Scrambled Egg & Cheese)Orange WedgesMilk
(WW) Fruit & Grain BarYogurtGrapesMilk
Whole Grain Blueberry MuffinSunflower SeedsApple JuiceMilk
Sausage on Whole Grain BiscuitFresh PearMilk
Waffles(individually wrapped)BlueberriesYogurtMilk
Soft PretzelCheese CubesFruit JuiceMilk
Whole Grain Strawberry Yogurt Chex MixCheese Stick (blended)Melon CupMilk
Cereal (high fiber)Fresh StrawberriesSunflower SeedsMilk
page 137Creating a Model Food Service Program In West Virginia
The following parent letters will help you implement the different breakfast strategies. Parent education and involvement are often the keys to a successful program.
page 138 The Playbook
Breakfast in the ClassroomBeginning Insert Start Date Here!
Dear Parents,
Is the morning rush at your house a mad dash to get out the door with your children barely having time to grab
their homework much less eat a nutritious breakfast? If this sounds familiar you will be relieved to know that
getting that important morning start will no longer be a challenge.
Beginning on Insert Start Date Here your child will take part in an innovative new program called “Breakfast
in the Classroom.” Just as the name implies, a nutritious breakfast will be served to each student right in
the classroom. They will have an opportunity during the first 10 minutes of class to eat breakfast with their
classmates and get the fuel they need to get through the morning ready to learn. There will be no breakfast
service from the cafeteria before school.
The direct impact of breakfast on academic performance has been well documented and we are happy to bring
you this proven approach to influencing maximum learning in the classroom.
How does it work?
Each day, breakfasts are packaged in rolling insulated coolers/containers and labeled by classroom. Student
monitors locate their coolers/containers by the cafteria, roll the coolers/containers to their classroom and
distribute the food and tray packs onto each student’s desk. Children eat while the teacher takes morning roll,
does review work and reads announcements. This normally takes about ten minutes. A wet wipe is included for
each student to clean hands and desk before classroom instruction begins. Trash is put into a rolling trash can
inside their classroom. Students tie off the bag, leave it in the rolling trash can and wheel it to a designated area.
Students return the rolling insulated coolers/containers to the kitchen. No food is left inside the classroom.
What are the advantages of Grab ‘N’ Go?
Traditional breakfast in the cafeteria does not meet the needs of many students. Less than 30% of West Virginia
student’s eat breakfast. Students who do not eat a nourishing breakfast are not able to concentrate well,
become irritable more quickly and show hunger-related symptoms such as headaches and stomachaches.
When Breakfast in the Classroom is served, every student is able to start the school day ready to learn. This
continues throughout the morning without hunger-related disruptions.
School Breakfast Information:
Price is determined by your confidential Application for Free and Reduced price Meals. If you need an
application, please call (304) XXX-XXXX or visit www.wvschoolmeals.net
Reduced Price:
Paid price:
Share this exciting news with your child and be ready on Insert Start Date Here for the start of this new program!
thebreakfastclub
[ If your county is participating in the Universal Meals Pilot please adjust this section accordingly ]
[ Be sure to include a copy of your menu with the letter ]
For a downloadable version of this letter, please visit:http://wvde.state.wv.us/nutrition/PlaybookInformation.html
page 139Creating a Model Food Service Program In West Virginia
[ Be sure to include a copy of your menu with the letter ]
Breakfast After FirstBeginning Insert Start Date Here!
Dear Parents,
Is the morning rush at your house a mad dash to get out the door with your children barely having
time to grab their homework much less eat a nutritious breakfast? If this sounds familiar you will be
relieved to know that getting that important morning start will no longer be a challenge.
Beginning on Insert Start Date Here your child will take part in an innovative new program called
Breakfast after First. This model is also called a nutrition break or second chance breakfast. As the
name implies, students eat breakfast during a break in the morning, usually between 9:00 am and
10:00 am. The direct impact of breakfast on academic performance has been well documented and
we are happy to bring you this proven approach to influencing maximum learning in the classroom.
How does it work?
Reimbursable breakfasts are either served in the cafeteria or packaged in individually grab ‘n’ go
bags. Many schools already offer a break from classes in the morning. By serving a reimbursable
meal at this time, students who were not hungry first thing in the morning or those who ate breakfast
very early now have a chance to eat a healthy meal.
What are the advantages of Breakfast in the Classroom?
Traditional breakfast in the cafeteria does not meet the needs of many students. Less than 30%
of West Virginia student’s eat breakfast. Students who do not eat a nourishing breakfast are not
able to concentrate well, become irritable more quickly and show hunger-related symptoms such
as headaches and stomachaches. When Breakfast after First is served, every student is able to
start the school day ready to learn. This continues throughout the morning without hunger-related
disruptions.
School Breakfast Information:
Price is determined by your confidential Application for Free and Reduced price Meals. If you need an
application, please call (304) XXX-XXXX or visit www.wvschoolmeals.net
Reduced Price:
Paid price:
Share this exciting news with your child and be ready on Insert Start Date Here for the start of this
new program!
thebreakfastclub
[ If your county is participating in the Universal Meals Pilot please adjust this section accordingly ]
[ Be sure to include a copy of your menu with the letter ]
For a downloadable version of this letter, please visit:http://wvde.state.wv.us/nutrition/PlaybookInformation.html
page 140 The Playbook
Grab ‘N’ GoBeginning Insert Start Date Here!
Dear Parents,
Is the morning rush at your house a mad dash to get out the door with your children barely having
time to grab their homework much less eat a nutritious breakfast? If this sounds familiar you will be
relieved to know that getting that important morning start will no longer be a challenge.
Beginning on Insert Start Date Here your child will take part in an innovative new program called
Grab ‘N’ Go. Grab ‘N’ Go breakfasts are packaged in paper bags, boxes or trays. Students pick up
their breakfast and eat it when and where they want, within school guidelines
The direct impact of breakfast on academic performance has been well documented and we are
happy to bring you this proven approach to influencing maximum learning in the classroom.
How does it work?
Grab ‘N’ Go breakfasts can be served first thing in the morning, between classes, or at a mid-morning
break. Bags can be served from mobile service carts located in high traffic areas such as the school
entrance, cafeteria, hallways, or near the gym. Students can take the breakfast and eat it outside, in
the hall, in class, or in the cafeteria, depending on what the school decides is appropriate.
What are the advantages of Grab ‘N’ Go?
Traditional breakfast in the cafeteria does not meet the needs of many students. Less than 30%
of West Virginia student’s eat breakfast. Students who do not eat a nourishing breakfast are not
able to concentrate well, become irritable more quickly and show hunger-related symptoms such
as headaches and stomachaches. When Grab ‘N’ Breakfast is served, every student is able to
start the school day ready to learn. This continues throughout the morning without hunger-related
disruptions.
School Breakfast Information:
Price is determined by your confidential Application for Free and Reduced price Meals. If you need an
application, please call (304) XXX-XXXX or visit www.wvschoolmeals.net
Reduced Price:
Paid price:
Share this exciting news with your child and be ready on Insert Start Date Here for the start of this
new program!
thebreakfastclub
[ If your county is participating in the Universal Meals Pilot please adjust this section accordingly ]
[ Be sure to include a copy of your menu with the letter ]
For a downloadable version of this letter, please visit:http://wvde.state.wv.us/nutrition/PlaybookInformation.html
page 141Creating a Model Food Service Program In West Virginia
[ Be sure to include a copy of your menu with the letter ]
On the following pages, you will find sample school meal menus from an exemplary West Virginia county.
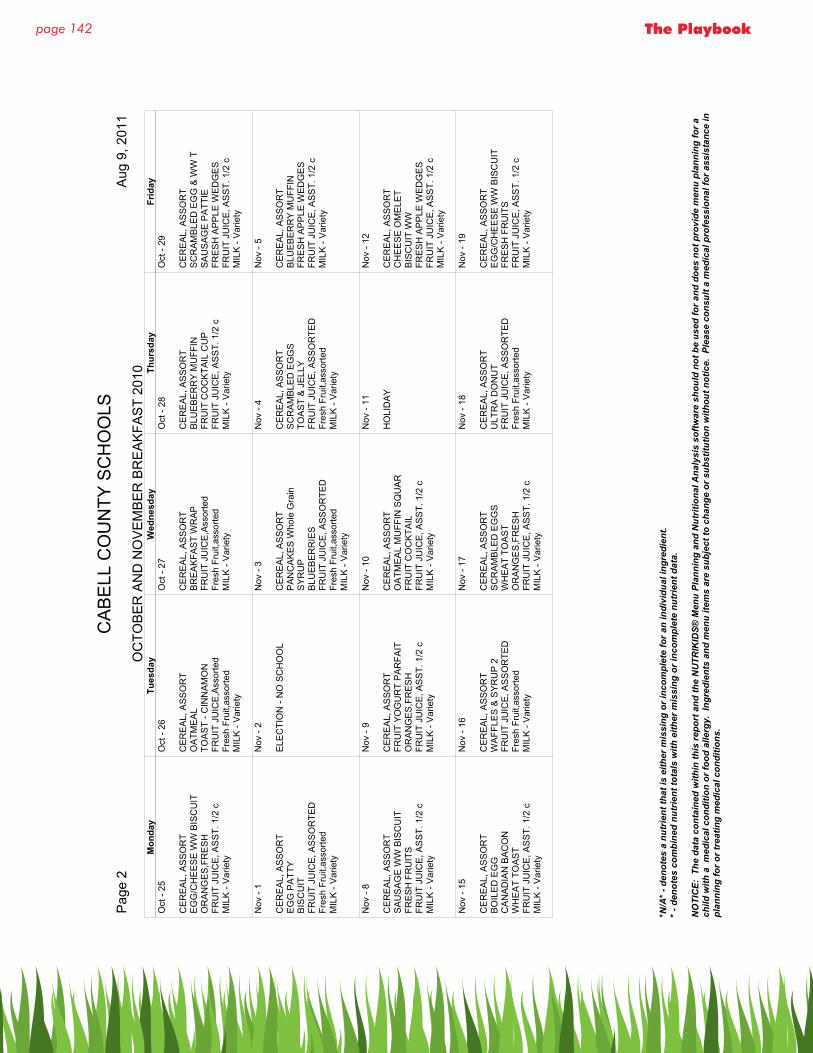
page 142 The Playbook
CA
BE
LL C
OU
NTY
SC
HO
OLS
Pag
e 2
OC
TOB
ER
AN
D N
OV
EM
BE
R B
RE
AK
FAS
T 20
10 A
ug 9
, 201
1
Mon
day
Tues
day
Wed
nesd
ayTh
ursd
ayFr
iday
Oct
- 25
CE
RE
AL,
AS
SO
RT
EG
G/C
HE
ES
E W
W B
ISC
UIT
OR
AN
GE
S,F
RE
SH
FRU
IT J
UIC
E, A
SS
T. 1
/2 c
MIL
K -
Var
iety
Oct
- 26
CE
RE
AL,
AS
SO
RT
OA
TME
AL
TOA
ST
- CIN
NA
MO
NFR
UIT
JU
ICE
,Ass
orte
dFr
esh
Frui
t,ass
orte
dM
ILK
- V
arie
ty
Oct
- 27
CE
RE
AL,
AS
SO
RT
BR
EA
KFA
ST
WR
AP
FRU
IT J
UIC
E,A
ssor
ted
Fres
h Fr
uit,a
ssor
ted
MIL
K -
Var
iety
Oct
- 28
CE
RE
AL,
AS
SO
RT
BLU
EB
ER
RY
MU
FFIN
FRU
IT C
OC
KTA
IL C
UP
FRU
IT J
UIC
E, A
SS
T. 1
/2 c
MIL
K -
Var
iety
Oct
- 29
CE
RE
AL,
AS
SO
RT
SC
RA
MB
LED
EG
G &
WW
TS
AU
SA
GE
PA
TTIE
FRE
SH
AP
PLE
WE
DG
ES
FRU
IT J
UIC
E, A
SS
T. 1
/2 c
MIL
K -
Var
iety
Nov
- 1
CE
RE
AL,
AS
SO
RT
EG
G P
ATT
YB
ISC
UIT
FRU
IT J
UIC
E, A
SS
OR
TED
Fres
h Fr
uit,a
ssor
ted
MIL
K -
Var
iety
Nov
- 2
ELE
CTI
ON
- N
O S
CH
OO
L
Nov
- 3
CE
RE
AL,
AS
SO
RT
PA
NC
AK
ES
Who
le G
rain
SY
RU
PB
LUE
BE
RR
IES
FRU
IT J
UIC
E, A
SS
OR
TED
Fres
h Fr
uit,a
ssor
ted
MIL
K -
Var
iety
Nov
- 4
CE
RE
AL,
AS
SO
RT
SC
RA
MB
LED
EG
GS
TOA
ST
& J
ELL
YFR
UIT
JU
ICE
, AS
SO
RTE
DFr
esh
Frui
t,ass
orte
dM
ILK
- V
arie
ty
Nov
- 5
CE
RE
AL,
AS
SO
RT
BLU
EB
ER
RY
MU
FFIN
FRE
SH
AP
PLE
WE
DG
ES
FRU
IT J
UIC
E, A
SS
T. 1
/2 c
MIL
K -
Var
iety
Nov
- 8
CE
RE
AL,
AS
SO
RT
SA
US
AG
E W
W B
ISC
UIT
FRE
SH
FR
UIT
SFR
UIT
JU
ICE
, AS
ST.
1/2
cM
ILK
- V
arie
ty
Nov
- 9
CE
RE
AL,
AS
SO
RT
FRU
IT Y
OG
UR
T P
AR
FAIT
OR
AN
GE
S,F
RE
SH
FRU
IT J
UIC
E, A
SS
T. 1
/2 c
MIL
K -
Var
iety
Nov
- 10
CE
RE
AL,
AS
SO
RT
OA
TME
AL
MU
FFIN
SQ
UA
RFR
UIT
CO
CK
TAIL
FRU
IT J
UIC
E, A
SS
T. 1
/2 c
MIL
K -
Var
iety
Nov
- 11
HO
LID
AY
Nov
- 12
CE
RE
AL,
AS
SO
RT
CH
EE
SE
OM
ELE
TB
ISC
UIT
WW
FRE
SH
AP
PLE
WE
DG
ES
FRU
IT J
UIC
E, A
SS
T. 1
/2 c
MIL
K -
Var
iety
Nov
- 15
CE
RE
AL,
AS
SO
RT
BO
ILE
D E
GG
CA
NA
DIA
N B
AC
ON
WH
EA
T TO
AS
TFR
UIT
JU
ICE
, AS
ST.
1/2
cM
ILK
- V
arie
ty
Nov
- 16
CE
RE
AL,
AS
SO
RT
WA
FFLE
S &
SY
RU
P 2
FRU
IT J
UIC
E, A
SS
OR
TED
Fres
h Fr
uit,a
ssor
ted
MIL
K -
Var
iety
Nov
- 17
CE
RE
AL,
AS
SO
RT
SC
RA
MB
LED
EG
GS
WH
EA
T TO
AS
TO
RA
NG
ES
,FR
ES
HFR
UIT
JU
ICE
, AS
ST.
1/2
cM
ILK
- V
arie
ty
Nov
- 18
CE
RE
AL,
AS
SO
RT
ULT
RA
DO
NU
TFR
UIT
JU
ICE
, AS
SO
RTE
DFr
esh
Frui
t,ass
orte
dM
ILK
- V
arie
ty
Nov
- 19
CE
RE
AL,
AS
SO
RT
EG
G/C
HE
ES
E W
W B
ISC
UIT
FRE
SH
FR
UIT
SFR
UIT
JU
ICE
, AS
ST.
1/2
cM
ILK
- V
arie
ty
*N/A
* - d
enot
es a
nut
rient
that
is e
ither
mis
sing
or i
ncom
plet
e fo
r an
indi
vidu
al in
gred
ient
.* -
den
otes
com
bine
d nu
trie
nt to
tals
with
eith
er m
issi
ng o
r inc
ompl
ete
nutr
ient
dat
a.
NO
TIC
E: T
he d
ata
cont
aine
d w
ithin
this
repo
rt a
nd th
e N
UTR
IKID
S® M
enu
Plan
ning
and
Nut
ritio
nal A
naly
sis
softw
are
shou
ld n
ot b
e us
ed fo
r and
doe
s no
t pro
vide
men
u pl
anni
ng fo
r a
child
with
a m
edic
al c
ondi
tion
or fo
od a
llerg
y. I
ngre
dien
ts a
nd m
enu
item
s ar
e su
bjec
t to
chan
ge o
r sub
stitu
tion
with
out n
otic
e. P
leas
e co
nsul
t a m
edic
al p
rofe
ssio
nal f
or a
ssis
tanc
e in
pl
anni
ng fo
r or t
reat
ing
med
ical
con
ditio
ns.
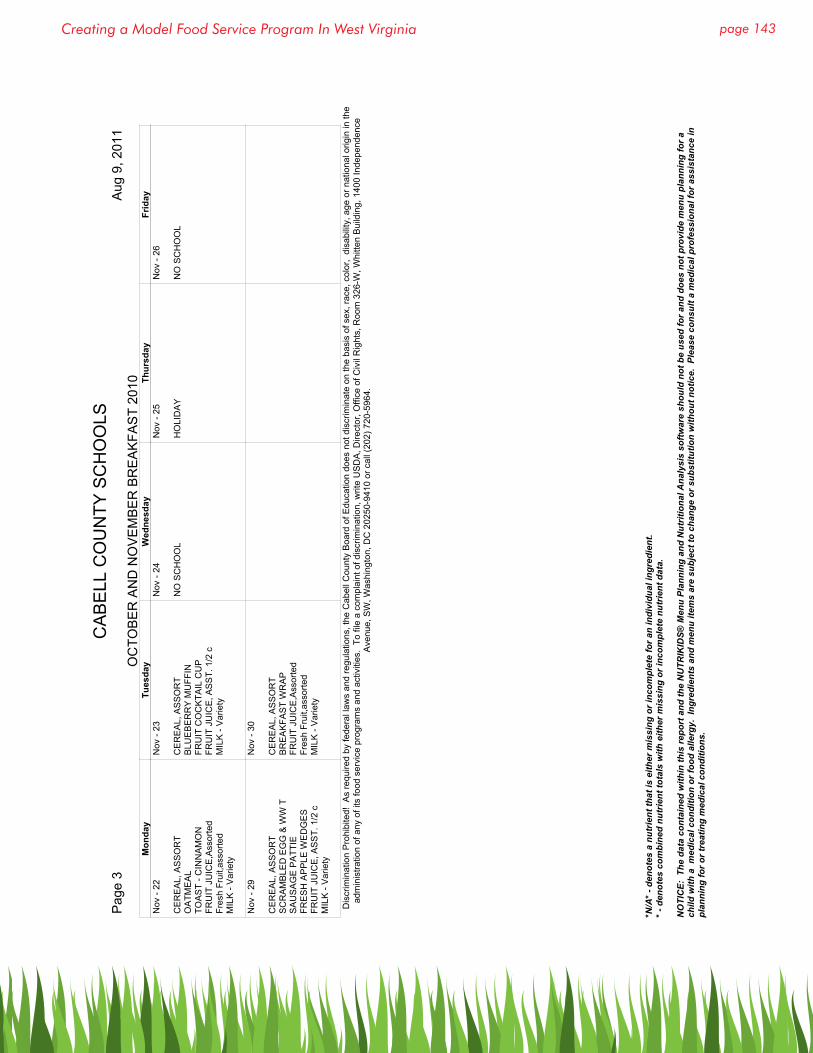
page 143Creating a Model Food Service Program In West Virginia
CA
BE
LL C
OU
NTY
SC
HO
OLS
Pag
e 3
OC
TOB
ER
AN
D N
OV
EM
BE
R B
RE
AK
FAS
T 20
10 A
ug 9
, 201
1
Mon
day
Tues
day
Wed
nesd
ayTh
ursd
ayFr
iday
Nov
- 22
CE
RE
AL,
AS
SO
RT
OA
TME
AL
TOA
ST
- CIN
NA
MO
NFR
UIT
JU
ICE
,Ass
orte
dFr
esh
Frui
t,ass
orte
dM
ILK
- V
arie
ty
Nov
- 23
CE
RE
AL,
AS
SO
RT
BLU
EB
ER
RY
MU
FFIN
FRU
IT C
OC
KTA
IL C
UP
FRU
IT J
UIC
E, A
SS
T. 1
/2 c
MIL
K -
Var
iety
Nov
- 24
NO
SC
HO
OL
Nov
- 25
HO
LID
AY
Nov
- 26
NO
SC
HO
OL
Nov
- 29
CE
RE
AL,
AS
SO
RT
SC
RA
MB
LED
EG
G &
WW
TS
AU
SA
GE
PA
TTIE
FRE
SH
AP
PLE
WE
DG
ES
FRU
IT J
UIC
E, A
SS
T. 1
/2 c
MIL
K -
Var
iety
Nov
- 30
CE
RE
AL,
AS
SO
RT
BR
EA
KFA
ST
WR
AP
FRU
IT J
UIC
E,A
ssor
ted
Fres
h Fr
uit,a
ssor
ted
MIL
K -
Var
iety
Dis
crim
inat
ion
Pro
hibi
ted!
As
requ
ired
by fe
dera
l law
s an
d re
gula
tions
, the
Cab
ell C
ount
y B
oard
of E
duca
tion
does
not
dis
crim
inat
e on
the
basi
s of
sex
, rac
e, c
olor
, di
sabi
lity,
age
or n
atio
nal o
rigin
in th
ead
min
istra
tion
of a
ny o
f its
food
ser
vice
pro
gram
s an
d ac
tiviti
es.
To fi
le a
com
plai
nt o
f dis
crim
inat
ion,
writ
e U
SD
A, D
irect
or, O
ffice
of C
ivil
Rig
hts,
Roo
m 3
26-W
, Whi
tten
Bui
ldin
g, 1
400
Inde
pend
ence
Ave
nue,
SW
, Was
hing
ton,
DC
202
50-9
410
or c
all (
202)
720
-596
4.
*N/A
* - d
enot
es a
nut
rient
that
is e
ither
mis
sing
or i
ncom
plet
e fo
r an
indi
vidu
al in
gred
ient
.* -
den
otes
com
bine
d nu
trie
nt to
tals
with
eith
er m
issi
ng o
r inc
ompl
ete
nutr
ient
dat
a.
NO
TIC
E: T
he d
ata
cont
aine
d w
ithin
this
repo
rt a
nd th
e N
UTR
IKID
S® M
enu
Plan
ning
and
Nut
ritio
nal A
naly
sis
softw
are
shou
ld n
ot b
e us
ed fo
r and
doe
s no
t pro
vide
men
u pl
anni
ng fo
r a
child
with
a m
edic
al c
ondi
tion
or fo
od a
llerg
y. I
ngre
dien
ts a
nd m
enu
item
s ar
e su
bjec
t to
chan
ge o
r sub
stitu
tion
with
out n
otic
e. P
leas
e co
nsul
t a m
edic
al p
rofe
ssio
nal f
or a
ssis
tanc
e in
pl
anni
ng fo
r or t
reat
ing
med
ical
con
ditio
ns.
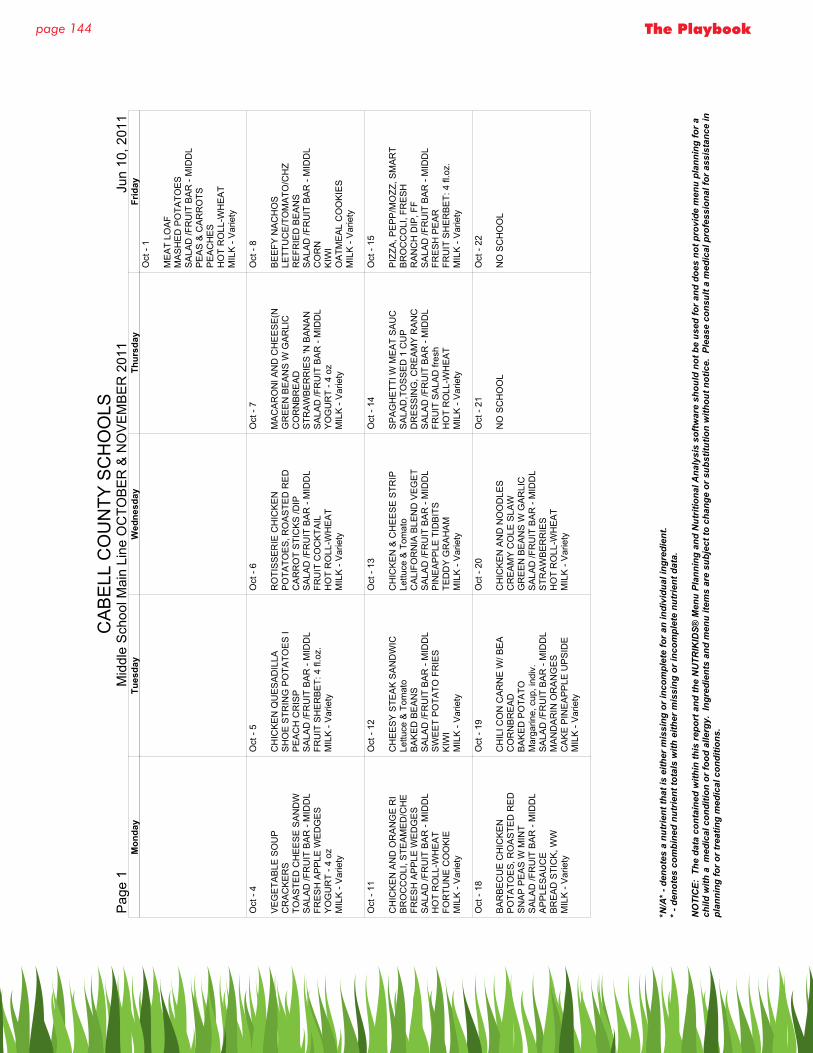
page 144 The Playbook
CA
BE
LL C
OU
NTY
SC
HO
OLS
Pag
e 1
Mid
dle
Sch
ool M
ain
Line
OC
TOB
ER
& N
OV
EM
BE
R 2
011
Jun
10,
201
1M
onda
yTu
esda
yW
edne
sday
Thur
sday
Frid
ayO
ct -
1
ME
AT
LOA
FM
AS
HE
D P
OTA
TOE
SS
ALA
D /F
RU
IT B
AR
- M
IDD
LP
EA
S &
CA
RR
OTS
PE
AC
HE
SH
OT
RO
LL-W
HE
AT
MIL
K -
Var
iety
Oct
- 4
VE
GE
TAB
LE S
OU
PC
RA
CK
ER
STO
AS
TED
CH
EE
SE
SA
ND
WS
ALA
D /F
RU
IT B
AR
- M
IDD
LFR
ES
H A
PP
LE W
ED
GE
SY
OG
UR
T - 4
oz
MIL
K -
Var
iety
Oct
- 5
CH
ICK
EN
QU
ES
AD
ILLA
SH
OE
STR
ING
PO
TATO
ES
IP
EA
CH
CR
ISP
SA
LAD
/FR
UIT
BA
R -
MID
DL
FRU
IT S
HE
RB
ET:
4 fl
.oz.
MIL
K -
Var
iety
Oct
- 6
RO
TIS
SE
RIE
CH
ICK
EN
PO
TATO
ES
, RO
AS
TED
RE
DC
AR
RO
T S
TIC
KS
/DIP
SA
LAD
/FR
UIT
BA
R -
MID
DL
FRU
IT C
OC
KTA
ILH
OT
RO
LL-W
HE
AT
MIL
K -
Var
iety
Oct
- 7
MA
CA
RO
NI A
ND
CH
EE
SE
(NG
RE
EN
BE
AN
S W
GA
RLI
CC
OR
NB
RE
AD
STR
AW
BE
RR
IES
'N B
AN
AN
SA
LAD
/FR
UIT
BA
R -
MID
DL
YO
GU
RT
- 4 o
zM
ILK
- V
arie
ty
Oct
- 8
BE
EFY
NA
CH
OS
LETT
UC
E/T
OM
ATO
/CH
ZR
EFR
IED
BE
AN
SS
ALA
D /F
RU
IT B
AR
- M
IDD
LC
OR
NK
IWI
OA
TME
AL
CO
OK
IES
MIL
K -
Var
iety
Oct
- 11
CH
ICK
EN
AN
D O
RA
NG
E R
IB
RO
CC
OLI
, STE
AM
ED
/CH
EFR
ES
H A
PP
LE W
ED
GE
SS
ALA
D /F
RU
IT B
AR
- M
IDD
LH
OT
RO
LL-W
HE
AT
FOR
TUN
E C
OO
KIE
MIL
K -
Var
iety
Oct
- 12
CH
EE
SY
STE
AK
SA
ND
WIC
Lettu
ce &
Tom
ato
BA
KE
D B
EA
NS
SA
LAD
/FR
UIT
BA
R -
MID
DL
SW
EE
T P
OTA
TO F
RIE
SK
IWI
MIL
K -
Var
iety
Oct
- 13
CH
ICK
EN
& C
HE
ES
E S
TRIP
Lettu
ce &
Tom
ato
CA
LIFO
RN
IA B
LEN
D V
EG
ET
SA
LAD
/FR
UIT
BA
R -
MID
DL
PIN
EA
PP
LE T
IDB
ITS
TED
DY
GR
AH
AM
MIL
K -
Var
iety
Oct
- 14
SP
AG
HE
TTI W
ME
AT
SA
UC
SA
LAD
,TO
SS
ED
1 C
UP
DR
ES
SIN
G, C
RE
AM
Y R
AN
CS
ALA
D /F
RU
IT B
AR
- M
IDD
LFR
UIT
SA
LAD
fres
hH
OT
RO
LL-W
HE
AT
MIL
K -
Var
iety
Oct
- 15
PIZ
ZA, P
EP
P/M
OZZ
, SM
AR
TB
RO
CC
OLI
, FR
ES
HR
AN
CH
DIP
, FF
SA
LAD
/FR
UIT
BA
R -
MID
DL
FRE
SH
PE
AR
FRU
IT S
HE
RB
ET:
4 fl
.oz.
MIL
K -
Var
iety
Oct
- 18
BA
RB
EC
UE
CH
ICK
EN
PO
TATO
ES
, RO
AS
TED
RE
DS
NA
P P
EA
S W
MIN
TS
ALA
D /F
RU
IT B
AR
- M
IDD
LA
PP
LES
AU
CE
BR
EA
D S
TIC
K, W
WM
ILK
- V
arie
ty
Oct
- 19
CH
ILI C
ON
CA
RN
E W
/ BE
AC
OR
NB
RE
AD
BA
KE
D P
OTA
TOM
arga
rine,
cup
, ind
iv.
SA
LAD
/FR
UIT
BA
R -
MID
DL
MA
ND
AR
IN O
RA
NG
ES
CA
KE
PIN
EA
PP
LE U
PS
IDE
M
ILK
- V
arie
ty
Oct
- 20
CH
ICK
EN
AN
D N
OO
DLE
SC
RE
AM
Y C
OLE
SLA
WG
RE
EN
BE
AN
S W
GA
RLI
CS
ALA
D /F
RU
IT B
AR
- M
IDD
LS
TRA
WB
ER
RIE
SH
OT
RO
LL-W
HE
AT
MIL
K -
Var
iety
Oct
- 21
NO
SC
HO
OL
Oct
- 22
NO
SC
HO
OL
*N/A
* - d
enot
es a
nut
rient
that
is e
ither
mis
sing
or i
ncom
plet
e fo
r an
indi
vidu
al in
gred
ient
.* -
den
otes
com
bine
d nu
trie
nt to
tals
with
eith
er m
issi
ng o
r inc
ompl
ete
nutr
ient
dat
a.
NO
TIC
E: T
he d
ata
cont
aine
d w
ithin
this
repo
rt a
nd th
e N
UTR
IKID
S® M
enu
Plan
ning
and
Nut
ritio
nal A
naly
sis
softw
are
shou
ld n
ot b
e us
ed fo
r and
doe
s no
t pro
vide
men
u pl
anni
ng fo
r a
child
with
a m
edic
al c
ondi
tion
or fo
od a
llerg
y. I
ngre
dien
ts a
nd m
enu
item
s ar
e su
bjec
t to
chan
ge o
r sub
stitu
tion
with
out n
otic
e. P
leas
e co
nsul
t a m
edic
al p
rofe
ssio
nal f
or a
ssis
tanc
e in
pl
anni
ng fo
r or t
reat
ing
med
ical
con
ditio
ns.
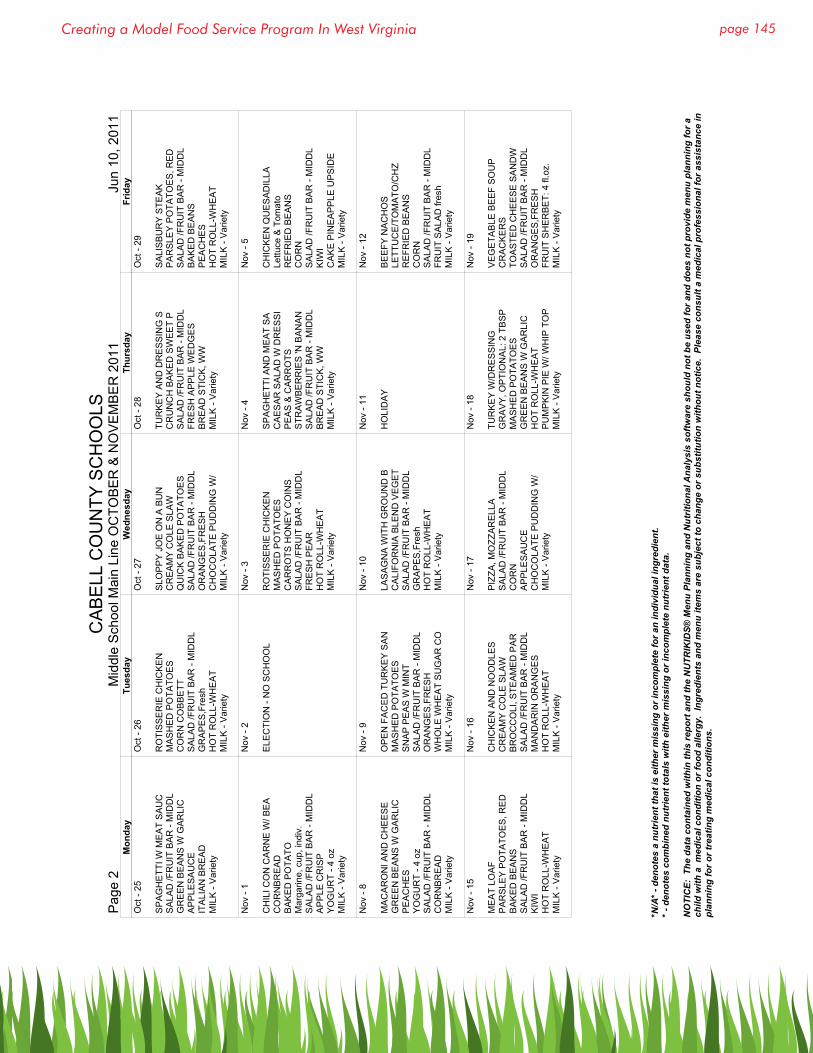
page 145Creating a Model Food Service Program In West Virginia
CA
BE
LL C
OU
NTY
SC
HO
OLS
Pag
e 2
Mid
dle
Sch
ool M
ain
Line
OC
TOB
ER
& N
OV
EM
BE
R 2
011
Jun
10,
201
1M
onda
yTu
esda
yW
edne
sday
Thur
sday
Frid
ayO
ct -
25
SP
AG
HE
TTI W
ME
AT
SA
UC
SA
LAD
/FR
UIT
BA
R -
MID
DL
GR
EE
N B
EA
NS
W G
AR
LIC
AP
PLE
SA
UC
EIT
ALI
AN
BR
EA
DM
ILK
- V
arie
ty
Oct
- 26
RO
TIS
SE
RIE
CH
ICK
EN
MA
SH
ED
PO
TATO
ES
CO
RN
CO
BB
ETT
SA
LAD
/FR
UIT
BA
R -
MID
DL
GR
AP
ES
,Fre
shH
OT
RO
LL-W
HE
AT
MIL
K -
Var
iety
Oct
- 27
SLO
PP
Y J
OE
ON
A B
UN
C
RE
AM
Y C
OLE
SLA
WQ
UIC
K B
AK
ED
PO
TATO
ES
SA
LAD
/FR
UIT
BA
R -
MID
DL
OR
AN
GE
S,F
RE
SH
CH
OC
OLA
TE P
UD
DIN
G W
/M
ILK
- V
arie
ty
Oct
- 28
TUR
KE
Y A
ND
DR
ES
SIN
G S
CR
UN
CH
BA
KE
D S
WE
ET
PS
ALA
D /F
RU
IT B
AR
- M
IDD
LFR
ES
H A
PP
LE W
ED
GE
SB
RE
AD
STI
CK
, WW
MIL
K -
Var
iety
Oct
- 29
SA
LIS
BU
RY
STE
AK
PA
RS
LEY
PO
TATO
ES
, RE
DS
ALA
D /F
RU
IT B
AR
- M
IDD
LB
AK
ED
BE
AN
SP
EA
CH
ES
HO
T R
OLL
-WH
EA
T M
ILK
- V
arie
ty
Nov
- 1
CH
ILI C
ON
CA
RN
E W
/ BE
AC
OR
NB
RE
AD
BA
KE
D P
OTA
TOM
arga
rine,
cup
, ind
iv.
SA
LAD
/FR
UIT
BA
R -
MID
DL
AP
PLE
CR
ISP
YO
GU
RT
- 4 o
zM
ILK
- V
arie
ty
Nov
- 2
ELE
CTI
ON
- N
O S
CH
OO
L
Nov
- 3
RO
TIS
SE
RIE
CH
ICK
EN
MA
SH
ED
PO
TATO
ES
CA
RR
OTS
HO
NE
Y C
OIN
S
SA
LAD
/FR
UIT
BA
R -
MID
DL
FRE
SH
PE
AR
HO
T R
OLL
-WH
EA
T M
ILK
- V
arie
ty
Nov
- 4
SP
AG
HE
TTI A
ND
ME
AT
SA
CA
ES
AR
SA
LAD
W D
RE
SS
IP
EA
S &
CA
RR
OTS
STR
AW
BE
RR
IES
'N B
AN
AN
SA
LAD
/FR
UIT
BA
R -
MID
DL
BR
EA
D S
TIC
K, W
WM
ILK
- V
arie
ty
Nov
- 5
CH
ICK
EN
QU
ES
AD
ILLA
Lettu
ce &
Tom
ato
RE
FRIE
D B
EA
NS
CO
RN
SA
LAD
/FR
UIT
BA
R -
MID
DL
KIW
IC
AK
E P
INE
AP
PLE
UP
SID
E
MIL
K -
Var
iety
Nov
- 8
MA
CA
RO
NI A
ND
CH
EE
SE
G
RE
EN
BE
AN
S W
GA
RLI
CP
EA
CH
ES
YO
GU
RT
- 4 o
zS
ALA
D /F
RU
IT B
AR
- M
IDD
LC
OR
NB
RE
AD
MIL
K -
Var
iety
Nov
- 9
OP
EN
FA
CE
D T
UR
KE
Y S
AN
MA
SH
ED
PO
TATO
ES
SN
AP
PE
AS
W M
INT
SA
LAD
/FR
UIT
BA
R -
MID
DL
OR
AN
GE
S,F
RE
SH
WH
OLE
WH
EA
T S
UG
AR
CO
MIL
K -
Var
iety
Nov
- 10
LAS
AG
NA
WIT
H G
RO
UN
D B
CA
LIFO
RN
IA B
LEN
D V
EG
ET
SA
LAD
/FR
UIT
BA
R -
MID
DL
GR
AP
ES
,Fre
shH
OT
RO
LL-W
HE
AT
MIL
K -
Var
iety
Nov
- 11
HO
LID
AY
Nov
- 12
BE
EFY
NA
CH
OS
LETT
UC
E/T
OM
ATO
/CH
ZR
EFR
IED
BE
AN
SC
OR
NS
ALA
D /F
RU
IT B
AR
- M
IDD
LFR
UIT
SA
LAD
fres
hM
ILK
- V
arie
ty
Nov
- 15
ME
AT
LOA
FP
AR
SLE
Y P
OTA
TOE
S, R
ED
BA
KE
D B
EA
NS
SA
LAD
/FR
UIT
BA
R -
MID
DL
KIW
IH
OT
RO
LL-W
HE
AT
MIL
K -
Var
iety
Nov
- 16
CH
ICK
EN
AN
D N
OO
DLE
SC
RE
AM
Y C
OLE
SLA
WB
RO
CC
OLI
, STE
AM
ED
PA
RS
ALA
D /F
RU
IT B
AR
- M
IDD
LM
AN
DA
RIN
OR
AN
GE
SH
OT
RO
LL-W
HE
AT
MIL
K -
Var
iety
Nov
- 17
PIZ
ZA, M
OZZ
AR
ELL
AS
ALA
D /F
RU
IT B
AR
- M
IDD
LC
OR
NA
PP
LES
AU
CE
CH
OC
OLA
TE P
UD
DIN
G W
/M
ILK
- V
arie
ty
Nov
- 18
TUR
KE
Y W
/DR
ES
SIN
GG
RA
VY
, OP
TIO
NA
L: 2
TB
SP
MA
SH
ED
PO
TATO
ES
GR
EE
N B
EA
NS
W G
AR
LIC
HO
T R
OLL
-WH
EA
T P
UM
PK
IN P
IE W
/ WH
IP T
OP
MIL
K -
Var
iety
Nov
- 19
VE
GE
TAB
LE B
EE
F S
OU
PC
RA
CK
ER
STO
AS
TED
CH
EE
SE
SA
ND
WS
ALA
D /F
RU
IT B
AR
- M
IDD
LO
RA
NG
ES
,FR
ES
HFR
UIT
SH
ER
BE
T: 4
fl.o
z.M
ILK
- V
arie
ty
*N/A
* - d
enot
es a
nut
rient
that
is e
ither
mis
sing
or i
ncom
plet
e fo
r an
indi
vidu
al in
gred
ient
.* -
den
otes
com
bine
d nu
trie
nt to
tals
with
eith
er m
issi
ng o
r inc
ompl
ete
nutr
ient
dat
a.
NO
TIC
E: T
he d
ata
cont
aine
d w
ithin
this
repo
rt a
nd th
e N
UTR
IKID
S® M
enu
Plan
ning
and
Nut
ritio
nal A
naly
sis
softw
are
shou
ld n
ot b
e us
ed fo
r and
doe
s no
t pro
vide
men
u pl
anni
ng fo
r a
child
with
a m
edic
al c
ondi
tion
or fo
od a
llerg
y. I
ngre
dien
ts a
nd m
enu
item
s ar
e su
bjec
t to
chan
ge o
r sub
stitu
tion
with
out n
otic
e. P
leas
e co
nsul
t a m
edic
al p
rofe
ssio
nal f
or a
ssis
tanc
e in
pl
anni
ng fo
r or t
reat
ing
med
ical
con
ditio
ns.
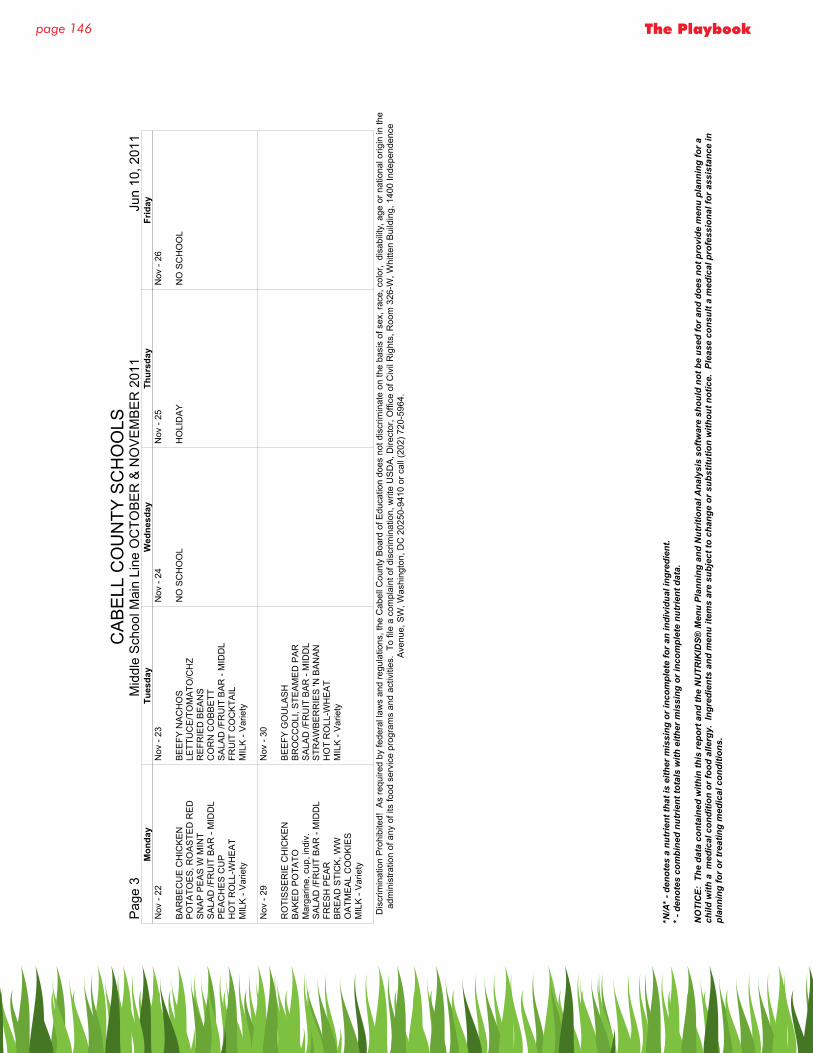
page 146 The Playbook
CA
BE
LL C
OU
NTY
SC
HO
OLS
Pag
e 3
Mid
dle
Sch
ool M
ain
Line
OC
TOB
ER
& N
OV
EM
BE
R 2
011
Jun
10,
201
1M
onda
yTu
esda
yW
edne
sday
Thur
sday
Frid
ayN
ov -
22
BA
RB
EC
UE
CH
ICK
EN
PO
TATO
ES
, RO
AS
TED
RE
DS
NA
P P
EA
S W
MIN
TS
ALA
D /F
RU
IT B
AR
- M
IDD
LP
EA
CH
ES
CU
PH
OT
RO
LL-W
HE
AT
MIL
K -
Var
iety
Nov
- 23
BE
EFY
NA
CH
OS
LETT
UC
E/T
OM
ATO
/CH
ZR
EFR
IED
BE
AN
SC
OR
N C
OB
BE
TTS
ALA
D /F
RU
IT B
AR
- M
IDD
LFR
UIT
CO
CK
TAIL
MIL
K -
Var
iety
Nov
- 24
NO
SC
HO
OL
Nov
- 25
HO
LID
AY
Nov
- 26
NO
SC
HO
OL
Nov
- 29
RO
TIS
SE
RIE
CH
ICK
EN
BA
KE
D P
OTA
TOM
arga
rine,
cup
, ind
iv.
SA
LAD
/FR
UIT
BA
R -
MID
DL
FRE
SH
PE
AR
BR
EA
D S
TIC
K, W
WO
ATM
EA
L C
OO
KIE
SM
ILK
- V
arie
ty
Nov
- 30
BE
EFY
GO
ULA
SH
BR
OC
CO
LI, S
TEA
ME
D P
AR
SA
LAD
/FR
UIT
BA
R -
MID
DL
STR
AW
BE
RR
IES
'N B
AN
AN
HO
T R
OLL
-WH
EA
T M
ILK
- V
arie
ty
Dis
crim
inat
ion
Pro
hibi
ted!
As
requ
ired
by fe
dera
l law
s an
d re
gula
tions
, the
Cab
ell C
ount
y B
oard
of E
duca
tion
does
not
dis
crim
inat
e on
the
basi
s of
sex
, rac
e, c
olor
, di
sabi
lity,
age
or n
atio
nal o
rigin
in th
ead
min
istra
tion
of a
ny o
f its
food
ser
vice
pro
gram
s an
d ac
tiviti
es.
To fi
le a
com
plai
nt o
f dis
crim
inat
ion,
writ
e U
SD
A, D
irect
or, O
ffice
of C
ivil
Rig
hts,
Roo
m 3
26-W
, Whi
tten
Bui
ldin
g, 1
400
Inde
pend
ence
Ave
nue,
SW
, Was
hing
ton,
DC
202
50-9
410
or c
all (
202)
720
-596
4.
*N/A
* - d
enot
es a
nut
rient
that
is e
ither
mis
sing
or i
ncom
plet
e fo
r an
indi
vidu
al in
gred
ient
.* -
den
otes
com
bine
d nu
trie
nt to
tals
with
eith
er m
issi
ng o
r inc
ompl
ete
nutr
ient
dat
a.
NO
TIC
E: T
he d
ata
cont
aine
d w
ithin
this
repo
rt a
nd th
e N
UTR
IKID
S® M
enu
Plan
ning
and
Nut
ritio
nal A
naly
sis
softw
are
shou
ld n
ot b
e us
ed fo
r and
doe
s no
t pro
vide
men
u pl
anni
ng fo
r a
child
with
a m
edic
al c
ondi
tion
or fo
od a
llerg
y. I
ngre
dien
ts a
nd m
enu
item
s ar
e su
bjec
t to
chan
ge o
r sub
stitu
tion
with
out n
otic
e. P
leas
e co
nsul
t a m
edic
al p
rofe
ssio
nal f
or a
ssis
tanc
e in
pl
anni
ng fo
r or t
reat
ing
med
ical
con
ditio
ns.
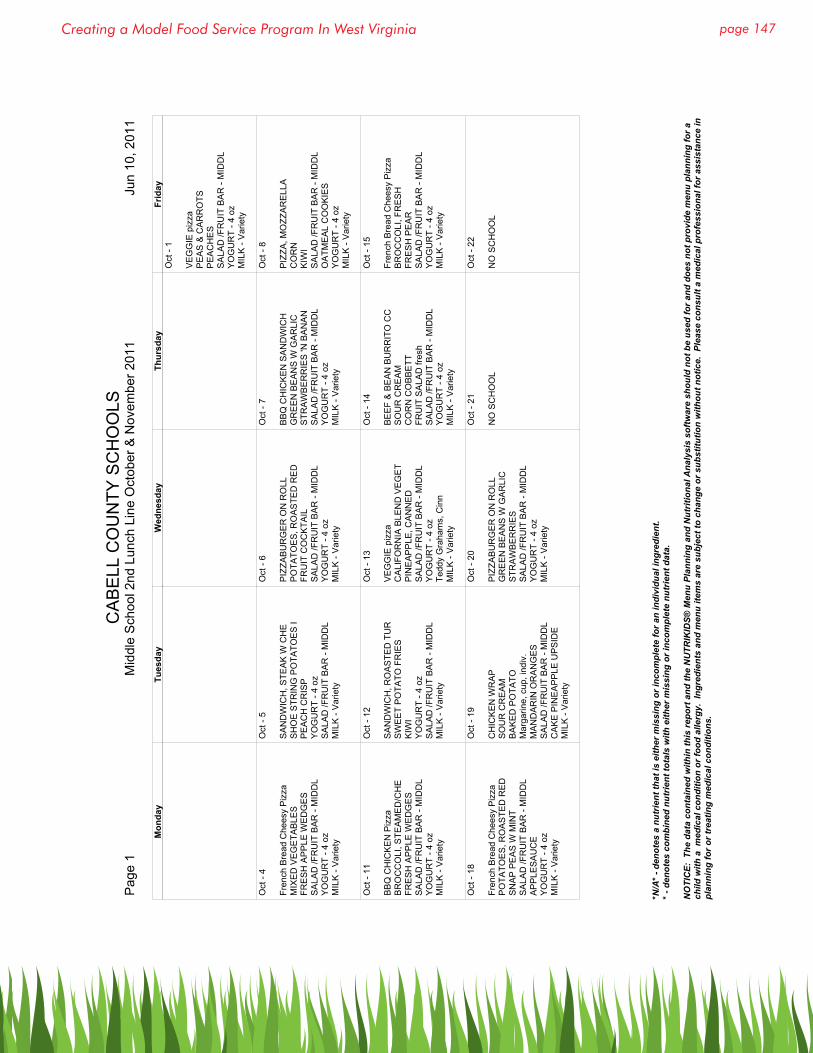
page 147Creating a Model Food Service Program In West Virginia
CA
BE
LL C
OU
NTY
SC
HO
OLS
Pag
e 1
Mid
dle
Sch
ool 2
nd L
unch
Lin
e O
ctob
er &
Nov
embe
r 201
1 J
un 1
0, 2
011
Mon
day
Tues
day
Wed
nesd
ayTh
ursd
ayFr
iday
Oct
- 1
VE
GG
IE p
izza
PE
AS
& C
AR
RO
TSP
EA
CH
ES
SA
LAD
/FR
UIT
BA
R -
MID
DL
YO
GU
RT
- 4 o
zM
ILK
- V
arie
ty
Oct
- 4
Fren
ch B
read
Che
esy
Piz
zaM
IXE
D V
EG
ETA
BLE
SFR
ES
H A
PP
LE W
ED
GE
SS
ALA
D /F
RU
IT B
AR
- M
IDD
LY
OG
UR
T - 4
oz
MIL
K -
Var
iety
Oct
- 5
SA
ND
WIC
H, S
TEA
K W
CH
ES
HO
E S
TRIN
G P
OTA
TOE
S I
PE
AC
H C
RIS
PY
OG
UR
T - 4
oz
SA
LAD
/FR
UIT
BA
R -
MID
DL
MIL
K -
Var
iety
Oct
- 6
PIZ
ZAB
UR
GE
R O
N R
OLL
PO
TATO
ES
, RO
AS
TED
RE
DFR
UIT
CO
CK
TAIL
SA
LAD
/FR
UIT
BA
R -
MID
DL
YO
GU
RT
- 4 o
zM
ILK
- V
arie
ty
Oct
- 7
BB
Q C
HIC
KE
N S
AN
DW
ICH
G
RE
EN
BE
AN
S W
GA
RLI
CS
TRA
WB
ER
RIE
S 'N
BA
NA
NS
ALA
D /F
RU
IT B
AR
- M
IDD
LY
OG
UR
T - 4
oz
MIL
K -
Var
iety
Oct
- 8
PIZ
ZA, M
OZZ
AR
ELL
AC
OR
NK
IWI
SA
LAD
/FR
UIT
BA
R -
MID
DL
OA
TME
AL
CO
OK
IES
YO
GU
RT
- 4 o
zM
ILK
- V
arie
ty
Oct
- 11
BB
Q C
HIC
KE
N P
izza
BR
OC
CO
LI, S
TEA
ME
D/C
HE
FRE
SH
AP
PLE
WE
DG
ES
SA
LAD
/FR
UIT
BA
R -
MID
DL
YO
GU
RT
- 4 o
zM
ILK
- V
arie
ty
Oct
- 12
SA
ND
WIC
H, R
OA
STE
D T
UR
SW
EE
T P
OTA
TO F
RIE
SK
IWI
YO
GU
RT
- 4 o
zS
ALA
D /F
RU
IT B
AR
- M
IDD
LM
ILK
- V
arie
ty
Oct
- 13
VE
GG
IE p
izza
CA
LIFO
RN
IA B
LEN
D V
EG
ET
PIN
EA
PP
LE, C
AN
NE
DS
ALA
D /F
RU
IT B
AR
- M
IDD
LY
OG
UR
T - 4
oz
Tedd
y G
raha
ms,
Cin
nM
ILK
- V
arie
ty
Oct
- 14
BE
EF
& B
EA
N B
UR
RIT
O C
CS
OU
R C
RE
AM
CO
RN
CO
BB
ETT
FRU
IT S
ALA
D fr
esh
SA
LAD
/FR
UIT
BA
R -
MID
DL
YO
GU
RT
- 4 o
zM
ILK
- V
arie
ty
Oct
- 15
Fren
ch B
read
Che
esy
Piz
zaB
RO
CC
OLI
, FR
ES
HFR
ES
H P
EA
RS
ALA
D /F
RU
IT B
AR
- M
IDD
LY
OG
UR
T - 4
oz
MIL
K -
Var
iety
Oct
- 18
Fren
ch B
read
Che
esy
Piz
zaP
OTA
TOE
S, R
OA
STE
D R
ED
SN
AP
PE
AS
W M
INT
SA
LAD
/FR
UIT
BA
R -
MID
DL
AP
PLE
SA
UC
EY
OG
UR
T - 4
oz
MIL
K -
Var
iety
Oct
- 19
CH
ICK
EN
WR
AP
SO
UR
CR
EA
MB
AK
ED
PO
TATO
Mar
garin
e, c
up, i
ndiv
.M
AN
DA
RIN
OR
AN
GE
SS
ALA
D /F
RU
IT B
AR
- M
IDD
LC
AK
E P
INE
AP
PLE
UP
SID
E
MIL
K -
Var
iety
Oct
- 20
PIZ
ZAB
UR
GE
R O
N R
OLL
GR
EE
N B
EA
NS
W G
AR
LIC
STR
AW
BE
RR
IES
SA
LAD
/FR
UIT
BA
R -
MID
DL
YO
GU
RT
- 4 o
zM
ILK
- V
arie
ty
Oct
- 21
NO
SC
HO
OL
Oct
- 22
NO
SC
HO
OL
*N/A
* - d
enot
es a
nut
rient
that
is e
ither
mis
sing
or i
ncom
plet
e fo
r an
indi
vidu
al in
gred
ient
.* -
den
otes
com
bine
d nu
trie
nt to
tals
with
eith
er m
issi
ng o
r inc
ompl
ete
nutr
ient
dat
a.
NO
TIC
E: T
he d
ata
cont
aine
d w
ithin
this
repo
rt a
nd th
e N
UTR
IKID
S® M
enu
Plan
ning
and
Nut
ritio
nal A
naly
sis
softw
are
shou
ld n
ot b
e us
ed fo
r and
doe
s no
t pro
vide
men
u pl
anni
ng fo
r a
child
with
a m
edic
al c
ondi
tion
or fo
od a
llerg
y. I
ngre
dien
ts a
nd m
enu
item
s ar
e su
bjec
t to
chan
ge o
r sub
stitu
tion
with
out n
otic
e. P
leas
e co
nsul
t a m
edic
al p
rofe
ssio
nal f
or a
ssis
tanc
e in
pl
anni
ng fo
r or t
reat
ing
med
ical
con
ditio
ns.
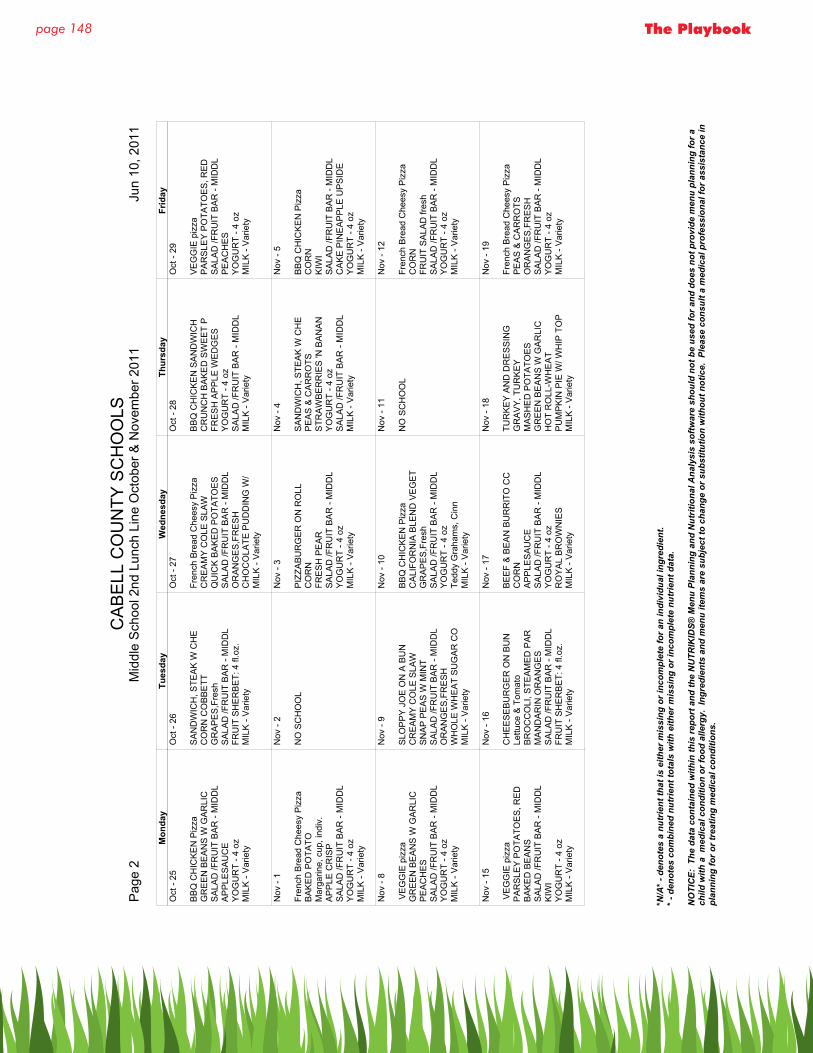
page 148 The Playbook
CA
BE
LL C
OU
NTY
SC
HO
OLS
Pag
e 2
Mid
dle
Sch
ool 2
nd L
unch
Lin
e O
ctob
er &
Nov
embe
r 201
1 J
un 1
0, 2
011
Mon
day
Tues
day
Wed
nesd
ayTh
ursd
ayFr
iday
Oct
- 25
BB
Q C
HIC
KE
N P
izza
GR
EE
N B
EA
NS
W G
AR
LIC
SA
LAD
/FR
UIT
BA
R -
MID
DL
AP
PLE
SA
UC
EY
OG
UR
T - 4
oz
MIL
K -
Var
iety
Oct
- 26
SA
ND
WIC
H, S
TEA
K W
CH
EC
OR
N C
OB
BE
TTG
RA
PE
S,F
resh
SA
LAD
/FR
UIT
BA
R -
MID
DL
FRU
IT S
HE
RB
ET:
4 fl
.oz.
MIL
K -
Var
iety
Oct
- 27
Fren
ch B
read
Che
esy
Piz
zaC
RE
AM
Y C
OLE
SLA
WQ
UIC
K B
AK
ED
PO
TATO
ES
SA
LAD
/FR
UIT
BA
R -
MID
DL
OR
AN
GE
S,F
RE
SH
CH
OC
OLA
TE P
UD
DIN
G W
/M
ILK
- V
arie
ty
Oct
- 28
BB
Q C
HIC
KE
N S
AN
DW
ICH
C
RU
NC
H B
AK
ED
SW
EE
T P
FRE
SH
AP
PLE
WE
DG
ES
YO
GU
RT
- 4 o
zS
ALA
D /F
RU
IT B
AR
- M
IDD
LM
ILK
- V
arie
ty
Oct
- 29
VE
GG
IE p
izza
PA
RS
LEY
PO
TATO
ES
, RE
DS
ALA
D /F
RU
IT B
AR
- M
IDD
LP
EA
CH
ES
YO
GU
RT
- 4 o
zM
ILK
- V
arie
ty
Nov
- 1
Fren
ch B
read
Che
esy
Piz
zaB
AK
ED
PO
TATO
Mar
garin
e, c
up, i
ndiv
.A
PP
LE C
RIS
PS
ALA
D /F
RU
IT B
AR
- M
IDD
LY
OG
UR
T - 4
oz
MIL
K -
Var
iety
Nov
- 2
NO
SC
HO
OL
Nov
- 3
PIZ
ZAB
UR
GE
R O
N R
OLL
CO
RN
FRE
SH
PE
AR
SA
LAD
/FR
UIT
BA
R -
MID
DL
YO
GU
RT
- 4 o
zM
ILK
- V
arie
ty
Nov
- 4
SA
ND
WIC
H, S
TEA
K W
CH
EP
EA
S &
CA
RR
OTS
STR
AW
BE
RR
IES
'N B
AN
AN
YO
GU
RT
- 4 o
zS
ALA
D /F
RU
IT B
AR
- M
IDD
LM
ILK
- V
arie
ty
Nov
- 5
BB
Q C
HIC
KE
N P
izza
CO
RN
KIW
IS
ALA
D /F
RU
IT B
AR
- M
IDD
LC
AK
E P
INE
AP
PLE
UP
SID
E
YO
GU
RT
- 4 o
zM
ILK
- V
arie
ty
Nov
- 8
VE
GG
IE p
izza
GR
EE
N B
EA
NS
W G
AR
LIC
PE
AC
HE
SS
ALA
D /F
RU
IT B
AR
- M
IDD
LY
OG
UR
T - 4
oz
MIL
K -
Var
iety
Nov
- 9
SLO
PP
Y J
OE
ON
A B
UN
C
RE
AM
Y C
OLE
SLA
WS
NA
P P
EA
S W
MIN
TS
ALA
D /F
RU
IT B
AR
- M
IDD
LO
RA
NG
ES
,FR
ES
HW
HO
LE W
HE
AT
SU
GA
R C
OM
ILK
- V
arie
ty
Nov
- 10
BB
Q C
HIC
KE
N P
izza
CA
LIFO
RN
IA B
LEN
D V
EG
ET
GR
AP
ES
,Fre
shS
ALA
D /F
RU
IT B
AR
- M
IDD
LY
OG
UR
T - 4
oz
Tedd
y G
raha
ms,
Cin
nM
ILK
- V
arie
ty
Nov
- 11
NO
SC
HO
OL
Nov
- 12
Fren
ch B
read
Che
esy
Piz
zaC
OR
NFR
UIT
SA
LAD
fres
hS
ALA
D /F
RU
IT B
AR
- M
IDD
LY
OG
UR
T - 4
oz
MIL
K -
Var
iety
Nov
- 15
VE
GG
IE p
izza
PA
RS
LEY
PO
TATO
ES
, RE
DB
AK
ED
BE
AN
SS
ALA
D /F
RU
IT B
AR
- M
IDD
LK
IWI
YO
GU
RT
- 4 o
zM
ILK
- V
arie
ty
Nov
- 16
CH
EE
SE
BU
RG
ER
ON
BU
NLe
ttuce
& T
omat
oB
RO
CC
OLI
, STE
AM
ED
PA
RM
AN
DA
RIN
OR
AN
GE
SS
ALA
D /F
RU
IT B
AR
- M
IDD
LFR
UIT
SH
ER
BE
T: 4
fl.o
z.M
ILK
- V
arie
ty
Nov
- 17
BE
EF
& B
EA
N B
UR
RIT
O C
CC
OR
NA
PP
LES
AU
CE
SA
LAD
/FR
UIT
BA
R -
MID
DL
YO
GU
RT
- 4 o
zR
OY
AL
BR
OW
NIE
SM
ILK
- V
arie
ty
Nov
- 18
TUR
KE
Y A
ND
DR
ES
SIN
G
GR
AV
Y, T
UR
KE
YM
AS
HE
D P
OTA
TOE
SG
RE
EN
BE
AN
S W
GA
RLI
CH
OT
RO
LL-W
HE
AT
PU
MP
KIN
PIE
W/ W
HIP
TO
PM
ILK
- V
arie
ty
Nov
- 19
Fren
ch B
read
Che
esy
Piz
zaP
EA
S &
CA
RR
OTS
OR
AN
GE
S,F
RE
SH
SA
LAD
/FR
UIT
BA
R -
MID
DL
YO
GU
RT
- 4 o
zM
ILK
- V
arie
ty
*N/A
* - d
enot
es a
nut
rient
that
is e
ither
mis
sing
or i
ncom
plet
e fo
r an
indi
vidu
al in
gred
ient
.* -
den
otes
com
bine
d nu
trie
nt to
tals
with
eith
er m
issi
ng o
r inc
ompl
ete
nutr
ient
dat
a.
NO
TIC
E: T
he d
ata
cont
aine
d w
ithin
this
repo
rt a
nd th
e N
UTR
IKID
S® M
enu
Plan
ning
and
Nut
ritio
nal A
naly
sis
softw
are
shou
ld n
ot b
e us
ed fo
r and
doe
s no
t pro
vide
men
u pl
anni
ng fo
r a
child
with
a m
edic
al c
ondi
tion
or fo
od a
llerg
y. I
ngre
dien
ts a
nd m
enu
item
s ar
e su
bjec
t to
chan
ge o
r sub
stitu
tion
with
out n
otic
e. P
leas
e co
nsul
t a m
edic
al p
rofe
ssio
nal f
or a
ssis
tanc
e in
pl
anni
ng fo
r or t
reat
ing
med
ical
con
ditio
ns.
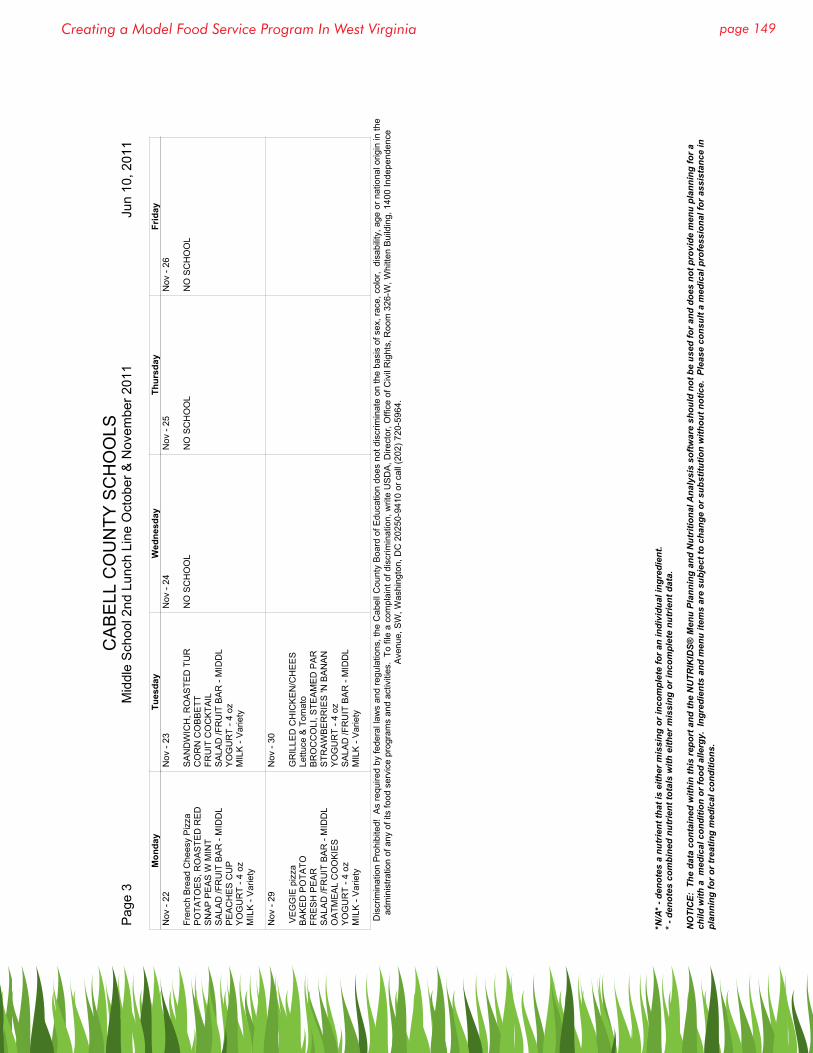
page 149Creating a Model Food Service Program In West Virginia
CA
BE
LL C
OU
NTY
SC
HO
OLS
Pag
e 3
Mid
dle
Sch
ool 2
nd L
unch
Lin
e O
ctob
er &
Nov
embe
r 201
1 J
un 1
0, 2
011
Mon
day
Tues
day
Wed
nesd
ayTh
ursd
ayFr
iday
Nov
- 22
Fren
ch B
read
Che
esy
Piz
zaP
OTA
TOE
S, R
OA
STE
D R
ED
SN
AP
PE
AS
W M
INT
SA
LAD
/FR
UIT
BA
R -
MID
DL
PE
AC
HE
S C
UP
YO
GU
RT
- 4 o
zM
ILK
- V
arie
ty
Nov
- 23
SA
ND
WIC
H, R
OA
STE
D T
UR
CO
RN
CO
BB
ETT
FRU
IT C
OC
KTA
ILS
ALA
D /F
RU
IT B
AR
- M
IDD
LY
OG
UR
T - 4
oz
MIL
K -
Var
iety
Nov
- 24
NO
SC
HO
OL
Nov
- 25
NO
SC
HO
OL
Nov
- 26
NO
SC
HO
OL
Nov
- 29
VE
GG
IE p
izza
BA
KE
D P
OTA
TOFR
ES
H P
EA
RS
ALA
D /F
RU
IT B
AR
- M
IDD
LO
ATM
EA
L C
OO
KIE
SY
OG
UR
T - 4
oz
MIL
K -
Var
iety
Nov
- 30
GR
ILLE
D C
HIC
KE
N/C
HE
ES
Le
ttuce
& T
omat
oB
RO
CC
OLI
, STE
AM
ED
PA
RS
TRA
WB
ER
RIE
S 'N
BA
NA
NY
OG
UR
T - 4
oz
SA
LAD
/FR
UIT
BA
R -
MID
DL
MIL
K -
Var
iety
Dis
crim
inat
ion
Pro
hibi
ted!
As
requ
ired
by fe
dera
l law
s an
d re
gula
tions
, the
Cab
ell C
ount
y B
oard
of E
duca
tion
does
not
dis
crim
inat
e on
the
basi
s of
sex
, rac
e, c
olor
, di
sabi
lity,
age
or n
atio
nal o
rigin
in th
ead
min
istra
tion
of a
ny o
f its
food
ser
vice
pro
gram
s an
d ac
tiviti
es.
To fi
le a
com
plai
nt o
f dis
crim
inat
ion,
writ
e U
SD
A, D
irect
or, O
ffice
of C
ivil
Rig
hts,
Roo
m 3
26-W
, Whi
tten
Bui
ldin
g, 1
400
Inde
pend
ence
Ave
nue,
SW
, Was
hing
ton,
DC
202
50-9
410
or c
all (
202)
720
-596
4.
*N/A
* - d
enot
es a
nut
rient
that
is e
ither
mis
sing
or i
ncom
plet
e fo
r an
indi
vidu
al in
gred
ient
.* -
den
otes
com
bine
d nu
trie
nt to
tals
with
eith
er m
issi
ng o
r inc
ompl
ete
nutr
ient
dat
a.
NO
TIC
E: T
he d
ata
cont
aine
d w
ithin
this
repo
rt a
nd th
e N
UTR
IKID
S® M
enu
Plan
ning
and
Nut
ritio
nal A
naly
sis
softw
are
shou
ld n
ot b
e us
ed fo
r and
doe
s no
t pro
vide
men
u pl
anni
ng fo
r a
child
with
a m
edic
al c
ondi
tion
or fo
od a
llerg
y. I
ngre
dien
ts a
nd m
enu
item
s ar
e su
bjec
t to
chan
ge o
r sub
stitu
tion
with
out n
otic
e. P
leas
e co
nsul
t a m
edic
al p
rofe
ssio
nal f
or a
ssis
tanc
e in
pl
anni
ng fo
r or t
reat
ing
med
ical
con
ditio
ns.
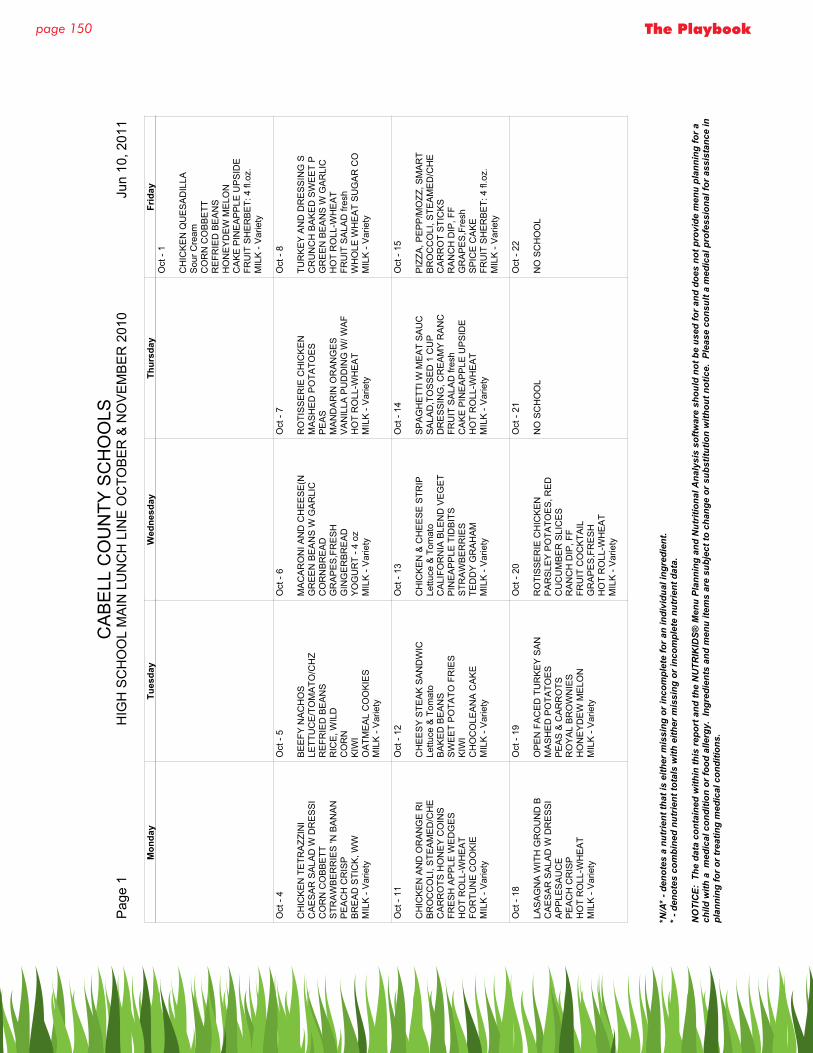
page 150 The Playbook
CA
BE
LL C
OU
NTY
SC
HO
OLS
Pag
e 1
HIG
H S
CH
OO
L M
AIN
LU
NC
H L
INE
OC
TOB
ER
& N
OV
EM
BE
R 2
010
Jun
10,
201
1
Mon
day
Tues
day
Wed
nesd
ayTh
ursd
ayFr
iday
Oct
- 1
CH
ICK
EN
QU
ES
AD
ILLA
Sou
r Cre
am
CO
RN
CO
BB
ETT
RE
FRIE
D B
EA
NS
HO
NE
YD
EW
ME
LON
CA
KE
PIN
EA
PP
LE U
PS
IDE
FR
UIT
SH
ER
BE
T: 4
fl.o
z.M
ILK
- V
arie
ty
Oct
- 4
CH
ICK
EN
TE
TRA
ZZIN
IC
AE
SA
R S
ALA
D W
DR
ES
SI
CO
RN
CO
BB
ETT
STR
AW
BE
RR
IES
'N B
AN
AN
PE
AC
H C
RIS
PB
RE
AD
STI
CK
, WW
MIL
K -
Var
iety
Oct
- 5
BE
EFY
NA
CH
OS
LETT
UC
E/T
OM
ATO
/CH
ZR
EFR
IED
BE
AN
SR
ICE
, WIL
DC
OR
NK
IWI
OA
TME
AL
CO
OK
IES
MIL
K -
Var
iety
Oct
- 6
MA
CA
RO
NI A
ND
CH
EE
SE
(NG
RE
EN
BE
AN
S W
GA
RLI
CC
OR
NB
RE
AD
GR
AP
ES
,FR
ES
HG
ING
ER
BR
EA
DY
OG
UR
T - 4
oz
MIL
K -
Var
iety
Oct
- 7
RO
TIS
SE
RIE
CH
ICK
EN
MA
SH
ED
PO
TATO
ES
PE
AS
MA
ND
AR
IN O
RA
NG
ES
VA
NIL
LA P
UD
DIN
G W
/ WA
FH
OT
RO
LL-W
HE
AT
MIL
K -
Var
iety
Oct
- 8
TUR
KE
Y A
ND
DR
ES
SIN
G S
CR
UN
CH
BA
KE
D S
WE
ET
PG
RE
EN
BE
AN
S W
GA
RLI
CH
OT
RO
LL-W
HE
AT
FRU
IT S
ALA
D fr
esh
WH
OLE
WH
EA
T S
UG
AR
CO
MIL
K -
Var
iety
Oct
- 11
CH
ICK
EN
AN
D O
RA
NG
E R
IB
RO
CC
OLI
, STE
AM
ED
/CH
EC
AR
RO
TS H
ON
EY
CO
INS
FR
ES
H A
PP
LE W
ED
GE
SH
OT
RO
LL-W
HE
AT
FOR
TUN
E C
OO
KIE
MIL
K -
Var
iety
Oct
- 12
CH
EE
SY
STE
AK
SA
ND
WIC
Lettu
ce &
Tom
ato
BA
KE
D B
EA
NS
SW
EE
T P
OTA
TO F
RIE
SK
IWI
CH
OC
OLE
AN
A C
AK
EM
ILK
- V
arie
ty
Oct
- 13
CH
ICK
EN
& C
HE
ES
E S
TRIP
Lettu
ce &
Tom
ato
CA
LIFO
RN
IA B
LEN
D V
EG
ET
PIN
EA
PP
LE T
IDB
ITS
STR
AW
BE
RR
IES
TED
DY
GR
AH
AM
MIL
K -
Var
iety
Oct
- 14
SP
AG
HE
TTI W
ME
AT
SA
UC
SA
LAD
,TO
SS
ED
1 C
UP
DR
ES
SIN
G, C
RE
AM
Y R
AN
CFR
UIT
SA
LAD
fres
hC
AK
E P
INE
AP
PLE
UP
SID
E
HO
T R
OLL
-WH
EA
T M
ILK
- V
arie
ty
Oct
- 15
PIZ
ZA, P
EP
P/M
OZZ
, SM
AR
TB
RO
CC
OLI
, STE
AM
ED
/CH
EC
AR
RO
T S
TIC
KS
RA
NC
H D
IP, F
FG
RA
PE
S,F
resh
SP
ICE
CA
KE
FRU
IT S
HE
RB
ET:
4 fl
.oz.
MIL
K -
Var
iety
Oct
- 18
LAS
AG
NA
WIT
H G
RO
UN
D B
CA
ES
AR
SA
LAD
W D
RE
SS
IA
PP
LES
AU
CE
PE
AC
H C
RIS
PH
OT
RO
LL-W
HE
AT
MIL
K -
Var
iety
Oct
- 19
OP
EN
FA
CE
D T
UR
KE
Y S
AN
MA
SH
ED
PO
TATO
ES
PE
AS
& C
AR
RO
TSR
OY
AL
BR
OW
NIE
SH
ON
EY
DE
W M
ELO
NM
ILK
- V
arie
ty
Oct
- 20
RO
TIS
SE
RIE
CH
ICK
EN
PA
RS
LEY
PO
TATO
ES
, RE
DC
UC
UM
BE
R S
LIC
ES
R
AN
CH
DIP
, FF
FRU
IT C
OC
KTA
ILG
RA
PE
S,F
RE
SH
HO
T R
OLL
-WH
EA
T M
ILK
- V
arie
ty
Oct
- 21
NO
SC
HO
OL
Oct
- 22
NO
SC
HO
OL
*N/A
* - d
enot
es a
nut
rient
that
is e
ither
mis
sing
or i
ncom
plet
e fo
r an
indi
vidu
al in
gred
ient
.* -
den
otes
com
bine
d nu
trie
nt to
tals
with
eith
er m
issi
ng o
r inc
ompl
ete
nutr
ient
dat
a.
NO
TIC
E: T
he d
ata
cont
aine
d w
ithin
this
repo
rt a
nd th
e N
UTR
IKID
S® M
enu
Plan
ning
and
Nut
ritio
nal A
naly
sis
softw
are
shou
ld n
ot b
e us
ed fo
r and
doe
s no
t pro
vide
men
u pl
anni
ng fo
r a
child
with
a m
edic
al c
ondi
tion
or fo
od a
llerg
y. I
ngre
dien
ts a
nd m
enu
item
s ar
e su
bjec
t to
chan
ge o
r sub
stitu
tion
with
out n
otic
e. P
leas
e co
nsul
t a m
edic
al p
rofe
ssio
nal f
or a
ssis
tanc
e in
pl
anni
ng fo
r or t
reat
ing
med
ical
con
ditio
ns.
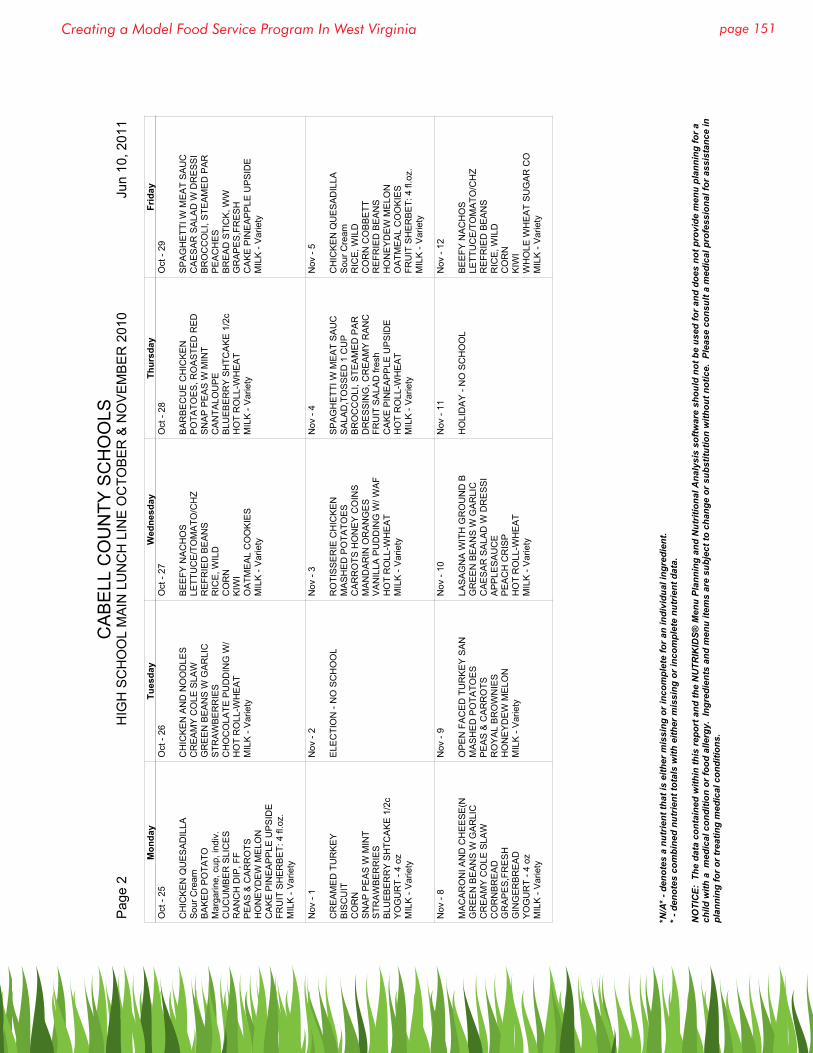
page 151Creating a Model Food Service Program In West Virginia
CA
BE
LL C
OU
NTY
SC
HO
OLS
Pag
e 2
HIG
H S
CH
OO
L M
AIN
LU
NC
H L
INE
OC
TOB
ER
& N
OV
EM
BE
R 2
010
Jun
10,
201
1
Mon
day
Tues
day
Wed
nesd
ayTh
ursd
ayFr
iday
Oct
- 25
CH
ICK
EN
QU
ES
AD
ILLA
Sou
r Cre
am
BA
KE
D P
OTA
TOM
arga
rine,
cup
, ind
iv.
CU
CU
MB
ER
SLI
CE
S
RA
NC
H D
IP, F
FP
EA
S &
CA
RR
OTS
HO
NE
YD
EW
ME
LON
CA
KE
PIN
EA
PP
LE U
PS
IDE
FR
UIT
SH
ER
BE
T: 4
fl.o
z.M
ILK
- V
arie
ty
Oct
- 26
CH
ICK
EN
AN
D N
OO
DLE
SC
RE
AM
Y C
OLE
SLA
WG
RE
EN
BE
AN
S W
GA
RLI
CS
TRA
WB
ER
RIE
SC
HO
CO
LATE
PU
DD
ING
W/
HO
T R
OLL
-WH
EA
T M
ILK
- V
arie
ty
Oct
- 27
BE
EFY
NA
CH
OS
LETT
UC
E/T
OM
ATO
/CH
ZR
EFR
IED
BE
AN
SR
ICE
, WIL
DC
OR
NK
IWI
OA
TME
AL
CO
OK
IES
MIL
K -
Var
iety
Oct
- 28
BA
RB
EC
UE
CH
ICK
EN
PO
TATO
ES
, RO
AS
TED
RE
DS
NA
P P
EA
S W
MIN
TC
AN
TALO
UP
EB
LUE
BE
RR
Y S
HTC
AK
E 1
/2c
HO
T R
OLL
-WH
EA
T M
ILK
- V
arie
ty
Oct
- 29
SP
AG
HE
TTI W
ME
AT
SA
UC
CA
ES
AR
SA
LAD
W D
RE
SS
IB
RO
CC
OLI
, STE
AM
ED
PA
RP
EA
CH
ES
BR
EA
D S
TIC
K, W
WG
RA
PE
S,F
RE
SH
CA
KE
PIN
EA
PP
LE U
PS
IDE
M
ILK
- V
arie
ty
Nov
- 1
CR
EA
ME
D T
UR
KE
YB
ISC
UIT
CO
RN
SN
AP
PE
AS
W M
INT
STR
AW
BE
RR
IES
BLU
EB
ER
RY
SH
TCA
KE
1/2
cY
OG
UR
T - 4
oz
MIL
K -
Var
iety
Nov
- 2
ELE
CTI
ON
- N
O S
CH
OO
L
Nov
- 3
RO
TIS
SE
RIE
CH
ICK
EN
MA
SH
ED
PO
TATO
ES
CA
RR
OTS
HO
NE
Y C
OIN
S
MA
ND
AR
IN O
RA
NG
ES
VA
NIL
LA P
UD
DIN
G W
/ WA
FH
OT
RO
LL-W
HE
AT
MIL
K -
Var
iety
Nov
- 4
SP
AG
HE
TTI W
ME
AT
SA
UC
SA
LAD
,TO
SS
ED
1 C
UP
BR
OC
CO
LI, S
TEA
ME
D P
AR
DR
ES
SIN
G, C
RE
AM
Y R
AN
CFR
UIT
SA
LAD
fres
hC
AK
E P
INE
AP
PLE
UP
SID
E
HO
T R
OLL
-WH
EA
T M
ILK
- V
arie
ty
Nov
- 5
CH
ICK
EN
QU
ES
AD
ILLA
Sou
r Cre
am
RIC
E, W
ILD
CO
RN
CO
BB
ETT
RE
FRIE
D B
EA
NS
HO
NE
YD
EW
ME
LON
OA
TME
AL
CO
OK
IES
FRU
IT S
HE
RB
ET:
4 fl
.oz.
MIL
K -
Var
iety
Nov
- 8
MA
CA
RO
NI A
ND
CH
EE
SE
(NG
RE
EN
BE
AN
S W
GA
RLI
CC
RE
AM
Y C
OLE
SLA
WC
OR
NB
RE
AD
GR
AP
ES
,FR
ES
HG
ING
ER
BR
EA
DY
OG
UR
T - 4
oz
MIL
K -
Var
iety
Nov
- 9
OP
EN
FA
CE
D T
UR
KE
Y S
AN
MA
SH
ED
PO
TATO
ES
PE
AS
& C
AR
RO
TSR
OY
AL
BR
OW
NIE
SH
ON
EY
DE
W M
ELO
NM
ILK
- V
arie
ty
Nov
- 10
LAS
AG
NA
WIT
H G
RO
UN
D B
GR
EE
N B
EA
NS
W G
AR
LIC
CA
ES
AR
SA
LAD
W D
RE
SS
IA
PP
LES
AU
CE
PE
AC
H C
RIS
PH
OT
RO
LL-W
HE
AT
MIL
K -
Var
iety
Nov
- 11
HO
LID
AY
- N
O S
CH
OO
L
Nov
- 12
BE
EFY
NA
CH
OS
LETT
UC
E/T
OM
ATO
/CH
ZR
EFR
IED
BE
AN
SR
ICE
, WIL
DC
OR
NK
IWI
WH
OLE
WH
EA
T S
UG
AR
CO
MIL
K -
Var
iety
*N/A
* - d
enot
es a
nut
rient
that
is e
ither
mis
sing
or i
ncom
plet
e fo
r an
indi
vidu
al in
gred
ient
.* -
den
otes
com
bine
d nu
trie
nt to
tals
with
eith
er m
issi
ng o
r inc
ompl
ete
nutr
ient
dat
a.
NO
TIC
E: T
he d
ata
cont
aine
d w
ithin
this
repo
rt a
nd th
e N
UTR
IKID
S® M
enu
Plan
ning
and
Nut
ritio
nal A
naly
sis
softw
are
shou
ld n
ot b
e us
ed fo
r and
doe
s no
t pro
vide
men
u pl
anni
ng fo
r a
child
with
a m
edic
al c
ondi
tion
or fo
od a
llerg
y. I
ngre
dien
ts a
nd m
enu
item
s ar
e su
bjec
t to
chan
ge o
r sub
stitu
tion
with
out n
otic
e. P
leas
e co
nsul
t a m
edic
al p
rofe
ssio
nal f
or a
ssis
tanc
e in
pl
anni
ng fo
r or t
reat
ing
med
ical
con
ditio
ns.
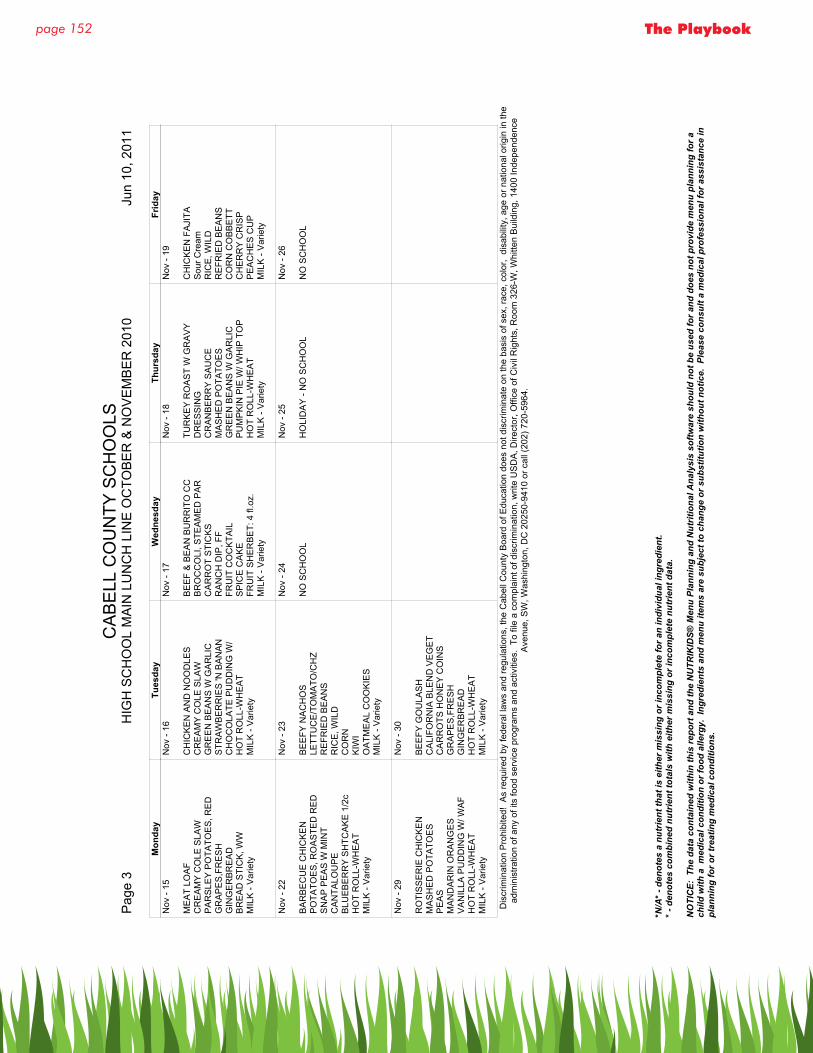
page 152 The Playbook
CA
BE
LL C
OU
NTY
SC
HO
OLS
Pag
e 3
HIG
H S
CH
OO
L M
AIN
LU
NC
H L
INE
OC
TOB
ER
& N
OV
EM
BE
R 2
010
Jun
10,
201
1
Mon
day
Tues
day
Wed
nesd
ayTh
ursd
ayFr
iday
Nov
- 15
ME
AT
LOA
FC
RE
AM
Y C
OLE
SLA
WP
AR
SLE
Y P
OTA
TOE
S, R
ED
GR
AP
ES
,FR
ES
HG
ING
ER
BR
EA
DB
RE
AD
STI
CK
, WW
MIL
K -
Var
iety
Nov
- 16
CH
ICK
EN
AN
D N
OO
DLE
SC
RE
AM
Y C
OLE
SLA
WG
RE
EN
BE
AN
S W
GA
RLI
CS
TRA
WB
ER
RIE
S 'N
BA
NA
NC
HO
CO
LATE
PU
DD
ING
W/
HO
T R
OLL
-WH
EA
T M
ILK
- V
arie
ty
Nov
- 17
BE
EF
& B
EA
N B
UR
RIT
O C
CB
RO
CC
OLI
, STE
AM
ED
PA
RC
AR
RO
T S
TIC
KS
RA
NC
H D
IP, F
FFR
UIT
CO
CK
TAIL
SP
ICE
CA
KE
FRU
IT S
HE
RB
ET:
4 fl
.oz.
MIL
K -
Var
iety
Nov
- 18
TUR
KE
Y R
OA
ST
W G
RA
VY
DR
ES
SIN
GC
RA
NB
ER
RY
SA
UC
EM
AS
HE
D P
OTA
TOE
SG
RE
EN
BE
AN
S W
GA
RLI
CP
UM
PK
IN P
IE W
/ WH
IP T
OP
HO
T R
OLL
-WH
EA
T M
ILK
- V
arie
ty
Nov
- 19
CH
ICK
EN
FA
JITA
Sou
r Cre
am
RIC
E, W
ILD
RE
FRIE
D B
EA
NS
CO
RN
CO
BB
ETT
CH
ER
RY
CR
ISP
PE
AC
HE
S C
UP
MIL
K -
Var
iety
Nov
- 22
BA
RB
EC
UE
CH
ICK
EN
PO
TATO
ES
, RO
AS
TED
RE
DS
NA
P P
EA
S W
MIN
TC
AN
TALO
UP
EB
LUE
BE
RR
Y S
HTC
AK
E 1
/2c
HO
T R
OLL
-WH
EA
T M
ILK
- V
arie
ty
Nov
- 23
BE
EFY
NA
CH
OS
LETT
UC
E/T
OM
ATO
/CH
ZR
EFR
IED
BE
AN
SR
ICE
, WIL
DC
OR
NK
IWI
OA
TME
AL
CO
OK
IES
MIL
K -
Var
iety
Nov
- 24
NO
SC
HO
OL
Nov
- 25
HO
LID
AY
- N
O S
CH
OO
L
Nov
- 26
NO
SC
HO
OL
Nov
- 29
RO
TIS
SE
RIE
CH
ICK
EN
MA
SH
ED
PO
TATO
ES
PE
AS
MA
ND
AR
IN O
RA
NG
ES
VA
NIL
LA P
UD
DIN
G W
/ WA
FH
OT
RO
LL-W
HE
AT
MIL
K -
Var
iety
Nov
- 30
BE
EFY
GO
ULA
SH
CA
LIFO
RN
IA B
LEN
D V
EG
ET
CA
RR
OTS
HO
NE
Y C
OIN
S
GR
AP
ES
,FR
ES
HG
ING
ER
BR
EA
DH
OT
RO
LL-W
HE
AT
MIL
K -
Var
iety
Dis
crim
inat
ion
Pro
hibi
ted!
As
requ
ired
by fe
dera
l law
s an
d re
gula
tions
, the
Cab
ell C
ount
y B
oard
of E
duca
tion
does
not
dis
crim
inat
e on
the
basi
s of
sex
, rac
e, c
olor
, di
sabi
lity,
age
or n
atio
nal o
rigin
in th
ead
min
istra
tion
of a
ny o
f its
food
ser
vice
pro
gram
s an
d ac
tiviti
es.
To fi
le a
com
plai
nt o
f dis
crim
inat
ion,
writ
e U
SD
A, D
irect
or, O
ffice
of C
ivil
Rig
hts,
Roo
m 3
26-W
, Whi
tten
Bui
ldin
g, 1
400
Inde
pend
ence
Ave
nue,
SW
, Was
hing
ton,
DC
202
50-9
410
or c
all (
202)
720
-596
4.
*N/A
* - d
enot
es a
nut
rient
that
is e
ither
mis
sing
or i
ncom
plet
e fo
r an
indi
vidu
al in
gred
ient
.* -
den
otes
com
bine
d nu
trie
nt to
tals
with
eith
er m
issi
ng o
r inc
ompl
ete
nutr
ient
dat
a.
NO
TIC
E: T
he d
ata
cont
aine
d w
ithin
this
repo
rt a
nd th
e N
UTR
IKID
S® M
enu
Plan
ning
and
Nut
ritio
nal A
naly
sis
softw
are
shou
ld n
ot b
e us
ed fo
r and
doe
s no
t pro
vide
men
u pl
anni
ng fo
r a
child
with
a m
edic
al c
ondi
tion
or fo
od a
llerg
y. I
ngre
dien
ts a
nd m
enu
item
s ar
e su
bjec
t to
chan
ge o
r sub
stitu
tion
with
out n
otic
e. P
leas
e co
nsul
t a m
edic
al p
rofe
ssio
nal f
or a
ssis
tanc
e in
pl
anni
ng fo
r or t
reat
ing
med
ical
con
ditio
ns.

page 153Creating a Model Food Service Program In West Virginia
CA
BE
LL C
OU
NTY
SC
HO
OLS
Pag
e 1
HIG
H S
CH
OO
L S
AN
DW
ICH
LIN
E O
CTO
BE
R &
NO
VE
MB
ER
201
0 J
un 1
0, 2
011
Mon
day
Tues
day
Wed
nesd
ayTh
ursd
ayFr
iday
Oct
- 1
VE
GG
IE p
izza
BU
RR
ITO
, BE
EF
& B
EA
NC
OR
NB
RO
CC
OLI
, FR
ES
HR
AN
CH
DIP
, FF
HO
NE
YD
EW
ME
LON
CA
KE
PIN
EA
PP
LE U
PS
IDE
Y
OG
UR
T - 4
oz
MIL
K -
Var
iety
Oct
- 4
PIZ
ZAB
UR
GE
R O
N R
OLL
CH
ICK
EN
FA
JITA
CO
RN
CO
BB
ETT
BR
OC
CO
LI, F
RE
SH
RA
NC
H D
IP, F
FP
EA
CH
CR
ISP
STR
AW
BE
RR
IES
'N B
AN
AN
YO
GU
RT
- 4 o
zM
ILK
- V
arie
ty
Oct
- 5
SA
ND
WIC
H, S
TEA
K W
CH
EFr
ench
Bre
ad C
hees
y P
izza
CO
RN
CA
RR
OT
STI
CK
S /D
IPK
IWI
OA
TME
AL
CO
OK
IES
MIL
K -
Var
iety
Oct
- 6
BB
Q C
HIC
KE
N P
izza
CH
EE
SE
BU
RG
ER
ON
BU
NLe
ttuce
& T
omat
oB
RO
CC
OLI
, STE
AM
ED
/CH
EC
ELE
RY
STI
CK
S
RA
NC
H D
IP, F
FG
ING
ER
BR
EA
DG
RA
PE
S,F
RE
SH
YO
GU
RT
- 4 o
zM
ILK
- V
arie
ty
Oct
- 7
SLO
PP
Y J
OE
ON
A B
UN
V
EG
GIE
piz
zaS
HO
E S
TRIN
G P
OTA
TOE
S I
BR
OC
CO
LI, F
RE
SH
RA
NC
H D
IP, F
FV
AN
ILLA
PU
DD
ING
W/ W
AF
MA
ND
AR
IN O
RA
NG
ES
MIL
K -
Var
iety
Oct
- 8
Fren
ch B
read
Che
esy
Piz
zaS
OFT
TA
CO
CO
RN
CE
LER
Y S
TIC
KS
R
AN
CH
DIP
, FF
FRU
IT S
ALA
D fr
esh
WH
OLE
WH
EA
T S
UG
AR
CO
YO
GU
RT
- 4 o
zM
ILK
- V
arie
ty
Oct
- 11
PIZ
ZA, C
HE
ES
YS
AN
DW
ICH
, BB
Q C
HIC
KE
NB
RO
CC
OLI
, STE
AM
ED
PA
RC
ELE
RY
STI
CK
S
RA
NC
H D
IP, F
FFR
ES
H A
PP
LE W
ED
GE
SFO
RTU
NE
CO
OK
IEY
OG
UR
T - 4
oz
MIL
K -
Var
iety
Oct
- 12
CH
ICK
EN
FA
JITA
Sou
r Cre
am
Fren
ch B
read
Che
esy
Piz
zaS
WE
ET
PO
TATO
FR
IES
BR
OC
CO
LI, F
RE
SH
Dre
ssin
g, R
anch
FF
KIW
IC
HO
CO
LEA
NA
CA
KE
FRU
IT S
HE
RB
ET
MIL
K -
Var
iety
Oct
- 13
VE
GG
IE p
izza
CH
EE
SE
BU
RG
ER
ON
BU
NLe
ttuce
& T
omat
oC
ALI
FOR
NIA
BLE
ND
VE
GE
TB
RO
CC
OLI
, FR
ES
HR
AN
CH
DIP
, FF
STR
AW
BE
RR
IES
PIN
EA
PP
LE T
IDB
ITS
Tedd
y G
raha
ms,
Cin
nY
OG
UR
T - 4
oz
MIL
K -
Var
iety
Oct
- 14
PIZ
ZAB
UR
GE
R O
N R
OLL
BB
Q C
HIC
KE
N S
AN
DW
ICH
C
OR
NC
ELE
RY
/CA
RR
OTS
Dre
ssin
g, R
anch
FF
FRU
IT S
ALA
D fr
esh
CA
KE
PIN
EA
PP
LE U
PS
IDE
Y
OG
UR
T - 4
oz
MIL
K -
Var
iety
Oct
- 15
VE
GG
IE p
izza
SA
ND
WIC
H, S
TEA
K W
CH
EB
RO
CC
OLI
, STE
AM
ED
/CH
EC
OR
N C
OB
BE
TTC
AR
RO
T S
TIC
KS
/DIP
GR
AP
ES
,FR
ES
HS
PIC
E C
AK
EM
ILK
- V
arie
ty
*N/A
* - d
enot
es a
nut
rient
that
is e
ither
mis
sing
or i
ncom
plet
e fo
r an
indi
vidu
al in
gred
ient
.* -
den
otes
com
bine
d nu
trie
nt to
tals
with
eith
er m
issi
ng o
r inc
ompl
ete
nutr
ient
dat
a.
NO
TIC
E: T
he d
ata
cont
aine
d w
ithin
this
repo
rt a
nd th
e N
UTR
IKID
S® M
enu
Plan
ning
and
Nut
ritio
nal A
naly
sis
softw
are
shou
ld n
ot b
e us
ed fo
r and
doe
s no
t pro
vide
men
u pl
anni
ng fo
r a
child
with
a m
edic
al c
ondi
tion
or fo
od a
llerg
y. I
ngre
dien
ts a
nd m
enu
item
s ar
e su
bjec
t to
chan
ge o
r sub
stitu
tion
with
out n
otic
e. P
leas
e co
nsul
t a m
edic
al p
rofe
ssio
nal f
or a
ssis
tanc
e in
pl
anni
ng fo
r or t
reat
ing
med
ical
con
ditio
ns.
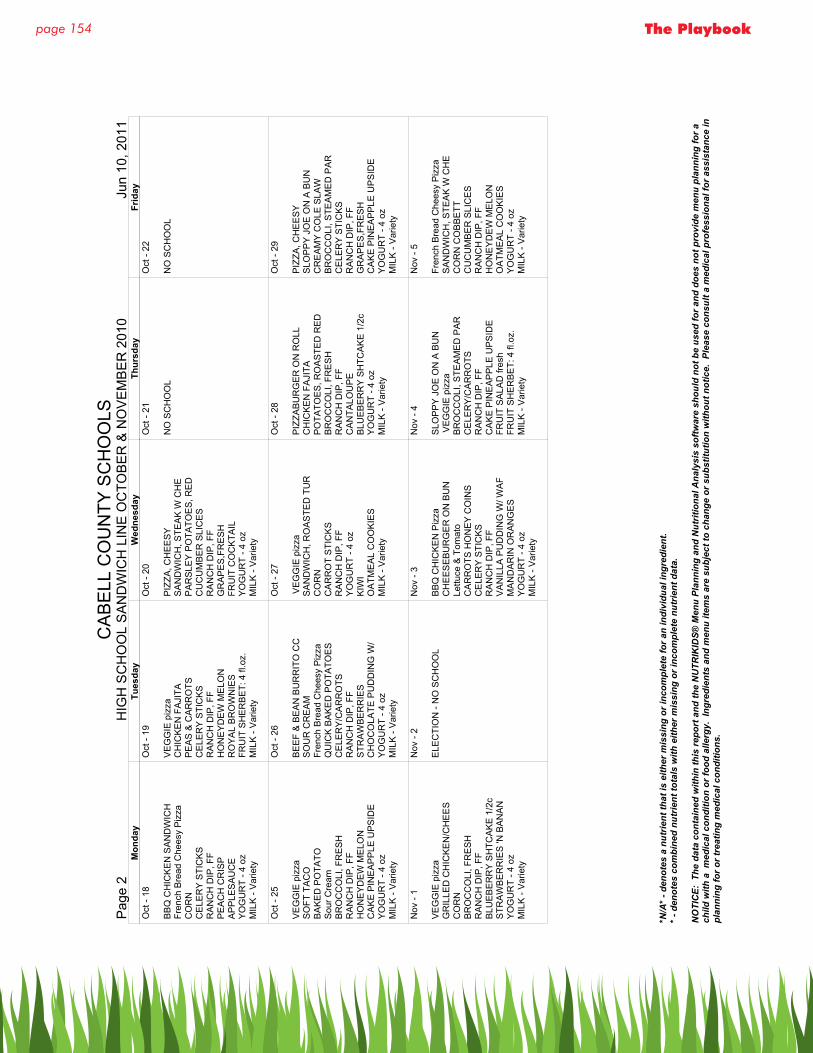
page 154 The Playbook
CA
BE
LL C
OU
NTY
SC
HO
OLS
Pag
e 2
HIG
H S
CH
OO
L S
AN
DW
ICH
LIN
E O
CTO
BE
R &
NO
VE
MB
ER
201
0 J
un 1
0, 2
011
Mon
day
Tues
day
Wed
nesd
ayTh
ursd
ayFr
iday
Oct
- 18
BB
Q C
HIC
KE
N S
AN
DW
ICH
Fr
ench
Bre
ad C
hees
y P
izza
CO
RN
CE
LER
Y S
TIC
KS
R
AN
CH
DIP
, FF
PE
AC
H C
RIS
PA
PP
LES
AU
CE
YO
GU
RT
- 4 o
zM
ILK
- V
arie
ty
Oct
- 19
VE
GG
IE p
izza
CH
ICK
EN
FA
JITA
PE
AS
& C
AR
RO
TSC
ELE
RY
STI
CK
S
RA
NC
H D
IP, F
FH
ON
EY
DE
W M
ELO
NR
OY
AL
BR
OW
NIE
SFR
UIT
SH
ER
BE
T: 4
fl.o
z.M
ILK
- V
arie
ty
Oct
- 20
PIZ
ZA, C
HE
ES
YS
AN
DW
ICH
, STE
AK
W C
HE
PA
RS
LEY
PO
TATO
ES
, RE
DC
UC
UM
BE
R S
LIC
ES
R
AN
CH
DIP
, FF
GR
AP
ES
,FR
ES
HFR
UIT
CO
CK
TAIL
YO
GU
RT
- 4 o
zM
ILK
- V
arie
ty
Oct
- 21
NO
SC
HO
OL
Oct
- 22
NO
SC
HO
OL
Oct
- 25
VE
GG
IE p
izza
SO
FT T
AC
OB
AK
ED
PO
TATO
Sou
r Cre
am
BR
OC
CO
LI, F
RE
SH
RA
NC
H D
IP, F
FH
ON
EY
DE
W M
ELO
NC
AK
E P
INE
AP
PLE
UP
SID
E
YO
GU
RT
- 4 o
zM
ILK
- V
arie
ty
Oct
- 26
BE
EF
& B
EA
N B
UR
RIT
O C
CS
OU
R C
RE
AM
Fren
ch B
read
Che
esy
Piz
zaQ
UIC
K B
AK
ED
PO
TATO
ES
CE
LER
Y/C
AR
RO
TSR
AN
CH
DIP
, FF
STR
AW
BE
RR
IES
CH
OC
OLA
TE P
UD
DIN
G W
/Y
OG
UR
T - 4
oz
MIL
K -
Var
iety
Oct
- 27
VE
GG
IE p
izza
SA
ND
WIC
H, R
OA
STE
D T
UR
CO
RN
CA
RR
OT
STI
CK
SR
AN
CH
DIP
, FF
YO
GU
RT
- 4 o
zK
IWI
OA
TME
AL
CO
OK
IES
MIL
K -
Var
iety
Oct
- 28
PIZ
ZAB
UR
GE
R O
N R
OLL
CH
ICK
EN
FA
JITA
PO
TATO
ES
, RO
AS
TED
RE
DB
RO
CC
OLI
, FR
ES
HR
AN
CH
DIP
, FF
CA
NTA
LOU
PE
BLU
EB
ER
RY
SH
TCA
KE
1/2
cY
OG
UR
T - 4
oz
MIL
K -
Var
iety
Oct
- 29
PIZ
ZA, C
HE
ES
YS
LOP
PY
JO
E O
N A
BU
N
CR
EA
MY
CO
LE S
LAW
BR
OC
CO
LI, S
TEA
ME
D P
AR
CE
LER
Y S
TIC
KS
R
AN
CH
DIP
, FF
GR
AP
ES
,FR
ES
HC
AK
E P
INE
AP
PLE
UP
SID
E
YO
GU
RT
- 4 o
zM
ILK
- V
arie
ty
Nov
- 1
VE
GG
IE p
izza
GR
ILLE
D C
HIC
KE
N/C
HE
ES
C
OR
NB
RO
CC
OLI
, FR
ES
HR
AN
CH
DIP
, FF
BLU
EB
ER
RY
SH
TCA
KE
1/2
cS
TRA
WB
ER
RIE
S 'N
BA
NA
NY
OG
UR
T - 4
oz
MIL
K -
Var
iety
Nov
- 2
ELE
CTI
ON
- N
O S
CH
OO
L
Nov
- 3
BB
Q C
HIC
KE
N P
izza
CH
EE
SE
BU
RG
ER
ON
BU
NLe
ttuce
& T
omat
oC
AR
RO
TS H
ON
EY
CO
INS
C
ELE
RY
STI
CK
S
RA
NC
H D
IP, F
FV
AN
ILLA
PU
DD
ING
W/ W
AF
MA
ND
AR
IN O
RA
NG
ES
YO
GU
RT
- 4 o
zM
ILK
- V
arie
ty
Nov
- 4
SLO
PP
Y J
OE
ON
A B
UN
V
EG
GIE
piz
zaB
RO
CC
OLI
, STE
AM
ED
PA
RC
ELE
RY
/CA
RR
OTS
RA
NC
H D
IP, F
FC
AK
E P
INE
AP
PLE
UP
SID
E
FRU
IT S
ALA
D fr
esh
FRU
IT S
HE
RB
ET:
4 fl
.oz.
MIL
K -
Var
iety
Nov
- 5
Fren
ch B
read
Che
esy
Piz
zaS
AN
DW
ICH
, STE
AK
W C
HE
CO
RN
CO
BB
ETT
CU
CU
MB
ER
SLI
CE
S
RA
NC
H D
IP, F
FH
ON
EY
DE
W M
ELO
NO
ATM
EA
L C
OO
KIE
SY
OG
UR
T - 4
oz
MIL
K -
Var
iety
*N/A
* - d
enot
es a
nut
rient
that
is e
ither
mis
sing
or i
ncom
plet
e fo
r an
indi
vidu
al in
gred
ient
.* -
den
otes
com
bine
d nu
trie
nt to
tals
with
eith
er m
issi
ng o
r inc
ompl
ete
nutr
ient
dat
a.
NO
TIC
E: T
he d
ata
cont
aine
d w
ithin
this
repo
rt a
nd th
e N
UTR
IKID
S® M
enu
Plan
ning
and
Nut
ritio
nal A
naly
sis
softw
are
shou
ld n
ot b
e us
ed fo
r and
doe
s no
t pro
vide
men
u pl
anni
ng fo
r a
child
with
a m
edic
al c
ondi
tion
or fo
od a
llerg
y. I
ngre
dien
ts a
nd m
enu
item
s ar
e su
bjec
t to
chan
ge o
r sub
stitu
tion
with
out n
otic
e. P
leas
e co
nsul
t a m
edic
al p
rofe
ssio
nal f
or a
ssis
tanc
e in
pl
anni
ng fo
r or t
reat
ing
med
ical
con
ditio
ns.
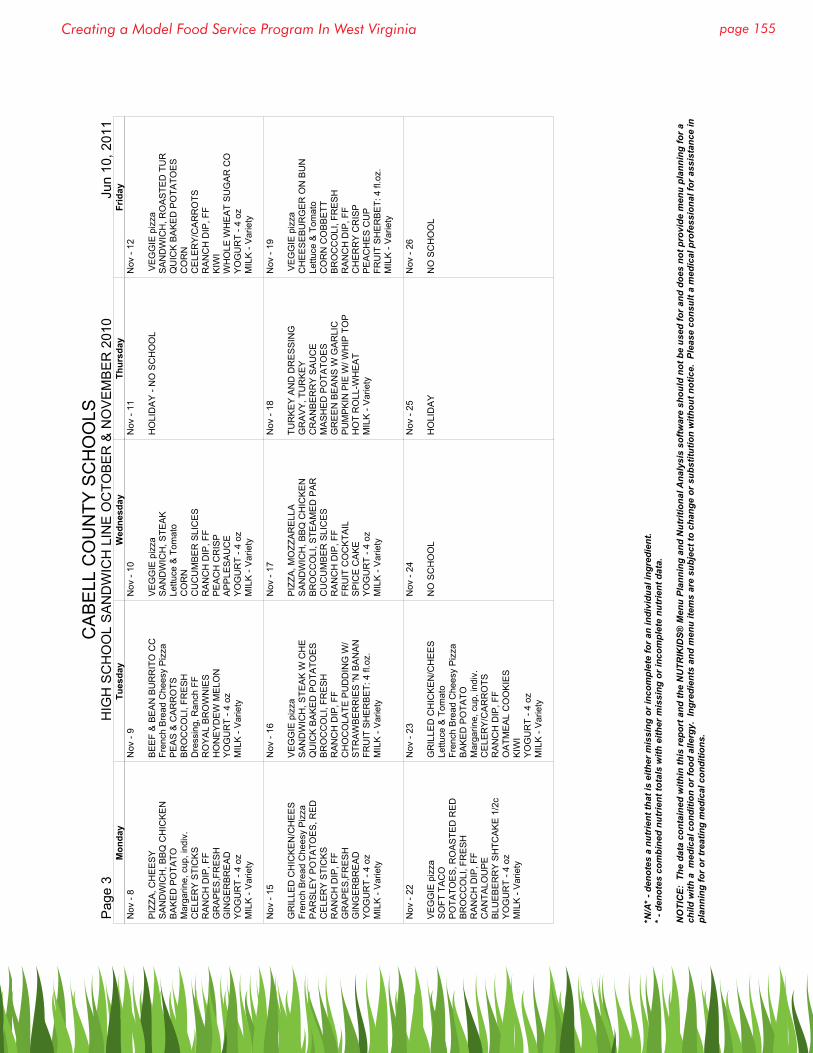
page 155Creating a Model Food Service Program In West Virginia
CA
BE
LL C
OU
NTY
SC
HO
OLS
Pag
e 3
HIG
H S
CH
OO
L S
AN
DW
ICH
LIN
E O
CTO
BE
R &
NO
VE
MB
ER
201
0 J
un 1
0, 2
011
Mon
day
Tues
day
Wed
nesd
ayTh
ursd
ayFr
iday
Nov
- 8
PIZ
ZA, C
HE
ES
YS
AN
DW
ICH
, BB
Q C
HIC
KE
NB
AK
ED
PO
TATO
Mar
garin
e, c
up, i
ndiv
.C
ELE
RY
STI
CK
S
RA
NC
H D
IP, F
FG
RA
PE
S,F
RE
SH
GIN
GE
RB
RE
AD
YO
GU
RT
- 4 o
zM
ILK
- V
arie
ty
Nov
- 9
BE
EF
& B
EA
N B
UR
RIT
O C
CFr
ench
Bre
ad C
hees
y P
izza
PE
AS
& C
AR
RO
TSB
RO
CC
OLI
, FR
ES
HD
ress
ing,
Ran
ch F
FR
OY
AL
BR
OW
NIE
SH
ON
EY
DE
W M
ELO
NY
OG
UR
T - 4
oz
MIL
K -
Var
iety
Nov
- 10
VE
GG
IE p
izza
SA
ND
WIC
H, S
TEA
KLe
ttuce
& T
omat
oC
OR
NC
UC
UM
BE
R S
LIC
ES
R
AN
CH
DIP
, FF
PE
AC
H C
RIS
PA
PP
LES
AU
CE
YO
GU
RT
- 4 o
zM
ILK
- V
arie
ty
Nov
- 11
HO
LID
AY
- N
O S
CH
OO
L
Nov
- 12
VE
GG
IE p
izza
SA
ND
WIC
H, R
OA
STE
D T
UR
QU
ICK
BA
KE
D P
OTA
TOE
SC
OR
NC
ELE
RY
/CA
RR
OTS
RA
NC
H D
IP, F
FK
IWI
WH
OLE
WH
EA
T S
UG
AR
CO
YO
GU
RT
- 4 o
zM
ILK
- V
arie
ty
Nov
- 15
GR
ILLE
D C
HIC
KE
N/C
HE
ES
Fr
ench
Bre
ad C
hees
y P
izza
PA
RS
LEY
PO
TATO
ES
, RE
DC
ELE
RY
STI
CK
S
RA
NC
H D
IP, F
FG
RA
PE
S,F
RE
SH
GIN
GE
RB
RE
AD
YO
GU
RT
- 4 o
zM
ILK
- V
arie
ty
Nov
- 16
VE
GG
IE p
izza
SA
ND
WIC
H, S
TEA
K W
CH
EQ
UIC
K B
AK
ED
PO
TATO
ES
BR
OC
CO
LI, F
RE
SH
RA
NC
H D
IP, F
FC
HO
CO
LATE
PU
DD
ING
W/
STR
AW
BE
RR
IES
'N B
AN
AN
FRU
IT S
HE
RB
ET:
4 fl
.oz.
MIL
K -
Var
iety
Nov
- 17
PIZ
ZA, M
OZZ
AR
ELL
AS
AN
DW
ICH
, BB
Q C
HIC
KE
NB
RO
CC
OLI
, STE
AM
ED
PA
RC
UC
UM
BE
R S
LIC
ES
R
AN
CH
DIP
, FF
FRU
IT C
OC
KTA
ILS
PIC
E C
AK
EY
OG
UR
T - 4
oz
MIL
K -
Var
iety
Nov
- 18
TUR
KE
Y A
ND
DR
ES
SIN
G
GR
AV
Y, T
UR
KE
YC
RA
NB
ER
RY
SA
UC
EM
AS
HE
D P
OTA
TOE
SG
RE
EN
BE
AN
S W
GA
RLI
CP
UM
PK
IN P
IE W
/ WH
IP T
OP
HO
T R
OLL
-WH
EA
T M
ILK
- V
arie
ty
Nov
- 19
VE
GG
IE p
izza
CH
EE
SE
BU
RG
ER
ON
BU
NLe
ttuce
& T
omat
oC
OR
N C
OB
BE
TTB
RO
CC
OLI
, FR
ES
HR
AN
CH
DIP
, FF
CH
ER
RY
CR
ISP
PE
AC
HE
S C
UP
FRU
IT S
HE
RB
ET:
4 fl
.oz.
MIL
K -
Var
iety
Nov
- 22
VE
GG
IE p
izza
SO
FT T
AC
OP
OTA
TOE
S, R
OA
STE
D R
ED
BR
OC
CO
LI, F
RE
SH
RA
NC
H D
IP, F
FC
AN
TALO
UP
EB
LUE
BE
RR
Y S
HTC
AK
E 1
/2c
YO
GU
RT
- 4 o
zM
ILK
- V
arie
ty
Nov
- 23
GR
ILLE
D C
HIC
KE
N/C
HE
ES
Le
ttuce
& T
omat
oFr
ench
Bre
ad C
hees
y P
izza
BA
KE
D P
OTA
TOM
arga
rine,
cup
, ind
iv.
CE
LER
Y/C
AR
RO
TSR
AN
CH
DIP
, FF
OA
TME
AL
CO
OK
IES
KIW
IY
OG
UR
T - 4
oz
MIL
K -
Var
iety
Nov
- 24
NO
SC
HO
OL
Nov
- 25
HO
LID
AY
Nov
- 26
NO
SC
HO
OL
*N/A
* - d
enot
es a
nut
rient
that
is e
ither
mis
sing
or i
ncom
plet
e fo
r an
indi
vidu
al in
gred
ient
.* -
den
otes
com
bine
d nu
trie
nt to
tals
with
eith
er m
issi
ng o
r inc
ompl
ete
nutr
ient
dat
a.
NO
TIC
E: T
he d
ata
cont
aine
d w
ithin
this
repo
rt a
nd th
e N
UTR
IKID
S® M
enu
Plan
ning
and
Nut
ritio
nal A
naly
sis
softw
are
shou
ld n
ot b
e us
ed fo
r and
doe
s no
t pro
vide
men
u pl
anni
ng fo
r a
child
with
a m
edic
al c
ondi
tion
or fo
od a
llerg
y. I
ngre
dien
ts a
nd m
enu
item
s ar
e su
bjec
t to
chan
ge o
r sub
stitu
tion
with
out n
otic
e. P
leas
e co
nsul
t a m
edic
al p
rofe
ssio
nal f
or a
ssis
tanc
e in
pl
anni
ng fo
r or t
reat
ing
med
ical
con
ditio
ns.
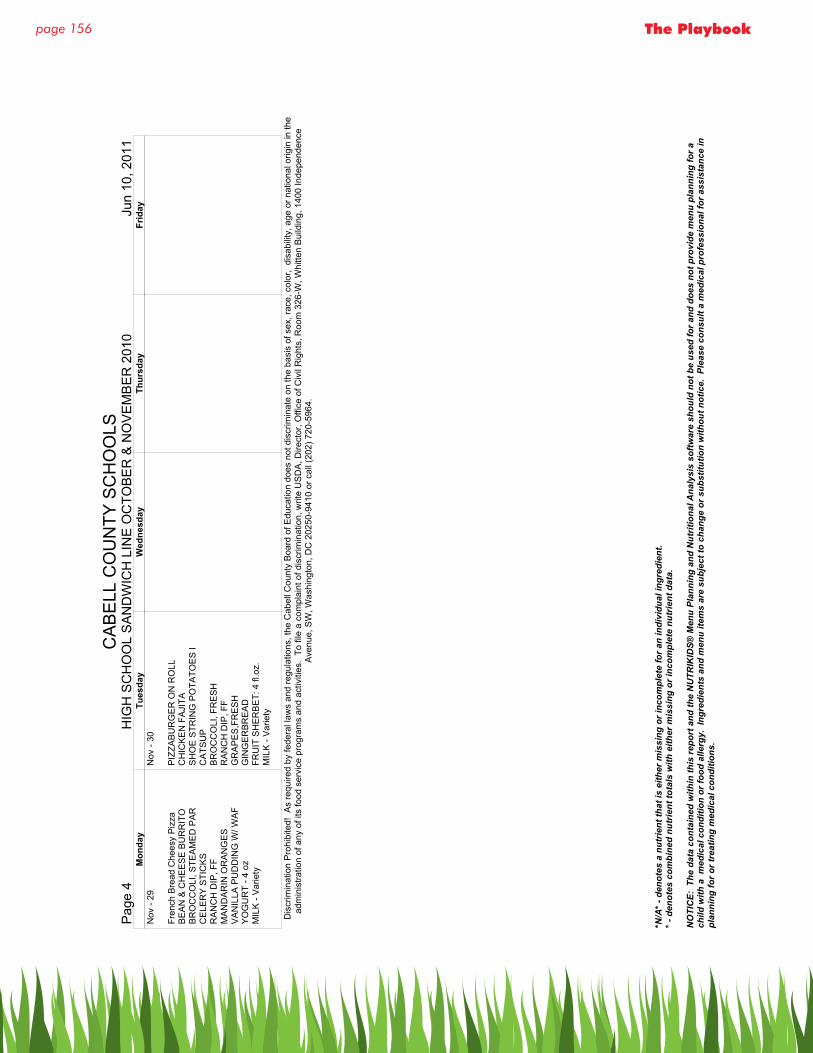
page 156 The Playbook
CA
BE
LL C
OU
NTY
SC
HO
OLS
Pag
e 4
HIG
H S
CH
OO
L S
AN
DW
ICH
LIN
E O
CTO
BE
R &
NO
VE
MB
ER
201
0 J
un 1
0, 2
011
Mon
day
Tues
day
Wed
nesd
ayTh
ursd
ayFr
iday
Nov
- 29
Fren
ch B
read
Che
esy
Piz
zaB
EA
N &
CH
EE
SE
BU
RR
ITO
BR
OC
CO
LI, S
TEA
ME
D P
AR
CE
LER
Y S
TIC
KS
R
AN
CH
DIP
, FF
MA
ND
AR
IN O
RA
NG
ES
VA
NIL
LA P
UD
DIN
G W
/ WA
FY
OG
UR
T - 4
oz
MIL
K -
Var
iety
Nov
- 30
PIZ
ZAB
UR
GE
R O
N R
OLL
CH
ICK
EN
FA
JITA
SH
OE
STR
ING
PO
TATO
ES
IC
ATS
UP
BR
OC
CO
LI, F
RE
SH
RA
NC
H D
IP, F
FG
RA
PE
S,F
RE
SH
GIN
GE
RB
RE
AD
FRU
IT S
HE
RB
ET:
4 fl
.oz.
MIL
K -
Var
iety
Dis
crim
inat
ion
Pro
hibi
ted!
As
requ
ired
by fe
dera
l law
s an
d re
gula
tions
, the
Cab
ell C
ount
y B
oard
of E
duca
tion
does
not
dis
crim
inat
e on
the
basi
s of
sex
, rac
e, c
olor
, di
sabi
lity,
age
or n
atio
nal o
rigin
in th
ead
min
istra
tion
of a
ny o
f its
food
ser
vice
pro
gram
s an
d ac
tiviti
es.
To fi
le a
com
plai
nt o
f dis
crim
inat
ion,
writ
e U
SD
A, D
irect
or, O
ffice
of C
ivil
Rig
hts,
Roo
m 3
26-W
, Whi
tten
Bui
ldin
g, 1
400
Inde
pend
ence
Ave
nue,
SW
, Was
hing
ton,
DC
202
50-9
410
or c
all (
202)
720
-596
4.
*N/A
* - d
enot
es a
nut
rient
that
is e
ither
mis
sing
or i
ncom
plet
e fo
r an
indi
vidu
al in
gred
ient
.* -
den
otes
com
bine
d nu
trie
nt to
tals
with
eith
er m
issi
ng o
r inc
ompl
ete
nutr
ient
dat
a.
NO
TIC
E: T
he d
ata
cont
aine
d w
ithin
this
repo
rt a
nd th
e N
UTR
IKID
S® M
enu
Plan
ning
and
Nut
ritio
nal A
naly
sis
softw
are
shou
ld n
ot b
e us
ed fo
r and
doe
s no
t pro
vide
men
u pl
anni
ng fo
r a
child
with
a m
edic
al c
ondi
tion
or fo
od a
llerg
y. I
ngre
dien
ts a
nd m
enu
item
s ar
e su
bjec
t to
chan
ge o
r sub
stitu
tion
with
out n
otic
e. P
leas
e co
nsul
t a m
edic
al p
rofe
ssio
nal f
or a
ssis
tanc
e in
pl
anni
ng fo
r or t
reat
ing
med
ical
con
ditio
ns.
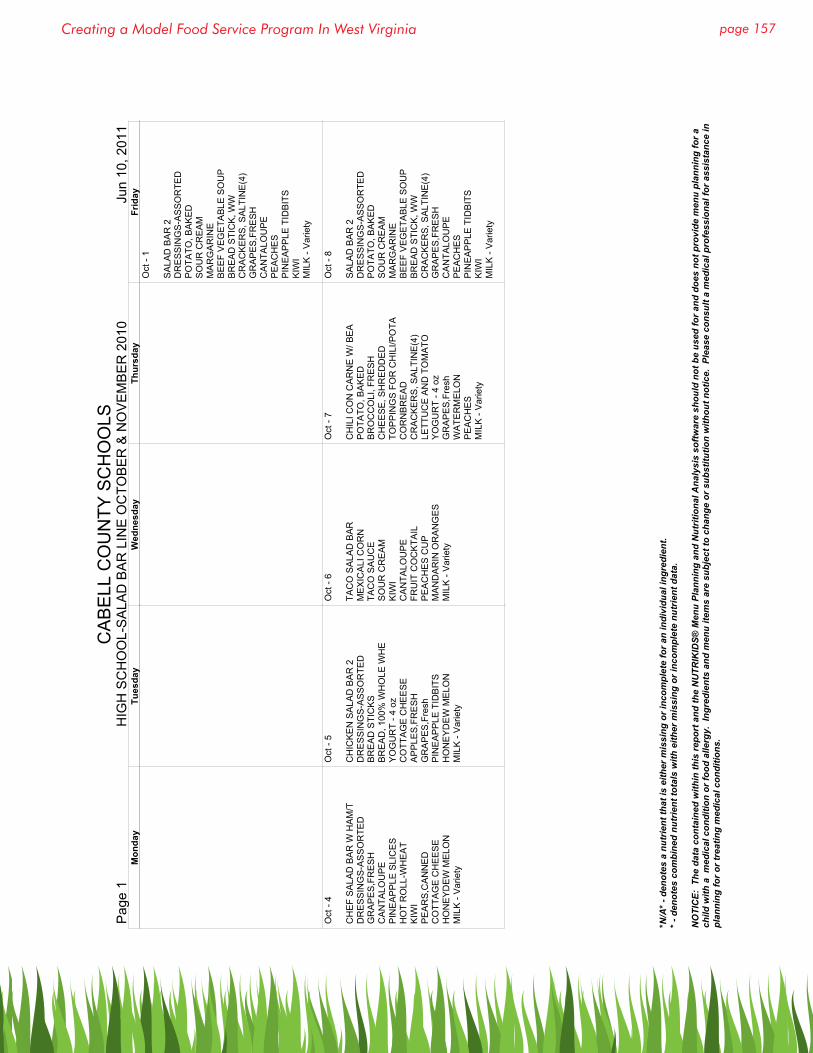
page 157Creating a Model Food Service Program In West Virginia
CA
BE
LL C
OU
NTY
SC
HO
OLS
Pag
e 1
HIG
H S
CH
OO
L-S
ALA
D B
AR
LIN
E O
CTO
BE
R &
NO
VE
MB
ER
201
0 J
un 1
0, 2
011
Mon
day
Tues
day
Wed
nesd
ayTh
ursd
ayFr
iday
Oct
- 1
SA
LAD
BA
R 2
DR
ES
SIN
GS
-AS
SO
RTE
DP
OTA
TO, B
AK
ED
S
OU
R C
RE
AM
MA
RG
AR
INE
BE
EF
VE
GE
TAB
LE S
OU
PB
RE
AD
STI
CK
, WW
CR
AC
KE
RS
, SA
LTIN
E(4
)G
RA
PE
S,F
RE
SH
CA
NTA
LOU
PE
PE
AC
HE
SP
INE
AP
PLE
TID
BIT
SK
IWI
MIL
K -
Var
iety
Oct
- 4
CH
EF
SA
LAD
BA
R W
HA
M/T
DR
ES
SIN
GS
-AS
SO
RTE
DG
RA
PE
S,F
RE
SH
CA
NTA
LOU
PE
PIN
EA
PP
LE S
LIC
ES
HO
T R
OLL
-WH
EA
T K
IWI
PE
AR
S,C
AN
NE
DC
OTT
AG
E C
HE
ES
EH
ON
EY
DE
W M
ELO
NM
ILK
- V
arie
ty
Oct
- 5
CH
ICK
EN
SA
LAD
BA
R 2
DR
ES
SIN
GS
-AS
SO
RTE
DB
RE
AD
STI
CK
SB
RE
AD
, 100
% W
HO
LE W
HE
YO
GU
RT
- 4 o
zC
OTT
AG
E C
HE
ES
EA
PP
LES
,FR
ES
HG
RA
PE
S,F
resh
PIN
EA
PP
LE T
IDB
ITS
HO
NE
YD
EW
ME
LON
MIL
K -
Var
iety
Oct
- 6
TAC
O S
ALA
D B
AR
ME
XIC
ALI
CO
RN
TA
CO
SA
UC
ES
OU
R C
RE
AM
KIW
IC
AN
TALO
UP
EFR
UIT
CO
CK
TAIL
PE
AC
HE
S C
UP
MA
ND
AR
IN O
RA
NG
ES
MIL
K -
Var
iety
Oct
- 7
CH
ILI C
ON
CA
RN
E W
/ BE
AP
OTA
TO, B
AK
ED
B
RO
CC
OLI
, FR
ES
HC
HE
ES
E, S
HR
ED
DE
DTO
PP
ING
S F
OR
CH
ILI/P
OTA
CO
RN
BR
EA
DC
RA
CK
ER
S, S
ALT
INE
(4)
LETT
UC
E A
ND
TO
MA
TOY
OG
UR
T - 4
oz
GR
AP
ES
,Fre
shW
ATE
RM
ELO
NP
EA
CH
ES
MIL
K -
Var
iety
Oct
- 8
SA
LAD
BA
R 2
DR
ES
SIN
GS
-AS
SO
RTE
DP
OTA
TO, B
AK
ED
S
OU
R C
RE
AM
MA
RG
AR
INE
BE
EF
VE
GE
TAB
LE S
OU
PB
RE
AD
STI
CK
, WW
CR
AC
KE
RS
, SA
LTIN
E(4
)G
RA
PE
S,F
RE
SH
CA
NTA
LOU
PE
PE
AC
HE
SP
INE
AP
PLE
TID
BIT
SK
IWI
MIL
K -
Var
iety
*N/A
* - d
enot
es a
nut
rient
that
is e
ither
mis
sing
or i
ncom
plet
e fo
r an
indi
vidu
al in
gred
ient
.* -
den
otes
com
bine
d nu
trie
nt to
tals
with
eith
er m
issi
ng o
r inc
ompl
ete
nutr
ient
dat
a.
NO
TIC
E: T
he d
ata
cont
aine
d w
ithin
this
repo
rt a
nd th
e N
UTR
IKID
S® M
enu
Plan
ning
and
Nut
ritio
nal A
naly
sis
softw
are
shou
ld n
ot b
e us
ed fo
r and
doe
s no
t pro
vide
men
u pl
anni
ng fo
r a
child
with
a m
edic
al c
ondi
tion
or fo
od a
llerg
y. I
ngre
dien
ts a
nd m
enu
item
s ar
e su
bjec
t to
chan
ge o
r sub
stitu
tion
with
out n
otic
e. P
leas
e co
nsul
t a m
edic
al p
rofe
ssio
nal f
or a
ssis
tanc
e in
pl
anni
ng fo
r or t
reat
ing
med
ical
con
ditio
ns.
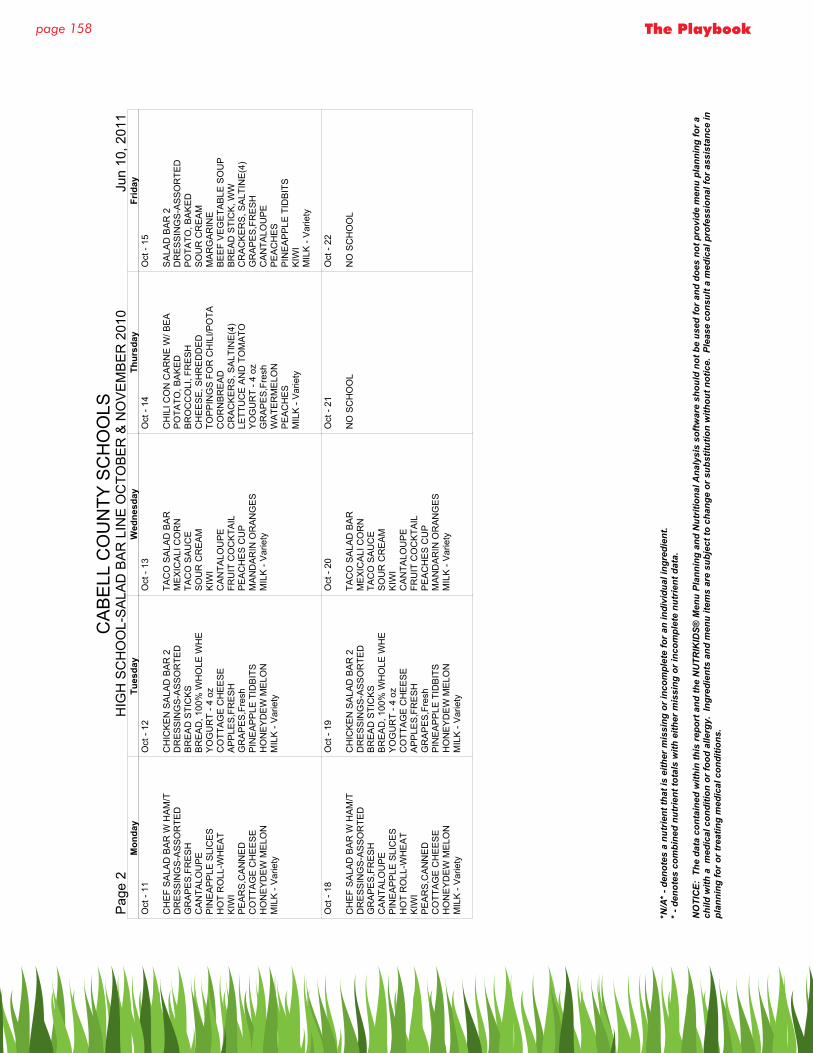
page 158 The Playbook
CA
BE
LL C
OU
NTY
SC
HO
OLS
Pag
e 2
HIG
H S
CH
OO
L-S
ALA
D B
AR
LIN
E O
CTO
BE
R &
NO
VE
MB
ER
201
0 J
un 1
0, 2
011
Mon
day
Tues
day
Wed
nesd
ayTh
ursd
ayFr
iday
Oct
- 11
CH
EF
SA
LAD
BA
R W
HA
M/T
DR
ES
SIN
GS
-AS
SO
RTE
DG
RA
PE
S,F
RE
SH
CA
NTA
LOU
PE
PIN
EA
PP
LE S
LIC
ES
HO
T R
OLL
-WH
EA
T K
IWI
PE
AR
S,C
AN
NE
DC
OTT
AG
E C
HE
ES
EH
ON
EY
DE
W M
ELO
NM
ILK
- V
arie
ty
Oct
- 12
CH
ICK
EN
SA
LAD
BA
R 2
DR
ES
SIN
GS
-AS
SO
RTE
DB
RE
AD
STI
CK
SB
RE
AD
, 100
% W
HO
LE W
HE
YO
GU
RT
- 4 o
zC
OTT
AG
E C
HE
ES
EA
PP
LES
,FR
ES
HG
RA
PE
S,F
resh
PIN
EA
PP
LE T
IDB
ITS
HO
NE
YD
EW
ME
LON
MIL
K -
Var
iety
Oct
- 13
TAC
O S
ALA
D B
AR
ME
XIC
ALI
CO
RN
TA
CO
SA
UC
ES
OU
R C
RE
AM
KIW
IC
AN
TALO
UP
EFR
UIT
CO
CK
TAIL
PE
AC
HE
S C
UP
MA
ND
AR
IN O
RA
NG
ES
MIL
K -
Var
iety
Oct
- 14
CH
ILI C
ON
CA
RN
E W
/ BE
AP
OTA
TO, B
AK
ED
B
RO
CC
OLI
, FR
ES
HC
HE
ES
E, S
HR
ED
DE
DTO
PP
ING
S F
OR
CH
ILI/P
OTA
CO
RN
BR
EA
DC
RA
CK
ER
S, S
ALT
INE
(4)
LETT
UC
E A
ND
TO
MA
TOY
OG
UR
T - 4
oz
GR
AP
ES
,Fre
shW
ATE
RM
ELO
NP
EA
CH
ES
MIL
K -
Var
iety
Oct
- 15
SA
LAD
BA
R 2
DR
ES
SIN
GS
-AS
SO
RTE
DP
OTA
TO, B
AK
ED
S
OU
R C
RE
AM
MA
RG
AR
INE
BE
EF
VE
GE
TAB
LE S
OU
PB
RE
AD
STI
CK
, WW
CR
AC
KE
RS
, SA
LTIN
E(4
)G
RA
PE
S,F
RE
SH
CA
NTA
LOU
PE
PE
AC
HE
SP
INE
AP
PLE
TID
BIT
SK
IWI
MIL
K -
Var
iety
Oct
- 18
CH
EF
SA
LAD
BA
R W
HA
M/T
DR
ES
SIN
GS
-AS
SO
RTE
DG
RA
PE
S,F
RE
SH
CA
NTA
LOU
PE
PIN
EA
PP
LE S
LIC
ES
HO
T R
OLL
-WH
EA
T K
IWI
PE
AR
S,C
AN
NE
DC
OTT
AG
E C
HE
ES
EH
ON
EY
DE
W M
ELO
NM
ILK
- V
arie
ty
Oct
- 19
CH
ICK
EN
SA
LAD
BA
R 2
DR
ES
SIN
GS
-AS
SO
RTE
DB
RE
AD
STI
CK
SB
RE
AD
, 100
% W
HO
LE W
HE
YO
GU
RT
- 4 o
zC
OTT
AG
E C
HE
ES
EA
PP
LES
,FR
ES
HG
RA
PE
S,F
resh
PIN
EA
PP
LE T
IDB
ITS
HO
NE
YD
EW
ME
LON
MIL
K -
Var
iety
Oct
- 20
TAC
O S
ALA
D B
AR
ME
XIC
ALI
CO
RN
TA
CO
SA
UC
ES
OU
R C
RE
AM
KIW
IC
AN
TALO
UP
EFR
UIT
CO
CK
TAIL
PE
AC
HE
S C
UP
MA
ND
AR
IN O
RA
NG
ES
MIL
K -
Var
iety
Oct
- 21
NO
SC
HO
OL
Oct
- 22
NO
SC
HO
OL
*N/A
* - d
enot
es a
nut
rient
that
is e
ither
mis
sing
or i
ncom
plet
e fo
r an
indi
vidu
al in
gred
ient
.* -
den
otes
com
bine
d nu
trie
nt to
tals
with
eith
er m
issi
ng o
r inc
ompl
ete
nutr
ient
dat
a.
NO
TIC
E: T
he d
ata
cont
aine
d w
ithin
this
repo
rt a
nd th
e N
UTR
IKID
S® M
enu
Plan
ning
and
Nut
ritio
nal A
naly
sis
softw
are
shou
ld n
ot b
e us
ed fo
r and
doe
s no
t pro
vide
men
u pl
anni
ng fo
r a
child
with
a m
edic
al c
ondi
tion
or fo
od a
llerg
y. I
ngre
dien
ts a
nd m
enu
item
s ar
e su
bjec
t to
chan
ge o
r sub
stitu
tion
with
out n
otic
e. P
leas
e co
nsul
t a m
edic
al p
rofe
ssio
nal f
or a
ssis
tanc
e in
pl
anni
ng fo
r or t
reat
ing
med
ical
con
ditio
ns.

page 159Creating a Model Food Service Program In West Virginia
CA
BE
LL C
OU
NTY
SC
HO
OLS
Pag
e 3
HIG
H S
CH
OO
L-S
ALA
D B
AR
LIN
E O
CTO
BE
R &
NO
VE
MB
ER
201
0 J
un 1
0, 2
011
Mon
day
Tues
day
Wed
nesd
ayTh
ursd
ayFr
iday
Oct
- 25
CH
EF
SA
LAD
BA
R W
HA
M/T
DR
ES
SIN
GS
-AS
SO
RTE
DG
RA
PE
S,F
RE
SH
CA
NTA
LOU
PE
PIN
EA
PP
LE S
LIC
ES
HO
T R
OLL
-WH
EA
T K
IWI
PE
AR
S,C
AN
NE
DC
OTT
AG
E C
HE
ES
EH
ON
EY
DE
W M
ELO
NM
ILK
- V
arie
ty
Oct
- 26
CH
ICK
EN
SA
LAD
BA
R 2
DR
ES
SIN
GS
-AS
SO
RTE
DB
RE
AD
STI
CK
SB
RE
AD
, 100
% W
HO
LE W
HE
YO
GU
RT
- 4 o
zC
OTT
AG
E C
HE
ES
EA
PP
LES
,FR
ES
HG
RA
PE
S,F
resh
PIN
EA
PP
LE T
IDB
ITS
HO
NE
YD
EW
ME
LON
MIL
K -
Var
iety
Oct
- 27
TAC
O S
ALA
D B
AR
ME
XIC
ALI
CO
RN
TA
CO
SA
UC
ES
OU
R C
RE
AM
KIW
IC
AN
TALO
UP
EFR
UIT
CO
CK
TAIL
PE
AC
HE
S C
UP
MA
ND
AR
IN O
RA
NG
ES
MIL
K -
Var
iety
Oct
- 28
CH
ILI C
ON
CA
RN
E W
/ BE
AP
OTA
TO, B
AK
ED
B
RO
CC
OLI
, FR
ES
HC
HE
ES
E, S
HR
ED
DE
DTO
PP
ING
S F
OR
CH
ILI/P
OTA
CO
RN
BR
EA
DC
RA
CK
ER
S, S
ALT
INE
(4)
LETT
UC
E A
ND
TO
MA
TOY
OG
UR
T - 4
oz
GR
AP
ES
,Fre
shW
ATE
RM
ELO
NP
EA
CH
ES
MIL
K -
Var
iety
Oct
- 29
SA
LAD
BA
R 2
DR
ES
SIN
GS
-AS
SO
RTE
DP
OTA
TO, B
AK
ED
S
OU
R C
RE
AM
MA
RG
AR
INE
BE
EF
VE
GE
TAB
LE S
OU
PB
RE
AD
STI
CK
, WW
CR
AC
KE
RS
, SA
LTIN
E(4
)G
RA
PE
S,F
RE
SH
CA
NTA
LOU
PE
PE
AC
HE
SP
INE
AP
PLE
TID
BIT
SK
IWI
MIL
K -
Var
iety
Nov
- 1
CH
EF
SA
LAD
BA
R W
HA
M/T
DR
ES
SIN
GS
-AS
SO
RTE
DG
RA
PE
S,F
RE
SH
CA
NTA
LOU
PE
PIN
EA
PP
LE S
LIC
ES
HO
T R
OLL
-WH
EA
T K
IWI
PE
AR
S,C
AN
NE
DC
OTT
AG
E C
HE
ES
EH
ON
EY
DE
W M
ELO
NM
ILK
- V
arie
ty
Nov
- 2
ELE
CTI
ON
- N
O S
CH
OO
L
Nov
- 3
TAC
O S
ALA
D B
AR
ME
XIC
ALI
CO
RN
TA
CO
SA
UC
ES
OU
R C
RE
AM
KIW
IC
AN
TALO
UP
EFR
UIT
CO
CK
TAIL
PE
AC
HE
S C
UP
MA
ND
AR
IN O
RA
NG
ES
MIL
K -
Var
iety
Nov
- 4
CH
ILI C
ON
CA
RN
E W
/ BE
AP
OTA
TO, B
AK
ED
B
RO
CC
OLI
, FR
ES
HC
HE
ES
E, S
HR
ED
DE
DTO
PP
ING
S F
OR
CH
ILI/P
OTA
CO
RN
BR
EA
DC
RA
CK
ER
S, S
ALT
INE
(4)
LETT
UC
E A
ND
TO
MA
TOY
OG
UR
T - 4
oz
GR
AP
ES
,Fre
shW
ATE
RM
ELO
NP
EA
CH
ES
MIL
K -
Var
iety
Nov
- 5
SA
LAD
BA
R 2
DR
ES
SIN
GS
-AS
SO
RTE
DP
OTA
TO, B
AK
ED
S
OU
R C
RE
AM
MA
RG
AR
INE
BE
EF
VE
GE
TAB
LE S
OU
PB
RE
AD
STI
CK
, WW
CR
AC
KE
RS
, SA
LTIN
E(4
)G
RA
PE
S,F
RE
SH
CA
NTA
LOU
PE
PE
AC
HE
SP
INE
AP
PLE
TID
BIT
SK
IWI
MIL
K -
Var
iety
*N/A
* - d
enot
es a
nut
rient
that
is e
ither
mis
sing
or i
ncom
plet
e fo
r an
indi
vidu
al in
gred
ient
.* -
den
otes
com
bine
d nu
trie
nt to
tals
with
eith
er m
issi
ng o
r inc
ompl
ete
nutr
ient
dat
a.
NO
TIC
E: T
he d
ata
cont
aine
d w
ithin
this
repo
rt a
nd th
e N
UTR
IKID
S® M
enu
Plan
ning
and
Nut
ritio
nal A
naly
sis
softw
are
shou
ld n
ot b
e us
ed fo
r and
doe
s no
t pro
vide
men
u pl
anni
ng fo
r a
child
with
a m
edic
al c
ondi
tion
or fo
od a
llerg
y. I
ngre
dien
ts a
nd m
enu
item
s ar
e su
bjec
t to
chan
ge o
r sub
stitu
tion
with
out n
otic
e. P
leas
e co
nsul
t a m
edic
al p
rofe
ssio
nal f
or a
ssis
tanc
e in
pl
anni
ng fo
r or t
reat
ing
med
ical
con
ditio
ns.
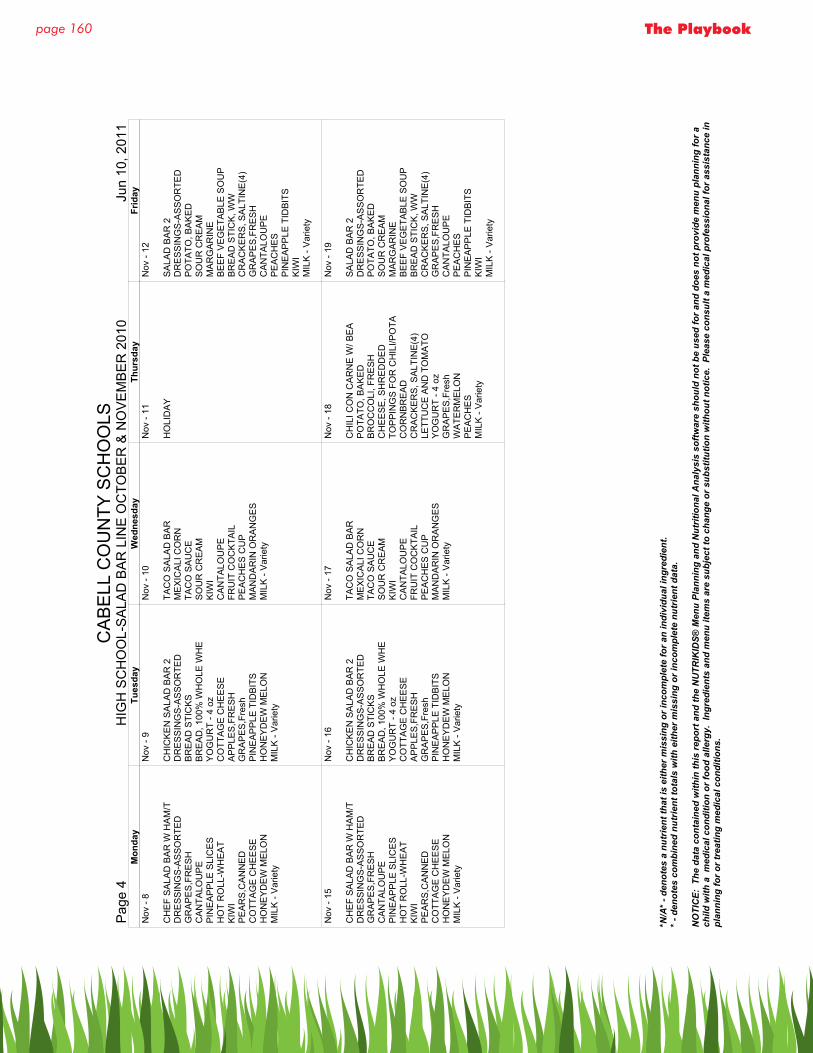
page 160 The Playbook
CA
BE
LL C
OU
NTY
SC
HO
OLS
Pag
e 4
HIG
H S
CH
OO
L-S
ALA
D B
AR
LIN
E O
CTO
BE
R &
NO
VE
MB
ER
201
0 J
un 1
0, 2
011
Mon
day
Tues
day
Wed
nesd
ayTh
ursd
ayFr
iday
Nov
- 8
CH
EF
SA
LAD
BA
R W
HA
M/T
DR
ES
SIN
GS
-AS
SO
RTE
DG
RA
PE
S,F
RE
SH
CA
NTA
LOU
PE
PIN
EA
PP
LE S
LIC
ES
HO
T R
OLL
-WH
EA
T K
IWI
PE
AR
S,C
AN
NE
DC
OTT
AG
E C
HE
ES
EH
ON
EY
DE
W M
ELO
NM
ILK
- V
arie
ty
Nov
- 9
CH
ICK
EN
SA
LAD
BA
R 2
DR
ES
SIN
GS
-AS
SO
RTE
DB
RE
AD
STI
CK
SB
RE
AD
, 100
% W
HO
LE W
HE
YO
GU
RT
- 4 o
zC
OTT
AG
E C
HE
ES
EA
PP
LES
,FR
ES
HG
RA
PE
S,F
resh
PIN
EA
PP
LE T
IDB
ITS
HO
NE
YD
EW
ME
LON
MIL
K -
Var
iety
Nov
- 10
TAC
O S
ALA
D B
AR
ME
XIC
ALI
CO
RN
TA
CO
SA
UC
ES
OU
R C
RE
AM
KIW
IC
AN
TALO
UP
EFR
UIT
CO
CK
TAIL
PE
AC
HE
S C
UP
MA
ND
AR
IN O
RA
NG
ES
MIL
K -
Var
iety
Nov
- 11
HO
LID
AY
Nov
- 12
SA
LAD
BA
R 2
DR
ES
SIN
GS
-AS
SO
RTE
DP
OTA
TO, B
AK
ED
S
OU
R C
RE
AM
MA
RG
AR
INE
BE
EF
VE
GE
TAB
LE S
OU
PB
RE
AD
STI
CK
, WW
CR
AC
KE
RS
, SA
LTIN
E(4
)G
RA
PE
S,F
RE
SH
CA
NTA
LOU
PE
PE
AC
HE
SP
INE
AP
PLE
TID
BIT
SK
IWI
MIL
K -
Var
iety
Nov
- 15
CH
EF
SA
LAD
BA
R W
HA
M/T
DR
ES
SIN
GS
-AS
SO
RTE
DG
RA
PE
S,F
RE
SH
CA
NTA
LOU
PE
PIN
EA
PP
LE S
LIC
ES
HO
T R
OLL
-WH
EA
T K
IWI
PE
AR
S,C
AN
NE
DC
OTT
AG
E C
HE
ES
EH
ON
EY
DE
W M
ELO
NM
ILK
- V
arie
ty
Nov
- 16
CH
ICK
EN
SA
LAD
BA
R 2
DR
ES
SIN
GS
-AS
SO
RTE
DB
RE
AD
STI
CK
SB
RE
AD
, 100
% W
HO
LE W
HE
YO
GU
RT
- 4 o
zC
OTT
AG
E C
HE
ES
EA
PP
LES
,FR
ES
HG
RA
PE
S,F
resh
PIN
EA
PP
LE T
IDB
ITS
HO
NE
YD
EW
ME
LON
MIL
K -
Var
iety
Nov
- 17
TAC
O S
ALA
D B
AR
ME
XIC
ALI
CO
RN
TA
CO
SA
UC
ES
OU
R C
RE
AM
KIW
IC
AN
TALO
UP
EFR
UIT
CO
CK
TAIL
PE
AC
HE
S C
UP
MA
ND
AR
IN O
RA
NG
ES
MIL
K -
Var
iety
Nov
- 18
CH
ILI C
ON
CA
RN
E W
/ BE
AP
OTA
TO, B
AK
ED
B
RO
CC
OLI
, FR
ES
HC
HE
ES
E, S
HR
ED
DE
DTO
PP
ING
S F
OR
CH
ILI/P
OTA
CO
RN
BR
EA
DC
RA
CK
ER
S, S
ALT
INE
(4)
LETT
UC
E A
ND
TO
MA
TOY
OG
UR
T - 4
oz
GR
AP
ES
,Fre
shW
ATE
RM
ELO
NP
EA
CH
ES
MIL
K -
Var
iety
Nov
- 19
SA
LAD
BA
R 2
DR
ES
SIN
GS
-AS
SO
RTE
DP
OTA
TO, B
AK
ED
S
OU
R C
RE
AM
MA
RG
AR
INE
BE
EF
VE
GE
TAB
LE S
OU
PB
RE
AD
STI
CK
, WW
CR
AC
KE
RS
, SA
LTIN
E(4
)G
RA
PE
S,F
RE
SH
CA
NTA
LOU
PE
PE
AC
HE
SP
INE
AP
PLE
TID
BIT
SK
IWI
MIL
K -
Var
iety
*N/A
* - d
enot
es a
nut
rient
that
is e
ither
mis
sing
or i
ncom
plet
e fo
r an
indi
vidu
al in
gred
ient
.* -
den
otes
com
bine
d nu
trie
nt to
tals
with
eith
er m
issi
ng o
r inc
ompl
ete
nutr
ient
dat
a.
NO
TIC
E: T
he d
ata
cont
aine
d w
ithin
this
repo
rt a
nd th
e N
UTR
IKID
S® M
enu
Plan
ning
and
Nut
ritio
nal A
naly
sis
softw
are
shou
ld n
ot b
e us
ed fo
r and
doe
s no
t pro
vide
men
u pl
anni
ng fo
r a
child
with
a m
edic
al c
ondi
tion
or fo
od a
llerg
y. I
ngre
dien
ts a
nd m
enu
item
s ar
e su
bjec
t to
chan
ge o
r sub
stitu
tion
with
out n
otic
e. P
leas
e co
nsul
t a m
edic
al p
rofe
ssio
nal f
or a
ssis
tanc
e in
pl
anni
ng fo
r or t
reat
ing
med
ical
con
ditio
ns.
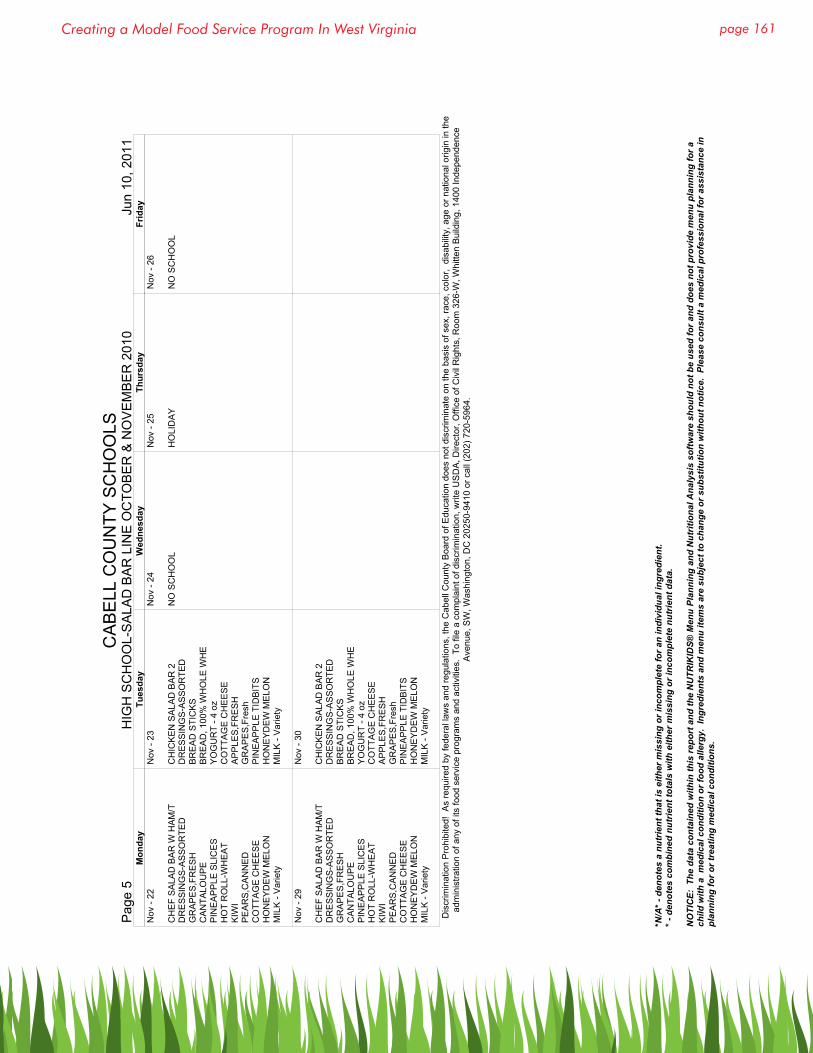
page 161Creating a Model Food Service Program In West Virginia
CA
BE
LL C
OU
NTY
SC
HO
OLS
Pag
e 5
HIG
H S
CH
OO
L-S
ALA
D B
AR
LIN
E O
CTO
BE
R &
NO
VE
MB
ER
201
0 J
un 1
0, 2
011
Mon
day
Tues
day
Wed
nesd
ayTh
ursd
ayFr
iday
Nov
- 22
CH
EF
SA
LAD
BA
R W
HA
M/T
DR
ES
SIN
GS
-AS
SO
RTE
DG
RA
PE
S,F
RE
SH
CA
NTA
LOU
PE
PIN
EA
PP
LE S
LIC
ES
HO
T R
OLL
-WH
EA
T K
IWI
PE
AR
S,C
AN
NE
DC
OTT
AG
E C
HE
ES
EH
ON
EY
DE
W M
ELO
NM
ILK
- V
arie
ty
Nov
- 23
CH
ICK
EN
SA
LAD
BA
R 2
DR
ES
SIN
GS
-AS
SO
RTE
DB
RE
AD
STI
CK
SB
RE
AD
, 100
% W
HO
LE W
HE
YO
GU
RT
- 4 o
zC
OTT
AG
E C
HE
ES
EA
PP
LES
,FR
ES
HG
RA
PE
S,F
resh
PIN
EA
PP
LE T
IDB
ITS
HO
NE
YD
EW
ME
LON
MIL
K -
Var
iety
Nov
- 24
NO
SC
HO
OL
Nov
- 25
HO
LID
AY
Nov
- 26
NO
SC
HO
OL
Nov
- 29
CH
EF
SA
LAD
BA
R W
HA
M/T
DR
ES
SIN
GS
-AS
SO
RTE
DG
RA
PE
S,F
RE
SH
CA
NTA
LOU
PE
PIN
EA
PP
LE S
LIC
ES
HO
T R
OLL
-WH
EA
T K
IWI
PE
AR
S,C
AN
NE
DC
OTT
AG
E C
HE
ES
EH
ON
EY
DE
W M
ELO
NM
ILK
- V
arie
ty
Nov
- 30
CH
ICK
EN
SA
LAD
BA
R 2
DR
ES
SIN
GS
-AS
SO
RTE
DB
RE
AD
STI
CK
SB
RE
AD
, 100
% W
HO
LE W
HE
YO
GU
RT
- 4 o
zC
OTT
AG
E C
HE
ES
EA
PP
LES
,FR
ES
HG
RA
PE
S,F
resh
PIN
EA
PP
LE T
IDB
ITS
HO
NE
YD
EW
ME
LON
MIL
K -
Var
iety
Dis
crim
inat
ion
Pro
hibi
ted!
As
requ
ired
by fe
dera
l law
s an
d re
gula
tions
, the
Cab
ell C
ount
y B
oard
of E
duca
tion
does
not
dis
crim
inat
e on
the
basi
s of
sex
, rac
e, c
olor
, di
sabi
lity,
age
or n
atio
nal o
rigin
in th
ead
min
istra
tion
of a
ny o
f its
food
ser
vice
pro
gram
s an
d ac
tiviti
es.
To fi
le a
com
plai
nt o
f dis
crim
inat
ion,
writ
e U
SD
A, D
irect
or, O
ffice
of C
ivil
Rig
hts,
Roo
m 3
26-W
, Whi
tten
Bui
ldin
g, 1
400
Inde
pend
ence
Ave
nue,
SW
, Was
hing
ton,
DC
202
50-9
410
or c
all (
202)
720
-596
4.
*N/A
* - d
enot
es a
nut
rient
that
is e
ither
mis
sing
or i
ncom
plet
e fo
r an
indi
vidu
al in
gred
ient
.* -
den
otes
com
bine
d nu
trie
nt to
tals
with
eith
er m
issi
ng o
r inc
ompl
ete
nutr
ient
dat
a.
NO
TIC
E: T
he d
ata
cont
aine
d w
ithin
this
repo
rt a
nd th
e N
UTR
IKID
S® M
enu
Plan
ning
and
Nut
ritio
nal A
naly
sis
softw
are
shou
ld n
ot b
e us
ed fo
r and
doe
s no
t pro
vide
men
u pl
anni
ng fo
r a
child
with
a m
edic
al c
ondi
tion
or fo
od a
llerg
y. I
ngre
dien
ts a
nd m
enu
item
s ar
e su
bjec
t to
chan
ge o
r sub
stitu
tion
with
out n
otic
e. P
leas
e co
nsul
t a m
edic
al p
rofe
ssio
nal f
or a
ssis
tanc
e in
pl
anni
ng fo
r or t
reat
ing
med
ical
con
ditio
ns.
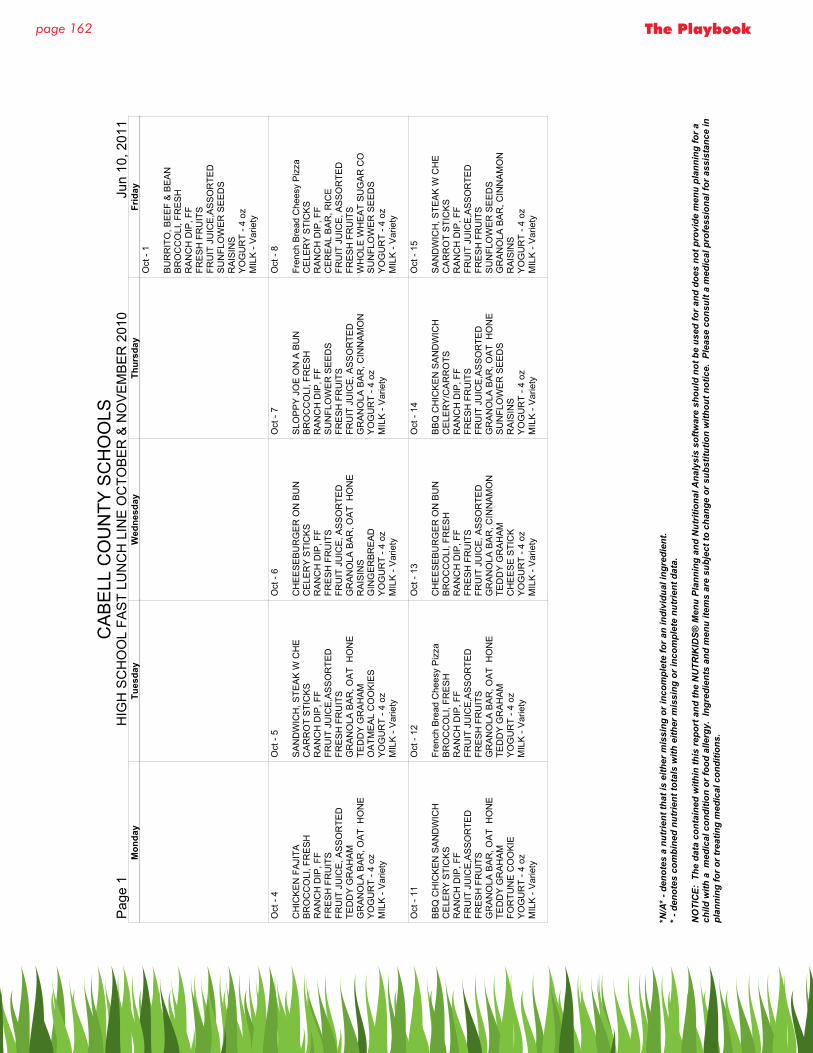
page 162 The Playbook
CA
BE
LL C
OU
NTY
SC
HO
OLS
Pag
e 1
HIG
H S
CH
OO
L FA
ST
LUN
CH
LIN
E O
CTO
BE
R &
NO
VE
MB
ER
201
0 J
un 1
0, 2
011
Mon
day
Tues
day
Wed
nesd
ayTh
ursd
ayFr
iday
Oct
- 1
BU
RR
ITO
, BE
EF
& B
EA
NB
RO
CC
OLI
, FR
ES
HR
AN
CH
DIP
, FF
FRE
SH
FR
UIT
SFR
UIT
JU
ICE
,AS
SO
RTE
DS
UN
FLO
WE
R S
EE
DS
RA
ISIN
SY
OG
UR
T - 4
oz
MIL
K -
Var
iety
Oct
- 4
CH
ICK
EN
FA
JITA
BR
OC
CO
LI, F
RE
SH
RA
NC
H D
IP, F
FFR
ES
H F
RU
ITS
FRU
IT J
UIC
E, A
SS
OR
TED
TED
DY
GR
AH
AM
GR
AN
OLA
BA
R, O
AT
HO
NE
YO
GU
RT
- 4 o
zM
ILK
- V
arie
ty
Oct
- 5
SA
ND
WIC
H, S
TEA
K W
CH
EC
AR
RO
T S
TIC
KS
RA
NC
H D
IP, F
FFR
UIT
JU
ICE
,AS
SO
RTE
DFR
ES
H F
RU
ITS
GR
AN
OLA
BA
R, O
AT
HO
NE
TED
DY
GR
AH
AM
OA
TME
AL
CO
OK
IES
YO
GU
RT
- 4 o
zM
ILK
- V
arie
ty
Oct
- 6
CH
EE
SE
BU
RG
ER
ON
BU
NC
ELE
RY
STI
CK
S
RA
NC
H D
IP, F
FFR
ES
H F
RU
ITS
FRU
IT J
UIC
E, A
SS
OR
TED
GR
AN
OLA
BA
R, O
AT
HO
NE
RA
ISIN
SG
ING
ER
BR
EA
DY
OG
UR
T - 4
oz
MIL
K -
Var
iety
Oct
- 7
SLO
PP
Y J
OE
ON
A B
UN
B
RO
CC
OLI
, FR
ES
HR
AN
CH
DIP
, FF
SU
NFL
OW
ER
SE
ED
SFR
ES
H F
RU
ITS
FRU
IT J
UIC
E, A
SS
OR
TED
GR
AN
OLA
BA
R, C
INN
AM
ON
YO
GU
RT
- 4 o
zM
ILK
- V
arie
ty
Oct
- 8
Fren
ch B
read
Che
esy
Piz
zaC
ELE
RY
STI
CK
S
RA
NC
H D
IP, F
FC
ER
EA
L B
AR
, RIC
EFR
UIT
JU
ICE
, AS
SO
RTE
DFR
ES
H F
RU
ITS
WH
OLE
WH
EA
T S
UG
AR
CO
SU
NFL
OW
ER
SE
ED
SY
OG
UR
T - 4
oz
MIL
K -
Var
iety
Oct
- 11
BB
Q C
HIC
KE
N S
AN
DW
ICH
C
ELE
RY
STI
CK
S
RA
NC
H D
IP, F
FFR
UIT
JU
ICE
,AS
SO
RTE
DFR
ES
H F
RU
ITS
GR
AN
OLA
BA
R, O
AT
HO
NE
TED
DY
GR
AH
AM
FOR
TUN
E C
OO
KIE
YO
GU
RT
- 4 o
zM
ILK
- V
arie
ty
Oct
- 12
Fren
ch B
read
Che
esy
Piz
zaB
RO
CC
OLI
, FR
ES
HR
AN
CH
DIP
, FF
FRU
IT J
UIC
E,A
SS
OR
TED
FRE
SH
FR
UIT
SG
RA
NO
LA B
AR
, OA
T H
ON
ETE
DD
Y G
RA
HA
MY
OG
UR
T - 4
oz
MIL
K -
Var
iety
Oct
- 13
CH
EE
SE
BU
RG
ER
ON
BU
NB
RO
CC
OLI
, FR
ES
HR
AN
CH
DIP
, FF
FRE
SH
FR
UIT
SFR
UIT
JU
ICE
, AS
SO
RTE
DG
RA
NO
LA B
AR
, CIN
NA
MO
NTE
DD
Y G
RA
HA
MC
HE
ES
E S
TIC
KY
OG
UR
T - 4
oz
MIL
K -
Var
iety
Oct
- 14
BB
Q C
HIC
KE
N S
AN
DW
ICH
C
ELE
RY
/CA
RR
OTS
RA
NC
H D
IP, F
FFR
ES
H F
RU
ITS
FRU
IT J
UIC
E,A
SS
OR
TED
GR
AN
OLA
BA
R, O
AT
HO
NE
SU
NFL
OW
ER
SE
ED
SR
AIS
INS
YO
GU
RT
- 4 o
zM
ILK
- V
arie
ty
Oct
- 15
SA
ND
WIC
H, S
TEA
K W
CH
EC
AR
RO
T S
TIC
KS
RA
NC
H D
IP, F
FFR
UIT
JU
ICE
,AS
SO
RTE
DFR
ES
H F
RU
ITS
SU
NFL
OW
ER
SE
ED
SG
RA
NO
LA B
AR
, CIN
NA
MO
NR
AIS
INS
YO
GU
RT
- 4 o
zM
ILK
- V
arie
ty
*N/A
* - d
enot
es a
nut
rient
that
is e
ither
mis
sing
or i
ncom
plet
e fo
r an
indi
vidu
al in
gred
ient
.* -
den
otes
com
bine
d nu
trie
nt to
tals
with
eith
er m
issi
ng o
r inc
ompl
ete
nutr
ient
dat
a.
NO
TIC
E: T
he d
ata
cont
aine
d w
ithin
this
repo
rt a
nd th
e N
UTR
IKID
S® M
enu
Plan
ning
and
Nut
ritio
nal A
naly
sis
softw
are
shou
ld n
ot b
e us
ed fo
r and
doe
s no
t pro
vide
men
u pl
anni
ng fo
r a
child
with
a m
edic
al c
ondi
tion
or fo
od a
llerg
y. I
ngre
dien
ts a
nd m
enu
item
s ar
e su
bjec
t to
chan
ge o
r sub
stitu
tion
with
out n
otic
e. P
leas
e co
nsul
t a m
edic
al p
rofe
ssio
nal f
or a
ssis
tanc
e in
pl
anni
ng fo
r or t
reat
ing
med
ical
con
ditio
ns.
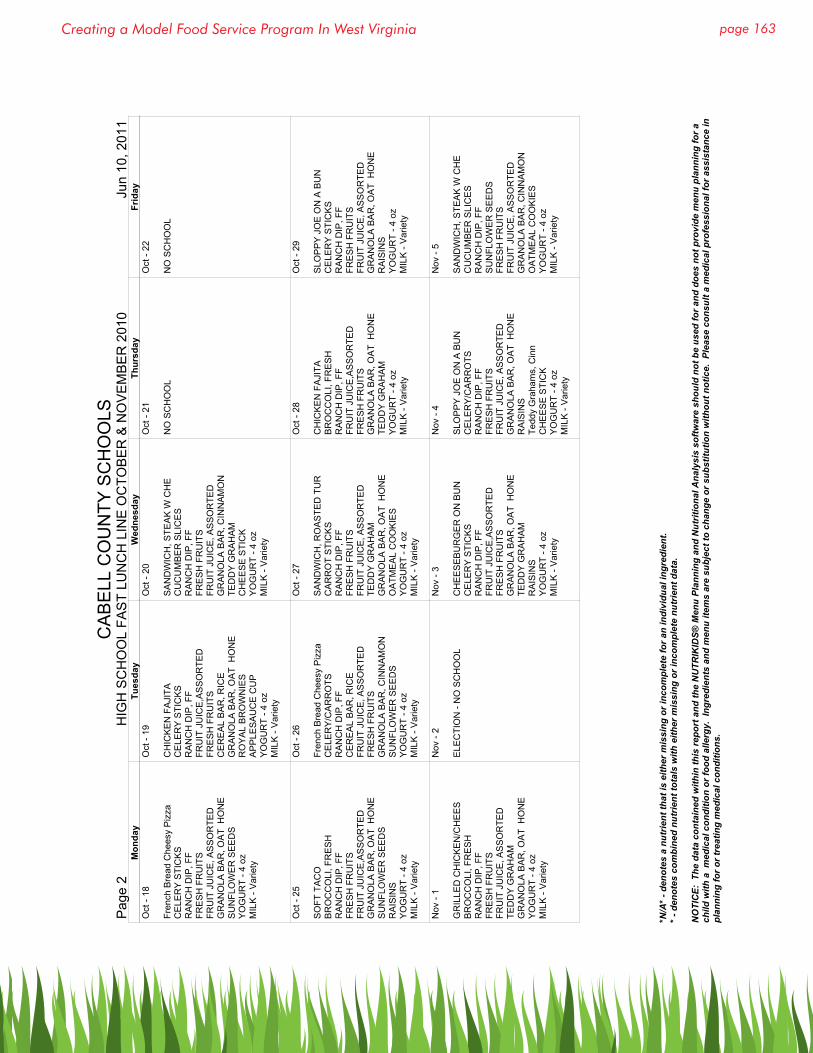
page 163Creating a Model Food Service Program In West Virginia
CA
BE
LL C
OU
NTY
SC
HO
OLS
Pag
e 2
HIG
H S
CH
OO
L FA
ST
LUN
CH
LIN
E O
CTO
BE
R &
NO
VE
MB
ER
201
0 J
un 1
0, 2
011
Mon
day
Tues
day
Wed
nesd
ayTh
ursd
ayFr
iday
Oct
- 18
Fren
ch B
read
Che
esy
Piz
zaC
ELE
RY
STI
CK
S
RA
NC
H D
IP, F
FFR
ES
H F
RU
ITS
FRU
IT J
UIC
E, A
SS
OR
TED
GR
AN
OLA
BA
R, O
AT
HO
NE
SU
NFL
OW
ER
SE
ED
SY
OG
UR
T - 4
oz
MIL
K -
Var
iety
Oct
- 19
CH
ICK
EN
FA
JITA
CE
LER
Y S
TIC
KS
R
AN
CH
DIP
, FF
FRU
IT J
UIC
E,A
SS
OR
TED
FRE
SH
FR
UIT
SC
ER
EA
L B
AR
, RIC
EG
RA
NO
LA B
AR
, OA
T H
ON
ER
OY
AL
BR
OW
NIE
SA
PP
LES
AU
CE
CU
PY
OG
UR
T - 4
oz
MIL
K -
Var
iety
Oct
- 20
SA
ND
WIC
H, S
TEA
K W
CH
EC
UC
UM
BE
R S
LIC
ES
R
AN
CH
DIP
, FF
FRE
SH
FR
UIT
SFR
UIT
JU
ICE
, AS
SO
RTE
DG
RA
NO
LA B
AR
, CIN
NA
MO
NTE
DD
Y G
RA
HA
MC
HE
ES
E S
TIC
KY
OG
UR
T - 4
oz
MIL
K -
Var
iety
Oct
- 21
NO
SC
HO
OL
Oct
- 22
NO
SC
HO
OL
Oct
- 25
SO
FT T
AC
OB
RO
CC
OLI
, FR
ES
HR
AN
CH
DIP
, FF
FRE
SH
FR
UIT
SFR
UIT
JU
ICE
,AS
SO
RTE
DG
RA
NO
LA B
AR
, OA
T H
ON
ES
UN
FLO
WE
R S
EE
DS
RA
ISIN
SY
OG
UR
T - 4
oz
MIL
K -
Var
iety
Oct
- 26
Fren
ch B
read
Che
esy
Piz
zaC
ELE
RY
/CA
RR
OTS
RA
NC
H D
IP, F
FC
ER
EA
L B
AR
, RIC
EFR
UIT
JU
ICE
, AS
SO
RTE
DFR
ES
H F
RU
ITS
GR
AN
OLA
BA
R, C
INN
AM
ON
SU
NFL
OW
ER
SE
ED
SY
OG
UR
T - 4
oz
MIL
K -
Var
iety
Oct
- 27
SA
ND
WIC
H, R
OA
STE
D T
UR
CA
RR
OT
STI
CK
SR
AN
CH
DIP
, FF
FRE
SH
FR
UIT
SFR
UIT
JU
ICE
, AS
SO
RTE
DTE
DD
Y G
RA
HA
MG
RA
NO
LA B
AR
, OA
T H
ON
EO
ATM
EA
L C
OO
KIE
SY
OG
UR
T - 4
oz
MIL
K -
Var
iety
Oct
- 28
CH
ICK
EN
FA
JITA
BR
OC
CO
LI, F
RE
SH
RA
NC
H D
IP, F
FFR
UIT
JU
ICE
,AS
SO
RTE
DFR
ES
H F
RU
ITS
GR
AN
OLA
BA
R, O
AT
HO
NE
TED
DY
GR
AH
AM
YO
GU
RT
- 4 o
zM
ILK
- V
arie
ty
Oct
- 29
SLO
PP
Y J
OE
ON
A B
UN
C
ELE
RY
STI
CK
S
RA
NC
H D
IP, F
FFR
ES
H F
RU
ITS
FRU
IT J
UIC
E, A
SS
OR
TED
GR
AN
OLA
BA
R, O
AT
HO
NE
RA
ISIN
SY
OG
UR
T - 4
oz
MIL
K -
Var
iety
Nov
- 1
GR
ILLE
D C
HIC
KE
N/C
HE
ES
B
RO
CC
OLI
, FR
ES
HR
AN
CH
DIP
, FF
FRE
SH
FR
UIT
SFR
UIT
JU
ICE
, AS
SO
RTE
DTE
DD
Y G
RA
HA
MG
RA
NO
LA B
AR
, OA
T H
ON
EY
OG
UR
T - 4
oz
MIL
K -
Var
iety
Nov
- 2
ELE
CTI
ON
- N
O S
CH
OO
L
Nov
- 3
CH
EE
SE
BU
RG
ER
ON
BU
NC
ELE
RY
STI
CK
S
RA
NC
H D
IP, F
FFR
UIT
JU
ICE
,AS
SO
RTE
DFR
ES
H F
RU
ITS
GR
AN
OLA
BA
R, O
AT
HO
NE
TED
DY
GR
AH
AM
RA
ISIN
SY
OG
UR
T - 4
oz
MIL
K -
Var
iety
Nov
- 4
SLO
PP
Y J
OE
ON
A B
UN
C
ELE
RY
/CA
RR
OTS
RA
NC
H D
IP, F
FFR
ES
H F
RU
ITS
FRU
IT J
UIC
E, A
SS
OR
TED
GR
AN
OLA
BA
R, O
AT
HO
NE
RA
ISIN
STe
ddy
Gra
ham
s, C
inn
CH
EE
SE
STI
CK
YO
GU
RT
- 4 o
zM
ILK
- V
arie
ty
Nov
- 5
SA
ND
WIC
H, S
TEA
K W
CH
EC
UC
UM
BE
R S
LIC
ES
R
AN
CH
DIP
, FF
SU
NFL
OW
ER
SE
ED
SFR
ES
H F
RU
ITS
FRU
IT J
UIC
E, A
SS
OR
TED
GR
AN
OLA
BA
R, C
INN
AM
ON
OA
TME
AL
CO
OK
IES
YO
GU
RT
- 4 o
zM
ILK
- V
arie
ty
*N/A
* - d
enot
es a
nut
rient
that
is e
ither
mis
sing
or i
ncom
plet
e fo
r an
indi
vidu
al in
gred
ient
.* -
den
otes
com
bine
d nu
trie
nt to
tals
with
eith
er m
issi
ng o
r inc
ompl
ete
nutr
ient
dat
a.
NO
TIC
E: T
he d
ata
cont
aine
d w
ithin
this
repo
rt a
nd th
e N
UTR
IKID
S® M
enu
Plan
ning
and
Nut
ritio
nal A
naly
sis
softw
are
shou
ld n
ot b
e us
ed fo
r and
doe
s no
t pro
vide
men
u pl
anni
ng fo
r a
child
with
a m
edic
al c
ondi
tion
or fo
od a
llerg
y. I
ngre
dien
ts a
nd m
enu
item
s ar
e su
bjec
t to
chan
ge o
r sub
stitu
tion
with
out n
otic
e. P
leas
e co
nsul
t a m
edic
al p
rofe
ssio
nal f
or a
ssis
tanc
e in
pl
anni
ng fo
r or t
reat
ing
med
ical
con
ditio
ns.

page 164 The Playbook
CA
BE
LL C
OU
NTY
SC
HO
OLS
Pag
e 3
HIG
H S
CH
OO
L FA
ST
LUN
CH
LIN
E O
CTO
BE
R &
NO
VE
MB
ER
201
0 J
un 1
0, 2
011
Mon
day
Tues
day
Wed
nesd
ayTh
ursd
ayFr
iday
Nov
- 8
BB
Q C
HIC
KE
N S
AN
DW
ICH
C
ELE
RY
STI
CK
S
RA
NC
H D
IP, F
FFR
UIT
JU
ICE
,AS
SO
RTE
DFR
ES
H F
RU
ITS
GR
AN
OLA
BA
R, O
AT
HO
NE
TED
DY
GR
AH
AM
GIN
GE
RB
RE
AD
YO
GU
RT
- 4 o
zM
ILK
- V
arie
ty
Nov
- 9
Fren
ch B
read
Che
esy
Piz
zaB
RO
CC
OLI
, FR
ES
HR
AN
CH
DIP
, FF
FRU
IT J
UIC
E,A
SS
OR
TED
FRE
SH
FR
UIT
SG
RA
NO
LA B
AR
, OA
T H
ON
ETE
DD
Y G
RA
HA
MR
OY
AL
BR
OW
NIE
SC
HE
ES
E S
TIC
KY
OG
UR
T - 4
oz
MIL
K -
Var
iety
Nov
- 10
SA
ND
WIC
H, S
TEA
K W
CH
EC
UC
UM
BE
R S
LIC
ES
R
AN
CH
DIP
, FF
FRE
SH
FR
UIT
SFR
UIT
JU
ICE
, AS
SO
RTE
DG
RA
NO
LA B
AR
, CIN
NA
MO
NTE
DD
Y G
RA
HA
MC
HE
ES
E S
TIC
KY
OG
UR
T - 4
oz
MIL
K -
Var
iety
Nov
- 11
HO
LID
AY
Nov
- 12
SA
ND
WIC
H, R
OA
STE
D T
UR
CE
LER
Y/C
AR
RO
TSR
AN
CH
DIP
, FF
FRE
SH
FR
UIT
SFR
UIT
JU
ICE
,AS
SO
RTE
DG
RA
NO
LA B
AR
, OA
T H
ON
ES
UN
FLO
WE
R S
EE
DS
RA
ISIN
SW
HO
LE W
HE
AT
SU
GA
R C
OY
OG
UR
T - 4
oz
MIL
K -
Var
iety
Nov
- 15
Fren
ch B
read
Che
esy
Piz
zaC
ELE
RY
STI
CK
S
RA
NC
H D
IP, F
FFR
ES
H F
RU
ITS
FRU
IT J
UIC
E, A
SS
OR
TED
GR
AN
OLA
BA
R, O
AT
HO
NE
SU
NFL
OW
ER
SE
ED
SG
ING
ER
BR
EA
DY
OG
UR
T - 4
oz
MIL
K -
Var
iety
Nov
- 16
SA
ND
WIC
H, S
TEA
K W
CH
EB
RO
CC
OLI
, FR
ES
HR
AN
CH
DIP
, FF
FRU
IT J
UIC
E,A
SS
OR
TED
FRE
SH
FR
UIT
SC
ER
EA
L B
AR
, RIC
EG
RA
NO
LA B
AR
, OA
T H
ON
ER
AIS
INS
AP
PLE
SA
UC
E C
UP
YO
GU
RT
- 4 o
zM
ILK
- V
arie
ty
Nov
- 17
BB
Q C
HIC
KE
N S
AN
DW
ICH
C
UC
UM
BE
R S
LIC
ES
R
AN
CH
DIP
, FF
FRE
SH
FR
UIT
SFR
UIT
JU
ICE
, AS
SO
RTE
DG
RA
NO
LA B
AR
, CIN
NA
MO
NTE
DD
Y G
RA
HA
MS
UN
FLO
WE
R S
EE
DS
CH
EE
SE
STI
CK
FRU
IT S
HE
RB
ET:
4 fl
.oz.
MIL
K -
Var
iety
Nov
- 18
SA
ND
WIC
H, R
OA
STE
D T
UR
BR
OC
CO
LI, F
RE
SH
RA
NC
H D
IP, F
FFR
UIT
JU
ICE
,AS
SO
RTE
DFR
ES
H F
RU
ITS
GR
AN
OLA
BA
R, O
AT
HO
NE
TED
DY
GR
AH
AM
CH
EE
SE
STI
CK
YO
GU
RT
- 4 o
zM
ILK
- V
arie
ty
Nov
- 19
CH
EE
SE
BU
RG
ER
ON
BU
NB
RO
CC
OLI
, FR
ES
HR
AN
CH
DIP
, FF
FRE
SH
FR
UIT
SFR
UIT
JU
ICE
, AS
SO
RTE
DG
RA
NO
LA B
AR
, OA
T H
ON
ER
AIS
INS
YO
GU
RT
- 4 o
zM
ILK
- V
arie
ty
Nov
- 22
SO
FT T
AC
OB
RO
CC
OLI
, FR
ES
HR
AN
CH
DIP
, FF
FRE
SH
FR
UIT
SFR
UIT
JU
ICE
,AS
SO
RTE
DG
RA
NO
LA B
AR
, OA
T H
ON
ES
UN
FLO
WE
R S
EE
DS
RA
ISIN
SY
OG
UR
T - 4
oz
MIL
K -
Var
iety
Nov
- 23
Fren
ch B
read
Che
esy
Piz
zaC
ELE
RY
/CA
RR
OTS
RA
NC
H D
IP, F
FC
ER
EA
L B
AR
, RIC
EFR
UIT
JU
ICE
, AS
SO
RTE
DFR
ES
H F
RU
ITS
GR
AN
OLA
BA
R, C
INN
AM
ON
OA
TME
AL
CO
OK
IES
SU
NFL
OW
ER
SE
ED
SY
OG
UR
T - 4
oz
MIL
K -
Var
iety
Nov
- 24
NO
SC
HO
OL
Nov
- 25
HO
LID
AY
Nov
- 26
NO
SC
HO
OL
*N/A
* - d
enot
es a
nut
rient
that
is e
ither
mis
sing
or i
ncom
plet
e fo
r an
indi
vidu
al in
gred
ient
.* -
den
otes
com
bine
d nu
trie
nt to
tals
with
eith
er m
issi
ng o
r inc
ompl
ete
nutr
ient
dat
a.
NO
TIC
E: T
he d
ata
cont
aine
d w
ithin
this
repo
rt a
nd th
e N
UTR
IKID
S® M
enu
Plan
ning
and
Nut
ritio
nal A
naly
sis
softw
are
shou
ld n
ot b
e us
ed fo
r and
doe
s no
t pro
vide
men
u pl
anni
ng fo
r a
child
with
a m
edic
al c
ondi
tion
or fo
od a
llerg
y. I
ngre
dien
ts a
nd m
enu
item
s ar
e su
bjec
t to
chan
ge o
r sub
stitu
tion
with
out n
otic
e. P
leas
e co
nsul
t a m
edic
al p
rofe
ssio
nal f
or a
ssis
tanc
e in
pl
anni
ng fo
r or t
reat
ing
med
ical
con
ditio
ns.
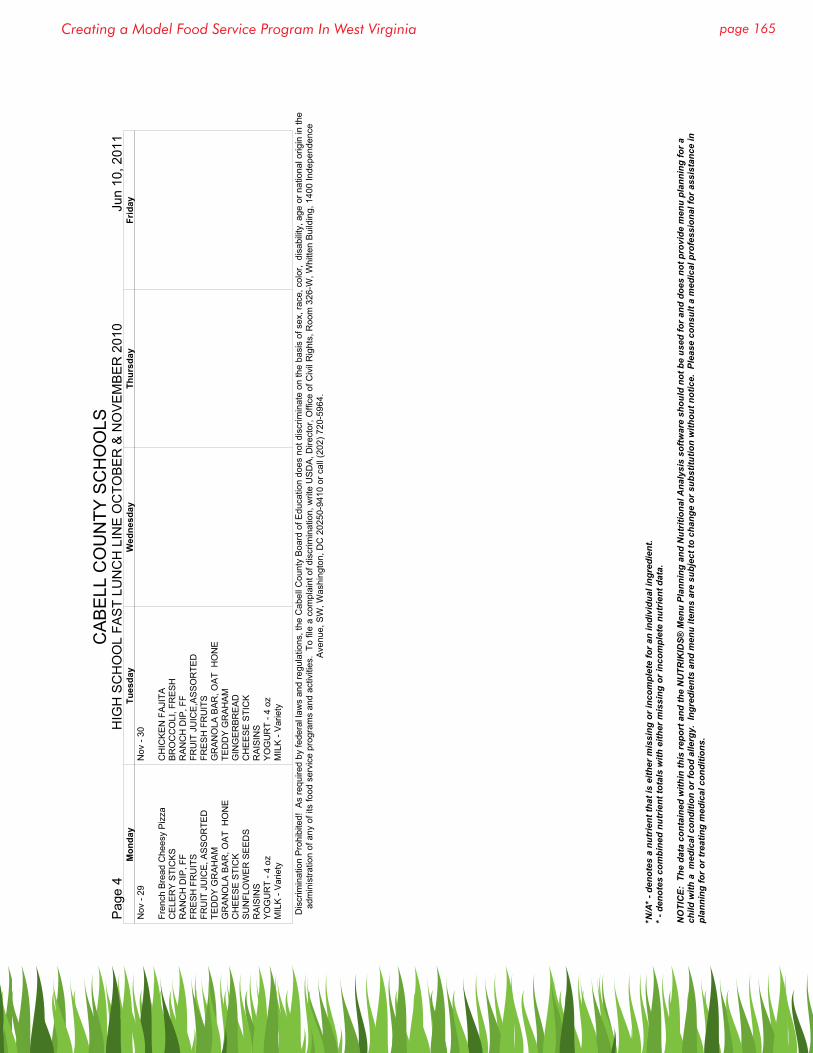
page 165Creating a Model Food Service Program In West Virginia
CA
BE
LL C
OU
NTY
SC
HO
OLS
Pag
e 4
HIG
H S
CH
OO
L FA
ST
LUN
CH
LIN
E O
CTO
BE
R &
NO
VE
MB
ER
201
0 J
un 1
0, 2
011
Mon
day
Tues
day
Wed
nesd
ayTh
ursd
ayFr
iday
Nov
- 29
Fren
ch B
read
Che
esy
Piz
zaC
ELE
RY
STI
CK
S
RA
NC
H D
IP, F
FFR
ES
H F
RU
ITS
FRU
IT J
UIC
E, A
SS
OR
TED
TED
DY
GR
AH
AM
GR
AN
OLA
BA
R, O
AT
HO
NE
CH
EE
SE
STI
CK
SU
NFL
OW
ER
SE
ED
SR
AIS
INS
YO
GU
RT
- 4 o
zM
ILK
- V
arie
ty
Nov
- 30
CH
ICK
EN
FA
JITA
BR
OC
CO
LI, F
RE
SH
RA
NC
H D
IP, F
FFR
UIT
JU
ICE
,AS
SO
RTE
DFR
ES
H F
RU
ITS
GR
AN
OLA
BA
R, O
AT
HO
NE
TED
DY
GR
AH
AM
GIN
GE
RB
RE
AD
CH
EE
SE
STI
CK
RA
ISIN
SY
OG
UR
T - 4
oz
MIL
K -
Var
iety
Dis
crim
inat
ion
Pro
hibi
ted!
As
requ
ired
by fe
dera
l law
s an
d re
gula
tions
, the
Cab
ell C
ount
y B
oard
of E
duca
tion
does
not
dis
crim
inat
e on
the
basi
s of
sex
, rac
e, c
olor
, di
sabi
lity,
age
or n
atio
nal o
rigin
in th
ead
min
istra
tion
of a
ny o
f its
food
ser
vice
pro
gram
s an
d ac
tiviti
es.
To fi
le a
com
plai
nt o
f dis
crim
inat
ion,
writ
e U
SD
A, D
irect
or, O
ffice
of C
ivil
Rig
hts,
Roo
m 3
26-W
, Whi
tten
Bui
ldin
g, 1
400
Inde
pend
ence
Ave
nue,
SW
, Was
hing
ton,
DC
202
50-9
410
or c
all (
202)
720
-596
4.
*N/A
* - d
enot
es a
nut
rient
that
is e
ither
mis
sing
or i
ncom
plet
e fo
r an
indi
vidu
al in
gred
ient
.* -
den
otes
com
bine
d nu
trie
nt to
tals
with
eith
er m
issi
ng o
r inc
ompl
ete
nutr
ient
dat
a.
NO
TIC
E: T
he d
ata
cont
aine
d w
ithin
this
repo
rt a
nd th
e N
UTR
IKID
S® M
enu
Plan
ning
and
Nut
ritio
nal A
naly
sis
softw
are
shou
ld n
ot b
e us
ed fo
r and
doe
s no
t pro
vide
men
u pl
anni
ng fo
r a
child
with
a m
edic
al c
ondi
tion
or fo
od a
llerg
y. I
ngre
dien
ts a
nd m
enu
item
s ar
e su
bjec
t to
chan
ge o
r sub
stitu
tion
with
out n
otic
e. P
leas
e co
nsul
t a m
edic
al p
rofe
ssio
nal f
or a
ssis
tanc
e in
pl
anni
ng fo
r or t
reat
ing
med
ical
con
ditio
ns.

page 166 The Playbook
Policy 4321.1 A copy of the policy is provided as a supplement to The Playbook.
Sample Cabell Local Wellness PolicyTo ensure that schools are providing a healthful environment to students, Congress mandated that county districts form a wellness committee to develop and implement a local wellness policy beginning with the 2006-2007 academic year. The wellness policy should be a living document, with revisions made every year thereafter. Each school participating in the federally funded National School Lunch Program must actively assist in the implementation of this policy.
The development of a policy should include input from parents, students, representatives of the school food authority, the school board, school administrators, and members of the local community.
The required components for this policy include goals for: • Nutrition education; • Physical activity; • Nutrition guidelines for all foods available on the school campus during the school day;• Other school-based activities that offer opportunities to create a total school environment that is
conducive to health eating and being physically active; and• A plan for measuring the implementation of the local wellness policy.
During the 2011-2012 school year, the Office of Child Nutrition will have counties and schools include school level policy and environmental changes into their local wellness efforts. Examples of these strategies are listed below:
• Implementation of the OCN’s outlined Breakfast Participation Strategies;• A policy that allows for physical activity time to be included during the school day (i.e. walking
and talking before homeroom, daily recess, “Jam a Minute” time throughout the school day);• A policy that only allows staff to consume soda within the teachers’ lounge;• A policy that does not allow any food other than fruit to be sold as a fundraiser during or after the
school day; and • A policy that would require concession stands to offer at least 50% healthy food items, priced at
an equal or lesser amount than unhealthy items offered for sale.
About the Office of Child NutritionThe Office of Child Nutrition is dedicated to improving the health of children in West Virginia by encouraging nutritious meals, supporting nutrition education and enhancing program quality and accountability. Our focus is on ensuring that every West Virginia child has eaten at least two healthy meals and good, nutritious snacks each school day. In 2010, the OCN distributed 85 million dollars in federal funds to provide nutritious, low cost or free meals and snacks to children in a variety of settings. The reach of our work includes:
• All public schools in West Virginia;• 17 private schools; • 30 residential child care institutions; • 503 child care centers; • 1,094 in home child care providers; • 4 adult day care agencies; and • 616 summer food sites.
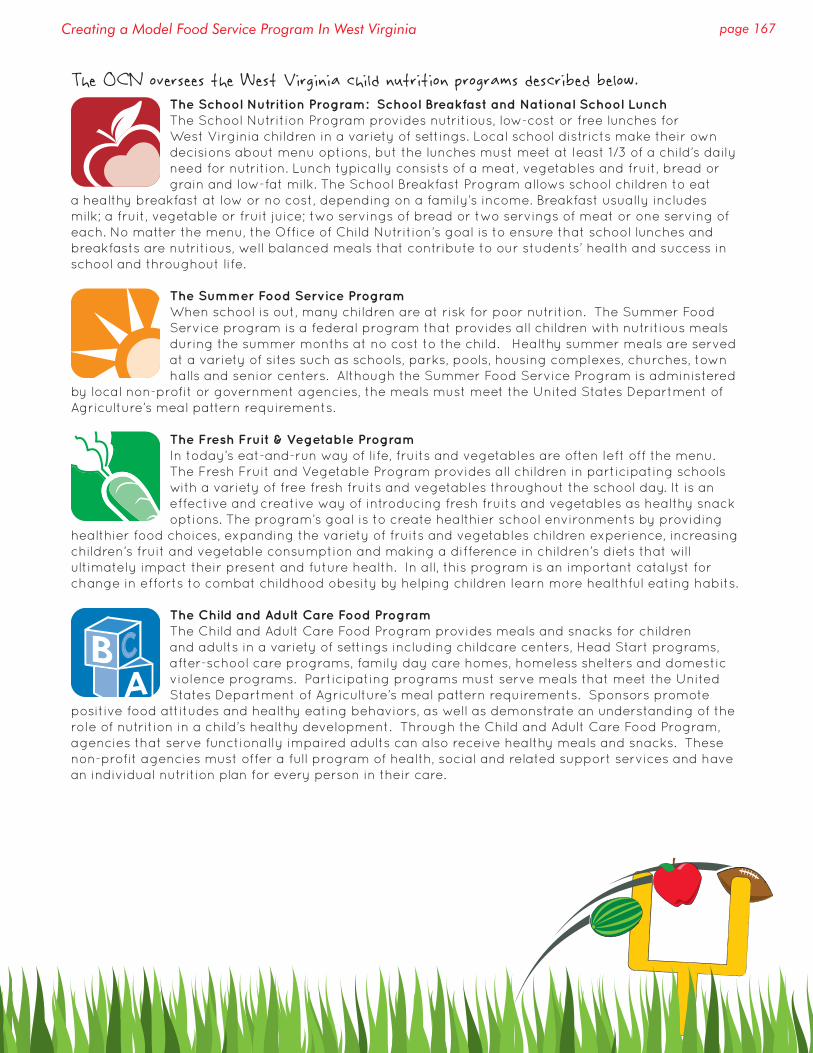
page 167Creating a Model Food Service Program In West Virginia
The OCN oversees the West Virginia child nutrition programs described below. The School Nutrition Program: School Breakfast and National School LunchThe School Nutrition Program provides nutritious, low-cost or free lunches for West Virginia children in a variety of settings. Local school districts make their own decisions about menu options, but the lunches must meet at least 1/3 of a child’s daily need for nutrition. Lunch typically consists of a meat, vegetables and fruit, bread or grain and low-fat milk. The School Breakfast Program allows school children to eat
a healthy breakfast at low or no cost, depending on a family’s income. Breakfast usually includes milk; a fruit, vegetable or fruit juice; two servings of bread or two servings of meat or one serving of each. No matter the menu, the Office of Child Nutrition’s goal is to ensure that school lunches and breakfasts are nutritious, well balanced meals that contribute to our students’ health and success in school and throughout life.
The Summer Food Service Program When school is out, many children are at risk for poor nutrition. The Summer Food Service program is a federal program that provides all children with nutritious meals during the summer months at no cost to the child. Healthy summer meals are served at a variety of sites such as schools, parks, pools, housing complexes, churches, town halls and senior centers. Although the Summer Food Service Program is administered
by local non-profit or government agencies, the meals must meet the United States Department of Agriculture’s meal pattern requirements.
The Fresh Fruit & Vegetable ProgramIn today’s eat-and-run way of life, fruits and vegetables are often left off the menu. The Fresh Fruit and Vegetable Program provides all children in participating schools with a variety of free fresh fruits and vegetables throughout the school day. It is an effective and creative way of introducing fresh fruits and vegetables as healthy snack options. The program’s goal is to create healthier school environments by providing
healthier food choices, expanding the variety of fruits and vegetables children experience, increasing children’s fruit and vegetable consumption and making a difference in children’s diets that will ultimately impact their present and future health. In all, this program is an important catalyst for change in efforts to combat childhood obesity by helping children learn more healthful eating habits.
The Child and Adult Care Food Program The Child and Adult Care Food Program provides meals and snacks for children and adults in a variety of settings including childcare centers, Head Start programs, after-school care programs, family day care homes, homeless shelters and domestic violence programs. Participating programs must serve meals that meet the United States Department of Agriculture’s meal pattern requirements. Sponsors promote
positive food attitudes and healthy eating behaviors, as well as demonstrate an understanding of the role of nutrition in a child’s healthy development. Through the Child and Adult Care Food Program, agencies that serve functionally impaired adults can also receive healthy meals and snacks. These non-profit agencies must offer a full program of health, social and related support services and have an individual nutrition plan for every person in their care.
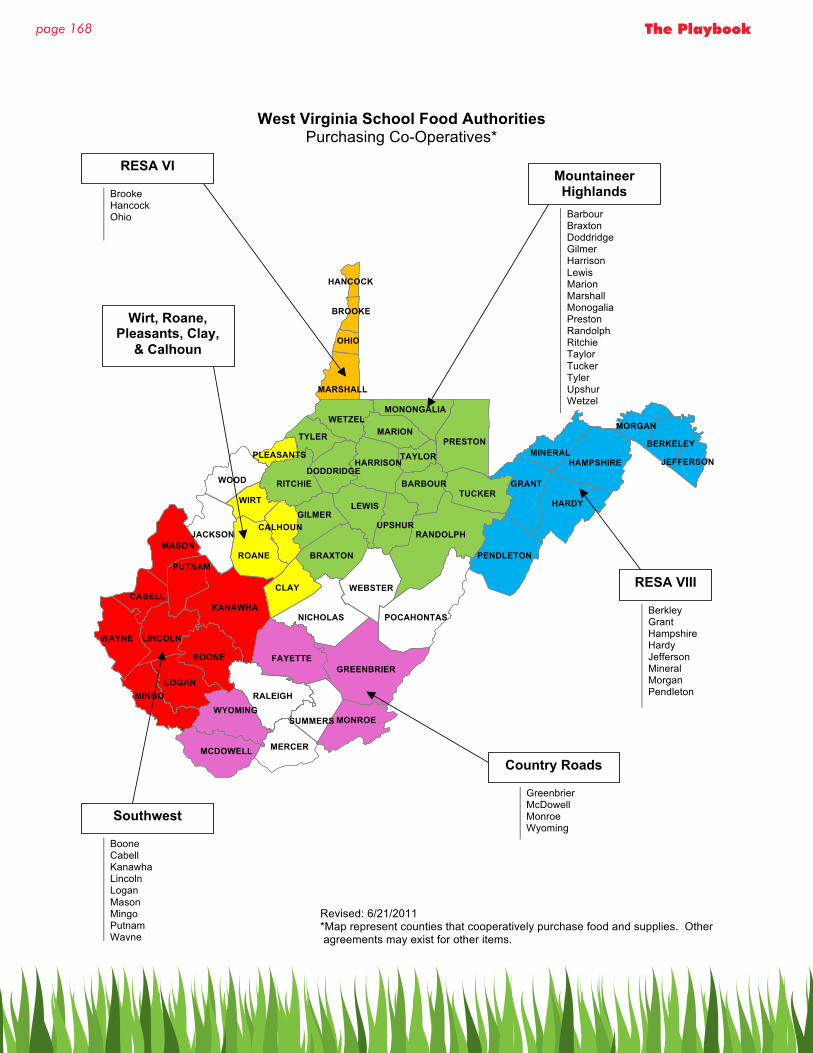
page 168 The Playbook
West Virginia School Food Authorities Purchasing Co-Operatives*
Revised: 6/21/2011 *Map represent counties that cooperatively purchase food and supplies. Other agreements may exist for other items.
Barbour Braxton Doddridge Gilmer Harrison Lewis Marion Marshall Monogalia Preston Randolph Ritchie Taylor Tucker Tyler Upshur Wetzel
Brooke Hancock Ohio
Berkley Grant Hampshire Hardy Jefferson Mineral Morgan Pendleton
Boone Cabell Kanawha Lincoln Logan Mason Mingo Putnam Wayne
Mountaineer Highlands
Wirt, Roane, Pleasants, Clay,
& Calhoun
Southwest
RESA VIII
Country Roads
RESA VI
Greenbrier McDowell Monroe Wyoming
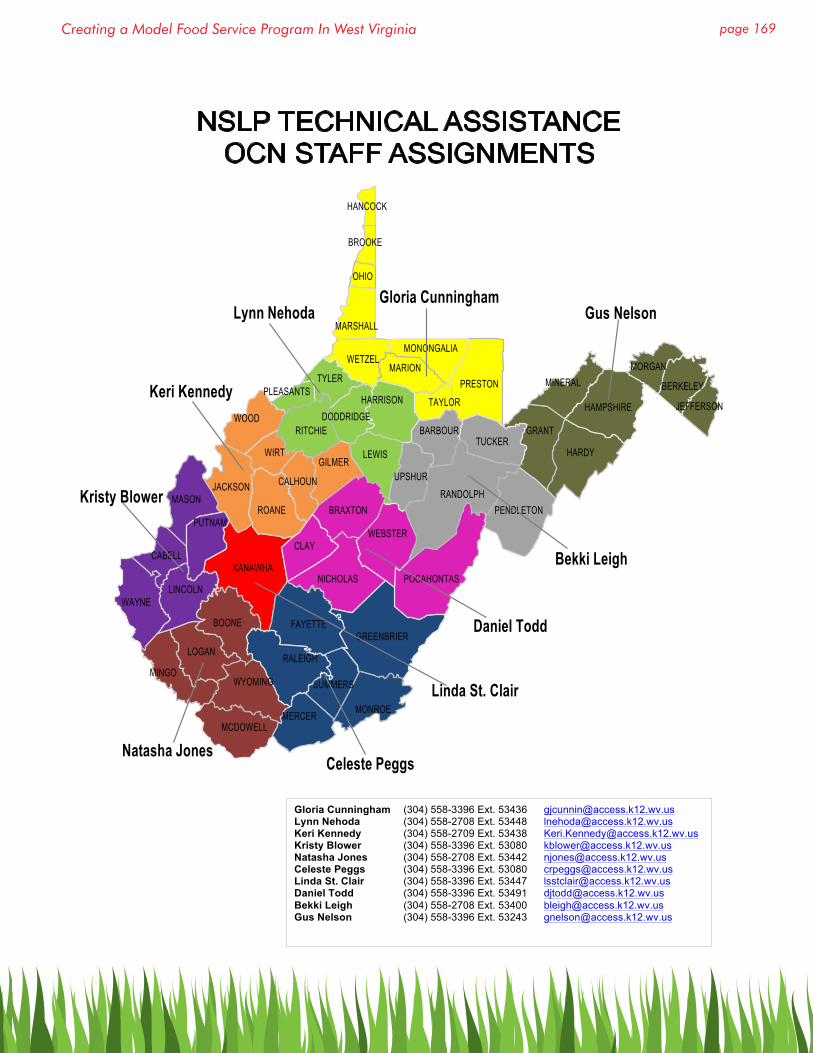
page 169Creating a Model Food Service Program In West Virginia
Gloria Cunningham (304) 558-3396 Ext. 53436 [email protected] Lynn Nehoda (304) 558-2708 Ext. 53448 [email protected] Keri Kennedy (304) 558-2709 Ext. 53438 [email protected] Kristy Blower (304) 558-3396 Ext. 53080 [email protected] Natasha Jones (304) 558-2708 Ext. 53442 [email protected] Celeste Peggs (304) 558-3396 Ext. 53080 [email protected] Linda St. Clair (304) 558-3396 Ext. 53447 [email protected] Daniel Todd (304) 558-3396 Ext. 53491 [email protected] Bekki Leigh (304) 558-2708 Ext. 53400 [email protected] Gus Nelson (304) 558-3396 Ext. 53243 [email protected]

page 170 The Playbook
Notes

page 171Creating a Model Food Service Program In West Virginia
Notes

page 172 The Playbook
Notes

Jorea M. Marple, Ed.D.State Superintendent of Schools
West Virginia Board of Education2011-2012
L. Wade Linger Jr., PresidentGayle C. Manchin, Vice President
Robert W. Dunlevy, Secretary
Michael I. Green, MemberPriscilla M. Haden, Member
Burma Hatfield, MemberLowell E. Johnson, MemberJenny N. Phillips, MemberWilliam M. White, Member
Brian E. Noland, Ex OfficioChancellor
West Virginia Higher Education Policy Commission
James L. Skidmore, Ex OfficioChancellor
West Virginia Council for Community and Technical College Education
Jorea M. Marple, Ex OfficioState Superintendent of Schools
West Virginia Department of EducationBuilding 6, Room 248
1900 Kanawha Boulevard, EastCharleston, WV 25305-0330
Phone: 304.558.2709 Fax: 304.558.1149