Embed Size (px)
Citation preview
Fabrication 11vision
~0
~.<v~~'" ~
,_~ x, \.«;#, :\ v \-'
<.~~, Pressure Vessel Research Committee ..\,~~
THE PLASTIC FATIGUE STRENGTH OF PRESSURE VESSEL STEELS
by J. H. Gross, D. E. Gucer J R. D. Stout
Lehigh University
•
THE PLASTIC FATIGUE STRENi',TH OF PRESSUPE VESSEL STEELS
By J. H. Gross ,-l(- D. E. Gucer,{(- and R. D. Stout-l<-
ForewGrd
The investigation reported in this paper was sponsored and guided by the
Fabrication Division of the Presssure Vessel Research Committee. hr. P. R.
Cassidy is Chairman and Mr. B. E. Rossi is EKecutive Secretary of the Pressure
Vessel Research Committee. hr. F. L. Plummer is Chairman of the Fabrication
Division, while the project Steering Con~ittee is composed of Mr. I. E. Boberg,
Mr. L. C.ULbber, Mr. W. P. Gerhart, and Mr. A. R. Lytle.
Introduction
In previous papers (1)-(2)a testing method was described for evaluating the
resistance of steels to repeated loads in the plastic range. The effects of fab-
rication operations, such as cold working, welding, and heat treatment, were re-
ported for several pressure vessel steels. Loading was restricted to the plastic
range in order to produce failure in a range of cycles applicable to pressure
vessel operation.
The present investigation was directed toward a comparison of plastic fat-
igue properties of a high strength Mn-Mo steel, ASTI4 A-302, Grade B, and a carbon
pressure vessel steel, ASTI1 A-201. If higher strength steels are applied to ves-
sels designed for increased stress levels, assurance is needed that the other
mechanical properties of these steels ~nll meet the requirements of service. In
addition, this program was to parallel tests at the University of Illinois on
larger hydraulic-loaded plate specimens and tests on model vessels at the Ecole
Polytechnique, 211 on the S~le heats of A-302 and A-201 steels.
The following phases of the program were investigated:1. Strain behavior in the specj~en during cycling2. Effect of surface preparation3. Effect of temperature durinp testing
{<-Department of Metallurgy, Lehigh University, Bethlehem, Pennsylvania
( 2)
4. Effect of welding and stress relieving5. Tests under constant maximum loading instead of constant
deflection6. Influence of heat treatment and microstructure
These will be described· and discussed in order.
Testing Hethods and l'1aterial
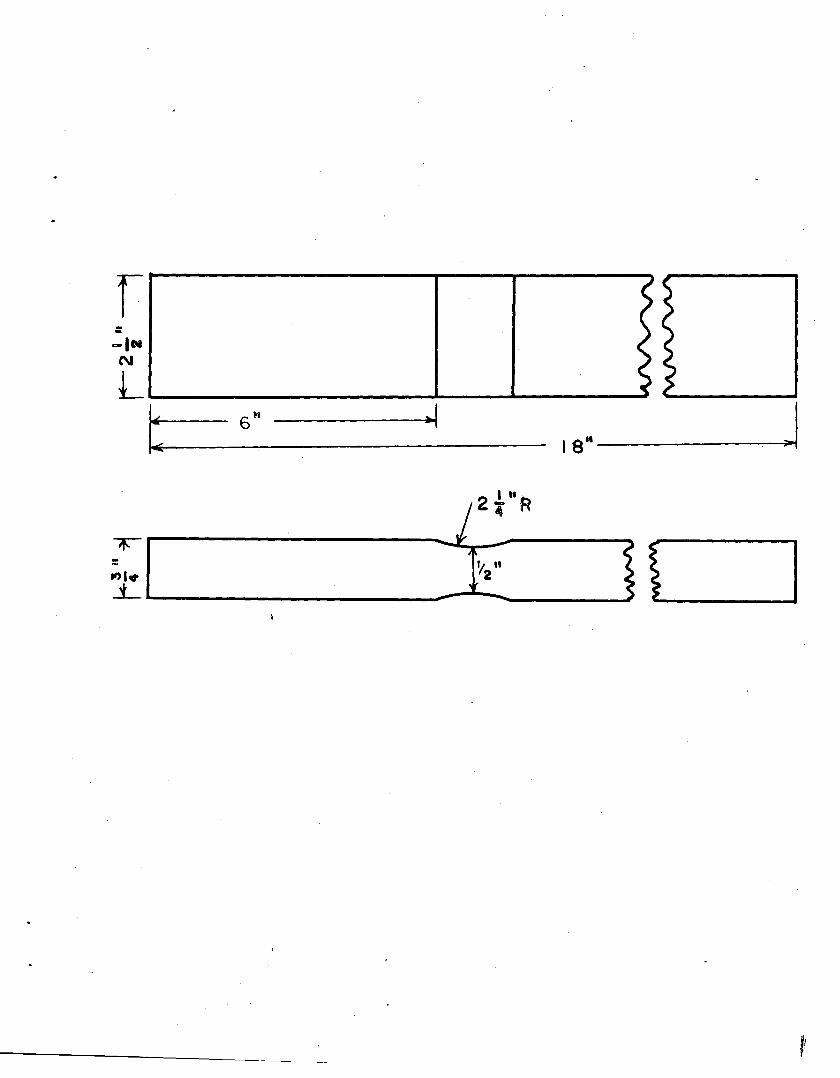
Tests at Constant Deflection. The details of the testing method have been(2)
presented previously. The specimen, shown in Figure 1, was loaded as a canti-
lever beam in the machine shown in Figure 2. This machine is a cam-type loading. .
device provid;i.ng essentially constant deflection amplitude during testing. The
specimen was sufficiently wide to set up 2:1 biaxial strains.
Tests at Constant Maximum Load. The investigations at the other cooperating
laboratories utilize oil pressure pulses for cycling which constitute loading to
a constant maximum pressure as opposed to the constant deflection characteristics
of the machine of Figure 2. In order to determine whether the behavior of the
steel under constant deflection is essentially the same or significantly different
as compared to constant loading, a second machine was constructed, as shown in
Figure 3. This machine is operated with compressed air, which furnishes loading
by means of the opposing cylinders. The air pressure is controlled in a secondary
tank, fed from the main tank, to plus or minus 0.5 pounds at levels varying from
50 to 100 pounds. The cycling is carried out at 100 cycles per minute by means of
a synchromous motor operatingamicroswitch and in turn alternately activating
three-way solenoid air valves. The loading is approximately square-wave in nature.
When the specimen has cracked to an extent which allows the cleflection to become
one-half inch, limit switches stop the test. The results of tests carried out on
this machine are presented in a later section.
steels. The steels used for testing consisted of two heats each of A- 302 and
A-201 in 3/4 inch thickness. The analyses and tensile properties of these heats
in the normalized and stress-relieved condition are given in Table 1. The "stan-
dard" heats are those under test at Illinois and Ecole Polytechnique, available
in limited quantity. The :flnew ll heats represent additional material needed for
further tests.
StE..ai.E-?ehavior in the Specimem
One of the problems involved in fatigue testing in the plastic range is to
express the severity of loading in quantitative and significant terms. The stress
values used in elastic loading lose validity, while strain values possess certain
ambic;uities which are demonstrated later on.
In previous investigations, as a first approximation, the strain imposed on
the initial tension cycle was used as -a.n index of the loading range. It appeared
desirable to study the strain produced throughout the test life of the specimen
to permit the best choice of a criterion for indicating the severity of plastic
loading. A second reason for such a study arose from the fact that specimens
of unlike strength experience different strains at identical deflections. In
general, greater strength results in lower strain in the test section.
Strains in the test scction were measured with a Tuckerman opticalgauge.
The gauge length was 1/4 inch, centered at the minimum cross-section. St.rains
were measured at small increments of deflection dUl~ng the first tension cycle
and then were recorded from maximum tension to maximum compression at frequent
intervals until the specimen developed a crack. Loads were also recorded on sev
eral of the tests by means of strain gauges affixed to the lo~ing arm of the
machine.
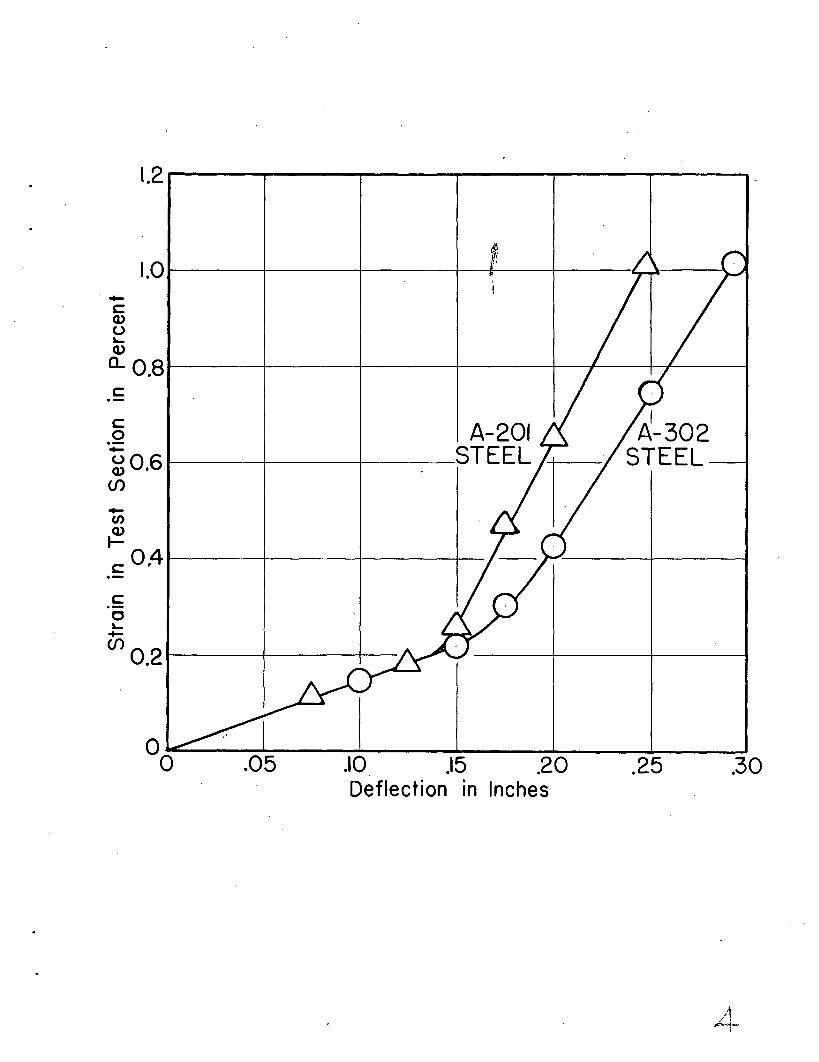
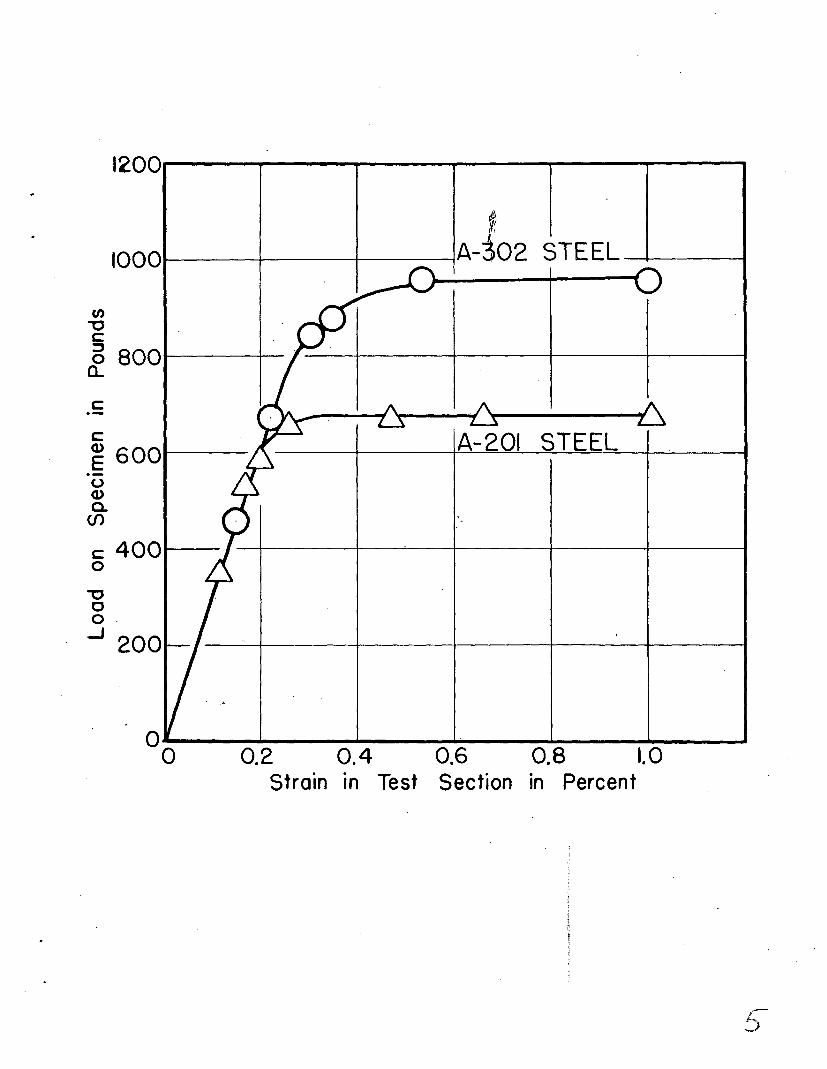
The relation between deflection, strain, and loads for the normalized and
stress relieved A-302 and A-201 on the first tension cycle is shown in Figures
4 and S. In the elastic range, the two steels behave nearly identically. Because
of its lower yield strength, the 1\-201 commences large plastic strain at lesser
deflections than the A-302. Thereafter,a given deflection induces greater plas
tic straining in the test section of the A-201 steel.than in that30f A-302. The
loads required to deflect the specimen likewise differ between the steels, as to
be expected from unequal t~nsile strengths.
(4)
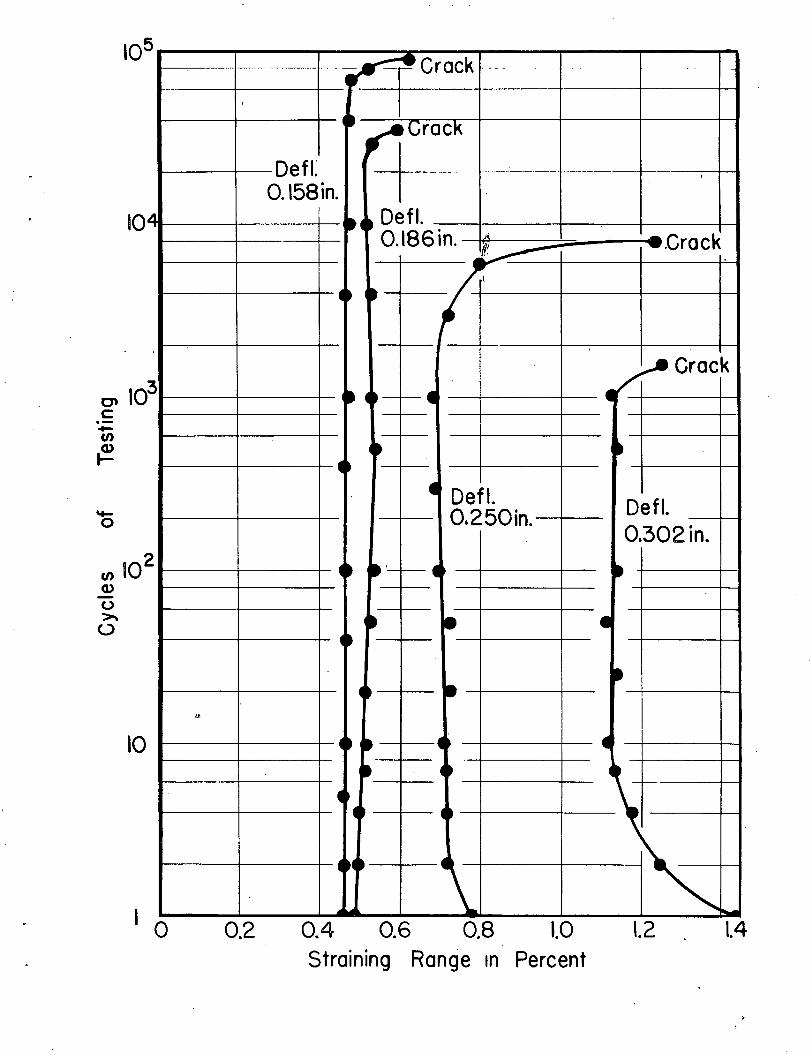
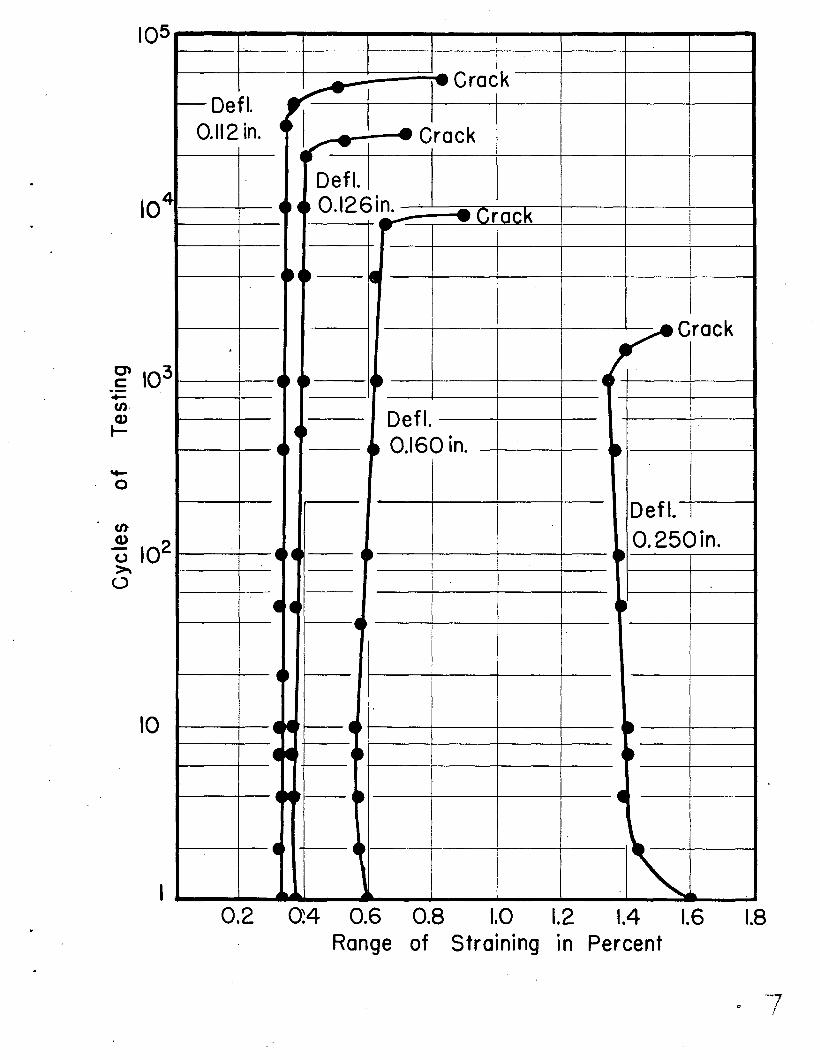
Under cyclic loading in the plastic range, the resistance of the steel to
failure can be expected to depend on the range of strain imposed throughout the
test. The variation of strain with cycling is shown for the standard heats of
two steels in Figures 6 &id 7. The strain is expresse'd as, that produced between
the points of maximum tension and maximum compression. At high deflections, the
strain range decreases noticeably during the first few cycles because of work har
dening. After about 10 cycles, there is little change in the strain. At low de
flection levels, the strain is nearly constant during the test. The sudden in~
crease in strain toward the end of the test indicates the initiation of a crack in
the gau?e section.
It should be possible according to these data, to 'express the severity of
loading fairly by the average straining ran~e effective during testing. Represen
tative values will be obtained by choosing the readings at 10 or 100 cycles. The
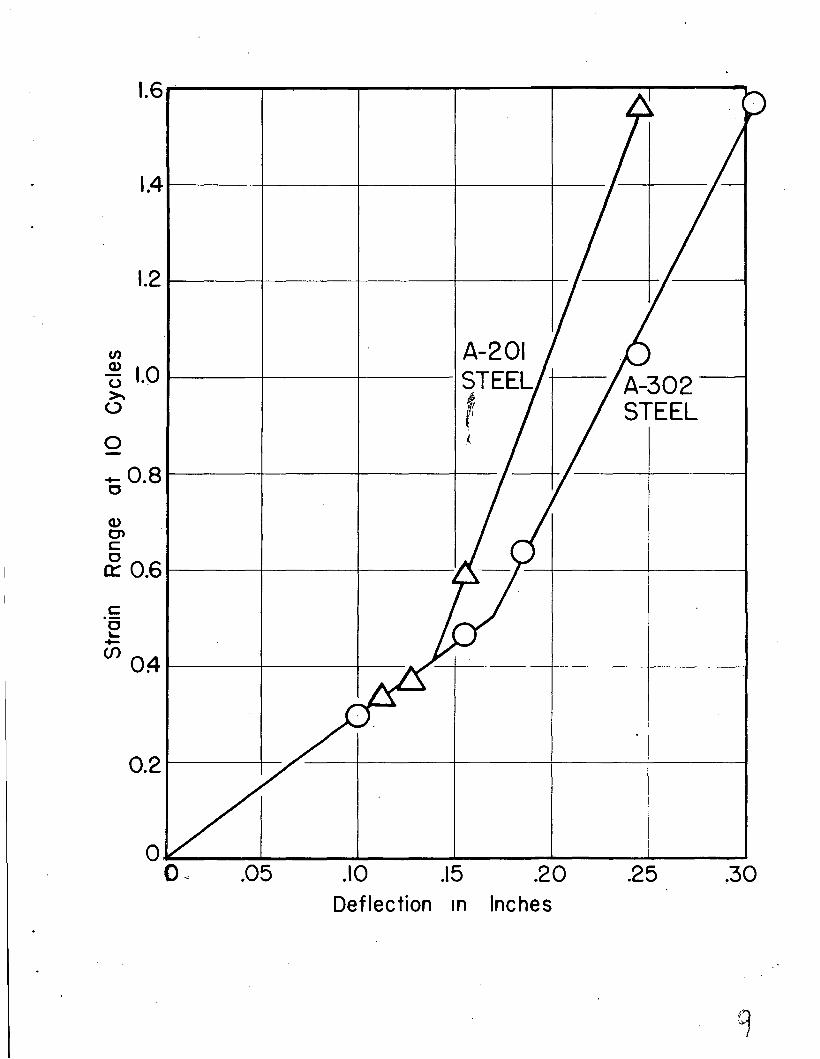
relation of straining to deflection at 10 cycles for the two steels is indicated
in Figure 8. At low deflections the two steels behave about alike, but at large
deflections the A-201 is strained considerably more than A-302, much as was shown
in Figure 4 for the initial tension cycle. The straining range after 10 cycles
was chosen as the criterion to express the degree of loading. It should be noted
however, that the conclusions reached in this paper would not be significantly al
tered if some other number of cycles were substituted, ~ncluding the initial ten
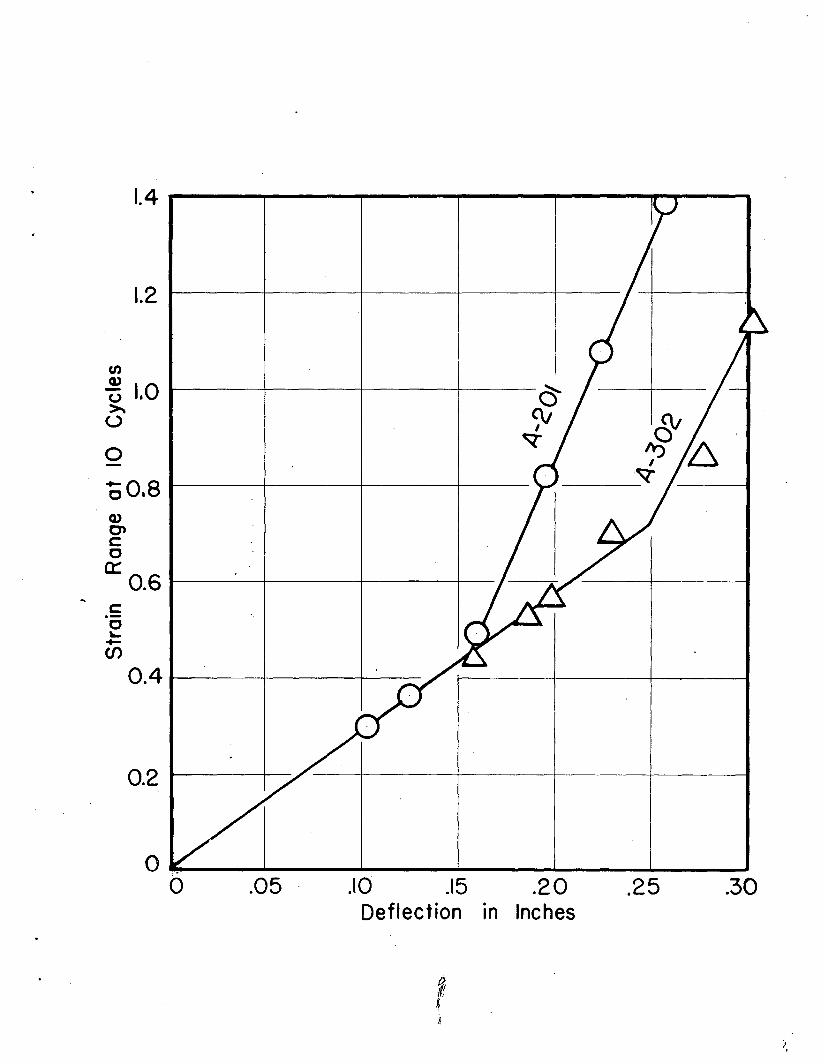
sion cycle. In Figure 9, strain ranges at 10 cycles are shawn for tho new heats
of A-302 and A-201.
Effect of Surface Preparation
The influence of the surface characteristics on the fatigue endurance limit
is well knovm. Cracks, discontinuities, tool marks, and simllar surface irreg
ularities lower the fatigue life seriously. Two questions therefore required
consideration: (1) is the action of the surface as strong in plastic fatigue'as
it is in the elastic range; and (2) what relative sensitivj.ty is shown by a high
strength stool and a carbon steel to surface conditions.
A series of surface preparations, selected to furnish information on. these
points, included the following:
1. polished to a 3/0 finish by hand2. ground to 50 G finish on a belt3. scaled (by normalizing treatment)4. scaled and pic~ed
5. notched 0.01 inch deep with a cutter 2 1/2 inches in diameter,45 0 included angle and 0.01 inch tooth radius
6. punch-marked by a Rockwell diamond indenter toa depth of 0.017inch at 1/2 inch intervals across the test specimen .
All specimens except the polished series were stress relieved as tho final
operation beforo testing. The notch for condition 5 above was produced by lower-
ing the milling cutter, vnthout lateral movement, the required depth into tho cen
ter of the test section. The resulting notch was about 3/8 inch long and was
perpendicular to the axis of .the specimen. Specimens for each condition were
tested at four strain levels with triplicates at each level. The number of
cycles to initiate the first visible crack was observed and also the number to
cause failure of the specimen as indicated by loss of load carrying c~pacity.
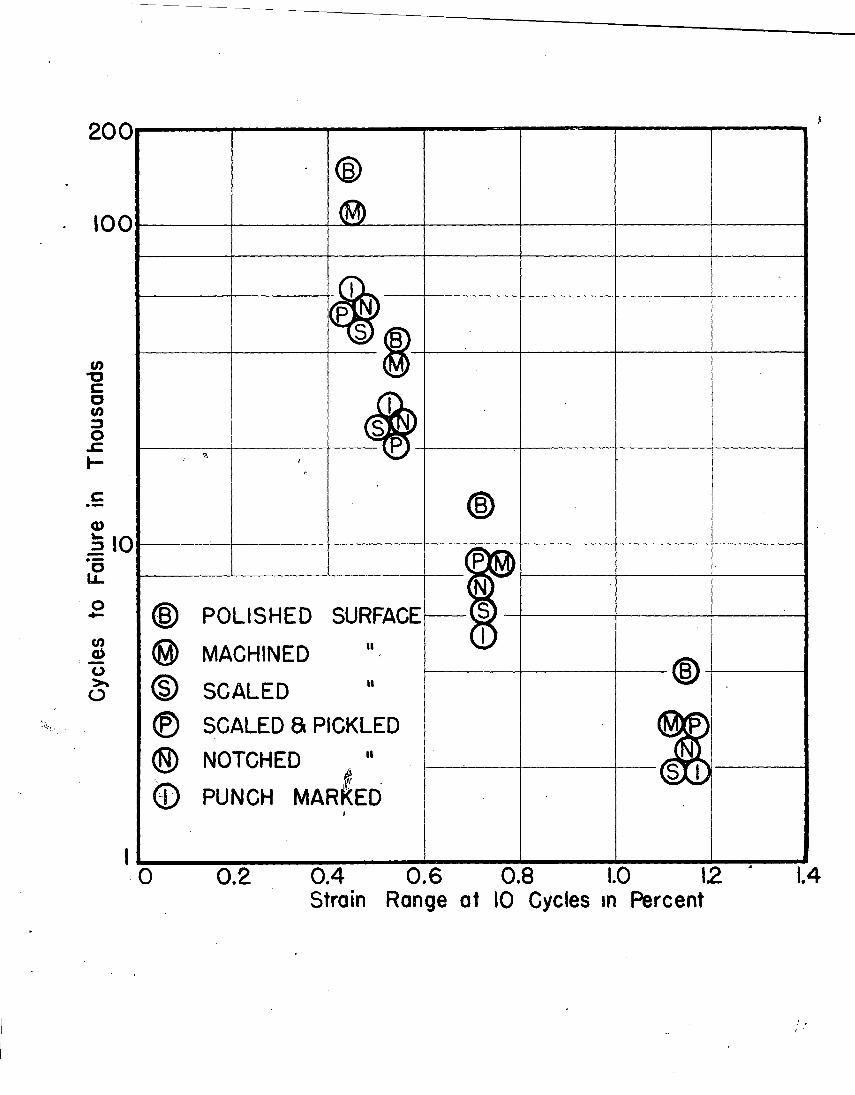
The results of these tests are shown in Figures 10 and ll•. The most favorable
surfaces should be the polished and the ground ones. The points for these condi-
tions lie at the top of the groups of data, that is, they show the largest cycles
to failure. For the A-302 steel in Figure 10 the other conditions are fairly
closely grouped at levels 30-40% lower than the polished series. The results for
the A-201 are more scattered. The effects of scaling or pickling seem small, but
the notches and punchmarks about halved the fatigue life.
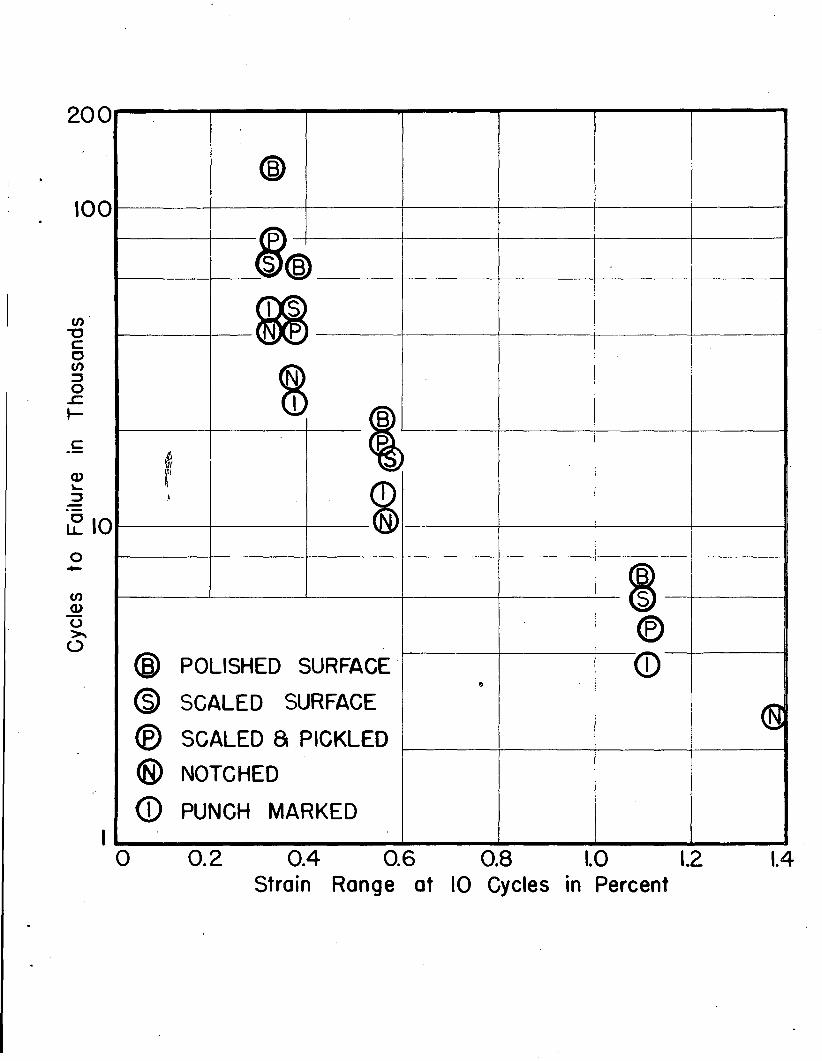
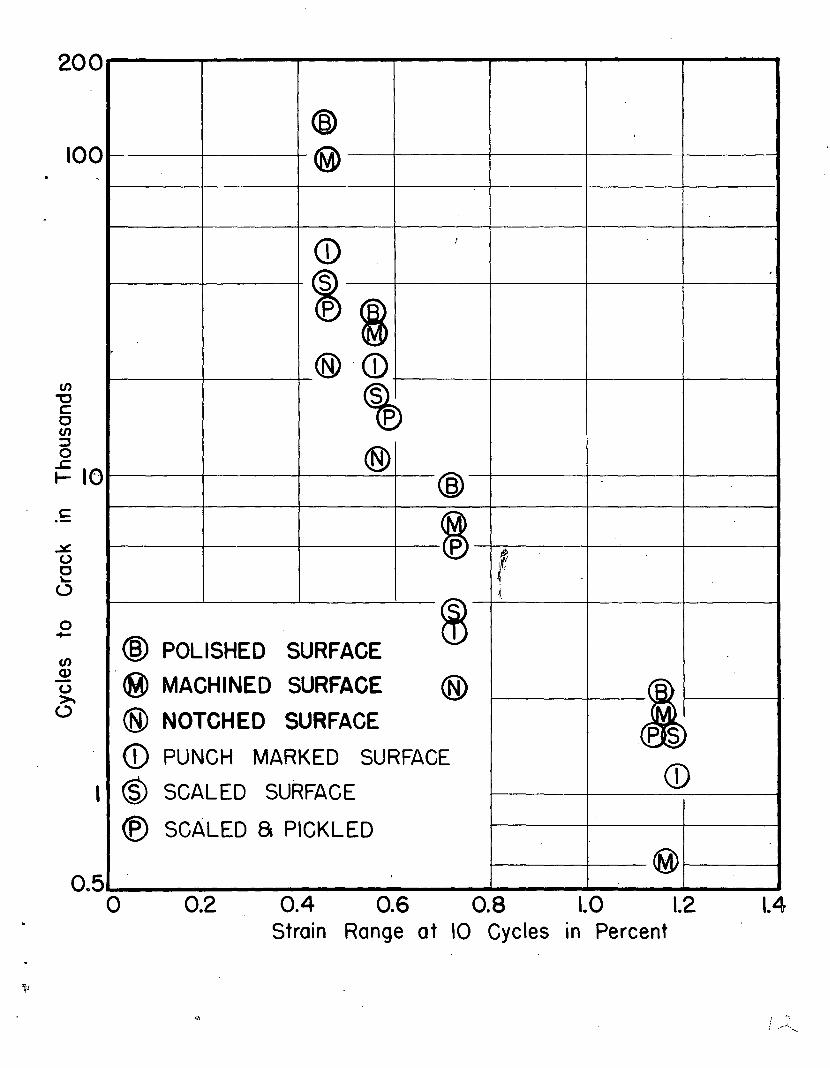
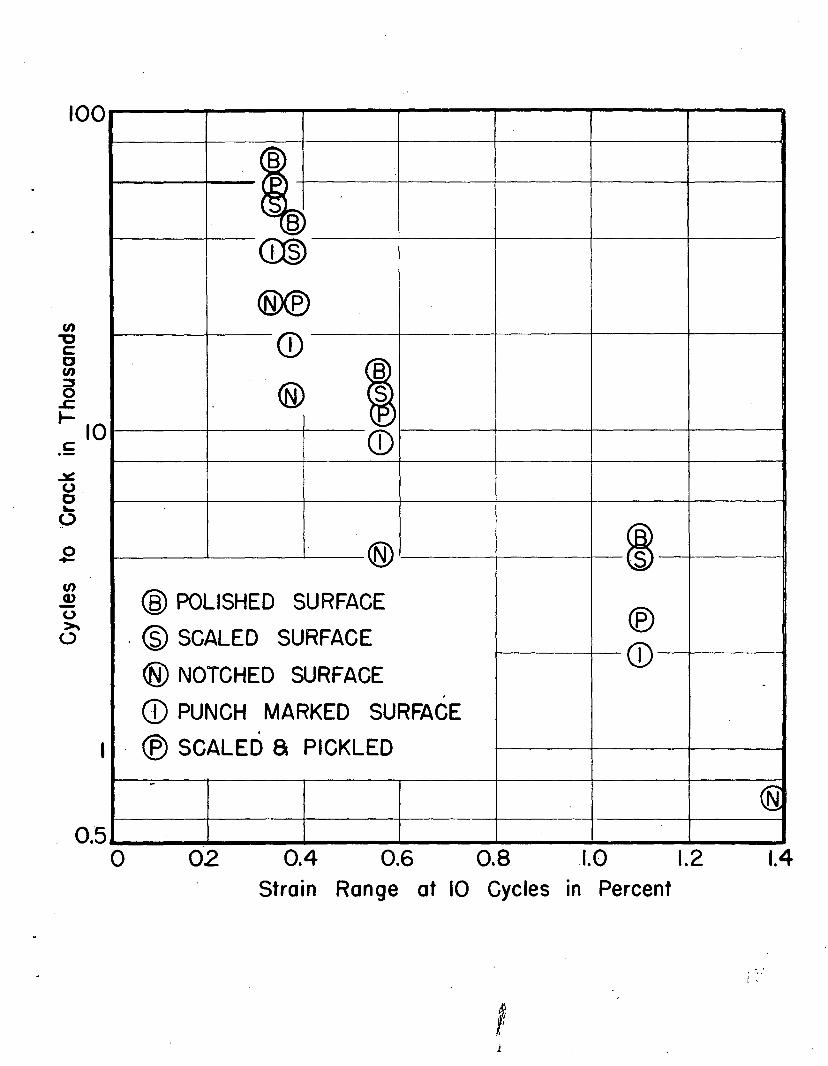
A similar plot is shown in Fi~ures 12 and 13 for the effect of surface pre
paration on tho cycles to the first crack. The noticeable difference between these
results and those of Fipures 10 and 11 is that notches or punchmarks are highly ef-
fective in lowering the cycles to the first crack. This behavior is to be expected
since crackinG originates early in the vicinity of these stress-raisers ... The life
of tho specimen after cracking is little aff~cted by the surface preparation.
Notice in the following table that the cycles between initial cracking and failure
(6)
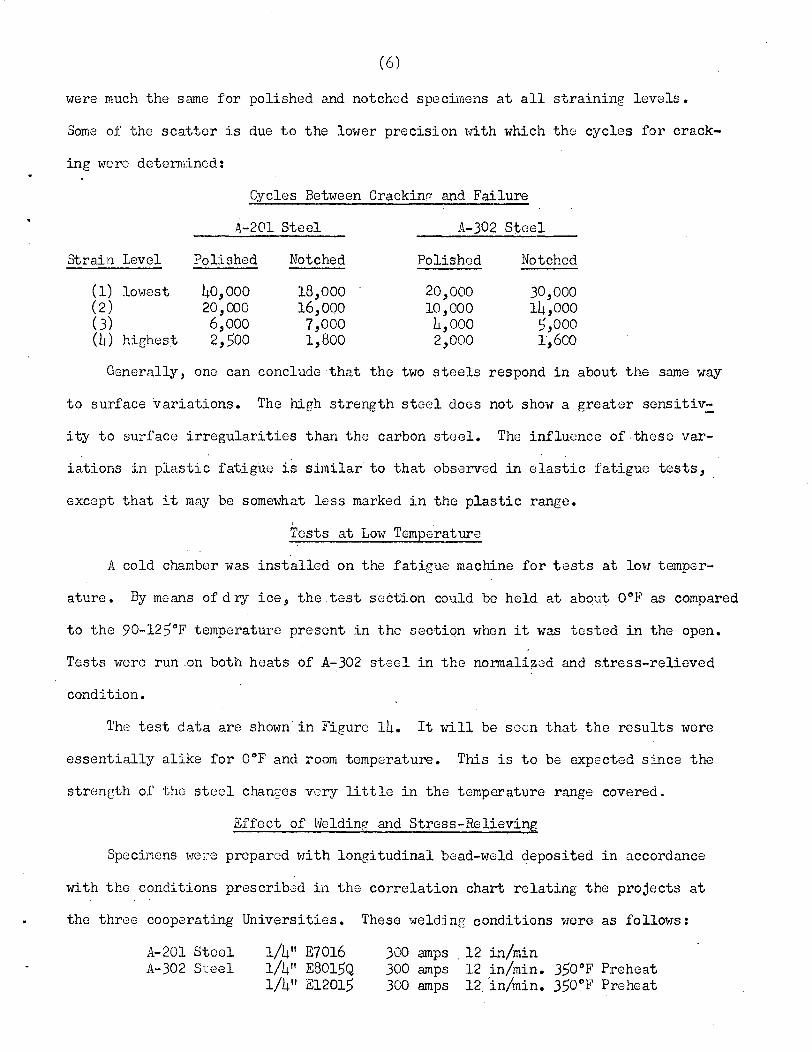
were much the same for polished and notched specimens at all straining levels.
Some of the scatter is due to the lower precision with which the cycles for crack-
ing were deterrninod:
Cycles Between Crackinr and Failure
A-201 Steel A-302 Steel
strain Level Polished Notched Polished Notched---- ---_.(1) lowest 40,000 18,000 20,000 30,000(2) 20,000 16,000 10,000 14,000(J) 6,000 7,000 4,000 5,000(4) highest 2;500 1,800 2,000 1,600
Generally, ono can conclude that the two stoels respond in about the same way
to surface variations. The high strength steel does not show a greater sensitiv~
ity to surface irregularities than the carbon steel. The influence oftheso var-
iations in plastic fatigue is similar to that observed in elastic fatigue tests,
except that it may be somewhat less marked in the plastic range.
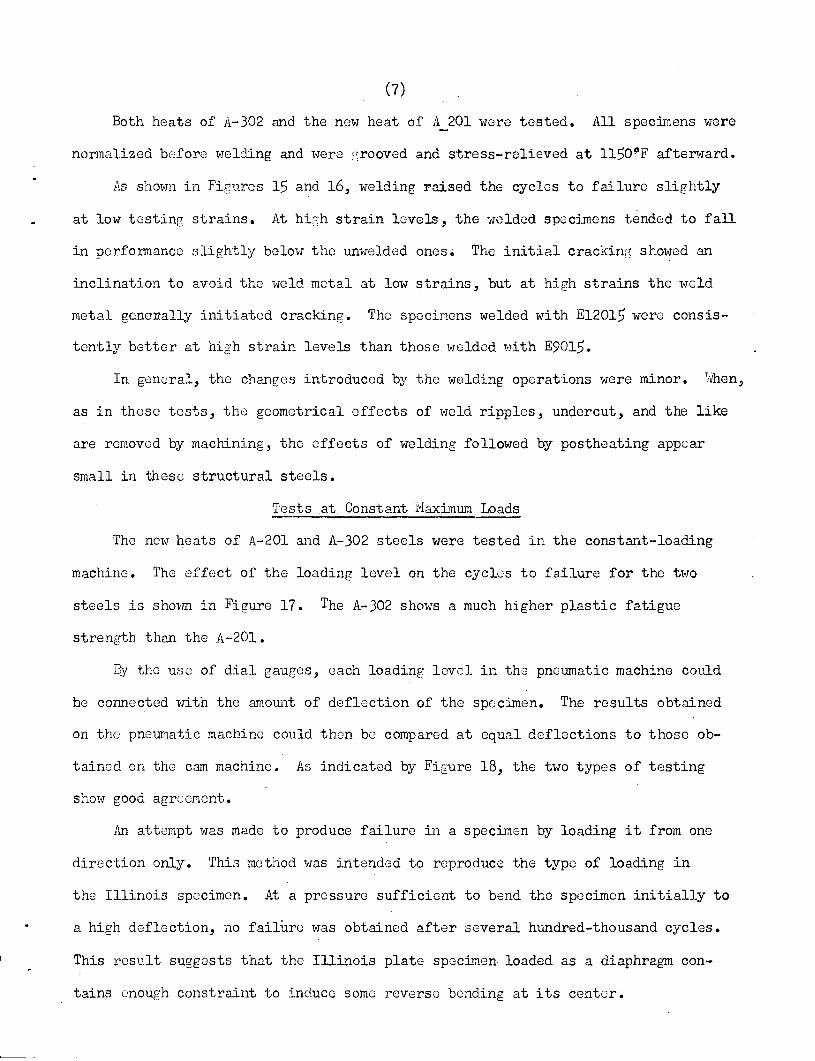
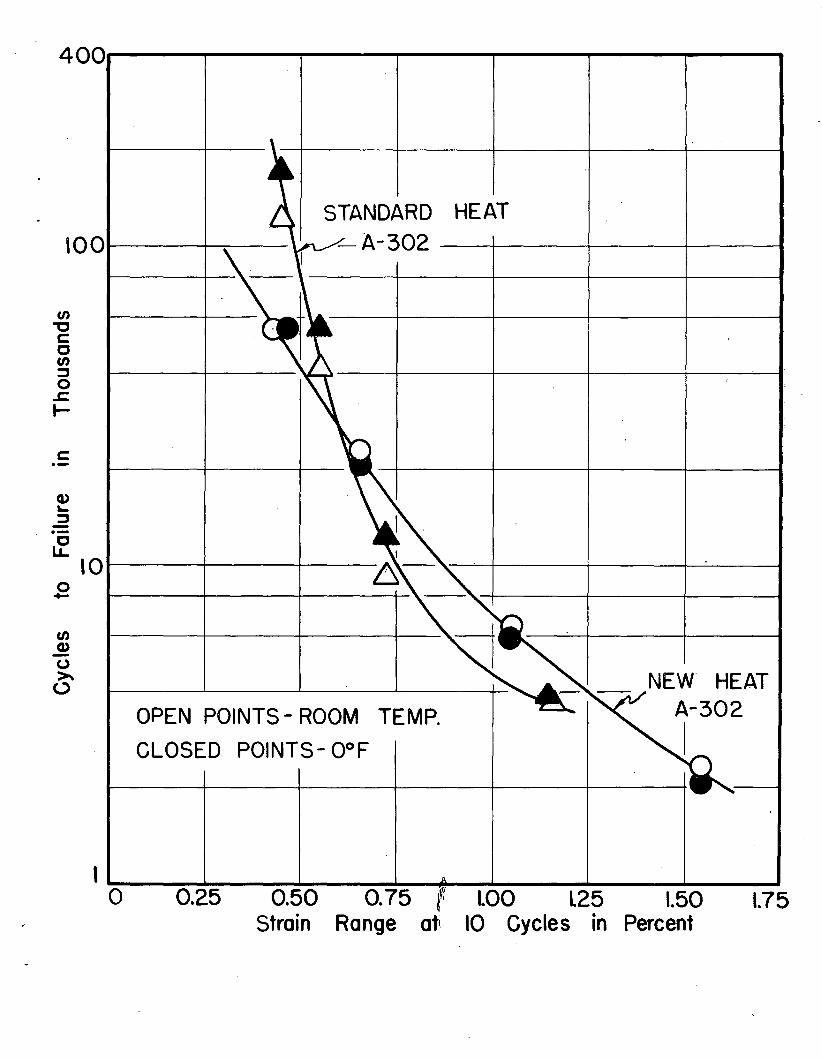
Tests at Low Temperature
A cold chamber was installed on the fatigue machine for tests at low temper-
ature. By moans of dry ice, the. test section could be held at about OOF as compared
to the 90-125°F temperature present in the section whon it was tested in the open.
Tests were run ,on both heats of A-302 steel in the normaliz2d and stress-relieved
condition.
'l'ho test data are shown in Figure 14. It will be seen that the results were
essentially alike for O°F and room temperature. This is to be expected since the
strength of tho steel changes very little in the temperature range covered.
Effect of WeldinR and Stress-Relieving
Specimons were propared 'lrJith longitudinal bead-wold deposited in accordance
with the conditions prescrib:Jd in the correlation chart relating the projects at
the throe cooperating Universities. These welding conditions were as follows:
A-201 Stoel 1/4" E7016 }JO amps . 12 in/minA-302 Steel 1/4" E8015Q 300 amps 12 in/min. 3.50°F Preheat
1/4" E12015 300 amps 12, 'in/min. 350°F Preheat
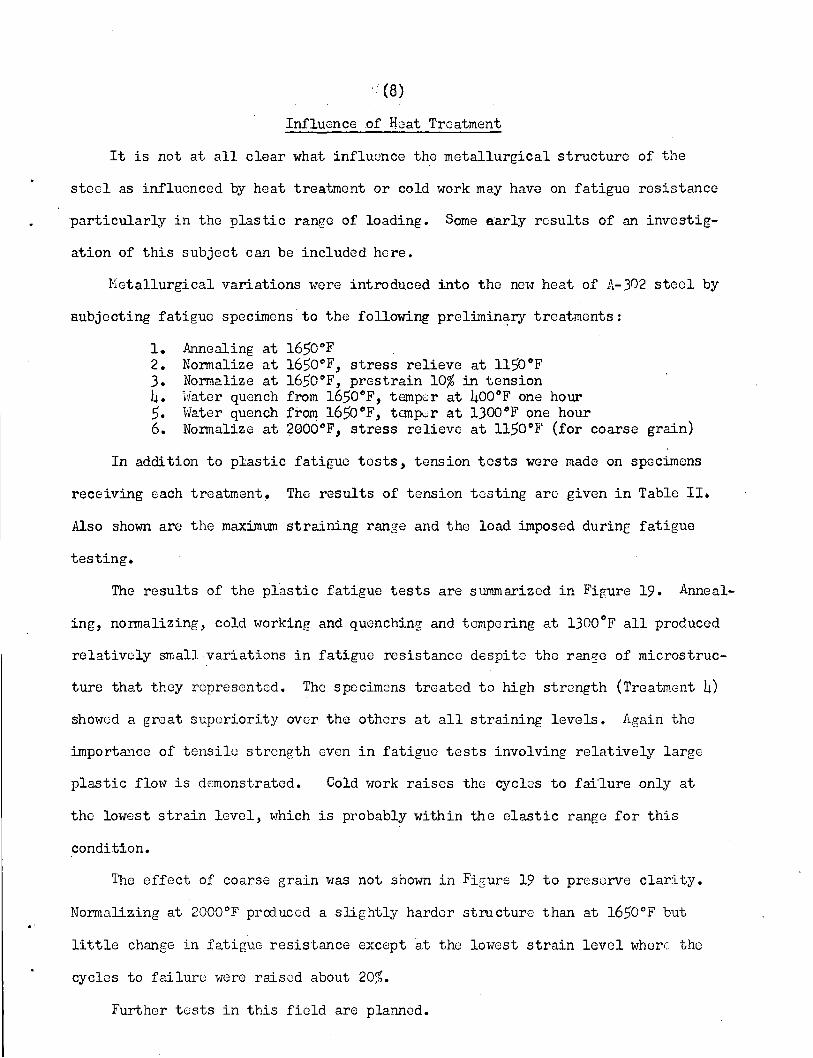
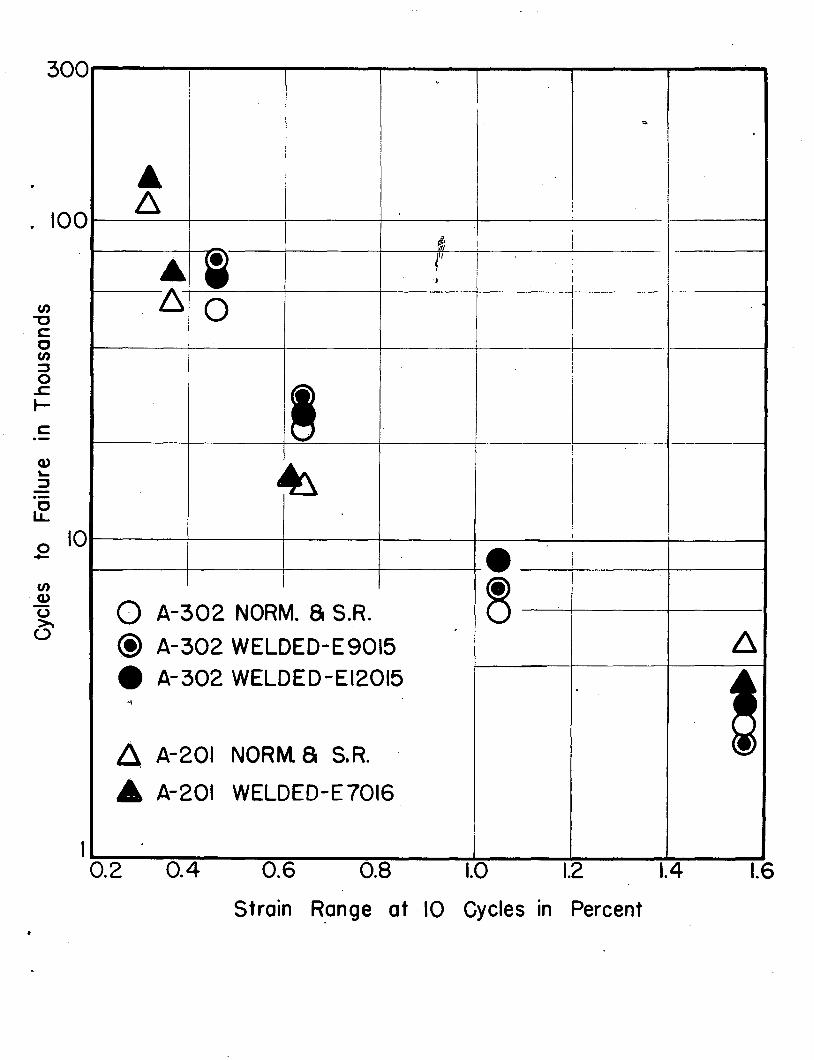
Both heats of A-302 and the now heat of A 201 were tested. All specnnens were
normalized b8fore welding and were ffrooved and stress-relieved at 11509 F afterward.
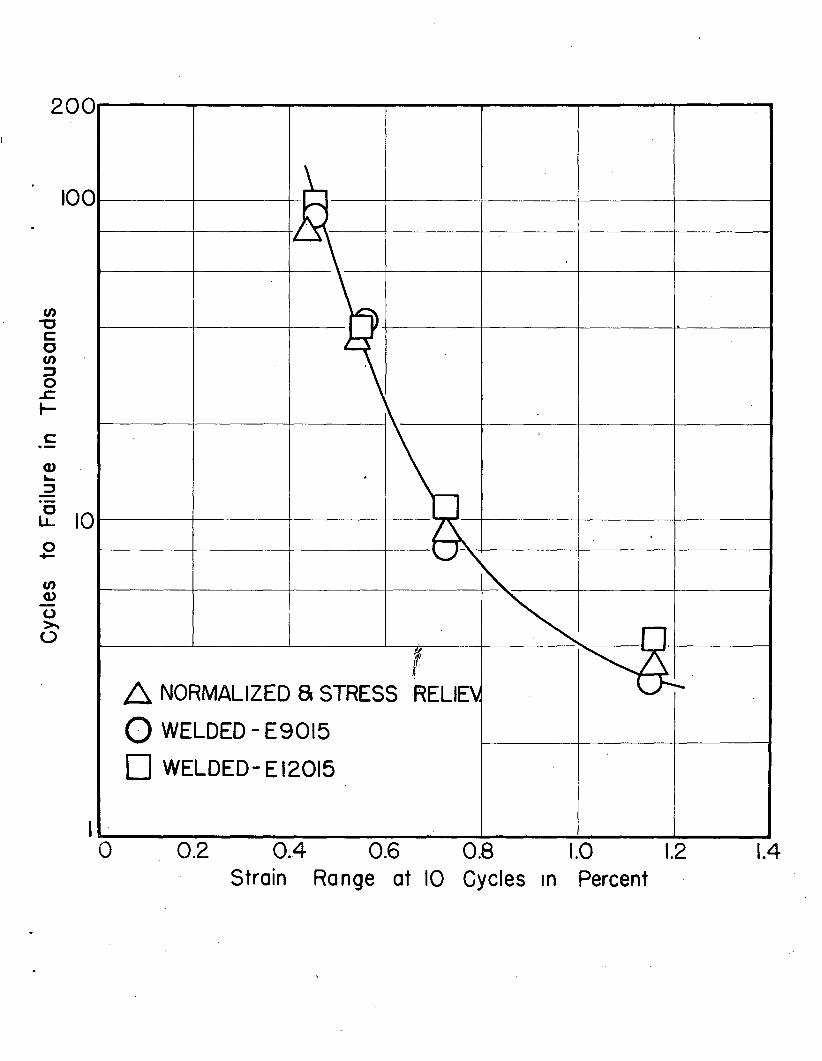
As shown in Figures 15 and 16, weldine raised the cycles to failure slightly
at low testing strains. At high strain levels, the wolded specimens tended to fall
in performance slightly below the unwelded onos. Tho initial crackin~ showed an
inclination to avoid the ~veld metal at low strains, but at high strains the Hold
metal genenally initiated cracking. The specimens welded with E12015 were consis
tently better at high strain levels than those welded with E9015.
In general, tho changes introduced by the welding operations were minor. When,
as in these tests, tho geometrical effects of wold ripples, undercut, and the like
are removed by machining, tho effects of welding followed by postheating appear
small in these structural steels.
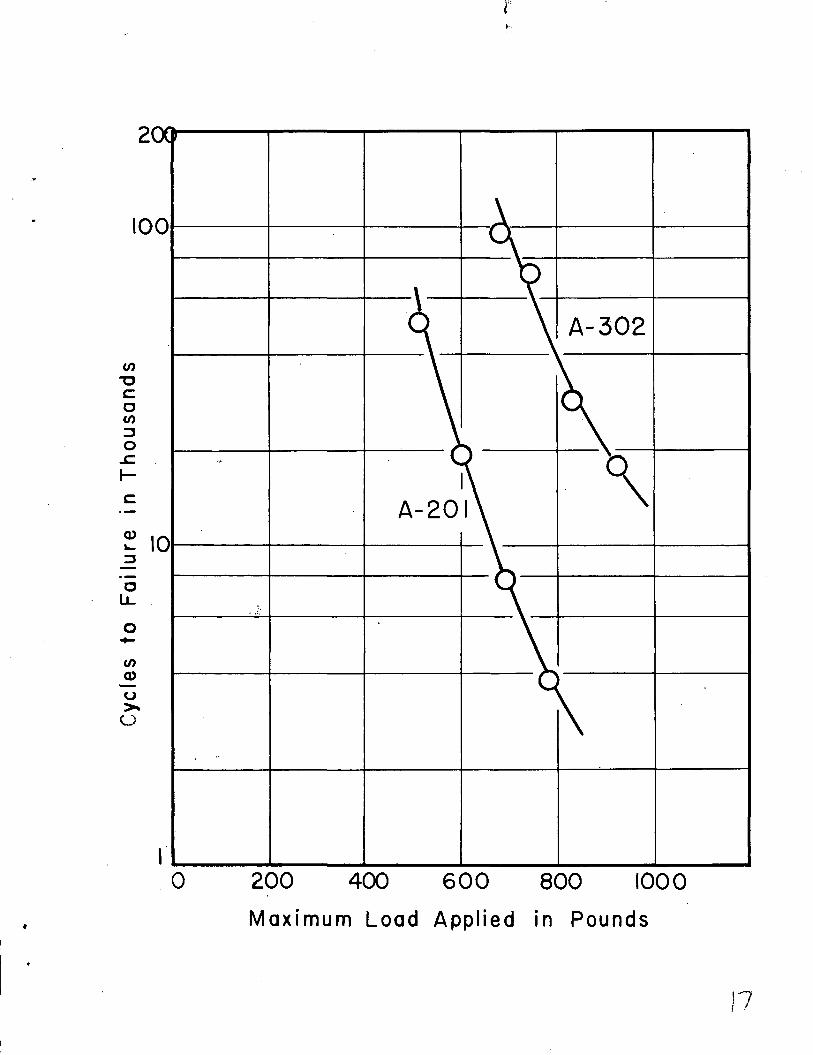
Tests .at Constant Maxnnum Loads
The now heats of A-201 and A-302 steels were tested in the constant-loading
machine. The effect of the loading level on the cyclos to failure for the two
steels is shovm in Figure 17. The A-302 shows a much higher plastic fatigue
strength than the A~201.
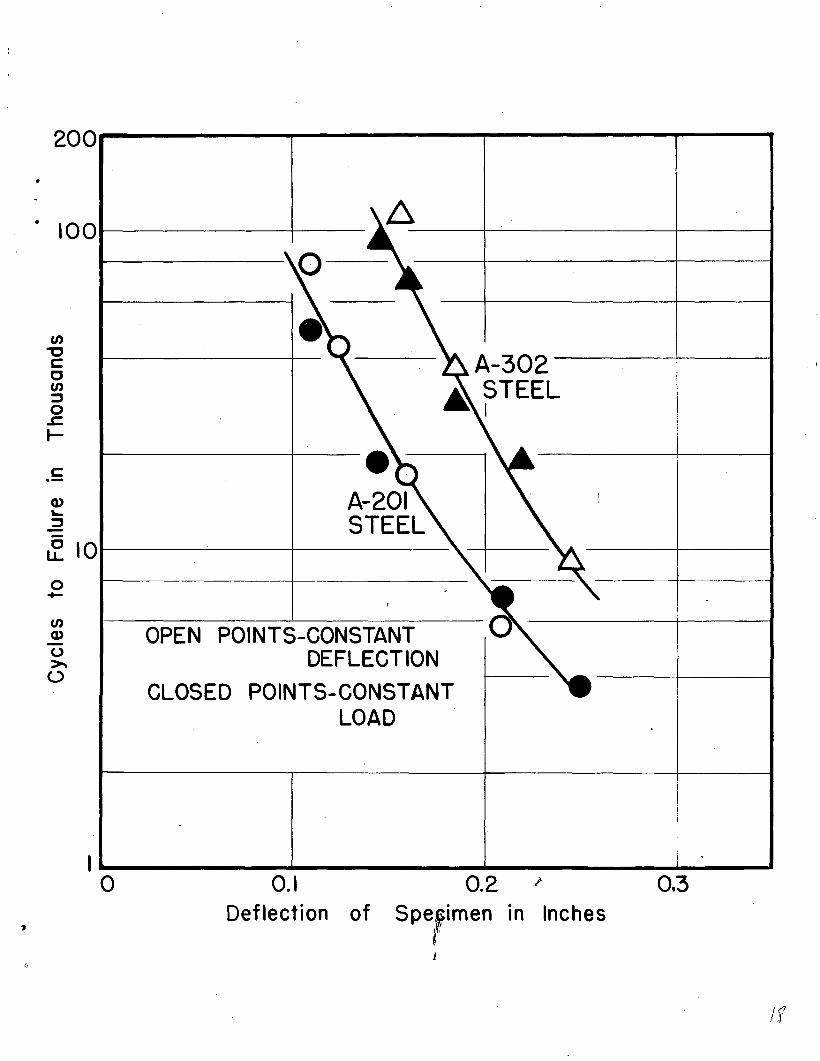
By the 11,'3e of dial gauges, each loading level in the pneumatic machine could
be connected with the amolli1t of deflection of the specimen. The results obtained
on the pneumatic machine could then be compared at equal deflections to those ob
tained on the cam machine. As indicated by Figure 18, the two types of testing
show good agreement.
An attempt was mado to produce failure in a specimen by loading it from one
direction only. This method vIaS intended to reproduce the type of loading in
the Illinois specimen. At a pressure sufficient to bend the specimen initially to
a high deflection, no failure was obtained after several hundred-thousand cycles.
This result suggests that the Illinois plato specimen loaded as a diaphragm con
tains enough constraint to induco somo reverse bonding at its center.
." (8)
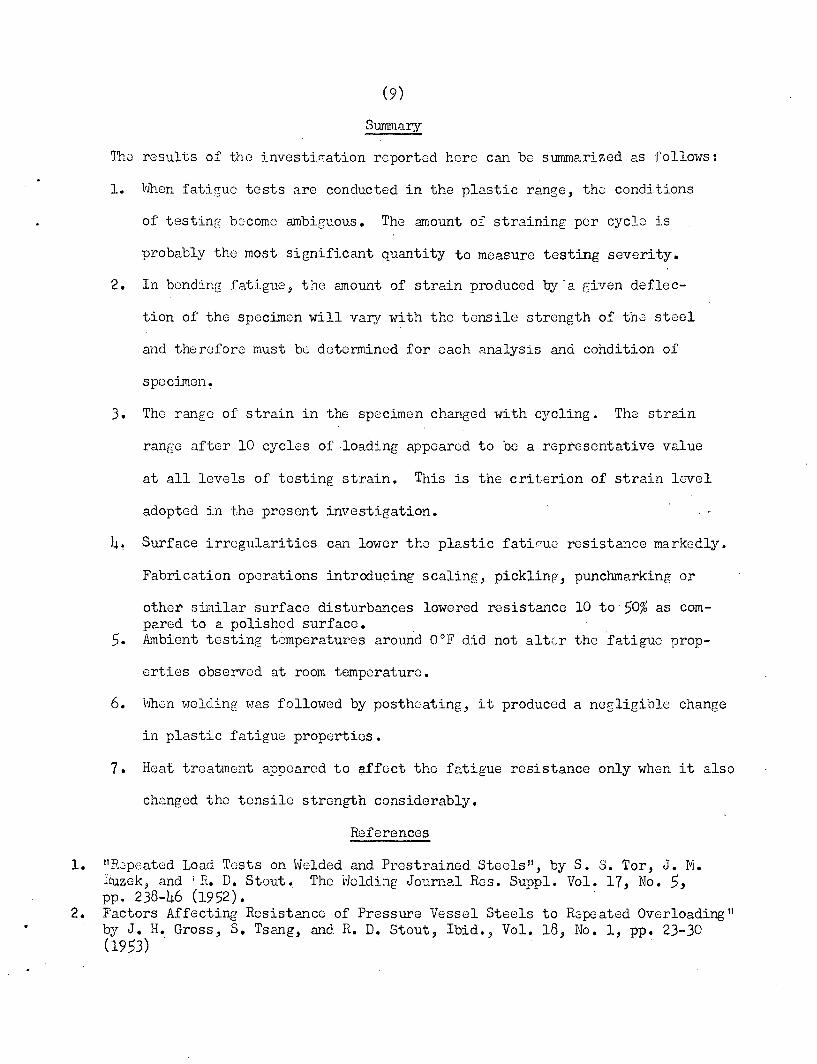
Influence ,of Heat Treatment
It is not at all clear what influence the metallurgical structure of the
steel as influenced by heat treatment or cold work may have on fatigue resistance
particularly in the plastic range of loading. Some early results of an investig-
ation of this subject can be included here.
r1cta11urgica1 variations wore introduced into the new heat of A-302 steel by
subjecting fatiguG specimens to the following prelimin~ry treatments:
1. Annealing at 1650°F2. Normalize at 1650°F, stress relieve at 1150°F3. Normalize at 1650°F, prestrain 10% in tension4. tJater quench from 1650°F, tempcr at 400°F one hour5. Water quench from 1650°F, tanp8r at 1300°F one hour6. Normalize at 2GOO°F, stress relieve at 1150°1" (for coarse grain)
In addition to plastic fatigue tests, tension tests were made on specimens
receiving each treatment, The results of tension testing are given in Table II.
Also shown are the maximum straining range and the load imposed during fatigue
testing.
The results of the plastic fatigue tests are summarized in Figure 19. Anneal-
ing, normalizing, cold working andquonching and tempering at 1300°F all produced
relativo1y small variations in fatigue resistance despite tho ranqe of microstruc-
ture that they represented. Tho specimons treated to high strength (Treatment 4)
showed a great superiority over the others at all straining levels. Again the
importance of tensilo strength even in fatigue tests involving relatively large
plastic flow is demonstrated. Cold work raises the cycles to fai'lure only at
.'
the lowest strain level, which is probably within the elastic range for this
condition.
The effect of coarse grain was not shown in Figure 19 to preserve clarity.
Normalizing at 2000°F produced a slightly harder structure than at 1650°F but
little change in fatigue resistance except at the lowest strain level where the
cycles to failure were raised about 20%.
Further tests in this field are planned.
Summary
'Iho results of tho invGstin.:ation reported horo can be summarized as follows:
1. vJhen fatiguo tests are conducted in the plastic range, the conditions
of testing become ambiguous. The amount of straining per cycJJJ is
probably the most significant quantity to measure testing severity.
2. In bonding fatigue, the amount of strain produced by'a given deflec-
tion of tho specimen will vary with the tensile strength of the stoel
and therefore must be determined for each analysis and condition of
specimen.
3. The range of strain in the specimen changed l ..i th cJrcling. The strain
range after 10 cycles of loading appeared to be a representative value
at all levels of testing strain. This is the criterion of strain level
adopted in tho present investigation.
4~ Surface irregularities can lower tho plastic fatin-uG resistance markedly.
Fabrication operations introducing scaling, pickling, punchmarking or
other similar surface disturbances lowered resistance 10 to 50% as compared to a polishod surface.
5. Ambient testing temperatures around O°F did not alter the fatigue prop-
ortios observod at ro~n temperature.
6. lubGn welding was followed by posthcating, it produced a negligible change
in plastic fatigue properties.
7. Heat treatment appeared to affect the fatigue resistance only when it also
changed the tensile strength considerably.
References
1. II Repeatod Load Tests on vlelded and Prestrained Steels", by S. S. Tor, J. M.l~zek, .and ; R. D. Stout~ The Walding Journal Ros. Supple Vol. 17, No.5,pp. 238-46 (1952).
2. Factors Affecting Resistance of Pressure Vessel Steels to Repeated Overloading II
by J. H. Gross, S. Tsang, and R. D. Stout, Ibid., Vol. 18, No.1, pp. 23-30(1953)
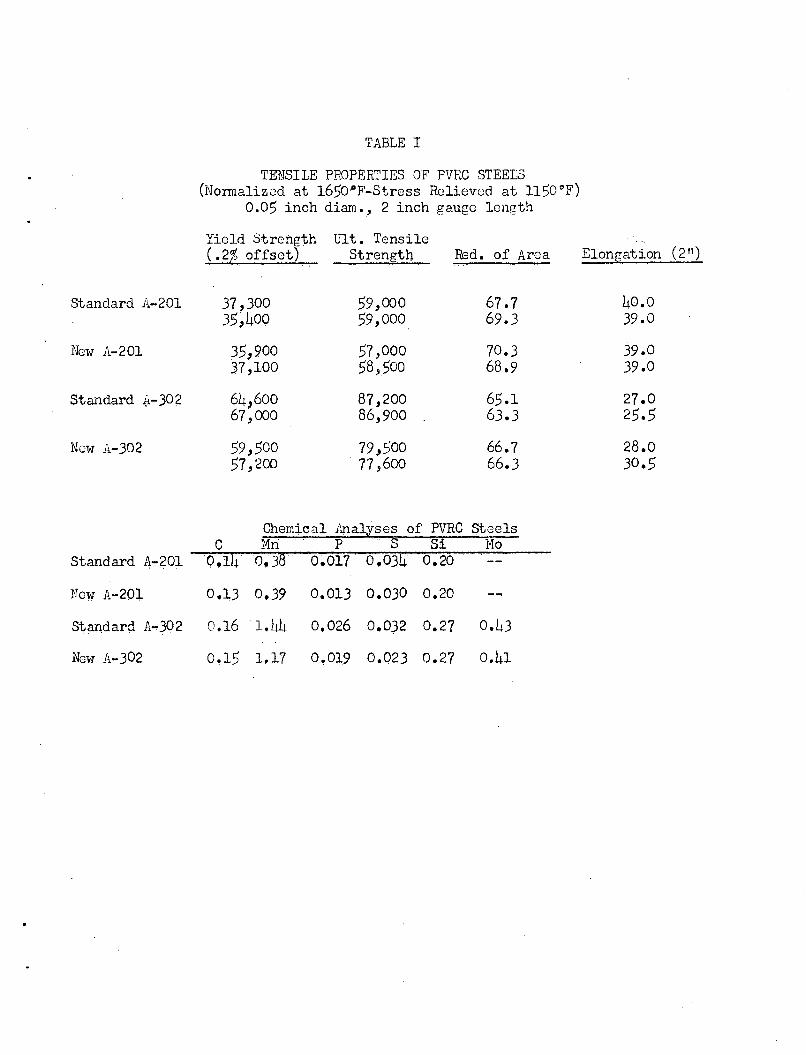
TABLE I
TENSILE PROPERTIES OF PVRC STEELS(Normalized at 1650-F-Stress Relieved at 1150 oF)
0.05 inch diam., 2 inch gauge longth
Yield Strength Ult. Tensile(.2% offsot) Strength Red. of Area Elongation (2 t1 )
Standard A-201 37,300 59,000 67.7 40.035,400 59,000 69.3 39.0
New 11.-201 35,900 57,000 70.3 39.037,100 58,500 68.9 39.0
Standard J:.- 302 64,600 87,200 65.1 27.067~000 86,900
~ 63.3 25.5
New 11.-302 59,500 79,500 66.7 28.057,200 77 ,600 66.3 30.5
Chemical Analyses of PVRC steelsC Mri P S Si Ho
Standard A~201 . ·O,l/.j. 0,38 0.017 . 0,034 0.20
NoW 11.-20], 0.13 0.39 0.013 0.030 0,,20
StaIldard 1',-302 0.16 1.44 0.026 0.03Z 0.27 O./.d
NOT 11.-302 0,15 1.17 0.019 0.023 0.27 0.41
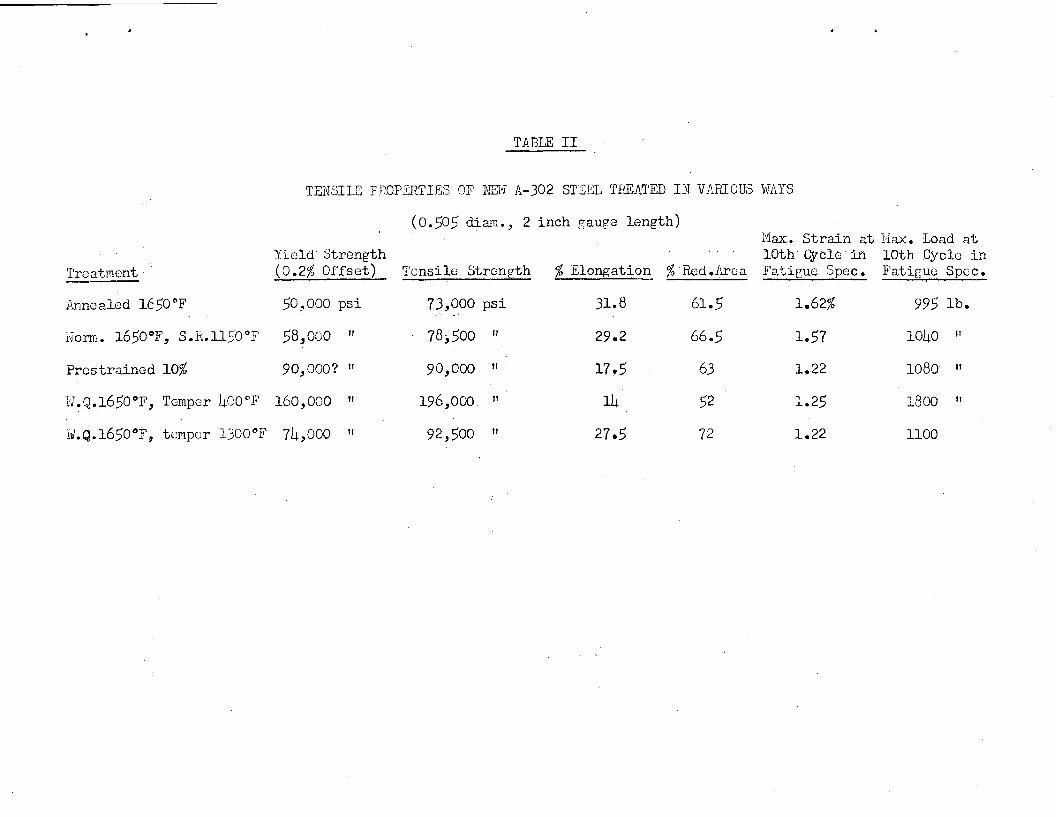
TABLE II
TENSILE PPOPERTIE,S OF J\JK\'J A-302 STEEL TEEA'I'ED Dr VARIOUS WAYS
(0.505 dia~., 2 inch gauge length)
Troatmont·Yield Strength(0.2% Offset) Tensile Strength
lViax. Strain at llax. Load at10th QVclc in lOth Cycle in
% Elongation_ % Red.Area Fatigue Spec. Fatigue Spec.
90,000? "
50 .• 000 psi 73,000 psi 31.8 61.5 1.62% 995 lb.
78,500 11 29.2 66.5 1.57 1040 11
90,000 II 17 .5 63 1.22 1080 II
196,000 11 14 52 1.25 1800 11
92,500 II 27.5 72 1.22 1100
"58,000
Annealed 1650°F
Prestrainod 10%
Fig. 1
Biaxial Plastic Fatigue Specimen
IS"-----~
rl-~--'--.... IN r-----
N
LIF:~6"==-=--j~-----l_~
1')1.L 1 l_-JI
I'
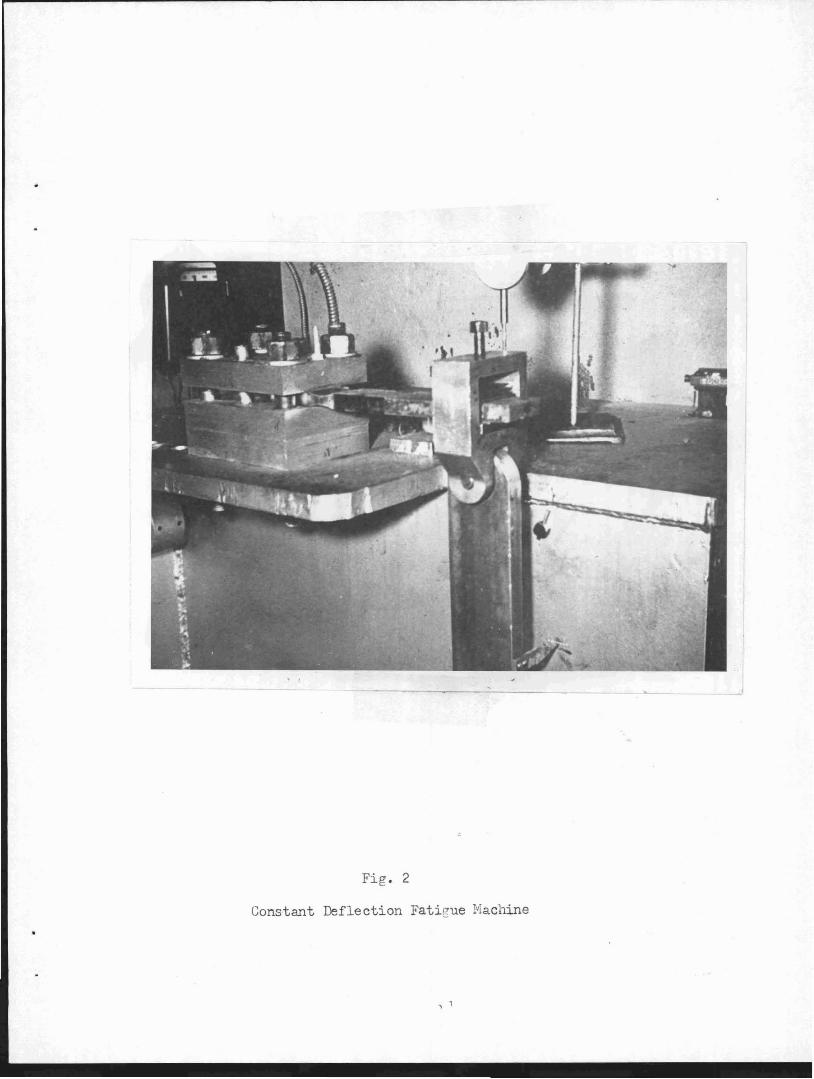
Fig. 2
Constant Deflection Fatigue Machine
, ,
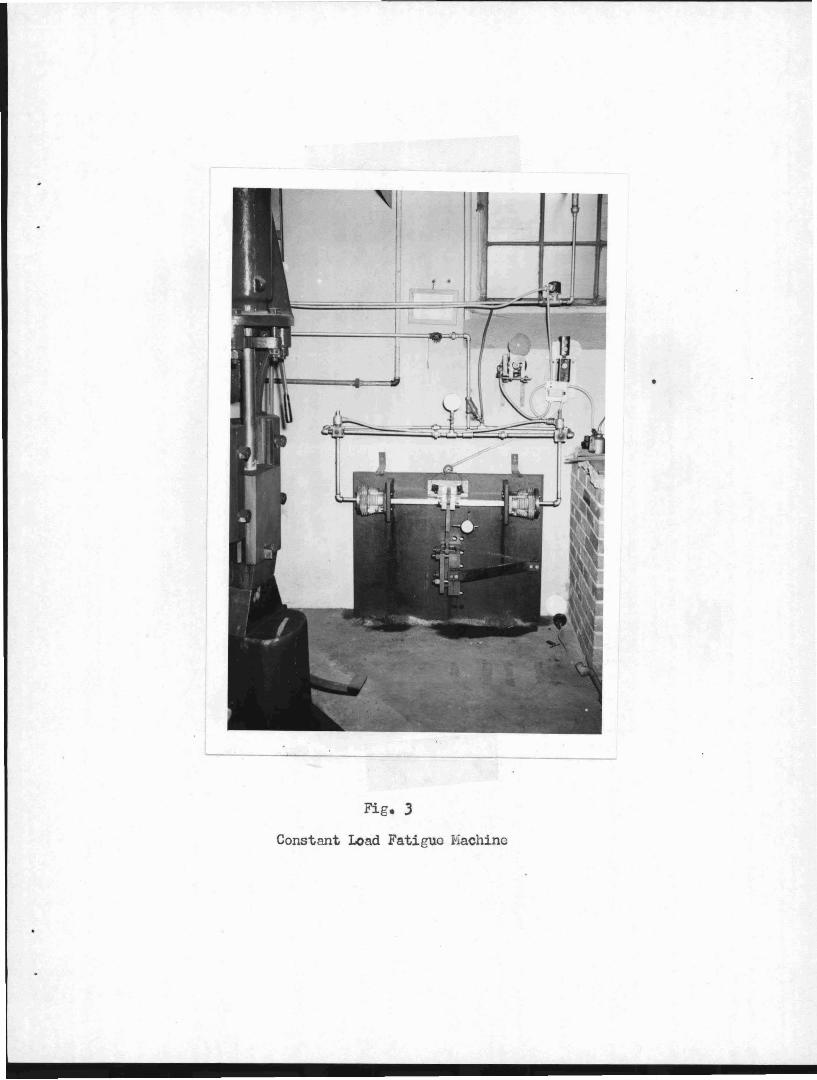
Fig. 3
Constant Load Fatigue Machine
•
Fig. 4
Strain Characteristics of A- 302 and A-201
Steels on FJ.rst Tension Cycle
1.2.----...,..----,------.,.---~---,------,
.30.25
A-302STEEL
.10. .15 .20Deflection in Inches
.05
~1.0
~,
+-s::::Q)u~
Q)
Cl. 0.8s::::.-s::::
.0+-
·~0.6(/)
+-(/)
~s:::: 0.4
s::::.-0~-(/) 0.2
Fig. 5
Load-Strain Characteristics of A-302ffi1d A-20l Steels on First Tension Cycle
1200r----.,----~--..,..----,------,------,
A-201 STEEL
en~c:g 8001------4-
a..
~
10001------I--------l~---1A-~02 STE EL --+--~---I
0~_~~----L.._---l---.J.....--.......L..--.....Jo 0.2 0.4 . 0.6 0.8 1.0Strain in Test Section in Percent
c:E600.-oQ,)
~(J)
c: 4001---o~oo·
--J 200
c:.-
Fig. 6
Effect of Cycling on Straining Range Produced
in A-J02 Steel under Constant Deflection
\
" '- ': t
\\ ' .\
\\
~~ \\. h .'. . . .. \
. ? ..\\ ... . •.. , .•..\/
.~
\
1.41.20.4 0.6 0.8 1.0Straining Range In Percent
0.2
----~Crack-- ----- . --_ .. - -
,
t ~{jrOCk
Deft ,
0.158in..J!I •• • Defl.
o.186~ ~.crack
H t
Crack:3 ••.- 1-- • 41
• •041 Defl.
0.250in. Defl.0.302 in.
0 .'--41 •~ • •.-
• It..'"
U It .. 41-
It u4
~ U
~ ~u
\=... -....
10
1 0
10
0'10c:
~
o
Fig. 7
Effect of Cycling on Straining Range Produced
in A-20l Steel Under Constant Deflection
105
'+-o
10
I~ Crack
~~Defl.
0.112 in. nl : Crack4(..... II
Defl. I04 t 0.126in. ; CrackIt"
It~ It 'ti
rCrraCk,
0 • U iII
Defl. I .
u I• • 0.160 in. • f
II
Defl. 1
•'.0.250in.I. I "I,
i
•~.11
I
0
•~ 4 t
•~ ~I_
4tl~-. •4 "=.
0.2 0~4 0.6 0.8 1.0 1.2 1.4 1.6 1.8Range of Straining in Percent
o 7
Fig. 8
Relation Between Deflection and the Range of Straining
at 10 Cycles for the Standard Heats of A-302 and A-201 Steels
.30.25.10 .15 .20Deflection in Inches
.05o 1Iio,.---~---I----'-----.L...---'----~
o
1.4 --------------....,.---~....---..
1.2 1------+---+-----+----+---
0.2 t--------f--
Q)
~co
a::: 0.6 ~--__4_--__+---_+_--~
(J)Q)
"0 1.0~
u
o"00.8
c.-o'~
en0.4 1------+----+--
Fig. 9
Relation Between Deflection and the Range of Straining at 10
Cycles for the New Heats of A-302 and A-201 Steels
.30.25
A-302STEEL
.10 .15 .20Deflection In Inches
.05o"'--__....L....__--L..__--I-__--I~__....L.______'
0"
en A-201~ 1.0 .----+----~---I STEEL
~ f(
0.2 1-------+-
1.4r----+-------t-----r----t-- -~--
1.6.--- --~--__r__--___,....--__,_--__..
1.2 1-----+------+------+-------1- --+- ----I
o_ 0.8 I------+-----f---__+_- --+- ----+----tC
Q)Ol~
ca:: 0.6 .-----+-------t-------'
~
c~-
(f) OA- I-----l-----+---
Fig. 10
Effect of Surface Preparation on the Plastic
Fatigue Resistance of A-302 Steel
1.40.4 0.6 0.8 1.0 12Strain Range at 10 Cycles In Percent
0.2
@
~
t~ II I
~?, I,I i,
®-- I(PJ~
(NI® POLISHED SURFACE (5)
?r>@ IIMACHINED ~,
®® SCALED "® SCALED a PICKLED .n~P)1
'l~'\!
® NOTCHED #.II lr\~ I
(S [I)(D MARRED --PUNCH
I
~
encD-(.)~
o
100
200
en"0c::oen::so.c..-c::.-Q)
~IO
~·0~
! •I·

Fig. 11
~ffcct of Surfneo Prcpnration Oil the Plastic
fatiguG Resistance of A-201 Steel
1.40.2 0.4 0.6 0.8 1.0 1.2Strain Range at 10 Cycles in Percent
@
~@
~
m~~
1.1
~,t,
;
$®
@ POLISHED SURFACE' <D.,
~ SCALED SURFACE~
® SCALED a PICKLED
® NOTCHED
<D PUNCH MARKEDIo
c:
100
200
~IO
CJ)Q)
<.J>.
<.)
CJ)
"Cc:CCJ)
::Jo
.J::.t-
o-
Fig. 12
Effect of Surface Preparation on the Incidence of
Initial Cracking of A-302 Steel in Plastic Fatigue
1.40.4 0.6 0.8 1.0 1.2Strain Range at 10 Cycles in Percent
0.2
@<M)
<D,
~~®CD,
®@
~ ~~'~
® POLISHED SURFACE~
@ MACHINED SURFACE ® I® NOTCHED SURFACE
<D PUNCH MARKED SURFACECD® SCALED SURFACE
® SCALED 8 PICKLED
(&1)
c:
0.5o
lOa
200
o-
(/)'1:)c:o(/)::Jo.c:~IO
(/)Q)-u~
<.)
! ':i _
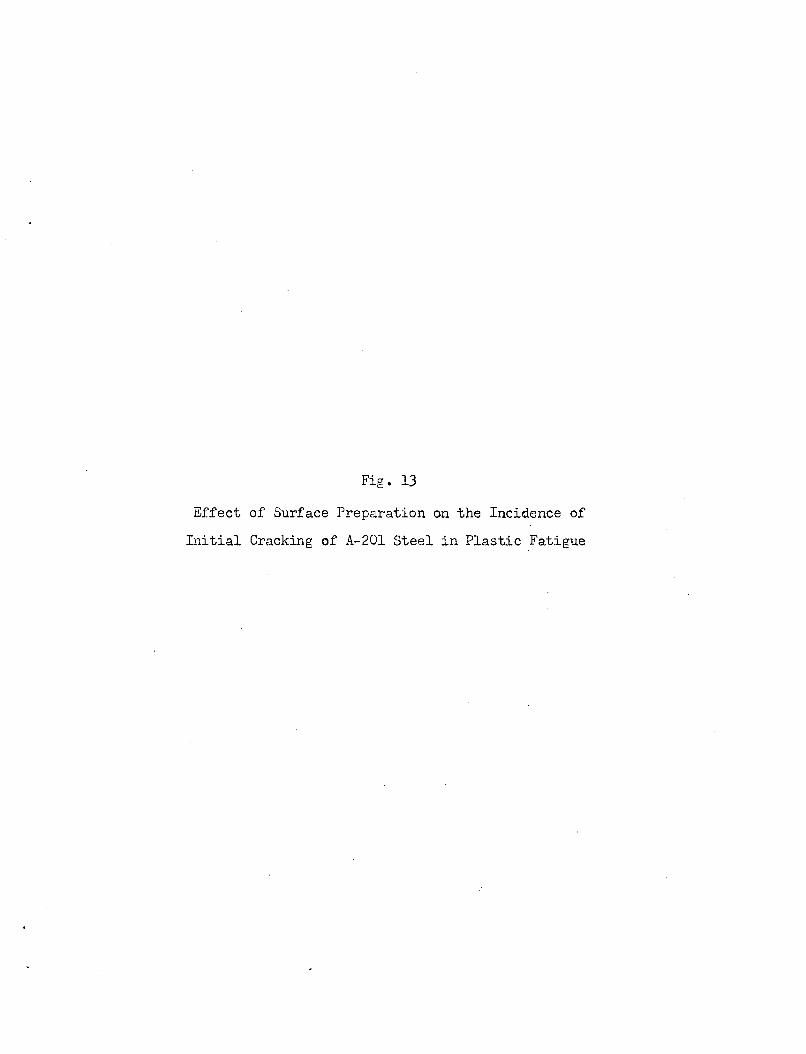
Fig. 13
Effect of Surface Preparation on the Incidence of
Initial Cracking of A-201 Steel in Plastic Fatigue
100
fI)
"'Cc:ofI)
5.c~IOc:
(/)Q,)
o~
<..:>
~( .......
~CIl§)
®®CD
® ~Q)
® ~@ POLISHED SURFACE
®. @ SCALED SURFACECD® NOTCHED SURFACE
CD PUNCH MARKED SURFACE
® SCALED a PICKLED
-@
0.5o 02 0.4 0.6 0.8 1.0 1.2
Strain Range at 10 Cycles in Percent
I '
1.4
Fig. 14
Effect of Low Temperature on the Plastic
Fatigue Resistance of A-302 Steels
400---...,.---..........-----,---........,.---,...---...,....---\
NEW' HEATA-302
I
STANDARD HEAT
- A- 302 --+-----+-----+----1
OPEN POINTS - ROOM TEMP.
CLOSED POINTS- O°F
1001-------+---,---
en~c:0en~
0~.....
c:.-Q)~
~-.-~
100.....
enQ)-0~
0
1.75
,~__...L.-__......I.....__~_+-___L. .l____....I.___~
o 0.25 0.50 0.75 {( lOO L25 1.50Strain Range ati 10 Cycles in Percent
Fig. 15
Effect of Welding Followed by Stress-Relieving
on Plastic Fatigue Resistance of Standard A-302 Steel
100
1.40.2 0.4 0.6 0.8 1.0 1.2Strain Range at 10 Cycles In Percent
~
\~
\.
.•~
I ~~
~i'~ NORMALIZED a STRESS RELIEV
o WELDED - E9015
D WELDED-EI2015
200
Ia
(J)Q)
U~
(.)
Q)"~
~ 10o-
c:.-
Fig. 16
Effect of Welding followed by Stress-Relieving on Plastic Fatigue
Resistance of New Heats of A-302 and A-20l Steels
300,..----:----.,....--~--.-.,....-I-~--.,..---.....
..._---1
c.-
A6. 1001-----+-----+-/-----+-----+------'---- !-----I
I _ 1 #,l i. It------+----Jo':~--__+__--__t____-~~----'----. ..----t.. If r It----liO(/)
~
·cc(/)
::::::Jo~
t-
o A-302 NORM. a S.R.
@ A-302 WELDED-E9015e A-302 WELDED-EI2015
...-__+-__-+--__-+-___+_ e _-+-1----t-----t
~ --"--f-'~-I
I10....-----+-----+----+----+-------:1---+-------1.E(/)(l)
13~
l::!. A-201 NORM a S. R.
~ A-201 WELDED-E7016
I~_~~--:-~-~~--~--~--~--~0.2 0.4 0.6 0.8 1.0 1.2 1.4 1.6
Strain R.ange at ·10 Cycles in Percent
Fig. 17
Comparison of Plastic Fatigue Resistance of A-302 and
A-20l Steels Under Constant Load Tests
ex
a 1~
A-302
'.
~IA-201
10l
. ,~,
"
I
10
2
cl.L
o~
enQ)
o~
<..)
en\JCCen::lo~
t-
a 200 400 600 800 1000
• Maximum Load Applied in Pounds
I .
I
I
17{ ,
F~g. IS
Comparison of Constant Deflection and Constant load
Tests on New A-302 and A-201 Steels
200....-----..,...---------r--------r---"""'T
eA-201STEEL
OPEN POINTS-CONSTANTDEFLECTION
CLOSED POINTS-CONSTANTLOAD
o~
enQ)
o~
o
~ 10t-------'---+-----
Q)~
::::s--
en-cc:oen::::so~
~
.5
· 1001--------+---
0.30.1 0.2 I'
Deflection of Spe~imen in Inchesr·
1....- """'-- ....... ---10__-'
o,
,
Fig. 19
Effect of Heat Treatment and Cold WOrk on Plastic
Fatigue Strength of New A-302 Steel
1.751.500.75 1.00 1.25at 10 Cycles In Percent
0.2'5 0.50Strain Range
.-\!I
e
C+> .
0-6 @
m
@"
lrI
6 ANNEALED
0 NORMALIZED a STRESS RELIEVED 0e NORMALIZED a 10cro PRESTRAIN ~
o QUENCHED 8 TEMPERED-1300°F
@ QUENCHED 8 TEMPERED- 400°F,o
enQ)
u~
(.)
200
Q)~
:::J.-~
o-
en"0c:o.en:::Jo
.c..-
.!: 10
•'- 100