Embed Size (px)
Citation preview

© 2011 Alight Planning Slide 1
The Planning Maturity Curve: Where Are You?
Where Do You Want to Be?
Rand Heer, CEO Alight Planning
Ben Lamorte, VP Marking Alight Planning
© 2011 Alight Planning Slide 2
Rand Heer Business Activities
CEO, Alight Planning (Planning software)
Co-Founder, Aspirity (Microsoft BI consulting)
Founder, FP&A Train (Essbase training)
Founder, Pillar Corporation (Enterprise budgeting)
CFO for 2 public companies
Rockwell Int‘l, Biz Unit CFO and Corporate
Today‘s Speaker
Publications
Coauthor: “Business Intelligence: Making Better Decisions Faster”
Author of 10 white papers on planning/reporting topics
Education
MBA degree Harvard Business School
© 2011 Alight Planning Slide 3
Agenda
Introductions
The Planning Maturity Curve
Level One: Seat of the Pants
Level Two: Budgeting
Level Three: Reporting
Level Four: Forecasting
Level Five: Agile Planning
Case Study in Agile Planning: Pittsburgh Mercy
Short Break
Agile Planning Simulation
Implementing Agile Planning
Out of Excel
Level of Detail
Driver-Based Planning
Integrating Actuals
Scenario Analysis

© 2011 Alight Planning Slide 4
Business Value from Planning
Insights
Understanding things we didn‘t see before
Actionable Knowledge
Planning scenarios gives us the financial impact of
choices
Decisions
Having choices sets up decision making
© 2011 Alight Planning Slide 5
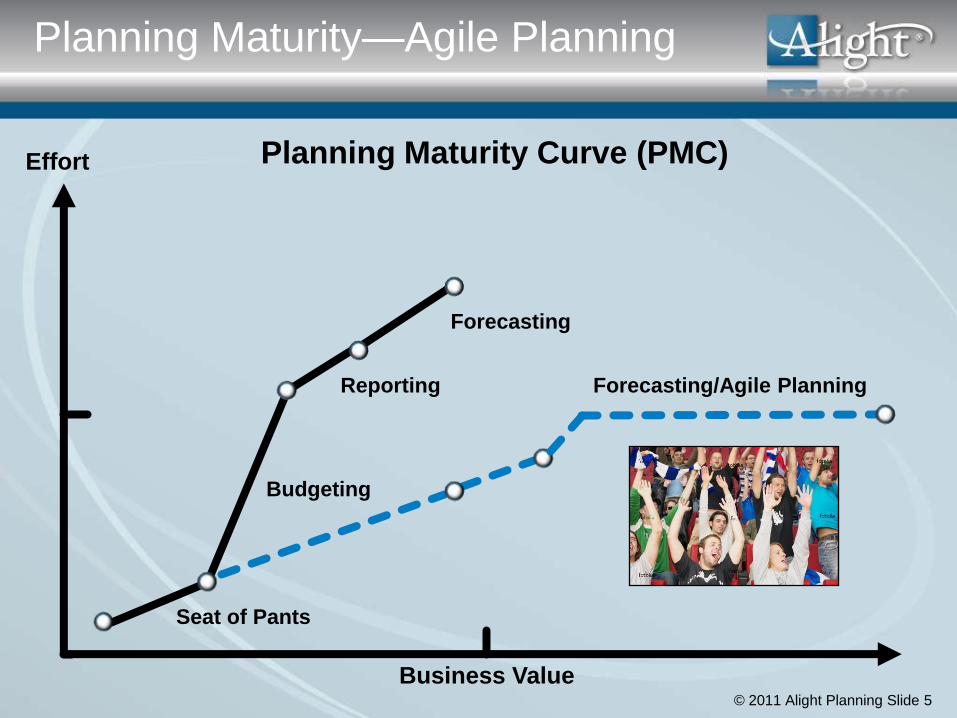
Planning Maturity—Agile Planning
Planning Maturity Curve (PMC)
Budgeting
Forecasting
Seat of Pants
Reporting
Effort
Business Value
Forecasting/Agile Planning
© 2011 Alight Planning Slide 6
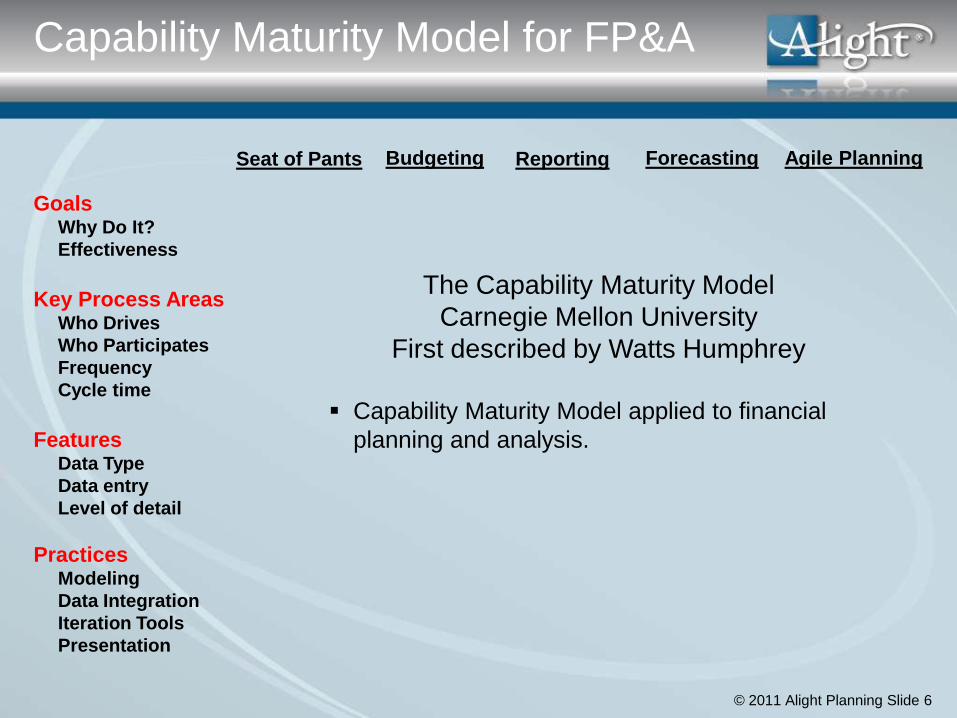
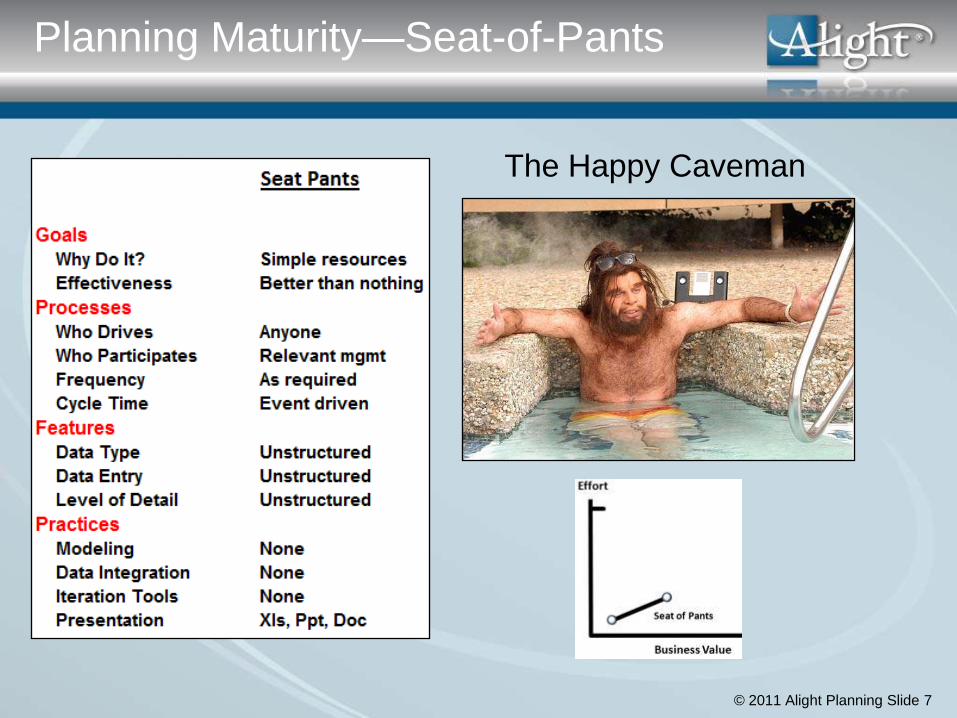
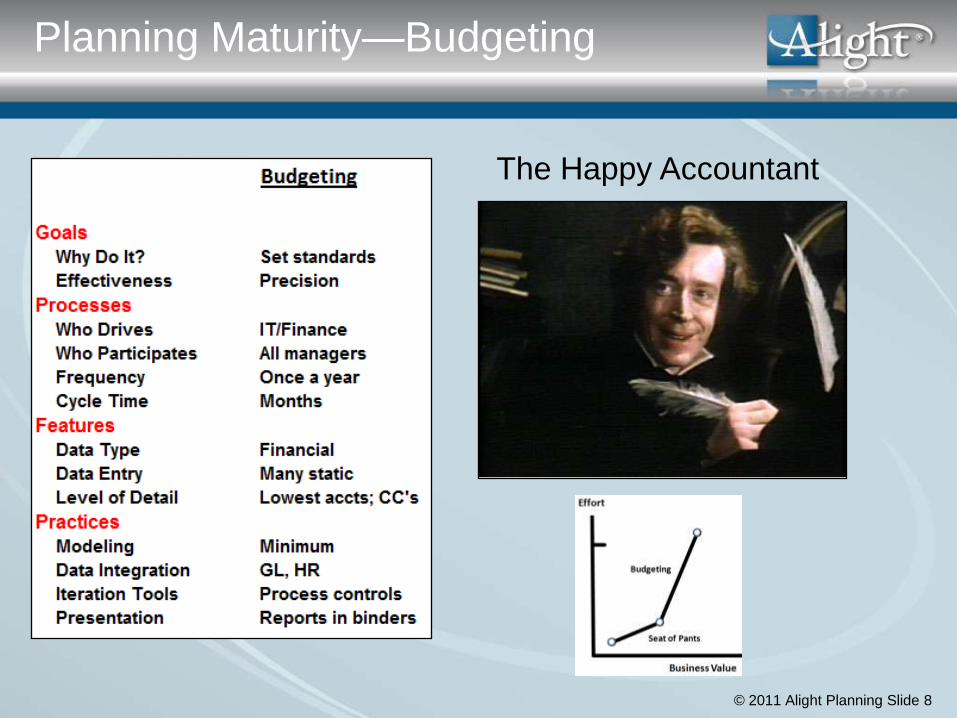
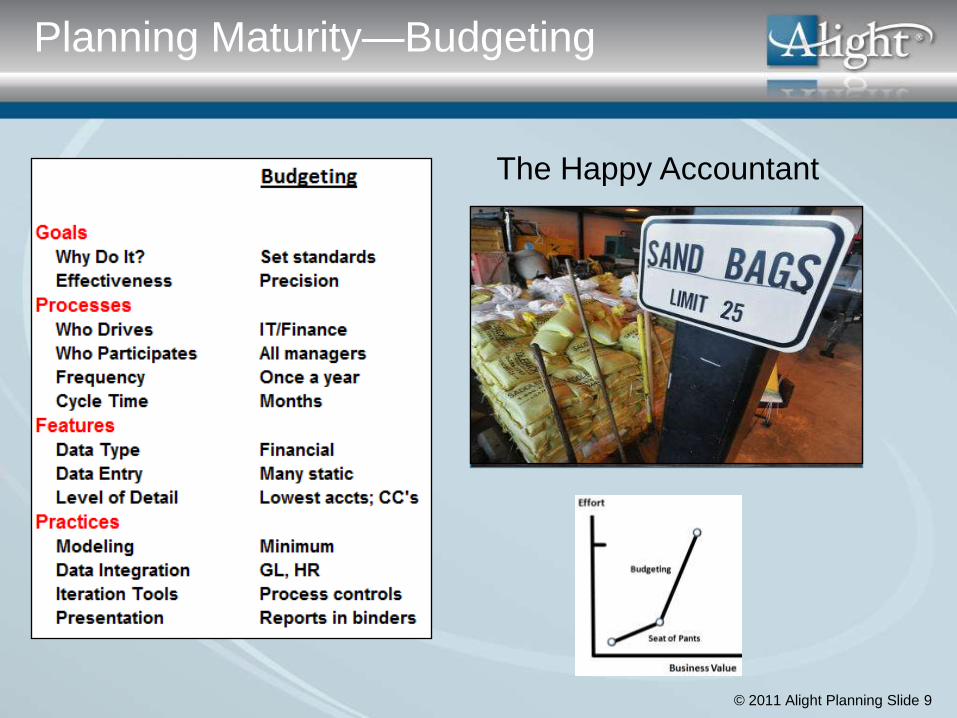
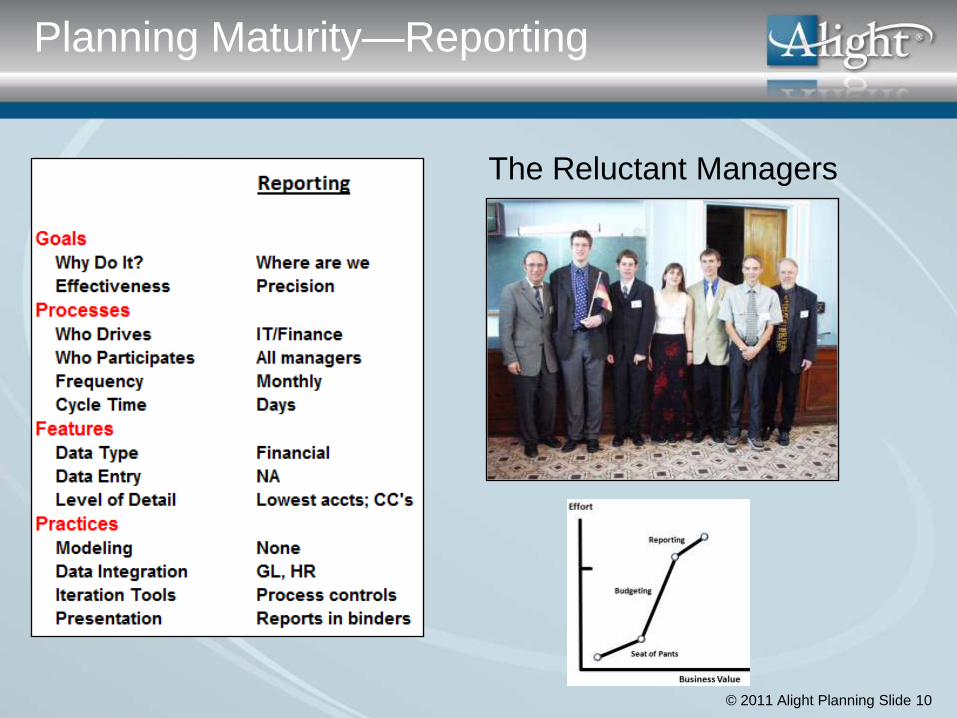
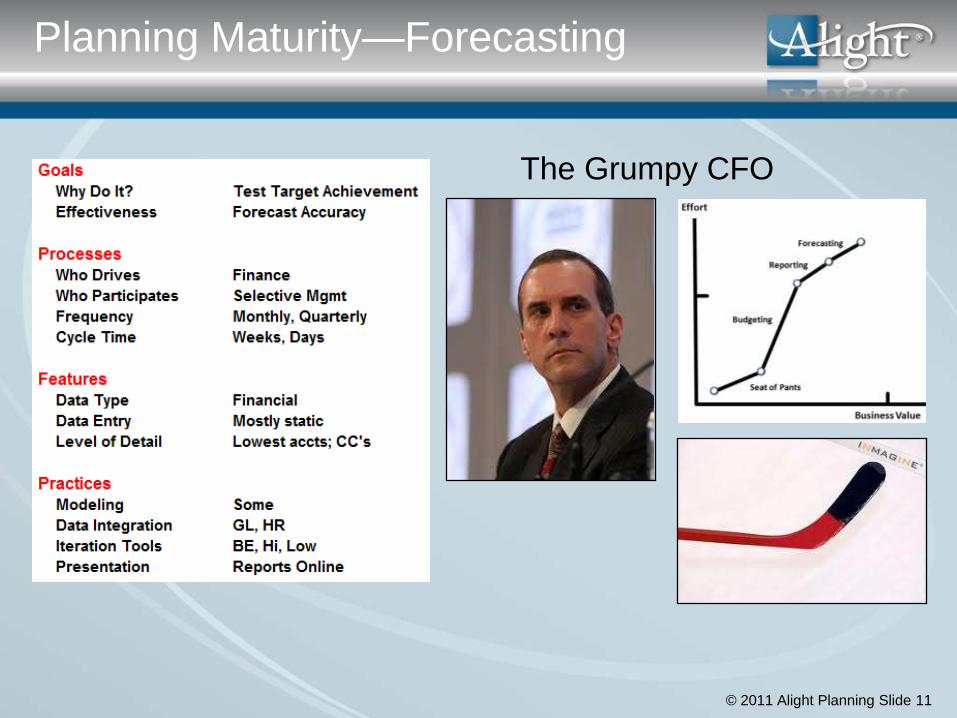
GoalsWhy Do It?
Effectiveness
Key Process Areas Who Drives
Who Participates
Frequency
Cycle time
FeaturesData Type
Data entry
Level of detail
PracticesModeling
Data Integration
Iteration Tools
Presentation
The Capability Maturity Model
Carnegie Mellon University
First described by Watts Humphrey
Capability Maturity Model applied to financial
planning and analysis.
Budgeting Forecasting Agile PlanningSeat of Pants
Capability Maturity Model for FP&A
Reporting
© 2011 Alight Planning Slide 7
Planning Maturity—Seat-of-Pants
The Happy Caveman
© 2011 Alight Planning Slide 8
Planning Maturity—Budgeting
The Happy Accountant
© 2011 Alight Planning Slide 9
Planning Maturity—Budgeting
The Happy Accountant
© 2011 Alight Planning Slide 10
Planning Maturity—Reporting
The Reluctant Managers
© 2011 Alight Planning Slide 11
Planning Maturity—Forecasting
The Grumpy CFO
© 2011 Alight Planning Slide 12
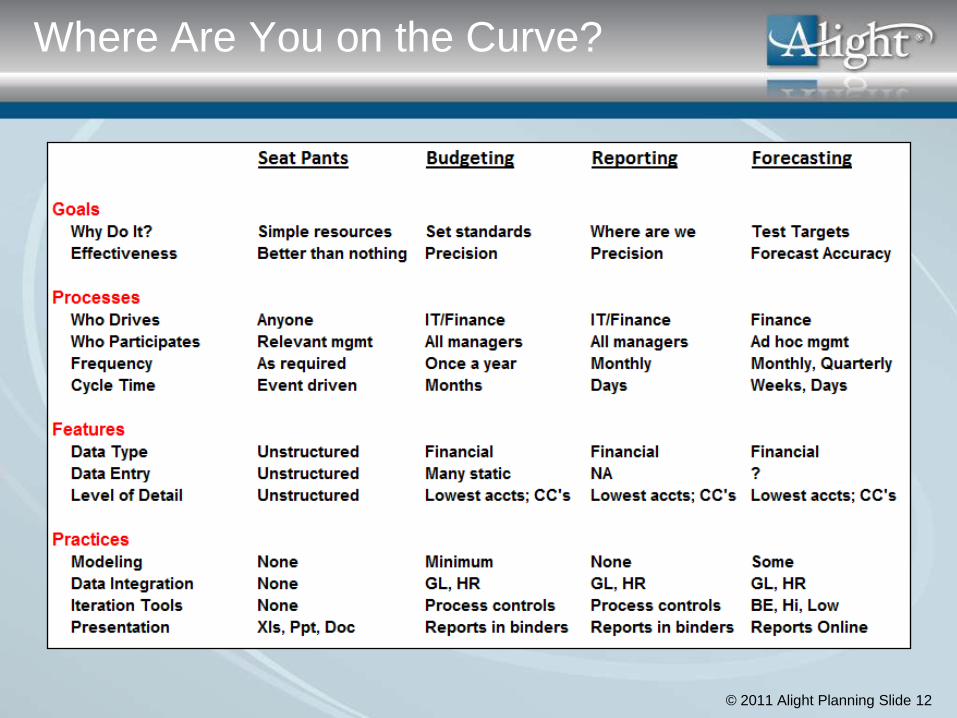
Where Are You on the Curve?
© 2011 Alight Planning Slide 13
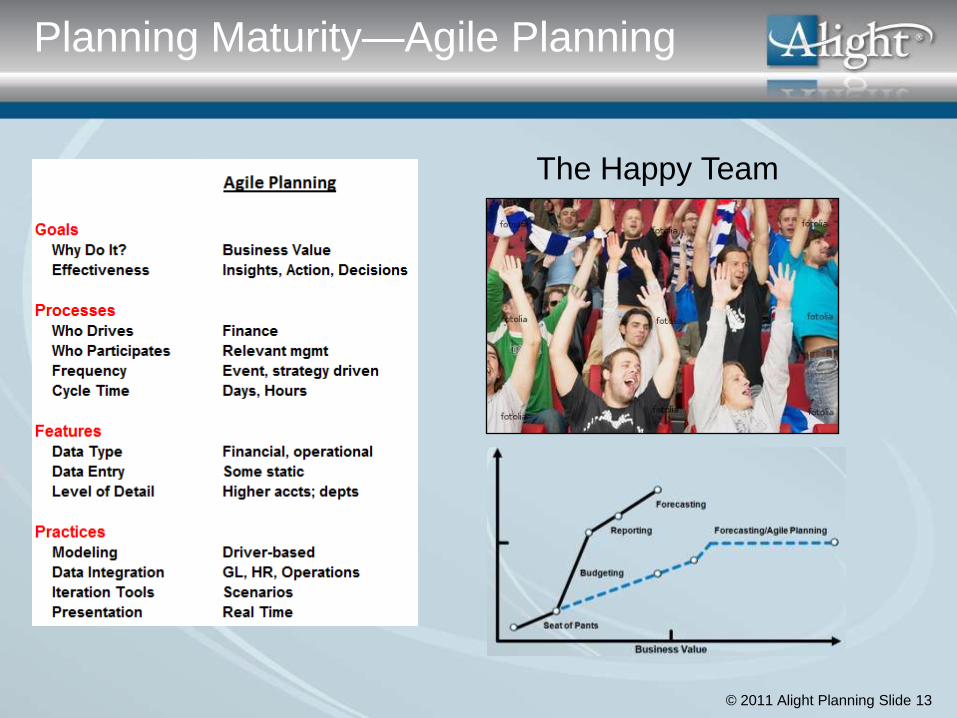
Planning Maturity—Agile Planning
The Happy Team
© 2011 Alight Planning Slide 14
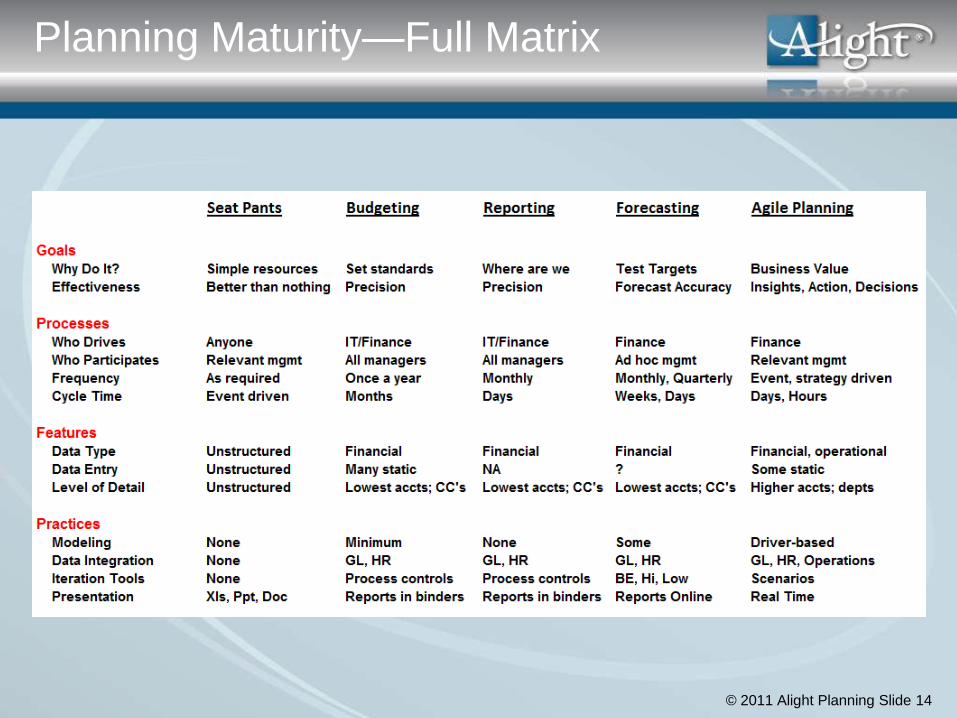
Planning Maturity—Full Matrix
© 2011 Alight Planning Slide 15
Planning Maturity—Agile Planning
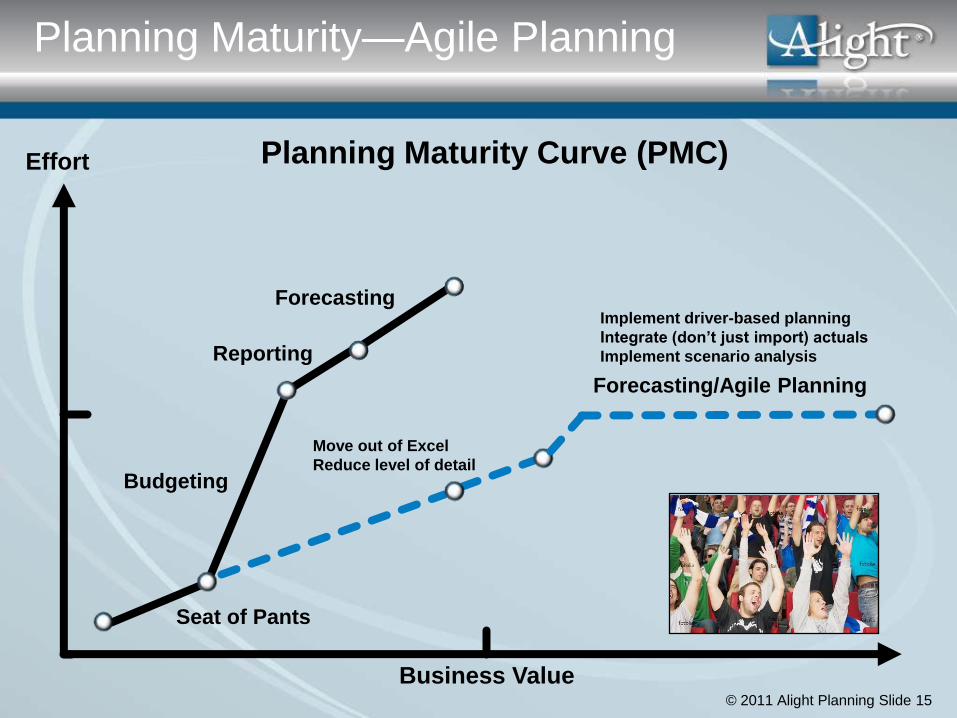
Planning Maturity Curve (PMC)
Budgeting
Forecasting
Seat of Pants
Reporting
Effort
Business Value
Move out of Excel
Reduce level of detail
Forecasting/Agile Planning
Implement driver-based planning
Integrate (don’t just import) actuals
Implement scenario analysis

© 2011 Alight Planning Slide 16
Ray Wolfe Business Activities
Chief Financial Officer, Pittsburgh Mercy Health
System 2006-present
Director of Fiscal and Information Systems– Mercy
Behavioral Health 1996-2006
Chief Fiscal Officer, Summit Center for Human
Development, 1988-1996
St. Francis Medical Center, Patient Account
Manager, 1986-1988
Awards: Ventana Leadership 2010
Education
Juris Doctorate, West Virginia University 1977
BA, Marshall University, 1974
Case Study: Pittsburgh Mercy

© 2011 Alight Planning Slide 17
Case Study: Pittsburgh Mercy
Community Mental Health and Health Care Related
Mental Health, Mental Retardation, Drug/Alcohol, Homeless
Prevention Services and a Private Foundation
Serving Southwestern Pennsylvania
Business Metrics
Pittsburgh Mercy Health System has
3 subsidiary corporations
60 community locations
27 major programs product lines
260 revenue/cost center
1,700 employees; 106 Managers & Supervisors
Funded through traditional insurance billing, government grants and
capitation contracts, Private Foundations
© 2011 Alight Planning Slide 18
Demographic Problems
Managers with only clinical backgrounds/ no business skills
60 sites yielded communication barriers and no common language
Excel based —
Overload mode of worksheets with link and formula errors
Too much time to maintain and no certainty of integrity
No way to import and compare actual data to the budget design
Budgeting became a ritual without meaning
Budgeting full year totals with no seasonality
Tops down budgets w/o manager buy in
No P&L visibility by critical factors
No operational integration
Case Study: Pittsburgh Mercy

© 2011 Alight Planning Slide 19
Organization of Forecast Groups and Processes
Group managers by functional areas—e.g. Community Treatment Teams
Outpatient Clinics
Child Services
15 Groups each meet once a quarter 3 to 12 managers per group
4 members from accounting/finance
Real time process elements Alight Planning displayed on Overhead Projector with Smart Board
CFO is facilitator; Alight Admin on the mouse and keyboard
Review/ make changes in real time
Everyone sees everything!
Case Study: Pittsburgh Mercy

© 2011 Alight Planning Slide 20
Level of Detail
Technical Issues
What level of detail? Actuals and plan
Transportation example

© 2011 Alight Planning Slide 21
Using Actuals to Drive Plan
Technical Issues
Visibility into Units/Rates/Amounts
Revenue and Allowance Rate Example

© 2011 Alight Planning Slide 22
Progress to Date
Financial Results $600K+ in documented revenue increases and cost cuts from MET goals
Process Results
No budgeting
Global updates twice a year – detailed updates quarterly
Forecast accuracy to 2%
Manager commitments based on demonstrated best practices
Understanding the business as an operating entity
Reaction to issues on a two year horizon, e.g. present cut plan
Model Status
Now on third model iteration built from scratch
Case Study: Pittsburgh Mercy

© 2011 Alight Planning Slide 23
Planning Maturity—Agile Planning
Planning Maturity Curve (PMC)
Budgeting
Forecasting
Seat of Pants
Reporting
Effort
Business Value
Move out of Excel
Reduce level of detail
Forecasting/Agile Planning
Implement driver-based planning
Integrate (don’t just import) actuals
Implement scenario analysis

© 2011 Alight Planning Slide 24
1. Move Out of Excel
Deal with structure issues
Deal with modeling issues
2. Reduce Level of Detail
Plan the way managers think; not the Happy Accountant
Reduce detail to better integrate strategy
3. Implement Driver-Based Planning
Reduce direct input data volumes
Increase ‗modeled elements‘—operational/driver based planning
4. Integrate (Don‘t Just Import) Actuals
―Rolling over‖ actuals in plan files—apples to apples
Using actuals to understand trends—focus on rates
5. Implement Scenario Analysis
You can‘t predict the future, but you can construct scenarios
You‘re looking for easy maintenance and comparisons at all levels
Guidelines for Agile PlanningTM
© 2011 Alight Planning Slide 25
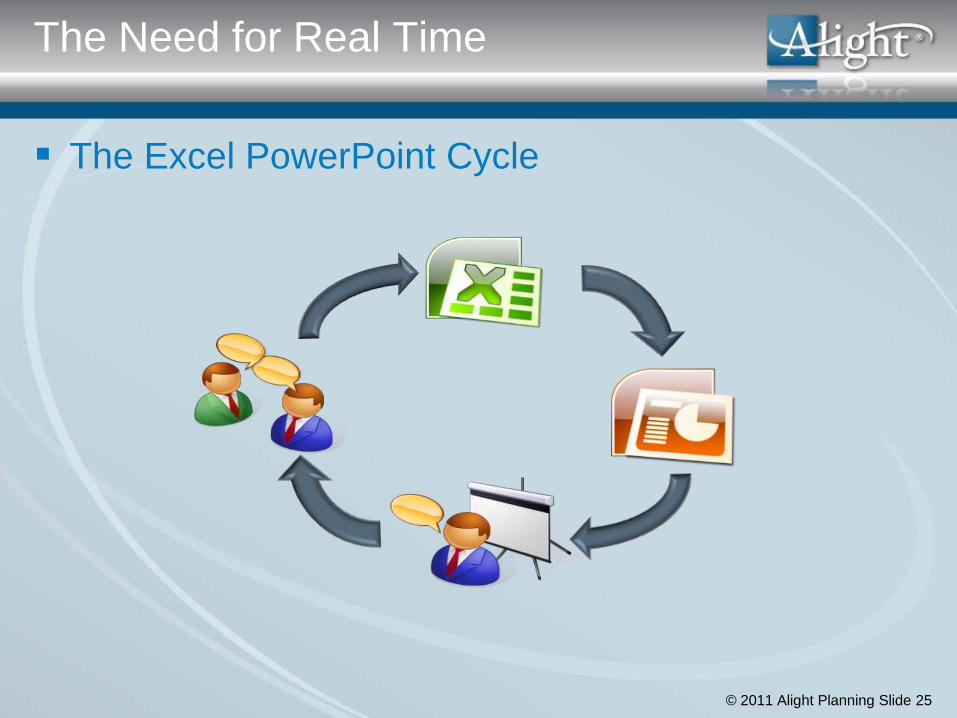
The Excel PowerPoint Cycle
The Need for Real Time
© 2011 Alight Planning Slide 26
The ―need for speed‖
Everything refreshes in near real time
The planning tool is the presentation tool
The planning tool enables collaboration on-the-fly
The Need for Real Time

© 2011 Alight Planning Slide 27
Agile Planning Simulation
Background Wombat, Ltd: mid market ERP for verticals: healthcare, manufacturing,
technology
Bongo is main competitor in manufacturing
Event driver: Bongo cuts prices 30% in manufacturing
The Players Ben, Sales Guy
Rand, Finance Guy
Sid, Services Guy
Phyllis, CEO (not present)
What You‘ll See Real Time Collaboration
Driver-Based Financial Model
Scenario Planning
© 2011 Alight Planning Slide 28
Follow up with Ben
Blamorte@AlightPlanning. com
Telephone: (415) 456-8528
Webinar Resources Transforming Planning at Pittsburgh Mercy:
www.Alightplanning.com/Webinars/PM/Video.html
Application Requirements for Rolling Forecasts www.AlightPlanning.com/Workshop/Requirements-for-Rolling-Forecasts/Video.html
Forecasting for Black Swans: www.ie.articfoxtv.com/224/planning-for-black-swans
w.alightplanning.com
Follow Up with Alight

© 2011 Alight Planning Slide 29
1. Out of Excel
Structure Issues Bound by templates: can‘t add line items on-the-fly
Rollup structures with dimensions are difficult to create and maintain
No multi-user security/process controls
Importing (rekeying) actuals is error prone/cumbersome
Structure problems
relate to budget
templates where you
need to build in
structure and
financial intelligence
from scratch.
Version A Version N…
Save As

© 2011 Alight Planning Slide 30
1. Out of Excel
Modeling Issues Formula and structure errors—aka #Refs
Dependency on key individuals—Lone Ranger Syndrome
Line manager spreadsheet skills are limited; untrained/dangerous.
Modeling problems: cell-
based linking which
discourages driver-based
planning which is the
source of most errors.
© 2011 Alight Planning Slide 31
1. Out of Excel
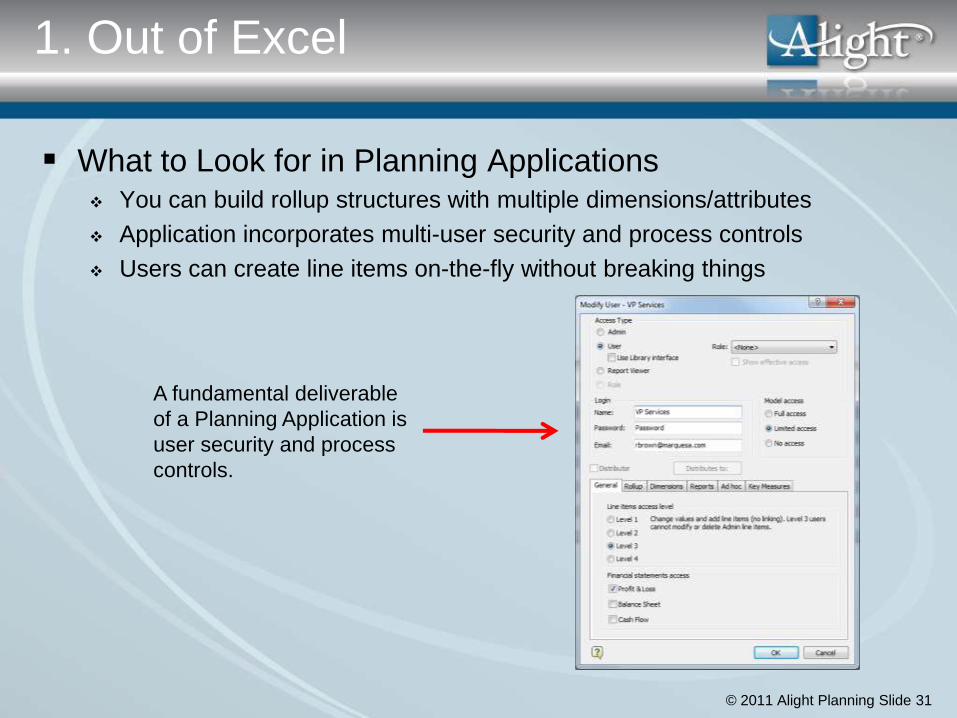
What to Look for in Planning Applications You can build rollup structures with multiple dimensions/attributes
Application incorporates multi-user security and process controls
Users can create line items on-the-fly without breaking things
A fundamental deliverable
of a Planning Application is
user security and process
controls.
© 2011 Alight Planning Slide 32
1. Out of Excel
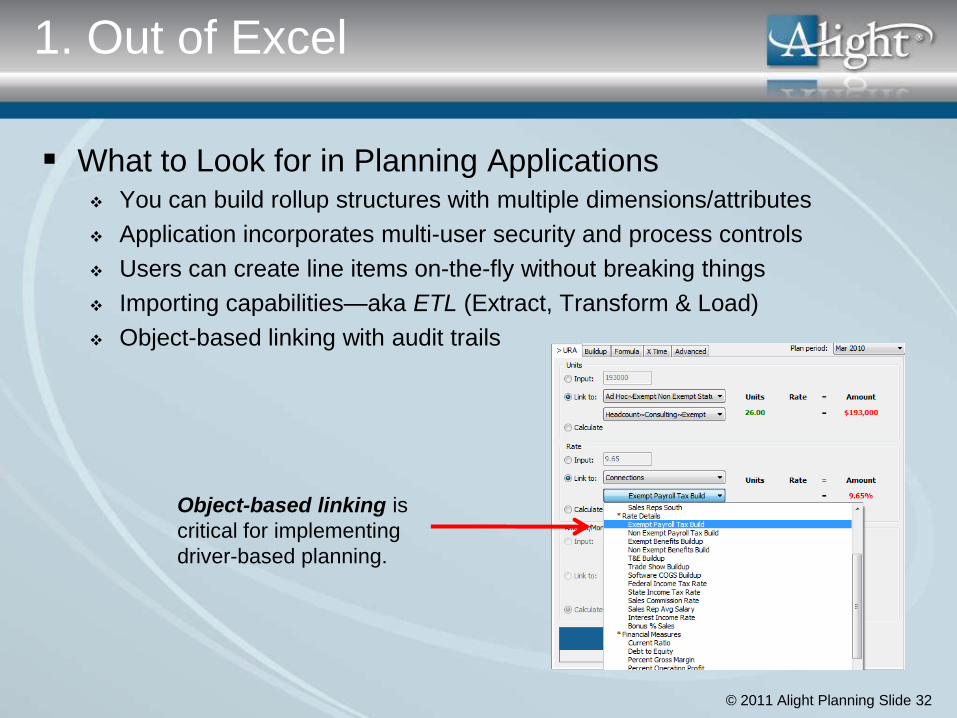
What to Look for in Planning Applications You can build rollup structures with multiple dimensions/attributes
Application incorporates multi-user security and process controls
Users can create line items on-the-fly without breaking things
Importing capabilities—aka ETL (Extract, Transform & Load)
Object-based linking with audit trails
Object-based linking is
critical for implementing
driver-based planning.
© 2011 Alight Planning Slide 33
2. Reduce Level of Detail
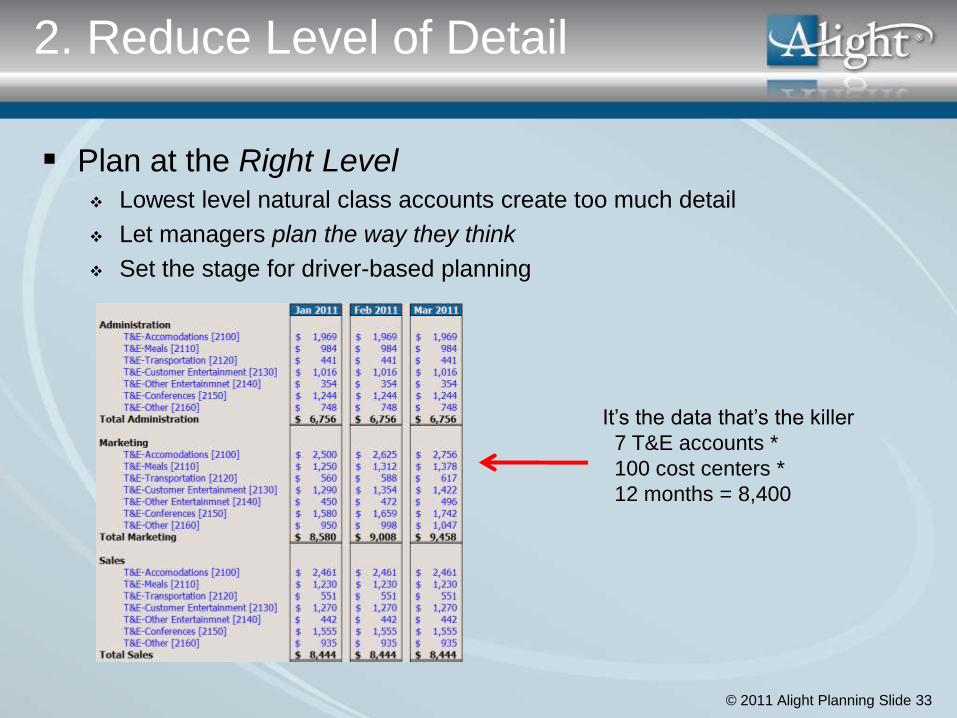
Plan at the Right Level Lowest level natural class accounts create too much detail
Let managers plan the way they think
Set the stage for driver-based planning
It‘s the data that‘s the killer
7 T&E accounts *
100 cost centers *
12 months = 8,400
© 2011 Alight Planning Slide 34
2. Reduce Level of Detail
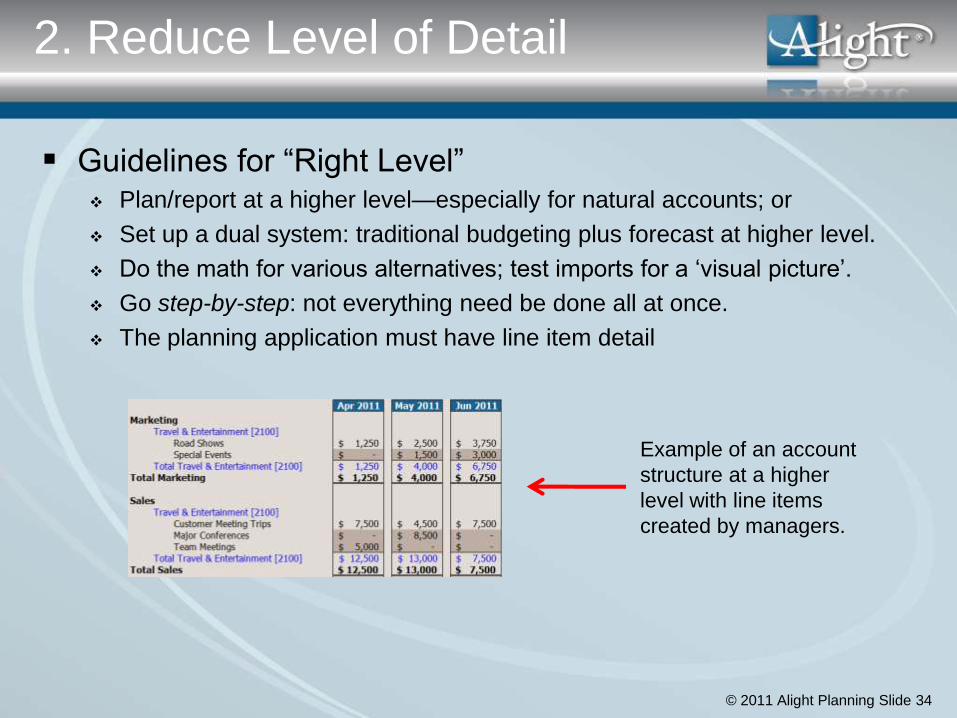
Guidelines for ―Right Level‖ Plan/report at a higher level—especially for natural accounts; or
Set up a dual system: traditional budgeting plus forecast at higher level.
Do the math for various alternatives; test imports for a ‗visual picture‘.
Go step-by-step: not everything need be done all at once.
The planning application must have line item detail
Example of an account
structure at a higher
level with line items
created by managers.
© 2011 Alight Planning Slide 35
2. Reduce Level of Detail
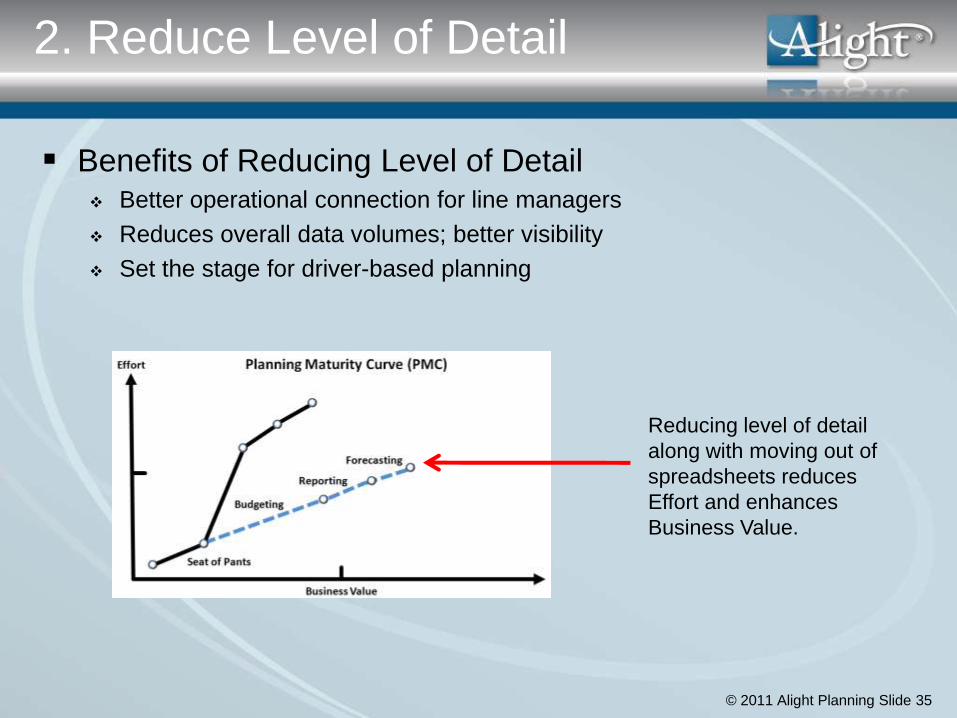
Benefits of Reducing Level of Detail Better operational connection for line managers
Reduces overall data volumes; better visibility
Set the stage for driver-based planning
Reducing level of detail
along with moving out of
spreadsheets reduces
Effort and enhances
Business Value.
© 2011 Alight Planning Slide 36
3. Driver-Based Planning
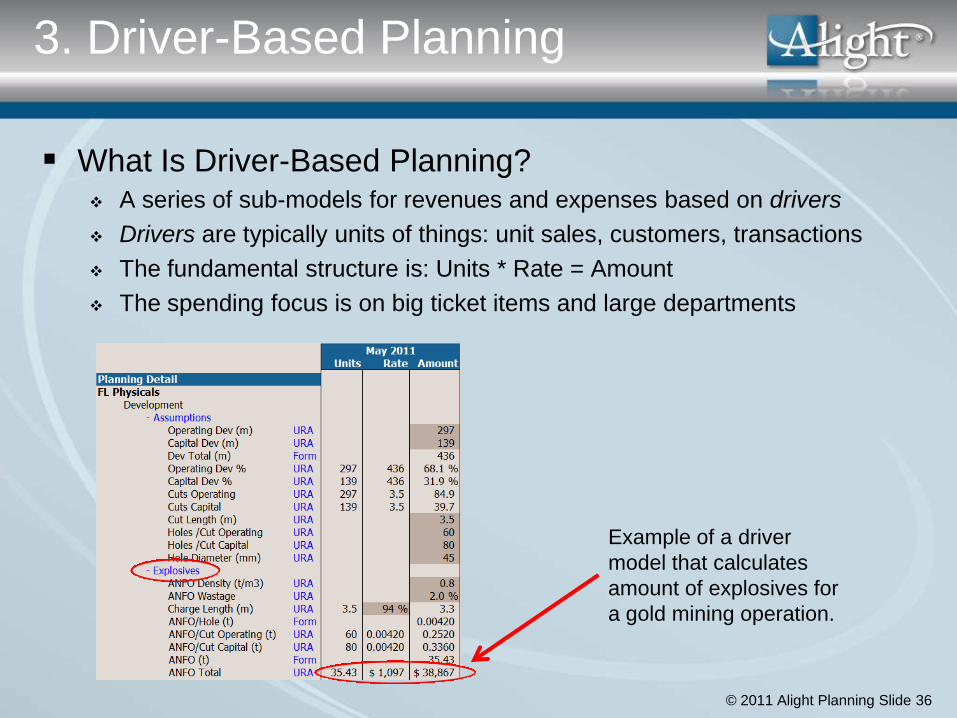
What Is Driver-Based Planning? A series of sub-models for revenues and expenses based on drivers
Drivers are typically units of things: unit sales, customers, transactions
The fundamental structure is: Units * Rate = Amount
The spending focus is on big ticket items and large departments
Example of a driver
model that calculates
amount of explosives for
a gold mining operation.
© 2011 Alight Planning Slide 37
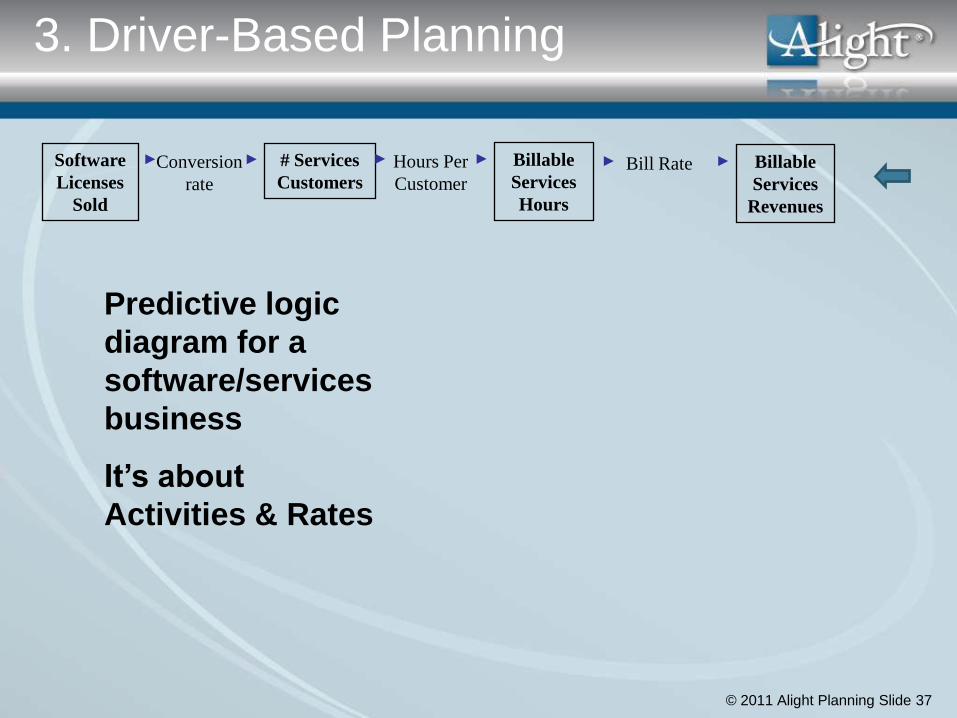
Software
Licenses
Sold
Conversion
rate
# Services
Customers
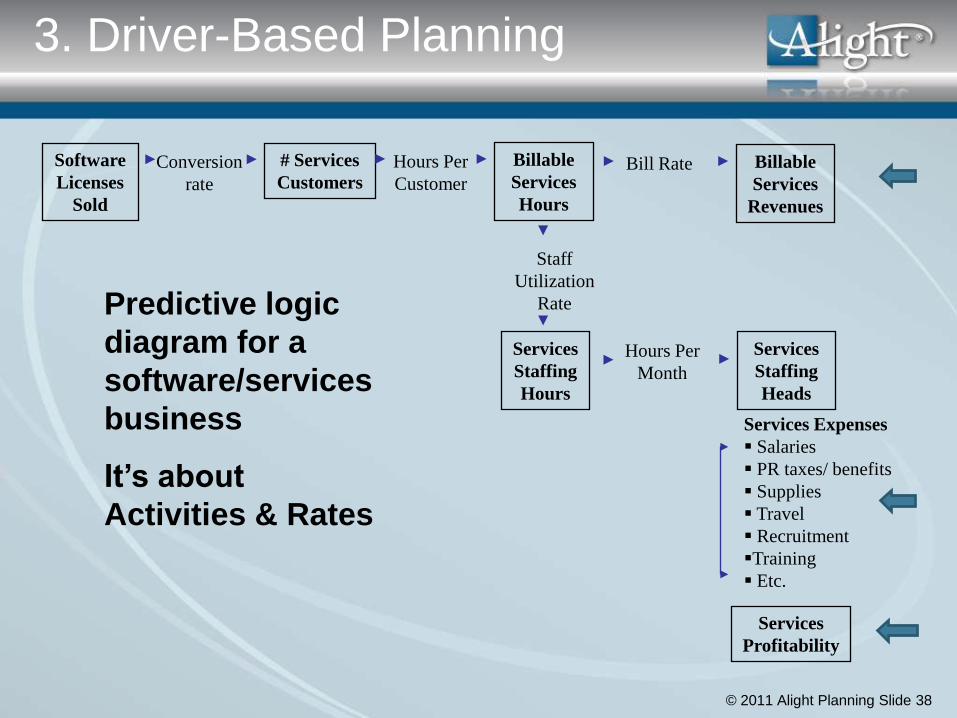
Predictive logic
diagram for a
software/services
business
It’s about
Activities & Rates
Hours Per
Customer
Billable
Services
Hours
Bill Rate Billable
Services
Revenues
3. Driver-Based Planning
© 2011 Alight Planning Slide 38
Software
Licenses
Sold
Conversion
rate
# Services
Customers
Services
Staffing
Hours
Services Expenses
Salaries
PR taxes/ benefits
Supplies
Travel
Recruitment
Training
Etc.
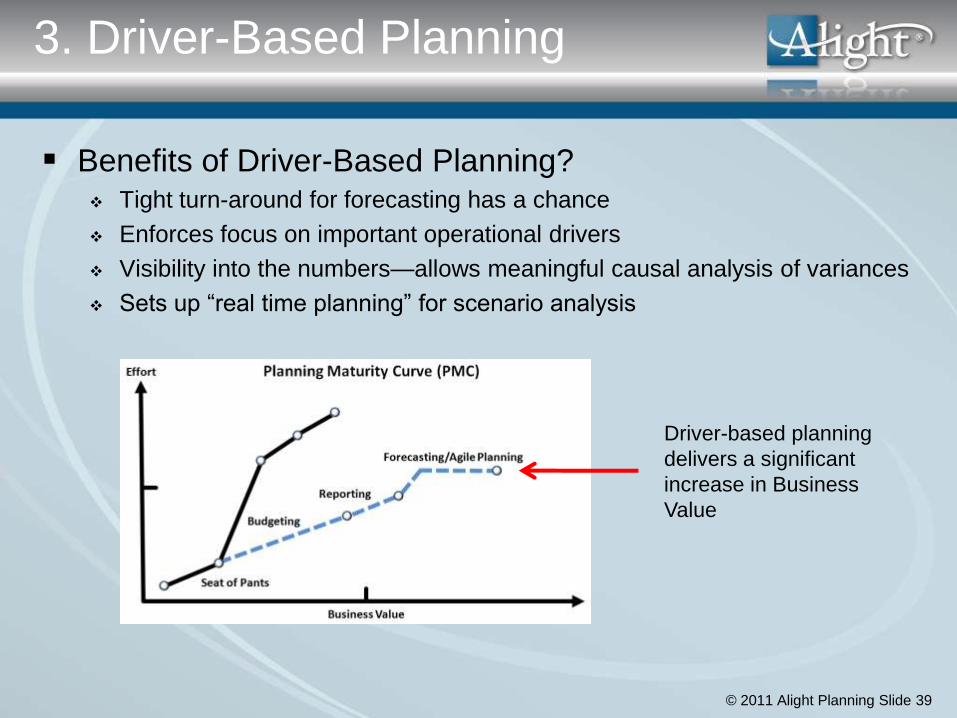
Predictive logic
diagram for a
software/services
business
It’s about
Activities & Rates
Hours Per
Customer
Billable
Services
Hours
Staff
Utilization
Rate
Bill Rate Billable
Services
Revenues
Hours Per
Month
Services
Staffing
Heads
Services
Profitability
3. Driver-Based Planning
© 2011 Alight Planning Slide 39
3. Driver-Based Planning
Benefits of Driver-Based Planning? Tight turn-around for forecasting has a chance
Enforces focus on important operational drivers
Visibility into the numbers—allows meaningful causal analysis of variances
Sets up ―real time planning‖ for scenario analysis
Driver-based planning
delivers a significant
increase in Business
Value

© 2011 Alight Planning Slide 40
4. Integrate Actuals
Import Actuals Metadata and data imports based on chart of accounts structures
Monthly updates from the general ledger
Automated with ―connectors‖ or semi-automated with ETL tools
Integrate Actuals Any source—GL,HR, CRM, RDBMS, OLAP
Any data type—text, number, currency, percentage, currency
Any level—line item, natural accounts, cost center, etc.
Any modeling—simple of complex linking, back calculate rates

© 2011 Alight Planning Slide 41
4. Integrate Actuals
Integration Issues Data spread across multiple sources
Actuals and Plan at different levels
No underlying activity drivers
Actual and plan structures out of sync
© 2011 Alight Planning Slide 42
4. Integrate Actuals
Integration Issues Data spread across multiple sources
Actuals and Plan at different levels
No underlying activity drivers
Actual and plan structures out of sync
© 2011 Alight Planning Slide 43
5. Implement Scenario Analysis
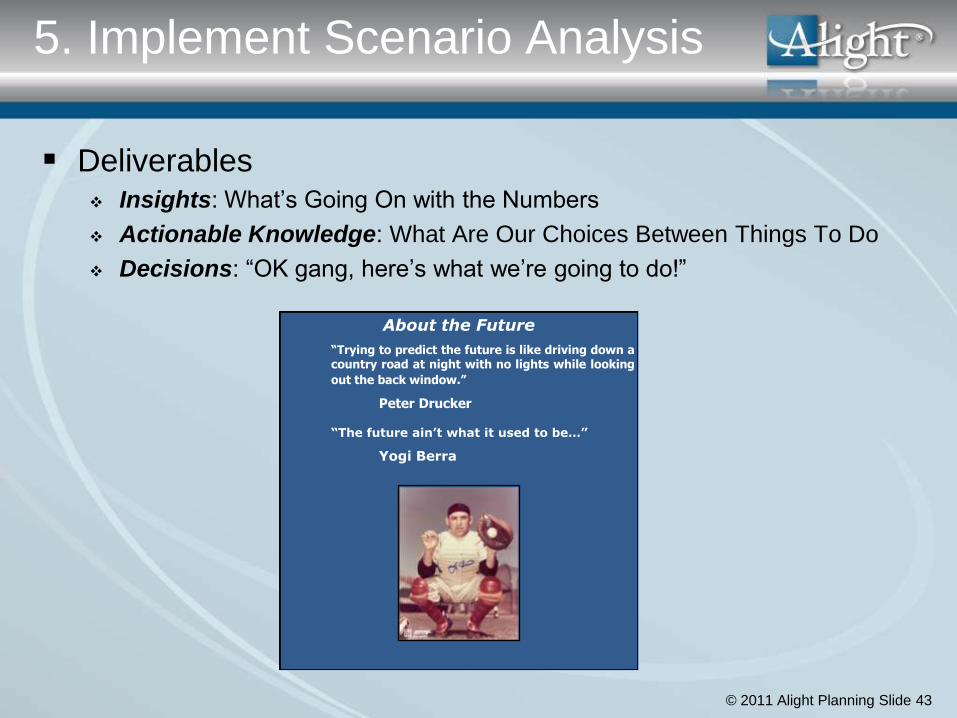
Deliverables Insights: What‘s Going On with the Numbers
Actionable Knowledge: What Are Our Choices Between Things To Do
Decisions: ―OK gang, here‘s what we‘re going to do!‖
About the Future
“Trying to predict the future is like driving down acountry road at night with no lights while looking
out the back window.”
Peter Drucker
“The future ain’t what it used to be…”
Yogi Berra
© 2011 Alight Planning Slide 44
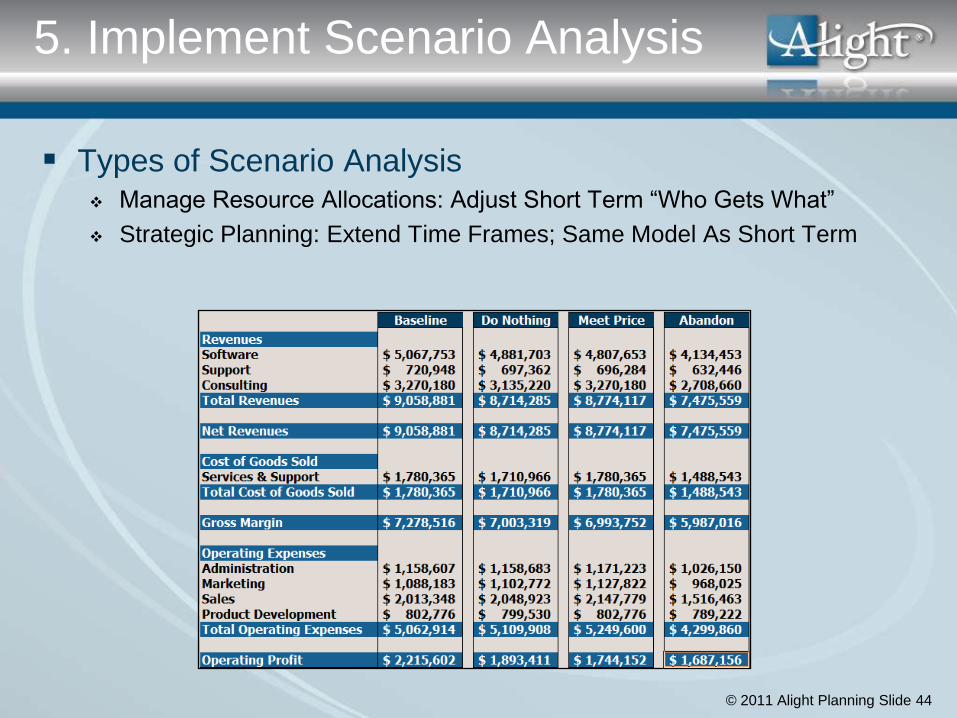
5. Implement Scenario Analysis
Types of Scenario Analysis Manage Resource Allocations: Adjust Short Term ―Who Gets What‖
Strategic Planning: Extend Time Frames; Same Model As Short Term

© 2011 Alight Planning Slide 45
5. Implement Scenario Analysis
Types of Scenario Analysis Manage Resource Allocations: Adjust Short Term ―Who Gets What‖
Strategic Planning: Extend Time Frames; Same Model As Short Term
Black Swan Planning: Understand Improbable Events [Nassim Taleb]
© 2011 Alight Planning Slide 46
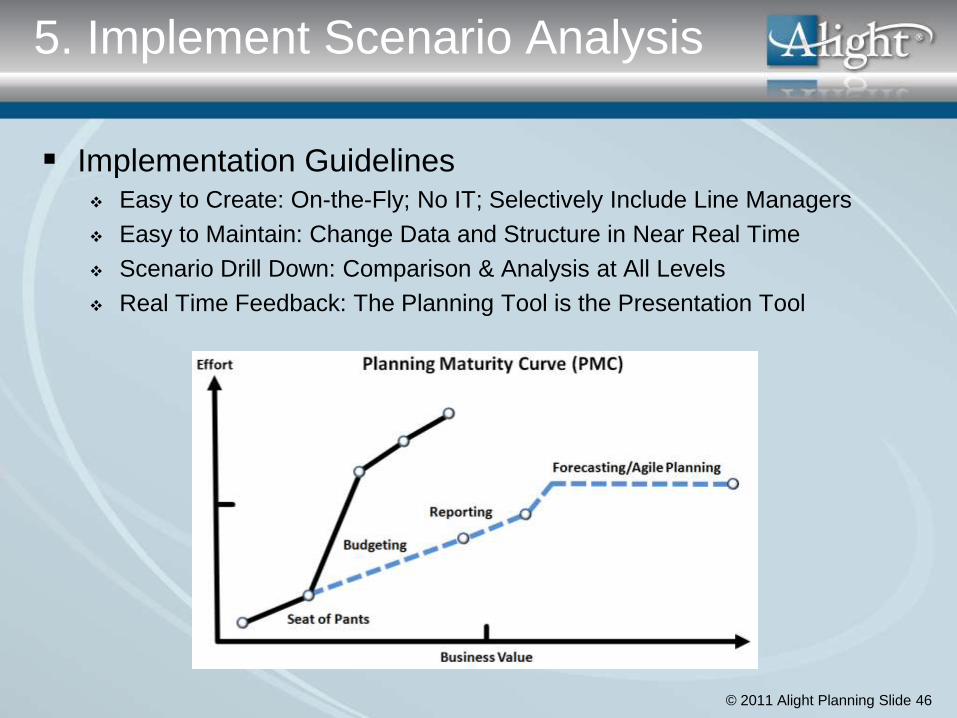
5. Implement Scenario Analysis
Implementation Guidelines Easy to Create: On-the-Fly; No IT; Selectively Include Line Managers
Easy to Maintain: Change Data and Structure in Near Real Time
Scenario Drill Down: Comparison & Analysis at All Levels
Real Time Feedback: The Planning Tool is the Presentation Tool

© 2011 Alight Planning Slide 47
Spreadsheet Issues
Spreadsheets Don‘t Do the Job Not multi-user: security and process control issues
Not a database: consolidation and reporting issues
Not multi-dimensional: reporting and analysis issues
Cell based modeling: limitations on driver-based planning
Save As for versions and scenarios: just not viable!
Scenario A Scenario B Scenario C