Embed Size (px)
Citation preview
1
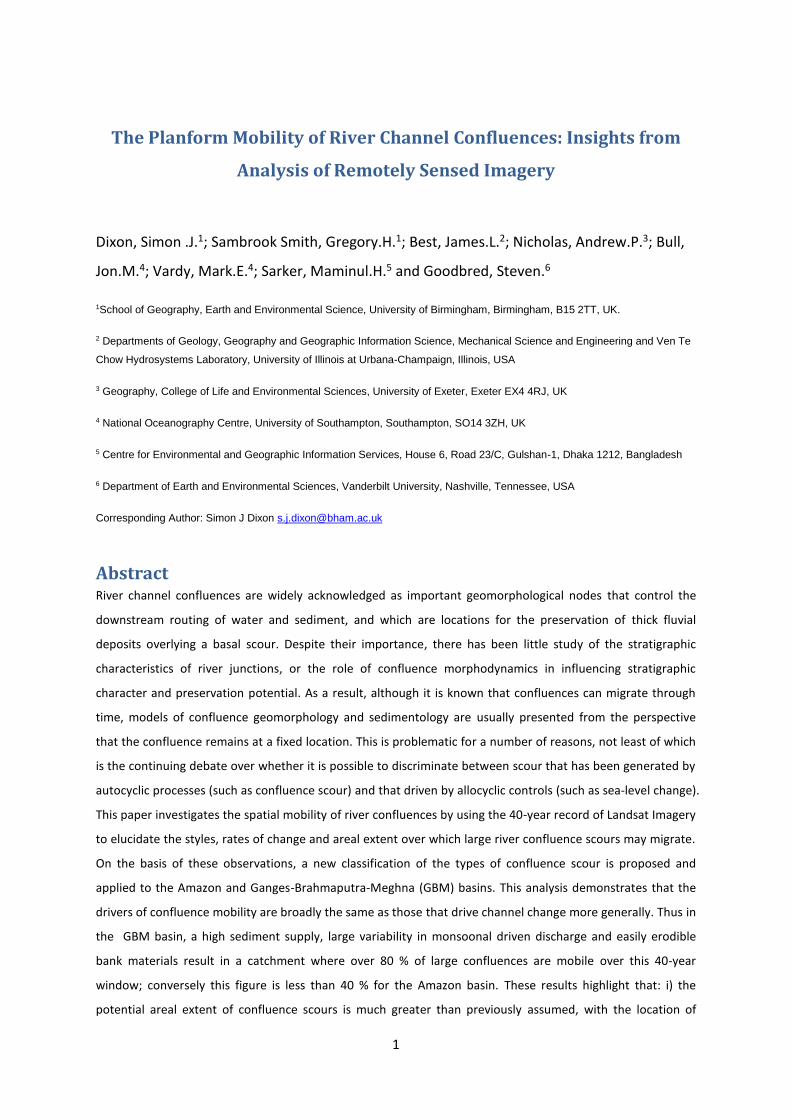
The Planform Mobility of River Channel Confluences: Insights from
Analysis of Remotely Sensed Imagery
Dixon, Simon .J.1; Sambrook Smith, Gregory.H.1; Best, James.L.2; Nicholas, Andrew.P.3; Bull,
Jon.M.4; Vardy, Mark.E.4; Sarker, Maminul.H.5 and Goodbred, Steven.6
1School of Geography, Earth and Environmental Science, University of Birmingham, Birmingham, B15 2TT, UK.
2 Departments of Geology, Geography and Geographic Information Science, Mechanical Science and Engineering and Ven Te
Chow Hydrosystems Laboratory, University of Illinois at Urbana-Champaign, Illinois, USA
3 Geography, College of Life and Environmental Sciences, University of Exeter, Exeter EX4 4RJ, UK
4 National Oceanography Centre, University of Southampton, Southampton, SO14 3ZH, UK
5 Centre for Environmental and Geographic Information Services, House 6, Road 23/C, Gulshan-1, Dhaka 1212, Bangladesh
6 Department of Earth and Environmental Sciences, Vanderbilt University, Nashville, Tennessee, USA
Corresponding Author: Simon J Dixon [email protected]
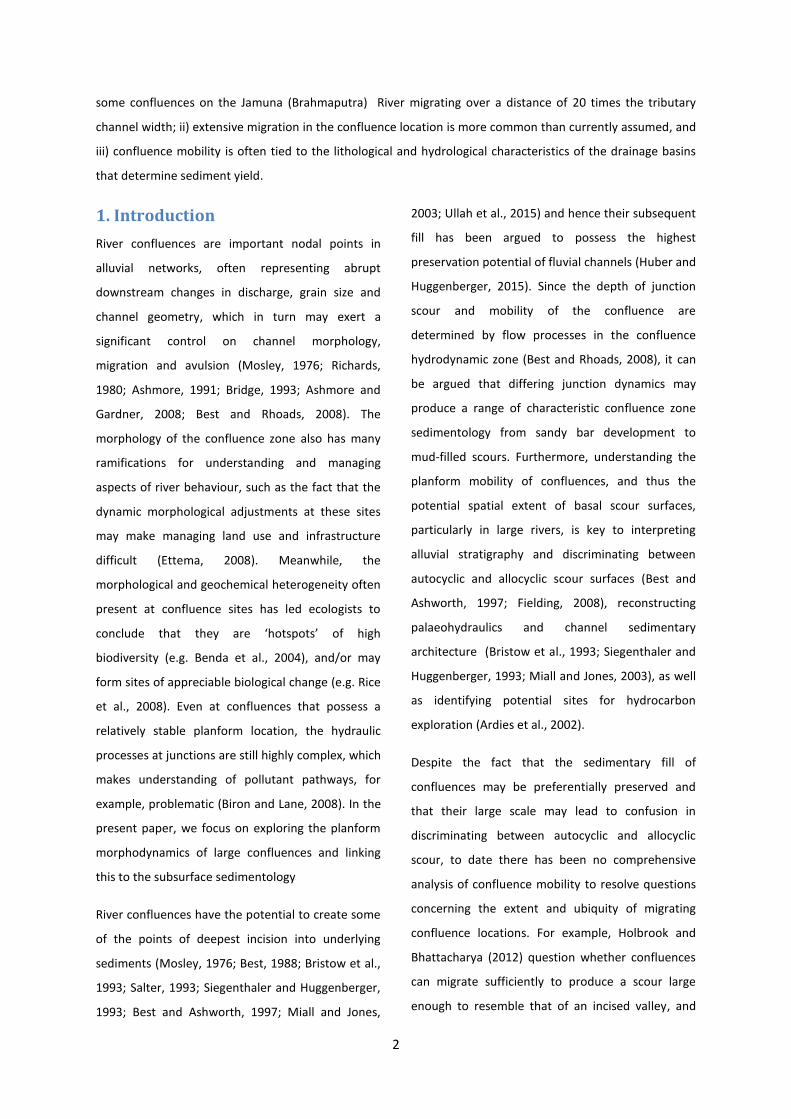
Abstract River channel confluences are widely acknowledged as important geomorphological nodes that control the
downstream routing of water and sediment, and which are locations for the preservation of thick fluvial
deposits overlying a basal scour. Despite their importance, there has been little study of the stratigraphic
characteristics of river junctions, or the role of confluence morphodynamics in influencing stratigraphic
character and preservation potential. As a result, although it is known that confluences can migrate through
time, models of confluence geomorphology and sedimentology are usually presented from the perspective
that the confluence remains at a fixed location. This is problematic for a number of reasons, not least of which
is the continuing debate over whether it is possible to discriminate between scour that has been generated by
autocyclic processes (such as confluence scour) and that driven by allocyclic controls (such as sea-level change).
This paper investigates the spatial mobility of river confluences by using the 40-year record of Landsat Imagery
to elucidate the styles, rates of change and areal extent over which large river confluence scours may migrate.
On the basis of these observations, a new classification of the types of confluence scour is proposed and
applied to the Amazon and Ganges-Brahmaputra-Meghna (GBM) basins. This analysis demonstrates that the
drivers of confluence mobility are broadly the same as those that drive channel change more generally. Thus in
the GBM basin, a high sediment supply, large variability in monsoonal driven discharge and easily erodible
bank materials result in a catchment where over 80 % of large confluences are mobile over this 40-year
window; conversely this figure is less than 40 % for the Amazon basin. These results highlight that: i) the
potential areal extent of confluence scours is much greater than previously assumed, with the location of
2
some confluences on the Jamuna (Brahmaputra) River migrating over a distance of 20 times the tributary
channel width; ii) extensive migration in the confluence location is more common than currently assumed, and
iii) confluence mobility is often tied to the lithological and hydrological characteristics of the drainage basins
that determine sediment yield.
1. Introduction
River confluences are important nodal points in
alluvial networks, often representing abrupt
downstream changes in discharge, grain size and
channel geometry, which in turn may exert a
significant control on channel morphology,
migration and avulsion (Mosley, 1976; Richards,
1980; Ashmore, 1991; Bridge, 1993; Ashmore and
Gardner, 2008; Best and Rhoads, 2008). The
morphology of the confluence zone also has many
ramifications for understanding and managing
aspects of river behaviour, such as the fact that the
dynamic morphological adjustments at these sites
may make managing land use and infrastructure
difficult (Ettema, 2008). Meanwhile, the
morphological and geochemical heterogeneity often
present at confluence sites has led ecologists to
conclude that they are ‘hotspots’ of high
biodiversity (e.g. Benda et al., 2004), and/or may
form sites of appreciable biological change (e.g. Rice
et al., 2008). Even at confluences that possess a
relatively stable planform location, the hydraulic
processes at junctions are still highly complex, which
makes understanding of pollutant pathways, for
example, problematic (Biron and Lane, 2008). In the
present paper, we focus on exploring the planform
morphodynamics of large confluences and linking
this to the subsurface sedimentology
River confluences have the potential to create some
of the points of deepest incision into underlying
sediments (Mosley, 1976; Best, 1988; Bristow et al.,
1993; Salter, 1993; Siegenthaler and Huggenberger,
1993; Best and Ashworth, 1997; Miall and Jones,
2003; Ullah et al., 2015) and hence their subsequent
fill has been argued to possess the highest
preservation potential of fluvial channels (Huber and
Huggenberger, 2015). Since the depth of junction
scour and mobility of the confluence are
determined by flow processes in the confluence
hydrodynamic zone (Best and Rhoads, 2008), it can
be argued that differing junction dynamics may
produce a range of characteristic confluence zone
sedimentology from sandy bar development to
mud-filled scours. Furthermore, understanding the
planform mobility of confluences, and thus the
potential spatial extent of basal scour surfaces,
particularly in large rivers, is key to interpreting
alluvial stratigraphy and discriminating between
autocyclic and allocyclic scour surfaces (Best and
Ashworth, 1997; Fielding, 2008), reconstructing
palaeohydraulics and channel sedimentary
architecture (Bristow et al., 1993; Siegenthaler and
Huggenberger, 1993; Miall and Jones, 2003), as well
as identifying potential sites for hydrocarbon
exploration (Ardies et al., 2002).
Despite the fact that the sedimentary fill of
confluences may be preferentially preserved and
that their large scale may lead to confusion in
discriminating between autocyclic and allocyclic
scour, to date there has been no comprehensive
analysis of confluence mobility to resolve questions
concerning the extent and ubiquity of migrating
confluence locations. For example, Holbrook and
Bhattacharya (2012) question whether confluences
can migrate sufficiently to produce a scour large
enough to resemble that of an incised valley, and
3
hence be mistaken for a product of allocylic-driven
erosion. However, some case studies, such as the
confluence of the Ganges and Jamuna rivers,
Bangladesh, show junction migration over distances
of several kilometres in a year (Best and Ashworth,
1997). In addition, the course of the Jamuna River
has also been shown to avulse on centennial to
millennial timescales (Best et al., 2008; Pickering et
al., 2014; Reitz et al., 2015), thus changing the
location of its confluence with the Ganges River by
hundreds of kilometres. High-angle confluences in
meandering rivers have also been demonstrated to
adjust their confluence planform over decadal
timescales (Riley, 2013). Ettema (2008) discusses
episodic bank erosion and changes in bar formation
at confluences in response to flood events,
particularly those driven by ice jams, whilst Best
(1988) and (Best and Roy, 1991) document tributary
bar migration as a response to changing discharge
ratio between confluent channels. Several studies
have also noted changes in confluence location and
morphology in response to sediment deposition in
the confluence zone. At a very small scale, Shit and
Maiti (2013) attribute the up- and down- stream
movement of confluences in small gully systems to
the deposition of sediment wedges from sediment-
laden tributaries. Zhang et al. (2015) also show the
dynamic behaviour of sedimentation at tributaries
of the Huang He River in China, which in some areas
possesses tributaries that transport huge sediment
loads into the main channel. Similarly, several
studies have shown deposition at the junctions of
high sediment load tributaries that are located
downstream of recently constructed dams, leading
to local bed aggradation that can cause lateral and
longitudinal movement of the confluence location,
as well as changes in confluence morphology (Graf,
1980; Petts, 1984; Allen et al., 1989; Grant et al.,
2003; Gilvear, 2004; Petts and Gurnell, 2005; Phillips
et al., 2005)
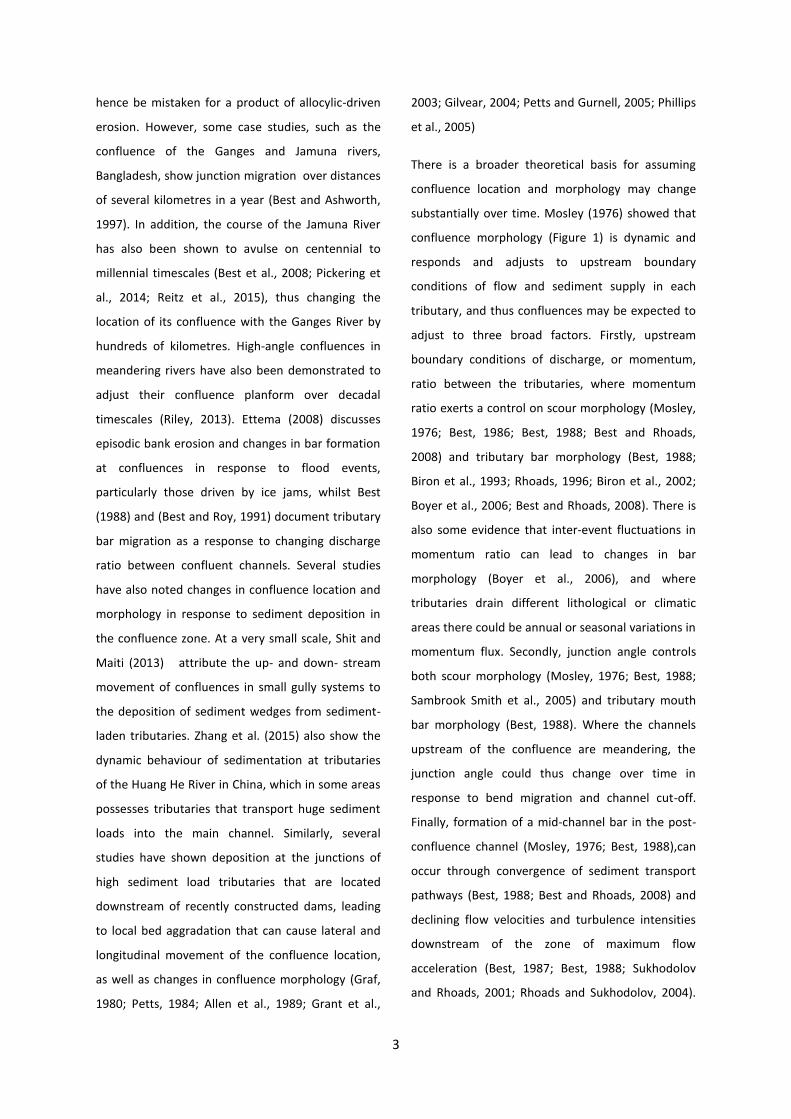
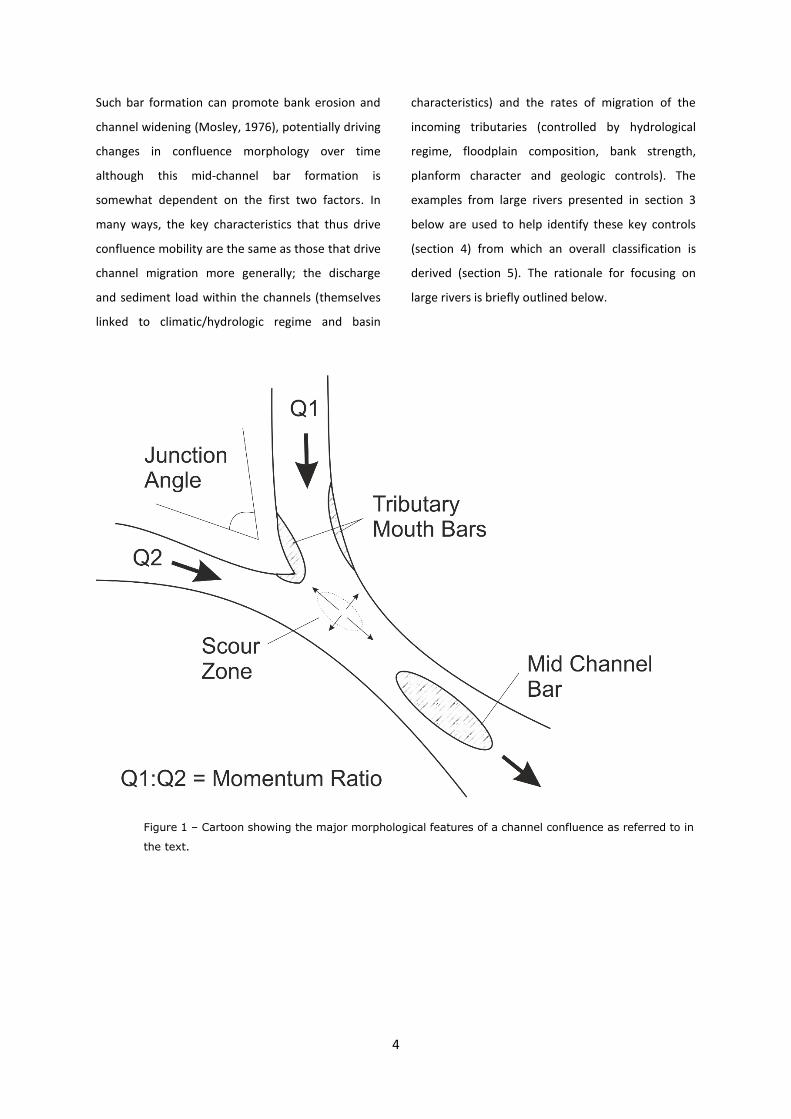
There is a broader theoretical basis for assuming
confluence location and morphology may change
substantially over time. Mosley (1976) showed that
confluence morphology (Figure 1) is dynamic and
responds and adjusts to upstream boundary
conditions of flow and sediment supply in each
tributary, and thus confluences may be expected to
adjust to three broad factors. Firstly, upstream
boundary conditions of discharge, or momentum,
ratio between the tributaries, where momentum
ratio exerts a control on scour morphology (Mosley,
1976; Best, 1986; Best, 1988; Best and Rhoads,
2008) and tributary bar morphology (Best, 1988;
Biron et al., 1993; Rhoads, 1996; Biron et al., 2002;
Boyer et al., 2006; Best and Rhoads, 2008). There is
also some evidence that inter-event fluctuations in
momentum ratio can lead to changes in bar
morphology (Boyer et al., 2006), and where
tributaries drain different lithological or climatic
areas there could be annual or seasonal variations in
momentum flux. Secondly, junction angle controls
both scour morphology (Mosley, 1976; Best, 1988;
Sambrook Smith et al., 2005) and tributary mouth
bar morphology (Best, 1988). Where the channels
upstream of the confluence are meandering, the
junction angle could thus change over time in
response to bend migration and channel cut-off.
Finally, formation of a mid-channel bar in the post-
confluence channel (Mosley, 1976; Best, 1988),can
occur through convergence of sediment transport
pathways (Best, 1988; Best and Rhoads, 2008) and
declining flow velocities and turbulence intensities
downstream of the zone of maximum flow
acceleration (Best, 1987; Best, 1988; Sukhodolov
and Rhoads, 2001; Rhoads and Sukhodolov, 2004).
4
Such bar formation can promote bank erosion and
channel widening (Mosley, 1976), potentially driving
changes in confluence morphology over time
although this mid-channel bar formation is
somewhat dependent on the first two factors. In
many ways, the key characteristics that thus drive
confluence mobility are the same as those that drive
channel migration more generally; the discharge
and sediment load within the channels (themselves
linked to climatic/hydrologic regime and basin
characteristics) and the rates of migration of the
incoming tributaries (controlled by hydrological
regime, floodplain composition, bank strength,
planform character and geologic controls). The
examples from large rivers presented in section 3
below are used to help identify these key controls
(section 4) from which an overall classification is
derived (section 5). The rationale for focusing on
large rivers is briefly outlined below.
Figure 1 – Cartoon showing the major morphological features of a channel confluence as referred to in
the text.
5
Current understanding of the morphodynamics of
river confluences has largely been dominated by
examples of experimental and small fluvial channels
(e.g. Mosley, 1976; Best, 1988; Roy and Bergeron,
1990; Best and Roy, 1991; Biron et al., 1993;
Kenworthy and Rhoads, 1995; Rhoads and
Kenworthy, 1995; Rhoads, 1996; Rhoads and
Kenworthy, 1998; De Serres et al., 1999; Rhoads and
Sukhodolov, 2001; Biron et al., 2002; Boyer et al.,
2006; Leite Ribeiro et al., 2012), and it is only with
recent advances in technology that the direct field
investigation of large river confluences has been
possible (e.g. McLelland et al., 1999; Ashworth et al.,
2000; Richardson and Thorne, 2001; Parsons et al.,
2005; Parsons et al., 2007; Lane et al., 2008; Parsons
et al., 2008; Sambrook Smith et al., 2009). There is
therefore a need to critically examine, describe and
quantify the decadal morphodynamics of large river
junctions in order to better understand the extent
to which river confluences are mobile, how mobility
is expressed and the rates of change. With recent
advances in remote sensing, the planform
characteristics and decadal evolution of large rivers
can be described in greater detail (Ashworth and
Lewin, 2012; Trigg et al., 2012; Lewin and Ashworth,
2014a), and the temporal morphodynamics of large
rivers can be quantified (e.g. Mount et al., 2013).
With over four decades of global imagery now
available from programmes such as NASA’s Landsat,
there is thus a great opportunity to study the
morphodynamics of large river confluences over
decadal timescales.
Herein, we use Landsat satellite image sequences to
examine the planform morphodynamics of large
river confluences over decadal timescales. Our aims
are to:
1. Illustrate the range in behaviour of the
planform confluence morphodynamics in
large rivers
2. Quantify the potential spatial extent and
mobility of the confluence planform over
decadal timescales
3. Detail the spatial distribution of different
morphodynamic types of junctions within
large rivers and examine the potential
controls on confluence mobility, and
4. Discuss the implications of confluence
mobility for the interpretation of ancient
sedimentary sequences.
2. Methods
Georeferenced Landsat imagery (30 megapixel
resolution) spanning the period 1972-2014 was
analysed to quantify the planform dynamics of large
river confluences. Although there is no universal
definition of large river channels (Gupta, 2008), a
channel width of 100 m is commonly used (e.g.
Miall, 2006; Latrubesse, 2008; Ashworth and Lewin,
2012; Lewin and Ashworth, 2014b). However, herein
large river confluences are classified as those where
both confluent channel widths are 250 m or greater.
This 250 m width criteria is used to allow
morphological changes to be more easily identified
and quantified in the Landsat imagery; a single pixel
in a 250 m wide channel represents a maximum of
~12% of the channel width, whereas a 100 m wide
channel is only three pixels wide. Variations in
global Landsat coverage over the period (Goward et
al., 2006) together with the need for low cloud
cover (<10%) in images, limits image availability.
Landsat imagery for all confluences was selected
from low flow stage, which minimised errors in
misclassifying morphological features, such as bars,
which may be emergent or submerged at different
6
river stages. Low flow stage was defined seasonally,
based on reference to existing literature on the
climate of the study basins, and a further check was
applied to images to identify the presence of low
flow features such as exposed point and mid-
channel bars in order to exclude any images during
unseasonal high flow events. Fourteen confluences
were studied in detail, across a range of climatic and
physiographic regions, and these are presented in
section 3 below. The objective in this initial analysis
was to understand the range of behaviours
displayed by large river confluences. This is then
used to present a conceptual model of confluence
types in section 5 based on this analysis. This
analysis of confluences was then performed on all
confluences within the Amazon and Ganges-
Brahmaputra-Meghna basins to examine spatial
distribution and quantify the morphodynamics of
different confluence types.
The extent of channel migration in braided rivers
was classified as either “within braidplain” or
“braidplain migration” based on a classification of
land cover types. This classification is based on the
assumption that vegetated areas have been
morphologically stable for at least the length of time
that dense vegetation takes to become established;
conversely, it is assumed that bare sediment has
been disturbed by channel processes within a time
frame that is not greater than that required for the
establishment of vegetation. Therefore, “within
braidplain” migration is defined as the reworking of
exposed sedimentary material assumed to be within
the active braidplain, whilst “braidplain migration” is
given as erosion into vegetated surfaces that is older
and not recently active. Both natural and false
colour composite images were used to determine
the edge of the active channel belt, by identifying
land cover types as either exposed sediment or
vegetation. The use of false colour composite
images allows coarse discrimination between
vegetation (chlorophyll) intensity, and it is therefore
possible to discriminate areas of sparser vegetation
(pioneer vegetation on bars for example) from
denser vegetated areas (e.g. riparian forest). This
does introduce a potential source of error in terms
of timescales of adjustment and the broad definition
of what constitutes the braidplain of a river. The
present definitions and methods differentiate
between a river that is reworking deposits less than
~30 years old, and one that is eroding into older
materials. However, this distinction is partly a
function of the short time scales over which these
rivers are examined, and may be capturing the same
process operating at different rates. These
differences for individual examples are discussed in
section 3, but all braided river migration is treated
as one type of adjustment in the quantification
(section 5) to eliminate any potential error from the
analysis.
Where confluence angle (see Figure 1) is reported,
this was measured using the approach of Hackney
and Carling (2011). River centre lines were drawn to
a distance of three channel widths from the
confluence for the upstream tributaries and
downstream confluent channel, and the angle at the
intersection of these centrelines was measured.
Where confluence locations are reported and
included on figures herein, these mark the point at
which the centrelines of the upstream tributaries
intersect at the junction.
7
Confluent Channels Country Type Channel
Width (km)a
Migration
length (km)
Dimensionless
migration
lengthb
Number of
Images Studied
Junction Angle Range
Orinoco/Meta Columbia Bar Migration 1.0-2.0 1 0.5-1.0 7 60º-100º
Lena/Aldan Russia Bar Migration 7.0 N/A N/A 6 N/A
Jamuna/Ganges Bangladesh Tributary Channel
Migration
2.0 14 7.0 20 70º-100º
Jamuna/Gangadhar India Tributary Channel
Migration
1.0 20 20.0 6 30º-80º
Jamuna/Dud Kumar India Tributary Channel
Migration
1.0 25 25.0 6 30º-70º
Jamuna/Dharla India Tributary Channel
Migration
1.0 7 7.0 6 40º-120º
Paraguay/Bermejo Argentina Meander Neck Cut
Off
0.8 0.6 0.8 7 15º-110º
Mississippi/Arkansas USA Meander Neck Cut
Off
1.3 5 4.0 31 40º-90º
Sardar/Ganghara India Channel Belt
Avulsion
1.9 23 12.0 8 35º-90º
Meghna/Padma Bangladesh Pinned 4.0 17 4.2 20 45º-90º
Yangtze/Dongting Lake China Pinned 1.5 0.8 0.5 6 70º -110º
Solimões/Negro Brazil Fixed 4.0 0 0 7 N/A
Congo/Kasai DRC Fixed 1.5 0 0 6 N/A
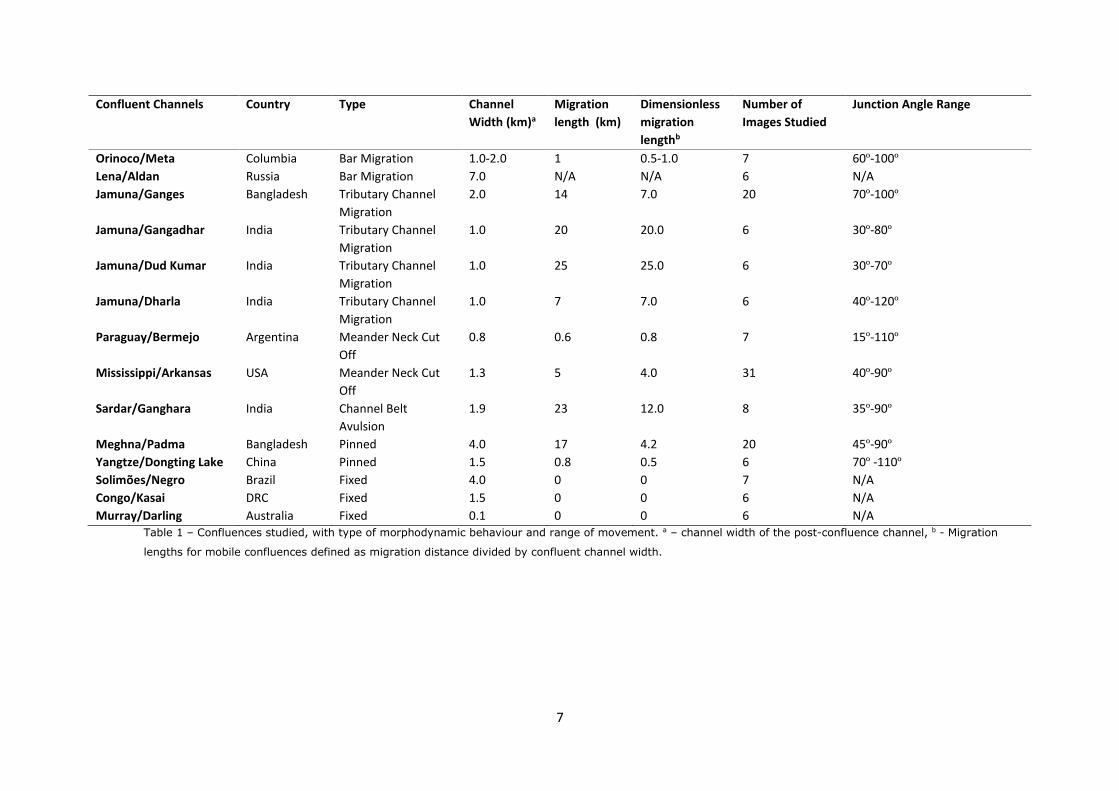
Murray/Darling Australia Fixed 0.1 0 0 6 N/A Table 1 – Confluences studied, with type of morphodynamic behaviour and range of movement. a – channel width of the post-confluence channel, b - Migration
lengths for mobile confluences defined as migration distance divided by confluent channel width.
8
3. Styles of confluence evolution
This section presents data on 14 large confluences
(summarised in Table 1) that cover a broad range of
channel size, geological setting and
geomorphological style. This overview allows
different styles of confluence evolution to be
characterised and compared, from which major
confluence types can then be identified. This
analysis is then used to propose a conceptual model
of confluence types and quantify their prevalence
within two example river basins in section 5.
Presentation of the examples below is broadly
themed to cover: i) those confluences in which
evolution may be related to bar migration, ii) where
bank erosion or bend migration are key controls on
confluence behaviour, iii) where channel avulsion
may be dominant, and iv) those cases that possess a
stability in confluence over the 40-year time period
examined (Table 1).
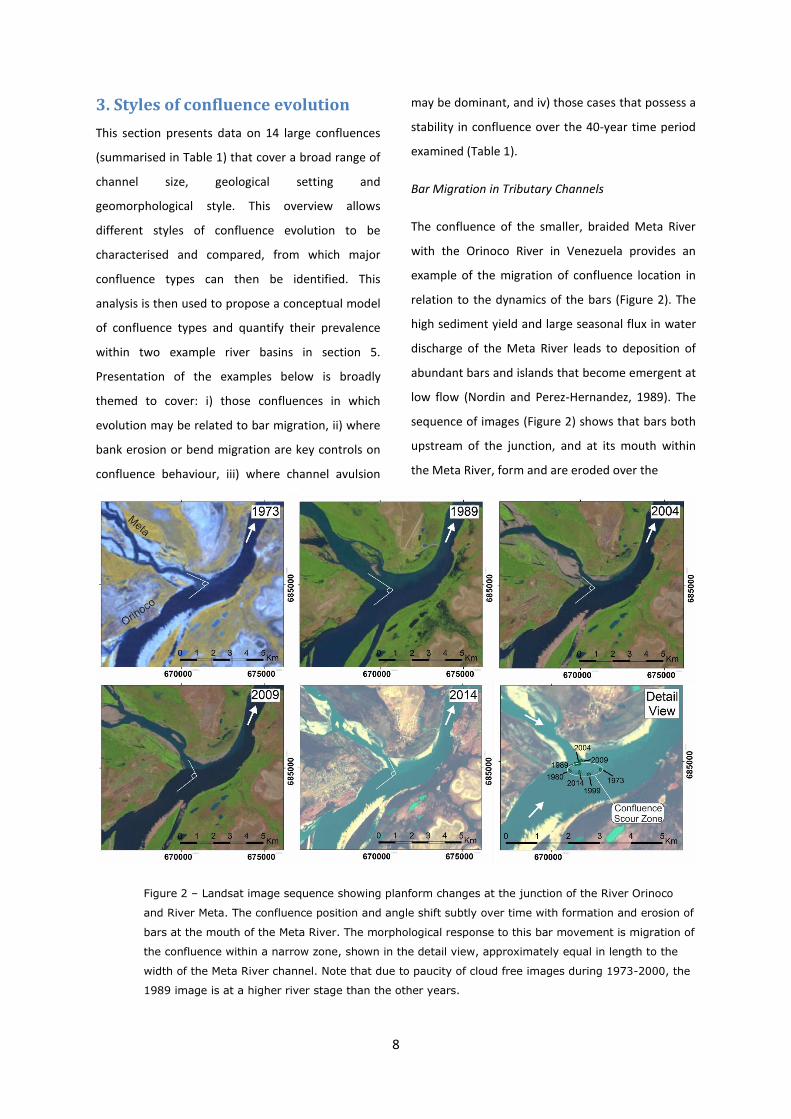
Bar Migration in Tributary Channels
The confluence of the smaller, braided Meta River
with the Orinoco River in Venezuela provides an
example of the migration of confluence location in
relation to the dynamics of the bars (Figure 2). The
high sediment yield and large seasonal flux in water
discharge of the Meta River leads to deposition of
abundant bars and islands that become emergent at
low flow (Nordin and Perez-Hernandez, 1989). The
sequence of images (Figure 2) shows that bars both
upstream of the junction, and at its mouth within
the Meta River, form and are eroded over the
Figure 2 – Landsat image sequence showing planform changes at the junction of the River Orinoco
and River Meta. The confluence position and angle shift subtly over time with formation and erosion of
bars at the mouth of the Meta River. The morphological response to this bar movement is migration of
the confluence within a narrow zone, shown in the detail view, approximately equal in length to the
width of the Meta River channel. Note that due to paucity of cloud free images during 1973-2000, the
1989 image is at a higher river stage than the other years.
9
period 1973-2014. The net result of this bar
formation and migration is that the flow from the
Meta River migrates between the left and right
edges of the wider river channel, and thus the
location of the confluence migrates up- and down-
stream by ~1km (~0.5-1 channel widths) with
respect to the larger Orinoco River. In addition, the
junction angle changes subtly over time from a
minimum of ~60° up to a maximum of ~90°-100°.
Past research (Mosley, 1976; Best, 1988) would
suggest this change in confluence angle would
increase the maximum
scour depth. Although there is ample evidence of
planform change within the Meta River upstream of
the confluence over the time period 1973-2014, the
location of the tributary channel at the confluence
does not show any migration or avulsion over this
period, and thus the movement in confluence
location is within a narrow zone of ~1 km, which is
approximately equal to the overall channel width of
the Meta River (Figure 2).
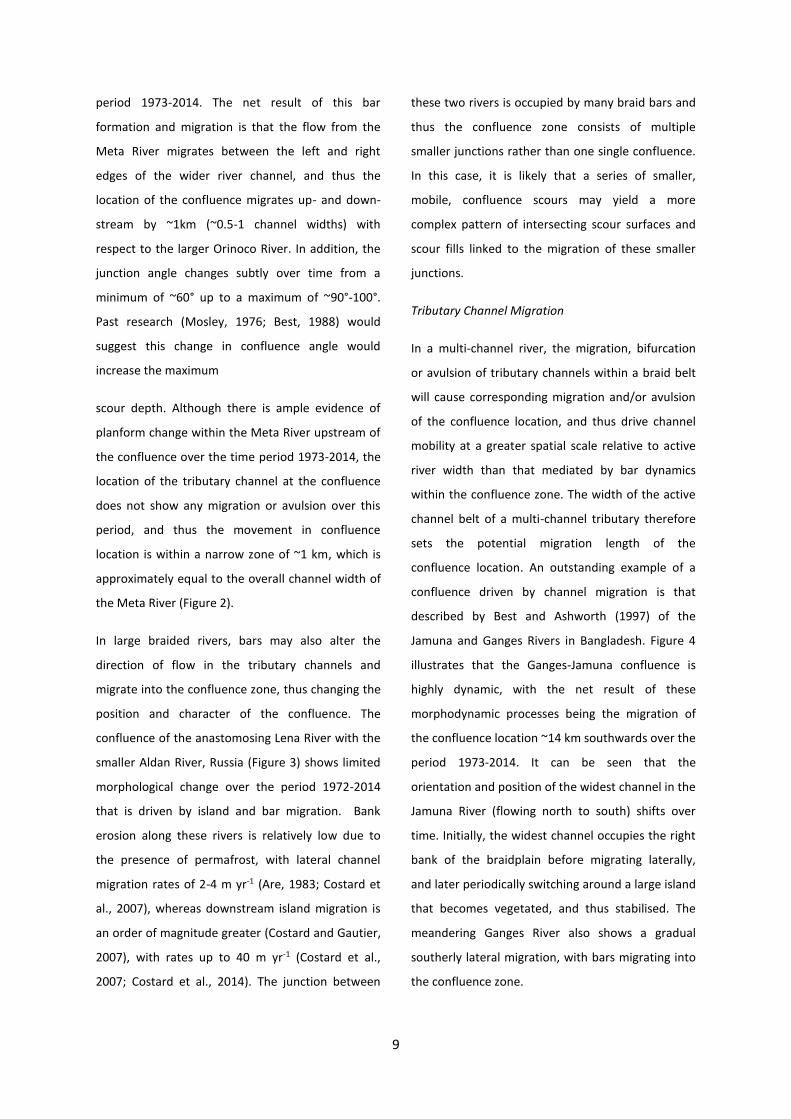
In large braided rivers, bars may also alter the
direction of flow in the tributary channels and
migrate into the confluence zone, thus changing the
position and character of the confluence. The
confluence of the anastomosing Lena River with the
smaller Aldan River, Russia (Figure 3) shows limited
morphological change over the period 1972-2014
that is driven by island and bar migration. Bank
erosion along these rivers is relatively low due to
the presence of permafrost, with lateral channel
migration rates of 2-4 m yr-1 (Are, 1983; Costard et
al., 2007), whereas downstream island migration is
an order of magnitude greater (Costard and Gautier,
2007), with rates up to 40 m yr-1 (Costard et al.,
2007; Costard et al., 2014). The junction between
these two rivers is occupied by many braid bars and
thus the confluence zone consists of multiple
smaller junctions rather than one single confluence.
In this case, it is likely that a series of smaller,
mobile, confluence scours may yield a more
complex pattern of intersecting scour surfaces and
scour fills linked to the migration of these smaller
junctions.
Tributary Channel Migration
In a multi-channel river, the migration, bifurcation
or avulsion of tributary channels within a braid belt
will cause corresponding migration and/or avulsion
of the confluence location, and thus drive channel
mobility at a greater spatial scale relative to active
river width than that mediated by bar dynamics
within the confluence zone. The width of the active
channel belt of a multi-channel tributary therefore
sets the potential migration length of the
confluence location. An outstanding example of a
confluence driven by channel migration is that
described by Best and Ashworth (1997) of the
Jamuna and Ganges Rivers in Bangladesh. Figure 4
illustrates that the Ganges-Jamuna confluence is
highly dynamic, with the net result of these
morphodynamic processes being the migration of
the confluence location ~14 km southwards over the
period 1973-2014. It can be seen that the
orientation and position of the widest channel in the
Jamuna River (flowing north to south) shifts over
time. Initially, the widest channel occupies the right
bank of the braidplain before migrating laterally,
and later periodically switching around a large island
that becomes vegetated, and thus stabilised. The
meandering Ganges River also shows a gradual
southerly lateral migration, with bars migrating into
the confluence zone.
10
Figure 3 – Landsat images showing planform change at the confluence of Lena and Aldan rivers,
Siberia, Russia from 1972 to 2014. Erosion at bar heads leads to very slow downstream migration of
bars into the confluence zone; there is also gradual bar/bank erosion in the zone downstream of the
confluence.
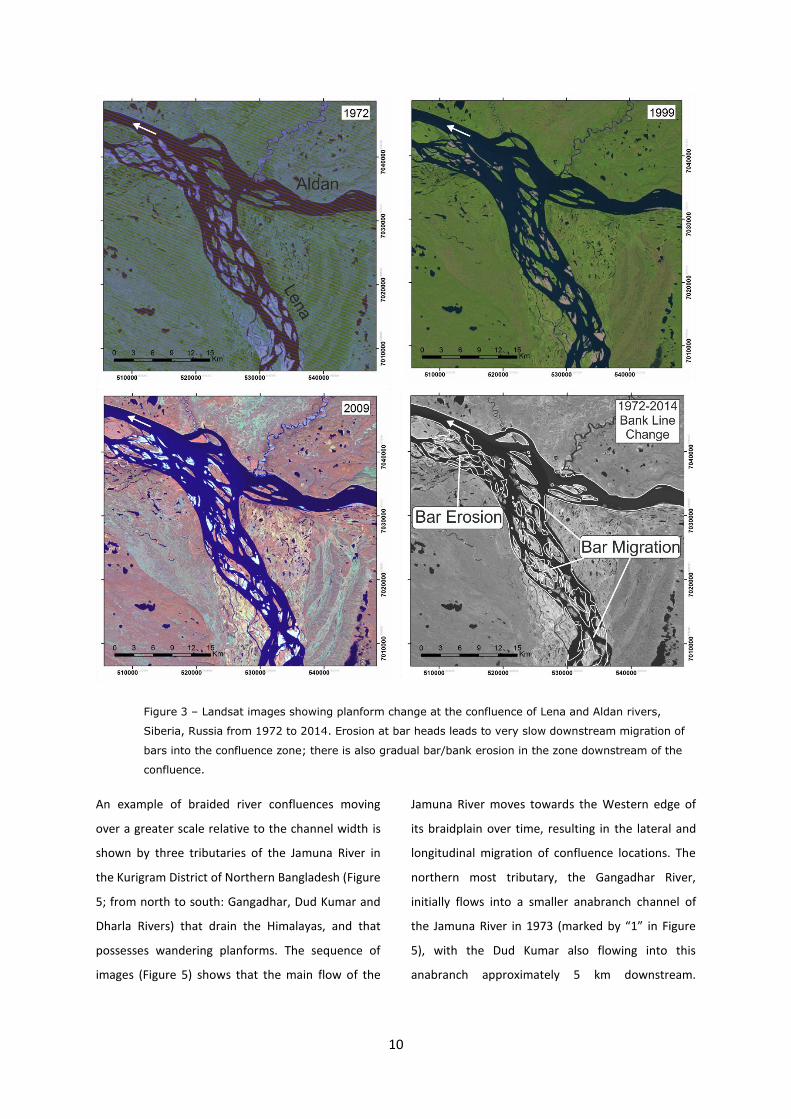
An example of braided river confluences moving
over a greater scale relative to the channel width is
shown by three tributaries of the Jamuna River in
the Kurigram District of Northern Bangladesh (Figure
5; from north to south: Gangadhar, Dud Kumar and
Dharla Rivers) that drain the Himalayas, and that
possesses wandering planforms. The sequence of
images (Figure 5) shows that the main flow of the
Jamuna River moves towards the Western edge of
its braidplain over time, resulting in the lateral and
longitudinal migration of confluence locations. The
northern most tributary, the Gangadhar River,
initially flows into a smaller anabranch channel of
the Jamuna River in 1973 (marked by “1” in Figure
5), with the Dud Kumar also flowing into this
anabranch approximately 5 km downstream.
11
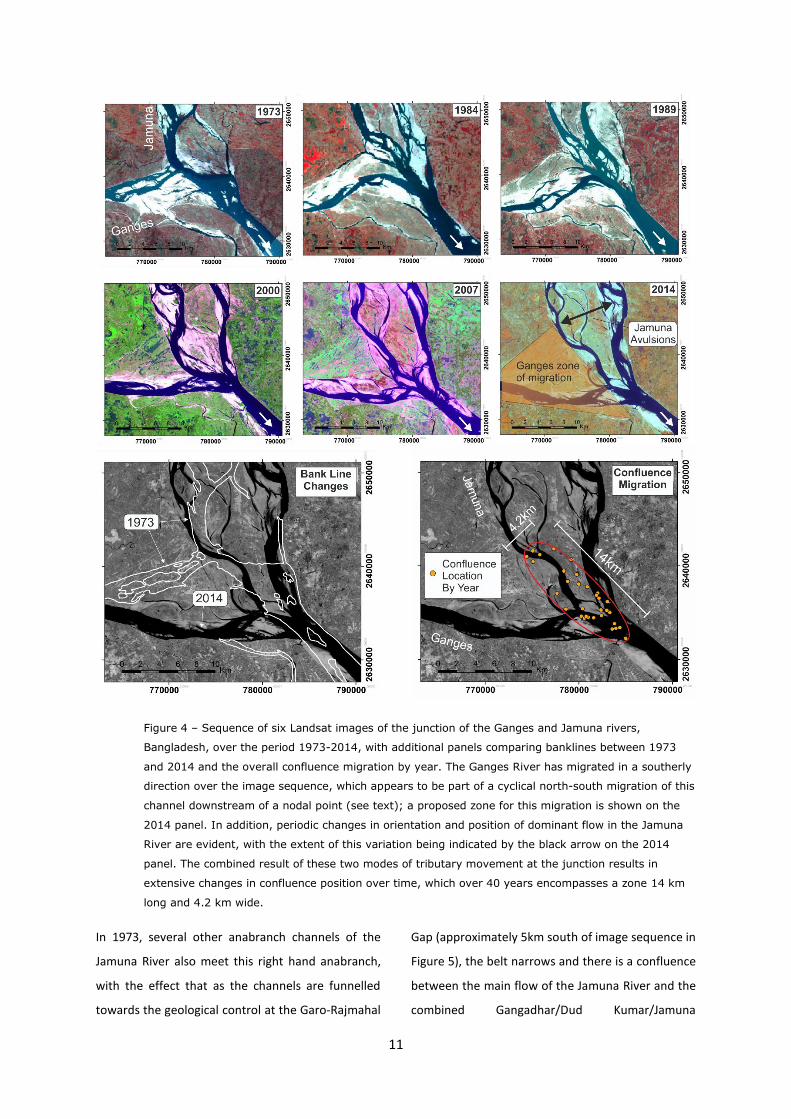
Figure 4 – Sequence of six Landsat images of the junction of the Ganges and Jamuna rivers,
Bangladesh, over the period 1973-2014, with additional panels comparing banklines between 1973
and 2014 and the overall confluence migration by year. The Ganges River has migrated in a southerly
direction over the image sequence, which appears to be part of a cyclical north-south migration of this
channel downstream of a nodal point (see text); a proposed zone for this migration is shown on the
2014 panel. In addition, periodic changes in orientation and position of dominant flow in the Jamuna
River are evident, with the extent of this variation being indicated by the black arrow on the 2014
panel. The combined result of these two modes of tributary movement at the junction results in
extensive changes in confluence position over time, which over 40 years encompasses a zone 14 km
long and 4.2 km wide.
In 1973, several other anabranch channels of the
Jamuna River also meet this right hand anabranch,
with the effect that as the channels are funnelled
towards the geological control at the Garo-Rajmahal
Gap (approximately 5km south of image sequence in
Figure 5), the belt narrows and there is a confluence
between the main flow of the Jamuna River and the
combined Gangadhar/Dud Kumar/Jamuna
12
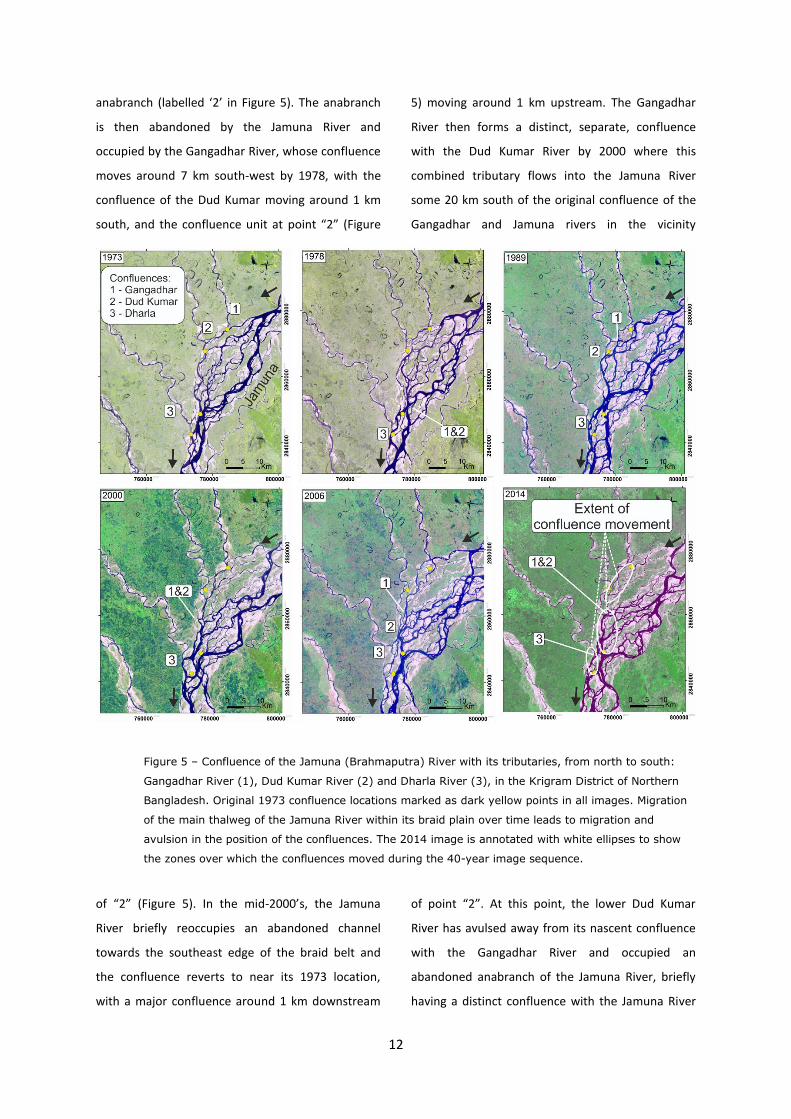
anabranch (labelled ‘2’ in Figure 5). The anabranch
is then abandoned by the Jamuna River and
occupied by the Gangadhar River, whose confluence
moves around 7 km south-west by 1978, with the
confluence of the Dud Kumar moving around 1 km
south, and the confluence unit at point “2” (Figure
5) moving around 1 km upstream. The Gangadhar
River then forms a distinct, separate, confluence
with the Dud Kumar River by 2000 where this
combined tributary flows into the Jamuna River
some 20 km south of the original confluence of the
Gangadhar and Jamuna rivers in the vicinity
Figure 5 – Confluence of the Jamuna (Brahmaputra) River with its tributaries, from north to south:
Gangadhar River (1), Dud Kumar River (2) and Dharla River (3), in the Krigram District of Northern
Bangladesh. Original 1973 confluence locations marked as dark yellow points in all images. Migration
of the main thalweg of the Jamuna River within its braid plain over time leads to migration and
avulsion in the position of the confluences. The 2014 image is annotated with white ellipses to show
the zones over which the confluences moved during the 40-year image sequence.
of “2” (Figure 5). In the mid-2000’s, the Jamuna
River briefly reoccupies an abandoned channel
towards the southeast edge of the braid belt and
the confluence reverts to near its 1973 location,
with a major confluence around 1 km downstream
of point “2”. At this point, the lower Dud Kumar
River has avulsed away from its nascent confluence
with the Gangadhar River and occupied an
abandoned anabranch of the Jamuna River, briefly
having a distinct confluence with the Jamuna River
13
around 25 km south of its 1973 confluence location.
By 2014, the main flow of the Jamuna River again
abandons the anabranch and a combined
Gangadhar/Dud Kumar tributary meets the Jamuna
River around 15 km south of point 1 (Figure 5). The
southernmost confluence in Figure 5, between the
Dharla and Jamuna rivers, is less complex, as there
appears less lateral space for the Jamuna River to
migrate. The position of the confluence marked as
“3” (Figure 5) can be seen to migrate steadily
towards the right edge of the Jamuna River braid
belt from 1973 to 2000, before moving upstream
with the abandonment of an anabranch of the
Jamuna River in 2006. Most importantly, in this river
the reworking of deposits at these wandering
junctions may be extensive enough to encompass
the entire 20 km wide braid plain over a period of 40
years. Within this zone of reworking, the associated
confluence scours are each likely to occupy zones up
to 8-10km long and up to 5km wide. Over longer
time periods, these are likely to form continuous
composite scour surfaces, perhaps similar to the
Lower Cretaceous tributary scour surfaces
reconstructed by Ardies et al. (2002).
Confluence evolution in response to channel
movement can also be seen in meandering rivers, as
illustrated by the junction of the Paraguay and
Bermejo rivers in Argentina (Figure 6). The Paraguay
River at this location is relatively stable, but
meander migration in the Bermejo River, upstream
of the confluence, drives changes in the confluence
location. Between 1985 and 1993, the Bermejo
River cuts through and abandons a meander
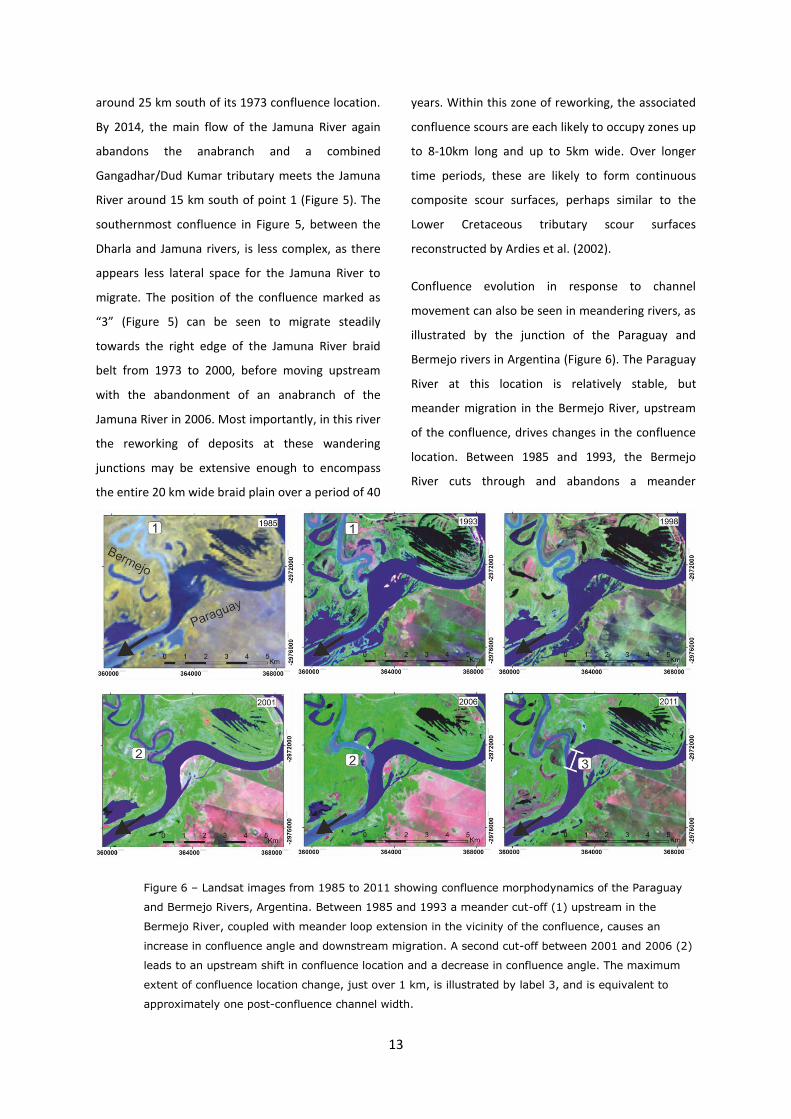
Figure 6 – Landsat images from 1985 to 2011 showing confluence morphodynamics of the Paraguay
and Bermejo Rivers, Argentina. Between 1985 and 1993 a meander cut-off (1) upstream in the
Bermejo River, coupled with meander loop extension in the vicinity of the confluence, causes an
increase in confluence angle and downstream migration. A second cut-off between 2001 and 2006 (2)
leads to an upstream shift in confluence location and a decrease in confluence angle. The maximum
extent of confluence location change, just over 1 km, is illustrated by label 3, and is equivalent to
approximately one post-confluence channel width.
14
bend (labelled 1 in Figure 6), whilst the bends in the
immediate vicinity of the confluence extend,
increasing the junction angle from 30° to 110°. Over
the period 1993 to 2001, the Bermejo River
gradually increases in sinuosity (from 1.72 to 2.37)
as the individual meander bends extend and
translate downvalley with respect to the tributary,
and this has the effect of moving the confluence
location gradually downstream relative to the
Paraguay River, whilst the junction angle remains
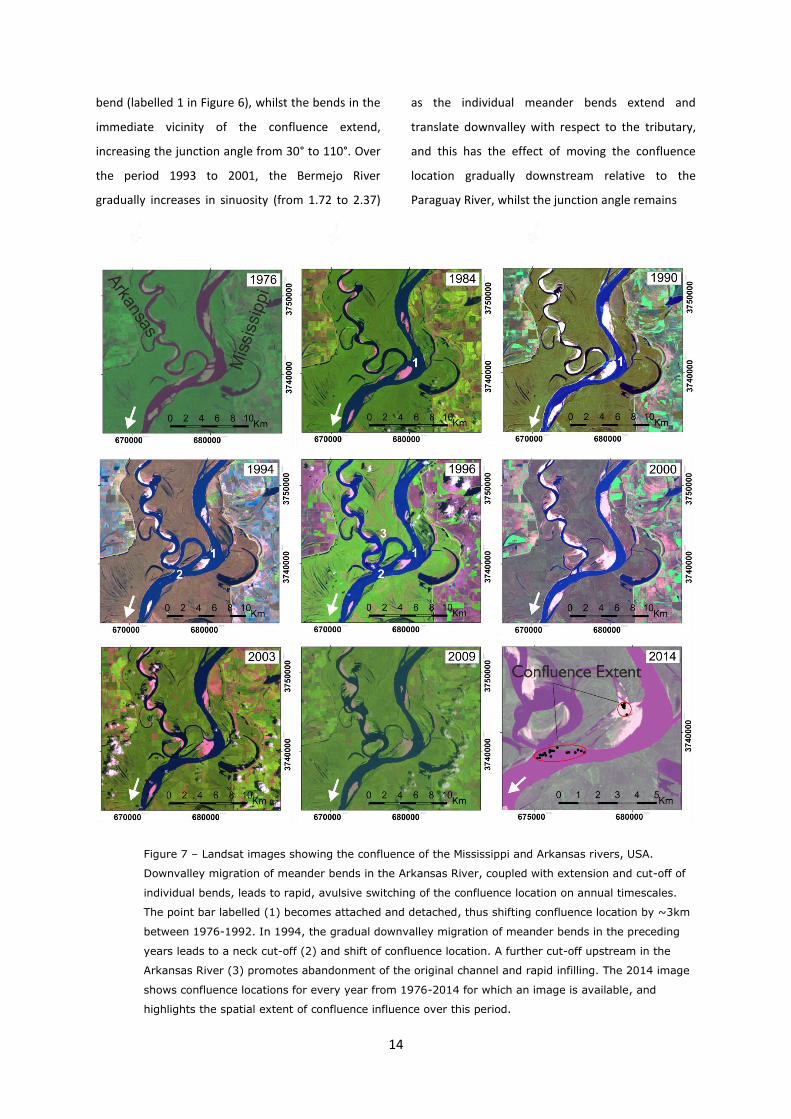
Figure 7 – Landsat images showing the confluence of the Mississippi and Arkansas rivers, USA.
Downvalley migration of meander bends in the Arkansas River, coupled with extension and cut-off of
individual bends, leads to rapid, avulsive switching of the confluence location on annual timescales.
The point bar labelled (1) becomes attached and detached, thus shifting confluence location by ~3km
between 1976-1992. In 1994, the gradual downvalley migration of meander bends in the preceding
years leads to a neck cut-off (2) and shift of confluence location. A further cut-off upstream in the
Arkansas River (3) promotes abandonment of the original channel and rapid infilling. The 2014 image
shows confluence locations for every year from 1976-2014 for which an image is available, and
highlights the spatial extent of confluence influence over this period.
15
high angle or obtuse (70-110°). A meander bend
neck cut-off in the Bermejo River immediately
upstream of the junction occurs between 2001 and
2006 (labelled 2, Figure 6), reducing sinuosity (from
2.37 to 1.44) and junction angle (95° to 45°), before
rapid extension of a new meander loop between
2006 to 2011 once again increases sinuosity from
1.44 to 2.06. Over this temporal sequence, the
location of the Bermejo-Paraguay confluence
migrated over a distance of ~600 m, or
approximately 0.8 times the post-confluence
channel width; however, based on the position of
abandoned meander loops in the floodplain, the
confluence location may have repeatedly migrated
over as much as 2 km through meander neck cut-
offs. Given the confluence angle has also varied
between 15° and 110°, it is likely there has also been
an associated spatially-variable pattern in maximum
scour depth.
The junction of the Mississippi and Arkansas rivers
(Figure 7) is another example of a highly mobile
confluence in a meandering river. The sequence of
images (Figure 7) shows that the position of the
confluence is driven by downvalley meander
migration and resulting neck cut-off in the smaller
Arkansas River, coupled with deposition,
attachment and erosion of a large point bar in the
Mississippi River (labelled 1, Figure 7). The result of
these morphodynamic changes at the junction is a
switching of confluence location up and
downstream with respect to the Mississippi River
over a total distance of around 5 km (4 channel
widths; Figure 7). The presence of meander scars in
the valley of the Arkansas River also suggests that
the maximum extent of this confluence migration
could be as much as 10 km.
Avulsion of the Channel Belt
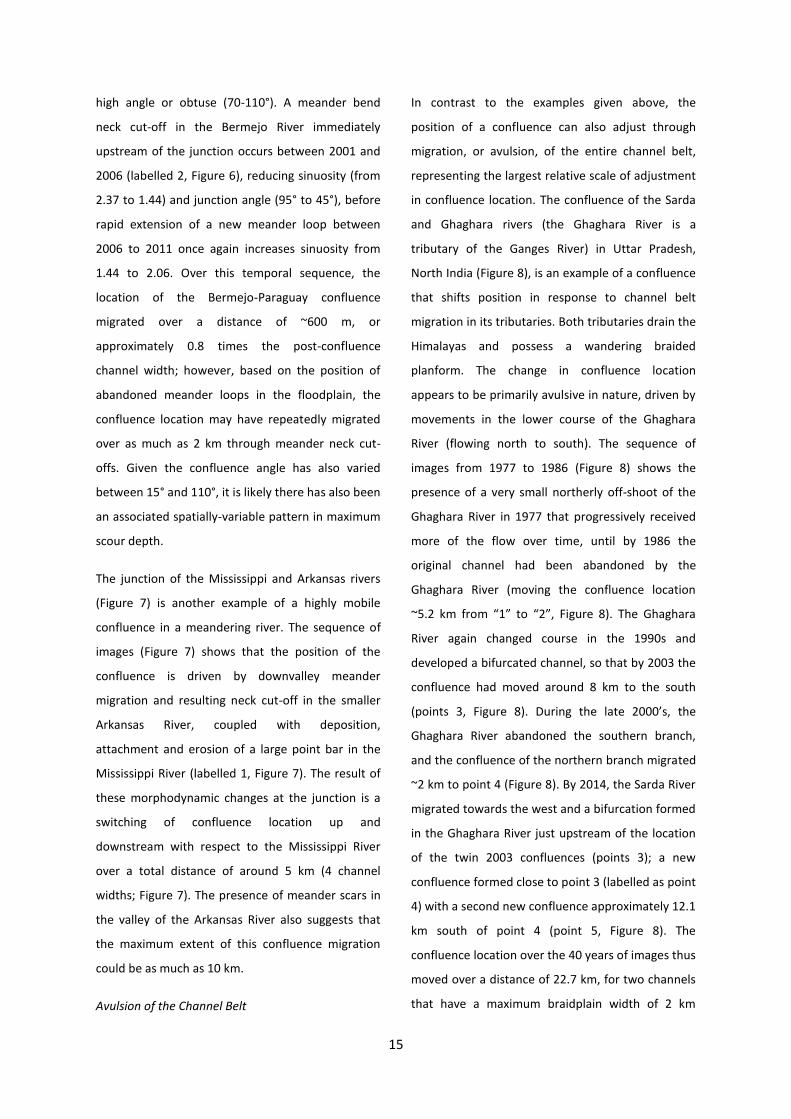
In contrast to the examples given above, the
position of a confluence can also adjust through
migration, or avulsion, of the entire channel belt,
representing the largest relative scale of adjustment
in confluence location. The confluence of the Sarda
and Ghaghara rivers (the Ghaghara River is a
tributary of the Ganges River) in Uttar Pradesh,
North India (Figure 8), is an example of a confluence
that shifts position in response to channel belt
migration in its tributaries. Both tributaries drain the
Himalayas and possess a wandering braided
planform. The change in confluence location
appears to be primarily avulsive in nature, driven by
movements in the lower course of the Ghaghara
River (flowing north to south). The sequence of
images from 1977 to 1986 (Figure 8) shows the
presence of a very small northerly off-shoot of the
Ghaghara River in 1977 that progressively received
more of the flow over time, until by 1986 the
original channel had been abandoned by the
Ghaghara River (moving the confluence location
~5.2 km from “1” to “2”, Figure 8). The Ghaghara
River again changed course in the 1990s and
developed a bifurcated channel, so that by 2003 the
confluence had moved around 8 km to the south
(points 3, Figure 8). During the late 2000’s, the
Ghaghara River abandoned the southern branch,
and the confluence of the northern branch migrated
~2 km to point 4 (Figure 8). By 2014, the Sarda River
migrated towards the west and a bifurcation formed
in the Ghaghara River just upstream of the location
of the twin 2003 confluences (points 3); a new
confluence formed close to point 3 (labelled as point
4) with a second new confluence approximately 12.1
km south of point 4 (point 5, Figure 8). The
confluence location over the 40 years of images thus
moved over a distance of 22.7 km, for two channels
that have a maximum braidplain width of 2 km
16
during the image sequence. This illustrates the
potential for confluences of morphodynamically-
active tributaries to move over distances around an
order of magnitude greater than their channel width
on decadal timescales.
Figure 8 – Landsat images showing confluence of the Ghaghara River (flowing north to south) and
Sarda River (flowing broadly west-east), Uttar Pradesh, India. Migration and avulsion of the lower
Ghaghara channel drives the movement of the confluence location from (1) in 1977 to (2) in 1986
where a dual junction is present, to (3) in 2003 and finally two separate confluences (4 & 5) around
12 km apart in 2014. The 2014 image shows the extent of confluence movement is 23 km from (2) to
(5). Note that confluence location also migrates approximately 1km during the intra-avulsion periods
(1) between 1977-1980 and (2) between 1986-1992.
The imagery also demonstrates that the rate of
confluence migration can change significantly over
time, and previously mobile confluences may
become much more stable. This can occur where, as
a result of either a natural geological hard point or
anthropogenic bank reinforcement, the confluence
becomes constrained against a less easily erodible
substrate and becomes “pinned” in place.
Depending on the extent of the hard point, this
confluence stability may be a temporary
phenomenon, ending when the hard point is
eventually eroded, or the morphodynamics are such
that the channel avulses away from, or around, the
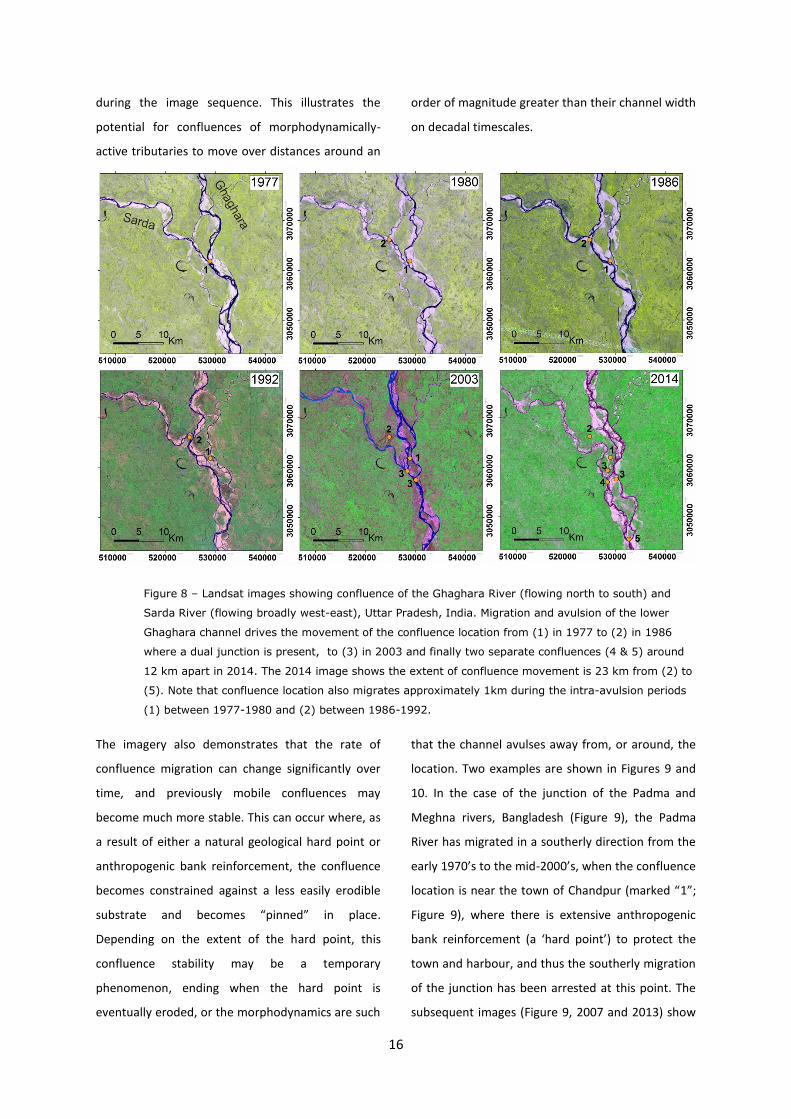
location. Two examples are shown in Figures 9 and
10. In the case of the junction of the Padma and
Meghna rivers, Bangladesh (Figure 9), the Padma
River has migrated in a southerly direction from the
early 1970’s to the mid-2000’s, when the confluence
location is near the town of Chandpur (marked “1”;
Figure 9), where there is extensive anthropogenic
bank reinforcement (a ‘hard point’) to protect the
town and harbour, and thus the southerly migration
of the junction has been arrested at this point. The
subsequent images (Figure 9, 2007 and 2013) show
17
an increasingly concave embayment forming
upstream of the pinned confluence, coupled with
increased bank erosion downstream. It is important
to note that although the location of the confluence
is pinned against the hard point in 2014, there has
been substantial planform adjustment up- and
down- stream of the confluence from 2003 to 2014,
demonstrating that the channel is highly mobile.
Figure 9 – Confluence of the Padma and Meghna Rivers near Chandpur, Bangladesh. The confluence
location migrates in a southerly direction from 1973-2003 before reaching the anthropogenic hard
point at Chandpur (point 1). In the 2007 and 2013 images there is increasing erosion up and
downstream of point 1. The 1973-2014 change panel shows the 2014 banklines superimposed onto a
grayscale image of the 1973 river.
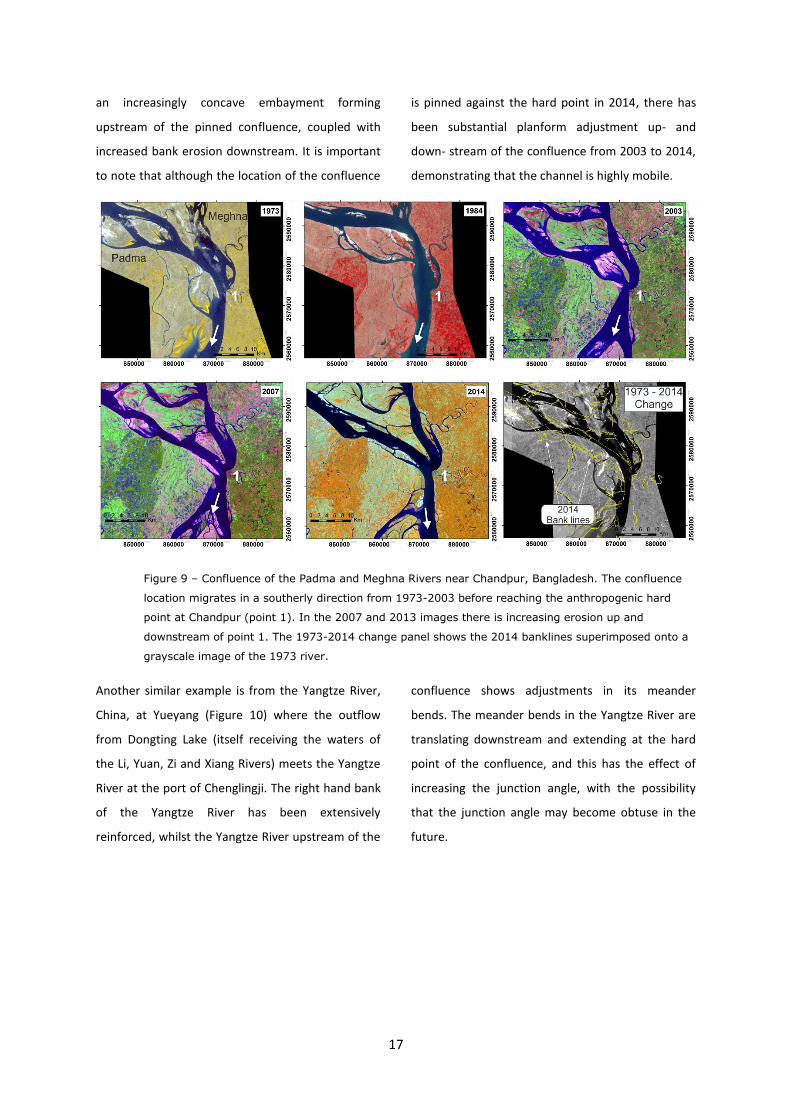
Another similar example is from the Yangtze River,
China, at Yueyang (Figure 10) where the outflow
from Dongting Lake (itself receiving the waters of
the Li, Yuan, Zi and Xiang Rivers) meets the Yangtze
River at the port of Chenglingji. The right hand bank
of the Yangtze River has been extensively
reinforced, whilst the Yangtze River upstream of the
confluence shows adjustments in its meander
bends. The meander bends in the Yangtze River are
translating downstream and extending at the hard
point of the confluence, and this has the effect of
increasing the junction angle, with the possibility
that the junction angle may become obtuse in the
future.
18
Figure 10 – Confluence of the Yangtze River and outflow from Dongting Lake, Yueyang, China.
Digitised banklines from 1973, 1989, 1995 and 2005 are superimposed onto two images of the
confluence planform from 2009. This sequence shows the translation and extension of meanders
upstream of the pinned confluence.
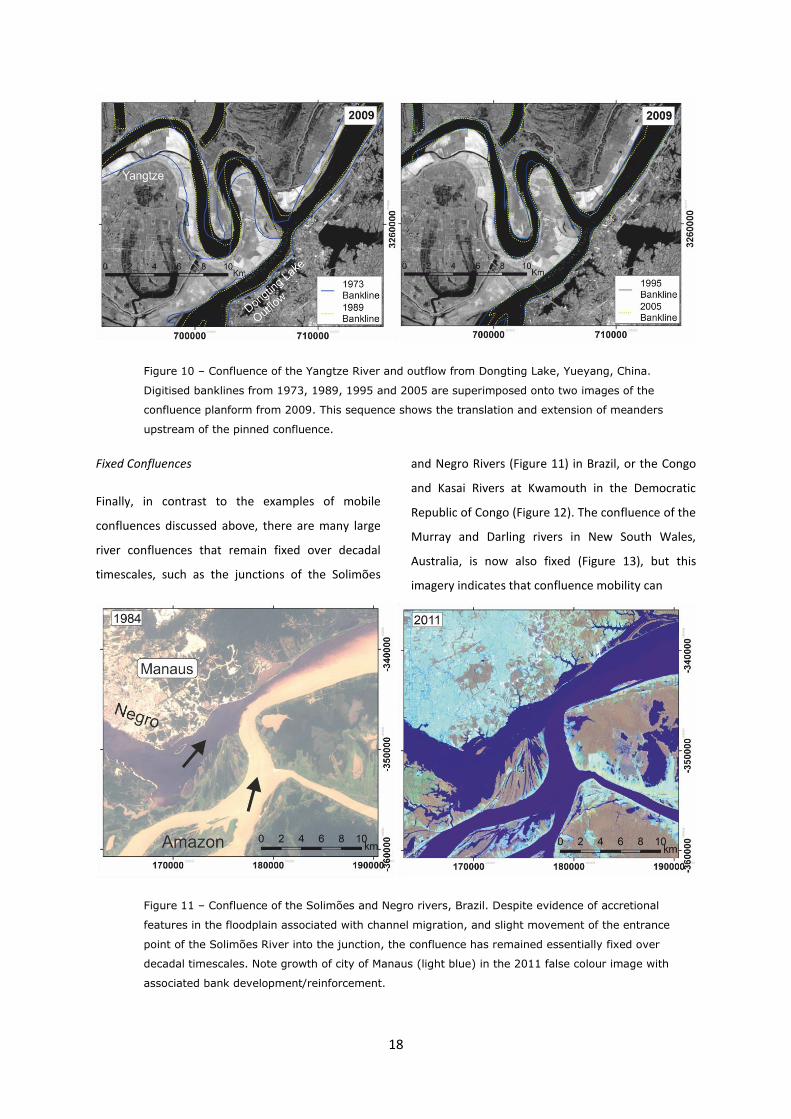
Fixed Confluences
Finally, in contrast to the examples of mobile
confluences discussed above, there are many large
river confluences that remain fixed over decadal
timescales, such as the junctions of the Solimões
and Negro Rivers (Figure 11) in Brazil, or the Congo
and Kasai Rivers at Kwamouth in the Democratic
Republic of Congo (Figure 12). The confluence of the
Murray and Darling rivers in New South Wales,
Australia, is now also fixed (Figure 13), but this
imagery indicates that confluence mobility can
Figure 11 – Confluence of the Solimões and Negro rivers, Brazil. Despite evidence of accretional
features in the floodplain associated with channel migration, and slight movement of the entrance
point of the Solimões River into the junction, the confluence has remained essentially fixed over
decadal timescales. Note growth of city of Manaus (light blue) in the 2011 false colour image with
associated bank development/reinforcement.
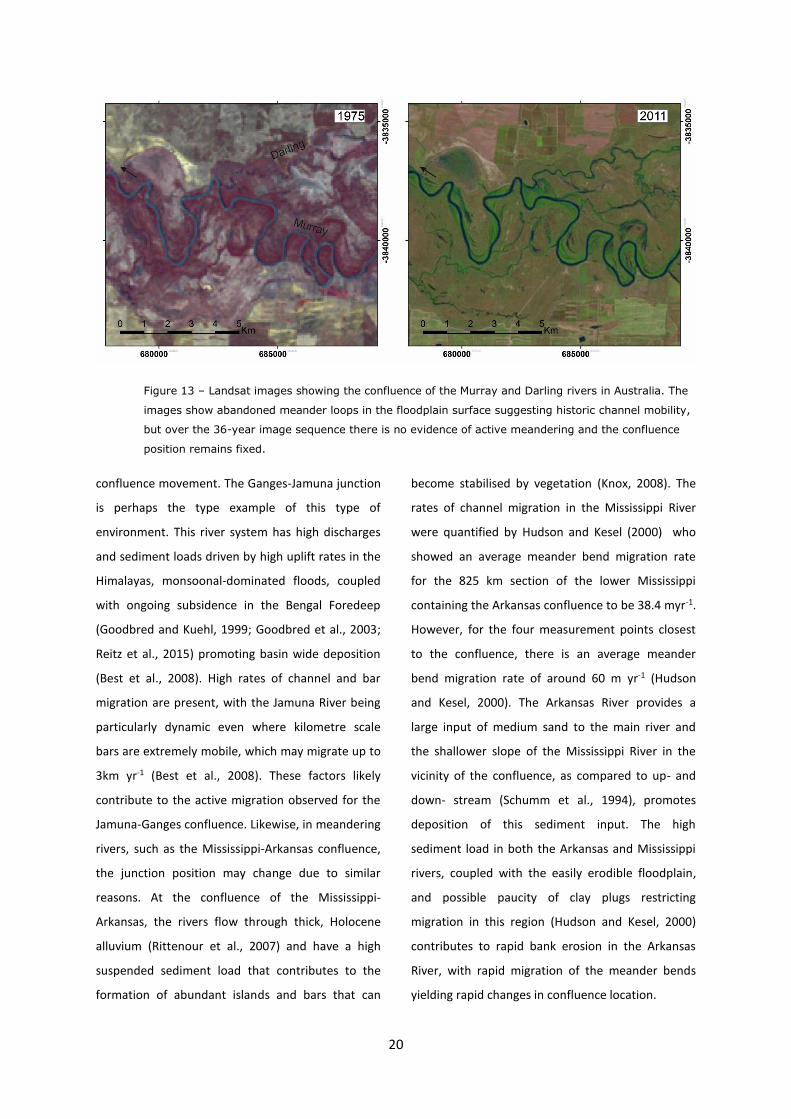
19
change significantly through time. For example, the
abandoned meander loops and scars in the
floodplain (Figure 13) suggest that at some point in
the past the river was morphodynamically active
and confluence evolution may have been more
similar to the example of the Mississippi and
Arkansas rivers presented above. It is important to
note that these junctions can only be viewed as
fixed over the 40 year period of observation, and
that they may display either much slower timescales
of adjustment, or the period of observation may
have coincided with a hiatus in a more episodic type
of mobility. Further work is required to quantify the
abundance of fixed confluences over much longer
timescales as these are likely to represent discrete
scour features in the rock record, compared to more
extensive scour surfaces produced by mobile
confluences. In order to understand more about
fixed confluences and timescales of adjustment, it is
thus necessary to understand the broader controls
on confluence mobility.
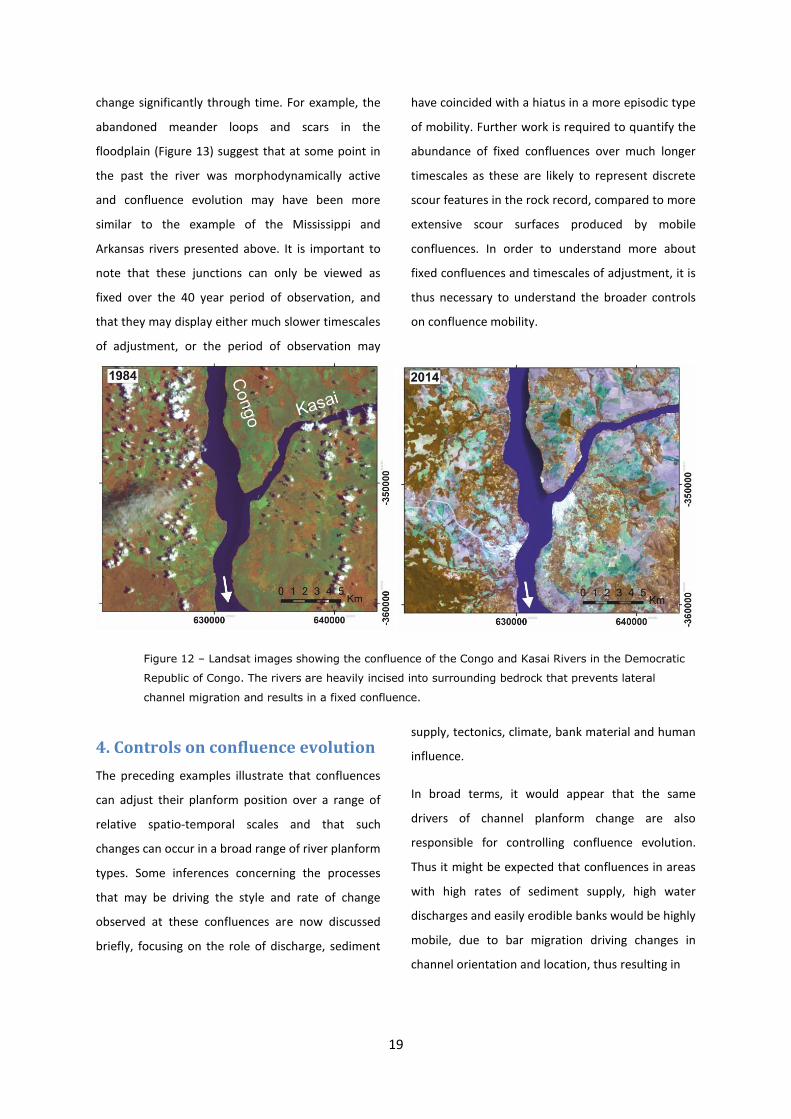
Figure 12 – Landsat images showing the confluence of the Congo and Kasai Rivers in the Democratic
Republic of Congo. The rivers are heavily incised into surrounding bedrock that prevents lateral
channel migration and results in a fixed confluence.
4. Controls on confluence evolution
The preceding examples illustrate that confluences
can adjust their planform position over a range of
relative spatio-temporal scales and that such
changes can occur in a broad range of river planform
types. Some inferences concerning the processes
that may be driving the style and rate of change
observed at these confluences are now discussed
briefly, focusing on the role of discharge, sediment
supply, tectonics, climate, bank material and human
influence.
In broad terms, it would appear that the same
drivers of channel planform change are also
responsible for controlling confluence evolution.
Thus it might be expected that confluences in areas
with high rates of sediment supply, high water
discharges and easily erodible banks would be highly
mobile, due to bar migration driving changes in
channel orientation and location, thus resulting in
20
Figure 13 – Landsat images showing the confluence of the Murray and Darling rivers in Australia. The
images show abandoned meander loops in the floodplain surface suggesting historic channel mobility,
but over the 36-year image sequence there is no evidence of active meandering and the confluence
position remains fixed.
confluence movement. The Ganges-Jamuna junction
is perhaps the type example of this type of
environment. This river system has high discharges
and sediment loads driven by high uplift rates in the
Himalayas, monsoonal-dominated floods, coupled
with ongoing subsidence in the Bengal Foredeep
(Goodbred and Kuehl, 1999; Goodbred et al., 2003;
Reitz et al., 2015) promoting basin wide deposition
(Best et al., 2008). High rates of channel and bar
migration are present, with the Jamuna River being
particularly dynamic even where kilometre scale
bars are extremely mobile, which may migrate up to
3km yr-1 (Best et al., 2008). These factors likely
contribute to the active migration observed for the
Jamuna-Ganges confluence. Likewise, in meandering
rivers, such as the Mississippi-Arkansas confluence,
the junction position may change due to similar
reasons. At the confluence of the Mississippi-
Arkansas, the rivers flow through thick, Holocene
alluvium (Rittenour et al., 2007) and have a high
suspended sediment load that contributes to the
formation of abundant islands and bars that can
become stabilised by vegetation (Knox, 2008). The
rates of channel migration in the Mississippi River
were quantified by Hudson and Kesel (2000) who
showed an average meander bend migration rate
for the 825 km section of the lower Mississippi
containing the Arkansas confluence to be 38.4 myr-1.
However, for the four measurement points closest
to the confluence, there is an average meander
bend migration rate of around 60 m yr-1 (Hudson
and Kesel, 2000). The Arkansas River provides a
large input of medium sand to the main river and
the shallower slope of the Mississippi River in the
vicinity of the confluence, as compared to up- and
down- stream (Schumm et al., 1994), promotes
deposition of this sediment input. The high
sediment load in both the Arkansas and Mississippi
rivers, coupled with the easily erodible floodplain,
and possible paucity of clay plugs restricting
migration in this region (Hudson and Kesel, 2000)
contributes to rapid bank erosion in the Arkansas
River, with rapid migration of the meander bends
yielding rapid changes in confluence location.
21
In contrast, where there is significant geological
control, confluences may be essentially static over
decadal timescales, as illustrated by the confluence
of the Congo and Kasai Rivers (Figure 12). At this
location, the confluence remains fixed due to the
inability of either channel to migrate laterally in the
presence of bedrock control. Changes in climate
may also lead to a change in confluence dynamics,
as is likely in the case of the Murray-Darling rivers
(Figure 13). River discharges in this region were
much higher than at present during the last glacial
maximum (LGM) through to the early Holocene
(Page et al., 1996; Nanson et al., 2008; Fitzsimmons
et al., 2013), with channel size and lateral migration
decreasing since the LGM (Nanson et al., 2008;
Fitzsimmons et al., 2013). The average annual flood
and long-term mean annual discharge have also
been reduced substantially over the later part of the
20th century by human intervention through water
diversions, and the construction of dams
(Maheshwari et al., 1995) and over 3600 weirs
(Arthington and Pusey, 2003). As a result, the
present day Murray-Darling River has a remarkably
low annual discharge for its catchment area
(Maheshwari et al., 1995; Arthington and Pusey,
2003), resulting in a confluence with no detectable
movement over decadal timescales. Within-channel
engineering works have also had a direct impact on
the movement of the Padma-Meghna and Yangtze
river confluences described herein, by introducing
an artificial hardpoints that prevent the migration of
these junctions.
5. A new classification of planform
confluence behaviour
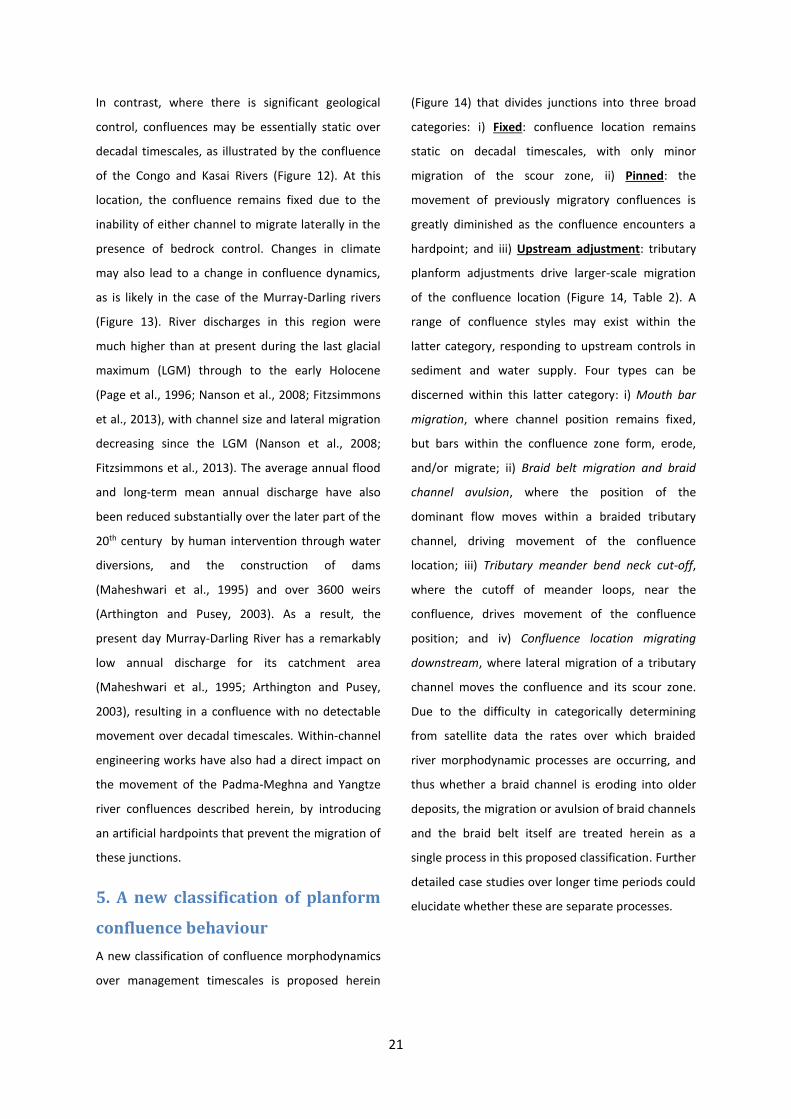
A new classification of confluence morphodynamics
over management timescales is proposed herein
(Figure 14) that divides junctions into three broad
categories: i) Fixed: confluence location remains
static on decadal timescales, with only minor
migration of the scour zone, ii) Pinned: the
movement of previously migratory confluences is
greatly diminished as the confluence encounters a
hardpoint; and iii) Upstream adjustment: tributary
planform adjustments drive larger-scale migration
of the confluence location (Figure 14, Table 2). A
range of confluence styles may exist within the
latter category, responding to upstream controls in
sediment and water supply. Four types can be
discerned within this latter category: i) Mouth bar
migration, where channel position remains fixed,
but bars within the confluence zone form, erode,
and/or migrate; ii) Braid belt migration and braid
channel avulsion, where the position of the
dominant flow moves within a braided tributary
channel, driving movement of the confluence
location; iii) Tributary meander bend neck cut-off,
where the cutoff of meander loops, near the
confluence, drives movement of the confluence
position; and iv) Confluence location migrating
downstream, where lateral migration of a tributary
channel moves the confluence and its scour zone.
Due to the difficulty in categorically determining
from satellite data the rates over which braided
river morphodynamic processes are occurring, and
thus whether a braid channel is eroding into older
deposits, the migration or avulsion of braid channels
and the braid belt itself are treated herein as a
single process in this proposed classification. Further
detailed case studies over longer time periods could
elucidate whether these are separate processes.
22
Figure 14 – A classification of confluence types based on analysis of Landsat imagery. See text for
explanation.
Having identified these different styles of behaviour,
the abundance of confluence types in different
basins can now be addressed. In order to begin to
answer this issue, 117 confluences for which both
tributary channels were greater than 250m wide
were identified in two of the world’s largest river
basins: the Ganges-Brahmaputra-Meghna (GBM)
(Figure 15) and the Amazon (Figure 16). Landsat
imagery spanning the period 1988 to 2014 was used
to classify each confluence according to the
classification scheme given in Figure 14. This
analysis demonstrates that for channels of a similar
size, the GBM and Amazon basins represent
confluences with a very different mobility (Table 2),
with over 80% of the large river confluences in the
GBM basin being mobile over decadal timescales,
whereas in the Amazon basin less than 40% of large
river confluences are mobile.
As discussed above, the characteristics of the GBM
basin that produce such high rates of channel
change are the highly seasonal monsoonal discharge
regime, low cohesive bank strength and high
sediment yields. The majority of sediment delivered
to tributaries of the GBM is fine sand, with a
relatively low silt fraction from Precambrian
metasedimentary rocks (Datta and Subramanian,
1997; Mukherjee et al., 2009). The sediments in the
channels are thus primarily unconsolidated, with the
high sediment yields leading to a dynamic
braiding/anabranching pattern in the majority of
channels within the GBM basin.
23
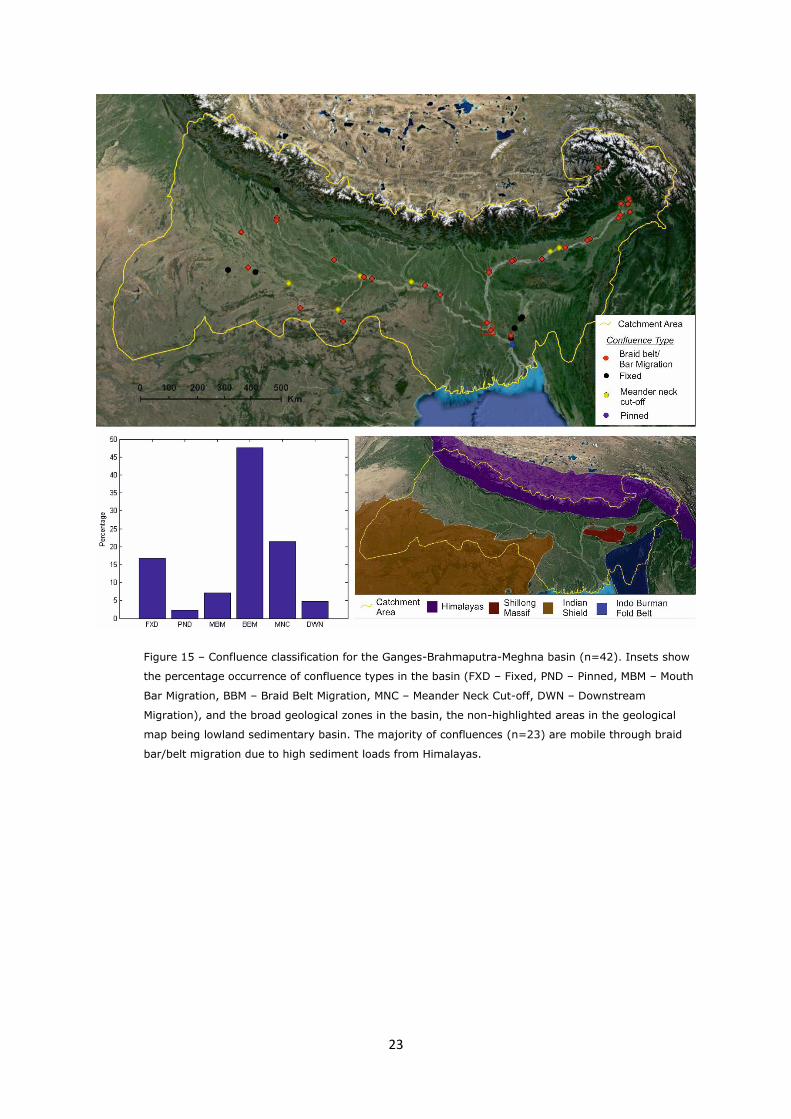
Figure 15 – Confluence classification for the Ganges-Brahmaputra-Meghna basin (n=42). Insets show
the percentage occurrence of confluence types in the basin (FXD – Fixed, PND – Pinned, MBM – Mouth
Bar Migration, BBM – Braid Belt Migration, MNC – Meander Neck Cut-off, DWN – Downstream
Migration), and the broad geological zones in the basin, the non-highlighted areas in the geological
map being lowland sedimentary basin. The majority of confluences (n=23) are mobile through braid
bar/belt migration due to high sediment loads from Himalayas.
24
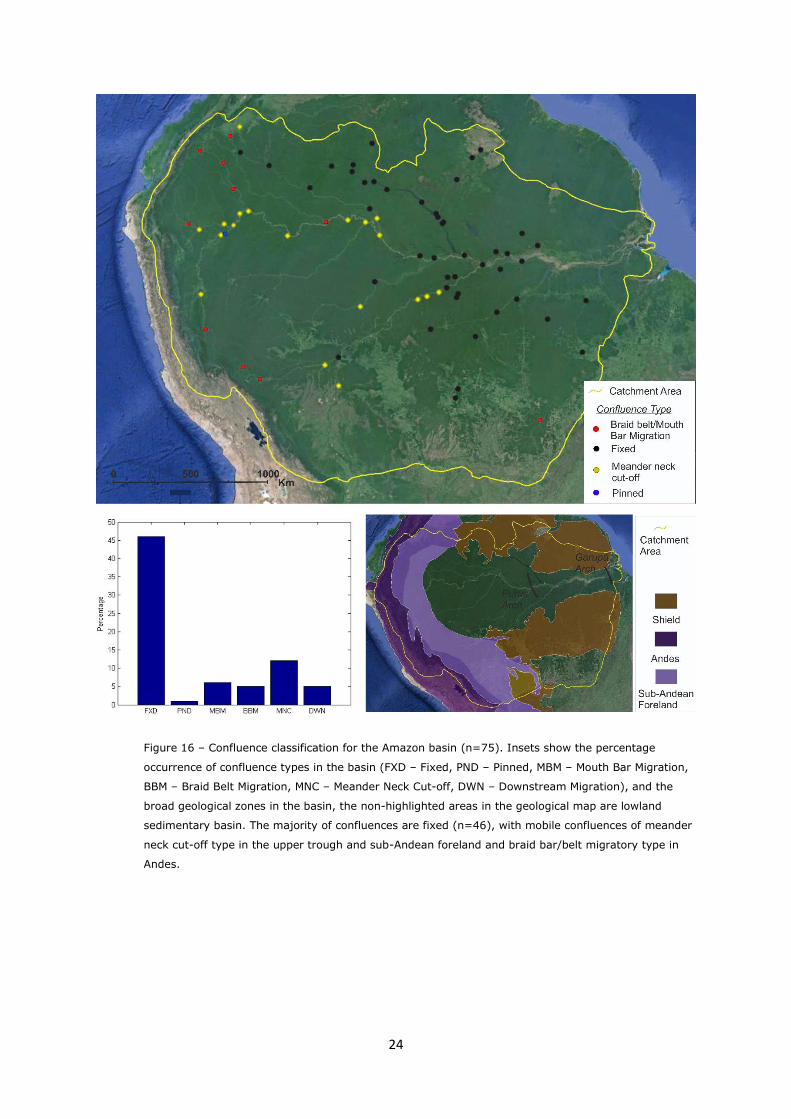
Figure 16 – Confluence classification for the Amazon basin (n=75). Insets show the percentage
occurrence of confluence types in the basin (FXD – Fixed, PND – Pinned, MBM – Mouth Bar Migration,
BBM – Braid Belt Migration, MNC – Meander Neck Cut-off, DWN – Downstream Migration), and the
broad geological zones in the basin, the non-highlighted areas in the geological map are lowland
sedimentary basin. The majority of confluences are fixed (n=46), with mobile confluences of meander
neck cut-off type in the upper trough and sub-Andean foreland and braid bar/belt migratory type in
Andes.
25
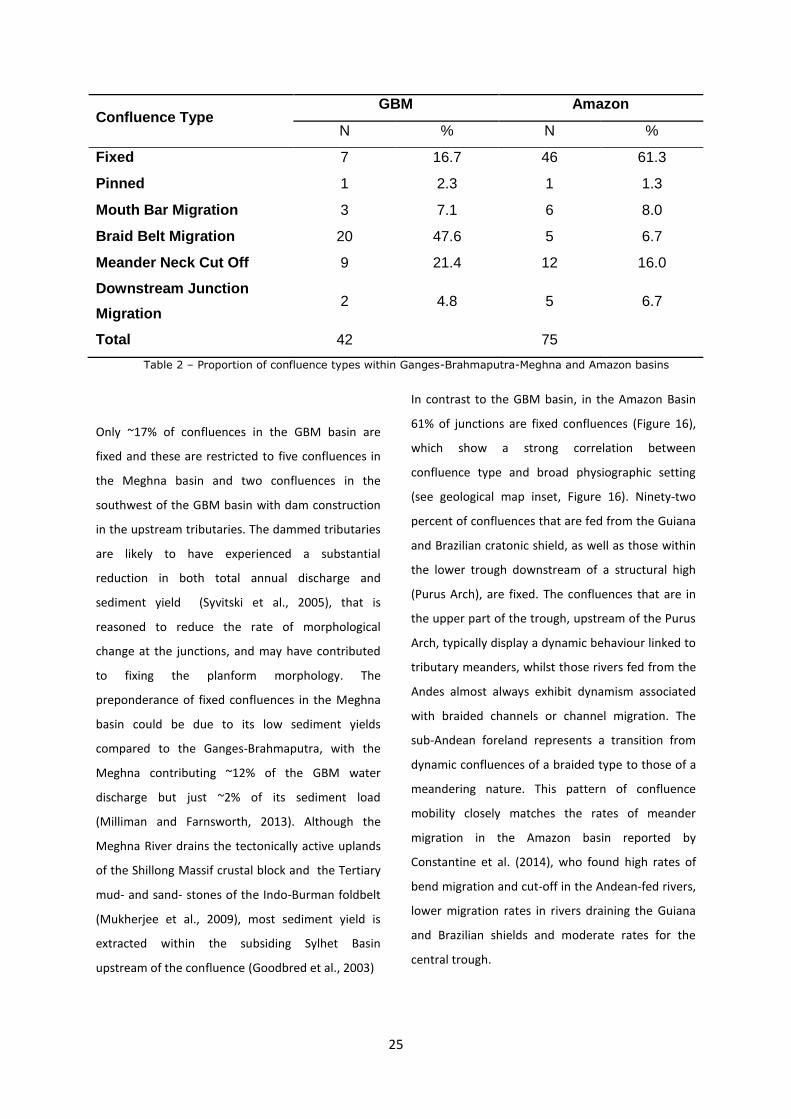
Confluence Type GBM Amazon
N % N %
Fixed 7 16.7 46 61.3
Pinned 1 2.3 1 1.3
Mouth Bar Migration 3 7.1 6 8.0
Braid Belt Migration 20 47.6 5 6.7
Meander Neck Cut Off 9 21.4 12 16.0
Downstream Junction
Migration 2 4.8 5 6.7
Total 42 75
Table 2 – Proportion of confluence types within Ganges-Brahmaputra-Meghna and Amazon basins
Only ~17% of confluences in the GBM basin are
fixed and these are restricted to five confluences in
the Meghna basin and two confluences in the
southwest of the GBM basin with dam construction
in the upstream tributaries. The dammed tributaries
are likely to have experienced a substantial
reduction in both total annual discharge and
sediment yield (Syvitski et al., 2005), that is
reasoned to reduce the rate of morphological
change at the junctions, and may have contributed
to fixing the planform morphology. The
preponderance of fixed confluences in the Meghna
basin could be due to its low sediment yields
compared to the Ganges-Brahmaputra, with the
Meghna contributing ~12% of the GBM water
discharge but just ~2% of its sediment load
(Milliman and Farnsworth, 2013). Although the
Meghna River drains the tectonically active uplands
of the Shillong Massif crustal block and the Tertiary
mud- and sand- stones of the Indo-Burman foldbelt
(Mukherjee et al., 2009), most sediment yield is
extracted within the subsiding Sylhet Basin
upstream of the confluence (Goodbred et al., 2003)
In contrast to the GBM basin, in the Amazon Basin
61% of junctions are fixed confluences (Figure 16),
which show a strong correlation between
confluence type and broad physiographic setting
(see geological map inset, Figure 16). Ninety-two
percent of confluences that are fed from the Guiana
and Brazilian cratonic shield, as well as those within
the lower trough downstream of a structural high
(Purus Arch), are fixed. The confluences that are in
the upper part of the trough, upstream of the Purus
Arch, typically display a dynamic behaviour linked to
tributary meanders, whilst those rivers fed from the
Andes almost always exhibit dynamism associated
with braided channels or channel migration. The
sub-Andean foreland represents a transition from
dynamic confluences of a braided type to those of a
meandering nature. This pattern of confluence
mobility closely matches the rates of meander
migration in the Amazon basin reported by
Constantine et al. (2014), who found high rates of
bend migration and cut-off in the Andean-fed rivers,
lower migration rates in rivers draining the Guiana
and Brazilian shields and moderate rates for the
central trough.
26
There are currently 67 dams in operation in the
Amazon basin (International Rivers, 2015), largely in
the Andean and sub-Andean foreland zones.
Dammed headwaters would be expected to have
reduced sediment supply, although we cannot
identify any different confluence behaviour on the
short timescales of Landsat image coverage for pre-
and post- dam construction. Further detailed studies
of the effects of damming on confluence
morphodynamics would help identify any effects
and temporal lag in response.
Overall, the main channel of the lower Amazon
system has low sinuosity, and is entrenched and
confined to its valley over a scale of hundreds of
kilometres (Mertes et al., 1996; Mertes and Dunne,
2008). Here the combination of intracratonic
deformation and structural highs results in a
channel system that is relatively immobile (Mertes
and Dunne, 2008), with structural features such as
the Purus and Garupá arches (Figure 16 geological
inset) promoting entrenchment of the river and
restricting channel movement (Mertes et al., 1996).
Thus, as the morphodynamics of junctions are
inextricably linked in scale and process to the
morphodynamics of their confluent channels, the
junctions of the lower Amazon are also immobile.
It has been argued that deep confluences have a
high preservation potential in the rock record (e.g.
Huber and Huggenberger, 2015), and it thus logically
follows that deep and migratory confluences (i.e.
those that both create large amounts of
accommodation space that is then filled) will have
the greatest chance of being preserved. Based on
the evidence presented above, the World’s largest
river basin, the Amazon, with a high proportion of
fixed confluences over decadal timescales, may thus
leave very little in absolute areal extent in the
sedimentological record, particularly in comparison
to more morphodynamically active rivers. Although
to the present study only concerns confluences over
decadal timescales, the dominance of geological
controls on the morphodynamics of the Amazon-
Solimões suggests the entrenchment of rivers in the
lower basin is likely to lead to very low rates of
morphological change (Mertes et al., 1996; Mertes
and Dunne, 2008; Constantine et al., 2014) and thus
also fixed confluences over longer timescales.
6. Sedimentological implications of
confluence mobility
Identifying the type and scale of erosional surfaces
in the sedimentary record is important for
reconstructing palaeoenvironments and
palaeoenvironmental change (Bristow et al., 1993;
Miall and Jones, 2003). However, in order to have
confidence in such interpretations, it is essential to
discriminate between different scales of scour and
their driving autocyclic and/or allocyclic
mechanisms. The present analysis has
demonstrated that large river confluences may
display a range of behaviours from static to highly
mobile, and that confluences in areas of weak bank
material and high sediment supply will tend to be
more dynamic. The present analysis thus
demonstrates that for river catchments where such
conditions are prevalent (e.g. the Jamuna-Ganges),
the majority of confluences may be mobile and
create a significant driver for the creation of
accommodation space and its subsequent fill. This
observation, that mobile confluences may represent
the norm over large areas of some large
catchments, has three important implications
interpretation of the sedimentological record.
27
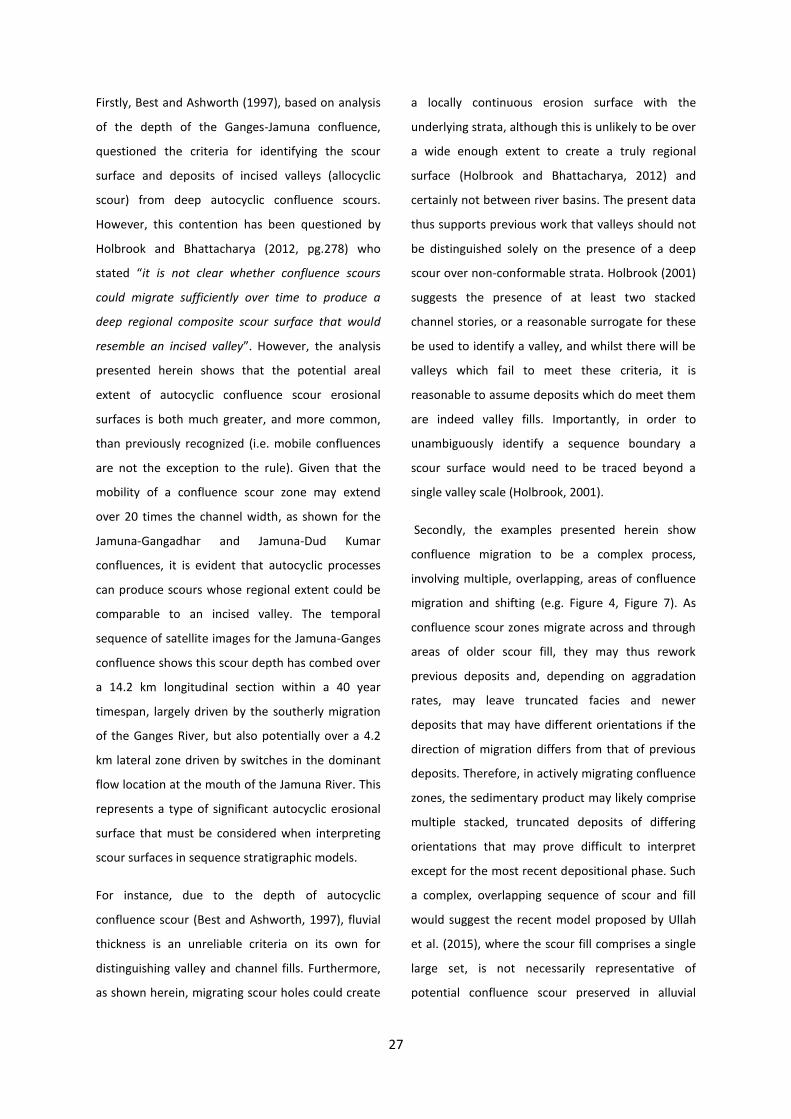
Firstly, Best and Ashworth (1997), based on analysis
of the depth of the Ganges-Jamuna confluence,
questioned the criteria for identifying the scour
surface and deposits of incised valleys (allocyclic
scour) from deep autocyclic confluence scours.
However, this contention has been questioned by
Holbrook and Bhattacharya (2012, pg.278) who
stated “it is not clear whether confluence scours
could migrate sufficiently over time to produce a
deep regional composite scour surface that would
resemble an incised valley”. However, the analysis
presented herein shows that the potential areal
extent of autocyclic confluence scour erosional
surfaces is both much greater, and more common,
than previously recognized (i.e. mobile confluences
are not the exception to the rule). Given that the
mobility of a confluence scour zone may extend
over 20 times the channel width, as shown for the
Jamuna-Gangadhar and Jamuna-Dud Kumar
confluences, it is evident that autocyclic processes
can produce scours whose regional extent could be
comparable to an incised valley. The temporal
sequence of satellite images for the Jamuna-Ganges
confluence shows this scour depth has combed over
a 14.2 km longitudinal section within a 40 year
timespan, largely driven by the southerly migration
of the Ganges River, but also potentially over a 4.2
km lateral zone driven by switches in the dominant
flow location at the mouth of the Jamuna River. This
represents a type of significant autocyclic erosional
surface that must be considered when interpreting
scour surfaces in sequence stratigraphic models.
For instance, due to the depth of autocyclic
confluence scour (Best and Ashworth, 1997), fluvial
thickness is an unreliable criteria on its own for
distinguishing valley and channel fills. Furthermore,
as shown herein, migrating scour holes could create
a locally continuous erosion surface with the
underlying strata, although this is unlikely to be over
a wide enough extent to create a truly regional
surface (Holbrook and Bhattacharya, 2012) and
certainly not between river basins. The present data
thus supports previous work that valleys should not
be distinguished solely on the presence of a deep
scour over non-conformable strata. Holbrook (2001)
suggests the presence of at least two stacked
channel stories, or a reasonable surrogate for these
be used to identify a valley, and whilst there will be
valleys which fail to meet these criteria, it is
reasonable to assume deposits which do meet them
are indeed valley fills. Importantly, in order to
unambiguously identify a sequence boundary a
scour surface would need to be traced beyond a
single valley scale (Holbrook, 2001).
Secondly, the examples presented herein show
confluence migration to be a complex process,
involving multiple, overlapping, areas of confluence
migration and shifting (e.g. Figure 4, Figure 7). As
confluence scour zones migrate across and through
areas of older scour fill, they may thus rework
previous deposits and, depending on aggradation
rates, may leave truncated facies and newer
deposits that may have different orientations if the
direction of migration differs from that of previous
deposits. Therefore, in actively migrating confluence
zones, the sedimentary product may likely comprise
multiple stacked, truncated deposits of differing
orientations that may prove difficult to interpret
except for the most recent depositional phase. Such
a complex, overlapping sequence of scour and fill
would suggest the recent model proposed by Ullah
et al. (2015), where the scour fill comprises a single
large set, is not necessarily representative of
potential confluence scour preserved in alluvial
28
stratigraphy. The mobile confluences described
herein share a sedimentological character more in
common with the model proposed by Siegenthaler
and Huggenberger (1993), where multiple erosion
surfaces are viewed as a defining characteristic.
Lastly, the present data demonstrate that channel
avulsion can result in confluence positions that
change from one location to another, resulting in
potentially separate, unconnected scours, as
opposed to the migratory movement of confluence
position that results in a continuous scour surface.
Examples of the former include the Mississippi and
Arkansas river confluence, which moved ~ 5km (or 4
channel widths), and the Ganghara and Sarda River
confluence which moved ~ 23km (or more than 11
channel widths) due to upstream channel avulsions.
These examples were typically complete within 10
years, with abandoned channels appearing to infill
rapidly. Other larger-scale channel avulsions, such as
that of the Brahmaputra in the late 18th century
(Best et al., 2007), may also relocate the locations of
major river confluences by large distances, in this
case by approximately 125km.
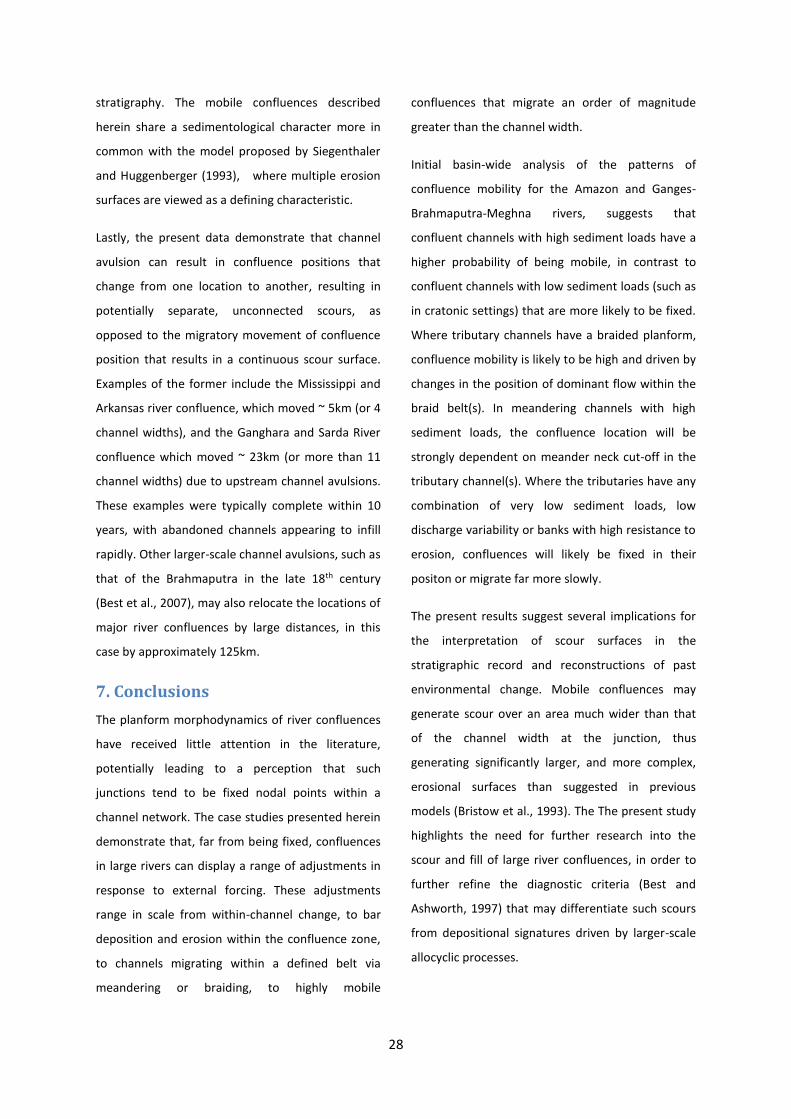
7. Conclusions
The planform morphodynamics of river confluences
have received little attention in the literature,
potentially leading to a perception that such
junctions tend to be fixed nodal points within a
channel network. The case studies presented herein
demonstrate that, far from being fixed, confluences
in large rivers can display a range of adjustments in
response to external forcing. These adjustments
range in scale from within-channel change, to bar
deposition and erosion within the confluence zone,
to channels migrating within a defined belt via
meandering or braiding, to highly mobile
confluences that migrate an order of magnitude
greater than the channel width.
Initial basin-wide analysis of the patterns of
confluence mobility for the Amazon and Ganges-
Brahmaputra-Meghna rivers, suggests that
confluent channels with high sediment loads have a
higher probability of being mobile, in contrast to
confluent channels with low sediment loads (such as
in cratonic settings) that are more likely to be fixed.
Where tributary channels have a braided planform,
confluence mobility is likely to be high and driven by
changes in the position of dominant flow within the
braid belt(s). In meandering channels with high
sediment loads, the confluence location will be
strongly dependent on meander neck cut-off in the
tributary channel(s). Where the tributaries have any
combination of very low sediment loads, low
discharge variability or banks with high resistance to
erosion, confluences will likely be fixed in their
positon or migrate far more slowly.
The present results suggest several implications for
the interpretation of scour surfaces in the
stratigraphic record and reconstructions of past
environmental change. Mobile confluences may
generate scour over an area much wider than that
of the channel width at the junction, thus
generating significantly larger, and more complex,
erosional surfaces than suggested in previous
models (Bristow et al., 1993). The The present study
highlights the need for further research into the
scour and fill of large river confluences, in order to
further refine the diagnostic criteria (Best and
Ashworth, 1997) that may differentiate such scours
from depositional signatures driven by larger-scale
allocyclic processes.
29
Acknowledgements This work was funded by NERC grant NE/I023228/1
to Sambrook Smith, Bull, Nicholas and Best.
Allen, P.M., Hobbs, R., Maier, N.D., 1989. Downstream impacts of a dam on a bedrock fluvial system, Brazos River, Central Texas. Bulletin of the Association of Engineering Geologists, 26(2), 165-189.
Ardies, G.W., Dalrymple, R.W., Zaitlin, B.A., 2002. Controls on the geometry of incised valleys in the Basal Quartz unit (Lower Cretaceous), Western Canada Sedimentary Basin. Journal of Sedimentary Research, 72(5), 602-618.
Are, F.E., 1983. Thermal abrasion of coasts, Proceedings of the Fourth International Conference on Permafrost. National Academy Press, Fairbanks, Alaska, pp. 24-28.
Arthington, A.H., Pusey, B.J., 2003. Flow restoration and protection in Australian rivers. River research and applications, 19(5‐6), 377-395.
Ashmore, P.E., 1991. How do gravel-bed rivers braid? Canadian Journal of Earth Sciences, 28(3), 326-341.
Ashmore, P.E., Gardner, J.T., 2008. Unconfined confluences in braided rivers. In: S.P. Rice, A.G. Roy, B.L. Rhoads (Eds.), River Confluences, Tributaries and the Fluvial Network. John Wiley & Sons, Chichester, pp. 119-147.
Ashworth, P.J., Best, J.L., Roden, J.E., Bristow, C.S., Klaassen, G.J., 2000. Morphological evolution and dynamics of a large, sand braid‐bar, Jamuna River, Bangladesh. Sedimentology, 47(3), 533-555.
Ashworth, P.J., Lewin, J., 2012. How do big rivers come to be different? Earth-Science Reviews, 114(1), 84-107.
Benda, L.E., Andras, K., Miller, D., Bigelow, P., 2004. Confluence effects in rivers: interactions of basin scale, network geometry, and disturbance regimes. Water Resources Research, 40(5).
Best, J.L., 1986. The morphology of river channel confluences. Progress in Physical Geography, 10(2), 157-174.
Best, J.L., 1987. Flow dynamics at river channel confluences: implications for sediment transport and bed morphology. In: F.G. Ethridge, R.M. Flores, M.D. Harvey (Eds.), Recent Developments in Fluvial Sedimentology. Special Publication 39. The Society of Economic Paleontologists and Mineralologists, Tulsa, OK, pp. 27-35.
Best, J.L., 1988. Sediment transport and bed morphology at river channel confluences. Sedimentology, 35(3), 481-498.
Best, J.L., Ashworth, P.J., 1997. Scour in large braided rivers and the recognition of sequence stratigraphic boundaries. Nature, 387(6630), 275-277.
Best, J.L., Ashworth, P.J., Sarker, M.H., Roden, J.E., 2008. The Brahmaputra-Jamuna River, Bangladesh. In: A. Gupta (Ed.), Large Rivers. John Wiley and Sons, Chichester, West Sussex, UK, pp. 395-433.
Best, J.L., Rhoads, B., 2008. Sediment transport, bed morphology and the sedimentology of river channel confluences. In: S.P. Rice, A.G. Roy, B. Rhoads (Eds.), River confluences, Tributaries and the Fluvial Network. John Wiley & Sons, Chichester, pp. 45-72.
Best, J.L., Roy, A.G., 1991. Mixing-layer distortion at the confluence of channels of different depth. Nature, 350, 411-413.
Biron, P., Roy, A.G., Best, J.L., Boyer, C.J., 1993. Bed morphology and sedimentology at the confluence of unequal depth channels. Geomorphology, 8(2), 115-129.
Biron, P.M., Lane, S.N., 2008. Modelling hydraulics and sediment transport at river confluences. In: S.P. Rice, A.G.
30
Roy, B.L. Rhoads (Eds.), River Confluences, Tributaries and the Fluvial Network. John Wiley & Sons, Chichester, pp. 17-43.
Biron, P.M., Richer, A., Kirkbride, A.D., Roy, A.G., Han, S., 2002. Spatial patterns of water surface topography at a river confluence. Earth Surface Processes and Landforms, 27(9), 913-928.
Boyer, C., Roy, A.G., Best, J.L., 2006. Dynamics of a river channel confluence with discordant beds: Flow turbulence, bed load sediment transport, and bed morphology. Journal of Geophysical Research: Earth Surface (2003–2012), 111(F4).
Bridge, J.S., 1993. The interaction between channel geometry, water flow, sediment transport and deposition in braided rivers. In: J.L. Best, C.S. Bristow (Eds.), Braided Rivers. Special Publication 75. Geological Society Publishing House, Bath, pp. 13-71.
Bristow, C.S., Best, J.L., Roy, A.G., 1993. Morphology and facies models of channel confluences. In: M. Marzo, C. Puigdefabregas (Eds.), Alluvial Sedimentation. Special Publications of the International Association of Sedimentology. Blackwell, Malden, MA, pp. 89-100.
Constantine, J.A., Dunne, T., Ahmed, J., Legleiter, C., Lazarus, E.D., 2014. Sediment supply as a driver of river meandering and floodplain evolution in the Amazon Basin. Nature Geoscience, 7(12), 899-903.
Costard, F., Gautier, E., 2007. The Lena River: hydromorphodynamic features in a deep permafrost zone. In: A. Gupta (Ed.), Large Rivers: Geomorphology and Management. John Wiley & Sons, Chichester, West Sussex, UK, pp. 225-233.
Costard, F., Gautier, E., Brunstein, D., Hammadi, J., Fedorov, A., Yang, D., Dupeyrat, L., 2007. Impact of the global warming on the fluvial thermal erosion over the Lena River in Central Siberia. Geophysical Research Letters, 34(14), L14501.
Costard, F., Gautier, E., Fedorov, A., Konstantinov, P., Dupeyrat, L., 2014. An Assessment of the Erosion Potential of the Fluvial Thermal Process during Ice Breakups of the Lena River (Siberia). Permafrost and Periglacial Processes, 25(3), 162-171.
Datta, D.K., Subramanian, V., 1997. Texture and mineralogy of sediments from the Ganges-Brahmaputra-Meghna river system in the Bengal Basin, Bangladesh and their environmental implications. Environmental Geology, 30(3-4), 181-188.
Davies, N.S., Gibling, M.R., 2011. Evolution of fixed-channel alluvial plains in response to Carboniferous vegetation. Nature Geoscience, 4(9), 629-633.
De Serres, B., Roy, A.G., Biron, P.M., Best, J.L., 1999. Three-dimensional structure of flow at a confluence of river channels with discordant beds. Geomorphology, 26(4), 313-335.
Ettema, R., 2008. Management of confluences. In: S.P. Rice, A.G. Roy, B.L. Rhoads (Eds.), River Confluences, Tributaries and the Fluvial Network. John Wiley & Sons, Chichester, pp. 93-118.
Fielding, C.R., 2008. Sedimentology and stratigraphy of large river deposits: recognition in the ancient record, and distinction from “incised valley fills”. In: A. Gupta (Ed.), Large Rivers: Geomorphology and Management, . John Wiley & Sons, Chichester, West Sussex, UK, pp. 97-113.
Fitzsimmons, K.E., Cohen, T.J., Hesse, P.P., Jansen, J., Nanson, G.C., May, J.-H., Barrows, T.T., Haberlah, D., Hilgers, A., Kelly, T., Larsen, J., Lomax, J., Treble, P., 2013. Late Quaternary palaeoenvironmental change in the Australian drylands. Quaternary Science Reviews, 74(0), 78-96.
Gilvear, D.J., 2004. Patterns of channel adjustment to impoundment of the upper River Spey, Scotland (1942–2000). River Research and Applications, 20(2), 151-165.
Goodbred, S.L., Kuehl, S.A., 1999. Holocene and modern sediment budgets for the
31
Ganges-Brahmaputra river system: Evidence for highstand dispersal to flood-plain, shelf, and deep-sea depocenters. Geology, 27(6), 559-562.
Goodbred, S.L., Kuehl, S.A., Steckler, M.S., Sarker, M.H., 2003. Controls on facies distribution and stratigraphic preservation in the Ganges–Brahmaputra delta sequence. Sedimentary Geology, 155(3), 301-316.
Goward, S., Arvidson, T., Williams, D.l., Faundeen, J., Irons, J., Franks, S., 2006. Historical Record of Landsat Global Coverage. Photogrammetric Engineering & Remote Sensing, 72(10), 1155-1169.
Graf, W.L., 1980. The effect of dam closure on downstream rapids. Water Resources Research, 16(1), 129-136.
Grant, G.E., Schmidt, J.C., Lewis, S.L., 2003. A geological framework for interpreting downstream effects of dams on rivers. Water Science and Application, 7, 209-225.
Gupta, A., 2008. Introduction. In: A. Gupta (Ed.), Large Rivers: Geomorphology and Management. John Wiley & Sons, Chicester, pp. 1-5.
Hackney, C.R., Carling, P.A., 2011. The occurrence of obtuse junction angles and changes in channel width below tributaries along the Mekong River, south‐east Asia. Earth Surface Processes and Landforms, 36(12), 1563-1576.
Holbrook, J., 2001. Origin, genetic interrelationships, and stratigraphy over the continuum of fluvial channel-form bounding surfaces: an illustration from middle Cretaceous strata, southeastern Colorado. Sedimentary Geology, 144(3), 179-222.
Holbrook, J.M., Bhattacharya, J.P., 2012. Reappraisal of the sequence boundary in time and space: Case and considerations for an SU (subaerial unconformity) that is not a sediment bypass surface, a time barrier, or an unconformity. Earth-Science Reviews, 113(3), 271-302.
Huber, E., Huggenberger, P., 2015. Morphological perspective on the sedimentary characteristics of a coarse, braided reach: Tagliamento River (NE Italy). Geomorphology, 248, 111-124.
Hudson, P.F., Kesel, R.H., 2000. Channel migration and meander-bend curvature in the lower Mississippi River prior to major human modification. Geology, 28(6), 531-534.
International Rivers, 2015. Dams in Amazonia. International Rivers, Fundación Proteger, ECOA.
Kenworthy, S.T., Rhoads, B.L., 1995. Hydrologic control of spatial patterns of suspended sediment concentration at a stream confluence. Journal of Hydrology, 168(1), 251-263.
Knox, J.C., 2008. The Mississippi River System. In: A. Gupta (Ed.), Large Rivers: Geomorphology and Management. John Wiley & Sons, Ltd. West Sussex, England. John Wiley & Sons, Chichester, West Sussex, UK, pp. 145-182.
Lane, S.N., Parsons, D.R., Best, J.L., Orfeo, O., Kostaschuk, R.A., Hardy, R.J., 2008. Causes of rapid mixing at a junction of two large rivers: Río Paraná and Río Paraguay, Argentina. Journal of Geophysical Research: Earth Surface (2003–2012), 113(F2).
Latrubesse, E.M., 2008. Patterns of anabranching channels: The ultimate end-member adjustment of mega rivers. Geomorphology, 101(1), 130-145.
Leite Ribeiro, M., Blanckaert, K., Roy, A.G., Schleiss, A.J., 2012. Flow and sediment dynamics in channel confluences. Journal of Geophysical Research: Earth Surface (2003–2012), 117(F1).
Lewin, J., Ashworth, P.J., 2014a. Defining large river channel patterns: Alluvial exchange and plurality. Geomorphology, 215, 83-98.
Lewin, J., Ashworth, P.J., 2014b. The negative relief of large river floodplains. Earth-Science Reviews, 129, 1-23.
Maheshwari, B.L., Walker, K.F., McMahon, T.A., 1995. Effects of regulation on the flow
32
regime of the River Murray, Australia. Regulated Rivers: Research & Management, 10(1), 15-38.
McLelland, S.J., Ashworth, P.J., Best, J.L., Roden, J.E., Klaassen, G.J., 1999. Flow structure and transport of sand-grade suspended sediment around an evolving braid bar, Jamuna River, Bangladesh. In: N.D. Smith, J. Rogers (Eds.), Fluvial Sedimentology 6. Special Publication of the International Association of Sedimentologists, pp. 43-57.
Mertes, L.A.K., Dunne, T., 2008. Effects of tectonism, climate change, and sea-level change on the form and behaviour of the modern Amazon River and its floodplain. In: A. Gupta (Ed.), Large Rivers: Geomorphology and Management. John Wiley and Sons, Chichester, West Sussex, UK, pp. 115-144.
Mertes, L.A.K., Dunne, T., Martinelli, L.A., 1996. Channel-floodplain geomorphology along the Solimões-Amazon river, Brazil. Geological Society of America Bulletin, 108(9), 1089-1107.
Miall, A.D., 2006. Reconstructing the architecture and sequence stratigraphy of the preserved fluvial record as a tool for reservoir development: A reality check. AAPG bulletin, 90(7), 989-1002.
Miall, A.D., Jones, B.G., 2003. Fluvial architecture of the Hawkesbury sandstone (Triassic), near Sydney, Australia. Journal of Sedimentary Research, 73(4), 531-545.
Milliman, J.D., Farnsworth, K.L., 2013. River discharge to the coastal ocean: a global synthesis. Cambridge University Press, Cambridge, UK.
Mosley, M.P., 1976. An experimental study of channel confluences. The Journal of Geology, 84, 535-562.
Mount, N.J., Tate, N.J., Sarker, M.H., Thorne, C.R., 2013. Evolutionary, multi-scale analysis of river bank line retreat using continuous wavelet transforms: Jamuna River, Bangladesh. Geomorphology, 183, 82-95.
Mukherjee, A., Fryar, A.E., Thomas, W.A., 2009. Geologic, geomorphic and hydrologic framework and evolution of the Bengal basin, India and Bangladesh. Journal of Asian Earth Sciences, 34(3), 227-244.
Nanson, G.C., Price, D.M., Jones, B.G., Maroulis, J.C., Coleman, M., Bowman, H., Cohen, T.J., Pietsch, T.J., Larsen, J.R., 2008. Alluvial evidence for major climate and flow regime changes during the middle and late Quaternary in eastern central Australia. Geomorphology, 101(1), 109-129.
Nordin, C.F., Perez-Hernandez, D., 1989. Sand waves, bars, and wind-blown sands of the Rio Orinoco, Venezuela and Colombia, US Geological Survey, Denver, Colorado.
Page, K.J., Nanson, G.C., Price, D., 1996. Chronology of Murrumbidgee river palaeochannels on the Riverine Plain, southeastern Australia. Journal of Quaternary Science, 11(4), 311-326.
Parsons, D.R., Best, J.L., Lane, S.N., Kostaschuk, R.A., Hardy, R.J., Orfeo, O., Amsler, M.L., Szupiany, R.N., 2008. Large river channel confluences. In: S.P. Rice, A.G. Roy, B.L. Rhoads (Eds.), River confluences, tributaries and the fluvial network. John Wiley & Sons, Chichester, pp. 73-91.
Parsons, D.R., Best, J.L., Lane, S.N., Orfeo, O., Hardy, R.J., Kostaschuk, R., 2007. Form roughness and the absence of secondary flow in a large confluence–diffluence, Rio Paraná, Argentina. Earth Surface Processes and Landforms, 32(1), 155-162.
Parsons, D.R., Best, J.L., Orfeo, O., Hardy, R.J., Kostaschuk, R., Lane, S.N., 2005. Morphology and flow fields of three‐dimensional dunes, Rio Paraná, Argentina: Results from simultaneous multibeam echo sounding and acoustic Doppler current profiling. Journal of Geophysical Research, 110(F4).
Petts, G.E., 1984. Sedimentation within a regulated river. Earth Surface Processes and Landforms, 9(2), 125-134.
Petts, G.E., Gurnell, A.M., 2005. Dams and geomorphology: Research progress and
33
future directions. Geomorphology, 71(1–2), 27-47.
Phillips, J.D., Slattery, M.C., Musselman, Z.A., 2005. Channel adjustments of the lower Trinity River, Texas, downstream of Livingston Dam. Earth Surface Processes and Landforms, 30(11), 1419-1439.
Pickering, J.L., Goodbred Jr, S.L., Reitz, M.D., Hartzog, T.R., Mondal, D.R., Hossain, M.S., 2014. Late Quaternary sedimentary record and Holocene channel avulsions of the Jamuna and Old Brahmaputra River valleys in the upper Bengal delta plain. Geomorphology, 227(0), 123-136.
Reitz, M.D., Pickering, J.L., Goodbred, S.L., Paola, C., Steckler, M.S., Seeber, L., Akhter, S.H., 2015. Effects of tectonic deformation and sea level on river path selection: theory and application to the Ganges-Brahmaputra-Meghna River Delta. Journal of Geophysical Research: Earth Surface, 2014JF003202.
Rhoads, B.L., 1996. Mean structure of transport-effective flows at an asymmetrical confluence when the main stream is dominant. In: P.J. Ashworth, S.J. Bennett, J.L. Best, S.J. McLelland (Eds.), Coherent Flow Structures in Open Channels. John Wiley and Sons, Chichester, pp. 491-517.
Rhoads, B.L., Kenworthy, S.T., 1995. Flow structure at an asymmetrical stream confluence. Geomorphology, 11(4), 273-293.
Rhoads, B.L., Kenworthy, S.T., 1998. Time-averaged flow structure in the central region of a stream confluence. Earth Surface Processes and Landforms, 23(2), 171-191.
Rhoads, B.L., Sukhodolov, A.N., 2001. Field investigation of three‐dimensional flow structure at stream confluences: 1. Thermal mixing and time‐averaged velocities. Water Resources Research, 37(9), 2393-2410.
Rhoads, B.L., Sukhodolov, A.N., 2004. Spatial and temporal structure of shear layer
turbulence at a stream confluence. Water Resources Research, 40(6).
Rice, S.P., Kiffney, P., Greene, C., Pess, G.R., 2008. The ecological importance of tributaries and confluences. In: S.P. Rice, A.G. Roy, B.L. Rhoads (Eds.), River Confluences, Tributaries and the Fluvial Network. John Wiley & Sons, Chichester, pp. 209-242.
Richards, K.S., 1980. A note on changes in channel geometry at tributary junctions. Water Resources Research, 16(1), 241-244.
Richardson, W.R., Thorne, C.R., 2001. Multiple thread flow and channel bifurcation in a braided river: Brahmaputra–Jamuna River, Bangladesh. Geomorphology, 38(3), 185-196.
Riley, J.D., 2013. The Fluvial Dynamics of Confluent Meander Bends. Ph.D., University of Illinois at Urbana-Champaign, Urbana-Champaign, 156 pp.
Rittenour, T.M., Blum, M.D., Goble, R.J., 2007. Fluvial evolution of the lower Mississippi River valley during the last 100 ky glacial cycle: Response to glaciation and sea-level change. Geological Society of America Bulletin, 119(5-6), 586-608.
Roy, A.G., Bergeron, N., 1990. Flow and particle paths at a natural river confluence with coarse bed material. Geomorphology, 3(2), 99-112.
Salter, T., 1993. Fluvial scour and incision: models for their influence on the development of realistic reservoir geometries. In: C.P. North, D.J. Prosser (Eds.), Characterization of Fluvial and Aoelian Reserviors, Geological Society Special Publications. Geological Society, London, pp. 33-51.
Sambrook Smith, G.H., Ashworth, P.J., Best, J.L., Lunt, I.A., Orfeo, O., Parsons, D.R., 2009. The sedimentology and alluvial architecture of a large braid bar, Rio Parana, Argentina. Journal of Sedimentary Research, 79(8), 629.
Sambrook Smith, G.H., Ashworth, P.J., Best, J.L., Woodward, J., Simpson, C.J., 2005. The morphology and facies of sandy
34
braided rivers: some considerations of scale invariance. Fluvial Sedimentology VII, 145-158.
Schumm, S.A., Rutherfurd, I.D., Brooks, J., 1994. Pre-cutoff morphology of the Lower Mississippi River. In: S.A. Schumm, B.R. Winkley (Eds.), The variability of large alluvial rivers. American Society of Civil Engineers, New York, US, pp. 13-44.
Shit, P.K., Maiti, R., 2013. Confluence Dynamics in an Ephemeral Gully Basin (A Case Study at Rangamari, Paschim Medinipur, West Bengal, India). Research Journal of Applied Sciences, Engineering and Technology, 15(5), 3895-3911.
Siegenthaler, C., Huggenberger, P., 1993. Pleistocene Rhine gravel: deposits of a braided river system with dominant pool preservation. In: J.L. Best, C.S. Bristow (Eds.), Braided Rivers. Geological Society Special Publications, London, pp. 147-162.
Sukhodolov, A.N., Rhoads, B.L., 2001. Field investigation of three‐dimensional flow structure at stream confluences: 2. Turbulence. Water Resources Research, 37(9), 2411-2424.
Syvitski, J.P.M., Vörösmarty, C.J., Kettner, A.J., Green, P., 2005. Impact of humans on the flux of terrestrial sediment to the global coastal ocean. Science, 308(5720), 376-380.
Trigg, M.A., Bates, P.D., Wilson, M.D., Schumann, G., Baugh, C., 2012. Floodplain channel morphology and networks of the middle Amazon River. Water Resources Research, 48(10).
Ullah, M.S., Bhattacharya, J.P., Dupre, W.R., 2015. Confluence Scours Versus Incised Valleys: Examples From the Cretaceous Ferron Notom Delta, Southeastern Utah, USA. Journal of Sedimentary Research, 85(5), 445-458.
Zhang, Y., Wang, P., Wu, B., Hou, S., 2015. An experimental study of fluvial processes at asymmetrical river confluences with hyperconcentrated tributary flows. Geomorphology, 230, 26-36.