Embed Size (px)
Citation preview
3
……………………………………………………………………………………………………………
ForewordMEASURING STUDENT KNOWLEDGE AND SKILLS
The PISA 2000 Assessment of Reading, Mathematicaland Scientific Literacy
Foreword
How well are young adults prepared to meet the challenges of the future? Are they able to
analyse, reason and communicate their ideas effectively? Do they have the capacity to continue
learning throughout life? Parents, students, the public and those who run education systems
need to know the answers to these questions.
Many education systems monitor student learning to provide some answers to these questions.
Comparative international analyses can extend and enrich the national picture by providing a
larger context within which to interpret national results. They can provide direction for schools’
instructional efforts and for students’ learning as well as insights into curriculum strengths and
weaknesses. Coupled with appropriate incentives, they can motivate students to learn better,
teachers to teach better and schools to be more effective. They also provide tools to allow central
authorities to monitor achievement levels even when administration is devolved and schools are
run in partnership with communities.
For these reasons, governments and the general public need solid and internationally
comparable evidence on educational outcomes. In response to this demand, the OECD has launched
the Programme for International Student Assessment (PISA). PISA represents a new commitment
by the governments of OECD countries to monitor the outcomes of education systems in terms of
student achievement on a regular basis and within a common framework that is internationally
agreed. PISA aims at providing a new basis for policy dialogue and for collaboration in defining
and operationalising educational goals – in innovative ways that reflect judgements about the
skills that are relevant to adult life. It provides inputs for standard-setting and evaluation; insights
into the mix of factors which contribute to the development of competencies, and how these
factors operate similarly or differently among countries; and a better understanding of the causes
and consequences of observed skill gaps. In supporting a shift in policy focus from the inputs used
in education systems and institutions to learning outcomes, PISA can assist countries in seeking to
……………………………………………………………………………………………………………
4
Foreword
bring about improvements in schooling and better preparation for young people as they enter an
adult life of rapid change and deepening global interdependence.
PISA is a collaborative effort, bringing together scientific expertise from the participating countries,
steered jointly by their governments on the basis of shared, policy-driven interests. Participating countries
take responsibility for the project at the policy level. Experts from participating countries also serve on
working groups that are charged with linking the PISA policy objectives with the best available
substantive and technical expertise in the field of international comparative assessment of educational
outcomes. Through participating in these expert groups, countries ensure that the PISA assessment
instruments are internationally valid and take into account the cultural and curricular contexts of
OECD Member countries; have strong measurement properties; and place an emphasis on authenticity
and educational validity. The frameworks and assessment instruments for PISA 2000 are the product
of a multi-year development process and were adopted in December 1999 by OECD governments,
through the Board of Participating Countries which manages the PISA project.
The PISA 2000 Assessment of Reading, Mathematical and Scientific Literacy is the second volume
in the PISA series Measuring Student Knowledge and Skills. It introduces the PISA approach to
comparative assessment and describes the PISA 2000 assessment instruments in terms of the
content that students need to acquire, the processes that need to be performed, and the contexts
in which knowledge and skills are applied. Each of the assessment domains is illustrated with a
range of sample items. It is published on the responsibility of the Secretary-General of the OECD.
Acknowledgements
This publication was prepared by the Statistics and Indicators Division of the OECD Directorate for
Education, Employment, Labour and Social Affairs, principally Andreas Schleicher and Claudia Tamassia. The
sample assessment materials presented in this publication were developed by international expert panels
and the test developers of the PISA consortium under the direction of Raymond Adams from the Australian
Council of Educational Research. The reading expert panel was chaired by Dr. Irwin Kirsch of the Education
Testing Service in the United States, the mathematics expert panel was chaired by Professor Jan de Lange
from the University of Utrecht, and the science expert panel was chaired by Professor Wynne Harlen from
the Scottish Council for Research in Education. Dr. Geoff Masters from the Australian Council for Educational
Research prepared the review of the PISA literacy concept in the publication. The members of the expert
panels and the PISA test developers are listed in the appendices.
……………………………………………………………………………………………………………
Table
of
Contents
5
TABLE OF CONTENTS
7 INTRODUCTION
7 The Programme for International Student Assessment9 The choice of assessment domains9 Beyond content
11 Three dimensions of literacy13 Knowledge and understanding15 Context of application16 PISA: a work in progress
18 CHAPTER 1: ASSESSING READING LITERACY IN PISA18 The PISA definition of reading literacy and its context18 Three dimensions of reading literacy
18 Reading tasks20 Types of text22 Purposes of text
23 Format of test questions23 Marking23 Sample questions
Reading units:24 UNIT 1 – BEES27 UNIT 2 – IN POOR TASTE29 UNIT 3 – A JUST JUDGE36 UNIT 4 – BULLYING39 UNIT 5 – MORELAND40 UNIT 6 – WARRANTY
42 Scoring scheme for the reading sample questions
50 CHAPTER 2: ASSESSING MATHEMATICAL LITERACY IN PISA50 The PISA definition of mathematical literacy and its context50 Three dimensions of mathematical literacy
50 Mathematical processes52 Mathematical content: strands and “big ideas”54 Situations and contexts
54 Format of test questions and marking55 Sample questions
Mathematics units:56 UNIT 1 – PIZZAS57 UNIT 2 – COINS58 UNIT 3 – LICHEN61 UNIT 4 – SHAPES64 UNIT 5 – BRAKING67 UNIT 6 – PATIO68 UNIT 7 – SEALS SLEEP
70 Scoring scheme for the mathematics sample questions
……………………………………………………………………………………………………………
6
Table
of
Contents
76 CHAPTER 3: ASSESSING SCIENTIFIC LITERACY IN PISA
76 The PISA definition of scientific literacy and its context76 Three dimensions of scientific literacy
76 Scientific processes78 Scientific concepts78 Situations and areas of application
78 Format of test questions79 Marking79 Sample questions
Science units:80 UNIT 1 – BUSES82 UNIT 2 – FLIES85 UNIT 3 – BIODIVERSITY87 UNIT 4 – CLIMATE CHANGE90 UNIT 5 – CHOCOLATE92 UNIT 6 – CALF CLONING
94 Scoring scheme for the science sample questions
97 REFERENCES
103 Appendix 1 – Functional Expert Group Membership
104 Appendix 2 – Test Development Team
7
……………………………………………………………………………………………………………
Introduction
Introduction
The Programme for International Student Assessment
The OECD’s Programme for International Student Assessment (PISA) is a new, regular survey of
15-year-olds which assesses aspects of their preparedness for adult life. The first round of the
survey is taking place in 32 countries during 2000, in collaboration between governments and
the OECD. Between 4 500 and 10 000 students will be surveyed in each country.
This publication explains the conceptual framework on which the PISA 2000 assessment is based
in terms of the content that students need to acquire, the processes that need to be performed, and
the contexts in which knowledge and skills are applied. It also illustrates how the assessment is to be
performed by reproducing sample assessment items and explaining what each is measuring.
PISA bases its assessment of student outcomes on three domains of “literacy” – reading literacy,
mathematical literacy and scientific literacy. In each case, international experts from OECD Member
countries have agreed on definitions of literacy and a framework for assessing it, using a common
set of principles (OECD, 1999).
The PISA concept of literacy is much wider than the historical notion of the ability to read and write.
Common usage now accepts that a literate person has a range of competencies. Moreover, it has come
to be accepted that there is no single cut-off point between a person who is fully literate and one who
is illiterate. Literacy is measured on a continuum, not as something that one either does or does not
have. In PISA, literacy is regarded as knowledge and skills for adult life. Its acquisition is a lifelong process
– taking place not just at school or through formal learning, but also through interaction with peers,
colleagues and wider communities. Fifteen-year-olds cannot be expected to have learned in school
everything that they will need to know as adults. They need a solid foundation of knowledge in areas
such as reading, mathematics and science. However, in order to go on learning in these domains and
to apply their learning to the real world, they need to understand some basic processes and principles,
and have the flexibility to use them in different situations. The three PISA domains of literacy therefore
emphasise the ability to undertake a number of fundamental processes in a range of situations, backed
by a broad understanding of key concepts, rather than the possession of specific knowledge.
The countries participating in the first OECD/PISA survey cycle are: Australia, Austria, Belgium,
Brazil, Canada, China, the Czech Republic, Denmark, Finland, France, Germany, Greece, Hungary,
Iceland, Ireland, Italy, Japan, Korea, Latvia, Luxembourg, Mexico, the Netherlands, New Zealand,
Norway, Poland, Portugal, the Russian Federation, Spain, Sweden, Switzerland, the United Kingdom
and the United States.
……………………………………………………………………………………………………………
8
Introduction
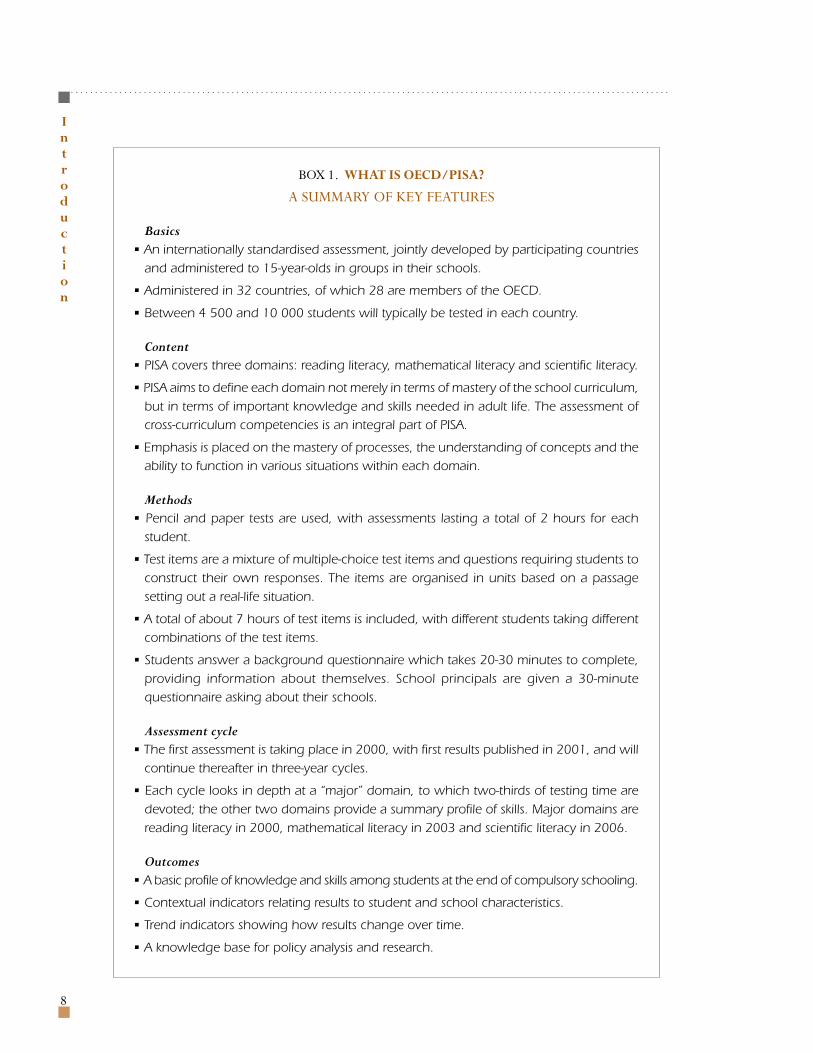
BOX 1. WHAT IS OECD/PISA?
A SUMMARY OF KEY FEATURES
Basics• An internationally standardised assessment, jointly developed by participating countries
and administered to 15-year-olds in groups in their schools.
• Administered in 32 countries, of which 28 are members of the OECD.
• Between 4 500 and 10 000 students will typically be tested in each country.
Content• PISA covers three domains: reading literacy, mathematical literacy and scientific literacy.
• PISA aims to define each domain not merely in terms of mastery of the school curriculum,but in terms of important knowledge and skills needed in adult life. The assessment ofcross-curriculum competencies is an integral part of PISA.
• Emphasis is placed on the mastery of processes, the understanding of concepts and theability to function in various situations within each domain.
Methods• Pencil and paper tests are used, with assessments lasting a total of 2 hours for each
student.
• Test items are a mixture of multiple-choice test items and questions requiring students toconstruct their own responses. The items are organised in units based on a passagesetting out a real-life situation.
• A total of about 7 hours of test items is included, with different students taking differentcombinations of the test items.
• Students answer a background questionnaire which takes 20-30 minutes to complete,providing information about themselves. School principals are given a 30-minutequestionnaire asking about their schools.
Assessment cycle• The first assessment is taking place in 2000, with first results published in 2001, and will
continue thereafter in three-year cycles.
• Each cycle looks in depth at a “major” domain, to which two-thirds of testing time aredevoted; the other two domains provide a summary profile of skills. Major domains arereading literacy in 2000, mathematical literacy in 2003 and scientific literacy in 2006.
Outcomes• A basic profile of knowledge and skills among students at the end of compulsory schooling.
• Contextual indicators relating results to student and school characteristics.
• Trend indicators showing how results change over time.
• A knowledge base for policy analysis and research.
9
……………………………………………………………………………………………………………
Introduction
The choice of assessment domains
It has long been accepted that an important objective of schooling is the development of a
“literate” adult population. Historically, this objective has been synonymous with ensuring that all
adults in a society are able to read and write. Literacy – defined as the ability to read and write –
has been seen as essential to personal fulfilment; full adult participation in social, cultural and
political life; personal empowerment; and success in securing and maintaining employment.
The notion that schools have a responsibility to create a future society in which all adults are
also mathematically “literate”, scientifically “literate”, and technologically “literate” is a relatively
recent idea. For much of the past century, the content of school mathematics and science curricula
was dominated by the need to provide foundations for the professional training of mathematicians,
scientists and engineers.
But with the increasing role of science, mathematics and technology in modern life, the objectives
of personal fulfilment, employment, and full participation in society increasingly require an adult
population which is not only able to read and write, but also mathematically, scientifically and
technologically literate. In the words of one commentator, “because of its pervasive role in modern
society, science is far too important to be left to the scientists only” (Zen, 1992, p. 20).
The imperatives in modern society to develop a citizenry which is mathematically, scientifically
and technologically “literate” are very similar to past arguments for achieving basic levels of adult
reading and writing competence: “A shared scientific background is part of a common cultural
base that binds civilised people together” (Zen, 1992); “Individuals who are deprived of the capacity
to make informed choices are rendered more vulnerable in matters of health and environment,
and are impaired in their ability to cope with an increasingly technological world” (Galbraith et al.,
1997); and basic mathematical and scientific literacy “renders individuals less dependent on others,
so that democratic processes, social values, and individual opportunities do not come to be
dominated by knowledgeable élites” (Krugly-Smolska, 1990).
Beyond content
A key feature of the broadened definition of “literacy” in PISA is a more explicit focus on the
knowledge, understanding and skills required for effective functioning in everyday life.
Literacy for effective participation in modern society requires mastery of a body of basic
knowledge and skills. For example, reading literacy depends on the ability to decode text, to
interpret meanings of words and grammatical structures, and to construct meaning at least at a
superficial level. But reading literacy for effective participation in modern society requires much
more than this: it also depends on the ability to read between the lines and to reflect on the
purposes and intended audiences of texts, to recognise devices used by writers to convey messages
and influence readers, and the ability to interpret meaning from the structures and features of
texts. Reading literacy depends on an ability to understand and interpret a wide variety of text
types, and to make sense of texts by relating them to the contexts in which they appear.
……………………………………………………………………………………………………………
10
Introduction
Mathematical literacy similarly depends on familiarity with a body of mathematical knowledge
and skills which includes: basic number facts and operations; working with money; fundamental
ideas about space and shape, including working with measurements; and notions of uncertainty,
growth and change. But mathematical literacy for effective functioning in modern society requires
much more than this: it also depends on the ability to think and work mathematically, including
modelling and problem solving. These competencies include knowing the extent and limits of
mathematical concepts; following and evaluating mathematical arguments; posing mathematical
problems; choosing ways of representing mathematical situations; and expressing oneself on matters
with a mathematical content. Mathematical literacy depends on an ability to apply this knowledge,
this understanding and these skills in a wide variety of personal, social and work contexts.
Scientific literacy also depends on familiarity with a body of scientific knowledge and skills. This
body of knowledge includes an understanding of fundamental scientific concepts such as food
chains, sustainability, energy conservation, photosynthesis, rates of reaction, adaptation, states of
matter, and inheritance. But scientific literacy for effective functioning in modern society requires
much more than this: it also depends on the ability to use processes of scientific enquiry such as
recognising the nature and limits of such enquiry; identifying evidence required to answer scientific
questions; and drawing, evaluating and communicating conclusions. Scientific literacy depends on
an ability to apply this knowledge, this understanding and these skills in a wide variety of personal,
social, and work contexts.
OECD/PISA adopts definitions of reading literacy, mathematical literacy and scientific literacy
that go beyond mastery of essential knowledge and skills (Box 2). In all three domains, the focus
is not primarily on the mastery of specific curriculum content, but on the ability to reflect on and
use reading, mathematical and scientific knowledge, understanding and skills to achieve personal
goals and to participate effectively in society (OECD, 1999).
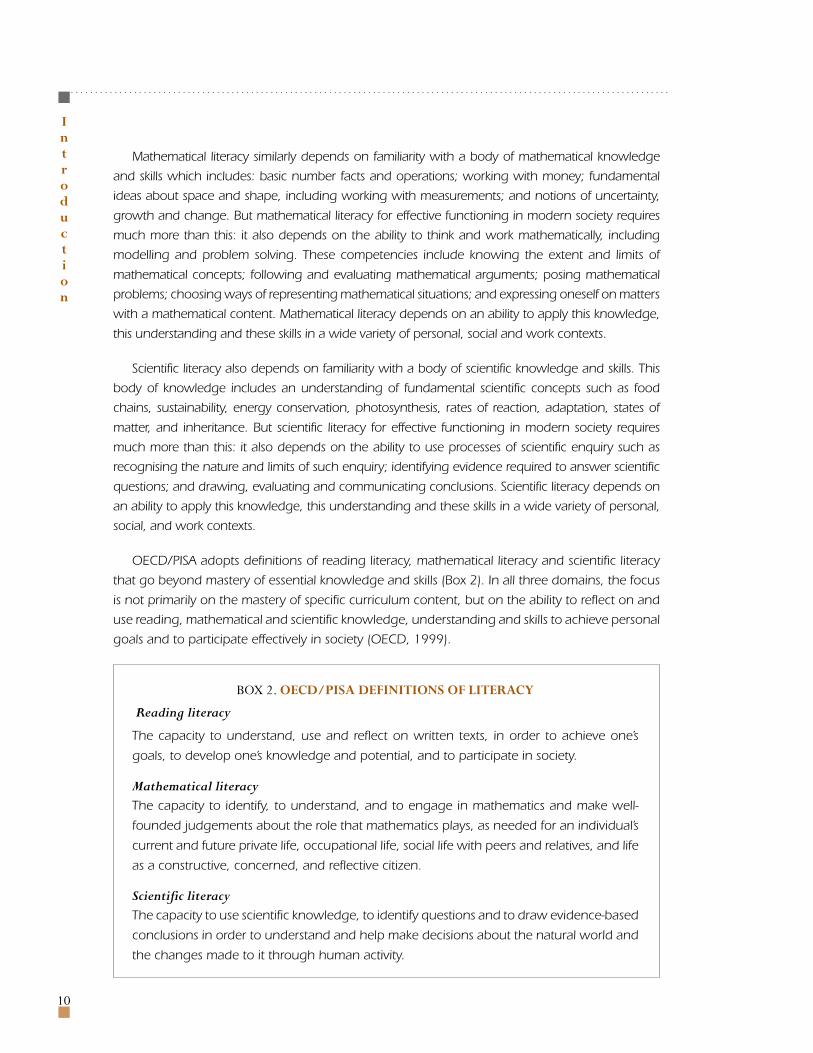
BOX 2. OECD/PISA DEFINITIONS OF LITERACY
Reading literacy
The capacity to understand, use and reflect on written texts, in order to achieve one’s
goals, to develop one’s knowledge and potential, and to participate in society.
Mathematical literacyThe capacity to identify, to understand, and to engage in mathematics and make well-
founded judgements about the role that mathematics plays, as needed for an individual’s
current and future private life, occupational life, social life with peers and relatives, and life
as a constructive, concerned, and reflective citizen.
Scientific literacyThe capacity to use scientific knowledge, to identify questions and to draw evidence-based
conclusions in order to understand and help make decisions about the natural world and
the changes made to it through human activity.
11
……………………………………………………………………………………………………………
Introduction
Three dimensions of literacy
In each domain, the assessment is organised in three dimensions, corresponding to process
skills, knowledge and understanding, and the context of application. The remainder of this
chapter gives an overview of each dimension. Chapters 2 to 4 explain more precisely the
criteria for assessment in each dimension within individual domains and illustrate these with
sample items.
It should be borne in mind that PISA 2000 gives more emphasis to reading literacy than to the
other two domains. PISA will take place every three years. In each cycle, two-thirds of testing time
will be devoted to assessing one domain in detail. Mathematical literacy will become the major
domain in 2003, and scientific literacy in 2006.
Processes
Reading literacy, mathematical literacy and scientific literacy require an understanding of and
facility with the methods and processes pertinent to each of these domains.
Beyond the ability to retrieve surface meaning from text, reading literacy requires an
understanding and appreciation of the writer’s craft, and an ability to reason about text. Readers
require an understanding of text structure, genre, and register. They must be able to follow chains
of reasoning; to compare and contrast information in a text; draw inferences; identify supporting
evidence; identify and understand irony, metaphor and humour; detect nuances and subtleties of
language; recognise ways in which texts are constructed to persuade and influence; and relate
what they read to their own background experience and knowledge.
Although surface understanding is important, it is not enough. In school and in society, we expect areader to be able to analyse, evaluate, and extend the ideas that are presented, just as we expect a writerto elaborate upon and defend judgements that are expressed. We expect people to know how to getinformation and to know how to use it and shape it to suit their needs. For example, readers must learnto relate what they are reading to their personal experience in order to integrate new ideas with whatthey know – perhaps modifying or rejecting the ideas in the process of considering them more fully.Readers must also learn to test the validity of what they read by comparing it with information fromother sources, as well as to judge the internal logic and consistency of the ideas and informationpresented (Applebee et al., 1987, p. 9).
Mathematical literacy similarly involves a range of process skills. The focus here is on students’
abilities to analyse, reason and communicate ideas effectively by posing, formulating and solving
mathematical problems. Mathematical literacy skills include thinking skills (e.g., distinguishing between
different kinds of mathematical statements); argumentation skills (e.g., following and evaluating chains
of mathematical arguments); modelling skills (e.g., translating “reality” into mathematical structures);
problem posing and solving skills; representation skills (e.g., distinguishing between different forms of
representation of mathematical situations); symbolic skills; technical skills (e.g., solving equations);
communication skills; and skills in using mathematical tools and aids.
……………………………………………………………………………………………………………
12
Introduction
[In the OECD/PISA definition of mathematics literacy], the term “engage in mathematics” includescommunicating, taking positions towards, relating to, assessing, and even appreciating mathematics(OECD, 1999, p. 41).
Scientific literacy depends on an ability to relate evidence or data to claims or conclusions. In
particular, scientific literacy involves the processes of recognising scientifically investigable questions
(e.g., identifying the question or idea being tested, distinguishing questions that can be answered
by scientific investigation from those which cannot); identifying evidence needed in a scientific
investigation (e.g., identifying and recognising what things should be compared, what variables
should be changed or controlled, and what additional information is required); drawing or
evaluating conclusions (e.g., producing a conclusion from a given set of evidence or data, and
identifying assumptions made in reaching a conclusion); and communicating valid conclusions
(e.g., producing an argument based on a situation or on data given, expressed in a manner that
is appropriate and clear to the intended audience).
The American Association for the Advancement of Science uses the term “scientific habits of
mind” in describing processes associated with the application of scientific, mathematical and
technological knowledge to everyday life. Individuals who have developed these habits of mind
should be able to:
(...) use the habits of mind and knowledge of science, mathematics and technology they have acquiredto think about and make sense of many of the ideas, claims, and events that they encounter in everydaylife. Accordingly, science literacy enhances the ability of a person to observe events perceptively, reflecton them thoughtfully, and comprehend explanations offered for them. In addition, these internal per-ceptions and reflections can provide the person with a basis for making decisions and taking action(American Association for the Advancement of Science, 1993, p. 322).
Scientific literacy also includes an understanding of the methods by which science derives
evidence to support claims for scientific knowledge, and of the strengths and limitations of science
in the real world:
An appreciation of what science is and isn’t, of what it can be and cannot be, or of what scientists mayor may not claim for science, is surely an essential element of literacy (Zen, 1992, p. 19).
Another important element of literacy (reading, mathematical and scientific) in PISA is the
ability to stand apart from arguments, evidence or text, to reflect on these, and to evaluate and
criticise claims made. These skills go beyond analysis, problem solving and communication to
evaluation and critical reflection.
In the domain of reading literacy,
(...) reflecting on the content of a text requires that the reader connects information found in a text toknowledge from other sources. Readers must also assess the claims made in the text against their ownknowledge of the world (...). Readers must be able to develop an understanding of what is said and
13
……………………………………………………………………………………………………………
Introduction
intended in a text, and must test that mental representation against what they know and believe on thebasis of either prior information, or information found in other texts. Readers must call on supportingevidence from within the text and contrast that with other sources of information, using both generaland specific knowledge, and the ability to reason abstractly (OECD, 1999, p. 32).
In the domain of scientific literacy,
An important life skill (...) is the capacity to draw appropriate and guarded conclusions from evidenceand information (...), to criticise claims made by others on the basis of the evidence put forward, andto distinguish opinion from evidence-based statements. Science has a particular part to play here sinceit is concerned with rationality in testing ideas and theories against evidence from the world around(OECD, 1999, p. 59).
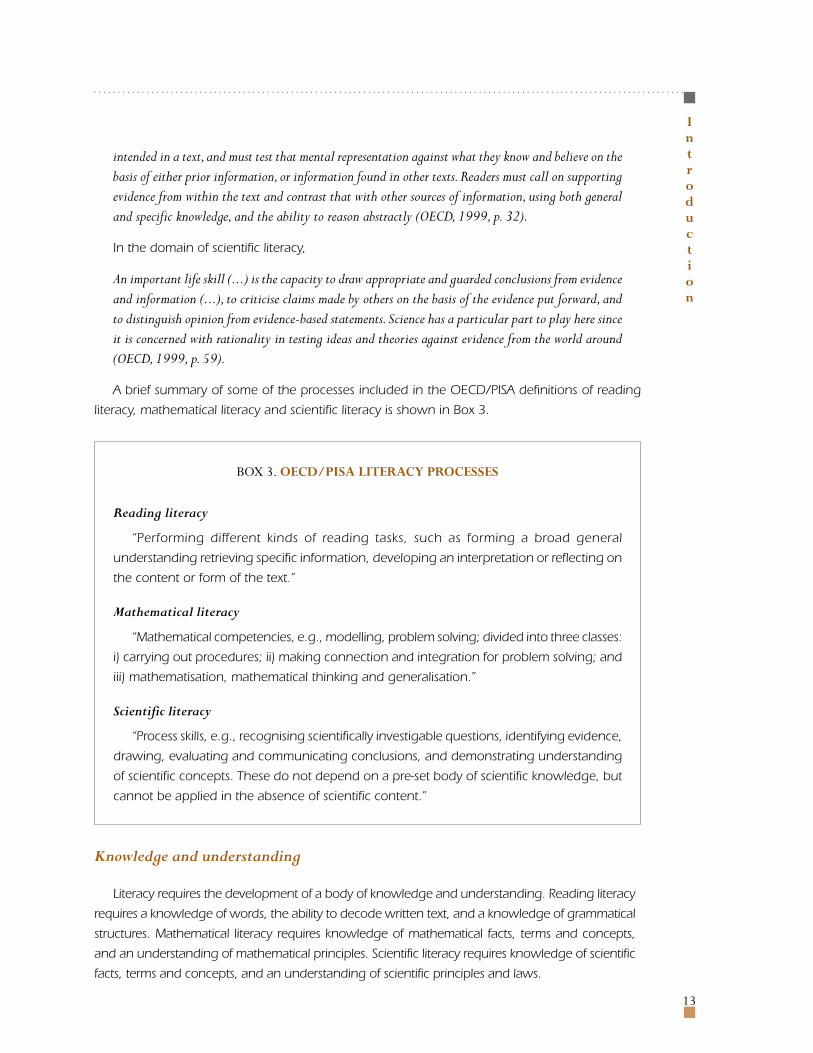
A brief summary of some of the processes included in the OECD/PISA definitions of reading
literacy, mathematical literacy and scientific literacy is shown in Box 3.
BOX 3. OECD/PISA LITERACY PROCESSES
Reading literacy
“Performing different kinds of reading tasks, such as forming a broad general
understanding retrieving specific information, developing an interpretation or reflecting on
the content or form of the text.”
Mathematical literacy
“Mathematical competencies, e.g., modelling, problem solving; divided into three classes:
i) carrying out procedures; ii) making connection and integration for problem solving; and
iii) mathematisation, mathematical thinking and generalisation.”
Scientific literacy
“Process skills, e.g., recognising scientifically investigable questions, identifying evidence,
drawing, evaluating and communicating conclusions, and demonstrating understanding
of scientific concepts. These do not depend on a pre-set body of scientific knowledge, but
cannot be applied in the absence of scientific content.”
Knowledge and understanding
Literacy requires the development of a body of knowledge and understanding. Reading literacy
requires a knowledge of words, the ability to decode written text, and a knowledge of grammatical
structures. Mathematical literacy requires knowledge of mathematical facts, terms and concepts,
and an understanding of mathematical principles. Scientific literacy requires knowledge of scientific
facts, terms and concepts, and an understanding of scientific principles and laws.
……………………………………………………………………………………………………………
14
Introduction
As individuals’ levels of reading literacy, mathematical literacy and scientific literacy develop,
they are able to draw on an increasingly rich store of knowledge and an increasingly deep
understanding of principles within each domain. The development of knowledge and
understanding specific to each domain is an important component of the development of
literacy.
But literacy involves much more than the mastery of bodies of knowledge. It also involves
an understanding of the methods, processes and limitations of a domain, and the ability to use
knowledge, understanding and skills in everyday contexts. For example,
[reading] literacy is not simply reading, but an ability to use print for personal and social ends. It is afunctional skill in that it requires the application of various skills in common everyday situations(Venezky et al., 1987, p. 5).
OECD/PISA differs from some other assessment programmes in that it is not primarily an
assessment of the extent to which students have mastered bodies of knowledge and skills
identified in school curricula. It is not an assessment of achievement in school reading,
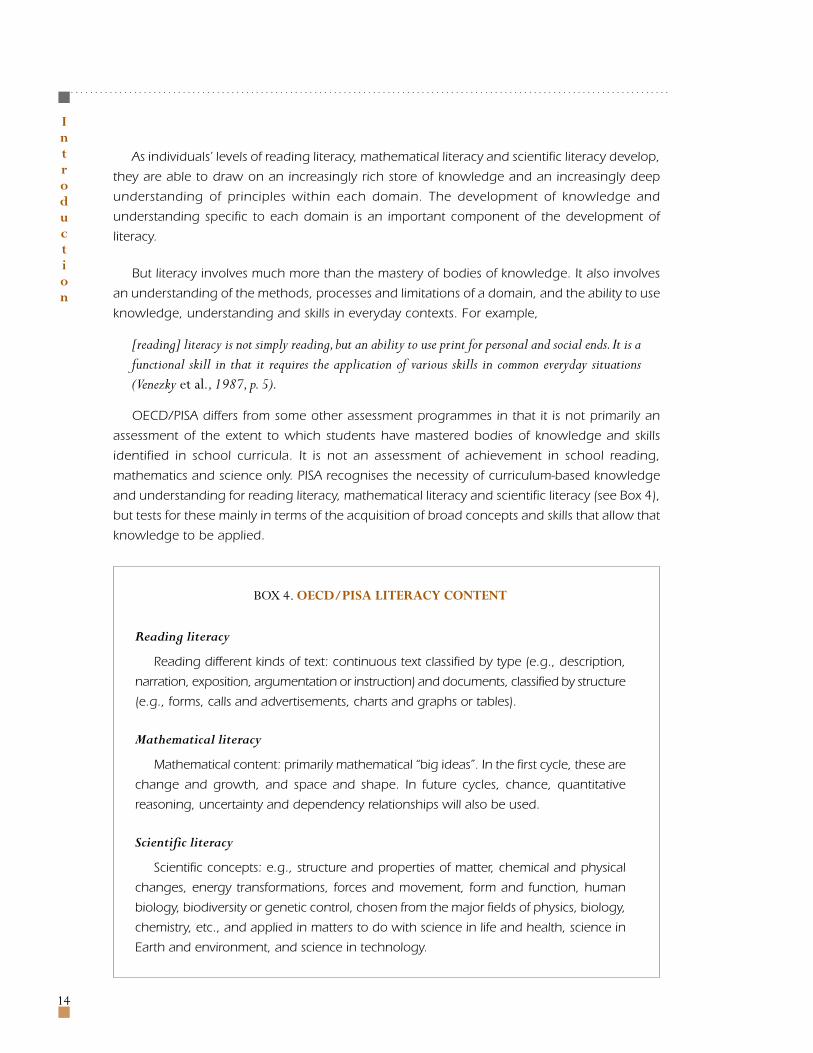
mathematics and science only. PISA recognises the necessity of curriculum-based knowledge
and understanding for reading literacy, mathematical literacy and scientific literacy (see Box 4),
but tests for these mainly in terms of the acquisition of broad concepts and skills that allow that
knowledge to be applied.
BOX 4. OECD/PISA LITERACY CONTENT
Reading literacy
Reading different kinds of text: continuous text classified by type (e.g., description,
narration, exposition, argumentation or instruction) and documents, classified by structure
(e.g., forms, calls and advertisements, charts and graphs or tables).
Mathematical literacy
Mathematical content: primarily mathematical “big ideas”. In the first cycle, these are
change and growth, and space and shape. In future cycles, chance, quantitative
reasoning, uncertainty and dependency relationships will also be used.
Scientific literacy
Scientific concepts: e.g., structure and properties of matter, chemical and physical
changes, energy transformations, forces and movement, form and function, human
biology, biodiversity or genetic control, chosen from the major fields of physics, biology,
chemistry, etc., and applied in matters to do with science in life and health, science in
Earth and environment, and science in technology.
15
……………………………………………………………………………………………………………
Introduction
Context of application
Finally, “literacy” incorporates an awareness and appreciation of the contexts in which texts are
constructed, mathematics is used, and science operates, and an ability to apply the knowledge,
understanding and skills specific to the appropriate domain to a wide range of contexts in the
world outside the classroom. This definition of literacy goes beyond the narrower conceptions of
literacy of the 1970s (sometimes called “functional” or “survival” literacy). The focus of these earlier
approaches was on minimal skills required to function in adult society.
Reading literacy as it is defined today includes an understanding of the contexts in which
written texts are created, and the ability to use this contextual understanding to interpret and
reason about texts. Modern definitions also recognise that reading literacy plays a crucial role in
facilitating participation in a wide variety of social contexts. In the OECD/PISA definition,
“participate” includes social, cultural and political engagement. Participation may include a criticalstance, a step towards personal liberation, emancipation and empowerment. The term “society” includeseconomic and political as well as social and cultural life (OECD, 1999, p. 21).
Modern definitions of mathematical and scientific literacy similarly emphasise the importance
of recognising and understanding the contexts in which mathematics and science operate and
the forces that shape these fields of human activity:
To ensure the scientific literacy of all students, curricula must present the scientific endeavour as asocial enterprise that strongly influences – and is influenced by – human thought and action (AmericanAssociation for the Advancement of Science, 1989, p. 5).
[Being literate] means having the intellectual skills to examine the pros and cons of any technologicaldevelopment, to examine its potential benefits, and to perceive the underlying political and socialforces driving the development (Fleming, 1989).
Beyond an understanding of the contexts in which written texts occur and mathematics and
science are undertaken, and the way in which these interact with, influence, and are shaped by
context, “literacy” includes an ability to use knowledge, understanding and skills in the three
domains in varied contexts and for a range of purposes:
[Mathematical literacy] involves using mathematics to make sense of the world; to assist in dealingwith real situations which arise in the workplace, personal and community settings. While it necessarilyinvolves understanding mathematical ideas, notations and techniques, it also involves drawing onknowledge of particular contexts and circumstances in deciding when to use mathematics, choosing themathematics to use, and critically evaluating its use (Cumming, 1997, p. 7).
In OECD/PISA, reading literacy, mathematical literacy and scientific literacy are assumed to
include the ability to apply processes and to use knowledge across a range of contexts:
……………………………………………………………………………………………………………
16
Introduction
• Reading literacy includes an ability to read a range of classroom materials and reading materials
outside classrooms, including reading for personal use (personal letters, fiction, biography, etc.); public
use (official documents, public information, etc.); employment; and education (textbooks, etc.).
• Mathematical literacy includes an ability to apply mathematical knowledge, skills and
understandings in “authentic” contexts. A context is considered authentic if it resides in the
actual experiences and practices of the participants in a real-world setting. An important part
of the definition of mathematical literacy is doing and using mathematics in a variety of situations.
These situations include personal life, school life, work and sports (or leisure in general), local
community and society as encountered in daily life, and scientific contexts.
• Scientific literacy includes an ability to solve problems in real-world situations which can affect
us as individuals (e.g., food and energy use) or as members of a local community (e.g., treatment
of the water supply or siting of a power station) or as world citizens (e.g., global warming,
diminution of biodiversity). Contexts to which scientific literacy could be applied include self
and family (personal), community (public), life across the world (global), and the evolution of
scientific knowledge and its influence on social decisions (historical relevance).
Box 5 summarises some of these contexts.
PISA: a work in progress
The assessment being carried out in 2000 and illustrated in this publication represents the
fruition of a long collaborative process. PISA is a highly ambitious venture. Its aim is to make an
authentic assessment of how well students are equipped for the future, in a way that is valid
across many different cultures and languages. It has brought together scientific expertise from a
wide range of participating countries, and has worked in association with governments to produce
a survey that will be relevant for policy making. While the first survey will inevitably be able to fulfil
some PISA objectives better than others, the achievement so far has been to produce a robust
framework that can be developed further over the years.
BOX 5. OECD/PISA CONTEXTS OF LITERACY
Reading literacy“Reading texts written for different situations, e.g., for personal interest or to meet work
requirements.”
Mathematical literacy“Using mathematics in different situations, e.g., problems that affect individuals, communities
or the whole world.”
Scientific literacy“Using science in different situations, e.g., problems that affect individuals, communities
or the whole world.”
READING
LITERACY
1
……………………………………………………………………………………………………………
18
Reading
Literacy
The PISA definition of readingliteracy and its context
Reading literacy is defined in PISA as:
understanding, using, and reflectingon written texts, in order to achieveone’s goals, to develop one’s knowledgeand potential, and to participate insociety.
Definitions of reading and of reading literacyhave changed over time in parallel with social,economic and cultural changes. Literacy is nolonger considered simply the ability to read andwrite. It is viewed as an advancing set ofknowledge, skills, and strategies, whichindividuals build on throughout life.
The PISA definition therefore goes beyondthe notion that reading literacy means decodingwritten material and literal comprehension.Reading incorporates understanding andreflecting on texts. Literacy involves the abilityof individuals to use written information to fulfiltheir goals, and of complex modern societiesto use written information to functioneffectively. PISA 2000 employs some 140reading literacy items that aim to represent thekinds of literacy that 15-year-olds will face intheir future lives.
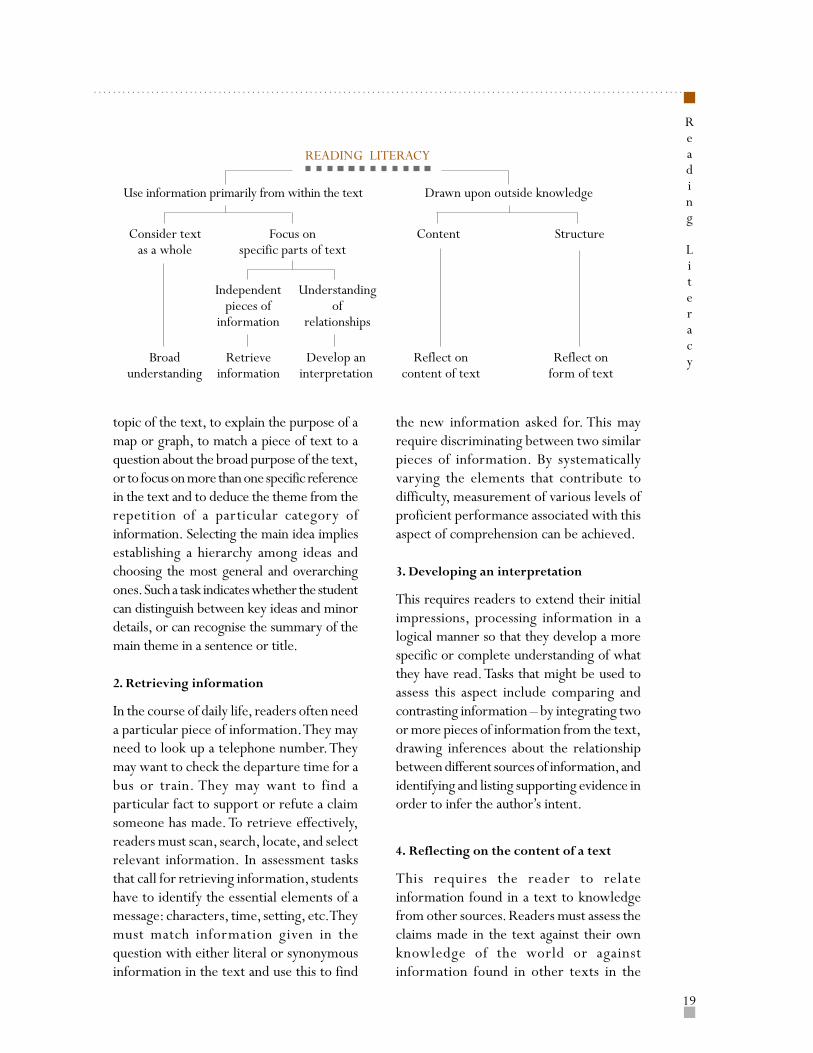
Three dimensions of reading literacy
Readers respond to a given text in a varietyof ways as they seek to use and understand whatthey are reading. This dynamic process has manydimensions, three of which are used toconstruct the PISA assessment:
• “Process” – reading tasks: various tasksrequired of readers (such as retrieval ofinformation or interpretation of text) usedin PISA to simulate the types of task thatstudents will encounter in real life;
• Content – types of text: the form inwhich written material is encountered andneeds to be understood (many and variedforms such as narrative prose, or graphicpresentation), a wide selection of which isrepresented in the PISA assessment items;
• Context – purpose of text: the situationin which reading takes place (e.g. for privateor occupational use), defined in PISAaccording to how the author intended thetext to be used. PISA items are designed torelate to a variety of such contexts.
Reading tasks
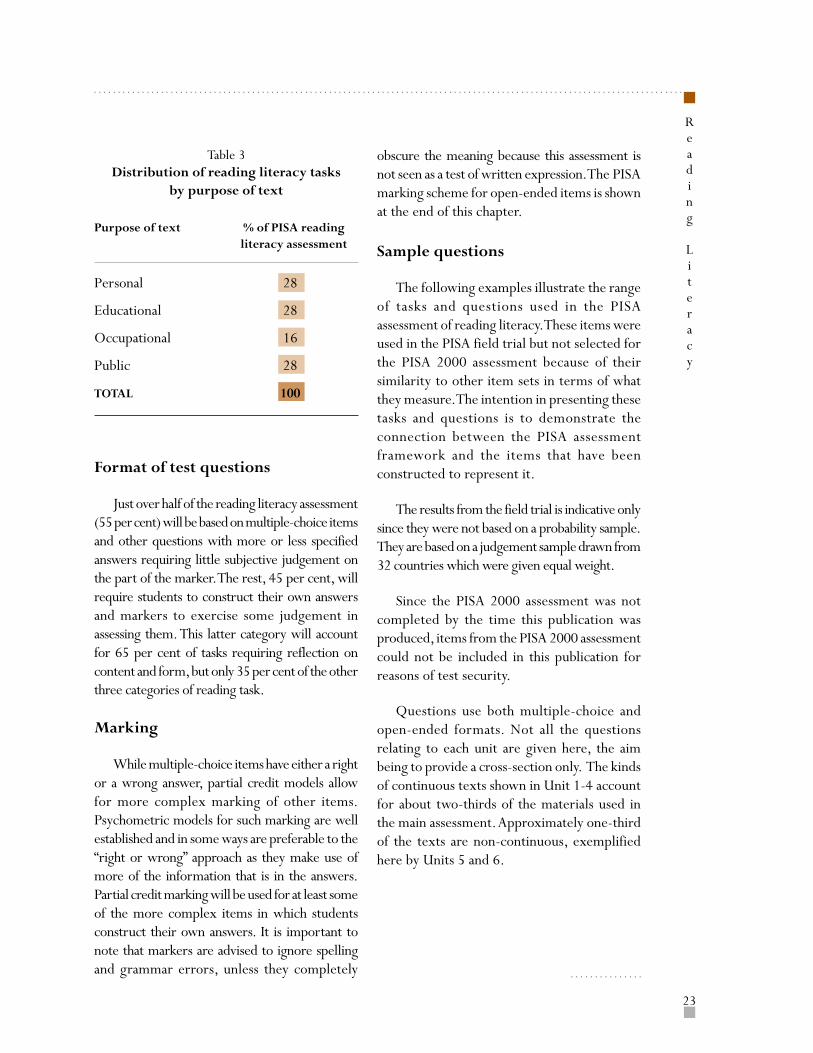
PISA assesses students’ ability to perform avariety of reading tasks. It aims to simulate thekinds of task encountered in “authentic” readingsituations – i.e. in real life. To this end, theassessment measures five aspects of understandinga text. It is expected that all readers, irrespectiveof their overall proficiency, will be able todemonstrate some level of competency in eachaspect. While there is an interrelationship amongthe five aspects, since each may require many ofthe same underlying skills, successfullyaccomplishing one may not be dependent uponsuccessfully completing any other. The five aspectsof reading assessed in PISA are:
1. Forming a broad general understanding
This requires the reader to consider the textas a whole or in a broad perspective. Studentsmay be asked, for example, to demonstrateinitial understanding by identifying the main
ASSESSING READING LITERACY IN PISA
19
……………………………………………………………………………………………………………
Reading
Literacy
Consider textas a whole
topic of the text, to explain the purpose of amap or graph, to match a piece of text to aquestion about the broad purpose of the text,or to focus on more than one specific referencein the text and to deduce the theme from therepetition of a particular category ofinformation. Selecting the main idea impliesestablishing a hierarchy among ideas andchoosing the most general and overarchingones. Such a task indicates whether the studentcan distinguish between key ideas and minordetails, or can recognise the summary of themain theme in a sentence or title.
2. Retrieving information
In the course of daily life, readers often needa particular piece of information. They mayneed to look up a telephone number. Theymay want to check the departure time for abus or train. They may want to find aparticular fact to support or refute a claimsomeone has made. To retrieve effectively,readers must scan, search, locate, and selectrelevant information. In assessment tasksthat call for retrieving information, studentshave to identify the essential elements of amessage: characters, time, setting, etc. Theymust match information given in thequestion with either literal or synonymousinformation in the text and use this to find
the new information asked for. This mayrequire discriminating between two similarpieces of information. By systematicallyvarying the elements that contribute todifficulty, measurement of various levels ofproficient performance associated with thisaspect of comprehension can be achieved.
3. Developing an interpretation
This requires readers to extend their initialimpressions, processing information in alogical manner so that they develop a morespecific or complete understanding of whatthey have read. Tasks that might be used toassess this aspect include comparing andcontrasting information – by integrating twoor more pieces of information from the text,drawing inferences about the relationshipbetween different sources of information, andidentifying and listing supporting evidence inorder to infer the author’s intent.
4. Reflecting on the content of a text
This requires the reader to relateinformation found in a text to knowledgefrom other sources. Readers must assess theclaims made in the text against their ownknowledge of the world or againstinformation found in other texts in the
READING LITERACY
Use information primarily from within the text
Focus onspecific parts of text
Independentpieces of
information
Understandingof
relationships
Broadunderstanding
Retrieveinformation
Develop aninterpretation
Drawn upon outside knowledge
Content Structure
Reflect oncontent of text
Reflect onform of text
……………………………………………………………………………………………………………
20
Reading
Literacy
assessment or explicitly provided in thequestion. In many situations, readers mustknow how to justify their own point of view.Typical assessment tasks include providingevidence or arguments from outside thetext, assessing the relevance of particularpieces of information or evidence, drawingcomparisons with moral or aesthetic rules(standards), identifying information thatmight strengthen the author’s argument, andevaluating the sufficiency of the evidence orinformation provided in the text.
5. Reflecting on the form of a text
Tasks in this category require readers to standapart from the text, consider it objectively,and evaluate its quality and appropriateness.Knowledge of such things as text structure,genre and register play an important role inthese tasks. Students are required to detectnuances in language – for example,understanding when the choice of an adjectivemight colour interpretation. Assessment tasksinclude determining the utility of a particulartext for a specified purpose, evaluating anauthor’s use of certain textual features inaccomplishing a particular goal, andidentifying or commenting on the author’s useof style and what the author’s purpose andattitude are.
Table 1 shows the distribution of readingliteracy tasks in the PISA 2000 assessment byeach of the five aspects defined above. The firstthree aspects, which look at how well a studentcan understand and use information within atext, account for 70 per cent of the readingliteracy assessment. The remaining tasks requirewider reflection.
Types of text
At the heart of the organisation of the PISAreading assessment is a distinction betweencontinuous and non-continuous texts. Continuoustexts are typically composed of sentences thatare, in turn, organised into paragraphs. Thesemay be fit into even larger structures such assections, chapters, and books. Non-continuoustexts, or documents as they are known in someapproaches, present information in a variety ofdifferent ways, such as forms, graphs and maps.
Continuous texts
Continuous text types are all in a standard“prose” form. They are classified according tothe author’s purpose, with the following fivetypes used in PISA:
1. Description refers to properties of objectsin space, and typically provides an answerto “what” questions.
2. Narration refers to properties of objectsin time and typically provides answers to“when”, or “in what sequence” questions.
3. Exposition presents information ascomposite concepts or mental constructs,or those elements into which concepts ormental constructs can be analysed. Thetext provides an explanation of how thecomponent elements interrelate in ameaningful whole and often answers“how” questions.
4. Argumentation presents propositions as tothe relationship among concepts, or other
Table 1. Distribution of reading tasksby aspects of reading literacy
Aspect % of PISA readingliteracy assessment
Retrieving information 20
Broad understanding 20
Developing an interpretation 30
Reflecting on content 15
Reflecting on form 15
TOTAL 100
21
……………………………………………………………………………………………………………
Reading
Literacy
propositions. Argument texts often answer“why” questions.
5. Instruction (sometimes called injunction)provides directions on what to do andincludes procedures, rules, regulationsand statutes specifying certain behaviours.
Non-continuous texts
Unlike continuous texts, non-continuousones vary in form, and are thus classifiedaccording to their structure rather than theauthor’s purpose. The following six types areused in PISA:
1. Forms are structured and formatted textswhich request the reader to respond tospecific questions in specified ways. Typicalexamples are tax forms, immigrationforms, visa forms, application forms,statistical questionnaires, etc.
2. Calls and advertisements are documentsdesigned to invite the reader to do some-thing, e.g., to buy goods or services, attendgatherings or meetings, elect a person to apublic office, etc. The purpose of these docu-ments is to persuade the reader. They offersomething and request attention and actionat the same time. Advertisements, invita-tions, summonses, warnings and notices areexamples of this document format.
3. Charts and graphs are iconic representationsof data. They are used for the purposes ofscientific argumentation, and also in jour-nals and newspapers to display numericaland tabular public information in a visualformat.
4. Diagrams often accompany technicaldescriptions (e.g., demonstrating parts ofa household appliance), expository texts,and instructive texts (e.g., illustrating howto assemble a household appliance). It isoften useful to distinguish procedural
(how to) from process (how somethingworks) diagrams.
5. Tables and matrices. Tables are row andcolumn matrices. Typically, all the entriesin each column and each row shareproperties, and thus the column and rowlabels are part of the information structureof the text. Common tables includetimetables, spreadsheets, order forms andindexes.
6. Maps are non-continuous texts that indicatethe geographic relationships between places.There is a variety of types of maps. Roadmaps mark the distances and routes betweenidentified places. Thematic maps indicate therelationships between locations and socialor physical features.
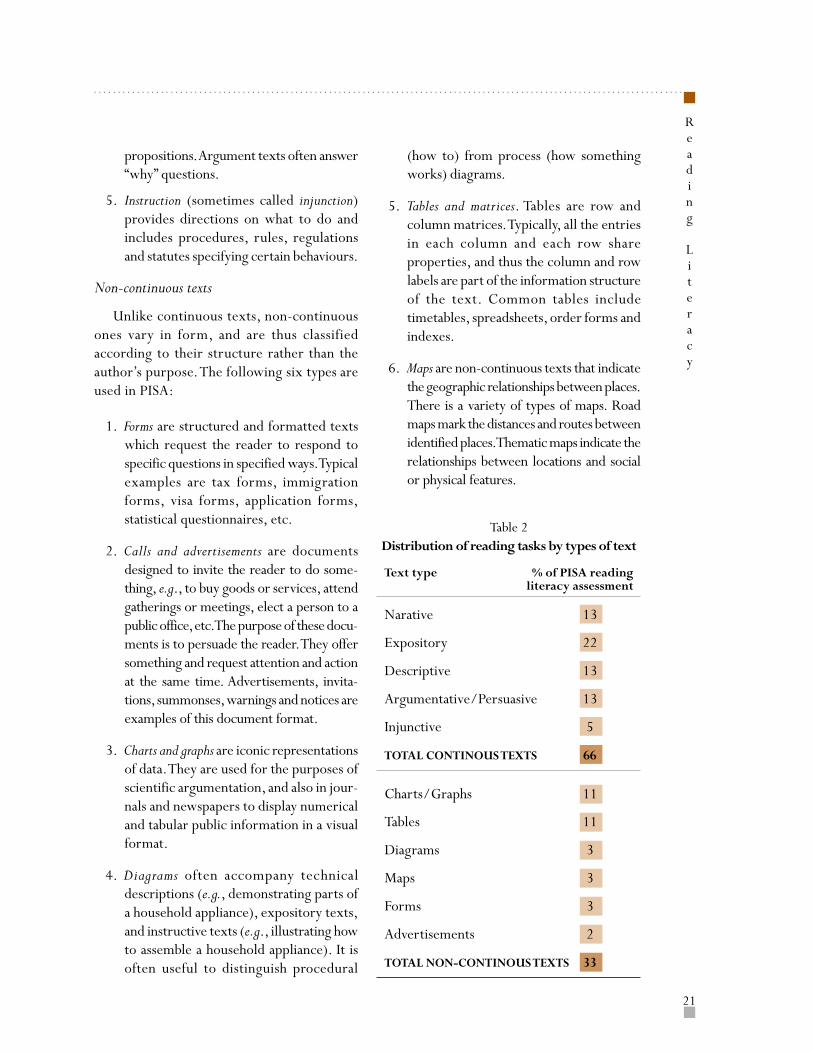
Table 2Distribution of reading tasks by types of text
Text type % of PISA readingliteracy assessment
Narative 13
Expository 22
Descriptive 13
Argumentative/Persuasive 13
Injunctive 5
TOTAL CONTINOUS TEXTS 66
Charts/Graphs 11
Tables 11
Diagrams 3
Maps 3
Forms 3
Advertisements 2
TOTAL NON-CONTINOUS TEXTS 33
……………………………………………………………………………………………………………
22
Reading
Literacy
The distribution and variety of texts thatstudents are asked to read for PISA, shown inTable 2, is an important characteristic of theassessment. Continuous texts represent abouttwo-thirds of the texts contained in theassessment, of which the largest single categoryis expository materials. Two-thirds of non-continuous texts are tables or charts and graphs.The remaining non-continuous texts are maps,advertisements, and forms of the type that 15-year-olds are expected to be able to read and use.
Purposes of text
PISA distinguishes four types of readingsituation: reading for private use, reading forpublic use, reading for work, and reading foreducation.
While it is the intent of the PISA readingliteracy assessment to measure the kinds ofreading that occur both within and outsideclassrooms, the manner in which readingsituations are defined cannot be based simplyon where reading takes place. For example,textbooks are read both in schools and in homes,and the processes and purposes of reading thesetexts differ little from one setting to another.
In PISA, the reading situations can thereforebe understood as a general categorisation oftexts based on their intended use, on implicitor explicit relations to others, and on thegeneral contents. Close attention has thereforebeen paid to the origin and content of texts.The goal is to reach a balance between reflectingthe broad definition of reading literacy used inPISA and representing the linguistic and culturaldiversity of participating countries. Thisdiversity will help to ensure that no one groupis either advantaged or disadvantaged by theassessment content.
1. Reading for private use (personal) is carriedout to satisfy an individual’s own interests,
both practical and intellectual. It alsoincludes reading to maintain, or develop,personal connections to other people.Contents typically include personalletters, fiction, biography, andinformational texts read for curiosity, as apart of leisure or recreational activities.
2. Reading for public use is carried out toparticipate in the activities of the largersociety. It includes the use of officialdocuments as well as information aboutpublic events. In general, these tasks areassociated with more or less anonymouscontact with others.
3. Reading for work (occupational) may notyet be required by most 15-year-olds,but there are two important reasons toinclude such situations in PISA. First,reading in such situations is usuallyclosely associated with the accomplish-ment of some immediate task. Secondly,some reading abilities will help to equipstudents for the world of work intowhich the PISA target population willshortly move.
4. Reading for education, or reading to learn,is normally involved with acquiringinformation as part of a larger learningtask. The materials are often not chosenby the reader, but assigned by a teacher.The content is usually designed specificallyfor the purpose of instruction.
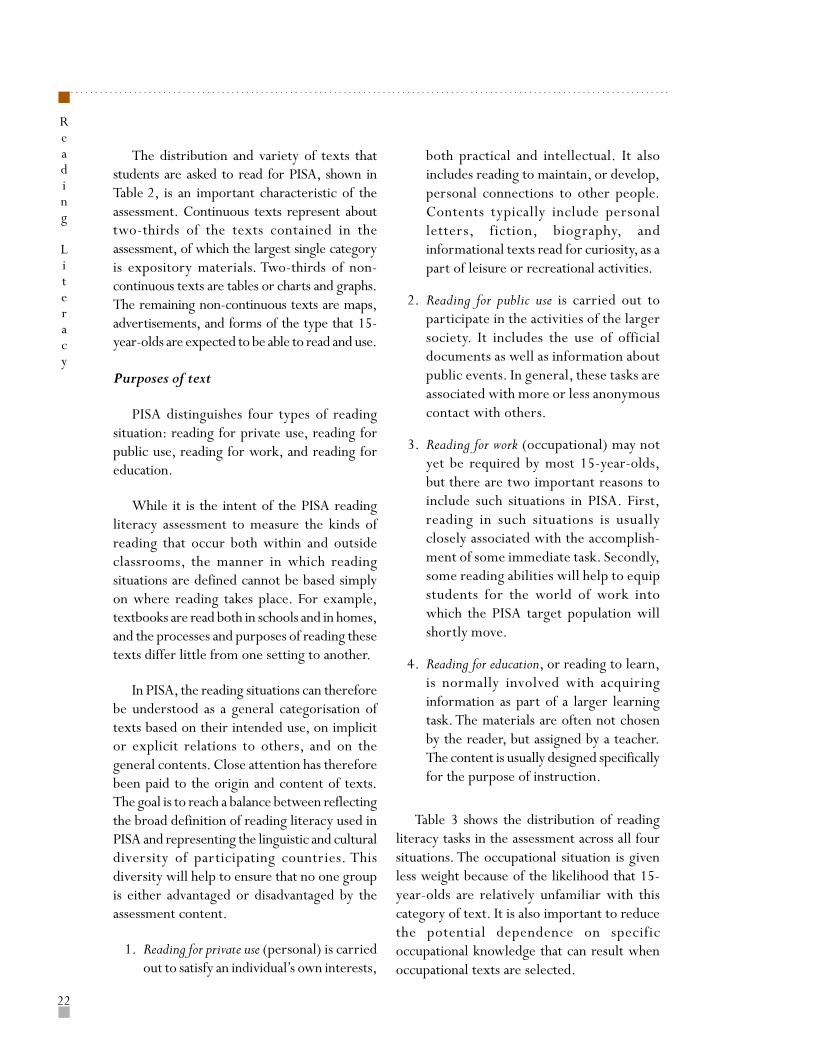
Table 3 shows the distribution of readingliteracy tasks in the assessment across all foursituations. The occupational situation is givenless weight because of the likelihood that 15-year-olds are relatively unfamiliar with thiscategory of text. It is also important to reducethe potential dependence on specificoccupational knowledge that can result whenoccupational texts are selected.
23
……………………………………………………………………………………………………………
Reading
Literacy
Format of test questions
Just over half of the reading literacy assessment(55 per cent) will be based on multiple-choice itemsand other questions with more or less specifiedanswers requiring little subjective judgement onthe part of the marker. The rest, 45 per cent, willrequire students to construct their own answersand markers to exercise some judgement inassessing them. This latter category will accountfor 65 per cent of tasks requiring reflection oncontent and form, but only 35 per cent of the otherthree categories of reading task.
Marking
While multiple-choice items have either a rightor a wrong answer, partial credit models allowfor more complex marking of other items.Psychometric models for such marking are wellestablished and in some ways are preferable to the“right or wrong” approach as they make use ofmore of the information that is in the answers.Partial credit marking will be used for at least someof the more complex items in which studentsconstruct their own answers. It is important tonote that markers are advised to ignore spellingand grammar errors, unless they completely
obscure the meaning because this assessment isnot seen as a test of written expression. The PISAmarking scheme for open-ended items is shownat the end of this chapter.
Sample questions
The following examples illustrate the rangeof tasks and questions used in the PISAassessment of reading literacy. These items wereused in the PISA field trial but not selected forthe PISA 2000 assessment because of theirsimilarity to other item sets in terms of whatthey measure. The intention in presenting thesetasks and questions is to demonstrate theconnection between the PISA assessmentframework and the items that have beenconstructed to represent it.
The results from the field trial is indicative onlysince they were not based on a probability sample.They are based on a judgement sample drawn from32 countries which were given equal weight.
Since the PISA 2000 assessment was notcompleted by the time this publication wasproduced, items from the PISA 2000 assessmentcould not be included in this publication forreasons of test security.
Questions use both multiple-choice andopen-ended formats. Not all the questionsrelating to each unit are given here, the aimbeing to provide a cross-section only. The kindsof continuous texts shown in Unit 1-4 accountfor about two-thirds of the materials used inthe main assessment. Approximately one-thirdof the texts are non-continuous, exemplifiedhere by Units 5 and 6.
……………
Table 3Distribution of reading literacy tasks
by purpose of text
Purpose of text % of PISA readingliteracy assessment
Personal 28
Educational 28
Occupational 16
Public 28
TOTAL 100
……………………………………………………………………………………………………………
24
Reading
Literacy
READING UNIT 1
BEES
COLLECTING NECTAR
Bees make honey to survive. It is their only essential food. If there are 60,000 bees ina hive about one third of them will be involved in gathering nectar which is then made intohoney by the house bees. A small number of bees work as foragers or searchers. They finda source of nectar, then return to the hive to tell the other bees where it is.
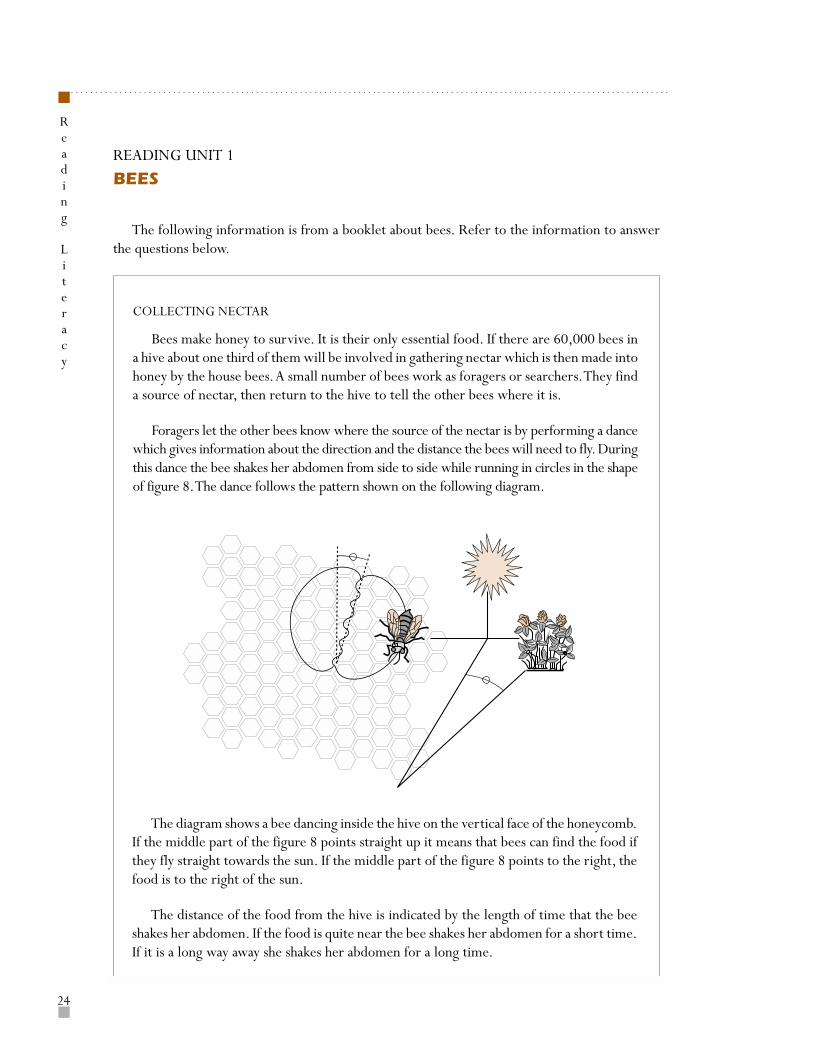
Foragers let the other bees know where the source of the nectar is by performing a dancewhich gives information about the direction and the distance the bees will need to fly. Duringthis dance the bee shakes her abdomen from side to side while running in circles in the shapeof figure 8. The dance follows the pattern shown on the following diagram.
The diagram shows a bee dancing inside the hive on the vertical face of the honeycomb.If the middle part of the figure 8 points straight up it means that bees can find the food ifthey fly straight towards the sun. If the middle part of the figure 8 points to the right, thefood is to the right of the sun.
The distance of the food from the hive is indicated by the length of time that the beeshakes her abdomen. If the food is quite near the bee shakes her abdomen for a short time.If it is a long way away she shakes her abdomen for a long time.
The following information is from a booklet about bees. Refer to the information to answerthe questions below.
25
……………………………………………………………………………………………………………
Reading
Literacy
Sample Question 1 (Multiple Choice)
• Aspect: Forming a broad understanding• Text type: Continuous (description)• Situation: Educational
What is the purpose of the bees’ dance?
A To celebrate the successful production of honey.
B To indicate the type of plant the foragers have found.
C To celebrate the birth of a new Queen Bee.
D To indicate where the foragers have found food.
Ninety-one per cent of all students participating in the field trial were able to select D as thecorrect answer to Sample Question 1.
MAKING HONEY
When the bees arrive at the hive carrying nectar they give this to the house bees. Thehouse bees move the nectar around with their mandibles, exposing it to the warm dry airof the hive. When it is first gathered the nectar contains sugar and minerals mixed withabout 80% water. After ten to twenty minutes, when much of the excess water hasevaporated, the house bees put the nectar in a cell in the honeycomb where evaporationcontinues. After three days, the honey in the cells contains about 20% water. At this stage,the bees cover the cells with lids which they make out of beeswax.
At any one time the bees in a hive usually gather nectar from the same type of blossomand from the same area. Some of the main sources of nectar are fruit trees, clover andflowering trees.
GLOSSARYhouse bee a worker bee which works inside the hivemandible mouth-part
Reproduced from “Hum Sweet Hum”.© National Foundation for Educational Research 1993.
The text in Unit 1 is from aneducational context and is anexample of a descriptive-explanatorytext because it characterises thefood-gathering behaviour of bees. Itis also an example of a text thatcontains both continuous and non-continuous information in that itincludes a diagram which makes amajor contribution to explainingthe dance of the forager bees.
……………………………………………………………………………………………………………
26
Reading
Literacy
Sample Question 2 (Multiple Choice)
• Aspect: Developing an interpretation• Text type: Continuous (description)• Situation: Educational
What is the main difference between nectar and honey?
A The proportion of water in the substance.
B The proportion of sugar to minerals in the substance.
C The type of plant from which the substance is gathered.
D The type of bee which processes the substance.
Sample Question 2 appears to be slightly more difficult, since only 72 per cent of allstudents in the PISA field trial answered it correctly. It requires students to develop aninterpretation by following the flow of ideas presented in the paragraph under heading“Making Honey.”
Sample Question 3 (Open-Constructed Response)
• Aspect: Developing an interpretation• Text type: Continuous (description)• Situation: Educational
In the dance, what does the bee do to show how far the food is from
the hive?
In Sample Question 3, readers again need to be able to follow the flow of ideas presented in apart of the text. In this case it is the paragraph after the diagram beginning “The distance ofthe food ...”. Students were required to state two things: the shaking of the abdomen and thelength of time. This question was answered correctly (with full credit) by only 48 per cent ofall students. A further 30 per cent responded by stating only one of these facts, and obtainedpartial credit. The question would have been easier if it had instructed students to list twothings stated in the text which bees do in order to indicate how far food is from the hive.Perhaps because of its current wording, only the more careful readers responded with bothpieces of information.
27
……………………………………………………………………………………………………………
Reading
Literacy
Sample Question 4 (Closed-Constructed Response)
• Aspect: Retrieving information• Text type: Continuous (description)• Situation: Educational
Write down three of the main sources of nectar.
1. ______________________2. ______________________3. ______________________
In order to respond correctly to Sample Question 4, students need to locate the lastsentence in the text that states: “Some of the main sources of nectar are fruit trees, cloverand flowering trees.” Given that the information is set out in the text and that thequestion specifically asks for three sources, it is somewhat surprising that only 66 per centof all students answered correctly. As the question makes no specific reference to the text, it ispossible that students attempted to use their own background knowledge to answer thisquestion rather than locating the information stated in the last sentence of the text.
READING UNIT 2
IN POOR TASTE
The following letter appeared in a newspaper in 1997. Refer to the letter to answer thequestions below.
IN POOR TASTEfrom Arnold Jago
Did you know that in 1996 we spent almost the same amount on chocolate as ourgovernment spent on overseas aid to help the poor?
Could there be something wrong with our priorities?
What are you going to do about it?
Yes, you.
Arnold Jago,
Mildura
Source: The Age, 1st April, 1997.
The text shown in Unit 2 is one of the shortestcontinuous or prose texts in the initial itempool. It is a letter entitled “In Poor Taste” whichappeared in a newspaper, and it is classed asan argumentative text because the writer isattempting to persuade the reader of his view.It is drawn from a public context.
……………………………………………………………………………………………………………
28
Reading
Literacy
Sample Question 5 (Multiple Choice)
• Aspect: Developing an interpretation• Text type: Continuous (description)• Situation: Public
Arnold Jago’s aim in the letter is to provoke
A guilt.
B amusement.
C fear.
D satisfaction.
Sample Question 5 is a multiple-choice question which was answered correctly by, on average,81 per cent of all students in the countries participating in the PISA field trial. This letter isclassified as an argumentative text because the writer was attempting to persuade the readerand it is thought to be a public text since reading it is typically associated with participationin society at large and also because it deals with information involving public events. It isdesigned to discover whether students can understand the way in which the information in theletter is organised. To this end, students are asked to use the information stated in the letter tomake an inference about the author’s intent or purpose. They are not asked to judge whetherthe letter fulfils that intent or purpose (had the question asked the students to consider theutility of the letter in meeting the author’s goal or intent, then it would have been classifiedas reflecting on the form of a text).
Sample Question 6 (Open-Constructed Response)
• Aspect: Reflecting on the content• Text type: Continuous (argumentation)• Situation: Public
What kind of response or action do you think Arnold Jago would like
his letter to prompt?
Sample Question 6 proved more difficult, being correctly answered by only 63 per cent of allstudents in the PISA field trial. It assesses a different aspect of reading, requiring students togo beyond the information provided in the letter and to reflect on the content. That is, theyare not given credit for a correct response if they only state that Jago wants them to spend lesson chocolate or to be less greedy. In reflecting on what they read, students need to bring theiroutside knowledge to bear on their understanding of the letter and to provide a statement orsentence indicating that government or individuals should provide larger amounts of overseasaid or that there should be a shift in priorities.
29
……………………………………………………………………………………………………………
Reading
Literacy
How did the students answer? Examples (See end of chapter for marking scheme)
• “People spending less money on chocolate and more on the overseas sick.” (Score 1 [a])
• “That people don’t spend all their money on chocolate rather than overseas.” (Score 1 [a])
• “An increase in the spending of the government towards overseas aid to help the poor.” (Score 1 [a])
• “People instead of buying and eating chocolate should give to a good cause and not be so self-indulgent.” (Score 1 [a])
• “People stirred up to think more of helping others than indulging in personal pleasures.”(Score 1 [b])
• “People’s awareness that the poor need our help, for people to do something about it.”(Score 1 [b])
• “I think he would like letters with written opinions and what they should do to help this problem.”(Score 0 [e])
• “He may like to see people’s suggestions on how to fund raise for overseas using chocolate.”(Score 0)
[a], [b] and [e] refer to the scoring guide at the end of this chapter.
A JUST JUDGE
An Algerian king named Bauakas wanted to find out whether or not it was true, as hehad been told, that in one of his cities lived a just judge who could instantly discern thetruth, and from whom no rogue was ever able to conceal himself. Bauakas exchangedclothes with a merchant and went on horseback to the city where the judge lived.
At the entrance to the city a cripple approached the king and begged alms of him.Bauakas gave him money and was about to continue on his way, but the cripple clung to hisclothing.
“What do you wish?” asked the king. “Haven’t I given you money?”
“You gave me alms,” said the cripple, “now grant me one favour. Let me ride with you asfar as the city square, otherwise the horses and camels may trample me.”
READING UNIT 3
A JUST JUDGERefer to the following story “A Just Judge” to answer the questions below.
……………………………………………………………………………………………………………
30
Reading
Literacy
Bauakas sat the cripple behind him on the horse and took him as far as the city square.There he halted his horse, but the cripple refused to dismount.
“We have arrived at the square, why don’t you get off?” asked Bauakas.
“Why should I?” the beggar replied. “This horse belongs to me. If you are unwilling toreturn it, we shall have to go to court.”
Hearing their quarrel, people gathered around them shouting:
“Go to the judge! He will decide between you!”
Bauakas and the cripple went to the judge. There were others in court, and the judgecalled upon each one in turn. Before he came to Bauakas and the cripple he heard a scholarand a peasant. They had come to court over a woman: the peasant said she was his wife, andthe scholar said she was his. The judge heard them both, remained silent for a moment, andthen said:
“Leave the woman here with me, and come back tomorrow.”
When they had gone, a butcher and an oil merchant came before the judge. The butcherwas covered with blood, and the oil merchant with oil. In his hand the butcher held somemoney, and the oil merchant held onto the butcher’s hand.
“I was buying oil from this man,” the butcher said, “and when I took out my purse to payhim, he seized me by the hand and tried to take all my money away from me. That is why wehave come to you – I holding onto my purse, and he holding onto my hand. But the money ismine, and he is a thief.”
Then the oil merchant spoke. “That is not true,” he said. “The butcher came to me to buyoil, and after I had poured him a full jug, he asked me to change a gold piece for him. WhenI took out my money and placed it on a bench, he seized it and tried to run off. I caught himby the hand, as you see, and brought him here to you.”
The judge remained silent for a moment, then said: “Leave the money here with me, andcome back tomorrow.”
When his turn came, Bauakas told what had happened. The judge listened to him, andthen asked the beggar to speak.
“All that he said is untrue,” said the beggar. “He was sitting on the ground, and as I rodethrough the city he asked me to let him ride with me. I sat him on my horse and took himwhere he wanted to go. But when we got there he refused to get off and said that the horsewas his, which is not true.”
31
……………………………………………………………………………………………………………
Reading
Literacy
The judge thought for a moment, then said, “Leave the horse here with me, and comeback tomorrow.”
The following day many people gathered in court to hear the judge’s decisions.
First came the scholar and the peasant.
“Take your wife,” the judge said to the scholar, “and the peasant shall be given fifty strokesof the lash.”
The scholar took his wife, and the peasant was given his punishment.
Then the judge called the butcher.
“The money is yours,” he said to him. And pointing to the oil merchant he said: “Givehim fifty strokes of the lash.”
He next called Bauakas and the cripple.
“Would you be able to recognise your horse among twenty others?” he asked Bauakas.
“I would,” he replied.
“And you?” he asked the cripple.
“I would,” said the cripple.
“Come with me,” the judge said to Bauakas.
They went to the stable. Bauakas instantly pointed out his horse among the twenty others.Then the judge called the cripple to the stable and told him to point out the horse. Thecripple recognised the horse and pointed to it. The judge then returned to his seat.
“Take the horse, it is yours,” he said to Bauakas. “Give the beggar fifty strokes of the lash.”
When the judge left the court and went home, Bauakas followed him.
“What do you want?” asked the judge. “Are you not satisfied with my decision?”
“I am satisfied,” said Bauakas. “But I should like to learn how you knew that the womanwas the wife of the scholar, that the money belonged to the butcher, and that the horse wasmine and not the beggar’s.”
“This is how I knew about the woman: in the morning I sent for her and said: ‘Please fillmy inkwell.’ She took the inkwell, washed it quickly and deftly, and filled it with ink; thereforeit was work she was accustomed to. If she had been the wife of the peasant she would nothave known how to do it. This showed me that the scholar was telling the truth.
……………………………………………………………………………………………………………
32
Reading
Literacy
Sample Question 7(Multiple Choice)
• Aspect: Reflecting on the content• Text type: Continuous (narration)• Situation: Personal/educational
How did the judge know that the woman was the wife of the scholar?
A By observing her appearance, and seeing that she did not look like a
peasant’s wife.
B By the way the scholar and the peasant told their stories in court.
C By the way she reacted to the peasant and the scholar in court.
D By testing her skill in work that she needed to perform for her
husband.
Sample Question 7 is the easiest question associated with this text (answered correctly by 82 percent of students in the PISA field trial). The correct answer, D, is very similar to the statement inthe text, which reads, “... therefore it was work she was accustomed to.”
“And this is how I knew about the money: I put it into a cup full of water, and in themorning I looked to see if any oil had risen to the surface. If the money had belonged to theoil merchant it would have been soiled by his oily hands. There was no oil on the water;therefore, the butcher was telling the truth.
“It was more difficult to find out about the horse. The cripple recognised it among twentyothers, even as you did. However, I did not take you both to the stable to see which of youknew the horse, but to see which of you the horse knew. When you approached it, it turnedits head and stretched its neck toward you; but when the cripple touched it, it laid back itsears and lifted one hoof. Therefore I knew that you were the horse’s real master.”
Then Bauakas said to the judge: “I amnot a merchant, but King Bauakas, I camehere in order to see if what is said of youis true. I see now that you are a wise judge.Ask whatever you wish of me, and youshall have it as reward.”
“I need no reward,” replied the judge.“I am content that my king has praised me.”
Source: “A Just Judge” by Leo Tolstoy from Fableand Fairytales, translated by Ann Dunningan.
A third example of a continuous text (Unit 3) is anarrative entitled “A Just Judge”. This story depictsa sequence of events beginning with an Algerianking named Bauakas who wants to learn whetherit is true that a just judge who is able to discerntruth lives in one of his cities. Whereas “In Poor Taste”(Unit 2) is an example of a short text, “A Just Judge”is an example of a long text that students areexpected to be able to read and understand. Although15-year-olds might typically encounter such a textin a classroom, it is classified as a personal ratherthan educational text, since it is a piece of fictioncomposed for personal rather than for formalinstructional purposes.
33
……………………………………………………………………………………………………………
Reading
Literacy
Sample Question 8 (Multiple Choice)
• Aspect: Developing an interpretation• Text type: Continuous (narration)• Situation: Personal/educational
Why didn’t Bauakas want to be recognised?
A He wanted to see if he would still be obeyed when he was an
“ordinary” person.
B He planned to appear in a case before the judge, disguised as a
merchant.
C He enjoyed disguising himself so he could move about freely and play
tricks on his subjects.
D He wanted to see the judge at work in his usual way, uninfluenced by
the presence of the king.
In Sample Question 8, which is somewhat more difficult, the text states only that the kingexchanged clothes with a merchant and went on horseback to where the judge lived. Thereader must infer the motive for this behaviour from the surrounding text. Seventy per cent ofthe students assessed in the PISA field trial selected alternative D, the correct answer to thisquestion.
Sample Question 9 (Multiple Choice)
• Aspect: Forming a broad understanding• Text type: Continuous (narration)• Situation: Personal/educational
What is this story mainly about?
A Major crimes.
B Wise justice.
C A good ruler.
D A clever trick.
Sample Question 9, of similar difficulty to Sample Question 8, asks students to form a broadunderstanding of the text by identifying the theme or main idea from a list of alternatives.Seventy-two per cent of all students answered it correctly by selecting alternative B.
……………………………………………………………………………………………………………
34
Reading
Literacy
Sample Question 10 (Multiple Choice)
• Aspect: Reflecting on the form• Text type: Continuous (narration)• Situation: Personal/educational
Which one of the following best describes the story?
A A folk tale
B A travel story
C A historical account
D A tragedy
E A comedy
Sample Question 10, which students in the PISA field trial found more difficult, asks studentsto show that they understand not only the content of the story but also something about itsstyle and structure. Sixty-four per cent of all students were able to recognise the rhetoricalstructure of this narrative as a folk tale.
Sample Question 11 (Open-Constructed Response)
• Aspect: Reflecting on the content• Text type: Continuous (narration)• Situation: Personal/educational
Do you think it was fair of the judge to give the same punishment for
all of the crimes? Explain your answer, referring to similarities or
differences between the three crimes.
A full response to Sample Question 11 requires readers to demonstrate an understanding of thecrimes and to support their opinion with some reflective remarks. This calls for more complexreflection on the text and the author’s message conveyed by the story. For example, one type ofcorrect answer might be: “In all three crimes one person wanted to cheat another, so it is fair thatthey were punished in the same way.” Another would be: “No, the crimes are not all equal; it ismuch more serious to want to steal someone’s wife than it is to steal their money or their horse.”
How did the students answer? Examples (See end of chapter for marking scheme)
• “No, some of the crimes were worse than others.” (Score 1)
• “Yes, they all lied.” (Score 1)
• “I don’t think it was fair to have the same punishment because they were all different cases.” (Score 0)
• “No, because there were different circumstances involved.” (Score 0)
• “Yes, all the three cases had a good and bad person, the so-called baddie should’ve been punishedfor doing the wrong thing.” (Score 0)
35
……………………………………………………………………………………………………………
Reading
Literacy
Sample Question 12 (Open-Constructed Response)
• Aspect: Reflecting on the content• Text type: Continuous (narration)• Situation: Personal/educational
For this question you need to compare law and justice in your country
with the law and justice shown in the story.
Question 12A:
In the story crimes are punished under the law. What is another way in
which law and justice in your country are SIMILAR to the kind of law
and justice shown in this story.
Question 12B:
In the story the judge gives fifty strokes of the lash for all the
crimes. Apart from the kind of punishment, what is one way in which law
and justice in your country are DIFFERENT to the kind of law and
justice shown in this story?
In Sample Question 12, students again need to show that they both understand the story and areable to use their outside knowledge – this time to suggest features that are similar and different intheir own legal systems. For example, a correct answer stating a similarity would be: “Both sidesare allowed to give their version of the truth.” Another might be: “The same punishment is oftengiven out for similar crimes.” An incorrect answer might include a vague or inaccurate reference tothe story, or be irrelevant. An example would be: “Even important rulers of countries can bebrought before a judge or taken to court.” The second part of the question, requiring students toreflect on the content by identifying a difference, is marked in the same manner and 33 per centof the students who answered the question got full credit.
How did the students respond? Examples (See end of chapter for marking scheme)
Question 12A:• “That they were taken to court to discuss the outcome.” (Score 1)
• “The justice system in this story has an impartial person to decide the truth, the judge.” (Score 1)
• “A jury helps to decide”. (Score 0)
• “It was the same.” (Score 0)
Question 12B:• “A board of 12 judges – a jury – is used instead of a single judge.” (Score 1)
• “There weren’t any lawyers or a jury.” (Score 1)
• “We do the judging inside the courtroom.” (Score 1)
• “The judges don’t use little “tests” like the just judge.” (Score 1)
• “Don’t wear wigs.” (Score 0)
……………………………………………………………………………………………………………
36
Reading
Literacy
READING UNIT 4
BULLYINGThe following article appeared in a Japanese newspaper in 1996. Refer to it to answer the
questions below.
Only one in three parents polled is awareof bullying involving their children,according to an Education Ministry surveyreleased on Wednesday.
The survey, conducted between December1994 and January 1995, involved some19,000 parents, teachers and children atprimary, junior and senior high schoolswhere bullying has occurred.
The survey, the first of its kind conductedby the Ministry, covered students from thefourth grade up. According to the survey,22 per cent of the primary school childrenpolled said they face bullying, comparedwith 13 per cent of junior high schoolchildren and 4 per cent of senior highschool students.
On the other hand, some 26 per cent of theprimary school children said they havebullied, with the percentage decreasing to20 per cent for junior high school childrenand 6 per cent for senior high schoolstudents.
Of those who replied that they have beenbullies, between 39 and 65 per cent saidthey also have been bullied.
The survey indicated that 37 per cent ofthe parents of bullied primary schoolchildren were aware of bullying targeted
at their children. The figure was 34 per centfor the parents of junior high schoolchildren and 18 per cent for those of thesenior high school students.
Of the parents aware of the bullying, 14 percent to 18 per cent said they had been toldof bullying by teachers. Only 3 per cent to4 per cent of the parents learned of thebullying from their children, according tothe survey.
The survey also found that 42 per cent ofprimary school teachers are not aware ofbullying aimed at their students. Theportion of such teachers was 29 per cent atjunior high schools and 69 per cent at seniorhigh schools.
Asked for the reason behind bullying, about85 per cent of the teachers cited a lack ofeducation at home. Many parents singled outa lack of a sense of justice and compassionamong children as the main reason.
An Education Ministry official said thefindings suggest that parents and teachersshould have closer contact with childrento prevent bullying.
School bullying became a major issue inJapan after 13-year-old Kiyoteru Okouchihanged himself in Nishio, Aichi Prefecture,in the fall of 1994, leaving a note saying
PARENTS LACKING AWARENESS OF BULLYING
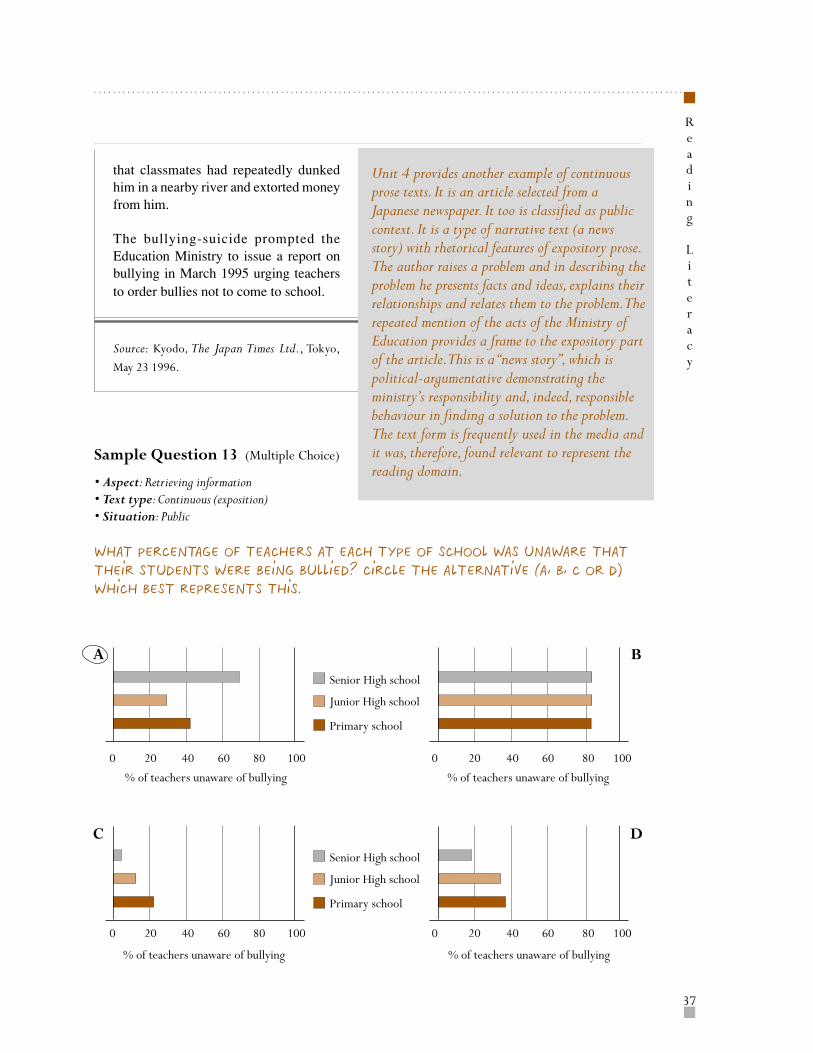
37
……………………………………………………………………………………………………………
Reading
Literacy
Sample Question 13 (Multiple Choice)
• Aspect: Retrieving information• Text type: Continuous (exposition)• Situation: Public
What percentage of teachers at each type of school was unaware that
their students were being bullied? Circle the alternative (A, B, C or D)
which best represents this.
that classmates had repeatedly dunkedhim in a nearby river and extorted moneyfrom him.
The bullying-suicide prompted theEducation Ministry to issue a report onbullying in March 1995 urging teachersto order bullies not to come to school.
Source: Kyodo, The Japan Times Ltd., Tokyo,
May 23 1996.
A B
C D
% of teachers unaware of bullying
% of teachers unaware of bullying % of teachers unaware of bullying
% of teachers unaware of bullying
0 20 40 60 80 100 0 20 40 60 80 100
0 20 40 60 80 100 0 20 40 60 80 100
Primary school
Junior High school
Senior High school
Primary school
Junior High school
Senior High school
Unit 4 provides another example of continuousprose texts. It is an article selected from aJapanese newspaper. It too is classified as publiccontext. It is a type of narrative text (a newsstory) with rhetorical features of expository prose.The author raises a problem and in describing theproblem he presents facts and ideas, explains theirrelationships and relates them to the problem. Therepeated mention of the acts of the Ministry ofEducation provides a frame to the expository partof the article. This is a “news story”, which ispolitical-argumentative demonstrating theministry’s responsibility and, indeed, responsiblebehaviour in finding a solution to the problem.The text form is frequently used in the media andit was, therefore, found relevant to represent thereading domain.
……………………………………………………………………………………………………………
38
Reading
Literacy
Sample Question 13 requires students to retrieve information that is literally stated inthe news article. In order to answer the question correctly, students need to locate theinformation stated in the paragraph beginning “The survey found that 42 per cent ofteachers...” and match it with one of the four alternatives provided in the question. Thequestion was answered correctly by 73 per cent of all students in the PISA field trial. Itis made more difficult by the fact that information given in a continuous text has to bematched with a question expressed in graphic, that is, non-continuous form.
Sample Question 14 (Open-Constructed Response)
• Aspect: Developing an interpretation• Text type: Continuous (exposition)• Situation: Public
Why does the article mention the death of Kiyoteru Okouchi?
Sample Question 14 appears to be slightly easier (answered correctly by 84 per cent ofall students in the PISA field trial). Students are again asked to demonstrate their skillat developing an interpretation. In order to provide a correct answer, students need to beable to link together information contained in the last two paragraphs. They are againasked to demonstrate their skill at interpretation by showing that they can follow thelogical organisation and presentation of ideas within a text. It is worth noting that inSample Question 8 (“A Just Judge”), a multiple-choice format is used to obtain evidenceabout students’ skill at developing an interpretation, while in Sample Question 14evidence of this skill is gathered through the constructed response format, by askingstudents to generate a short statement connecting the student’s suicide death directly tothe increased awareness of bullying and the public’s concern for this type of behaviour inJapanese schools.
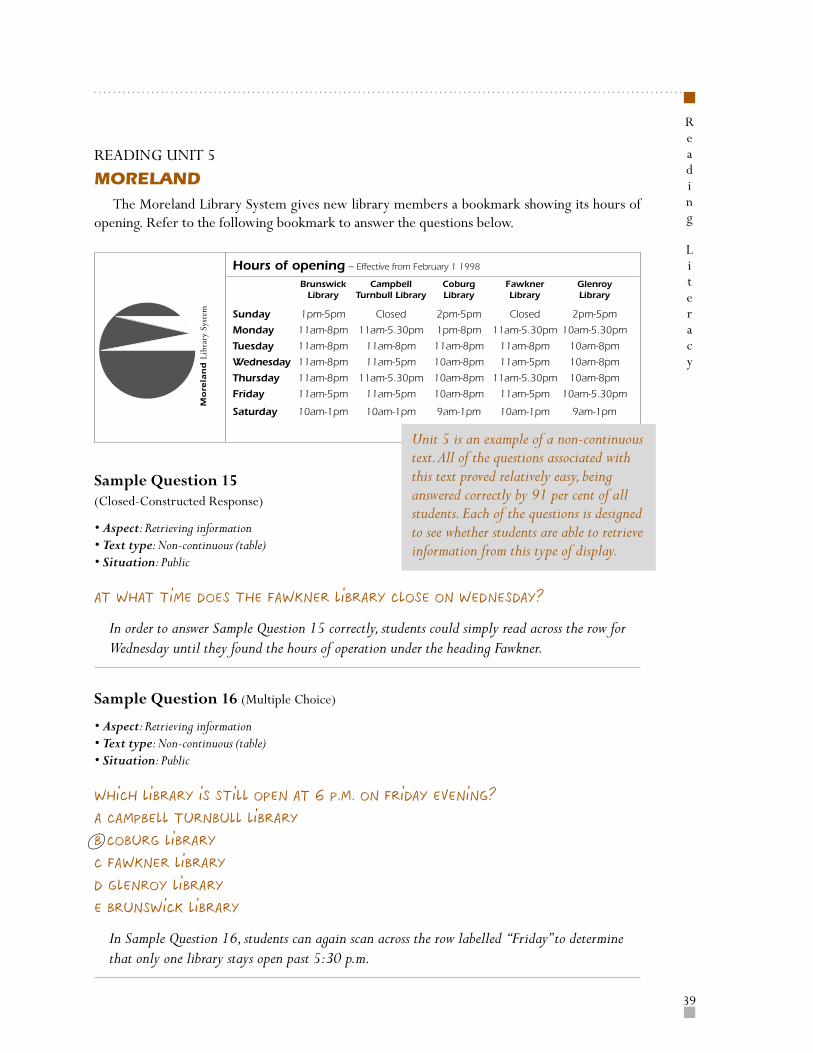
39
……………………………………………………………………………………………………………
Reading
Literacy
READING UNIT 5
MORELANDThe Moreland Library System gives new library members a bookmark showing its hours of
opening. Refer to the following bookmark to answer the questions below.
Sample Question 15(Closed-Constructed Response)
• Aspect: Retrieving information• Text type: Non-continuous (table)• Situation: Public
At What time does the Fawkner Library close on Wednesday?
In order to answer Sample Question 15 correctly, students could simply read across the row forWednesday until they found the hours of operation under the heading Fawkner.
Sample Question 16 (Multiple Choice)
• Aspect: Retrieving information• Text type: Non-continuous (table)• Situation: Public
Which library is still open at 6 p.m. on Friday evening?
A Campbell Turnbull Library
B Coburg Library
C Fawkner Library
D Glenroy Library
E Brunswick Library
In Sample Question 16, students can again scan across the row labelled “Friday” to determinethat only one library stays open past 5:30 p.m.
Hours of opening – Effective from February 1 1998
Brunswick Campbell Coburg Fawkner GlenroyLibrary Turnbull Library Library Library Library
Sunday 1pm-5pm Closed 2pm-5pm Closed 2pm-5pm
Monday 11am-8pm 11am-5.30pm 1pm-8pm 11am-5.30pm 10am-5.30pm
Tuesday 11am-8pm 11am-8pm 11am-8pm 11am-8pm 10am-8pm
Wednesday 11am-8pm 11am-5pm 10am-8pm 11am-5pm 10am-8pm
Thursday 11am-8pm 11am-5.30pm 10am-8pm 11am-5.30pm 10am-8pm
Friday 11am-5pm 11am-5pm 10am-8pm 11am-5pm 10am-5.30pm
Saturday 10am-1pm 10am-1pm 9am-1pm 10am-1pm 9am-1pm
Unit 5 is an example of a non-continuoustext. All of the questions associated withthis text proved relatively easy, beinganswered correctly by 91 per cent of allstudents. Each of the questions is designedto see whether students are able to retrieveinformation from this type of display.
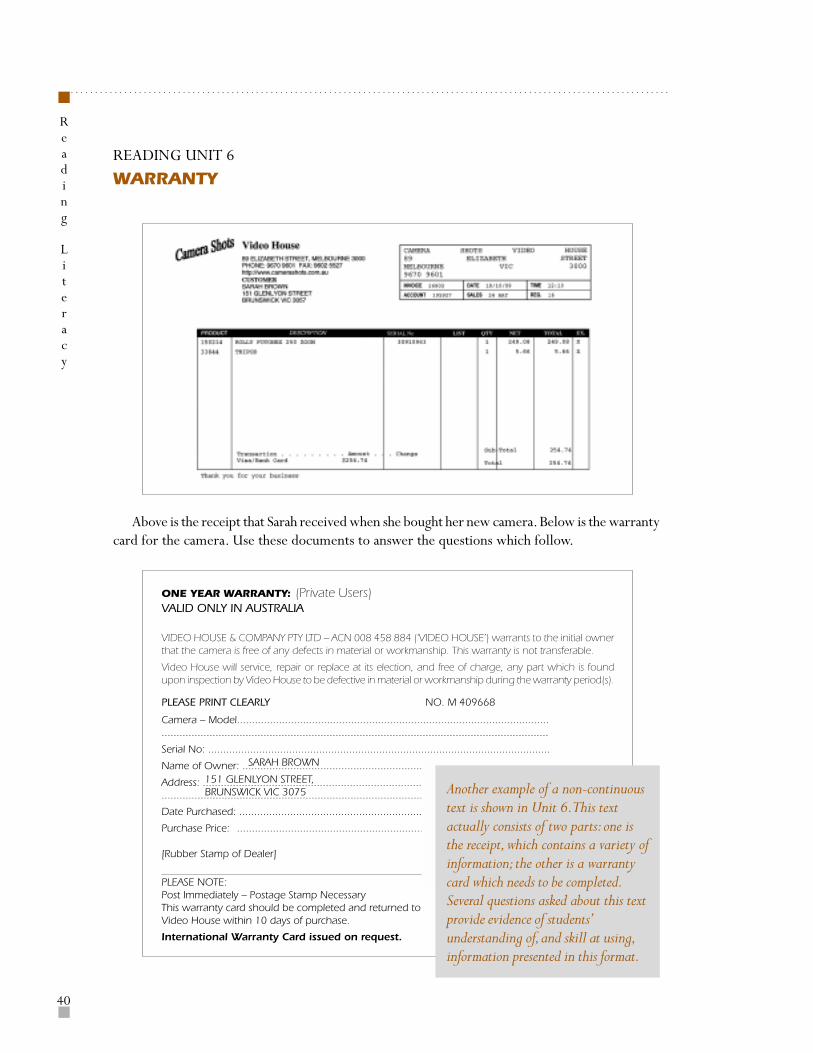
……………………………………………………………………………………………………………
40
Reading
Literacy
ONE YEAR WARRANTY: (Private Users)VALID ONLY IN AUSTRALIA
VIDEO HOUSE & COMPANY PTY LTD – ACN 008 458 884 (‘VIDEO HOUSE’) warrants to the initial ownerthat the camera is free of any defects in material or workmanship. This warranty is not transferable.
Video House will service, repair or replace at its election, and free of charge, any part which is foundupon inspection by Video House to be defective in material or workmanship during the warranty period(s).
PLEASE PRINT CLEARLY NO. M 409668
Camera – Model.........................................................................................................................................................................................................................................
Serial No: ..................................................................................................................
Name of Owner: .......................................................................................................
Address: .....................................................................................................................................................................................................................................................
Date Purchased: .......................................................................................................
Purchase Price: .........................................................................................................
[Rubber Stamp of Dealer]
PLEASE NOTE:Post Immediately – Postage Stamp NecessaryThis warranty card should be completed and returned toVideo House within 10 days of purchase.
International Warranty Card issued on request.
READING UNIT 6
WARRANTY
Above is the receipt that Sarah received when she bought her new camera. Below is the warrantycard for the camera. Use these documents to answer the questions which follow.
Another example of a non-continuoustext is shown in Unit 6. This textactually consists of two parts: one isthe receipt, which contains a variety ofinformation; the other is a warrantycard which needs to be completed.Several questions asked about this textprovide evidence of students’understanding of, and skill at using,information presented in this format.
SARAH BROWN
151 GLENLYON STREET,BRUNSWICK VIC 3075
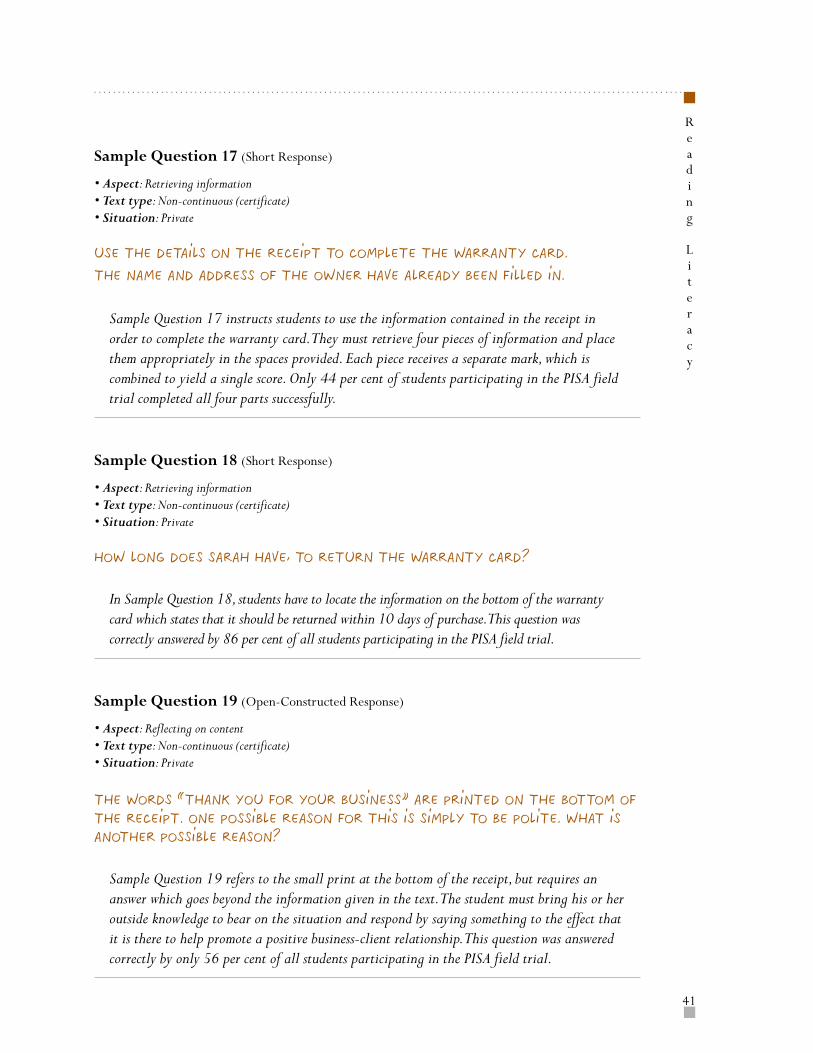
41
……………………………………………………………………………………………………………
Reading
Literacy
Sample Question 17 (Short Response)
• Aspect: Retrieving information• Text type: Non-continuous (certificate)• Situation: Private
Use the details on the receipt to complete the warranty card.
The name and address of the owner have already been filled in.
Sample Question 17 instructs students to use the information contained in the receipt inorder to complete the warranty card. They must retrieve four pieces of information and placethem appropriately in the spaces provided. Each piece receives a separate mark, which iscombined to yield a single score. Only 44 per cent of students participating in the PISA fieldtrial completed all four parts successfully.
Sample Question 18 (Short Response)
• Aspect: Retrieving information• Text type: Non-continuous (certificate)• Situation: Private
How long does Sarah have, to return the warranty card?
In Sample Question 18, students have to locate the information on the bottom of the warrantycard which states that it should be returned within 10 days of purchase. This question wascorrectly answered by 86 per cent of all students participating in the PISA field trial.
Sample Question 19 (Open-Constructed Response)
• Aspect: Reflecting on content• Text type: Non-continuous (certificate)• Situation: Private
The words “Thank you for your business” are printed on the bottom of
the receipt. One possible reason for this is simply to be polite. What is
another possible reason?
Sample Question 19 refers to the small print at the bottom of the receipt, but requires ananswer which goes beyond the information given in the text. The student must bring his or heroutside knowledge to bear on the situation and respond by saying something to the effect thatit is there to help promote a positive business-client relationship. This question was answeredcorrectly by only 56 per cent of all students participating in the PISA field trial.
……………………………………………………………………………………………………………
42
Reading
Literacy
SCORING SCHEME FOR THE READING SAMPLE QUESTIONS
READING UNIT 1 – BEES
Sample Question 1
Score 1: Response option D – To indicate where the foragers have found food.
Score 0: Other.
Sample Question 2
Score 1: Response option A – The proportion of water in the substance.
Score 0: Other.
Sample Question 3
Score 2: Answers which indicate that information is given BOTH by the shaking of theabdomen AND by the length of time for which the abdomen is shaken, for example:
• “How long the bee shakes her abdomen for.”
Score 1: Answers which mention the shaking of the abdomen only. (Answer may be partlyinaccurate.) For example:
• “She shakes her abdomen.”• “She shows how far it is by how fast she shakes her abdomen.”
Score 0: Irrelevant, inaccurate, incomplete or vague answers, for example:
• “How fast the bee runs around in the figure 8.”• “How big the figure 8 is.”• “How the bee moves.”• “The dance.”• “The abdomen.”
Sample Question 4
Score 1: (in any order from among the following): abc, abe, bde.
a: fruit treesb: cloverc: flowering treesd: treese: flowers
Score 0: Other.
43
……………………………………………………………………………………………………………
Reading
Literacy
READING UNIT 2 – IN POOR TASTE
Sample Question 5
Score 1: Response option A – Guilt.
Score 0: Other.
Sample Question 6
Score 1: Answers of type a or b:
a. Answers which provide a statement or sentence indicating that government orindividuals should spend more on (overseas) aid, for example:• “People donating money to overseas aid.”• “Donating money to charities.”• “People should spend less on chocolate and more on the poor.”
b. Answers which provide a statement or sentence indicating that government orindividuals should change their priorities or awareness, for example:• “Change our priorities.”• “He would like people to raise their awareness about how we spend our resources.”
Score 0: Answers of type c, d or e:
c. Answers that identify the writer’s strategy, to make the reader feel guilty.• “Feel guilty / ashamed.”
d. Answers which provide a statement or sentence indicating that less should be spent onchocolate or be less greedy, for example:• “Not buy any more chocolate.”• “Stop eating junk food.”
e. Other, including vague, inappropriate or irrelevant, for example:
• “Spend more on charities.”• “He would like the government to be sacked.”• “He would like people to say, ‘I will donate all my money to charity.’”• “I don’t agree with Arnold Jago.”• “Agree with him.”
READING UNIT 3 – A JUST JUDGE
Sample Question 7
Score 1: Response option D – By testing her skill in work that she needed to perform for herhusband.
Score 0: Other.
Sample Question 8
Score 1: Response option D – He wanted to see the judge at work in his usual way,uninfluenced by the presence of the king.
Score 0: Other.
……………………………………………………………………………………………………………
44
Reading
Literacy
Sample Question 9
Score 1: Response option B – Wise justice.
Score 0: Other.
Sample Question 10
Score 1: Response option A – A folk tale.
Score 0: Other.
Sample Question 11
Score 1: Answers of type a:
a. Evaluates the fairness of the punishments in relation to each other, in terms ofsimilarity or difference between offences. Shows accurate understanding of the crimes.For example:
• “No, it is a much more serious crime to try to steal someone’s wife than to steal theirmoney or their horse.”
• “All three criminals tried to cheat someone and then lied about it, so it was fair thatthey were punished in the same way.”
• “It’s hard to say. The peasant, the oil merchant and the beggar all wanted to stealsomething. On the other hand, the things they wanted to steal were not equallyvaluable.”
Score 0: Other, including answers of type b, c or d:
b. Shows accurate understanding of the crimes and/or the punishments withoutevaluating them. For example:
• “The judge gave fifty strokes to the three criminals. Their crimes were stealing awoman, stealing money and stealing a horse.”
c. Demonstrates a misunderstanding of the crimes or the punishments. For example:
• “I think the case of the peasant and the scholar was different from the other twobecause it was more like a divorce, while the other two were thefts. So the peasantshould not have been punished.”
d. Agrees or disagrees without explanation or with inadequate explanation. May evaluatethe fairness of the punishment per se (i.e. answers as if the question were, “Is fiftystrokes of the lash a just punishment?”). For example:
• “No, fifty lashes are much too harsh a punishment for any of these crimes.”
• “Yes, severe punishments are necessary because that way the criminal won’t try to doit again.”
• “No, I don’t think the punishments were harsh enough.”
• “He was too severe.”
• “Yes, I think it was fair.”
45
……………………………………………………………………………………………………………
Reading
Literacy
Sample Question 12
Question 12A:
Score 1: Describes one similarity. Shows accurate comprehension of the story. Comparisonwith a feature of the national legal system is either explicitly stated or may be readily inferred.Accurate knowledge of national legal systems is not essential, but take into account whatbackground knowledge about the law in your country it would be reasonable to expect of a15-year-old. For example:
• “Rulings are made on evidence.”• “Both sides are allowed to give their version of the truth.”• “Equality before the law (it doesn’t matter who you are).”• “There is a judge presiding over the court.”• “The same punishment is given for similar offences.”
Score 0: Other, including vague, inaccurate and irrelevant answers.
• “Don’t know right from wrong.”• “Even important rulers of countries can be called to court.”• “Punishment.” [excluded by the question]
Question 12B:
Score 1: Describes one difference. Shows accurate comprehension of the story. Comparisonwith a feature of the national legal system is either explicitly stated or may be readily inferred.Accurate knowledge of national legal systems is not essential. (For example “no jury” may beaccepted as a “difference”, although in some legal systems there is no jury.) Take into accountwhat background knowledge about the law in your country it would be reasonable to expect of a15-year-old. Examples are:
• “No lawyers.”• “Judge carries out his own investigation.”• “It’s very quick, whereas in modern courts usually cases take weeks.”• “No jury; there doesn’t seem to be any way of appealing.”• “The punishment is much harsher.” [a qualitative comment on the kind of punishment]• “The same punishment is given regardless of the offence.”
Score 0: Other, including vague, inaccurate and irrelevant answers.
• “Punishment.”• “Old fashioned.”• “Court system.”• “People do not receive the lash.” [excluded by question]
READING UNIT 4 – BULLYING
Sample Question 13
Score 1: Response option A – A (letter A or graph A).
Score 0: Other.
……………………………………………………………………………………………………………
46
Reading
Literacy
Sample Question 14
Score 1: Answers which relate bullying (and the suicide) to public concern and/or to thesurvey. The connection may be explicitly stated or readily inferred. Possible answers are:
• “To explain why the survey was conducted.”• “To give the background to why people are so concerned about bullying in Japan.”• “He was a boy who committed suicide because of bullying.”• “To show how far bullying can go.”• “It was an extreme case.”
Score 0: Vague or inaccurate answers:
• “He was a Japanese schoolboy.”• “There are many cases like this all over the world.”
READING UNIT 5 – MORELAND
Sample Question 15
Score 1: 5 p.m. or 5 o’clock or 17.00.
Score 0: Other.
Sample Question 16
Score 1: Response option B – Coburg Library.
Score 0: Other.
READING UNIT 6 – WARRANTY
Sample Question 17
• 1a (model)Score 1: Answers which correctly identify the model:
Rolly Fotonex 250 zoom.Rolly Fotonex.Fotonex.
Score 0: Other.
• 1b (serial number)
Score 1: 30910963.Score 0: Other.
• 1c (date of purchase)
Score 1: 18/10/99.Score 0: Other.
47
……………………………………………………………………………………………………………
Reading
Literacy
• 1d (purchase price)
Score 1: ($) 249.08.
Score 0: Other. For example: ($) 254.74.
Sample Question 18
Score 1: Answers which indicate 10 days or ten days. For example:• “Within 10 days of purchase.”
Score 0: Other.
Sample Question 19
Score 1: Answers which refer either explicitly or implicitly to the development of the business-customer relationship. For example:
• “It’s good for business to be nice to you.”• “To create a good relationship with the customer.”• “They want you to come back.”
Score 0: Other. For example:
• “They’re being polite.”• “They’re glad you bought the camera from them.”• “They want you to feel special.”• “To let the customers know they are appreciated.”

MATHEMATICAL
LITERACY
2
……………………………………………………………………………………………………………
50
Mathematical
Literacy
ASSESSING MATHEMATICAL LITERACY IN PISA
The PISA definition of mathematicalliteracy and its context
Mathematical literacy is defined in PISA as:
the capacity to identify, to understand,and to engage in mathematics andmake well-founded judgements aboutthe role that mathematics plays, asneeded for an individual’s current andfuture private life, occupational life,social life with peers and relatives, andlife as a constructive, concerned, andreflective citizen.
Several aspects of this definition have specificmeaning in the PISA context. As with reading,the definition revolves around wider uses inpeople’s lives rather than simply carrying outmechanical operations. The term “literacy” istherefore used to indicate the ability to putmathematical knowledge and skill to functionaluse rather than just to master it within a schoolcurriculum.
In the PISA definition, to “engage in”mathematics covers not simply physical or socialactions (such as working out how much changeto give someone in a shop) but also wider uses,including taking positions towards andappreciating things (such as having an opinionabout the government’s spending plans).
Mathematical literacy also implies the abilityto pose and solve mathematical problems in avariety of contexts, as well as the inclination todo so, which often relies on personal traits suchas self-confidence and curiosity.
Three dimensions of mathematicalliteracy
To transform this definition into anassessment of mathematical literacy, three broaddimensions have been identified. These are:
• Processes: the focus is on students’ abilitiesto analyse, reason and communicate ideaseffectively by posing, formulating andsolving mathematical problems. Processesare divided into three classes: reproduction,definitions and computations; connectionsand integration for problem solving; andmathematisation, mathematical thinking andgeneralisation.
• Content: PISA emphasises broadmathematical themes such as change andgrowth, space and shape, chance, quantita-tive reasoning, and uncertainty and depend-ency relationships.
• Context: an important aspect ofmathematical literacy is doing and usingmathematics in a variety of situations,including personal life, school life, workand sports, local community and society.
Mathematical processes
PISA tasks are designed to encompass a setof general mathematical processes that aremeant to be relevant and pertinent to alleducational levels:
1. Mathematical thinking, which includes:
– posing questions characteristic ofmathematics (“Is there...?”, “If so, howmany?”, “How do we find...?”);
– knowing the kinds of answers thatmathematics offers to such questions;
– distinguishing between different kindsof statements (definitions, theorems,
51
……………………………………………………………………………………………………………
Mathematical
Literacy
conjectures, hypotheses, examples,conditioned assertions);
– understanding and handling the extentand limits of given mathematical concepts.
2. Mathematical argumentation, whichincludes:
– knowing what mathematical proof is andhow it differs from other kinds ofmathematical reasoning;
– following and assessing chains of math-ematical arguments of different types;
– possessing a feel for heuristics (“whatcan(not) happen, and why”), andcreating mathematical arguments.
3. Modelling, which includes:
– structuring the field or situation to bemodelled;
– mathematising (that is translating from“reality” to “mathematics”);
– de-mathematising (that is interpretingmathematical models in terms of “reality”);
– tackling the model (working within themathematics domain);
– validating the model;
– reflecting, analysing, offering a critiqueof models and their results;
– communicating about the model and itsresults (including the limitations of suchresults);
– monitoring and controlling themodelling process.
4. Problem posing and solving, whichincludes:
– posing and formulating mathematicalproblems;
– solving different kinds of mathematicalproblems, in a variety of ways.
5. Representation, which includes:
– decoding, interpreting and distinguish-ing between different forms of repre-
sentation of mathematical objects andsituations, and the interrelationsbetween the various representations;
– choosing, and switching between,different forms of representation,according to situation and purpose.
6. Symbols and formalism, which includes:
– decoding and interpreting symbolic andformal language and understanding itsrelationship to natural language;
– translating from natural language tosymbolic/formal language;
– handling statements and expressionscontaining symbols and formulae;
– using variables, solving equations andunderstanding calculations.
7. Communication, which includes:
– expressing oneself, in a variety of ways,on matters with a mathematical compo-nent, in oral as well as in written form;
– understanding others’ written or oralstatements about such matters.
8. Aids and tools, which includes:
– knowing about, and being able to makeuse of, various aids and tools (includinginformation technology tools) that mayassist mathematical activity;
– knowing about the limitations of suchaids and tools.
PISA does not use test items that assess theabove skills individually. When doing “real math-ematics” it is necessary to draw simultaneouslyupon many of these skills.
In order to describe levels of mathematicalcompetency, PISA organises processes intothree classes, defining the type of thinking skillneeded: i) reproduction, definitions andcomputations; ii) connections and integration forproblem solving; and iii) mathematisation,
……………………………………………………………………………………………………………
52
Mathematical
Literacy
mathematical thinking, generalisation andinsight. In general, these processes are inascending order of difficulty, but it does notfollow that one must be mastered in order toprogress to the other: it is possible for exampleto engage in mathematical thinking withoutbeing good at computations.
1. Competency Class 1: Reproduction,definitions and computations
Class 1 covers processes assessed in manystandardised tests, as well in comparativeinternational studies, operationalised mainlyin multiple-choice format. It deals withknowledge of facts, representing,recognising equivalents, recallingmathematical objects and properties,performing routine procedures, applyingstandard algorithms and developingtechnical skills.
2. Competency Class 2: Connections andintegration for problem solving
Class 2 processes start making connectionsbetween the different strands and domainsin mathematics, and integrate informationin order to solve simple problems. Althoughthe problems are supposedly non-routine,they require relatively minor degrees ofmathematisation.
Within this competency class students arealso expected to handle different aspects ofrepresentation, according to situation andpurpose. Connections also require studentsto be able to distinguish and relate differentstatements such as definitions, claims, exam-ples, conditioned assertions and proofs.Decoding and interpreting symbolic andformal language, and understanding its rela-tionship to natural language, form anotheraspect of this class. In this class, the problemsare often placed within a context, and engagestudents in mathematical decision making.
3. Competency Class 3: Mathematisation,mathematical thinking, generalisation andinsight
In this competency class students are askedto mathematise situations: to recognise andextract the mathematics embedded in thesituation and use mathematics to solve theproblem, analyse, interpret, develop theirown models and strategies, and makemathematical arguments, including proofsand generalisations.
These processes involve critical thinking,analysis and reflection. Students should notonly be able to solve problems but also topose problems, to communicate solutionsappropriately, and to have insight into thenature of mathematics as a science.
This level, which goes to the heart ofmathematics and mathematical literacy, isdifficult to test. The multiple-choiceformat for test items is usually inadequate.Questions with open-ended answers aremore suitable, but both the design of suchquestions and the marking of answers aredifficult.
Mathematical content: strands and “bigideas”
School mathematics curricula are usuallyorganised in strands. These strandscompartmentalise mathematics and often over-emphasise computation and formulae. At thebeginning of the 20th century, mathematicscould reasonably be regarded as consisting ofsome twelve distinct subjects: arithmetic,geometry, algebra, calculus, and so on. Today,however, between sixty and seventy distinctsubjects would be a reasonable figure. Somesubjects, such as algebra or topology, have splitinto various sub-fields; others, such ascomplexity theory or dynamic systems theory,are completely new areas of study. To be
53
……………………………………………………………………………………………………………
Mathematical
Literacy
relevant, mathematics must reflect the complexpatterns in the world around us.
For these and other reasons, PISA took adifferent approach and organised contentaround cross-cutting mathematical themes,referred to as “big ideas”. For the purpose ofPISA, a selection of big ideas has been madethat offers sufficient variety and depth to revealthe essentials of mathematics and that relatesto the traditional curricular strands. Thefollowing list of mathematical big ideas meetsthis requirement: change and growth; space andshape; quantitative reasoning; uncertainty; anddependency and relationships.
In PISA 2000, the focus is on the first twoof these big ideas. They allow a wide range ofaspects of the curriculum to be represented,without giving undue weight to number skills.
1. Change and growth
Every natural phenomenon is amanifestation of change. Examples ofchange include the growth of organisms,the cycle of seasons, the ebb and flow oftides, cycles in unemployment levels andthe Dow-Jones index. Some growthprocesses can be described or modelled bystraightforward mathematical functions:linear, exponential, periodic, logistic,either discrete or continuous. But manyprocesses fall into different categories anddata analysis is quite often essential.Observing patterns of change in natureand in mathematics is therefore notconfined to par ticular par ts of thecurriculum such as algebra.
PISA examines students’ ability to representchanges in a comprehensible form, tounderstand the fundamental types of change,to recognise particular types of change whenthey occur, to apply these techniques to the
outside world, and to cope with a changingworld to our best advantage.
Many sub-strands of traditionalmathematics curricula are involved in tasksof this type. They include, for example,relations, functions and gradients.Considering rates of growth for differentgrowth phenomena leads to linear,exponential, logarithmic, periodic, logisticgrowth curves and their properties andrelations. These, in turn, lead to aspects ofnumber theory. The connections betweenthese ideas and geometrical representationscan also play a role.
Growth patterns can be expressed inalgebraic forms, which in turn can berepresented by graphs. Growth can also bemeasured empirically, and questions ariseas to what inferences can be made fromthe growth data, how the growth datamight be represented, and so on. Dataanalysis and statistics are relevantcurricular strands here.
2. Space and shape
Patterns are encountered everywherearound us: spoken words, music, video,traffic, constructions and art. Shapes arepatterns: houses, churches, bridges, starfish,snowflakes, town plans, clover leaves,crystals and shadows.
In understanding space and shape, studentsneed to look for similar ities anddifferences as they analyse the componentsof form and recognise shapes in differentrepresentations and different dimensions.This means that they must be able tounderstand the relative positions ofobjects. They must be aware of how wesee things and why we see them as we do.They must learn to navigate through spaceand through constructions and shapes.
……………………………………………………………………………………………………………
54
Mathematical
Literacy
Students should therefore be able tounderstand the relations between shapes andimages or visual representations, such as thatbetween a real city and photographs andmaps of the same city. They must alsounderstand how three-dimensional objectscan be represented in two dimensions, howshadows are formed and must beinterpreted, what “perspective” is and howit functions. Described in this way, the studyof space and shape is open-ended anddynamic, and fits well both intomathematical literacy and into themathematical competencies defined for thisstudy.
In PISA 2000, testing time will be evenlydistributed between the two big ideas: changeand growth and space and shape. In some itemsat least, marks will not only be awarded for the“correct” answer but also for the differentstrategies used by students to solve the testitems.
Situations and contexts
Students’ mathematical insight and under-standing need to be assessed in a variety ofsituations, partly to minimise the chance ofstudents finding that tasks are not culturallyrelevant.
One can think of a situation as being at acertain distance from the student. The closestis private life (daily life), next is school life, workand sports, followed by the local communityand society as encountered in daily life, andfurthest away are scientific contexts. In this wayone can define a more or less continuous scaleof situations.
It is not always clear to what extent thestudents, performances are affected by theirdistance from the situations. We cannot say that“closer” contexts are necessarily more attractive
for students, or better suited than morescientific contexts. Indeed, some expertsbelieve that familiarity with the context can bea hindrance, while research suggests that boysdo better on experiential knowledge ofnumbers and measures from the daily worldwhile girls perform better on items where astandard procedure is needed. Secondary schoolstudents appear to have less need for apersonally relevant context than primary schoolchildren.
Whatever the distance from the students,PISA aims to ensure that tasks are based on“authentic” contexts which are likely to occurin a real-world setting. If mathematics educationis to prepare students to be active and informedcitizens it has to deal with “real” contexts suchas pollution problems, traffic safety andpopulation growth. This does not exclude,however, artificial fictional contexts based onthe stylised representation of problems – suchas a traffic situation in a non-existent town.
Format of test questions andmarking
PISA will assess mathematical literacythrough a combination of item formats. Sometasks are assessed through multiple-choicequestions, typically those associated withsimpler mathematical processes.
Open-ended items are preferred forassessing higher-order mathematical processes.Such items often require students to show thesteps taken or to explain how the answer wasreached. They allow students to demonstratetheir level of ability by providing solutions of arange of mathematical complexity.Furthermore, since these responses givevaluable information about students’ ideas andthinking, which can be fed back into curriculumplanning, the marking guides for items includedin the main study were designed to include a
55
……………………………………………………………………………………………………………
Mathematical
Literacy
system of two-digit marking so that thefrequency of various types of correct andincorrect response can be recorded. It isimportant to note that markers are advised toignore spelling and grammar errors, unless theycompletely obscure the meaning, because thisis not a test of written expression. The PISAmarking scheme for open-ended items is shownat the end of this chapter.
Sample questions
The following examples illustrate the rangeof tasks and questions used in the PISAassessment of mathematical literacy. These itemswere used in the PISA field trial but not selectedfor the PISA 2000 assessment because of theirsimilarity to other item sets in terms of whatthey measure. The intention in presenting thesetasks and questions is to demonstrate theconnection between the PISA assessmentframework and the items that were constructedto represent it.
Since the PISA 2000 assessment was notcompleted by the time this publication wasproduced, items from the PISA 2000 tests couldnot be included in this publication for reasonsof test security.
As will be evident from the examplesshown here, it is not always easy to matchitems neatly to the dimensions of mathemat-ics given in the PISA framework. In particu-lar, the three competency classes are notintended to form a strict hierarchy since thecompetencies used to solve a given problemwill vary from student to student. Mathemati-cal problems are also frequently not specificto particular situations.
…………
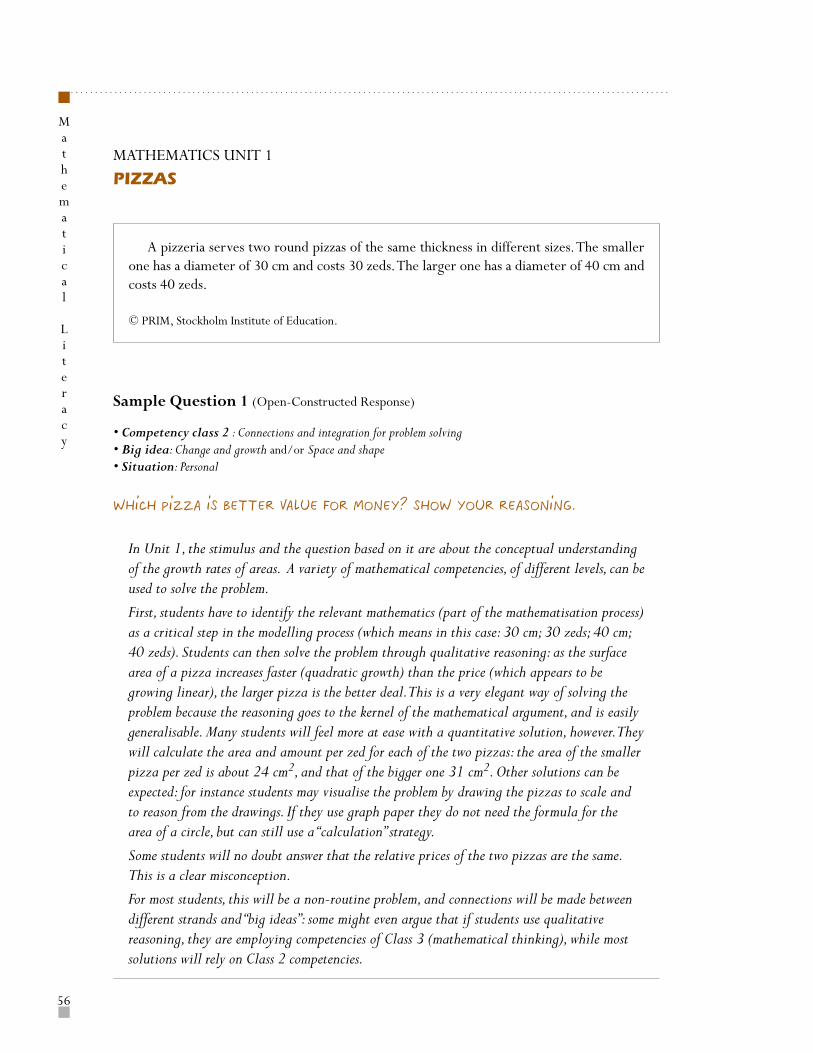
……………………………………………………………………………………………………………
56
Mathematical
Literacy
MATHEMATICS UNIT 1
PIZZAS
A pizzeria serves two round pizzas of the same thickness in different sizes. The smallerone has a diameter of 30 cm and costs 30 zeds. The larger one has a diameter of 40 cm andcosts 40 zeds.
© PRIM, Stockholm Institute of Education.
Sample Question 1 (Open-Constructed Response)
• Competency class 2 : Connections and integration for problem solving• Big idea: Change and growth and/or Space and shape• Situation: Personal
Which pizza is better value for money? Show your reasoning.
In Unit 1, the stimulus and the question based on it are about the conceptual understandingof the growth rates of areas. A variety of mathematical competencies, of different levels, can beused to solve the problem.
First, students have to identify the relevant mathematics (part of the mathematisation process)as a critical step in the modelling process (which means in this case: 30 cm; 30 zeds; 40 cm;40 zeds). Students can then solve the problem through qualitative reasoning: as the surfacearea of a pizza increases faster (quadratic growth) than the price (which appears to begrowing linear), the larger pizza is the better deal. This is a very elegant way of solving theproblem because the reasoning goes to the kernel of the mathematical argument, and is easilygeneralisable. Many students will feel more at ease with a quantitative solution, however. Theywill calculate the area and amount per zed for each of the two pizzas: the area of the smallerpizza per zed is about 24 cm2, and that of the bigger one 31 cm2. Other solutions can beexpected: for instance students may visualise the problem by drawing the pizzas to scale andto reason from the drawings. If they use graph paper they do not need the formula for thearea of a circle, but can still use a “calculation” strategy.
Some students will no doubt answer that the relative prices of the two pizzas are the same.This is a clear misconception.
For most students, this will be a non-routine problem, and connections will be made betweendifferent strands and “big ideas”: some might even argue that if students use qualitativereasoning, they are employing competencies of Class 3 (mathematical thinking), while mostsolutions will rely on Class 2 competencies.
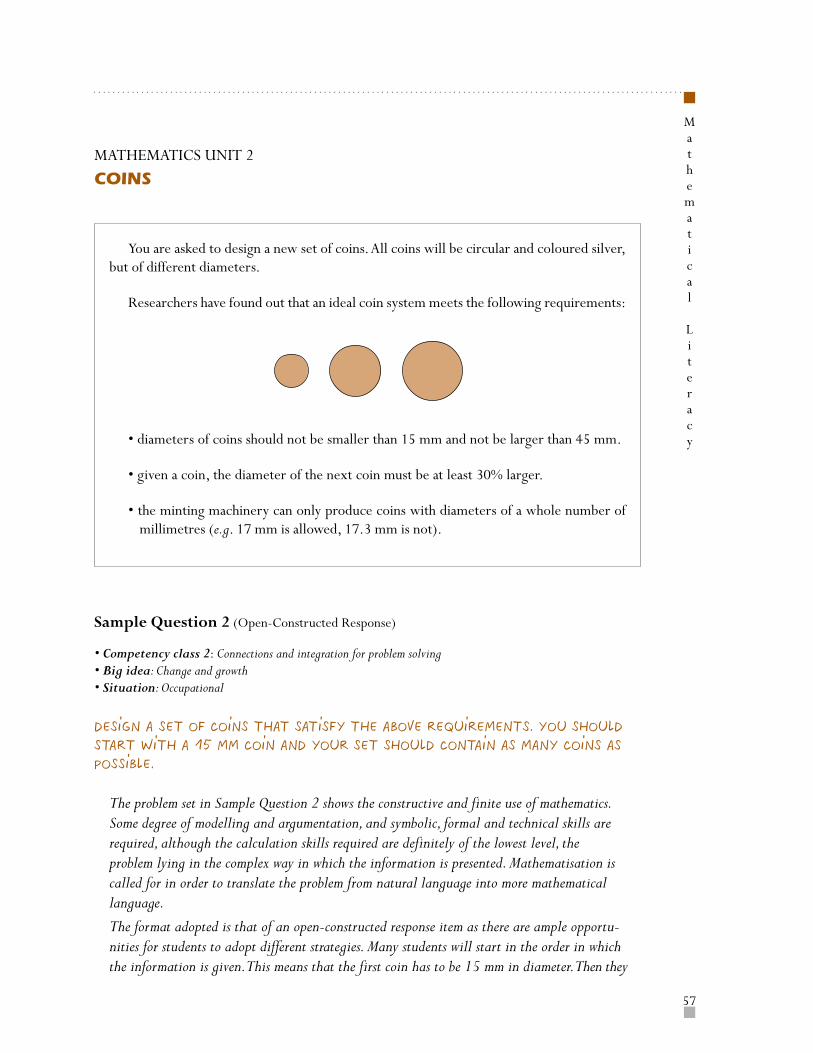
57
……………………………………………………………………………………………………………
Mathematical
Literacy
You are asked to design a new set of coins. All coins will be circular and coloured silver,but of different diameters.
Researchers have found out that an ideal coin system meets the following requirements:
• diameters of coins should not be smaller than 15 mm and not be larger than 45 mm.
• given a coin, the diameter of the next coin must be at least 30% larger.
• the minting machinery can only produce coins with diameters of a whole number ofmillimetres (e.g. 17 mm is allowed, 17.3 mm is not).
MATHEMATICS UNIT 2
COINS
Sample Question 2 (Open-Constructed Response)
• Competency class 2: Connections and integration for problem solving• Big idea: Change and growth• Situation: Occupational
Design a set of coins that satisfy the above requirements. You should
start with a 15 mm coin and your set should contain as many coins as
possible.
The problem set in Sample Question 2 shows the constructive and finite use of mathematics.Some degree of modelling and argumentation, and symbolic, formal and technical skills arerequired, although the calculation skills required are definitely of the lowest level, theproblem lying in the complex way in which the information is presented. Mathematisation iscalled for in order to translate the problem from natural language into more mathematicallanguage.
The format adopted is that of an open-constructed response item as there are ample opportu-nities for students to adopt different strategies. Many students will start in the order in whichthe information is given. This means that the first coin has to be 15 mm in diameter. Then they
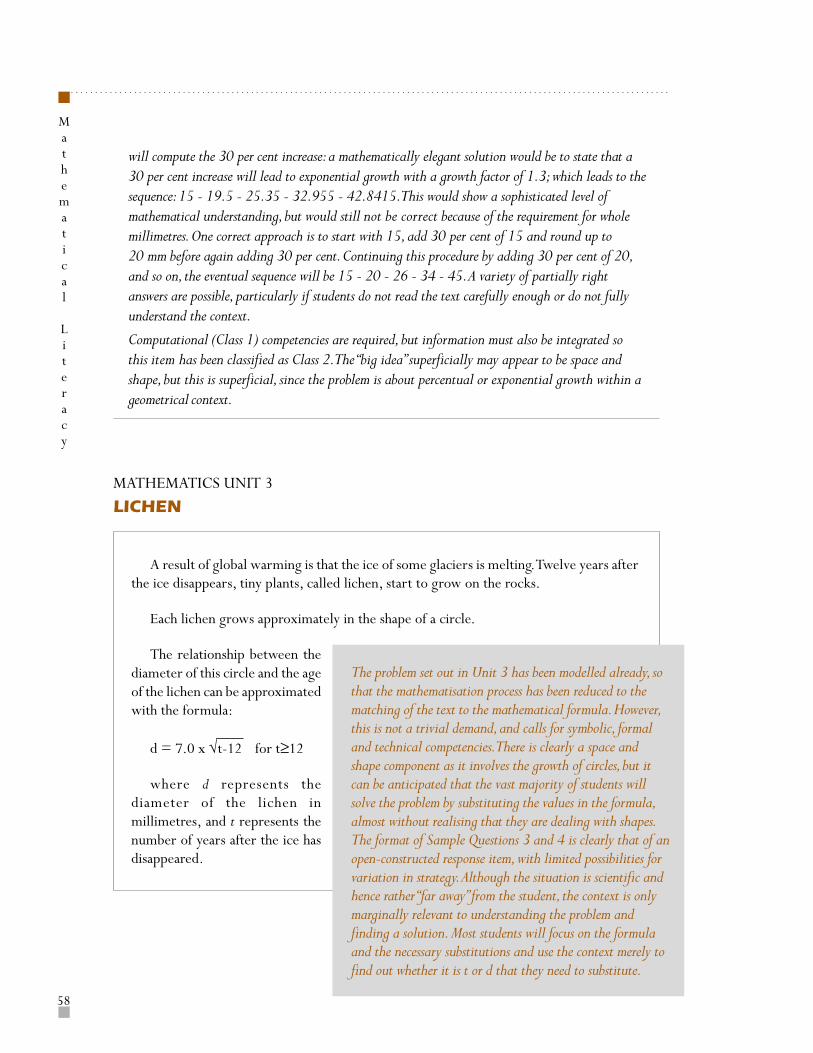
……………………………………………………………………………………………………………
58
Mathematical
Literacy
will compute the 30 per cent increase: a mathematically elegant solution would be to state that a30 per cent increase will lead to exponential growth with a growth factor of 1.3; which leads to thesequence: 15 - 19.5 - 25.35 - 32.955 - 42.8415. This would show a sophisticated level ofmathematical understanding, but would still not be correct because of the requirement for wholemillimetres. One correct approach is to start with 15, add 30 per cent of 15 and round up to20 mm before again adding 30 per cent. Continuing this procedure by adding 30 per cent of 20,and so on, the eventual sequence will be 15 - 20 - 26 - 34 - 45. A variety of partially rightanswers are possible, particularly if students do not read the text carefully enough or do not fullyunderstand the context.
Computational (Class 1) competencies are required, but information must also be integrated sothis item has been classified as Class 2. The “big idea” superficially may appear to be space andshape, but this is superficial, since the problem is about percentual or exponential growth within ageometrical context.
MATHEMATICS UNIT 3
LICHEN
A result of global warming is that the ice of some glaciers is melting. Twelve years afterthe ice disappears, tiny plants, called lichen, start to grow on the rocks.
Each lichen grows approximately in the shape of a circle.
The relationship between thediameter of this circle and the ageof the lichen can be approximatedwith the formula:
d = 7.0 x √t-12 for t≥12
where d represents thediameter of the lichen inmillimetres, and t represents thenumber of years after the ice hasdisappeared.
The problem set out in Unit 3 has been modelled already, sothat the mathematisation process has been reduced to thematching of the text to the mathematical formula. However,this is not a trivial demand, and calls for symbolic, formaland technical competencies. There is clearly a space andshape component as it involves the growth of circles, but itcan be anticipated that the vast majority of students willsolve the problem by substituting the values in the formula,almost without realising that they are dealing with shapes.The format of Sample Questions 3 and 4 is clearly that of anopen-constructed response item, with limited possibilities forvariation in strategy. Although the situation is scientific andhence rather “far away” from the student, the context is onlymarginally relevant to understanding the problem andfinding a solution. Most students will focus on the formulaand the necessary substitutions and use the context merely tofind out whether it is t or d that they need to substitute.
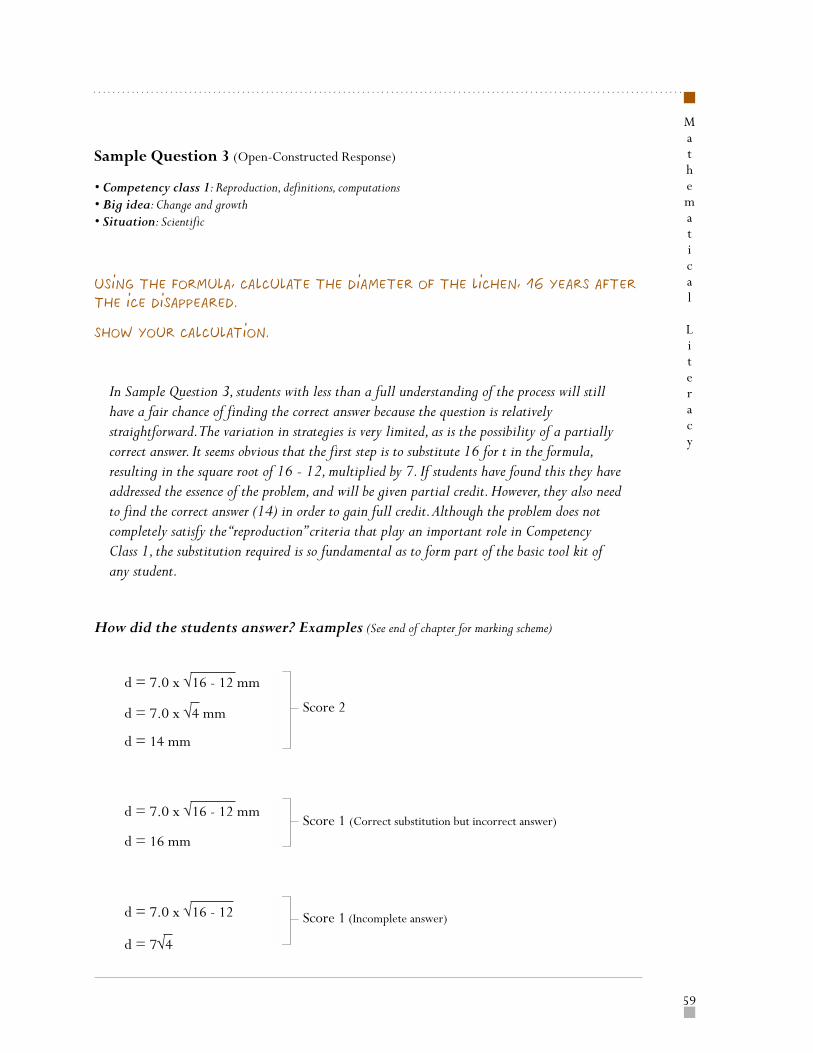
59
……………………………………………………………………………………………………………
Mathematical
Literacy
Sample Question 3 (Open-Constructed Response)
• Competency class 1: Reproduction, definitions, computations• Big idea: Change and growth• Situation: Scientific
Using the formula, calculate the diameter of the lichen, 16 years after
the ice disappeared.
Show your calculation.
In Sample Question 3, students with less than a full understanding of the process will stillhave a fair chance of finding the correct answer because the question is relativelystraightforward. The variation in strategies is very limited, as is the possibility of a partiallycorrect answer. It seems obvious that the first step is to substitute 16 for t in the formula,resulting in the square root of 16 - 12, multiplied by 7. If students have found this they haveaddressed the essence of the problem, and will be given partial credit. However, they also needto find the correct answer (14) in order to gain full credit. Although the problem does notcompletely satisfy the “reproduction” criteria that play an important role in CompetencyClass 1, the substitution required is so fundamental as to form part of the basic tool kit ofany student.
How did the students answer? Examples (See end of chapter for marking scheme)
d = 7.0 x √16 - 12 mm
d = 7.0 x √4 mm
d = 14 mm
d = 7.0 x √16 - 12 mm
d = 16 mm
d = 7.0 x √16 - 12
d = 7√4
Score 1 (Correct substitution but incorrect answer)
Score 1 (Incomplete answer)
Score 2
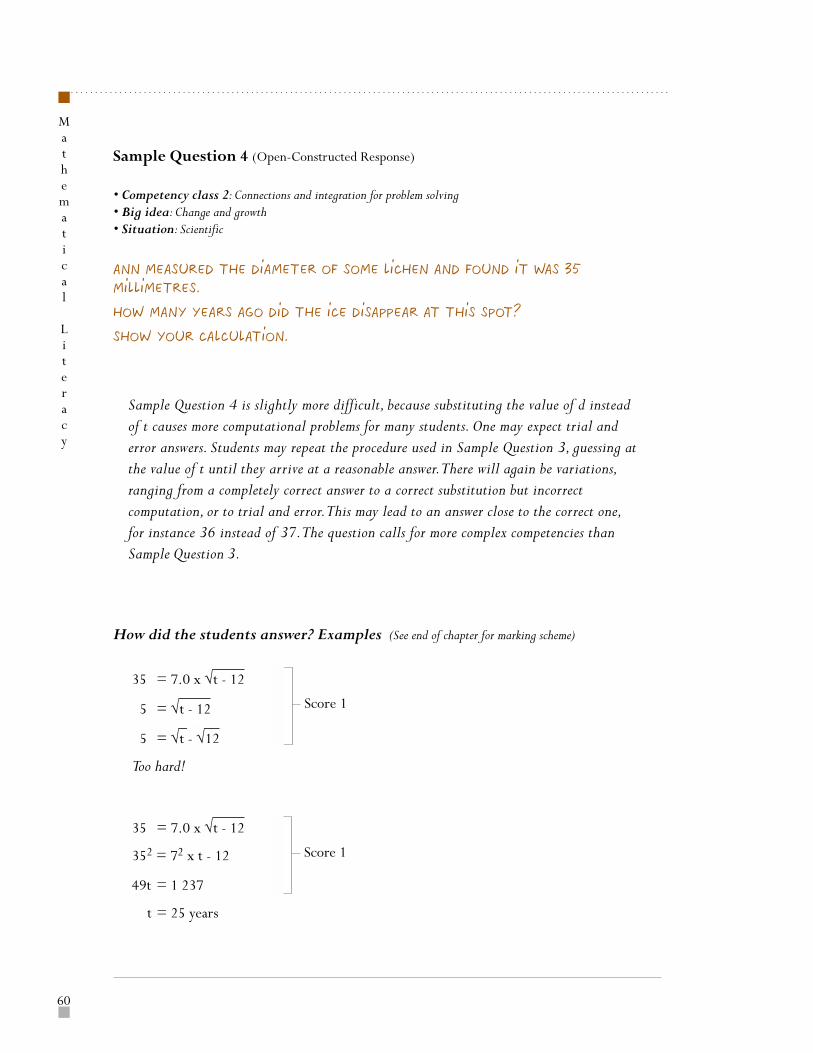
……………………………………………………………………………………………………………
60
Mathematical
Literacy
Sample Question 4 (Open-Constructed Response)
• Competency class 2: Connections and integration for problem solving• Big idea: Change and growth• Situation: Scientific
Ann measured the diameter of some lichen and found it was 35
millimetres.
How many years ago did the ice disappear at this spot?
Show your calculation.
Sample Question 4 is slightly more difficult, because substituting the value of d insteadof t causes more computational problems for many students. One may expect trial anderror answers. Students may repeat the procedure used in Sample Question 3, guessing atthe value of t until they arrive at a reasonable answer. There will again be variations,ranging from a completely correct answer to a correct substitution but incorrectcomputation, or to trial and error. This may lead to an answer close to the correct one,for instance 36 instead of 37. The question calls for more complex competencies thanSample Question 3.
How did the students answer? Examples (See end of chapter for marking scheme)
35 = 7.0 x √t - 12
5 = √t - 12
5 = √t - √12
Too hard!
35 = 7.0 x √t - 12
352 = 72 x t - 12
49t = 1 237
t = 25 years
Score 1
Score 1
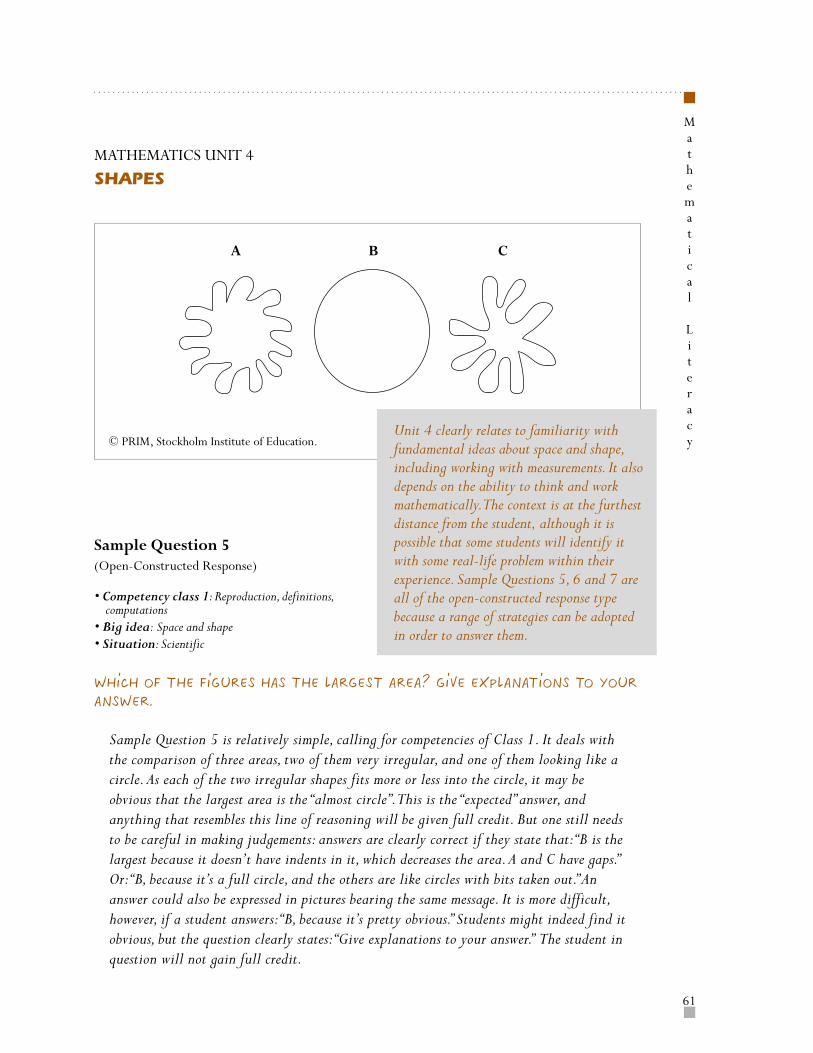
61
……………………………………………………………………………………………………………
Mathematical
Literacy
MATHEMATICS UNIT 4
SHAPES
Sample Question 5(Open-Constructed Response)
• Competency class 1: Reproduction, definitions,computations
• Big idea: Space and shape• Situation: Scientific
Which of the figures has the largest area? Give explanations to your
answer.
Sample Question 5 is relatively simple, calling for competencies of Class 1. It deals withthe comparison of three areas, two of them very irregular, and one of them looking like acircle. As each of the two irregular shapes fits more or less into the circle, it may beobvious that the largest area is the “almost circle”. This is the “expected” answer, andanything that resembles this line of reasoning will be given full credit. But one still needsto be careful in making judgements: answers are clearly correct if they state that: “B is thelargest because it doesn’t have indents in it, which decreases the area. A and C have gaps.”Or: “B, because it’s a full circle, and the others are like circles with bits taken out.” Ananswer could also be expressed in pictures bearing the same message. It is more difficult,however, if a student answers: “B, because it’s pretty obvious.” Students might indeed find itobvious, but the question clearly states: “Give explanations to your answer.” The student inquestion will not gain full credit.
Unit 4 clearly relates to familiarity withfundamental ideas about space and shape,including working with measurements. It alsodepends on the ability to think and workmathematically. The context is at the furthestdistance from the student, although it ispossible that some students will identify itwith some real-life problem within theirexperience. Sample Questions 5, 6 and 7 areall of the open-constructed response typebecause a range of strategies can be adoptedin order to answer them.
A B C
© PRIM, Stockholm Institute of Education.
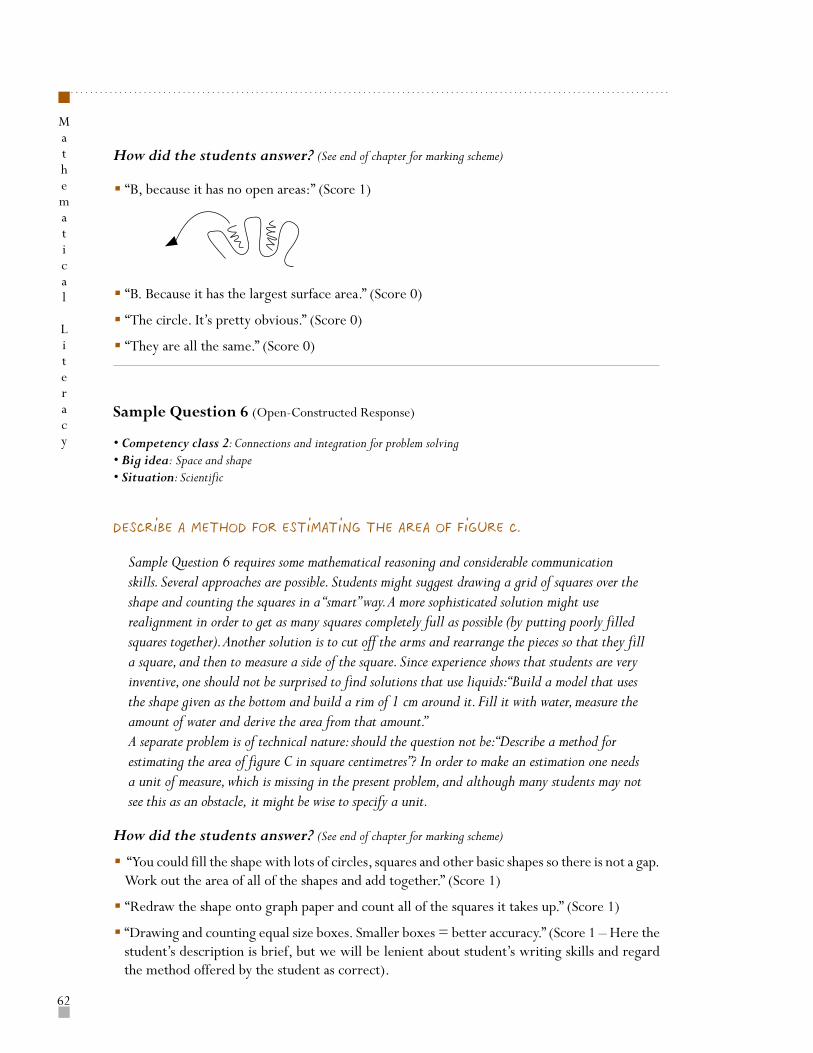
……………………………………………………………………………………………………………
62
Mathematical
Literacy
How did the students answer? (See end of chapter for marking scheme)
• “B, because it has no open areas:” (Score 1)
• “B. Because it has the largest surface area.” (Score 0)
• “The circle. It’s pretty obvious.” (Score 0)
• “They are all the same.” (Score 0)
Sample Question 6 (Open-Constructed Response)
• Competency class 2: Connections and integration for problem solving• Big idea: Space and shape• Situation: Scientific
Describe a method for estimating the area of figure C.
Sample Question 6 requires some mathematical reasoning and considerable communicationskills. Several approaches are possible. Students might suggest drawing a grid of squares over theshape and counting the squares in a “smart” way. A more sophisticated solution might userealignment in order to get as many squares completely full as possible (by putting poorly filledsquares together). Another solution is to cut off the arms and rearrange the pieces so that they filla square, and then to measure a side of the square. Since experience shows that students are veryinventive, one should not be surprised to find solutions that use liquids: “Build a model that usesthe shape given as the bottom and build a rim of 1 cm around it. Fill it with water, measure theamount of water and derive the area from that amount.”A separate problem is of technical nature: should the question not be: “Describe a method forestimating the area of figure C in square centimetres”? In order to make an estimation one needsa unit of measure, which is missing in the present problem, and although many students may notsee this as an obstacle, it might be wise to specify a unit.
How did the students answer? (See end of chapter for marking scheme)
• “You could fill the shape with lots of circles, squares and other basic shapes so there is not a gap.Work out the area of all of the shapes and add together.” (Score 1)
• “Redraw the shape onto graph paper and count all of the squares it takes up.” (Score 1)
• “Drawing and counting equal size boxes. Smaller boxes = better accuracy.” (Score 1 – Here thestudent’s description is brief, but we will be lenient about student’s writing skills and regardthe method offered by the student as correct).
63
……………………………………………………………………………………………………………
Mathematical
Literacy
• “Add up the area of each individual arm of the shape.” (Score 0)
• “Find the area of B then find the areas of the cut out pieces and subtract them from the mainarea.” (Score 0)
• “Minus the shape from the circle.” (Score 0)
• “Use a string and measure the perimeter of the shape. Stretch the string out to a circle andmeasure the area of the circle using π r2.” (Score 0 – Here the method described by the studentis wrong)
Sample Question 7 (Open-Constructed Response)
• Competency class 2: Connections and integration for problem solving• Big idea: Space and shape• Situation: Scientific
Describe a method for estimating the perimeter of figure C.
Sample Question 7 is of a similar order of complexity as Sample Question 6, and raises manyof the same problems. It tries to establish how well students can measure the perimeter s of anirregular area. A good way is to use measuring tape or a piece of string or cord over theoutline of the shape and to measure the length of this string. Students with more developedlinear reasoning might suggest approximating the length in straight pieces and subsequentlymeasuring the sum of the pieces. Or students might argue that they could approximate thepresent irregular star by a regular star shape, and measure the length of one arm, andsubsequently multiply the answer by eight.
How did the students answer? Examples (See end of chapter for marking scheme)
• “Wool or string!!!” (Score 1 – Here although the answer is brief, the student did offer a METHODfor measuring the perimeter)
• “Cut the side of the shape into sections. Measure each then add them together.” (Score 1 – Herethe student did not explicitly say that each section needs to be approximately straight, but wewill give the benefit of the doubt, that is, by offering the METHOD of cutting the shape intopieces, each piece is assumed to be easily measurable)
• “Measure around the outside.” (Score 0 – Here the student did not suggest any METHODof measuring. Simply saying “measure it” is not offering any method of how to go aboutmeasuring it)
• “Stretch out the shape to make it a circle.” (Score 0 – Here although a method is offered by thestudent, the method is wrong)
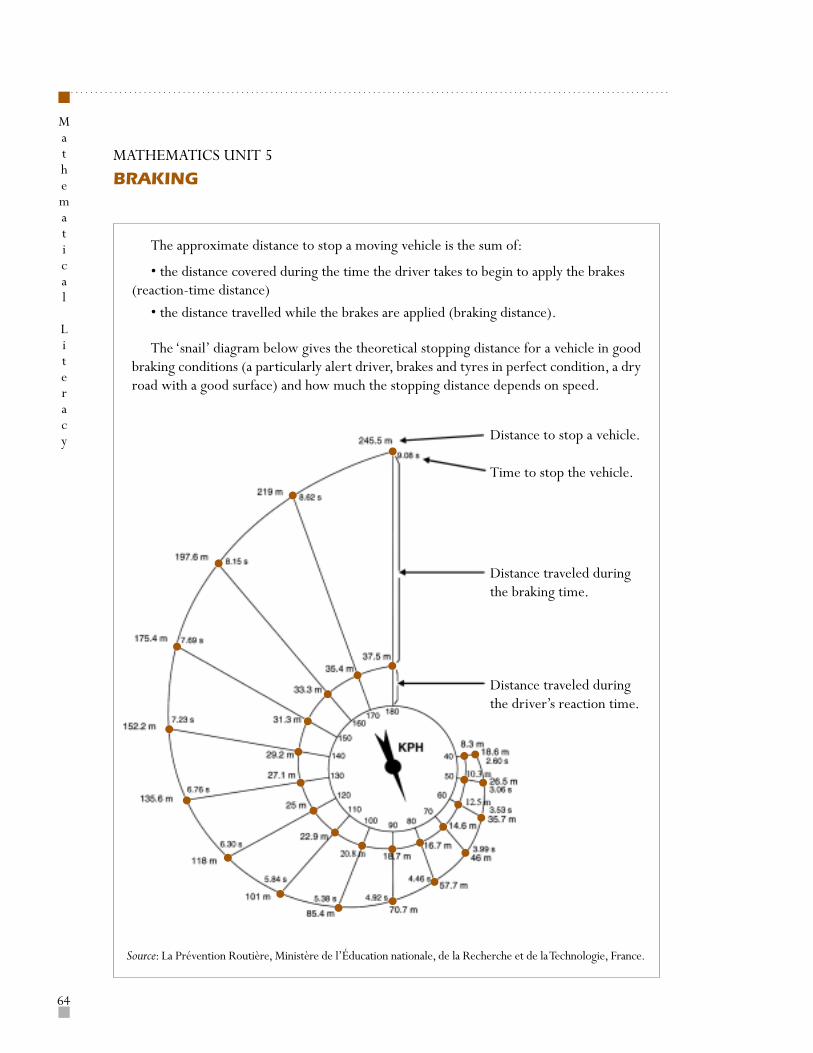
……………………………………………………………………………………………………………
64
Mathematical
Literacy
MATHEMATICS UNIT 5
BRAKING
The approximate distance to stop a moving vehicle is the sum of:
• the distance covered during the time the driver takes to begin to apply the brakes(reaction-time distance)
• the distance travelled while the brakes are applied (braking distance).
The ‘snail’ diagram below gives the theoretical stopping distance for a vehicle in goodbraking conditions (a particularly alert driver, brakes and tyres in perfect condition, a dryroad with a good surface) and how much the stopping distance depends on speed.
Distance to stop a vehicle.
Time to stop the vehicle.
Distance traveled duringthe braking time.
Distance traveled duringthe driver’s reaction time.
Source: La Prévention Routière, Ministère de l’Éducation nationale, de la Recherche et de la Technologie, France.
65
……………………………………………………………………………………………………………
Mathematical
Literacy
Modelling can take many different forms. In Unit 5, a well-known situation that is relevant toeveryone who travels by road is presented by way of a diagram to show clearly the increase inbraking distance as a function of speed. The context will be familiar for many students.The “distance” from students’ own world is relatively small, although they might not be aware ofthe underlying mathematical model. The context is authentic because it resides in the actualexperiences and practices of the participants in a real-life setting. Understanding the problem cancertainly contribute to better “functioning” in our complex society, and the ability to interpret anduse a visual presentation is a skill that falls well within the limits of literacy. It is not dependenton pure technical skills such as substituting numbers in a known formula.
The modelling of the braking process has already been done, but modelling and representationskills will be used to “de-mathematise” the diagram and translate it into natural language.Basically, all that is asked of the student is to “read” the diagram, making the connectionbetween reaction time, distance and braking action, in relation to speed. This may seem simplebut students are so used to seeing in a test what has been taught in the classroom that theylose the ability to transfer their skills to different contexts. The PISA assessment acknowledgesthis in that all questions are straightforward and use numbers that are directly represented inthe diagram. The questions form a natural sequence, using the same speed throughout. It willbe clear from the nature of the questions that we do not expect a variety of strategies andstyles of answer. The format of Sample Questions 8-12 is therefore that of a closed-con-structed response item. Although this is definitely a simple problem concerning growth curves,it is likely that students will never have encountered such a representation. For that reason allthe questions asked about it are assumed to call for Competency Class 2.
The situation (dealing with braking distances diagrammatically) could be used to ask furtherquestions demanding additional skills. If one takes a speed of 107 kph, for instance, the studentneeds to draw a line (maybe) that starts at the appropriate point on the speedometer between100 and 110, and then to make educated guesses about the correct answer, which can be obtainedin different ways. Much more complex questions could be asked as well. An example would be tocompute the ratios between the distances travelled during the reaction time and the total brakingdistance. At 40 kph this ratio is 8.3:18.6, or close to 1:2. At a speed of 180 kph, the ratio is37.8:245.5, close to 1:6. Students could be asked to explain that difference.
Sample Question 8 (Closed-Constructed Response)
• Competency class 2: Connections and integration for problem solving• Big idea: Change and growth• Situation: Personal/public
If a vehicle is travelling at 110 kph, what distance does the vehicle
travel during the driver’s reaction time?
For anyone able to read the diagram, the answer to Sample Question 8 is simple: 22.9 m.
……………………………………………………………………………………………………………
66
Mathematical
Literacy
Sample Question 9 (Closed-Constructed Response)
• Competency class 2: Connections and integration for problem solving• Big idea: Change and growth• Situation: Personal/public
If a vehicle is travelling at 110 kph, what is the total distance travelled
before the vehicle stops?
Sample Question 9 is equally simple. The answer is 101 metres.
Sample Question 10 (Closed-Constructed Response)
• Competency class 2: Connections and integration for problem solving• Big idea: Change and growth• Situation: Personal/public
If a vehicle is travelling at 110 kph, how long does it take to stop the
vehicle completely?
Sample Question 10 is related to the previous question. This question is somewhat lessrelevant in most cases of braking but can be found at the outer spiral: 5.84 seconds.
Sample Question 11 (Closed-Constructed Response)
• Competency class 2: Connections and integration for problem solving• Big idea: Change and growth• Situation: Personal/public
If a vehicle is travelling at 110 kph, what is the distance travelled while
the brakes are being applied?
Sample Question 11 is different, requiring not just reading of the diagram but also somesimple calculation to show that students can interpret the diagram. Students need to subtract22.9 from 101 to find the answer, 78.1 metres.
Sample Question 12 (Closed-Constructed Response)
• Competency class 2: Connections and integration for problem solving• Big idea: Change and growth
• Situation: Personal/public
A second driver, travelling in good road conditions, stops her vehicle in
a total distance of 70.7 metres. At what speed was the vehicle travelling
before the brakes were applied?
Sample Question 12, the last on this stimulus, is somewhat easier as it merely requiresstudents to read off the speed that accords with the given total braking distance.
67
……………………………………………………………………………………………………………
Mathematical
Literacy
MATHEMATICS UNIT 6
PATIO
Sample Question 13 (Open-Constructed Response)
• Competency class 2: Connections and integration for problem solving• Big idea: Space and shape
• Situation: Personal
Nick wants to pave the rectangular patio of his new house. The patio is 5.25
metres long and 3.00 metres wide. He needs 81 bricks per square metre.
Calculate how many bricks Nick needs for the whole patio.
An important part of the definition of mathematical literacy is doing and using mathematicsin a variety of “authentic” situations. These situations include personal life and work. Unit 6,however simple, fits well into the definition and can be encountered in many variations indaily life or at work.
In order to answer Sample Question 13, the student needs to understand the problem. In thiscase the wording is straightforward, and confusion is hardly possible. It is almost a “standard”problem: the solution is to compute the total area, and multiply this by the number of bricksneeded for one square metre, in this case 81. It could be argued therefore that this problem hastwo stages. The mathematisation process (finding the relevant mathematics in the text, which is5.25 times 3.00 and 81 per square metre) is perhaps a third stage. The question itself is a littleambiguous because it uses natural language, asking “how many bricks Nick needs”, but this canbe translated into at least three possible correct answers. One answer is 1 276. Or one couldanswer by stating how many “whole” bricks are needed (admittedly somewhat less natural):1 275. Or one could give a “precise” number of bricks (including partial bricks): 1 275.75. Themost likely answer is that 15 square metres takes 1 215 bricks. The three remaining areas areeach of 1/4 square metre. Since 1/4 of 81 is about 20, we must add 60 bricks to the total of1 215, giving 1 275. The format is therefore that of an open-constructed response item, asstudents have the opportunity to adopt a variety of strategies.
The most obvious competencies required are modelling skill, to mathematise the problem,and problem solving skill to find the correct answer. Communication skill is also neededbecause there is more than one possible answer, and (as in almost all problems) technicalskill is needed for correct computation. Representation skill may be useful if studentswant to visualise the problem in order to solve it. They might want to draw the patio anddivide it up into blocks of 81 bricks. This question seems to fit neatly into Class 2 as it isnot a reproduction problem, and requires simple problem solving skills, typical for thislevel of competencies.
……………………………………………………………………………………………………………
68
Mathematical
Literacy
MATHEMATICS UNIT 7
SEALS SLEEP
A seal has to breathe even if it is asleep in the water. Martin observed a seal for onehour. At the start of his observation, the seal was at the surface and took a breath. It thendove to the bottom of the sea and started to sleep. From the bottom it slowly floated to thesurface in 8 minutes and took a breath again. In three minutes it was back at the bottom ofthe sea again. Martin noticed that this whole process was a very regular one.
Sample Question 14 (Multiple Choice)
• Competency class 2: Connections and integration for problem solving• Big idea: Change and growth• Situation: Personal/Scientific
After one hour the seal was
a at the bottom
b on its way up
c breathing
d on its way down
Sample Question 14 demonstrates that simple mathematics can be used to make sense of theworld around us. Students need to analyse the text carefully and to recognise that the crucialmathematical idea here is periodicity, which falls within the “big idea” of change and growth.They need to transform this idea into a mathematical problem, which can be solved indifferent ways. This is relatively complex because the information is not neatly organised forstudents: first, they are given information about the diving part of the cycle, but not aboutthe time it takes. They find this information only after the numerical information about thefloating process. This is not what students are usually confronted with. They need to graspthat a full cycle takes 11 minutes: three minutes to dive, eight minutes to float to the surface,take a breath, and dive again. The mathematisation of the problem is that at t = 0, the sealstarts to dive, at t = 3, it is at the bottom, and at t = 11 it is at the surface again. And so on.What is it doing at t = 60? Answer: if five cycles take 55 minutes, at t = 60 we are5 minutes after the beginning of the cycle, and hence on its way up to the surface. Butstudents could also mathematise the problem by using less formal mathematics. They couldmake a sketch with the surface and the bottom as two parallel lines and draw lines down(3 mins.) and up (8 mins.), continuing this process until they reach the 60 minute mark. The
69
……………………………………………………………………………………………………………
Mathematical
Literacy
competencies used here are modelling, representation and formal skills. Many variations andother strategies can be expected.
The problem is not “close” to most students’ worlds. It is somewhat scientific althoughstudents might encounter this or similar problems nearer to home: predicting tides for thoseclose to the sea, or arrival times of regular buses. The problem therefore is authentic, althoughit has been pre-modelled. The format is multiple choice, and machine marking is possible.
…………
……………………………………………………………………………………………………………
70
Mathematical
Literacy
SCORING SCHEME FOR THE MATHEMATICS SAMPLE QUESTIONS
MATHEMATICS UNIT 1 – PIZZA
Sample Question 1
Score 1: Answers which give the general reasoning that the surface area of pizza increases morerapidly than the price of the pizza, concluding that the larger pizza is better value. For example:
• “The diameter of the pizzas is the same number as their price, but the amount of pizza you getis found using squarred diameter, so you will get more pizza per zeds from the larger one.”
or
Answers which calculate the area and amount per zed for each pizza, concluding that the largerpizza is better value. For example:
• “Area of smaller pizza is 0.25 x π x 30 x 30 = 225π; amount per zed is 23.6 cm2 area oflarger pizza is 0.25 x π x 40 x 40 = 400π; amount per zed is 31.4 cm2 so larger pizza isbetter value.”
Score 0: Other incorrect responses. For example:
• “They are the same value for money.”
or
Answers which are correct but with an incorrect or insufficient reasoning. For example:
• “The larger one.”
MATHEMATICS UNIT 2 – COINS
Sample Question 2
Score 2: 15 - 20 - 26 - 34 - 45. It is possible that the response could be presented as actualdrawings of the coins of the correct diameters. This should be scored 2 as well.
Score 1: The answer gives a set of coins that satisfy the three criteria, but not the set thatcontains as many coins as possible, for example:
• “15 - 21 - 29 - 39”, or “15 - 30 - 45.”
or
Answers which give the first four diameters correct, the last one incorrect, for example:
• “15 - 20 - 26 - 34 - .”
or
Answers which give the first three diameters correct, the last two incorrect, for example:
• “15 - 20 - 26 - .”
Score 0: Other incorrect responses.
71
……………………………………………………………………………………………………………
Mathematical
Literacy
MATHEMATICS UNIT 3 – LICHEN
Sample Question 3
Score 2: 14 mm or 14 (units not required). Score 2 should be given as long as the correctanswer is 14 whether solution steps are shown or not.
d = 7.0 x √16 - 12
d = 14
• “14 mm.”
Score 1: Answers with partial responses, for example:
• Correct substitution of value in the formula but incorrect answer.• Incomplete answers.
Score 0: Other incorrect responses, for example:
• “16.” (Incorrect answer with no solution steps shown).
Sample Question 4
Score 2: Answers which indicate 37 years or 37 (units not required), regardless of the presenceor absence of solution steps, for example:
35 = 7.0 x √t - 12
5 = √t - 12
25 = t - 12
t = 37
Score 1: Answers which indicate a correct substitution of values in the formula but an incorrectanswer, for example:
35 = 7.0 x √t - 12
352 = 72 x t - 12
35t = 1 752
t = 50
35 = 7.0 x √t - 12
35 = √t - 12
1 225 = t - 12
t = 1 237
Score 0: Other incorrect responses.
Score 2
Score 2
Score 1
Score 1
……………………………………………………………………………………………………………
72
Mathematical
Literacy
MATHEMATICS UNIT 4 – SHAPES
Sample Question 5
Score 1: Answers which indicate shape B, supported with plausible reasoning, for example:
• “B. It doesn’t have indents in it which decreases the area. A and C have gaps.”• “B, because it’s a full circle, and the others are like circles with bits taken out.”
Score 0: Answers which indicate shape B, without plausible support.
Sample Question 6
Score 1: Answers which indicate any reasonable method, such as:
• “Draw a grid of squares over the shape and count the squares that are more than half filledby the shape.”
• “Cut the arms off the shape and rearrange the pieces so that they fill a square then measurethe side of the square.”
• “Build a 3D model based on the shape and fill it with water. Measure the amount of waterused and the depth of the water in the model. Derive the area from the information.”
Score 0: Other incorrect or incomplete answers. For example:
• “The student suggests to find the area of the circle and subtract the area of the cut outpieces. However, the student does not mention about HOW to find out the area of the cutout pieces.”
Sample Question 7
Score 1: Answers which indicate any reasonable method, such as:• “Lay a piece of string over the outline of the shape then measure the length of string used.”• “Cut the shape up into short, nearly straight pieces and join them together in a line, then
measure the length of the line.”• “Measure the length of some of the arms to find an average arm length then multiply by 8
(number of arms) x 2.”
Score 0: Other incomplete or incorrect responses.
MATHEMATICS UNIT 5 – BRAKING
Sample Question 8
Score 1: 22.9 metres (units not required).
Score 0: Other.
Sample Question 9
Score 1: 101 metres (units not required).
Score 0: Other.
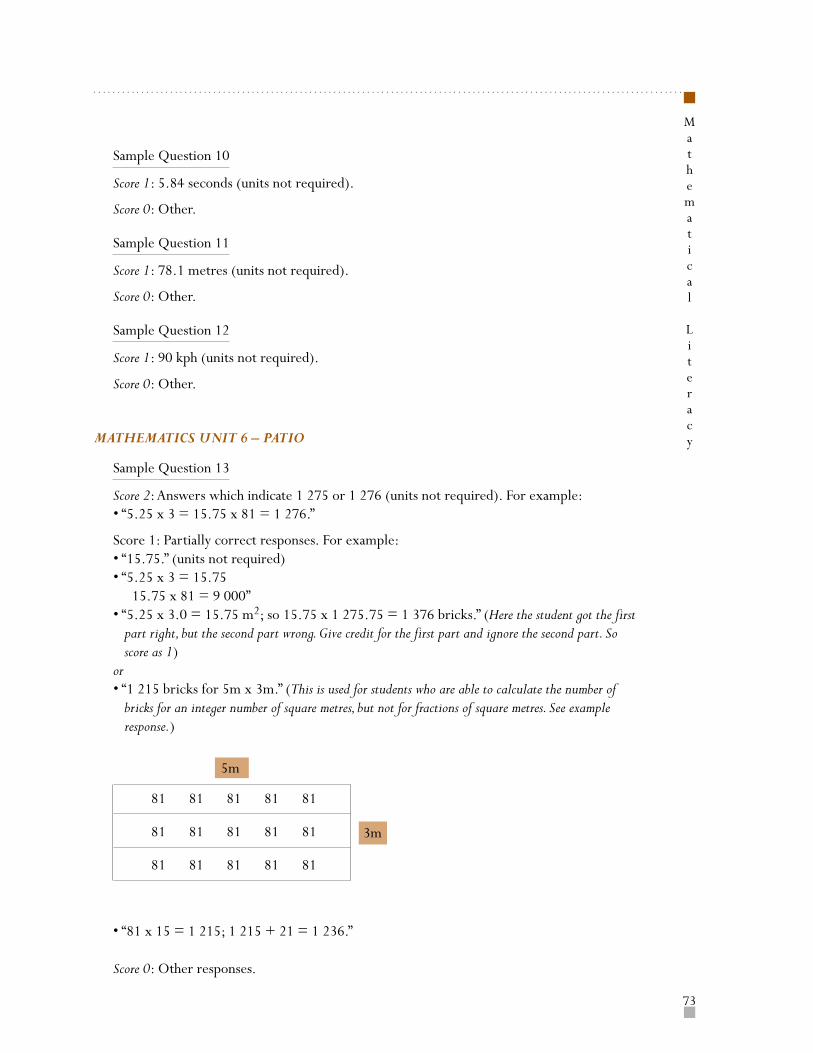
73
……………………………………………………………………………………………………………
Mathematical
Literacy
Sample Question 10
Score 1: 5.84 seconds (units not required).
Score 0: Other.
Sample Question 11
Score 1: 78.1 metres (units not required).
Score 0: Other.
Sample Question 12
Score 1: 90 kph (units not required).
Score 0: Other.
MATHEMATICS UNIT 6 – PATIO
Sample Question 13
Score 2: Answers which indicate 1 275 or 1 276 (units not required). For example:• “5.25 x 3 = 15.75 x 81 = 1 276.”
Score 1: Partially correct responses. For example:• “15.75.” (units not required)• “5.25 x 3 = 15.75
15.75 x 81 = 9 000”• “5.25 x 3.0 = 15.75 m2; so 15.75 x 1 275.75 = 1 376 bricks.” (Here the student got the first
part right, but the second part wrong. Give credit for the first part and ignore the second part. Soscore as 1)
or• “1 215 bricks for 5m x 3m.” (This is used for students who are able to calculate the number of
bricks for an integer number of square metres, but not for fractions of square metres. See exampleresponse.)
• “81 x 15 = 1 215; 1 215 + 21 = 1 236.”
Score 0: Other responses.
3m
81 81 81 81 81
81 81 81 81 81
81 81 81 81 81
5m
……………………………………………………………………………………………………………
74
Mathematical
Literacy
MATHEMATICS UNIT 7 – SEALS SLEEP
Sample Question 14
Score 1: Response option B – On its way up.
Score 0: Other.

3
SCIENTIFIC
LITERACY
……………………………………………………………………………………………………………
76
Scientific
Literacy
The PISA definition of scientificliteracy and its context
Scientific literacy is defined in PISA as:
the capacity to use scientific knowledge,to identify questions and to drawevidence-based conclusions in order tounderstand and help make decisionsabout the natural world and the changesmade to it through human activity.
An important aspect of scientific literacy isthat it is considered a key outcome of educationby age 15 for all students, whether or not theycontinue to learn science thereafter. Scientificthinking is required by citizens, not just scientists.It has been widely accepted in the past that readingand mathematical skills are important for alladults, in many life contexts. The inclusion ofscientific literacy as a general competency for lifereflects the growing centrality of scientific andtechnological questions to 21st century life. Notethat the definition does not imply that tomorrow’sadults need large reservoirs of scientificknowledge, but that the key is to be able to thinkscientifically about the evidence that theyencounter.
Three dimensions of scientific literacy
To transform this definition into anassessment of scientific literacy, three broaddimensions have been identified. These are:
• Scientific processes or skills: themental processes that are involved inaddressing a question or issue (such asidentifying evidence or explainingconclusions);
ASSESSING SCIENTIFIC LITERACY IN PISA
• Concepts and content: the scientificknowledge and conceptual understandingthat are required in using these processes;
• Context: situations in which the processesand understanding are applied – such as thepersonal context of health and nutrition orthe global context of climate.
Within each dimension, decisions have beenmade about which components need to beincluded – for example, what kinds of scientificprocess are the most important to master. Theintention has been to focus on literacy as a broadcompetence rather than on the mastery ofcurriculum content only. The arguments anddecisions about these components are brieflyset out below.
Scientific processes
PISA emphasises the ability to use scientificknowledge and to know about science. Theassessment of such abilities helps us to under-stand how well science education is preparingfuture citizens to participate in societies evermore affected by scientific and technologicaladvances. Students should be equipped withunderstanding of the nature of science, of itsprocedures, of its strengths and limitations andof the kinds of question that it can, and cannot,answer. Students should also be able to recog-nise the type of evidence required in ascientific investigation and the extent to whichreliable conclusions can be drawn fromevidence. It is considered important forstudents to be able to communicate theirunderstanding and arguments effectively toparticular audiences, for otherwise they willhave no voice in the matters that are debatedin society.
77
……………………………………………………………………………………………………………
Scientific
Literacy
It should be possible for all these abilities tobe derived from experiencing science at firsthand and from investigations and experimentsin school. However, the concern in PISA is notto find out whether students can undertakescientific investigations for themselves, butrather whether their school experiences haveculminated in an understanding of scientificprocesses and the ability to apply scientificconcepts that enable them “to make decisionsabout the natural world and the changes madeto it through human activity”.
These arguments have led to theidentification of the following scientificprocesses for assessment in PISA:
1. Recognising scientifically investigablequestions
This means being able to identify the kindsof question that science can attempt toanswer, or the specific question that is, ormight be, tested in a particular situation.
It can be assessed, for example, bypresenting a situation in which questionscould be answered scientifically and askingfor these to be identified, or presentingseveral questions and asking which can beanswered by scientific investigation.
2. Identifying evidence needed in ascientific investigation
This process involves identifying orproposing the evidence required to answerthe questions posed in a scientificinvestigation, or the procedures needed togather that evidence.
It can be assessed, for example, by presentingan investigation and asking students to identifythe evidence needed or the action to be takento obtain valid evidence.
3. Drawing or evaluating conclusions
This process involves relating conclusions tothe evidence on which they are based, orshould be based.
It can be assessed, for example, by providingstudents with an account of an investigationand the conclusions drawn from it and askingfor an evaluation of these conclusions, or byasking for a conclusion or alternativeconclusions to be drawn that are consistentwith given evidence.
4. Communicating valid conclusions
The process involved here is that ofexpressing, in a way that is appropriate to agiven audience, the conclusions that can bedrawn from available evidence.
It can be assessed, for example, bypresenting students with a situation whichrequires information or evidence fromdifferent sources to be brought together tosupport a given course of action orconclusion. The emphasis here is on theclarity of communication rather than theparticular conclusion being communicated,provided that this is consistent with scientificunderstanding.
5. Demonstrating understanding ofscientific concepts
This is the process of showing understandingby being able to apply concepts in situationsdifferent from those in which they werelearned. It involves not only recallingknowledge but also showing the relevanceof that knowledge or using it in makingpredictions or giving explanations.
It can be assessed, for example, by askingfor explanations or predictions about a givensituation, phenomenon or event.
……………………………………………………………………………………………………………
78
Scientific
Literacy
It is acknowledged and indeed emphasisedthat in using all of these processes somescientific knowledge is required. This is mostobvious in Process 5, but it applies to Processes1 to 4 equally, for these cannot be described as“scientific processes” unless they are applied inrelation to scientific content.
Scientific concepts
The scientific concepts selected in PISA areexpressed as broad integrating ideas that helpto explain aspects of our material environment.The PISA framework does not attempt toidentify all concepts that would meet thiscriterion; assessing them comprehensivelywould be impossible within the constraints oflimited test “space”. Instead, concepts will besampled from the following main themes:
1. Structure and properties of matter2. Atmospheric change3. Chemical and physical changes4. Energy transformations5. Forces and movement6. Form and function7. Human biology8. Physiological change9. Biodiversity
10. Genetic control11. Ecosystems12. The Earth and its place in the universe13. Geological change
Situations and areas of application
The PISA definition of scientific literacyemphasises the application of processes andconcepts in relation to problems and issues in thereal world. Students who have acquired somemeasure of scientific literacy will be able to applywhat they have learned in school and non-schoolsituations. A scientific situation is used here toindicate a real-world phenomenon in whichscience can be applied. Note the distinctionbetween a scientific concept (such as atmosphericchange) and an aspect of our world in which it isapplied (such as weather or climate).
The areas of application of science have beengrouped under three broad headings:
1. Science in life and health,2. Science in Earth and environment, and3. Science in technology.
Problems and issues under these headingscan affect us as individuals, as members of alocal community or as world citizens; often asall three. Moreover, some areas in which scienceis applied have a long history, illustratingchanges in scientific understanding over timeand providing opportunities for recognising theapplication of science in contexts that are nolonger familiar today.
The situations that can be used for assessingscientific literacy can thus be characterised bothby the broad area of application and by the aspectsof our lives in which they are relevant (Table 1).
Format of test questions
The test used to assess scientific literacy is aseries of “units”, each dealing with a particularproblem or issue. Assessment units presentstudents with a real-life situation, taken from anauthentic source, and a series of questions aboutit. Each question requires the use of one or moreof the process skills and some scientificknowledge. The presentation of the stimulusmaterial (problem or issue) requires the readingof some text, table or diagrammaticrepresentation. However, since several questionsare linked to the same stimulus material in eachunit, the overall time spent reading, rather thananswering a question, is no greater than in a seriesof stand-alone items in a conventional test.
In the following examples, only two of theplanned items within each unit are presented,in the interests of providing a range of situations.There will, therefore, appear to be a greaterreading load for each question than is in factthe case for the actual PISA assessment. Thecommentary on each question indicates the
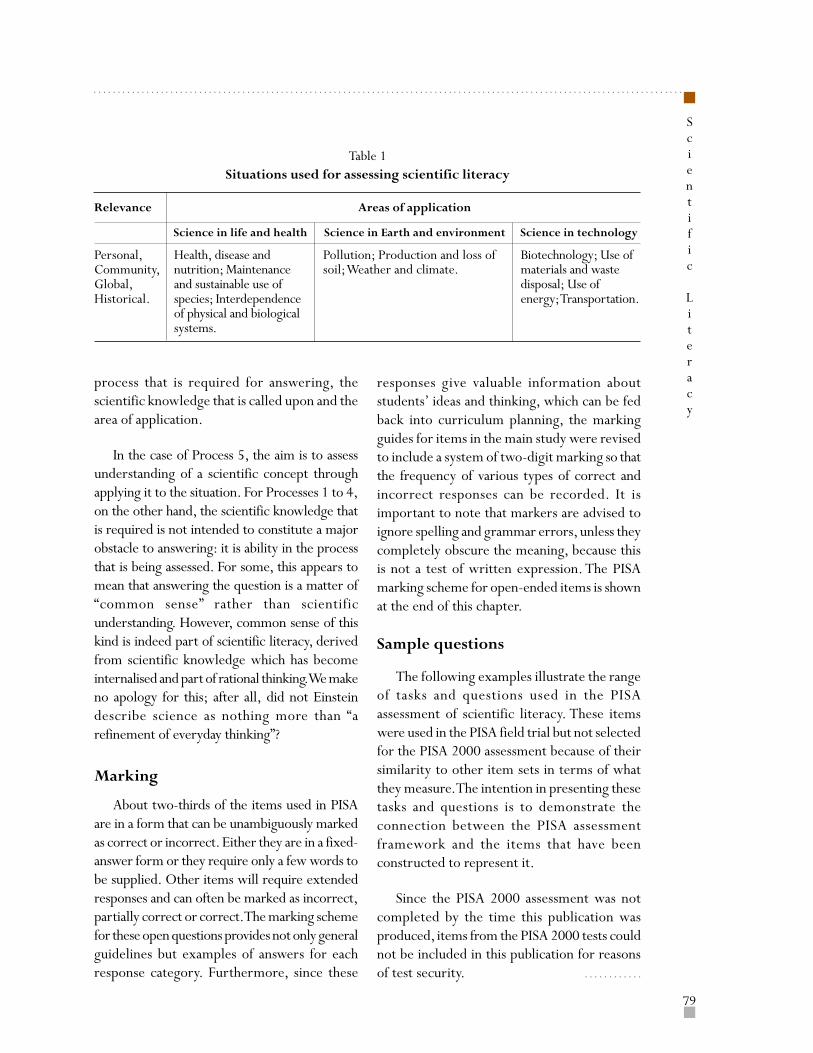
79
……………………………………………………………………………………………………………
Scientific
Literacy
process that is required for answering, thescientific knowledge that is called upon and thearea of application.
In the case of Process 5, the aim is to assessunderstanding of a scientific concept throughapplying it to the situation. For Processes 1 to 4,on the other hand, the scientific knowledge thatis required is not intended to constitute a majorobstacle to answering: it is ability in the processthat is being assessed. For some, this appears tomean that answering the question is a matter of“common sense” rather than scientificunderstanding. However, common sense of thiskind is indeed part of scientific literacy, derivedfrom scientific knowledge which has becomeinternalised and part of rational thinking. We makeno apology for this; after all, did not Einsteindescribe science as nothing more than “arefinement of everyday thinking”?
Marking
About two-thirds of the items used in PISAare in a form that can be unambiguously markedas correct or incorrect. Either they are in a fixed-answer form or they require only a few words tobe supplied. Other items will require extendedresponses and can often be marked as incorrect,partially correct or correct. The marking schemefor these open questions provides not only generalguidelines but examples of answers for eachresponse category. Furthermore, since these
responses give valuable information aboutstudents’ ideas and thinking, which can be fedback into curriculum planning, the markingguides for items in the main study were revisedto include a system of two-digit marking so thatthe frequency of various types of correct andincorrect responses can be recorded. It isimportant to note that markers are advised toignore spelling and grammar errors, unless theycompletely obscure the meaning, because thisis not a test of written expression. The PISAmarking scheme for open-ended items is shownat the end of this chapter.
Sample questions
The following examples illustrate the rangeof tasks and questions used in the PISAassessment of scientific literacy. These itemswere used in the PISA field trial but not selectedfor the PISA 2000 assessment because of theirsimilarity to other item sets in terms of whatthey measure. The intention in presenting thesetasks and questions is to demonstrate theconnection between the PISA assessmentframework and the items that have beenconstructed to represent it.
Since the PISA 2000 assessment was notcompleted by the time this publication wasproduced, items from the PISA 2000 tests couldnot be included in this publication for reasonsof test security.
Table 1Situations used for assessing scientific literacy
Relevance Areas of application
Science in life and health Science in Earth and environment Science in technology
…………
Personal,Community,Global,Historical.
Health, disease andnutrition; Maintenanceand sustainable use ofspecies; Interdependenceof physical and biologicalsystems.
Pollution; Production and loss ofsoil; Weather and climate.
Biotechnology; Use ofmaterials and wastedisposal; Use ofenergy; Transportation.
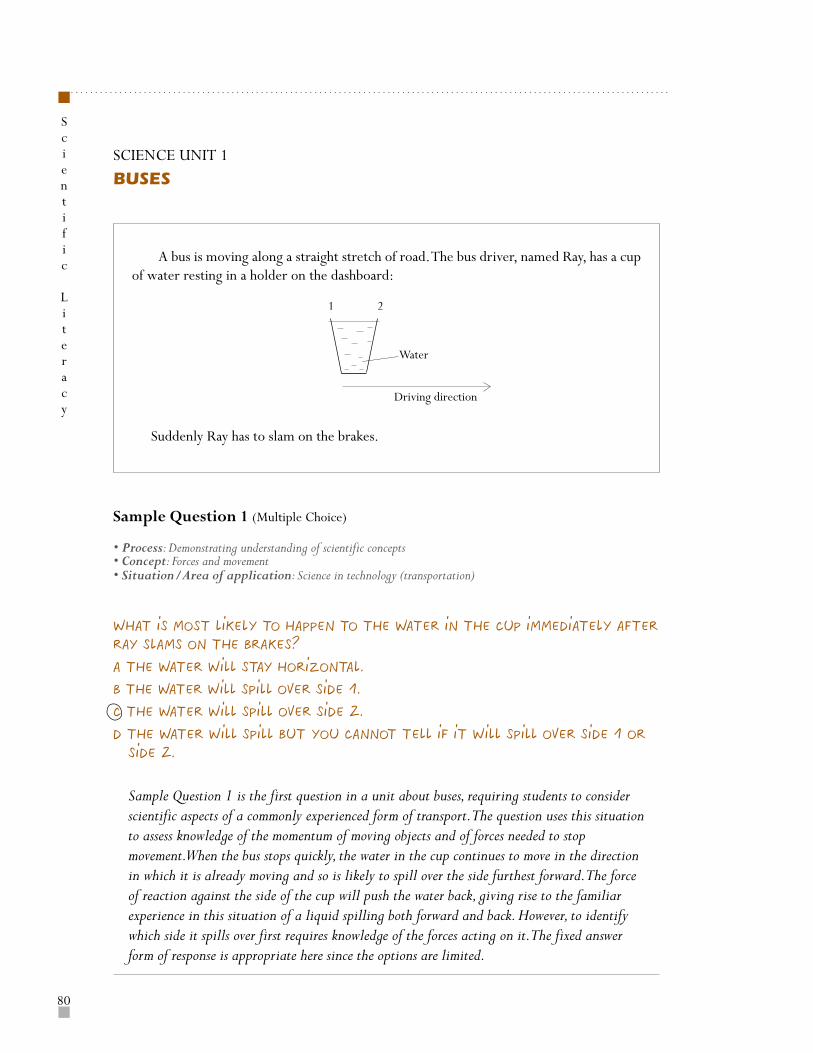
……………………………………………………………………………………………………………
80
Scientific
Literacy
SCIENCE UNIT 1
BUSES
A bus is moving along a straight stretch of road. The bus driver, named Ray, has a cupof water resting in a holder on the dashboard:
Suddenly Ray has to slam on the brakes.
Sample Question 1 (Multiple Choice)
• Process: Demonstrating understanding of scientific concepts• Concept: Forces and movement• Situation/Area of application: Science in technology (transportation)
What is most likely to happen to the water in the cup immediately after
Ray slams on the brakes?
A The water will stay horizontal.
B The water will spill over side 1.
C The water will spill over side 2.
D The water will spill but you cannot tell if it will spill over side 1 or
side 2.
Sample Question 1 is the first question in a unit about buses, requiring students to considerscientific aspects of a commonly experienced form of transport. The question uses this situationto assess knowledge of the momentum of moving objects and of forces needed to stopmovement. When the bus stops quickly, the water in the cup continues to move in the directionin which it is already moving and so is likely to spill over the side furthest forward. The forceof reaction against the side of the cup will push the water back, giving rise to the familiarexperience in this situation of a liquid spilling both forward and back. However, to identifywhich side it spills over first requires knowledge of the forces acting on it. The fixed answerform of response is appropriate here since the options are limited.
Water
Driving direction
1 2
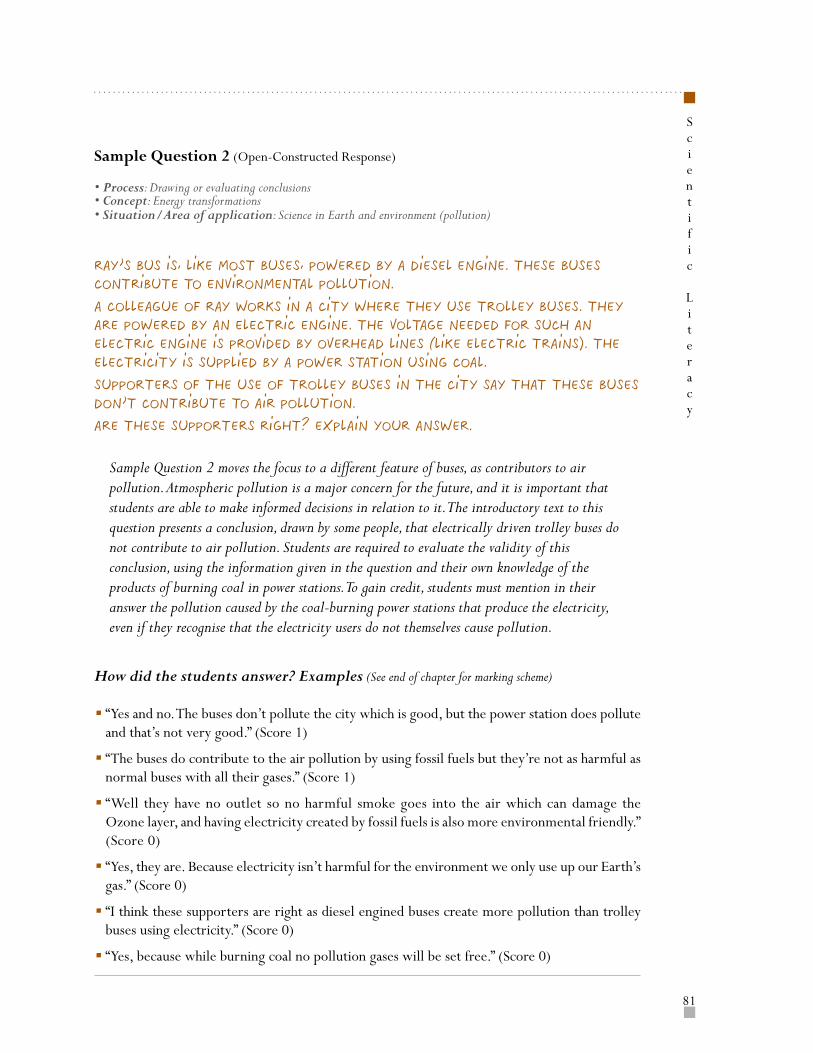
81
……………………………………………………………………………………………………………
Scientific
Literacy
Sample Question 2 (Open-Constructed Response)
• Process: Drawing or evaluating conclusions• Concept: Energy transformations• Situation/Area of application: Science in Earth and environment (pollution)
Ray’s bus is, like most buses, powered by a diesel engine. These buses
contribute to environmental pollution.
A colleague of Ray works in a city where they use trolley buses. They
are powered by an electric engine. The voltage needed for such an
electric engine is provided by overhead lines (like electric trains). The
electricity is supplied by a power station using coal.
Supporters of the use of trolley buses in the city say that these buses
don’t contribute to air pollution.
Are these supporters right? Explain your answer.
Sample Question 2 moves the focus to a different feature of buses, as contributors to airpollution. Atmospheric pollution is a major concern for the future, and it is important thatstudents are able to make informed decisions in relation to it. The introductory text to thisquestion presents a conclusion, drawn by some people, that electrically driven trolley buses donot contribute to air pollution. Students are required to evaluate the validity of thisconclusion, using the information given in the question and their own knowledge of theproducts of burning coal in power stations. To gain credit, students must mention in theiranswer the pollution caused by the coal-burning power stations that produce the electricity,even if they recognise that the electricity users do not themselves cause pollution.
How did the students answer? Examples (See end of chapter for marking scheme)
• “Yes and no. The buses don’t pollute the city which is good, but the power station does polluteand that’s not very good.” (Score 1)
• “The buses do contribute to the air pollution by using fossil fuels but they’re not as harmful asnormal buses with all their gases.” (Score 1)
• “Well they have no outlet so no harmful smoke goes into the air which can damage theOzone layer, and having electricity created by fossil fuels is also more environmental friendly.”(Score 0)
• “Yes, they are. Because electricity isn’t harmful for the environment we only use up our Earth’sgas.” (Score 0)
• “I think these supporters are right as diesel engined buses create more pollution than trolleybuses using electricity.” (Score 0)
• “Yes, because while burning coal no pollution gases will be set free.” (Score 0)
……………………………………………………………………………………………………………
82
Scientific
Literacy
SCIENCE UNIT 2
FLIES
A farmer was working with dairy cattle at an agricultural experiment station. Thepopulation of flies in the barn where the cattle lived was so large that the animals’ healthwas affected. So the farmer sprayed the barn and the cattle with a solution of insecticideA. The insecticide killed nearly all the flies. Some time later, however, the number offlies was again large. The farmer again sprayed with the insecticide. The result was similarto that of the first spraying. Most, but not all, of the flies were killed. Again, within ashort time the population of flies increased, and they were again sprayed with theinsecticide. This sequence of events was repeated five times: then it became apparentthat insecticide A was becoming less and less effective in killing the flies.
The farmer noted that one large batch ofthe insecticide solution had been made andused in all the sprayings. Therefore hesuggested the possibility that the insecticidesolution decomposed with age.
Source: Teaching About Evolution and the Nature ofScience, National Academy Press, Washington, DC,1998, p. 75.
The subject of Unit 2, the use of insecticidesin agriculture, is one that is gaining inimportance. Intensive food production hasbrought with it greater use of insecticidesand herbicides, whose effect we now knowtends to diminish with continued use.However, in specific cases, as in that presentedin this unit, there could be other reasonsbesides the development of resistance in theorganisms targeted. Thus students arepresented here with questions set in a contextthat involves genuine and important issues.
Sample Question 3(Open-Constructed Response)
• Process: Identifying evidence needed in a scientific investigation• Concept: Chemical and physical changes• Situation/Area of application: Science in life and health (health, disease and nutrition)
The farmer’s suggestion is that the insecticide decomposed with age.
Briefly explain how this suggestion could be tested.
In Sample Question 3, attention is directed to the farmer’s own suggestion for the decline inthe effectiveness of insecticide A. Students are asked to identify the kind of evidence thatwould enable the suggestion to be tested. Scientific knowledge of the meaning ofdecomposition and of how this would change the chemical make-up, and thus the effect,
Read the following information and answer the questions below.
83
……………………………………………………………………………………………………………
Scientific
Literacy
of insecticide A is a necessary background for understanding this question. There are severalscientifically valid ways of finding out whether change in the insecticide was responsible forits reduced effect. One is an experimental approach, involving comparison of new and oldbatches in a controlled test. Variables which would need to be controlled in this test are thetype of fly, age of insecticide and the amount of exposure to insecticide. However, answers ofthis kind are accepted without explicit reference to these controls, since they are often clearlyimplied. Partial credit is given for answers which suggest some procedure that is relevant butis not sufficient to make the comparisons necessary.
How did the students answer? Examples (See end of chapter for marking scheme)
• “Some flies could be taken. If they would both be put in a separate box you could use a newspray and an older spray and see what the results are.” (Score 2)
• “Make one big batch of spray. Have two groups of flies and spray each group every six months.Spray group 1 with the big batch, and group 2 a new batch each time.” (Score 2)
• “Try a new bottle of it, then wait till it gets a bit older and the flies come back and then tryagain.” (Score 2)
• “Take batches of the insecticide to a laboratory every few months and have its strength tested.”(Score 2)
• “Do the same thing but buy new insecticide each time, hence proving if his theory is right orwrong.” (Score 1)
• “Maybe if he sent a fresh batch of the poison to the lab with a batch of the old stuff and get themretested the results may prove his theory.” (Score 1)
• “He could test it every year to see if it is not old and would still work.” (Score 0)
• “Get a fly from his shed and another shed and spray them each with the insecticide.” (Score 0)
Sample Question 4 (Open-Constructed Response)
• Process: Drawing or evaluating conclusions• Concept: Physiological change• Situation/Area of application: Science in life and health (health, disease and nutrition)
The farmer’s suggestion is that the insecticide decomposed with age.
Give two alternative explanations as to why “insecticide A was becoming
less and less effective ...”
Explanation 1:
_____________________________________________________________Explanation 2:
_____________________________________________________________
……………………………………………………………………………………………………………
84
Scientific
Literacy
The stimulus for this unit presents observations from which alternative conclusions can bedrawn. Sample Question 4 focuses on possible reasons for the diminishing effect of theinsecticide, apart from the one suggested by the farmer. In the case of answers referring tothe resistance of the flies, scientific knowledge of physiological change and of thepossibility of consequent inherited resistance is required. Almost all students assessed inthe PISA field trial included this as one of their answers. For example: “With the repeateduse of the same insecticide the flies were becoming immune to the formula.” The other twoaccepted explanations involve recognising the possibility of changes in the environmentalconditions and a change in the way the insecticide was applied – conclusions which canbe drawn from the evidence available. Questions such as this, where there are three (andin some cases, more) possible correct answers but where only two are required, raise ageneral issue about marking. It can sometimes be argued that one particular answer isworth more than others, and therefore that full credit should be given only when this oneis included. In the case of Sample Question 4, the response referring to the acquiredresistance of the flies might be considered more important than the other two responses.However, if the question does not signal to the student the preference for one type ofanswer, it is only fair to treat all responses equally.
How did the students answer? Examples (See end of chapter for marking scheme)
• Explanation 1: “With the repeated use of the same insecticide the flies were becoming immuneto the formula.”
Explanation 2: “Over time chemicals in the insecticide rose to the top of spray can leaving waterdiluted (ineffective) at the bottom.” (Score 2)
• Explanation 1: “The flies were becoming immune to the spray.”
Explanation 2: “Heat may make it decompose and temperature change.” (Score 2)
• Explanation 1: “Maybe the flies developed a defense gene so the insecticide would not work.”
Explanation 2: “He (the farmer) used less each time.” (Score 2)
• Explanation 1: “The temperature got very hot and affected the insecticide.”
Explanation 2: “The farmer did not spray the insecticide on the flies properly.” (Score 2)
• “He might not have sprayed it properly.” (Score 1)
• “The flies could have built up an immunity.” (Score 1)
• “There were different types of flies each time.” (Score 1)
• “The flies could have been breeding.” (Score 0)
• “Because every time he sprayed it it became less and less effective.” (Score 0)
• “When there is more of it in the can it is stronger.” (Score 0)
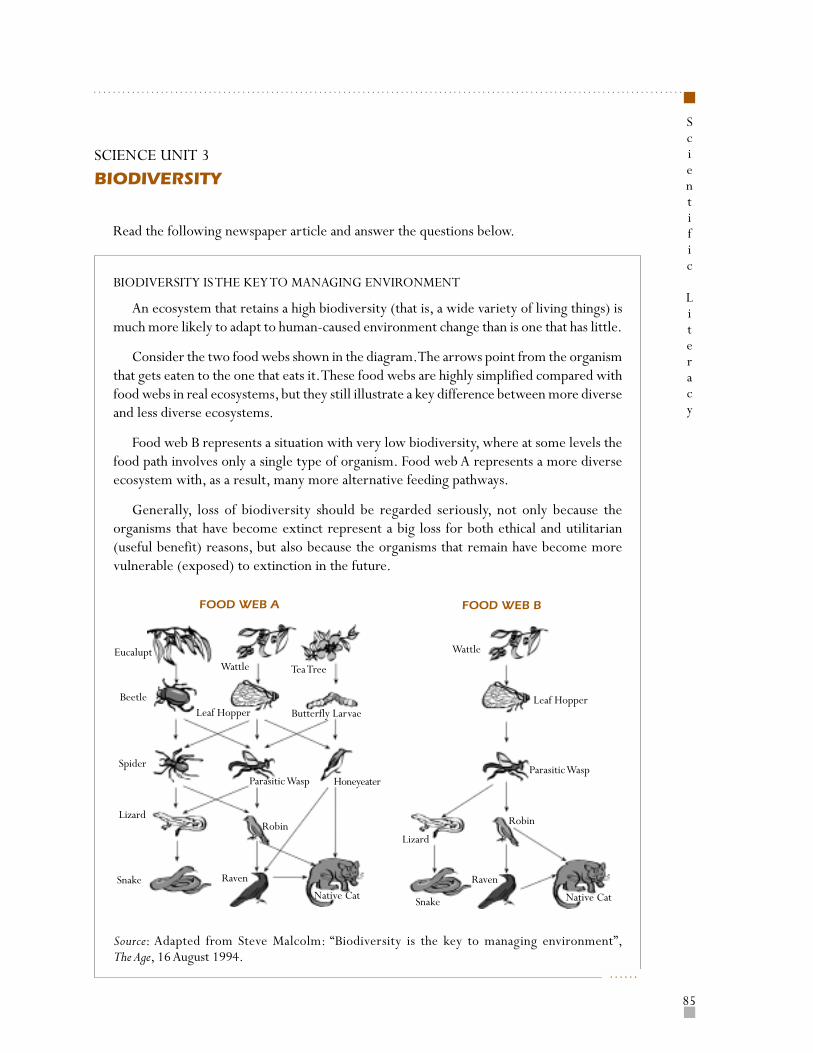
85
……………………………………………………………………………………………………………
Scientific
Literacy
SCIENCE UNIT 3
BIODIVERSITY
BIODIVERSITY IS THE KEY TO MANAGING ENVIRONMENT
An ecosystem that retains a high biodiversity (that is, a wide variety of living things) ismuch more likely to adapt to human-caused environment change than is one that has little.
Consider the two food webs shown in the diagram. The arrows point from the organismthat gets eaten to the one that eats it. These food webs are highly simplified compared withfood webs in real ecosystems, but they still illustrate a key difference between more diverseand less diverse ecosystems.
Food web B represents a situation with very low biodiversity, where at some levels thefood path involves only a single type of organism. Food web A represents a more diverseecosystem with, as a result, many more alternative feeding pathways.
Generally, loss of biodiversity should be regarded seriously, not only because theorganisms that have become extinct represent a big loss for both ethical and utilitarian(useful benefit) reasons, but also because the organisms that remain have become morevulnerable (exposed) to extinction in the future.
Source: Adapted from Steve Malcolm: “Biodiversity is the key to managing environment”,The Age, 16 August 1994.
FOOD WEB A FOOD WEB B
Eucalupt
Beetle
Spider
Lizard
Snake
Wattle
Leaf Hopper
Parasitic Wasp
Robin
Raven
Tea Tree
Butterfly Larvae
Honeyeater
Native Cat
Wattle
Leaf Hopper
Parasitic Wasp
Lizard
Snake
Raven
Native Cat
Robin
……
Read the following newspaper article and answer the questions below.
……………………………………………………………………………………………………………
86
Scientific
Literacy
Sample Question 5 (Multiple Choice)
• Process: Drawing or evaluating conclusions• Concept: Ecosystems• Situation/Area of application: Science in life and health (maintenance and sustainable us of species)
In the article it is stated that “Food web A represents a more diverse
ecosystem with, as a result, many more alternative feeding pathways.”
Look at FOOD WEB A. Only two animals in this food web have three direct
(immediate) food sources. Which two animals are they?
A Native Cat and Parasitic Wasp.
B Native Cat and Raven.
C Parasitic Wasp and Leaf Hopper.
D Parasitic Wasp and Spider.
E Native Cat and Honeyeater.
The first items in the unit (of which Sample Question 5 is one) explore students’ ability to“read” the food webs and to interpret correctly what they represent. Sample Question 5requires students to use their knowledge of food webs and the information given in food web Ato identify the conclusion that fits the data. The answer is to be found in the informationgiven in food web A, and students do not have to recall knowledge of the particular animalsinvolved.
The maintenance of a wide variety of species has far-reaching consequences on a global scale and over a fairlylong time span, although its importance may not beimmediately obvious in everyday life. The impact of the lossof a species, which can happen for any of a number ofreasons, including human activity, may be felt inunexpected ways. Understanding the chain of events andconsequences depends on knowledge of the interdependenceof living things and the ability to use this knowledge topredict how changes in the population of some living thingscan affect others. Food webs are a useful way of presentingand explaining such relationships and are encountereduniversally in science curricula. Unit 3 on biodiversitypresents two food webs, one representing a more diverseecosystem than the other.
87
……………………………………………………………………………………………………………
Scientific
Literacy
Sample Question 6 (Multiple Choice)
• Process: Drawing or evaluating conclusions• Concept: Ecosystems• Situation/Area of application: Science in life and health (maintenance and sustainable us of species)
Food webs A and B are in different locations. Imagine that Leaf Hoppers
died out in both locations. Which one of these is the best prediction
and explanation for the effect this would have on the food webs?
A The effect would be greater in food web A because the Parasitic Wasp
has only one food source in web A.
B The effect would be greater in food web A because the Parasitic Wasp
has several food sources in web A.
C The effect would be greater in food web B because the Parasitic Wasp
has only one food source in web B.
D The effect would be greater in food web B because the Parasitic Wasp
has several food sources in web B.
Sample Question 6 is one of several in the unit which explore students’ understanding of theimpact of change on ecosystems. Other questions require students to generate reasons, in thecontext of the given food webs, why loss of diversity is regarded seriously. Sample Question 6requires the comparison of the two food webs and recognition of the greater impact ofpopulation change on a less diverse ecosystem. A fixed answer format is used, with emphasis onthe reason rather than the choice of food web. Credit is only given for the combination of thecorrect web and relevant reason. The careful reading of the alternative answers given in thequestion did not appear to be an obstacle in pilot trials, since the question was answeredcorrectly by 60 per cent of the students in the PISA field trial.
SCIENCE UNIT 4
CLIMATE CHANGE
WHAT HUMAN ACTIVITIES CONTRIBUTE TO CLIMATE CHANGE?
The burning of coal, oil and natural gas, as well as deforestation and various agriculturaland industrial practices, are altering the composition of the atmosphere and contributingto climate change. These human activities have led to increased concentrations of particlesand greenhouse gases in the atmosphere.
Read the following information and answer the questions below.
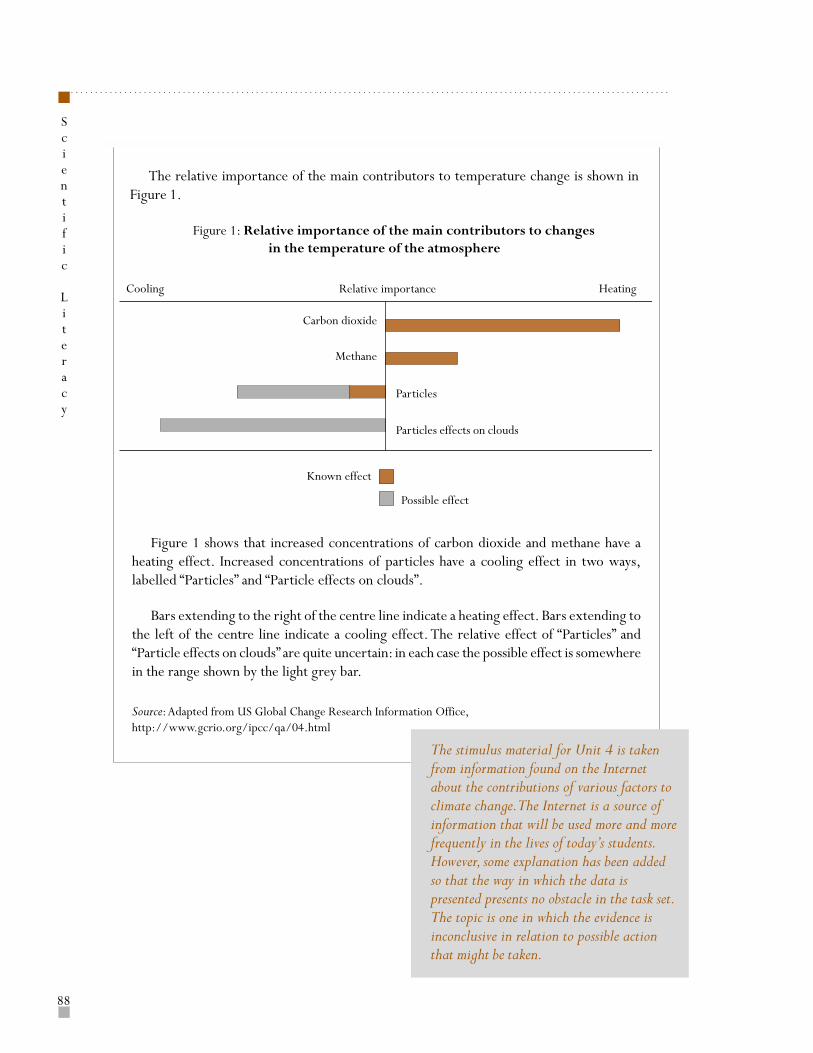
……………………………………………………………………………………………………………
88
Scientific
Literacy
The relative importance of the main contributors to temperature change is shown inFigure 1.
Figure 1: Relative importance of the main contributors to changesin the temperature of the atmosphere
Figure 1 shows that increased concentrations of carbon dioxide and methane have aheating effect. Increased concentrations of particles have a cooling effect in two ways,labelled “Particles” and “Particle effects on clouds”.
Bars extending to the right of the centre line indicate a heating effect. Bars extending tothe left of the centre line indicate a cooling effect. The relative effect of “Particles” and“Particle effects on clouds” are quite uncertain: in each case the possible effect is somewherein the range shown by the light grey bar.
Source: Adapted from US Global Change Research Information Office,http://www.gcrio.org/ipcc/qa/04.html
The stimulus material for Unit 4 is takenfrom information found on the Internetabout the contributions of various factors toclimate change. The Internet is a source ofinformation that will be used more and morefrequently in the lives of today’s students.However, some explanation has been addedso that the way in which the data ispresented presents no obstacle in the task set.The topic is one in which the evidence isinconclusive in relation to possible actionthat might be taken.
HeatingRelative importance
Carbon dioxide
Methane
Particles
Particles effects on clouds
Known effect
Possible effect
Cooling
89
……………………………………………………………………………………………………………
Scientific
Literacy
Sample Question 7 (Open-Constructed Response)
• Process: Communicating valid conclusions• Concept: Atmospheric change• Situation/Area of application: Science in Earth and environment (weather and climate)
Use the information in Figure 1 to support the view that priority
should be given to reducing the emission of carbon dioxide from the
human activities mentioned.
Sample Question 7 requires students to use the information given to support a particularcourse of action, namely to reduce the emission of carbon dioxide as a result of humanactivity. A further question (not shown here) asks students to use the same information in adifferent way, to support the view that the effects of human activity do not constitute a realproblem. In both cases, the questions assess the ability to communicate conclusions based onevidence. In combination, the two questions exemplify the caution with which scientificinformation has to be applied in such complex cases. The questions depend on knowledge ofthe subject matter, such as why cooling and heating are important in climate change and howcarbon dioxide, methane and particles in the air can bring about these effects. However, thefocus is on constructing an argument using the given data and thus assesses the ability tocommunicate effectively. In this example, credit is given for answers which identify theinformation of relevance to the argument put forward and no credit is given for answers whichfail to focus on the argument for reduction, even if they concern the activities that contributeto the production of carbon dioxide.
How did the students answer? Examples (See end of chapter for marking scheme)
• “The emission of CO2 causes significant heating to the atmosphere and therefore should belessened.” (Score 1)
• “Carbon dioxide in the Earth’s atmosphere heats up the Earth. Normally this wouldn’t be aproblem if the possible effects were proven true. However, they haven’t so the graph shows anincrease in heat. This shows it is necessary to cut down on carbon dioxide emissions.” (Score 1)(Note: This answer distinguishes between known and possible effects)
• “According to Figure 1 reduction in the emission of carbon dioxide is necessary because itconsiderably heats the Earth.” (Score 1)
• “The burning of fossil fuel such as oil, gas and coal are contributing to the build up of gases inthe atmosphere, one of which is carbon dioxide (CO2). This gas affects the temperature of theEarth which increases causing a greenhouse effect.” (Score 0)
• “The way that humans could help control carbon dioxide levels to drop would be by not drivinga car, don’t burn coal and don’t chop down forests.” (Score 0)
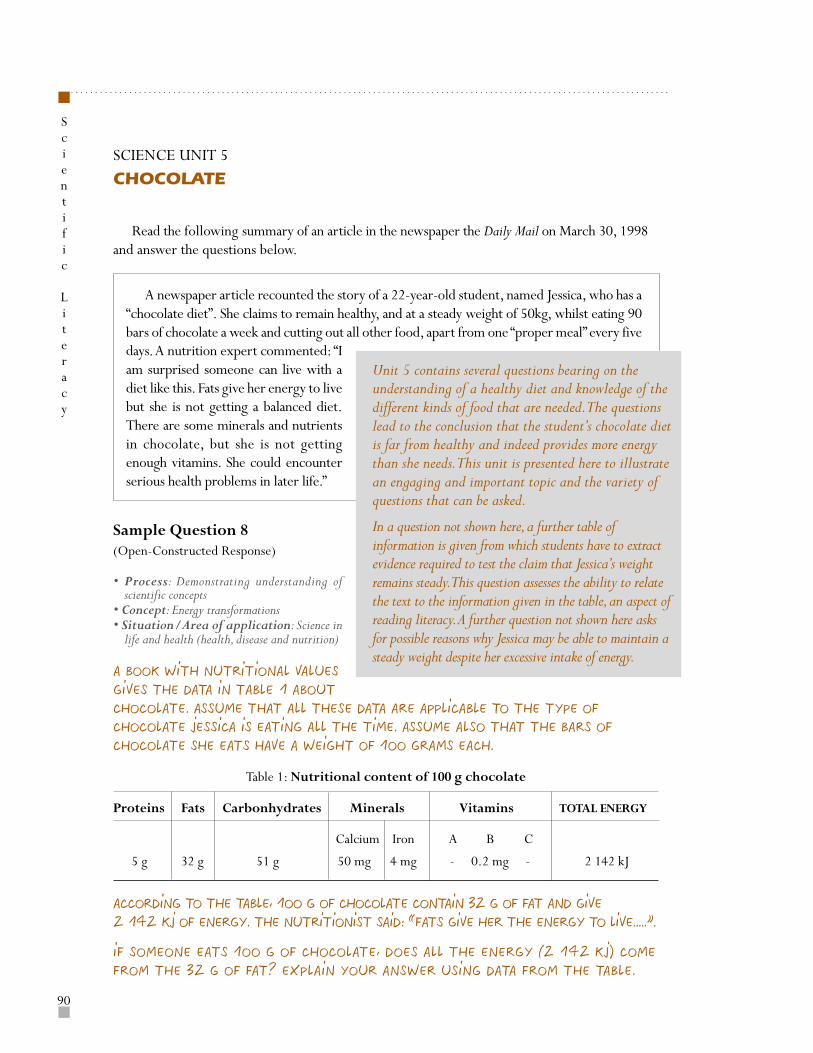
……………………………………………………………………………………………………………
90
Scientific
Literacy
SCIENCE UNIT 5
CHOCOLATE
A newspaper article recounted the story of a 22-year-old student, named Jessica, who has a“chocolate diet”. She claims to remain healthy, and at a steady weight of 50kg, whilst eating 90bars of chocolate a week and cutting out all other food, apart from one “proper meal” every fivedays. A nutrition expert commented: “Iam surprised someone can live with adiet like this. Fats give her energy to livebut she is not getting a balanced diet.There are some minerals and nutrientsin chocolate, but she is not gettingenough vitamins. She could encounterserious health problems in later life.”
Unit 5 contains several questions bearing on theunderstanding of a healthy diet and knowledge of thedifferent kinds of food that are needed. The questionslead to the conclusion that the student’s chocolate dietis far from healthy and indeed provides more energythan she needs. This unit is presented here to illustratean engaging and important topic and the variety ofquestions that can be asked.
In a question not shown here, a further table ofinformation is given from which students have to extractevidence required to test the claim that Jessica’s weightremains steady. This question assesses the ability to relatethe text to the information given in the table, an aspect ofreading literacy. A further question not shown here asksfor possible reasons why Jessica may be able to maintain asteady weight despite her excessive intake of energy.
Sample Question 8(Open-Constructed Response)
• Process: Demonstrating understanding ofscientific concepts
• Concept: Energy transformations• Situation/Area of application: Science in
life and health (health, disease and nutrition)
A book with nutritional values
gives the data in Table 1 about
chocolate. Assume that all these data are applicable to the type of
chocolate Jessica is eating all the time. Assume also that the bars of
chocolate she eats have a weight of 100 grams each.
According to the table, 100 g of chocolate contain 32 g of fat and give
2 142 kJ of energy. The nutritionist said: “Fats give her the energy to live.....”.
If someone eats 100 g of chocolate, does all the energy (2 142 kJ) come
from the 32 g of fat? Explain your answer using data from the table.
Table 1: Nutritional content of 100 g chocolate
Proteins Fats Carbonhydrates Minerals Vitamins TOTAL ENERGY
Calcium Iron A B C
5 g 32 g 51 g 50 mg 4 mg - 0.2 mg - 2 142 kJ
Read the following summary of an article in the newspaper the Daily Mail on March 30, 1998and answer the questions below.
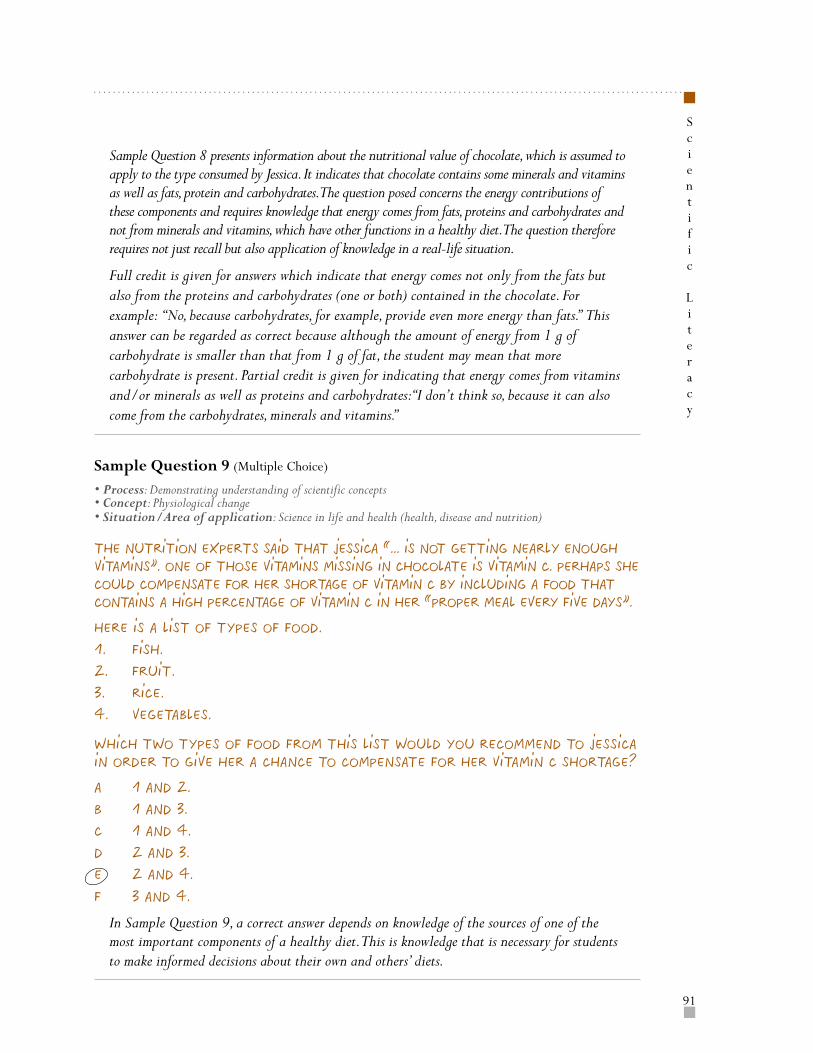
91
……………………………………………………………………………………………………………
Scientific
Literacy
Sample Question 8 presents information about the nutritional value of chocolate, which is assumed toapply to the type consumed by Jessica. It indicates that chocolate contains some minerals and vitaminsas well as fats, protein and carbohydrates. The question posed concerns the energy contributions ofthese components and requires knowledge that energy comes from fats, proteins and carbohydrates andnot from minerals and vitamins, which have other functions in a healthy diet. The question thereforerequires not just recall but also application of knowledge in a real-life situation.
Full credit is given for answers which indicate that energy comes not only from the fats butalso from the proteins and carbohydrates (one or both) contained in the chocolate. Forexample: “No, because carbohydrates, for example, provide even more energy than fats.” Thisanswer can be regarded as correct because although the amount of energy from 1 g ofcarbohydrate is smaller than that from 1 g of fat, the student may mean that morecarbohydrate is present. Partial credit is given for indicating that energy comes from vitaminsand/or minerals as well as proteins and carbohydrates: “I don’t think so, because it can alsocome from the carbohydrates, minerals and vitamins.”
Sample Question 9 (Multiple Choice)
• Process: Demonstrating understanding of scientific concepts• Concept: Physiological change• Situation/Area of application: Science in life and health (health, disease and nutrition)
The nutrition experts said that Jessica “... is not getting nearly enough
vitamins”. One of those vitamins missing in chocolate is vitamin C. Perhaps she
could compensate for her shortage of vitamin C by including a food that
contains a high percentage of vitamin C in her “proper meal every five days”.
Here is a list of types of food.
1. Fish.
2. Fruit.
3. Rice.
4. Vegetables.
Which two types of food from this list would you recommend to Jessica
in order to give her a chance to compensate for her vitamin C shortage?
A 1 and 2.
B 1 and 3.
C 1 and 4.
D 2 and 3.
E 2 and 4.
F 3 and 4.
In Sample Question 9, a correct answer depends on knowledge of the sources of one of themost important components of a healthy diet. This is knowledge that is necessary for studentsto make informed decisions about their own and others’ diets.
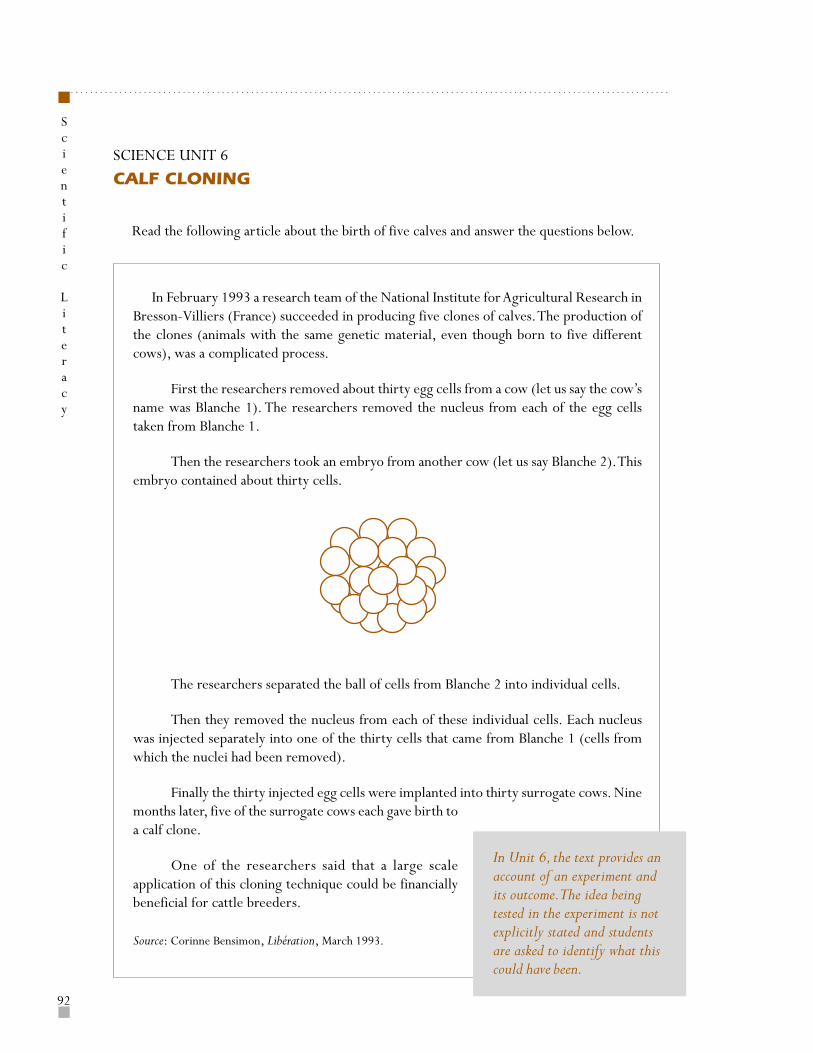
……………………………………………………………………………………………………………
92
Scientific
Literacy
SCIENCE UNIT 6
CALF CLONING
In February 1993 a research team of the National Institute for Agricultural Research inBresson-Villiers (France) succeeded in producing five clones of calves. The production ofthe clones (animals with the same genetic material, even though born to five differentcows), was a complicated process.
First the researchers removed about thirty egg cells from a cow (let us say the cow’sname was Blanche 1). The researchers removed the nucleus from each of the egg cellstaken from Blanche 1.
Then the researchers took an embryo from another cow (let us say Blanche 2). Thisembryo contained about thirty cells.
The researchers separated the ball of cells from Blanche 2 into individual cells.
Then they removed the nucleus from each of these individual cells. Each nucleuswas injected separately into one of the thirty cells that came from Blanche 1 (cells fromwhich the nuclei had been removed).
Finally the thirty injected egg cells were implanted into thirty surrogate cows. Ninemonths later, five of the surrogate cows each gave birth toa calf clone.
One of the researchers said that a large scaleapplication of this cloning technique could be financiallybeneficial for cattle breeders.
Source: Corinne Bensimon, Libération, March 1993.
In Unit 6, the text provides anaccount of an experiment andits outcome. The idea beingtested in the experiment is notexplicitly stated and studentsare asked to identify what thiscould have been.
Read the following article about the birth of five calves and answer the questions below.
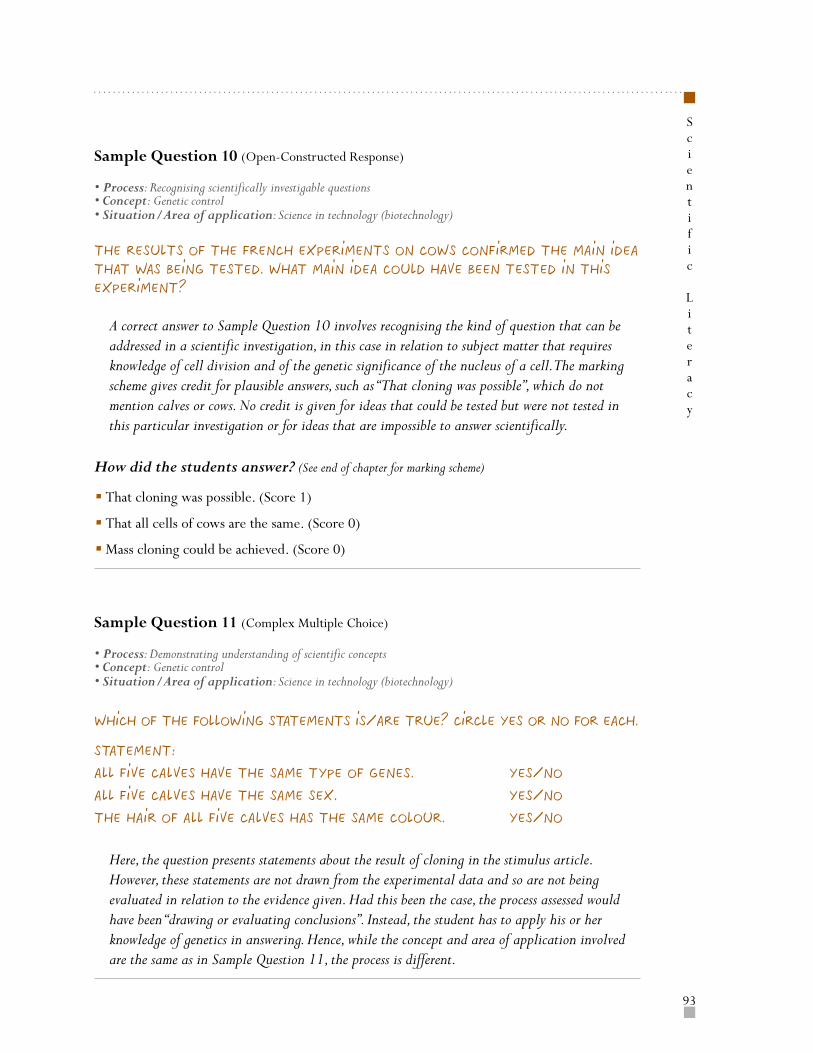
93
……………………………………………………………………………………………………………
Scientific
Literacy
Sample Question 10 (Open-Constructed Response)
• Process: Recognising scientifically investigable questions• Concept: Genetic control• Situation/Area of application: Science in technology (biotechnology)
The results of the French experiments on cows confirmed the main idea
that was being tested. What main idea could have been tested in this
experiment?
A correct answer to Sample Question 10 involves recognising the kind of question that can beaddressed in a scientific investigation, in this case in relation to subject matter that requiresknowledge of cell division and of the genetic significance of the nucleus of a cell. The markingscheme gives credit for plausible answers, such as “That cloning was possible”, which do notmention calves or cows. No credit is given for ideas that could be tested but were not tested inthis particular investigation or for ideas that are impossible to answer scientifically.
How did the students answer? (See end of chapter for marking scheme)
• That cloning was possible. (Score 1)
• That all cells of cows are the same. (Score 0)
• Mass cloning could be achieved. (Score 0)
Sample Question 11 (Complex Multiple Choice)
• Process: Demonstrating understanding of scientific concepts• Concept: Genetic control• Situation/Area of application: Science in technology (biotechnology)
Which of the following statements is/are true? Circle Yes or No for each.
Statement:
All five calves have the same type of genes. Yes/No
All five calves have the same sex. Yes/No
The hair of all five calves has the same colour. Yes/No
Here, the question presents statements about the result of cloning in the stimulus article.However, these statements are not drawn from the experimental data and so are not beingevaluated in relation to the evidence given. Had this been the case, the process assessed wouldhave been “drawing or evaluating conclusions”. Instead, the student has to apply his or herknowledge of genetics in answering. Hence, while the concept and area of application involvedare the same as in Sample Question 11, the process is different.
……………………………………………………………………………………………………………
94
Scientific
Literacy
SCORING SCHEME FOR THE SCIENCE SAMPLE QUESTIONS
SCIENCE UNIT 1 – BUSES
Sample Question 1
Score 1: Response option C – The water will spill over side 2.
Score 0: Other.
Sample Question 2
Score 1: Answers which state that the power station or the burning of coal also contributesto air pollution. For example:
• “No, because the power station causes air pollution as well.”• “Yes, but this is only true for the trolley bus itself; burning coal, however, causes air pollution.”
Score 0: No or yes, without a correct explanation.
SCIENCE UNIT 2 – FLIES
Sample Question 3
Score 2: Answers of type a, b or c:
a. Answers which mention control of all three variables (type of flies, age of insecticide, andexposure), for example:
• “Compare the results from a new batch of the insecticide with results from the oldbatch on two groups of flies of the same species that have not been previously exposedto the insecticide.”
b. Answers which mention control of two of the three variables (type of flies, age of insecticide,and exposure), for example:
• “Compare the results from a new batch of the insecticide with the results from the oldbatch on the flies in the barn.”
c. Answers which mention control of only one variable of three variables (type of flies, ageof insecticide, and exposure), for example:
• “(Chemically) analyse samples of the insecticide at regular intervals to see if it changesover time.”
Score 1: Answers of type d or e:
d. “Spray the flies with a new batch of insecticide, but without mentioning comparison withold batch.”
e. “(Chemically) analyse samples of the insecticide but without mentioning comparison ofanalyses over time.”
Note: Score 1 if sending samples of the insecticide to a laboratory is mentioned.
Score 0: Other.
95
……………………………………………………………………………………………………………
Scientific
Literacy
Sample Question 4
Score 2: Answers which give any two of the following explanations:
• “Flies with resistance to the insecticide survive and pass on that resistance to latergenerations (also credit for ‘immunity’ although it is recognised that it is not strictlyanalogous to ‘resistance’).”
• “A change in the environmental conditions (such as temperature).”
• “A change in the way the insecticide was applied (including variation in the amount used).”
Score 1: Answers which give one explanation from the above.
Score 0: Other, including new flies moving to the barn from nearby (unsprayed) areas.
SCIENCE UNIT 3 – BIODIVERSITY
Sample Question 5
Score 1: Response option A – Native Cat and Parasitic Wasp.
Score 0: Other.
Sample Question 6
Score 1: Response option B – The effect would be greater in food web B because the ParasiticWasp has only one food source in web B.
Score 0: Other.
SCIENCE UNIT 4 – CLIMATE CHANGE
Sample Question 7
Score 1: Answers which indicate that:• Carbon dioxide is relatively the largest contributor to the heating effect and/or the effect
of carbon dioxide is a known effect.or• Carbon dioxide is relatively the largest contributor to the heating effect and/or the effect
of carbon dioxide is a known effect, but which also mention that the possible effects ofparticles should be considered.
Score 0: Other, including answers which• Do not indicate that carbon dioxide is relatively the largest contributor to the heating effect.or• Do not focus on the fact that the effects of carbon dioxide are known.or• Indicate that an increase in temperature will have a bad effect on the Earth.or• Focus on the activities that contribute to carbon dioxide production.
……………………………………………………………………………………………………………
96
Scientific
Literacy
SCIENCE UNIT 5 – CHOCOLATE
Sample Question 8
Score 2: Answers which indicate “no” and explain that some energy comes from carbohydratesor proteins or carbohydrates + proteins.
Score 1: Answers which indicate “no” and explain that some energy comes from carbohydratesor proteins or carbohydrates + proteins and also from vitamins and/or minerals.
Score 0: Answers which• Indicate “yes”.or• Indicate “no” with no explanation.or• Indicate “no” with irrelevant comment.or• Indicate “no” with the explanation that (only) minerals and/or vitamins will contribute to
energy as well.or• Indicate “no” with the explanation that other components of chocolate (without
mentioning them) will contribute as well.
Sample Question 9
Score 1: Response option E – 2 and 4, alternative E.
Score 0: Other.
SCIENCE UNIT 6 – CALF CLONING
Sample Question 10
Score 1: Answers which give an acceptable main idea, for example:• “Testing whether cloning of calves is possible.”• “Determining the number of calf clones that could be produced.”
Score 0: Answers which• Do not mention calves or cloning.or• In effect repeat that “a large-scale application of this cloning technique could be financially
beneficial for cattle breeders”.
Sample Question 11
Score 1: Yes, Yes, Yes.
Score 0: Other.
97
……………………………………………………………………………………………………………
References
REFERENCES
American Association for the Advancement of Science (1989), Science for all Americans, NewYork: Oxford University Press.
American Association for the Advancement of Science (1993), Benchmarks for Science Literacy,New York: Oxford University Press.
Applebee, A.N., Langer, J.A. & Mullis, I.V.S. (1987), Learning to be Literate in America: Reading,Writing and Reasoning, Princeton NJ: Educational Testing Service.
Champagne, A.B. & Klopfer, L.E. (1982), “Actions in a time of crisis”, Science Education, 66(4),pp. 503-514.
Cross, R. (1994), “Scientific literacy and democracy”, Search, 25(9), pp. 283-286.
Cumming, J. (1997), “Developments in numeracy: what is it and how should we teach it?”, AustralianLanguage Matters, 5(1), pp. 7-8.
Dangerfield, L. (1989), “Scientific literacy: myth or miracle”, The ACT Science Teacher, 14(1), pp. 26-31.
Fleming, R. (1989), “Literacy for a technological age”, Science Education, 73(4), pp. 391-404.
Galbraith, P.L., Carss, M.C., Grice, R.D., Endean, L. & Warry, M. (1997), “Towards scientific literacyfor the third millenium”, International Journal of Science Education, 19(4), pp. 447-467.
Kirsch, I.S. & Murray, T.S. (1998), Adult Literacy in OECD Countries: Technical Report on the FirstInternational Adult Literacy Survey, Washington, DC: US Department of Education.
Krugly-Smolska, E.T. (1990), “Scientific literacy in developed and developing countries”, InternationalJournal of Science Education, 12, pp. 473-480.
OECD (1999), Measuring Student Knowledge and Skills: A New Framework for Assessment, Paris: OECD.
Paulos, J.A. (1988), Innumeracy: Mathematical Illiteracy and its Consequences, New York: Hill and Wang.
Venezky, R.L., Kaestle, C.F. & Sum, A.M. (1987), The Subtle Danger: Reflections on the Literacy Abilitiesof America’s Young Adults, Princeton, NJ: Educational Testing Service.
Zen, E. (1992), “Scientific literacy: what it is, why it is important, and what can scientists do to improvethe situation?”, The Australian Science Teachers Journal, 38(3), pp. 18-23.
……………………………………………………………………………………………………………
98
Further
Reading
FURTHER READING
Almond, R.G. & Mislevy, R.J. (1998), Graphical Models and Computerized Adaptive Testing, TOEFLTechnical Report No.14, Educational Testing Service, Princeton, NJ, March.
Baker, L. (1991), “Metacognition, reading and science education”, in C. M. Santa and D. E. Alvermann(eds.), Science Learning: Processes and Applications, International Reading Association, Newark, DE,pp. 2-13.
Bennett, R.E. (1993), “On the meanings of constructed response”, in R.E. Bennett (ed.), Constructionvs. Choice in Cognitive Measurement: Issues in Constructed Response, Performance Testing, and PortfolioAssessment, Lawrence Erlbaum Associates, Hillsdale, NJ, pp. 1-27.
Binkley, M. & Linnakylä, P. (1997), “Teaching reading in the United States and Finland”, in M. Binkley,K. Rust and T. Williams (eds.), Reading Literacy in an International Perspective, U.S. Department ofEducation, Washington, DC.
Bruner, J. (1990), Acts of Meaning, Harvard University Press, Cambridge, MA.
Bybee, R.W. (1997), “Towards an understanding of scientific literacy”, in W. Grabe and C. Bolte (eds.),Scientific Literacy – An International Symposium, IPN, Kiel.
Council of Europe (1996), Modern Languages: Learning, Teaching, Assessment. A Common EuropeanFramework of Reference, CC LANG (95) 5 Rev. IV, Strasbourg.
Council of Ministers of Education, Canada (1994), Student Achievement Indicators Program: Readingand Writing, Toronto.
de Lange, J. & Verhage, H. (1992), Data Visualization, Sunburst, Pleasantville, NY.
de Lange, J. (1987), Mathematics, Insight and Meaning, OW and OC, Utrecht.
Devlin, K. (1994, 1997), Mathematics, The Science of Patterns, Scientific American Library, New York.
Dole, J., Duffy, G., Roehler, L. & Pearson, P. (1991), “Moving from the old to the new: Research onreading comprehension instruction”, Review of Educational Research, 16 (2), pp. 239-264.
Ehrlich, M.F. (1996), “Metacognitive monitoring in the processing of anaphoric devices in skilled andless-skilled comprehenders”, in C. Cornoldi and J. Oakhill (eds.), Reading Comprehension Difficulties:Processes and Interventions, Lawrence Erlbaum Associates, Mahwah, NJ, pp. 221-249.
99
……………………………………………………………………………………………………………
Further
Reading
Ehrlich, M. F., Kurtz-Costes, B. & Loridant, C. (1993), “Cognitive and motivational determinants ofreading comprehension in good and poor readers”, Journal of Reading Behavior, 25, pp. 365-381.
Einstein, A. (1933), “Preface to M. Plank”, Where is Science Going?, Allen and Unwin, London.
Elley, W.B. (1992), How in the World do Students Read?, International Association for the Evaluation ofEducational Achievement, The Hague.
Frederickson, N. (1984), “The real test bias”, American Psychologist, 39, pp. 193-202.
Freudenthal, H. (1973), Mathematics as an Educational Task, Reidel, Dordrecht.
Freudenthal, H. (1983), Didactical Phenomenology of Mathematical Structures, Reidel, Dordrecht.
Graeber, W. & Bolte, C. (Eds) (1997), Scientific Literacy – An International Symposium, IPN, Kiel.
Gronlund, N.E. (1968), Constructing Achievement Tests, Prentice Hall, Englewood Cliffs.
Grünbaum, B. (1985), “Geometry strikes again”, Mathematics Magazine, 58 (1), pp. 12-18.
Hawking, S.W. (1988), A Brief History of Time, Bantam Press, London.
Hubbard, R. (1989), “Notes from the underground: Unofficial literacy in one sixth grade”, Anthropologyand Education Quarterly, 20, pp. 291-307.
Jones, S. (1995), “The practice(s) of literacy”, in Literacy, Economy and Society: Results of the FirstInternational Adult Literacy Survey, OECD and Statistics Canada, Paris and Ottawa, pp. 87-113.
Kirsch, I. (1995), “Literacy performance on three scales: Definitions and results”, in Literacy, Economyand Society: Results of the First International Adult Literacy Survey, OECD and Statistics Canada, Paris andOttawa, pp. 27-53.
Kirsch, I.S. & Mosenthal, P.B. (1989-1991), “Understanding documents. A monthly column”, Journalof Reading, International Reading Association, Newark, DE.
Kirsch, I. S. & Mosenthal, P.B. (1994), “Interpreting the IEA reading literacy scales”, in M. Binkley, K. Rust andM. Winglee (eds.), Methodological Issues in Comparative Educational Studies: The Case of the IEA Reading LiteracyStudy, U.S. Department of Education, National Center for Education Statistics, Washington, DC, pp. 135-192.
Kirsch, I., Jungeblut, A. & Mosenthal, P.B. (1998), “The measurement of adult literacy”, in T. S. Murray,I. S. Kirsch, and L. Jenkins (eds.), Adult Literacy in OECD Countries: Technical Report on the First InternationalAdult Literacy Survey, U.S. Department of Education, National Center for Education Statistics, Washington, DC.
Langer, J. (1995), Envisioning Literature, International Reading Association, Newark, DE.
Linnakylä, P. (1992), “Recent trends in reading literacy research in Finland”, in P. Belanger, C. Winterand A. Sutton (eds.), Literacy and Basic Education in Europe on the Eve of the 21st Century, Council ofEurope, Strassbourg, pp. 129-135.
……………………………………………………………………………………………………………
100
Further
Reading
Lundberg, I. (1991), “Reading as an individual and social skill”, in I. Lundberg and T. Hoien (eds.),Literacy in a World of Change, Center for Reading Research/UNESCO, Stavanger.
Maccarthey, S.J. & Raphael, T.E. (1989), Alternative Perspectives of Reading/Writing Connections,College for Education, Institute for Research on Teaching,. Occasional paper #130, Michigan StateUniversity.
Millar, R. & Osborne, J. (1998), Beyond 2000: Science Education for the Future, King’s College LondonSchool of Education, London.
Myers, M. & Paris, S.G. (1978), “Children’s metacognitive knowledge about reading”, Journal ofEducational Psychology, 70, pp. 680-690.
Paris, S., Wasik, B. &Turner, J. (1991), “The development of strategic readers”, in R. Barr, M. Kamiland P. Mosenthal (eds.), Handbook of Reading Research, vol. II, Longman, New York.
Senechal, M. (1990), “Shape”, in L.A. Steen (ed.), On the Shoulders of the Giant – New Approaches toNumeracy, National Academy Press, Washington D.C., pp. 139-182.
Shamos, M.H. (1995), The Myth of Scientific Literacy, Rutgers University Press, New Brunswick.
Smith, M.C. (1996), “Differences in adults’ reading practices and literacy proficiencies”, Reading ResearchQuarterly, 31, pp. 196-219.
Sticht, T.G. (ed.) (1975), Reading for Working: A Functional Literacy Anthology, Human Resources ResearchOrganization, Alexandria, VA.
Stiggins, R.J. (1982), “An analysis of the dimensions of job-related reading”, Reading World, 82, pp. 237-247.
Streefland, L. (1990), Fractions in Realistic Mathematics Education, A Paradigm of Developmental Research,Reidel Dordrecht.
Stuart, I. (1990), “Change”, in L.A. Steen (ed.), On the Shoulders of the Giant – New Approaches toNumeracy, National Academy Press, Washington D.C., pp. 183-218.
Taube, K. & Mejding, J. (1997), “A nine-country study: What were the differences between the lowand high performing students in the IEA Reading Literacy Study?”, in M. Binkley, K. Rust and T. Williams(eds.), Reading Literacy in the International Perspectives, U.S. Department of Education, National Centerfor Education Statistics, Washington, DC, pp. 63-100.
Traub, R.E. (1993), “On the equivalence of the traits assessed by multiple-choice and constructed-responsetests”, in R. E. Bennett (ed.), Construction vs. Choice in Cognitive Measurement: Issues in Constructed Response,Performance Testing, and Portfolio Assessment, Lawrence Erlbaum Associates, Hillsdale, NJ, pp. 29-44.
Travers, K.J. & Westbury, I. (1989), The IEA Study of Mathematics, vol. 1, Analysis of mathematicscurricula, Pergamon Press, Oxford.
Treffers, A. (1986), Three Dimensions, Reidel, Dordrecht.
101
……………………………………………………………………………………………………………
Further
Reading
Treffers, A. & Goffree, F. (1985), “Rational analysis of realistic mathematics education”, in L. Streefland(ed.), Proceedings of the Ninth International Conference for the Psychology of Mathematics Education (PME),OW and OC, Utrecht, pp. 79-122.
UNESCO (1993), International Forum on Scientific and Technological Literacy for All, Final Report,UNESCO, Paris.
Ward, W.C., Dupree, D. & Carlson, S.B. (1987), A Comparison of Free-response and Multiple-choice Questionsin the Assessment of Reading Comprehension (RR-87-20), Educational Testing Service, Princeton, NJ.
Werlich, E. (1976), A Text Grammar of English, Quelle and Meyer, Heidelberg.
Ziman, J.M. (1980), Teaching and Learning about Science and Society, Cambridge University Press.

103
……………………………………………………………………………………………………………
AppendixAPPENDIX 1
FUNCTIONAL EXPERT GROUP MEMBERSHIP
Science
Peter FenshamMonash University, Melbourne,Australia
Raul GagliardiUniversity of Geneva, Geneva,Switzerland
Wynne Harlen,Scottish Council for Researchin Education,Edinburgh, United Kingdom
Svein LieUniversity of Oslo,Oslo, Norway
Manfred PrenzelInstitut für die Pädagogik derNaturwissenschaften (IPN)(Institute for Science Education)Kiel, Germany
Senta RaizenNational Center for ImprovingScience EducationWashington, DC, United States
Donghee ShinKorea Institute of Curriculum andEvaluationSeoul, Korea
Elizabeth StageUniversity of CaliforniaOakland, California, United States
Reading
Irwin Kirsch, ChairEducational Testing ServicePrinceton, New Jersey, United States
Marilyn BinkleyNational Center forEducational StatisticsWashington, DC, United States
Alan DaviesUniversity of Edinburgh, Scotland,United Kingdom
Stan JonesStatistics CanadaNova Scotia, Canada
John de JongSwets Language Testing UnitArnhem, The Netherlands
Dominique LafontaineUniversité de Liège, Liège,Belgium
Pirjo LinnakyläUniversity of JyvaskylaJyvaskyla, Finland
Martine RémondInstitut National de RecherchePédagogique, Paris, France
Wolfgang SchneiderUniversity of Würzburg,Würzburg, Germany
Ryo WatanabeNational Institute for EducationalResearch, Tokyo, Japan
Mathematics
Raimondo BollettaCentro Europeo dell’Educazione,Frascati, Italy
Sean CloseSt Patricks College,Dublin, Ireland
Jan de Lange, ChairUtrecht University, Utrecht,The Netherlands
Maria Luisa MorenoInstituto Nacional de Calidad yEvaluación (INCE)Madrid, Spain
Mogens NissRoskilde University, Roskilde,Denmark
Kyung Mee ParkChungbuk National University,Seoul, Korea
Thomas RombergUniversity of Wisconsin-MadisonMadison, Wisconsin, United States
Peter SchüllerFederal Ministry of Educationand Cultural AffairsVienna, Austria
…………
……………………………………………………………………………………………………………
104
Appendix
Australian Council forEducational Research (ACER)
Margaret WuCo-ordinator, ACER Test Development
Jan Lokan
Joy McQueen
Juliette Mendelovits
Gayl O’Connor
APPENDIX 2TEST DEVELOPMENT TEAM
National Institute forEducational Measurement (CITO)
Steven BakkerCo-ordinator, CITO Test Development
Bart Bossers
Karin Bugel
Truus Dekkers
Ico De Roo
Kees Lagerwaard
Erna Van Hest
Gerben van Lent


![PISA Released Item Reading[1]](https://img.pdfslide.us/doc/110x75/5448abfcafaf9f39088b4d32/pisa-released-item-reading1.jpg)