Embed Size (px)
Citation preview

Perception & Psychophysics2000.62 (1).127-136
The Pieron function in the threshold region
DELPHINE PINS and CLAUDE BONNETUnioersite Louis Pasteur, Strasbourg, France
The Pieron function (Pieron, 1914, 1920, 1952) describes the decay of reaction time (RT) when theintensity of the stimulus is increased. It is generally demonstrated within a suprathreshold range of intensities. However, in some studies, for the lowest range of intensities, the exponent of the function isclearly greater than that for the upper ranges of intensities. Such an increase in the exponent for thelowest intensities is assumed to result from a combined effect of stimulus intensity and of stirnulis uncertainty in detection. Our first experiment used luminance levels that covered all the scotopic rangeand a spatial two-alternative forced-choice task in which both accuracy and RT were measured. Itdemonstrated a drastic increase in the exponent in the Pieron function when the intensities reachedthe threshold region. Since the estimates of the threshold region may have been biased by the use of amuch larger range of luminances, a second experiment was conducted using luminances that coveredonly the threshold region. This experiment confirmed the previous estimates for the threshold region.
where RT is SRT, to is the asymptotic RT reached at thehighest stimulus intensities, {3 is a free parameter, I is the in-
The authors thank 1. C. Baird and L. Allan. as well as, an anonymousreviewer for their helpful suggestions and comments on a previous version of this paper. Correspondence should be addressed to D. Pins, Laboratoire de Psychopathologic et Pharmacologie de la Cognition, INSERM U405, Clinique Psychiatrique, Hopitaux Universitaires deStrasbourg, I Place de l'Hopital, 67091 Strasbourg, France (e-mail:[email protected]).
Since Exner (1868), Wundt (1874), Cattell (1886), andPieron (1914), many studies in different sensory modalities have demonstrated an inverse relationship betweensimple reaction time (SRT) and stimulus intensity. A possible exception occurs when color stimuli has been used(Luce, 1986). Various equations have been suggested tosummarize the data. Bujas (1935) proposed a rectangular hyperbola, which is a special case of the Pieron function (see Equation I) for a = 1. This function was firstadopted by Yamamoto and Kawamura (1981), but waslater slightly modified by Yamamoto et a1. (1982). Hara(1955) proposed a linear logarithm function that mighthave led to a change in Bujas's original function by addinglogarithms. Woodworth and Schlosberg (1955) suggestedan exponential function. Other functions, such as thesymmetric logistic and Michaelis's functions (Schweickert, Dahn, & McGuigan, 1988), have also been investigated. In a recent paper, Bonnet, Zamora, Buratti, andGuirao ( 1999) compared these different solutions usinga large sample of RTs in several taste concentration experiments. Overall, the Pieron function provided the bestfit to the data.
Pieron's law (Pieron, 1914, 1920, 1952) describes thedecrease of simple reaction time (SRT) with the increaseof supraliminal intensities ofa given stimulus by a powerfunction in the form:
(RT - to) = {3I-a. (I)
tensity ofthe stimulus, and a is the exponent ofthe function.The functional significance of these parameters is still uncertain. However, parameters a and to appear to be specificfor a given sensory modality (see Bonnet, 1992a, I992b).Parameter toappears to represent the combination ofat leasttwo constant parameters: The duration ofthe motor component and a specific processing time for a given sensorymodality. Because tovaries between sensory modalities, itsfunctional significance is presumably more sensory thandecisional (see Bonnet, I992a). However, to may be shownto vary with the task (see Pins & Bonnet, 1996).
Although such an effect of stimulus intensity on RT hasbeen questioned in choice reaction time (CRT) tasks whenvisual stimuli were used (e.g., Luce, 1986), some authorshave shown that CRT decreases when the luminance of thestimulus increases (e.g., Lappin & Disch, 1972; Pachella &Fisher, 1969; Posner, 1986). Moreover, in experiments inwhich the subject had to localize whether a visual stimulus,which varied in luminance from trial to trial, appeared to theleft or to the right ofa fixation point, Pins and Bonnet (1996)have shown that the exponent ofthe Pieron function does notvary with the complexity ofthe psychophysical task. The effect of intensity, estimated by the value of the exponent a,is much the same in CRT tasks as in SRT tasks. The exponent of the Pieron function does not change with the complexity ofthe additional stages that are required between luminance processing and the decision process. A change inRT as a function of luminance probably arises only as aconsequence of the luminance processing stage.
Most RT models assume that responses result basicallyfrom some kind of accumulation of information over time(e.g., Grice, 1968; Link, 1978, 1992; Luce, 1986; Luce &Green, 1972; McGill, 1961, 1963). When stimulus intensity increases, the rate of neural impulses increases (e.g.,Bartlett & Doty, 1974; Levick, 1973; Marrocco, 1975;Stone & Fukuda, 1974; Tepas & Armington, 1962). Therate offiring ofneurons is the biological support ofthe assumed mechanism. The higher the intensity, the higher the
127 Copyright 2000 Psychonomic Society, Inc.

128 PINS AND BONNET
rate ofneural firing, and the faster the rate ofaccrual ofselected information. A second factor that comes into play isthe critical accumulation level at which the response is triggered. The first factor is the result ofa sensory mechanism,the second is the result ofthe decisional process (Bonnet,1996; Pins & Bonnet, 1996). Assuming that the responsecriterion ofthe subject is constant, RT is inversely related tothe rate ofaccrual of information (e.g., Link, 1992).
It has been pointed out (e.g., Bonnet, 1992a; Restle,196 I ) that sometimes the fit of a single function over anentire dynamic range ofintensities is optimized when thelowest intensities are discarded. For instance, Restle(196 I) reanalyzed Chocholle's (1940) RTs for pure tonesand concluded that two functions provided a better fit tothe data than one. Moreover, the function fitted for thelowest range ofintensities appears to have a much higherexponent than the one fitted for upper intensities. Similar conclusions can be reached from reanalyzing Pieron'sdata, as he expressed the intensities ofhis stimuli relativeto the threshold. In fact, Baird (1997) and Stevens (1975)have mentioned that magnitude estimation data alsoyield a steeper exponent ofthe power function near threshold than they do in the suprathreshold range. This is a further argument for the assumption that the exponents inStevens's and Pieron's functions should be the same (Baird,1997; Norwich, 1993).
The question here is to determine the factor responsible for the drastic elevation of the exponent in the Pieronfunction in the lowest range ofluminance intensities. Thesimplest assumption that can be put forward is that the exponent rises when the intensities approach the thresholdregion (i.e., when stimulus uncertainty increases), whileuncertainty is known to lengthen the RT (e.g., Link, 1992).In the threshold region, uncertainty increases as intensitydecreases. The RT, which increases when intensity decreases, should therefore increase even faster in the threshold region compared to in suprathreshold ranges.
The intensities used by Pieron (1914) and Chocholle(1940) started from threshold. Hence, presumably someof the lowest intensities remained in the threshold region.However, they did not explicitly mention this. BecausePieron and Chocolle used a SRT task, an RT could be obtained even when the target was missed by the subject. Thequestion becomes whether or not the increase in the exponent is limited to the threshold region (i.e., the region inwhich errors are detection errors).
In the present experiments, a CRT task was used inorder to estimate the probability of correct detection ofthe target together with the RT. In previous experiments(Pins & Bonnet, 1996), the exponent of the Pieron function was not affected by the type of task (i.e., whether itinvolves SRT or CRT).
EXPERIMENT 1Determining the Threshold Region
in Scotopic Luminance Levels
In this experiment, luminance levels covered the scotopic range, from a value just inferior to threshold to the
beginning of the mesopic range (e.g., Pins & Bonnet,1997). The target was presented in a spatial two-alternativeforced-choice (2AFC) paradigm. This experiment wasrun in order to test the assumption that, in the threshold region, there was a combined effect of luminance and stimulus uncertainty on processing time. TwoPieron functionswere expected, one ofthem with a larger exponent for therange of intensities near threshold.
MethodSubjects. Four trained subjects took part in the experiment. One
of them was the first author. The subjects had normal or correctedto-normal vision.
Procedure. The stimuli and experimental design were identicalto those used by Pins and Bonnet (1996) in a localization experiment(Experiment 3). The stimuli were presented binocularly on a highresolution video monitor (Visionor Model M 51 CHR No. 1007,Lille, France). The stimuli were generated through a PC-compatiblecomputer (HP20 0386) that used a special graphics adaptator(GALAXY ref. SA-1019A, Evroz, Tel Aviv) that provided a displayof 1024 X 768 pixels at a 60-Hz frame rate (noninterlaced). Carefulcalibration ofeach RGB combination was carried out with a homemade photomultiplier standardized with a Pritchard photomultiplier.The values were cross-checked with a CS 100 Minolta photometer.
The stimuli were luminous vertical rectangles (30 X 7.5 min of arc)presented during 83 msec on a dark background (0.02 cd/m-) in a darkroom. The subjects were placed at a viewing distance of 70 em. Thehead position was stabilized by means ofa chinrest. They looked at acentral fixation dot (1.5 min ofarc diameter, 10 cd/rn-). In each trial,a luminous rectangle appeared, with its center located randomly at1.25°left or right from the fixation point. Ten scotopic luminance levels of the target were used. They followed an approximately geometrical series (0.104, 0.116, 0.133, 0.151, 0.170, 0.194, 0.219, 0.246,0.280, and 0.314 cd/m-), These luminance levels ranged from scotopic levels (values inferior to the detection threshold: 0.120 cd/m-)to mesopic levels. The different luminance levels were presented inmixed blocks. Each session started with a darkness adaptation period.
The RT measurements were rounded to the closest millisecond asindicated by the external clock driven by the computer. The appearance of the target was preceded by an auditory warning signal(1000 Hz, 500 msec). Five preparatory periods (450,550,650,750,and 850 msec) were used, presented randomly according to an exponential distribution in order to prevent anticipatory responses. Thetask was to indicate whether the target appeared to the left (left key)or to the right (right key) of the fixation point (CRT task). The experiment involved 17 experimental sessions of300 trials. Thus, 510RTs were recorded for each subject and for each level ofluminance.For each subject and each intensity, median RTs were calculated foreach session and the medians were averaged over sessions.
ResultsThe overall mean difference between the RTs for the
localization (left/right) of the stimulus, was 2 I msec[F(1,3) = 1.07, n.s.]. For further analyses, the data wereaveraged over the localization factor, which had no significant effect.
Averaged over subjects, the percent ofcorrect responsesincreased with increasing luminance. The data are illustrated in Figure 1A, using the probability of correct responses (PeR) as ordinate. Clearly, two regions emergedfrom the data. In the upper range of intensities, the percentage of correct detections became statistically constant.
To provide a rough estimate of the upper limit of thethreshold region, two linear regressions were carried out
PIERON FUNCTION 129
A
Ii:o ....... ....•. .....•....... •.3: • J('
mQ)
.9mc0 !a.m~ .8ti~
.78-0~ .6 - !:cCll.0 Ie .5 -a.
.4 I I
0.05 0.10 0.15 0.20 0.25 0.30 0.35
luminance (cd/m')
6B
5
4
'5 3§
~ 2
o
-1
0.05 0.10 0.15 0.20 0.25 0.30 0.35
luminance (cd/m')
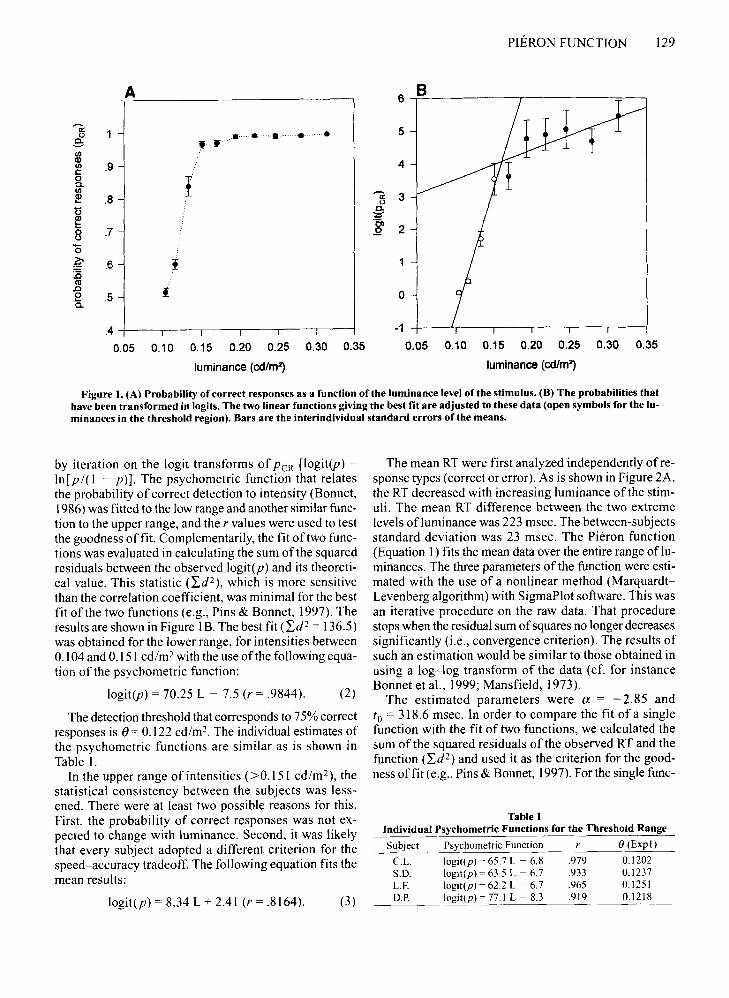
Figure I. (A) Probability of correct responses as a function of the luminance level of the stimulus. (B) The probabilities thathave been transformed in logits. The two linear functions giving the best fit are adjusted to these data (open symbols for the luminances in the threshold region). Bars are the interindividual standard errors ofthe means.
by iteration on the logit transforms of PeR [Iogit(p) =In [p I(I - p)]. The psychometric function that relatesthe probability of correct detection to intensity (Bonnet,1986) was fitted to the low range and another similar function to the upper range, and the r values were used to testthe goodness offit. Complementarily, the fit of two functions was evaluated in calculating the sum ofthe squaredresiduals between the observed logit(p) and its theoretical value. This statistic (Id 2 ), which is more sensitivethan the correlation coefficient, was minimal for the bestfit of the two functions (e.g., Pins & Bonnet, 1997). Theresults are shown in Figure 1B. The best fit (Id 2 = 136.5)was obtained for the lower range, for intensities between0.104 and 0.151 cd/m- with the use ofthe following equation of the psychometric function:
logit(p) = 70.25 L - 7.5 (r = .9844). (2)
The detection threshold that corresponds to 75% correctresponses is 0= 0.122 cd/rn-', The individual estimates ofthe psychometric functions are similar as is shown inTable I.
In the upper range of intensities (>0.151 cd/rn-), thestatistical consistency between the subjects was lessened. There were at least two possible reasons for this.First, the probability of correct responses was not expected to change with luminance. Second, it was likelythat every subject adopted a different criterion for thespeed-accuracy tradeoff. The following equation fits themean results:
logit(p)=8.34L+2.41 (r=.8164). (3)
The mean RT were first analyzed independently of response types (correct or error). As is shown in Figure 2A,the RT decreased with increasing luminance ofthe stimuli. The mean RT difference between the two extremelevels ofluminance was 223 msec. The between-subjectsstandard deviation was 23 msec. The Pieron function(Equation 1) fits the mean data over the entire range of luminances. The three parameters of the function were estimated with the use of a nonlinear method (MarquardtLevenberg algorithm) with SigmaPlot software. This wasan iterative procedure on the raw data. That procedurestops when the residual sum ofsquares no longer decreasessignificantly (i.e., convergence criterion). The results ofsuch an estimation would be similar to those obtained inusing a log-log transform of the data (cf. for instanceBonnet et al., 1999; Mansfield, 1973).
The estimated parameters were ex = -2.85 andto = 318.6 msec. In order to compare the fit of a singlefunction with the fit of two functions, we calculated thesum of the squared residuals of the observed RT and thefunction (Id 2 ) and used it as the criterion for the goodness offit (e.g., Pins & Bonnet, 1997). For the single func-
Table 1Individual Psychometric Functions for the Threshold Range
Subject Psychometric Function r e (Exp I)
c.L. logit(p) = 65.7 L - 6.8 .979 0.1202S.D. logit(p) = 63.5 L - 6.7 .933 0.1237L.F. logit(p) = 62.2 L - 6.7 .965 0.1251D.P. logit(p) = 77.1 L - 8.3 .919 0.1218

130 PINS AND BONNET
A B600 2.80
550 2.75
500 2.70
lil i='.s 450 0:: 2.650;~ .Q
400 2.60
350 2.55
300 +-----.,------,r---..,-------r----,r-------1
0.05 0.10 0.15 0.20 0.25 0.30 0.35
luminance (cd/m2)
2.50 +----r----r----.----'----.---..,---,--"'-I
-1.1 -1.0 -0.9 -0.8 -0.7 -0.6 -0.5 -0.4
log(luminance)
Figure 2. (A) RT as a function ofluminance. Bars are the interindividual standard errors of the means. The Pieron function(Equation 1) was fitted to the data. (B) Two simplified Pieron functions (Equation 4) are fitted to the data shown here on a log-logplot. Open symbols for the data in the threshold region. Log standard errors have been divided by 100 for sake of clarity.
tion that fit the data with the parameters mentioned above,Id2 = 1,780.6.
We then examined how two chronometric functions fitthe results: one for the threshold range ofluminance andone for the high range ofluminance. The following simplified form of the Pieron function, which took into account only two parameters, was used:
963.5). This value was obtained with the same limit between the lower range and the upper range as the one foundfor the percent correct. This fit is illustrated in Figure 2Bon a log-log plot. The parameters ofthe two functions are
0.104 to 0.151 cd/rn-: -a= -0.9793
and
RT = f3I-a. (4) 0.170 to 0.314cd/m2: -a= -0.1959.
The estimation ofa third parameter (to) would, in fact,not have been appropriate, especially for the lowest rangeofluminances. IfEquation 1 (with three parameters) hadbeen fit to the lower range of intensities, it would have ledto a negative value of to (precisely, -1,000.6 msec) whichwould have been absurd. Using a two-parameter solution(Equation 4) for the entire range of luminances, while assuming the exponent is the same for all stimuli, produceda very poor fit (Id2 = 8,105.7). Then, two functions werefit to the results: one for the lower range and another forthe upper range ofintensities. This was accomplished byusing the iterative procedure in which the limit betweenthe lower and the upper ranges ofluminances was changedat each run. The Id2 summed over the two functions wasused as a descriptive statistic for estimating the goodnessoffit. The best fit was the one that minimized Id2 (Id 2 =
Table 2Individual Exponents for the Two Ranges of Luminance
The same analysis was run subject by subject. It confirmed the hypothesis that using two separate functionsholds individually. The exponents for the individual functions are shown in Table 2. Whereas the individual exponents are rather variable in the low range, the exponentof the function reduces drastically from the thresholdrange to the upper range of luminance for each subject.However, as mentioned above, the accuracy of the subject's performance was similar in the threshold range.
In a further analysis, the relationship between the accuracy and the RTs-that is, between the psychometricand the chronometric functions-was examined. As canbe derived from Link's model (see, also, Bonnet, 1996;Link, 1992), a linear function with a negative slope is expected for the relationship between logit(p) and RTs.(The results are shown in Figure 6.) The following equation (Equation 5) fits the present data for the entire range:
RT = 540.9 - 43.9510git(p)(Id2 = 2,261.1). (5)
However, as in the previous analysis, two regression functions provided a better fit (Id2 = 1,172.1). In the threshold region, the equation is
Subject Low Range High Range
C.L. -I.~ -~n
S.D. -0.61 -0.16L.F. -0.39 -0.18D.P. -1.45 -0.19 RT = 550 - 52.4 logit(p), (6)
PIERON FUNCTION 131
2.56 -,----~--------------
2.55
2.54
...... 2.53I-a:::j
2.52
2.51
P&B,97
• •P&B,98
••
2.50
2.49 +----.,---,------r----r---.,.-~..,__-_1
-0.80 -0.75 -0.70 -0.65 -0.60 -0.55 -0.50 -0.45
log(luminance)
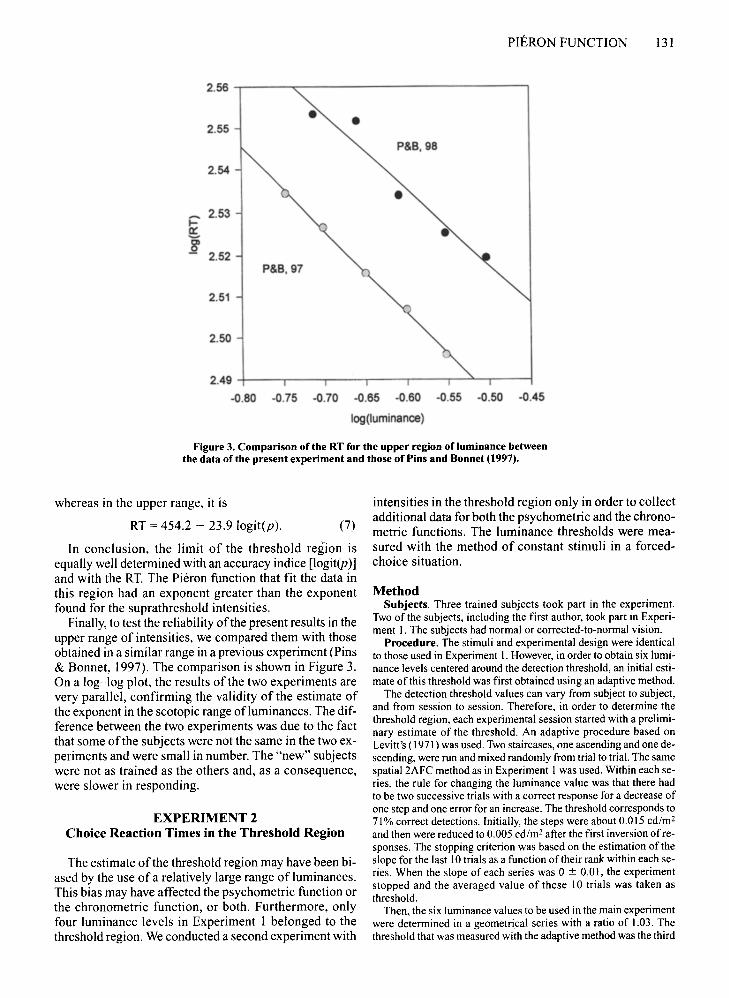
Figure 3. Comparison of the RT for the upper region ofluminance betweenthe data of the present experiment and those of Pins and Bonnet (1997).
EXPERIMENT 2Choice Reaction Times in the Threshold Region
The estimate of the threshold region may have been biased by the use of a relatively large range of luminances.This bias may have affected the psychometric function orthe chronometric function, or both. Furthermore, onlyfour luminance levels in Experiment I belonged to thethreshold region. We conducted a second experiment with
In conclusion, the limit of the threshold region isequally well determined with an accuracy indice [logit(p)]and with the RT. The Pieron function that fit the data inthis region had an exponent greater than the exponentfound for the suprathreshold intensities.
Finally, to test the reliability ofthe present results in theupper range of intensities, we compared them with thoseobtained in a similar range in a previous experiment (Pins& Bonnet, 1997). The comparison is shown in Figure 3.On a log-log plot, the results of the two experiments arevery parallel, confirming the validity of the estimate ofthe exponent in the scotopic range ofluminances. The difference between the two experiments was due to the factthat some of the subjects were not the same in the two experiments and were small in number. The "new" subjectswere not as trained as the others and, as a consequence,were slower in responding.
whereas in the upper range, it is
RT = 454.2 - 23.9 logit(p). (7)
intensities in the threshold region only in order to collectadditional data for both the psychometric and the chronometric functions. The luminance thresholds were measured with the method of constant stimuli in a forcedchoice situation.
MethodSubjects. Three trained subjects took part in the experiment.
Two of the subjects, including the first author, took part in Experiment I. The subjects had normal or corrected-to-normal vision.
Procedure. The stimuli and experimental design were identicalto those used in Experiment I. However, in order to obtain six luminance levels centered around the detection threshold, an initial estimate of this threshold was first obtained using an adaptive method.
The detection threshold values can vary from subject to subject,and from session to session. Therefore, in order to determine thethreshold region, each experimental session started with a preliminary estimate of the threshold. An adaptive procedure based onLevitt's (1971) was used. Two staircases, one ascending and one descending, were run and mixed randomly from trial to trial. The samespatial 2AFC method as in Experiment I was used. Within each series, the rule for changing the luminance value was that there hadto be two successive trials with a correct response for a decrease ofone step and one error for an increase. The threshold corresponds to71% correct detections. Initially, the steps were about 0.015 cd/mand then were reduced to 0.005 cd/m? after the first inversion ofresponses. The stopping criterion was based on the estimation of theslope for the last 10 trials as a function of their rank within each series. When the slope of each series was 0 ± 0.0 I, the experimentstopped and the averaged value of these 10 trials was taken asthreshold.
Then, the six luminance values to be used in the main experimentwere determined in a geometrical series with a ratio of 1.03. Thethreshold that was measured with the adaptive method was the third

132 PINS AND BONNET
A B.95 3.0 n•• .0
5.90 •.s • 2.5 [:IIII
.0CDIII
.85c[:I0 2.0Q. •III ol!! .80 lr
[:I'oti .s 1.5 "'-CD ..~
ot:8 .75
r1 '"- 1.0 o0
~ .70 ... • 1>'
:.0 ....1>-(Q
0.5.c ••0 .65 -...'"
Q.
.60 I I I I I 0.0
0.125 0.130 0.135 0.140 0.145 0.150 0.155 0.125 0.130 0.135 0.140 0.145 0.150 0.155
luminance (cd/m2) luminance (cd/m2
)
Figure 4. (A) Averaged probability of correct responses as a function .ofth~ l.uminance level.oft~e stimulus for Experi~~nt 2.(B) The probabilities have been transformed in logits. The linear function glVlDg the best fit IS adjusted to the data. Individualpsychophysical functions are shown with open symbols.
Similar results were observed for each subject. Individual exponents of the Pieron functions were (DP) -1.16,(SD) -0.91, and (TP) -0.98. The between-subjects standard deviation of mean RT was 21 msec. The analysis ofthe mean RTs only for correct responses, led to similarresults. However, the mean RT for errors (474 msec) was alittle longer than the one for correct responses (456 msec).
distant from the minimum and the maximum ofthe probability function, the estimate of the threshold could beconsidered to be more reliable in this experiment. Nevertheless, the estimates of the upper limit of the threshold range were consistent in the two experiments.
As in Experiment 1, the RTs were first analyzed independently of response types (correct or errors). As isshown in Figure 5, CRT decreased with the increasing luminance of the stimuli. The mean RT difference betweenthe two extreme levels of luminance was 77 msec. As inExperiment 1, a three parameter solution (Equation 1)produced a negative value of to,the goodness offit beingas good with a two-parameter solution (Equation 4). Theestimated exponent of the Pieron function (Equation 4)that fit all the data (r = - .99) is as follows:
-a= -1.0204.
intensity in the series. The six luminance levels were presented according to the constant stimuli method. The subjects went through14 experimental sessions of 240 trials each. Thus, 560 RTs wererecorded for each subject and for each level ofluminance.
ResultsThe detection thresholds that were estimated with the
adaptive method in the preliminary phase did not varymuch from session to session. They ranged between 0.12and 0.18 cd/m- for each subject with an average of0.138 cd/rn-. Because the differences in luminances foreach step ofthe main experiment were negligible from session to session and from subject to subject, the six following values were used in the next parametric analysis ofthedata: 0.129,0.134,0.138,0.142,0.147, and 0.152 cd/rn-,
The RTs did not differ significantly (F < 1) for the twolocalizations (left/right) of the target. The averaged difference was 0.2 msec. For further analyses, the data wereaveraged over this factor.
The percentage of correct responses was transformedinto logits and a psychometric function was computed(see Figure 4). The individual and mean results are shownin Table 3, which includes the comparison between thethreshold estimated from the constant method [O(const)]and the thresholds estimated previously with the adaptivemethod [O(adapt)]. They both corresponded to 75% correct. The between-subjects standard deviation of meanpercentage of correct responses was 1.5%.
The mean thresholds that were estimated with the adaptive method were systematically larger than those obtainedwith the method ofconstant stimuli. The latter were, on theaverage, larger than those estimated from Experiment 1(0 = 0.122 cd/m-), Because the two extreme luminancesin the range used in this second experiment were more
Subject
D.P.S.D.T.P.Mean
Table 3Individual and Mean PsychometricFunctions and Threshold Estimates
Psychometric Function r e (const)
logit(p) = 101.5 L - 12.6 .989 0.135logit(p)=98.1 L - 11.5 .963 0.129logit(p)=69.8 L-9.1 .992 0.146logit(p) = 86.7 L - 10.7 .991 0.136
e (adapt)
0.1410.1680.1800.161

PIERON FUNCTION 133
510 --,---,-------------------,
.155.150.145.140.135.130420 +---,---,-----,---,---r--'----1
.125
430
440
450
I 470I-0::: 460
480
490
500
luminance (cd/m2)
Figure 5. RT as a function of luminance. The Pieron function (Equation 2) was fitted to the data. Bars are the interindividual standard errorsofthe means.
RT = 520.48 - 38.1 logit(p) (r = .9995). (8)
Figure 6 compares the results of the two experiments inthe threshold region. The linear relationship is
The estimated exponent ofthe Pieron function on the meanRT for correct responses (r = -.99) is - a = - 0.9212.
Finally, the RTs were plotted as a function ofaccuracy(see Figure 6B). As in Experiment 1, a linear relationship was demonstrated here between the RT and logit(p),with the following parameters:
This fits the individual data and the averaged ones. However, although the mean threshold was similar in the twoexperiments, the slopes of the function (Equation 9)showed some individual differences (see Subject c.L. inExperiment 1, for instance). The average thresholds werea little lower in the first experiment than in the second one.The RT for the mean threshold values (obtained usingEquation 9) were slightly longer in the first experimentthan in the second one (496 vs. 475 msec). The tradeoffbetween accuracy (threshold) and speed could result froma "context" effect. In Experiment 2, the conditions weremore consistent because all levels ofluminance belongedto the threshold region. In Experiment 1, only 4 out of 10belonged to that region. The fact that the majority of theluminance levels were supraliminal may have encouragedthe subjects to respond faster. Such an interpretation is
reinforced by the fact that there were errors even when theluminance was clearly a suprathreshold one.
DiscussionThe two experiments confirmed that the Pieron func
tion holds both in the threshold range ofluminances andabove that range. However, the exponent of the functionincreased drastically in the threshold region. In fact, notonly did the RT decrease with the increase in luminance,it also did so when the probability of correct detectionincreased. As a result of the combined effect of these twofactors, a linear relationship is demonstrated between thelogit transform ofdetection probability and the RT (Equation 9). The Pieron functions in the two present experiments that fit the threshold range, are parametrically verysimilar with an exponent close to 1 (Experiment 1, -a=-0.9793; Experiment 2, -a= -1.0204).
As was shown in Experiment 1, the exponent of thefunction decreases drastically for stimulus luminancebeyond the limit of the threshold region. This result confirms observations on Pieron's (1914) or Chocholle's(1940) data. When working with the Pieron function, itis therefore critical to determine the threshold region inorder to avoid bias in the estimation ofthe exponent. Empirically, it would seem convenient to look for the weightof the lowest intensities (see Bonnet et al., 1999).
The increase in the exponent for the lower range of intensities (the threshold region) demonstrated by our RT
(9)RT = b - a logit(p).

134 PINS AND BONNET
A
700
<> TPI:::. SD2'\7 DP2• mean2
600500
Mean RT
400
o
-1
300700600500
Mean RT
400
4
5
6--.--.---.------....,-----.
o
-1
300
Figure 6. Linear relationship between RT and 10git(PcR) in Experiment 1 (A) and in Experiment 2 (B). In dark are theaveraged data, in gray are the individual results.
data is parallel to the increase in the exponent of theStevens's function applied to magnitude estimation data(ME), as examined previously by Baird (1997). There aretheoretical arguments (Link, 1992; Norwich, 1993) thatthe absolute value ofthe exponents of the Pieron and theStevens functions should be the same. However, no directcomparison of these exponents can be made here. Magni-
tude estimation data would have to be obtained under thesame experimental conditions.
Different explanations can be brought forward to explain the steeper exponent in the threshold region, suchas, for example, when intensity increases near threshold,uncertainty will decrease. At low intensities, only a relatively small number of neurons, those having a low dy-
I I
350 400 450 500 550 600
mean RTs
o ///
//
//
///0
//
//
//
//
N. .0 / __-• / 0
// 0 """'- ..-...-...-/ C/?-""
/ ..- ...- @)/ ...- ...-. 0~ ...-
....-..
840
l!? 35gQ)
"E 30co"0t:
~ 25 -(ij::J"0's
20:ct:
·CS.s
15
10
300550 600350 400 450 500
mean RTs
~/
//
//
/
/~/
//
//
A>--Jf----O;4
//
//
//.
/.
--.--...-....- .f--®--1 .__...-
~.--.--.~
I/~-=r
A0.24
0.22
e 0.20gQ) 0.18"Eco
0.16"0t:S
0.14til
(ij::J
0.12"0:~"0
0.10.!:'0t: 0.08coQ)
E 0.06
0.04
300
Figure 7. Relationships between the mean RTs and variability. Results are shown on a log-log plot for more clarity. (A) The ordinate is the mean of the individual standard errors. (B) The ordinate is the interindividual standard error of the mean. Opensymbols are results of Experiment 1 in the threshold region, black symbols are the results of Experiment 1 above the thresholdregion, gray symbols are the results of Experiment 2 in the threshold region.

namic range and, as a consequence, having a low threshold (Baird, 1997) would be activated. These neurons, beinghypothetically more sparse, would reduce the probabilityofan early response and therefore lengthen the RT.However, this explanation is not sufficient to explain why theRT still declines beyond the threshold region. Increasingthe intensity of the stimulus increases the speed of summation of receptor potentials and thus reduces the delaybetween receptor activation and neural action potentials.It also increases neural firing rates. All ofthese factors operate on a large range of intensities beyond threshold. Asfar as the RT is concerned, a saturation point is reachedwhen the RTs become constant (to), and the Pieron function and the Stevens function should diverge.
A complementary line of thought relates the Pieron orStevens functions to discrimination (Link, 1992; Norwich,1993; Teghtsoonian, 1971). Whereas the present experiments do not relate directly to that issue, an analysis ofchanges in the variability ofRTs provides an argument infavor of this idea. Analyses of the RT revealed both interand intrasubject variabilities. Baird (1997) mentionedthat some studies appear to be at odds with each other regarding the relationship between the mean RT and its variability. On the one hand, Chocholle (1940) showed a linear relationship between mean RT and the standarddeviation, which is consistent with Weber's law. That linear relationship has been stressed by Bonnet (1996), andhas been found to apply to various sets of data. On theother hand, Green and Luce ( 1971) have shown data exhibiting a nonlinear function that is concave downward.In Experiment I and in Experiment 2, we examined therelationship between the individual mean RT and the standard errors. For each subject in each experiment, a linearregression fit satisfactorily to these data (see Figure 7).A nonlinear function (power function) was investigated,and it was found that it did not improve the goodness offitsubstantially. However, in each case the function appearedslightly concave upward rather than concave downward.In Experiment I, nonlinearity seems to have resultedmainly from the separation between the threshold rangeand the suprathreshold range. A similar analysis was performed on interindividual variability, leading to similarconclusions. These data are presented in a condensed wayin Figure 7. To the best ofour knowledge, they do not allowone to draw a conclusion about this issue, essentially because there were a limited number of observations.
The asymptotic RT, to, may also deserve some furthercomments. In Pieron's data on RT and brightness (1914),to was estimated within the range of 100-150 msec inMansfield (1973) the best estimate was 194.6 msec. Apartfrom the numerous problems in getting a stable estimateof this parameter (Bonnet et al., 1999; Luce, 1986), itsvalue depends on several factors. The first factor relatesto the task itself. The task here was a CRT task, whereaspreviously mentioned results were obtained in SRT tasks.A difference in the parameter to in these two tasks has beenshown by Pins and Bonnet ( 1996). A second set of factors,
PIERON FUNCTION 135
discussed by Luce (1986), relates to interindividual differences and to the degree of training of the observers.
In CRT tasks, errors are not always related to thedetectability of the stimuli. In our Experiment 1, for example, some errors were observed even when the luminance levels were beyond the estimated limit of thethreshold region. These errors may have resulted fromthe time pressure induced by the experiments. However,as seen previously (Pins & Bonnet, 1996, 1997), they donot, in general, vary with luminance beyond the thresholdregion.
In conclusion, we have demonstrated in our experimentsthat uncertainty about the presence of the stimulus in thethreshold range makes the Pieron function steeper thanbeyond that range. We have contributed to reinserting RTmeasures into the field of sensory psychophysics, wherethey have been somewhat neglected in the past. From ourdiscussion, there appeared to emerge many questions thatcall for further investigation in this domain.
REFERENCES
BAIRD. J. C. (1997). Sensation andjudgment: Complementarity theoryofpsychophysics. Mahwah, NJ: Erlbaum.
BARTLETT. J. R.. & DoTY. R. W.( 1974). Response of units in striate cortex of squirrel monkeys to visual and electrical stimuli. Journal ofNeurophysiology, 37, 621-641.
BONNET, C. ( 1986). Manuel Pratique de Psychophysique. Paris: ArmandColin.
BONNET, C. (1992a). Psychophysical scaling within an information processing approach? Behavioral & Brain Sciences, 15, 560-561.
BONNET. C. ( 1992b). Sensation and psychophysics of reaction time. International Journal ofPsychology, 27, 373.
BONNET. C. (1996). Sensory/decisional problem: An expansion ofLink's theory. In S. C. Masin (Ed.), Fechner Day 96 (pp. 137-142).International Society for Psychophysics.
BONNET, C.. ZAMORA, M. c.. BURATTI, E, & GUIRAO, M. (1999). Groupand individual gustatory reaction times and Pieron's law. Physiology& Behavior. 46, 1-10.
BUlAS, Z. ( (935). Le temps de reaction aux excitations gustatives d'intensite differente. Comptes Rendus de la Societe de Biologie, 119,1360-1364.
CATTELL, J. M. (1886). The influence of the intensity of the stimulus onthe length of the reaction time. Brain, 8, 512-515.
CHOCHOLLE. R. (1940). Variation des temps de reaction auditifs enfonction de l'intensite adiverses frequences. L'Annee Psychologique,41-42,65-124.
EXNER, S. (1868). Uber die zu einer Gesichtswahrnehmung notige Zeit.Sitzungsberichte del' Kaiserlichen Akademie del' Wissenschaften, 57,601-632.
GREEN, D. M., & LUCE, R. D. ( 1971 ). Detection ofauditory signals presented at random times: Ill. Perception & Psychophysics, 9, 257-268.
GRICE, G. R. (1968). Stimulus intensity and response evocation. Psychological Review, 75, 359-373.
HARA, S. ( 1955). Interrelationships between stimulus intensity. stimulatedareas and reaction times in human gustatory sensation. Bulletin ofTokvo Medical & Dentistry University, 2,147-158.
LAPPIN, J. S.. & DISCH, K. (1972). The latency operating characteristic:11. Effects of visual stimulus intensity on choice reaction time. Journal ofExperimental Psychology, 93, 367-372.
LEVICK, W. R. (1973). Variation in the response latency of cat retinalganglion cells. Vision Research, 13,837-853.
LEVITT, H. (1971). Transformed up-down methods in psychoacoustics.Journal ofthe Acoustical Societv ofAmerica, 49, 467-477.
LINK,S. W: (1978). The relative judgment theory of the psychometric

136 PINS AND BONNET
function. In 1.Requin (Ed.), Attention andperformance VII (pp. 619630). Hillsdale, NJ: Erlbaum.
LINK, S. W. (1992). The wave theory ofdiscrimination and similarity.Hillsdale, NJ: Erlbaum.
LUCE, R D.(1986).Response times. New York: OxfordUniversityPress.LUCE, R. D., & GREEN, D. M. (1972). A neural timing theory for re
sponse times and the psychophysics of intensity. Psychological Review, 79, 14-57.
MANSFIELD, R J. W.(1973). Latency functions in human vision. VisionResearch, 13, 2219-2234.
MARROCCO, R. T (1975). Possible neural basis of brightness magnitudeestimations. Brain Research, 86, 128-133.
McGILL, W.J. (1961). Loudness and reaction time: A guided tour of thelistener's private world. Acta Psychologica, 19,193-199.
MCGILL, W. J. (1963). Stochastic latency mechanisms. In R. D. Luce,R. R. Bush, & E. Galanter (Eds.), Handbook ofMathematical Psychology (pp. 309-360). New York: Wiley.
NORWICH, K. H. (1993). Information. sensation and perception. SanDiego, Academic Press.
PACHELLA, R. G., & FISHER, D. F. (1969). Effect of stimulus degradation and similarity on the trade off between speed and accuracy in absolute judgments. Journal ofExperimental Psychology, 81, 7-9.
PIERON, H. (1914). Recherches surles lois de variation des temps de latence sensorielle en fonction des intensites excitatrices. L'Annee Psychologique,20, 17-96.
PIERON, H. (1920). Nouvelles recherches sur I'analyse du temps de latence sensorielleen fonction des intensites excitatriceset sur la loi quirelie ce temps a l'intensite de I'excitation. L'Annee Psychologique,22,58-142.
PIERON, H. (1952). The sensations. New Haven, CT: Yale UniversityPress.
PINS, D., & BONNET, C. (1996). On the relation between stimulus intensity and processing time: Pieron's law and choice reaction time.Perception & Psychophysics, 58, 390-400.
PINS, D., & BONNET, C. (1997). Reaction times reveal the contributionof the different receptor components in luminance perception. Psychonomic Bulletin & Review, 4, 359-366.
POSNER, M. I. (1986). Chronometric exploration ofmind. Oxford: Oxford University Press.
RESTLE, F. (1961). The psychology ofjudgment and choice: A theoretical essay. New York:Wiley.
SCHWEICKERT, R., DAHN, C.. & MCGUIGAN, K. (1988). Intensity and thenumber of alternatives in hue identification: Pieron's Law and choicereaction time. Perception & Psychophysics, 44, 383-389.
STEVENS, S, S. (1975). Psychophysics: Introduction to its perceptual.neural and social prospects. New York: Wiley.
STONE, J., & FUKUDA, Y.(1974). Propertiesof cat retinal ganglion cells:A comparison of'W-cells with X- and Y-cells. Journal ofNeurophysiology, 37, 722-748.
TEGHTSOONIAN, R. (1971). On the exponents of Stevens' law and theconstant of Ekman's law.Psychological Bulletin, 78, 71-80.
TEPAS, D. I., & ARMINGTON, J. C. (1962). Properties of evoked visualpotentials. Vision Research, 2, 449-461.
WOODWORTH, R, & SCHLOSBERG, H. (1955). Experimental psychology.New York: Holt.
WUNDT, W. (1874). Grundziige der Physiologisches Psychologie.Leipzig: Engelmann.
YAMAMOTO, T, KATO, T, MATSUO, R.. ARAIE, N., AZUMA, S.. & KAWAMURA, Y.(1982). Gustatory reaction time under variable stimulus parameters in human adults. Physiology & Behavior, 29, 79-84.
YAMAMOTO, T, & KAWAMURA, Y. (198\). Gustatory reaction time inhuman adults. Physiology & Behavior, 26, 715-719.
(Manuscript received April 8, 1998;revision accepted for publication November 19, 1998.)


![[ARTIGO CIENTÍFICO ORIGINAL] ÁREA CIENTÍFICA DE … · Toulouse Pieron Test of Concentrated Attention (TPT). This should provide a consistent although not exhaustive model for](https://img.pdfslide.us/doc/110x75/5b02f3ae7f8b9a2d518b7001/artigo-cientfico-original-rea-cientfica-de-pieron-test-of-concentrated-attention.jpg)


![Cognitive-motor Rehabilitation Through Low-cost Mobile ... · based on the paper-and-pencil Toulouse-Piéron cancellation task [6]. These following steps are required to ensure the](https://img.pdfslide.us/doc/110x75/5b02e9787f8b9a89208b6e7a/cognitive-motor-rehabilitation-through-low-cost-mobile-on-the-paper-and-pencil.jpg)