Embed Size (px)
Citation preview
NASA Technical Memorandum TM 102786
The Physiological Cost Of Wearing ThePropellant Handler's Ensemble At TheKennedy Space Center
Janua_ 1990
(NASA-TM-IO27_b) T=-!E PHYSIOLOGICAL COST CF NqO-ZI_963
_EARING T,_E PRuPZLLANT HANbLER'S _NSEM_.L_ AT
THE KENNEDY SPACE CFNTER (?ionetics Corp.)
47 p CSCL 05H Uncl,_sG_/54 0271147
NASANational Aeronautics andSpace Administration
https://ntrs.nasa.gov/search.jsp?R=19900013650 2018-08-20T17:39:32+00:00Z

NASA Technical Memorandum TM 102786
The Physiological Cost Of Wearing ThePropellant Handler's Ensemble At TheKennedy Space Center
Brian R. Schonfeld, M.A.
Donald F. Doerr, B.S.E.E.Clare Marie Tomaselli, Ph.D.
Biomedical Operations And Research OfficeThe Bionetics Corporation
Kennedy Space Center, FI.
January 1990
National Aeronautics and
Space Administration
John F. Kennedy Space Center
N/ SA

TABLE OF CONTENTS
SECTION
Table of Contents
List of Tables
List of Figures
Glossary
Acknowledgements
Product Disclaimer
Introduction
Methods
Results
Discussion
Recommendations
References
Appendix I
Appendix II
PAGE
i
ii
iii
iv-v
vi
vii
1
2-4
4-5
5-10
10-13
14-15
16-33
34-38
\
LIST OF TABLES
(ALL TABLES ARE CONTAINED IN APPENDIX I)
TABLE NUMBER AND TITLE PAGE
I. Subject Characteristics
2. PHE Test Protocol
3. Mean Delta Oxygen (Percent)
4. Mean Rectal Temperature (°F)
5. Mean Skin Temperature (°F)
6. Mean Body Temperature (°F)
7. Mean Suit Temperature (°F)
8. HR Response and Estimated VO 2 For Treadmill WorkIn the PHE Suits as a Percentage of Maximum
9A. The Estimated Metabolic Work Load of Treadmill
Walking in the PHE Suits
9B. The Estimated Metabolic Load of Treadmill Work
in PHE Suits as a Percent of Maximal Oxygen Uptake,
VO2MAX
I0. Review of Oxygen Uptake (V02) Values for Weighted
Treadmill Walking
17
18
19
20
21
22
23
24
25
26
27
II
LIST OF FIGURES
(All figures are contained in Appendix I)
FIGURE NUMBER
Figures 1A-C.
Figures 2A-C.
TITLE
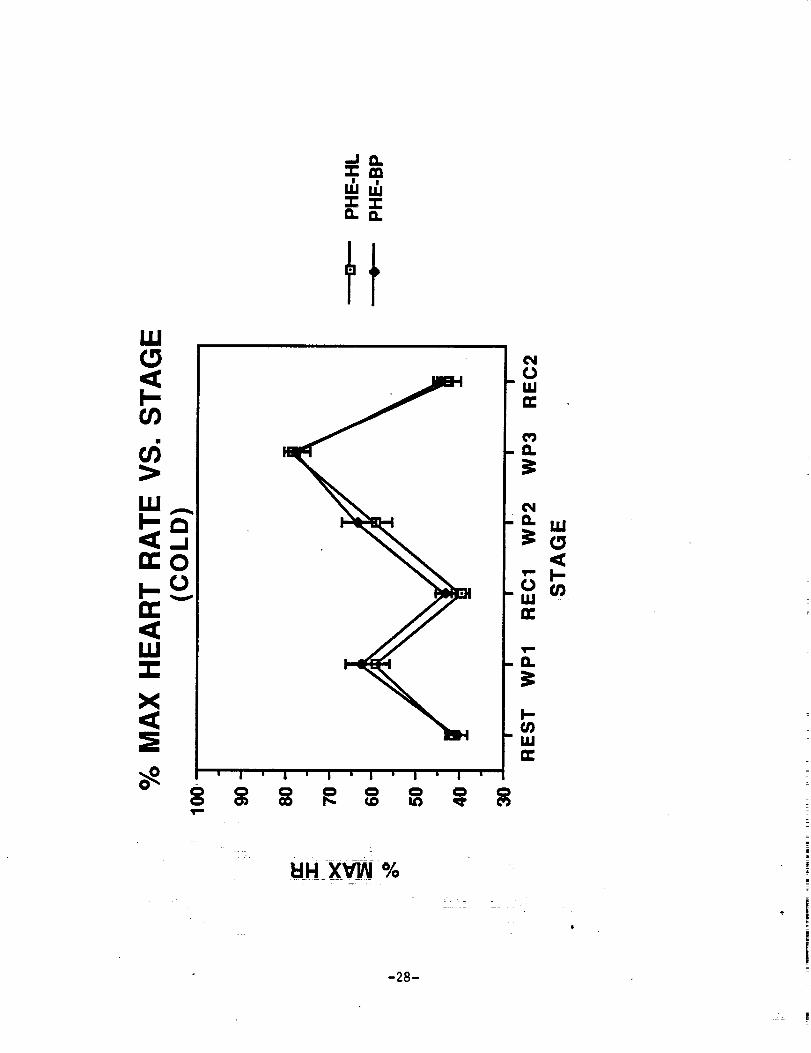
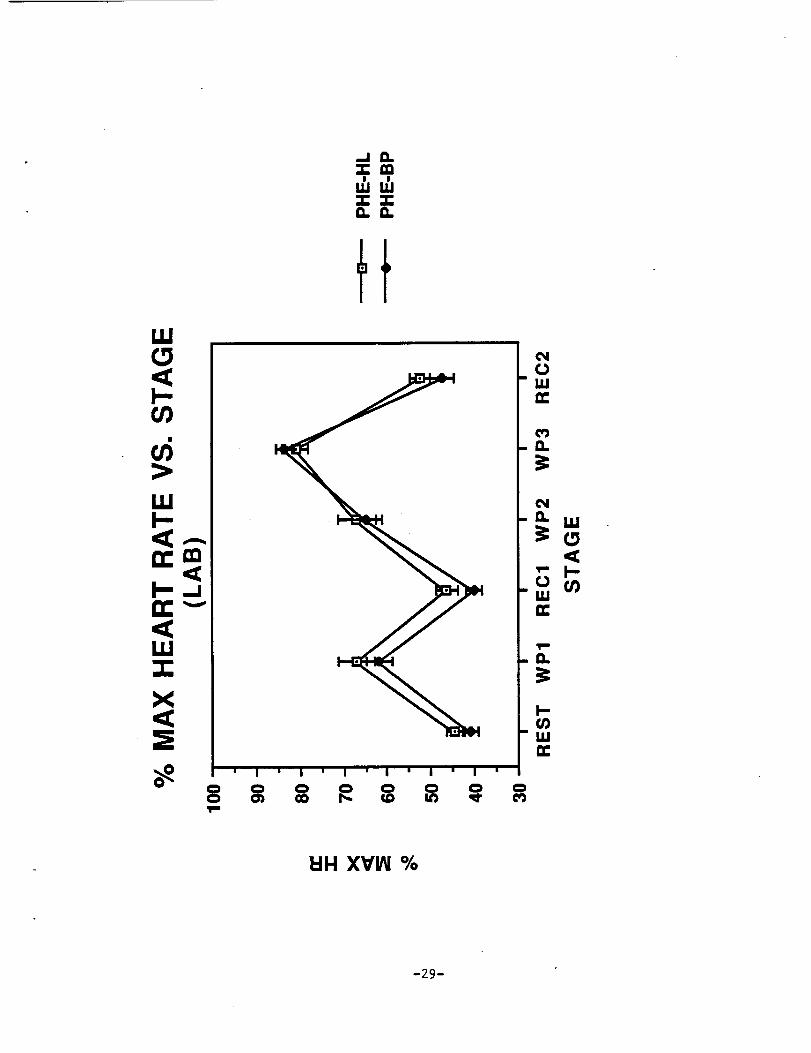
Percent heart rate max (% HRmax)
responses versus stage for (A) COLD,
(B) LAB, and (C) HOT environments.
P1 = PHE-HL suit. P3 = PHE-BP suit.
See Table 2 for stage abbreviations.
Values are mean • SEM.
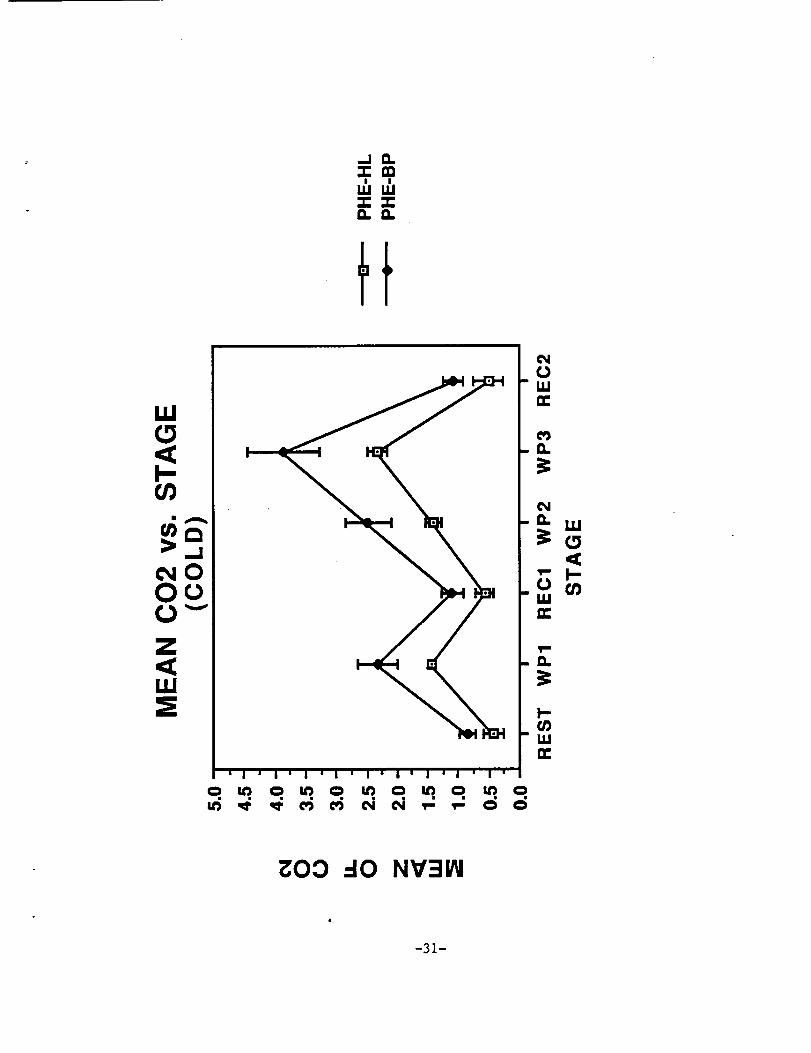
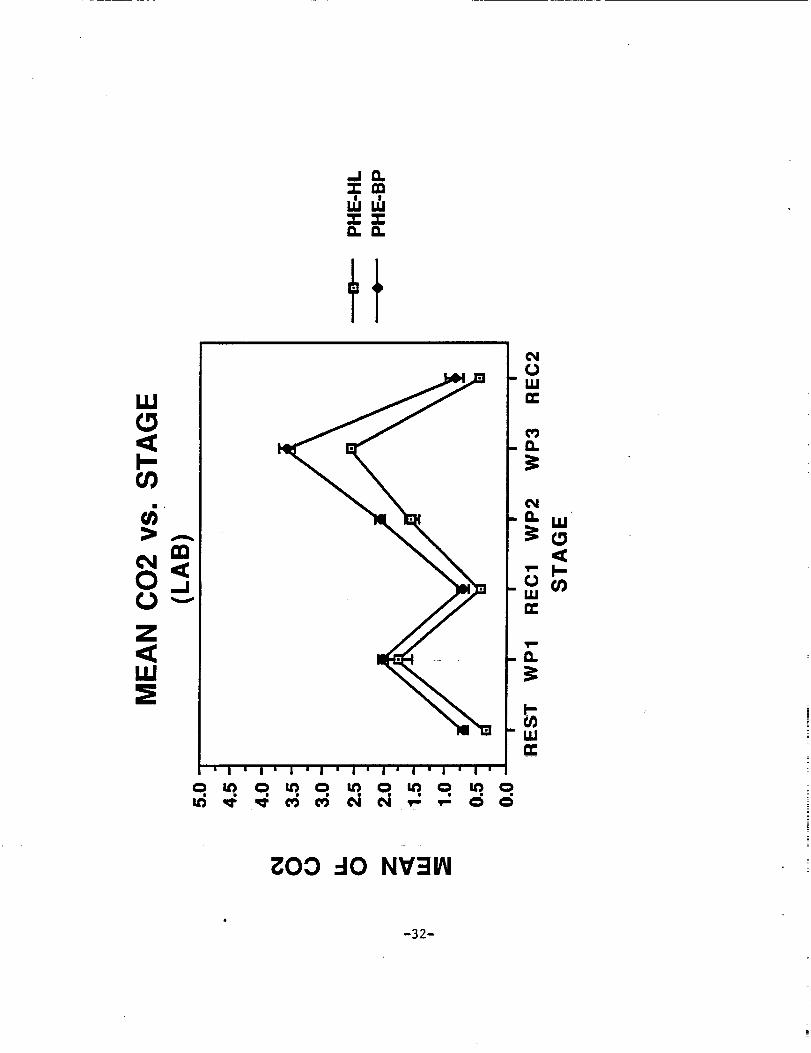
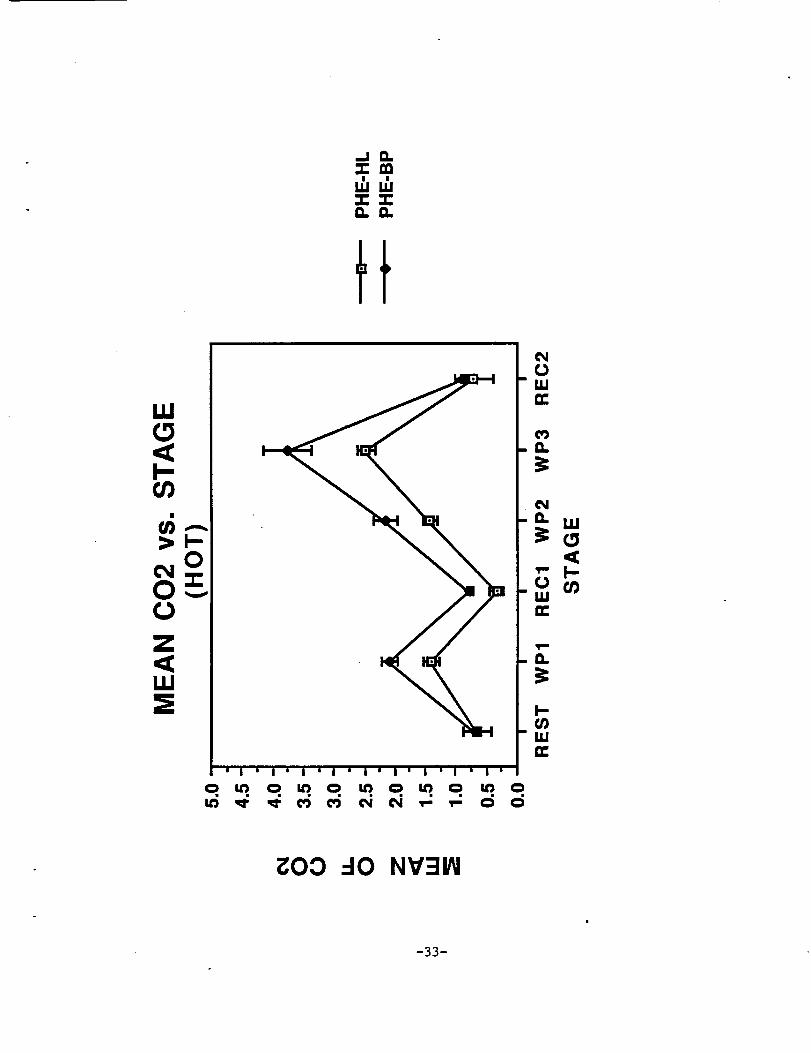
Helmet C02 concentration (%) versus
stage for (A) COLD, (B) LAB, and (C) HOTenvironments. PI = PHE-HL suit.
P3 = PHE-BP suit. See Table 2 for stageabbreviations. Values are mean ± SEM.
PAGE
28-30
31-33
iii
GLOSSARY
ANOVA: Analysis of Variance, a statistical procedure for dataanalysis.
Stage I:II:
III:IV:V:
VI:VII:
BRUCETM PROTOCOL:increments broken into stages.
1.7 mph, 10%2.5 mpb, 12%3.4 mph, 14%4.2 mph, 16%5.0 mph, 18%5.5 mph, 20%6.0 mph, 22%
A standard series of speed and % gradeEach stage lasts for 3 min.
DELTA 02: The difference between baseline 02 concentration takenat minute 38 and the 02 concentration at any other minute duringthe protocol; measured as the absolute change in % 02 . NOTE:Initial concentrations of 02 vary daily as the liquid air supplywas mixed weekly from cryogenic sources of N2 and 02.
ECU: Environmental Control Unit, worn as part of the PHE-BP.
weight s 17.7 kg (39 lbs.) when full with liquid air.
ECU
GRADIENT FOR HEAT EXCHANGE: The difference in rectal (Trec) andskin temperatures (Tsk) which allows heat to be taken from the
body's core to the body'ssurface where it can be dissipated
through sweating and evaporation.b
HR RESERVE: This method was utilized by Karvonen et al (13) to
estimate V02 from HRdata. The HR reserve is the difference
between HRmax and HR rest, i.e., HR Reserve _ HRmax - HRrest. For
purpose of this study, HRrest was defined as the HR at minute 38.
HYPERCAPNIA:standard.
Excessive C02 content, defined as _ 3.0%, the ACGIH
HYPERTHERMIA:
99.1°F.heat stress defined as a rectal temperature >
HYPOXIA: Low 02 concentration, defined as < 18% 02 according toAmerican Conference of Government IndustriaT Hygienists (ACGIH)
guidelines.
PHE: Propellant Handler's Ensemble--a whole body protective suit
replacing the SCAPE.
SCAPE: Self-Contained Atmospheric Protective Ensemble--a whole
body protective suit.
iv
TM: Treadmill--a motorized walking device.
VE: minute ventilati6n, the total volume of air breathed per
minute.
V02: Oxygen uptake (aka work capacity) measured as an absolute
term (LO2/min) or as a relative term (ml 02/kg/min) which takes
body weight (kg) into account. Maximum oxygen uptake, VO2max, isa measure of an individual's aerobic fitness level. VO2sm =
sub-maximal V02, usually measured as a percentage of one's maximum
capacity (i.e., 80% VO2max).
Watts, W: A measure of physical work. Watts can be converted to
VO 2 (L/min) to determine the metabolic work. Estimated fromPandolf et al (14).
Work Period 1 (WPI): 40-43 mln 1.7mph, 10% Bruce stage I
Work Period 2 (WP2): 63-66 mln 1.7mph, 10% Bruce stage I
Work Period 3 (WP3): 66-69 min 2.5mph, 12% Bruce stage II
V
ACKNOWLEDGEMENTS
The authors acknowledge the professional and technical assistance
of the entire staff of the Biomedical Laboratories at the Kennedy
Space Center. Special acknowledgements go to:
NASA Biomedical Operations and Research Office
H. Reed, C. Housworth, A. Maples, G. Triandfils, and L. Crane
The Bionetics Corporation
K. Mathes, M. Lasley, S. Loffek, V. Hall, M. Antiel, and B.Moore
vi

PRODUCTDISCLAIMER
This report, in whole or in part, may not be used to state or
imply the eudorsemeut by NASA or by NASA employees of a commercial
product, process or service, or used in any other mauuer that
might mislead.
vll

INTRODUCTION
The Kennedy Space Center (KSC) is the focal point for preflightpreparation and launch of numerous spacecraft. Propulsionsystems on these spacecraft rely on a variety ofpropellants -- nitrogen tetroxide, hydrazine, monomethylhydrazine -- all of which are toxic to the human skin andrespiratory systems. The potential for exposure to such toxinsduring spacecraft flight preparations and propellant transferoperations dictates the use of a whole body protective suit toprovide proper protection. The Self-Contained AtmosphericProtective Ensemble (SCAPE) or the Propellant Handler's Ensemble(PHE) the subject of the present report, which recently replacedthe SCAPE, have been utilized at KSC since 1964.
The weight, structure, and operating conditions of the suit mayhave a significant impact upon the physiological responses of theworker, especially in medium to heavy work situations. Theweight and encumbrance of the suit contributes an extra workloadabove the assigned operatiogal tasks. Thermal loads are imposed,and restrictions to vision, mobility, and dexterity areexperienced. The cumulative effects of these factors may imposelimitations on the safe performance of assigned Job tasks.
The connection between aerobic fitness and work capacity isdirect. Highly fit individuals can work at higher work rates orfor a longer duration at lesser work rates (15). The previousliterature has dealt very little with the physiological demandsof occupational performance while dressed in whole bodyprotective suits. However, several studies have examined theinfluence of heavy weight carrying on work metabolism. Themetabolic costs associated with carrying external loads whilewalking on a treadmill (TM) have been investigated (5,8,10-12,14)and predictive formulas have been developed based upon either theheart rate (HR) response at a given speed and grade (13) or uponthe concept of a fixed energy cost per kilogram (kg) of weight ateach level of speed and grade (11,14).
The Biomedical Laboratory at KSC examined two configurations ofthe PHE. The purpose of the present study was to examine thefactors affecting the physiology of the user during extremes oftemperature and workload which may be experienced during theservicing and deservicing of space vehicles. The specificobjectives were: l) evaluate the performance of the suits indifferent environmental conditions, 2) assess the physiologic andmetabolic demands placed upon the individuals wearing them, and3) propose appropriate fitness recommendations for individualsperforming work while encumbered with the PHE.
-I-
METHODS
Subjects: Four nonsmoking male subjects participated in these
tests. Their age, baseline antnropometry, maximal heart rate (HR
max), and maximum oxygen uptake (V02 max) are listed in Table 1.
All subjects underwent a complete physical examination, includinga medical history review, resting electrocardiogram, bloodchemistry, pulmonary function tests, and a Bruce treadmill stress
test to volitional fatigue, prior to participation in this
study. Subjects were fully informed about the test proceduresand any risks associated with them. An informed written consent
was obtained from each subject.
Suit Test Protocol: After approval of the test protocol by the
Human Research Review Board at KSC, each subject participated inthree different environmental test protocols lasting 89 min. in
both of the configurations of the PHE; the backpack (PHE-BP) and
hosellne (PHE-HL) models. The test protocol, detailed in Table2, was conducted under three different environmental conditions:
COLD (-7°C), laboratory (LAB) (23°C), and HOT (43°C). All
experiments were conducted in an environmental chamber measuring
1.5 x 3.1 x 2.1 m with the relative humidity being maintainedaround 50% for the laboratory and HOT conditions.
Field experience showed that normal opera£_n_typically required
the worker to walk several hundred meters, sometimes climbing
several flights of stairs, perform light repairs or monitoringtasks, and then walk back after a two hour work period. A worst
case workload may involve the rescue of a fallen co-worker during
a hazardous operation. Thus, the test protocol utilized a
work/rest regimen that took place in an envir0umental chamber.
After a 20 minute standing baseline rest period (SSR - 20-40
min), each work period was followed by a 20 minute standing
recovery period (43-63 min = RECI, 69-89 mln = REC2) as outlined
in Table 2. Because the Bruce treadmill protocol serves as the
current fitness qualification test for potential PHE users(completion of Stage III qualifies an individual to perform PHE
activities) and as our laboratory standard, the work intervals
were selected as Stage I and Stages I & II of the Bruce
protocol. The work intervals occurred at 40-43 min. (work period
l, WP1) and 63-69 min. (WP2 and WP3, respectively) during eachtest session.
Prior to entering the environmental chamber each subject was
instrumented for a single channel electrocardiogram (ECG) using a
Hewlett-Packard telemetry system. The ECG data was recorded on
both strip chart and magnetic tape recorders. HR was displayed
on a HR counter and was Validated against the strip chart
information. The data Were converted into a percentage of
maximal HR (%HRmax): %HRmax - HRsubmax/HRmax x 100%. The oxygen
-2-
(02) and carbon dioxide (C02) concentrations in the helmet regionwere analyzed with a Beckman Metabolic Measurement Cartthroughout the test. Because every backpack fill yielded aslightly different liquid air 02 concentration, a baselineconcentration (minute 38) was selected and all values wererecorded as the delta 02 concentration (i.e., minute 38 02concentration - U2 concentration at a specific minute). HelmetC02 was recorded as the actual concentration. Also, rectaltemperature (Trec) , four skin temperatures (forehead, upper arm,left chest, and right thigh), and interior suit temperature(helmet and chest regions) were recorded with YSI series 700thermistors connected to a Digitec Model 2000 Datalogger. Meanskin temperature (Tsk) was calculated as the average of the fourskin thermistor sites. Body temperature (Tb) was calculated asTb = (0.65 x Tre c) + (0.35 x Tsk) (4) and suit temperature (Ts)was the average of the readings at the helmet and chest sites(thermistors located to avoid contact with the subject and theinner suit surface). Finally, suit pressure was recorded with aNational Semiconductor integrated pressure chip connected to abuffer amplifier. The output was recorded on a strip chart andon magnetic tape.
Description of the Propellant Handler's Ensemble: The PHE is acompletely enclosed whole body suit made of chlorobutyl coatedNomex material. This is one of very few materials which is
relatively impervious to rocket propellants; yet, can be sewed
and sealed to provide vapor tight Joints that can withstand the
rigors of repeated flexing during handling and transferactivities.
The PHE has two modes of environmental control. The PHE-BP
contains an Environmental Control Unit (ECU) which is worn on the
user's back and powered by liquid air. This ECU provides gaseous
air after the expansion of liquid air through a heat exchanger
wherein the user's body heat contributes to the state change.
The primary air flow (42.5 1/min) is fed into a venturi and is
combined with air recycled from the suit causing a totalcirculation of 425 liters/min (15 Standard Cubic Feet/Min (SCFM))
which is routed through a manifold allowing approximately 60%
distribution to the helmet (9 SCFM) with the remainder being
circulated equally to the arms and legs. Though this backpack
version of the PHE allows the user complete mobility, the added
weight of the 17.7 kg (39 lbs when charged) backpack mounted ECU
is a drawback, bringing the total weight of the complete suit to
29.5 kg (65 Ibs).
The other version, the PHE-HL, relies on a hoseline to supply air
for respiratory and cooling purposes. Normal air flows are about170 1/min (6 SCFM) with the internal distribution being identical
to that of the PHE-BP, except that air is not recirculated. A
-3-
vortex cooling unit was used to partially cool the inlet air inthe HOT and LAB tests. The PHE-HL relieves the user from
carrying an ECU. The complete suit weighs only 11.8 kg (26lbs). However the user is encumbered with a tether (hoseline)
limiting mobility.
Estimates of Exercise Metabolism: Due to the nature of the PHE,
oxygen consumption (V02) could not be monitored directly without
interruption of normal air flow patterns in the helmet. Rather,
V02 was estimated using two different equations. Using the HRdata from the rest and work periods, the equation of Karvonen et
al (13) was used to estimate VO 2 in ml/kg/mln. A secondpredictive formula, that of Pandolf et al (14), was used to
estimate the workload in watts (W). The workload value, W, was
then converted to V02 in L/min (4,6) and then converted into a
percentage of each subjects' VO 2 max (_VO2max). The predictiveformulas and pertinent conversion factors are detailed in
Appendix II.
Statistical Analysis: A two-way ANOVA model with repeatedmeasures across environment and work period (WPI = 40-4Bmin;
WP2 = 63-66min; and WP3 = 66-69min) was used to assess specific
contrasts for the _HRmax variable. A paired t-test was used to
examine other suit performance differences for statisticalsignificance. The confidence level for all statistical tests was
set at P<0.05. No statistical analyses were performed on the
metabolic workload estimates, as these data were extrapolatedfrom the raw data.
RESULTS
Heart Rate: The mean HR responses were plotted as a percentage
of maximal HR (_HRmax) versus stage for the COLD, LAB, and HOT
conditions in Figures I A, B, and C, respectively. The HR
responded as expected given the imposition of load, temperature,
and exercise intensity. Within any particular environment, therewere no significant differences in %HRmax due to the PHE suit at
any given protocol stage. In each environment, WPI and WP2required similar mean _HRmax values. In all cases the mean
%HRmax values for wP3 were signiflcantly greater than either WP1
or WP2 values (P<0.001) for either suit, independent of theenvironment. During the recovery periods the mean %HRmax values
approached baseline SSR values for each suit only in the COLD
condition and during REC1 in the LAB condition. In the HOT
environment, the recovery %HRmax values remained elevatedrelative to SSR values.
Helmet O? and CO_ Concentrations: The mean delta 02 values are
listed in Table 3. The FHE-BP suit showed a -2.11% average delta
-4-
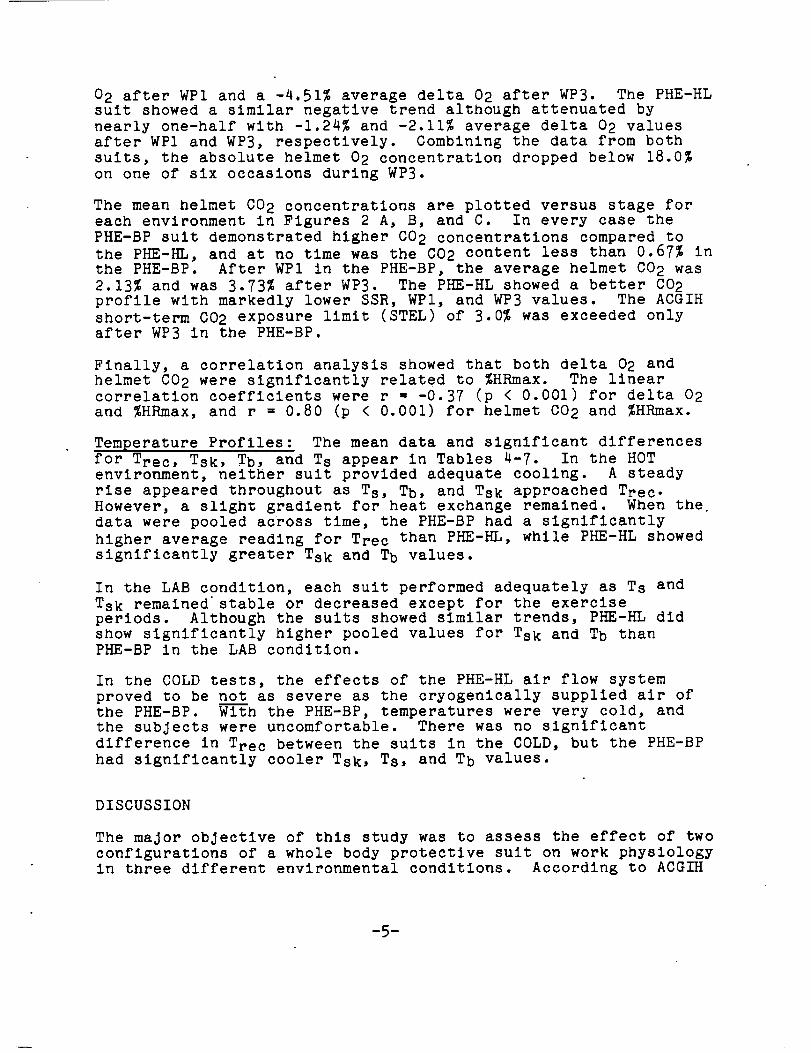
02 after WPI and a -4,51% average delta 02 after WP3. The PHE-HLsuit showed a similar negative trend although attenuated bynearly one-half with -1.24% and -2.11% average delta 02 valuesafter WP1 and WP3, respectively. Combining the data from bothsuits, the absolute helmet 02 concentration dropped below 18.0%on one of six occasions during WP3.
The mean helmet CO2 concentrations are plotted versus stage foreach environment In Figures 2 A, B, and C. Iu every case the
PHE-BP suit demonstrated higher CO 2 concentrations compared to
the PHE-HL, and at no time was the C02 content less than 0.67% in
the PHE-BP. After WP1 in the PHE-BP, the average helmet CO 2 was
2.13% and was 3.73% after WP3. The PHE-HL showed a better CO 2
profile with markedly lower SSR, WP1, and WP3 values. The ACGIH
short-term C02 exposure limit (STEL) of 3.0% was exceeded onlyafter WP3 in the PHE-BP.
Finally, a correlation analysis showed that both delta 02 and
helmet CO 2 were slguificantly related to %HRmax. The llnearcorrelation coefficients were r = -0.37 (p < 0.001) for delta 02
and %HRmax, and r = 0.80 (p < 0.001) for helmet CO 2 and %HRmax.
Temperature Profiles: The mean data and significant differencesfor Trec, Tsk, Tb, and Ts appear in Tables 4-7. In the HOTenvironment, neither suit provided adequate cooling. A steady
rise appeared throughout as Ts, Tb, and Tsk approached Trec.However, a slight gradient for heat exchange remained. When the
data were pooled across time, the PHE-BP had a significantly
higher average reading for Trec than PHE-HL, while PHE-HL showed
significantly greater Tsk and Tb values.
In the LAB condition, each suit performed adequately as Ts and
Tsk remained'stable or decreased except for the exerciseperiods. Although the suits showed similar trends, PHE-HL didshow significantly higher pooled values for Tsk and Tb thanPHE-BP in the LAB condition.
In the COLD tests, the effects of the PHE-HL air flow system
proved to be not as severe as the cryogenically supplied air of
the PHE-BP. With the PHE-BP, temperatures were very cold, and
the subjects were uncomfortable. There was no significant
difference in Tre c between the suits in the COLD, but the PHE-BP
had significantly cooler Tsk, Ts, and Tb values.
DISCUSSION
The major objective of this study was to assess the effect of twoconfigurations of a whole body protective suit on work physiologyin three different environmental conditions. According to ACGIH
-5-
standards, PHE activity was classified as moderate work which
#equired walking about with some lifting and pushing. Thisclassification did not consider the encumbrance of the suit (2).
However, our findings indicated that the weight and encumbrance
of the suit, the external air supply, and the ambient temperaturehad a significant effect upon the cardiovascular and thermal
responses to brief periods of TM walking in each PHE suit.
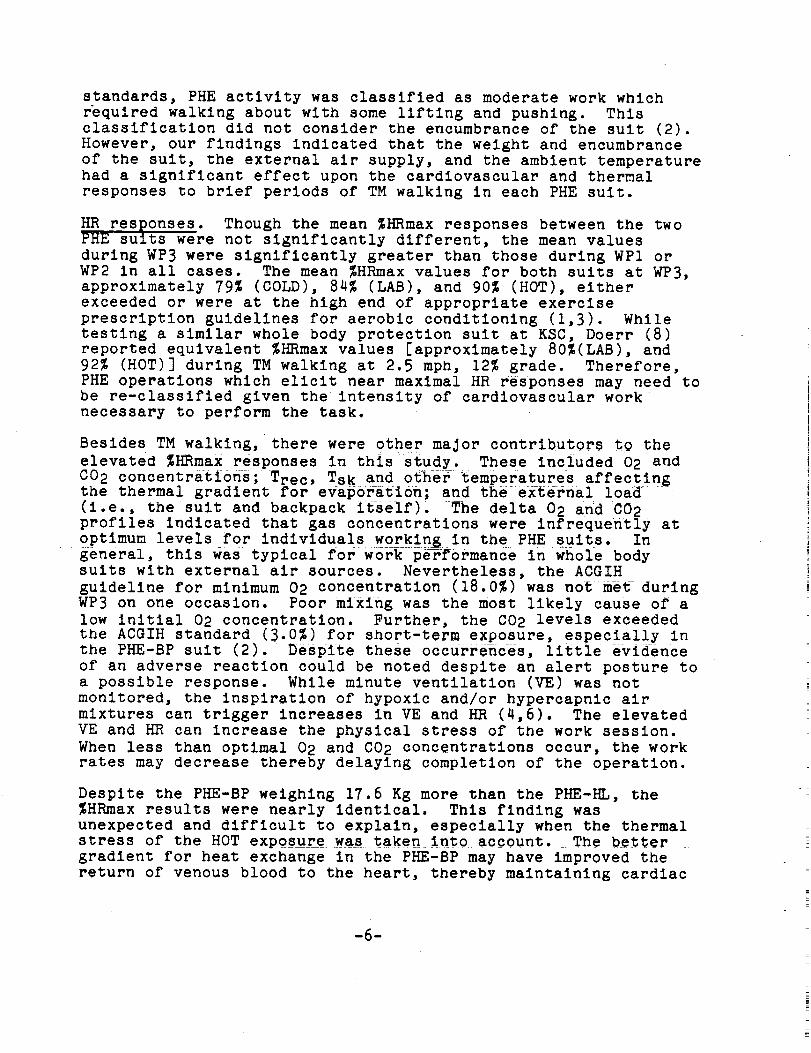
HR responses. Though the mean %HRmax responses between the twoPHE suits were not significantly different, the mean values
during WP3 were significantly greater than those during WPI orWP2 in all cases. The mean %HRmax values for both suits at WP3,
approximately 79% (COLD), 84% (LAB), and 90% (HOT), either
exceeded or were at the high end of appropriate exercise
prescription guidelines for aerobic conditioning (1,3). Whiletesting a similar whole body protection suit at KSC, Doerr (8)
reported equivalent %HRmax values [approximately 80%(LAB), and
92% (HOT)] during TM walking at 2.5 mph, 12% grade. Therefore,
PHE operations which elicit near maximal HR responses may need tobe re-classlfled given the intensity of cardiovascular work
necessary to perform the task.
Besides TM walking, there were other major contributors to the
elevated %HRmax responses in this study. These included 02 and
C02 concentrations; Trec, Tsk and othe_ temperatures affectingthe thermal gradient for evaporation; and the external load
(i.e., the suit and backpack itself). The delta 02 and C02profiles indicated that gas concentrations were infrequently atoptimum levels for individuals working in the PHE suits. In
general, this Was typical for work performance in whole body
suits with external air sources. Nevertheless, the ACGIH
guideline for minimum 02 concentration (18.0%) was not met during
WP3 on one occasion. Poor mixing was the most likely cause of a
low initial 02 concentration. Further, the C02 levels exceededthe ACGIH standard (3.0%) for short-term exposure, especially in
the PHE-BP suit (2). Despite these occurrences, little evidence
of an adverse reaction could be noted despite an alert posture to
a possible response. While minute ventilation (VE) was not
monitored, the inspiration of hypoxic and/or hypercapcic air
mixtures can trigger increases in VE and HR (4,6). The elevated
VE and HR can increase the physical stress of the work session.
When less than optimal 02 and C02 concentrations occur, the workrates may decrease thereby delaying completion of the operation.
Despite the PHE-BP weighing 17.6 Kg more than the PHE-HL, the
%HRmax results were nearly identical. This finding was
unexpected and difficult to explain, especially when the thermalstress of the HOT exposure was taken into account. The better
gradient for heat exchange in the PHE-BP may have improved the
return of venous blood to the heart, thereby maintaining cardiac
-6-

stroke volume and diminishing (somewhat) the expected elevation
in HR. The differences in Trec and mean Tsk lend some support to
this hypothesis.
Temperature Profiles. The temperature profiles for Ts, Tb, Tsk,and Tre c were not remarkably different for either suit and werein accordance with data from others (8,9). Neither PHE suit
performed well in the HOT environment as Ts, Tb, Tsk, approached
Trec, leaving little gradient for heat exchange even during therest phases of the protocol. Although the PHE-HL HOT test wassubjectively the hottest exposure, the cooler air provided by the
PHE-BP ECU offered little relief for the subject as demonstrated
by the significantly greater Trec (PHE-BP > PHE-HL, p < 0.05)during the HOT test.
The greater Trec in the PHE-BP may be accounted for by theincreased metabolic work required to carry the heavier suit and
possibly by an elevated C02 concentration. The result was anincreased relative workload (%VO2max) , and increases in Tre c are
known to be positively correlated with increases in %V02 max (6).
The temperature profiles in the LAB tests were similar,indicating that some cooling capacity was still available. In
this test, the cooler air from the PHE-BP ECU had a significant
effect on Tsk, Tb, and Ts as they showed a steady decreasethroughout except for the exercise periods. In the COLD tests,
the PHE-HL was the preferred suit, as the circulation of ambientair was not as severe as that from the PHE-BP ECU. In the COLD
PHE-BP test, Ts dropped to 35.1 °F and several subjects were
uncomfortable, though none shivered uncontrollably. The normal
undergarment for this uult was a single layer of thermal
underwear. However, if more clothing or insulation were added to
protect the subject, then less body heat would have been
available to the ECU heat exchanger, further cooling the air
supplied into the veuturi.
Comparison of the PHE Suits. Given the test conditions and thetemperature profile data, neither suit significantly outperformed
the other. The PHE-BP performed best in the LAB condition, while
the potential for thermal intolerance (e.g., hyperthermla orshivering) existed in both the HOT and COLD exposures. The
PHE-HL was significantly more comfortable in the COLD because of
its warmer incoming air, but the suit did not provide adequate
cooling in the other environments. Because neither suit could
meet completely the cooling requirements in the HOT exposure,hyperthermia and its subsequent effects on HR and work rate wereand may continue to be a cause for concern during PHE operations
in hot ambient temperatures. The ambient heat stress, the work
intensity of the operation, plus the weight and encumbrance of
the PHE suit -- all act to heighten the physiologic and thermal
-7-
stress placed upon the individual user. In circumstances such asthese, even relatively light work performed while wearing the PHEmay become arduous.
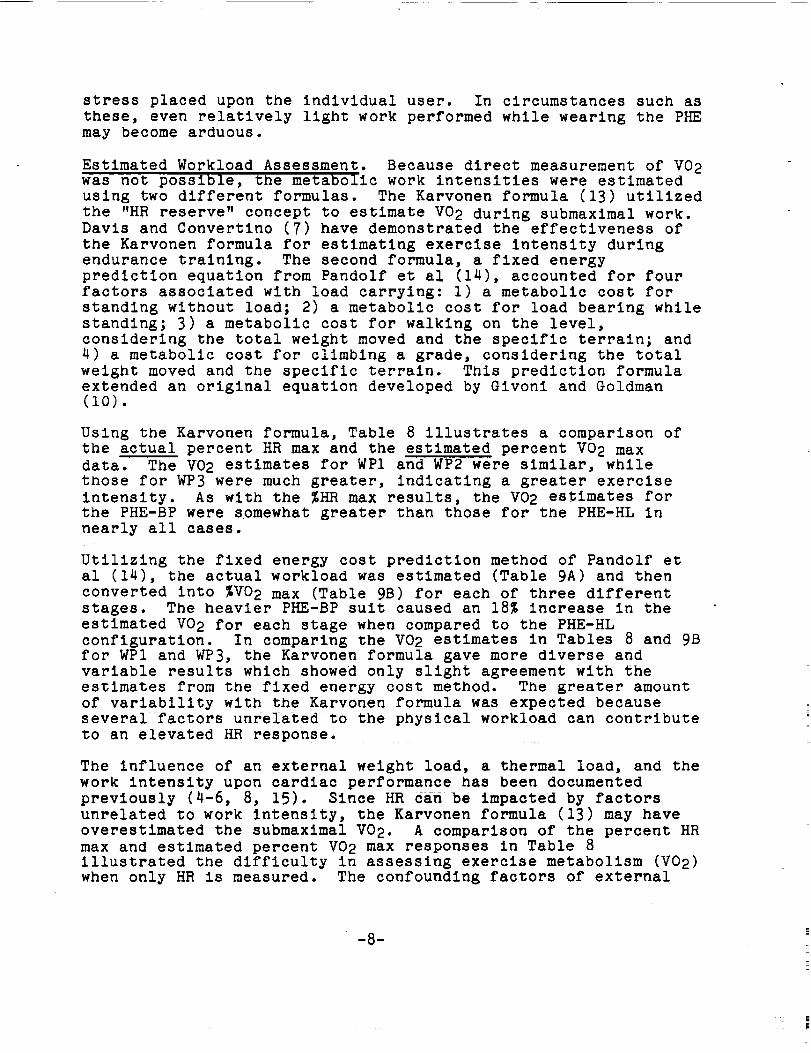
Estimated Workload Assessment. Because direct measurement of V02was not possible, the metabolic work intensities were estimated
using two different formulas. The Karvonen formula (13) utilized
the "HR reserve" concept to estimate VO 2 during submaximal work.Davis and Convertino (7) have demonstrated the effectiveness of
the Karvoueu formula for estimating exercise intensity duringendurance training. The second formula, a fixed energy
prediction equation from Pandolf et al (14), accounted for four
factors associated with load carrying: l) a metabolic cost for
standing without load; 2) a metabolic cost for load bearing while
standing; 3) a metabolic cost for walking on the level,
considering the total weight moved and the specific terrain; and
4) a metabolic cost for climbing a grade, considering the total
weight moved and the specific terrain. This prediction formulaextended an original equation developed by Givonl and Goldman(10).
Using the Karvonen formula, Table 8 illustrates a comparison of
the actual percent HR max and the estimated percent VO 2 max
data. The V02 estimates for WPI and WP2 were similar, while
those for WP3 were much greater, indicating a greater exercise
intensity. As with the %HR max results, the V02 estimates for
the PHE-BP were somewhat greater than those for the PHE-HL innearly all cases.
Utilizing the fixed energy cost prediction method of Pandolf et
al (14), the actual workload was estimated (Table 9A) and then
converted into %VO 2 max (Table 9B) for each of three different
stages. The heavier PHE-BP suit caused an 18% increase in the
estimated VO 2 for each stage when compared to the PHE-HLconfiguration. In comparing the V02 estimates in Tables 8 and 9B
for WPI and WP3, the Karvonen formula gave more diverse and
variable results which showed only slight agreement with theestimates from the fixed energy cost method. The greater amount
of variability with the Karvonen formula was expected because
several factors unrelated to the physical workload can contribute
to an elevated HR response.
The influence of an external weight load, a thermal load, and the
work intensity upon cardiac performance has been documented
previously (4-6, 8, 15). Since HR can be impacted by factors
unrelated to work intensity, the Karvonen formula (13) may have
overestimated the submaximal VO 2. A comparison of the percent HR
max and estimated percent V02 max responses in Table 8
illustrated the difficulty in assessing exercise metabolism (V02)when only HR is measured. The confounding factors of external
-8-
weight, suit design, and thermal adversities elevated the HR (andhence, %HRmax) In excess of that required strictly to perform the
physical work. Thus, the Karvonen formula seems to have limitedusefulness for PHE operations as an estimator of metabolicworkload.
In contrast, the Pandolf et al (14) prediction formula generated
VO 2 estimates which account for the metabolic costs associatedwith each of the four factors listed earlier. However, the added
dimension of walking In a pressurized garment, such as the PHE,
altered mechanical efficiency, a variable not factored into their
equation. Although the Pandolf et al formula may underestimate
the actual V02 because of changes in mechanical efficiency, theequation might be a better predictor of the metabolic workload
required for PHE operations since all the fixed energy costs(standing, load, terrain, grade, speed) are accounted for.
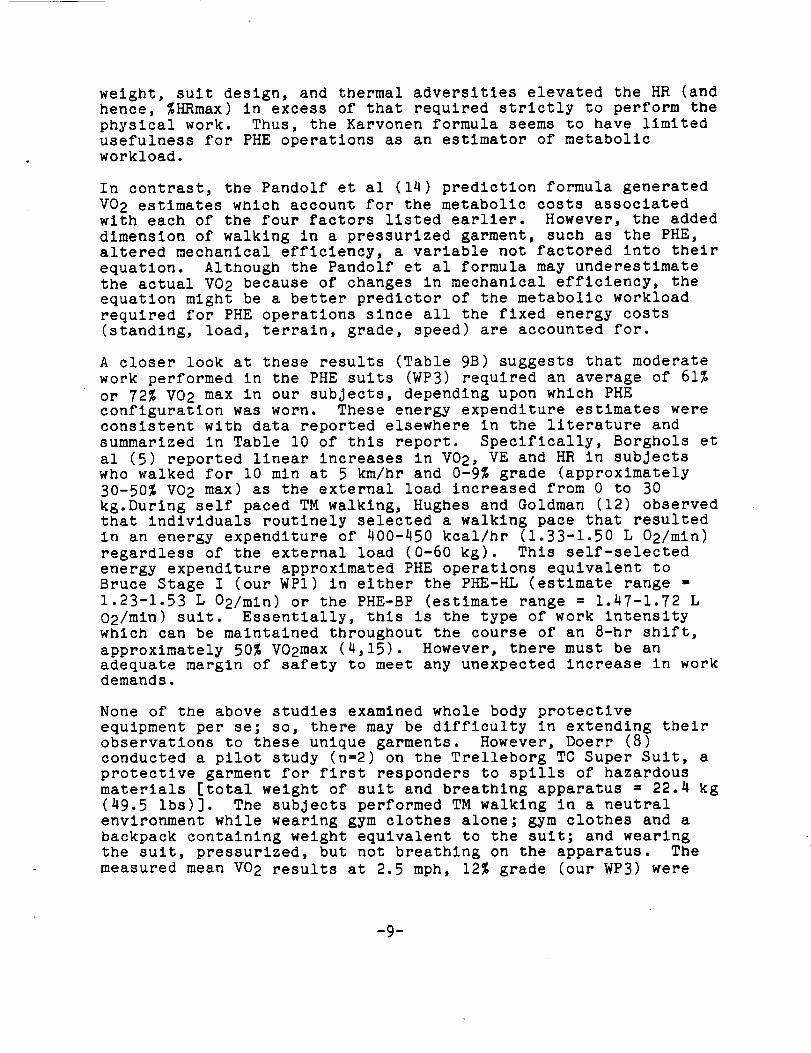
A closer look at these results (Table 9B) suggests that moderate
work performed in the PHE suits (WP3) required an average of 61%
or 72% V02 max in our subjects, depending upon which PHEconfiguration was worn. These energy expenditure estimates were
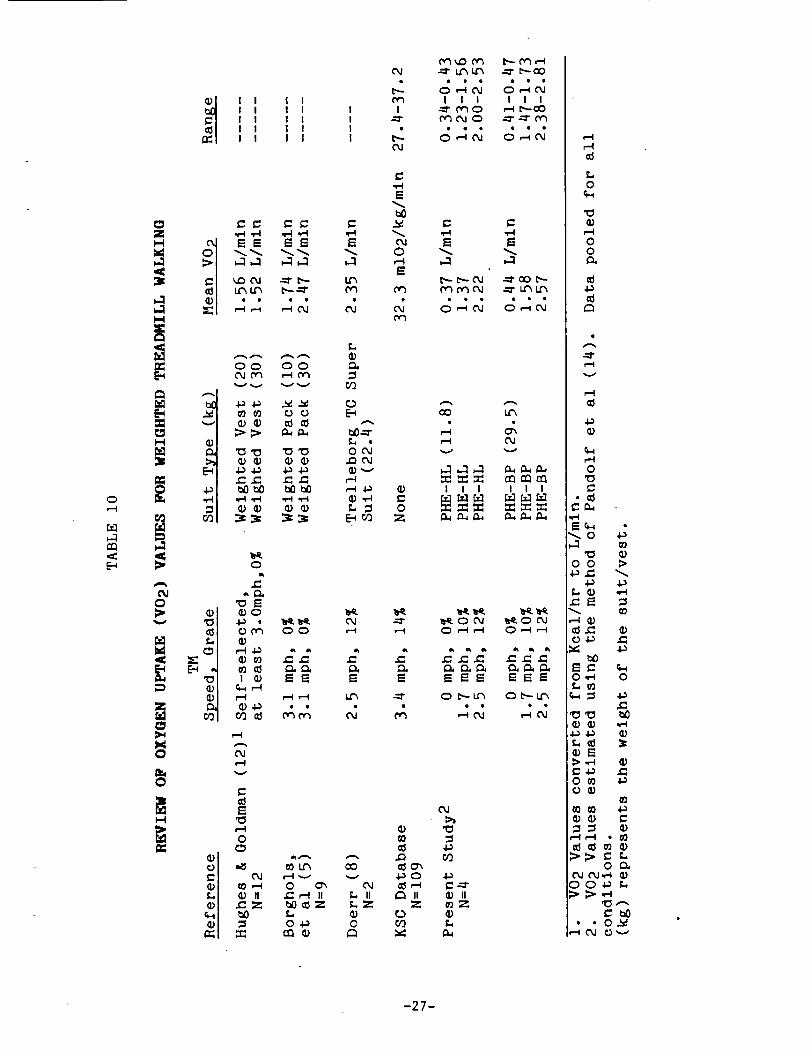
consistent with data reported elsewhere in the literature and
summarized in Table i0 of this report. Specifically, Borghols et
al (5) reported linear increases In V02, VE and HR in subjectswho walked for I0 mln at 5 km/hr and 0-9% grade (approximately
30-50% V02 max) as the external load increased from 0 to 30
kg. Durlng self paced TM walking, Hughes and Goldman (12) observedthat individuals routinely selected a walking pace that resulted
in an energy expenditure of 400-450 kcal/hr (1.33-1.50 L 02/mln)
regardless of the external load (0-60 kg). This self-selected
energy expenditure approximated PHE operations equivalent toBruce Stage I (our WPI) in either the PHE-HL (estimate range _
1.23-1.53 L 02/min ) or the PHE-BP (estimate range _ 1.47-1.72 L
02/mln) suit. Essentially, this is the type of work intensitywhich can be maintained throughout the course of an 8-hr shift,
approximately 50% VO2max (4,15). However, there must be an
adequate margin of safety to meet any unexpected increase in workdemands.
None of the above studies examined whole body protective
equipment per se; so, there may be difficulty in extending theirobservations to these unique garments. However, Doerr (8)conducted a pilot study (n=2) on the Trelleborg TC Super Suit, a
protective garment for first responders to spills of hazardous
materials [total weight of suit and breathing apparatus m 22.4 kg
(49.5 lbs)]. The subjects performed TM walking in a neutral
environment while wearing gym clothes alone; gym clothes and a
backpack containing weight equivalent to the suit; and wearingthe suit, pressurized, but not breathing on the apparatus. The
measured mean VO 2 results at 2.5 mph, 12% grade (our WP3) were
-9-
1.62 L/min (baseline), 2.23 L/min (shorts + backpack), and 2.35
L/min (suit), respectively. The encumbrance of the suit led to a
45% increase in VO 2 between the baseline and suited conditions
and a 5.4% increase between the weighted and suited conditions
despite uo change in TM speed or grade. Our estimated VO 2results via Pandolf et al (14) were in close agreement with thosereported by Doerr (8). In the LAB condition, our WP3 estimates
ranged from 2.00-2.53 L/min for the PHE-HL, while those for the
PHE-BP ranged from 2.38-2.81L/min.
In summary, the imposition of a whole body protective suit, such
as the PHE, resulted in significant physiologic and thermal
stress for the user due solely to the protective system. In
nearly every instance the HR was driven to moderately high
levels, the supplied respiratory gases were less than optimum,
and thermal adversities were introduced. Each PHE configuration
burdened the user with a weight load that may be prohibitive for
the less fit worker, or the smaller, lighter individual. Sinceneither PHE configuration offered clearly superior performance,
our findings suggested that the operational choice of which PHEsuit to use should be made after careful consideration of the
task difficulty, length and type of operation, ambientconditions, and perhaps, even the fitness capabilities of theworker(s).
RECOMMENDATIONS
Because the relationship between aerobic fitness an_ workcapacity is a direct =one, questions remain concerning the
cardiorespiratory fitness level (V02maX) desired or required for
individuals who are performing PHE operations at _C. Thecurrent physical qualification Standar_ is completion of Bruce
Stage III (3.4 mph, 14_), a 9 minute test. Data from KSC workers
(N=109) indicated that this test corresponded to a VO 2 of
approximately 33 ml 02/kg/min or 2.31 LO2/min for a 70kgreference individual. As reported here, and previously by Doerr(8), this level of exertion was comparable to performing PHE
operations at Bruce Stage II (moderate to difficult work).
Working at light to moderate PHE tasks, comparable to Bruce Stage
I, will require approximately 65% (1.5 L/min/2.31L/min) of
VO2max (70 kg person) for an individual who barely complies with
the current standard. This level of physioiogic stress can be
maintained for long periods In highly fit individuals; however,
PHE tasks of this intensity may be more demanding than the
suggested "self-selected" work pace of 30-50% VO2max (4,12,15).
Based on these resu_s and our experience with the PHE, we haveoutlined several critical areas of concern and our
recommendations for minimizing _theireffects.
-i0-
|l|
I •
•
.
ISSUE:
The physical demands of working in the PHE can sometimesexceed the fitness level to which individuals are certified
at present.
RECOMMENDATIONS:
a) Continue annual certification procedures.
b) Review the present physical standard.
c) Consider extending the qualification TM test into Bruce
Stage IV (minute 2).
ISSUE:
Develop optimum work/rest ratios to minimize physical stress
to the worker and maximize the quality and timely completion
of PHE operations.
RECOMMENDATION:
a) Continuous monitoring of the ambient temperature to
assist in the prevention of potential heat injuries.
b) Prolonged operations >90 min should be of light to
moderate intensity with work periods of 10-20 mln
followed by an equivalent rest period•c) Intense PHE operations should be <90 min in duration
with work periods of up t__ol0 min followed by a minimumrest period of i0 mln.
d) When a PHE worker is required to perform monitoring
functions, the maximum time allowed in the suit should
not exceed the safe limits of the air supply,
ap---_roximately 150-180 min.
ISSUE:
During work in a hot, humid environment, the elevation of
core temperature may be of sufficient magnitude to decrease
physical performance and lead to potential medical problems.
RECOMMENDATIONS:
a) Develop guidelines to encourage all PHE users to becomeheat acclimated, and to consume extra fluids
(non-caffeinated) prior to donning the suit. Enhancedfluid consumption should begin 18-24 h prior to the
operation.b) Explore the effects of cold air inhalation (3.6°C) on
PHE work performance. Recent research evidence suggests
that breathing cold air can reduce the rise in core
temperature associated with heat stress (9).
c) Explore methods to improve air flow for evaporative
cooling.
d) Consider monitoring pre- and post body weight, heartrate, and/or blood pressure during PHE operations. This
-ll-

data will help establish guidelines to enhance physicalrecovery for PHE users.
. ISSUE:
The 02 and the C02 gas concentrations were not always withinACGIH guidelines.
RECOMMENDATIONS:
a) Increase level of 02 in liquid air mix from 21% to 25%.
b) Consider methods to reduce C02 build up in the helmet
region.
• ISSUE:
There is a need to validate the work intensity of PHE
operations so that appropriate work categorizations can bemade.
RECOMMENDATIONS:
Through field tests and assessments of PHE operations,determine a worst case scenario (e.g., heavy physical work
with victim rescue) and evaluate its work intensity and
safety (via HR and rectal temperature data).
. ISSUE:
Develop operational procedures to determine which PHE
configuration best meets the requirements of the operationand best accommodates the user, given the task intensity,
duration, and ambient conditions.
RECOMMENDATION:
a) Assess the need for mobility during the operation
(noseline tether vs. backpack).
b) Evaluate the potential interaction between task
intensity, ambient conditions, and task duration.
c) Select appropriate PHE configuration after considering
all aspects of the operation (using the matrix below.
AMBIENT TEMPERATURE LIGHT WORK HEAVY WORK
HOT P_-BP PHE-BP
NEUTRAL (LAB) PHE-HL PHE-BP
COLD PHE-HL PHE-BP
In summary, these recommendations reflect a concern that low
aerobic fitness, in combination with ambient heat stress, heavy
physical work, a reduced cooling capacity, and less than optimal
-12-

02 and C02 concentrations, may lead to difficulty during PHEoperations. By incorporating these recommendations, this riskcan be minimized and the safety of the operation will beimproved.
-13-
REFERENCES
i• American College of Sports Medicine• Guidelines for Exercise
Testing and Prescription. Philadelphia: Lea & Febiger, 1986.
o American Conference of Government Industrial Hygienists•
Threshold limit values and biological exposure indices for
1986-1987. Cincinnati, OH:ACGIH, 1986•
• American Heart Association Subcommittee on Rehabilitation.
The Exercise Standards Book• Dallas: American Heart
Association, 1979.
• Astrand, P.O., and K. Rodahl. Textbook of Work Physiology.New York: McGraw-Hill Book Company, 1970.
•
•
Borghols, EAM, HMW Dresen, and AP Hollander. Influence of
heavy weight carrying on the cardiorespiratory system during
exercise. Eur. J. Appl. Physiol., 38: 161-169, 1978.
Brooks, G.A. and T.D. Fahey.
J. Wiley & Sons, 1984.Exercise Physiology. New York:
•
•
•
i0.
Davis, J.A. and V.A. Convertlno. A comparison of heart rate
methods for predlctlng endurance training intensity. Med.
Sci. Sports. 7:295-298, 1975.
Doerr, D.F. Trelleborg Trellchem Super Suit with Spiromatic
930 Self-Contalned Breathing Apparatus. Report from the
Kennedy Space Center, January, 1986.
Geladas, N. and E.W. Banister. Effect of cold air inhalation
on core temperature in exercising subjects under heat stress•
J. Appl. Pflyslol., 64(6): 2381-2387, 1988.
Givoni, B., and R.F. Goldman. Predicting metabolic energy
cost. J. Appl. Physiol., 30: 429-433, 1971•
ii.
12.
Goldman, R.F•, and P.F. lampietro. Energy cost of load
carriage. J. Appl. Physiol. 17:675-676, 1962.
Hughes, A.L. and R.F. Goldman. Energy cost of "hard work".
J. AppI. Physiol., 29(5): 570-572, 1970.
13. Karvonen, M.J., E. Kentala, and O. Mustala. The effects of
training on heart rate. A longitudinal study. Ann. Med.
Exper. Fenn. 35: 307-315, 1957.
14. Pandolf, K.B., B. Givoni, and R.F. Goldman• Predicting energy
expenditure with loads while standing or walking very slowly.
J. Appl. Physiol., 43(4): 577-581, 1977.
-14-
15. Sharkey, B.J. Fitness and Work Capacity Testing. Forestservice, u.s. Department of Agriculture, July, 197 7-
-15-
APPENDIX I
P
-16-
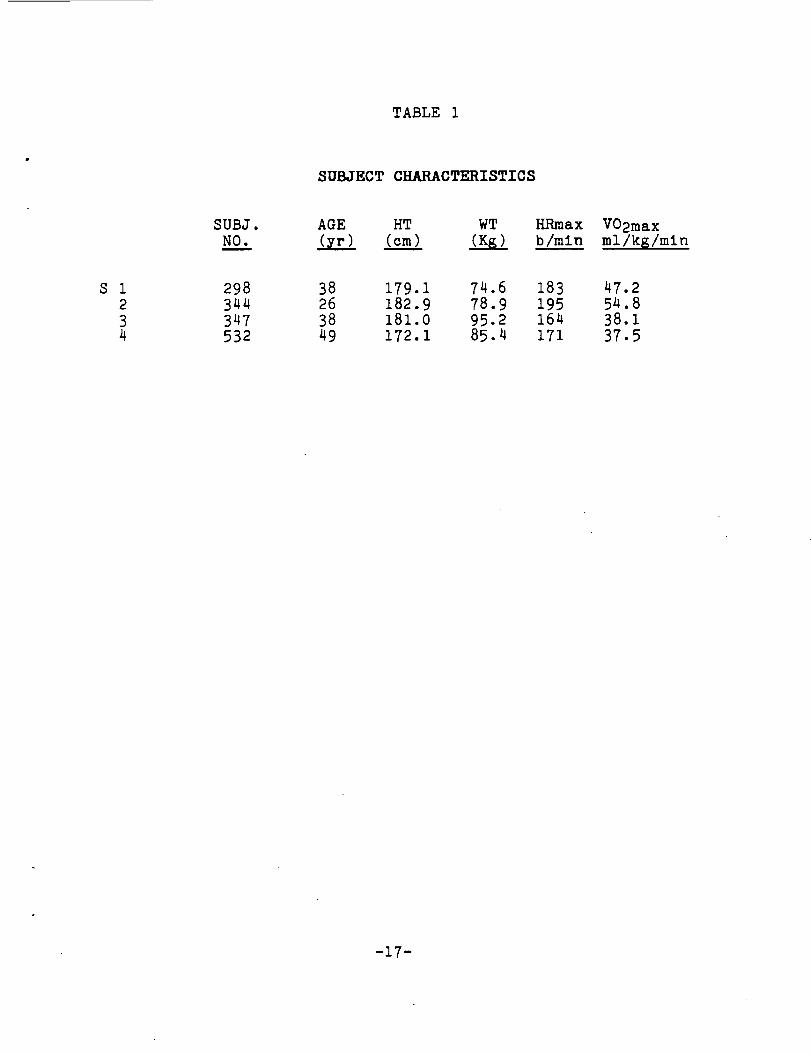
TABLE 1
SUBJECT CHARACTERISTICS
SUBJ. AGE HT WTN0___t. (yr) (cm) (Kg)
HRmax
b/mi nV02max
m!/k_/min
1
2
34
298
344
347
532
38 179.1 74.6 183
26 182.9 78.9 195
38 181.0 95.2 164
49 172.1 85.4 171
47.2
54.838.137.5
-17-
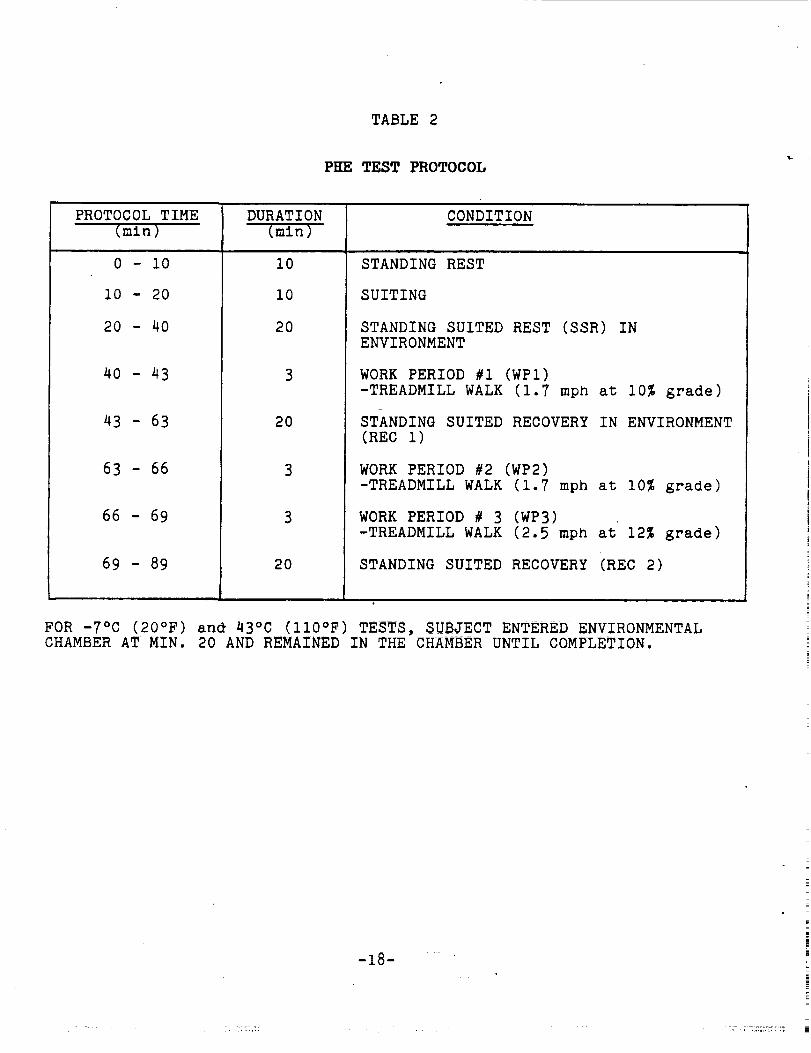
TABLE 2
PHE TEST PROTOCOL
PROTOCOL TIME
(mln)
0 - 10
I0 - 20
20 - 40
4O - 43
43 - 63
63 - 66
66 - 69
69 - 89
DURATION
(min)
I0
I0
2O
2O
3
3
2O
CONDITION
STANDING REST
SUITING
STANDING SUITED REST (SSR) INENVIRONMENT
WORK PERIOD #i (WPI)
-TREADMILL WALK (1.7 mpb at 10% grade)
STANDING SUITED RECOVERY IN ENVIRONMENT
(REC i)
WORK PERIOD #2 (WP2)
-TREADMILL WALK (i.7 mph at 10% grade)
WORK PERIOD # 3 (WP3)
-TREADMILL WALK (2.5 mph at 12% grade)
STANDING SUITED RECOVERY (REC 2)
FOR -7°C (20°F) an_ 43°C (ll0°F) TESTS, SUBJECT ENTERED ENVIRONMENTALCHAMBER AT MIN. 20 AND REMAINED IN THE CHAMBER UNTIL COMPLETION.
-18-
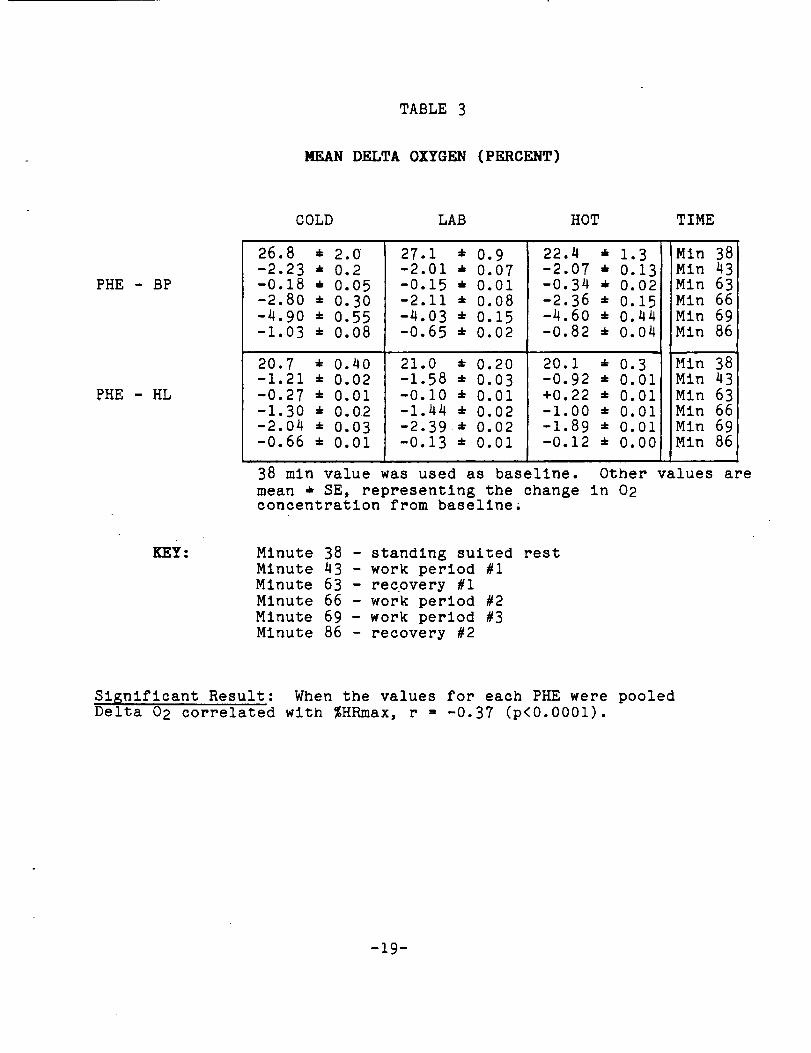
TABLE 3
MEAN DELTA OXYGEN (PERCENT)
PHE - BP
PHE - HL
COLD LAB HOT TIME
26.8 • 2.0
-2.23 • 0.2
-0.18 • 0.05-2.80 • 0.30
-4.90 • 0.55
-1.03 * 0.08
20.7 • 0.40-1.21 • 0.02
-0.27 • 0.01
-1.30 • 0.02
-2.04 -_ 0.03-0.66 ± 0.01
27.1 _ 0.9-2.01 • 0.07-0.15 • 0.01
-2.11 • 0.08
-4.03 • 0.15
-0.65 • 0.02
21.0 • 0.20
-1.58 • 0.03-0.I0 • 0.01
-1.44 • 0.02
-2.39 • 0.02
-0.13 • 0.01
22.4 m 1.3
-2.07 • 0.13i-0.34 m 0.02
-2.36 • 0.15-4.60 • 0.44
-0.82 • 0.04
20.1 _ 0.3-0.92 • 0.01
+0.22 • 0.01
-I.00 • 0.01
-1.89 • 0.01-0.12 • 0.00
Min 38Min 43
Min 63Min 66
Min 69Min 86
Min 38
Min 43
Min 63
Min 66
Min 69Min 86
38 min value was used as baseline. Other values are
mean • SE, representing the change in 02concentration from baseline_
KEY: Minute 38 - standing suited rest
Minute 43 - work period #i
Minute 63 - recovery #I
Minute 66 - work period #2
Minute 69 - work period #3
Minute 86 - recovery #2
Significant Result: When the values for each PHE were pooledDelta 02 correlated with %HRmax, r = -0.37 (p<0.0001).
-19-
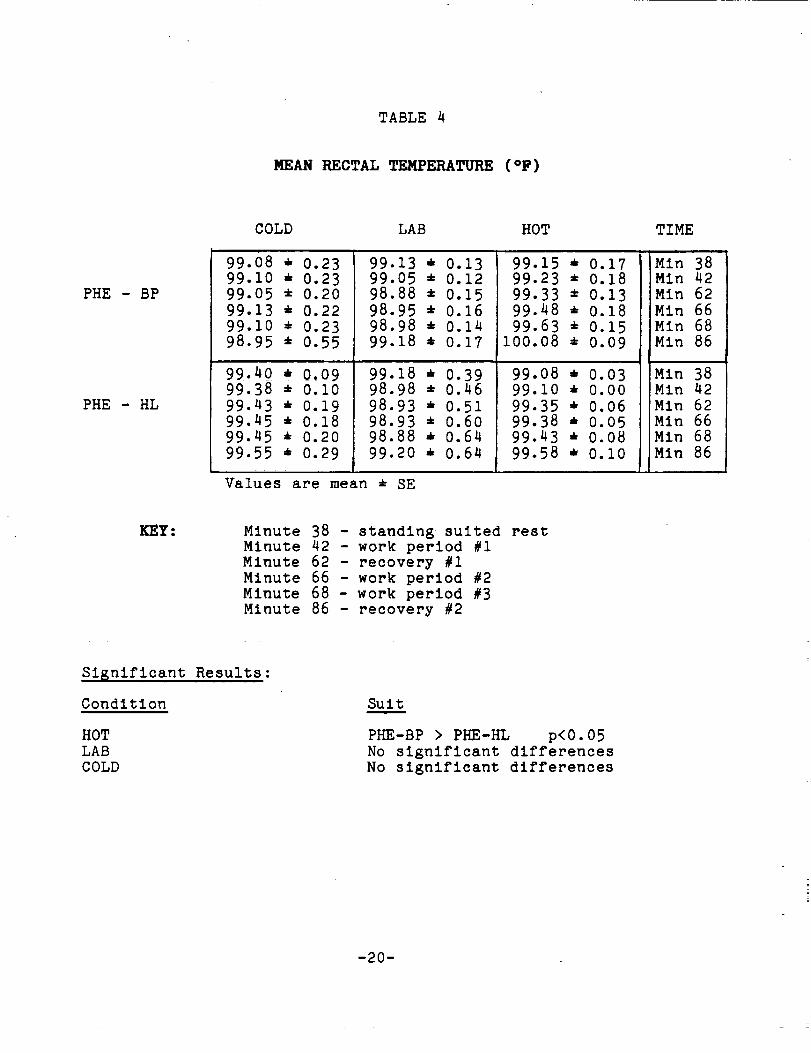
TABLE 4
MEANRECTAL TEMPERATURE (*F)
PHE - BP
PHE - HL
COLD LAB HOT TIME
99.08 * 0.23
99.10 * 0.2399.05 • 0.2099.13 * 0.2299.10 * 0.2398.95 • 0.55
99.40 * 0.0999.38 * 0.I0
99.43 * 0.19
99.45 * 0.1899.45 • 0.20
99.55 * 0.29
99.13 * 0.1399.05 * 0.12
98.88 • 0.1598.95 • 0.16
98.98 • 0.14
99.18 • 0.17
99.18 * 0.3998.98 • 0.46
98.93 * 0.5198.93 _ 0.6098.88 * 0.64
99.20 * 0.64
99.15 * 0.1799.23 • 0.18
99.33 • 0.13
99.48 * 0.18
99.63 • 0.15100.08 * 0.09
99.08 * 0.0399.10 • 0.00
99.35 * 0.06
99.38 * 0.05
99.43 * 0.08
99.58 J 0.i0
Values are mean • SE
iLMin 38Min 42
Min 62
Min 66
Min 68
iMin 86
Min 38Min 42
Min 62
Min 66
Min 68
Min 86
KEY: Minute 38 - standing suited rest
Minute 42 - work period #iMinute 62 - recovery #I
Minute 66 - work period #2
Minute 68 - work period #3
Minute 86 - recovery #2
Significant Results:
Condition
HOTLAB
COLD
Suit
PHE-BP > PHE-HL p<0.05
No significant differences
No significant differences
-20-
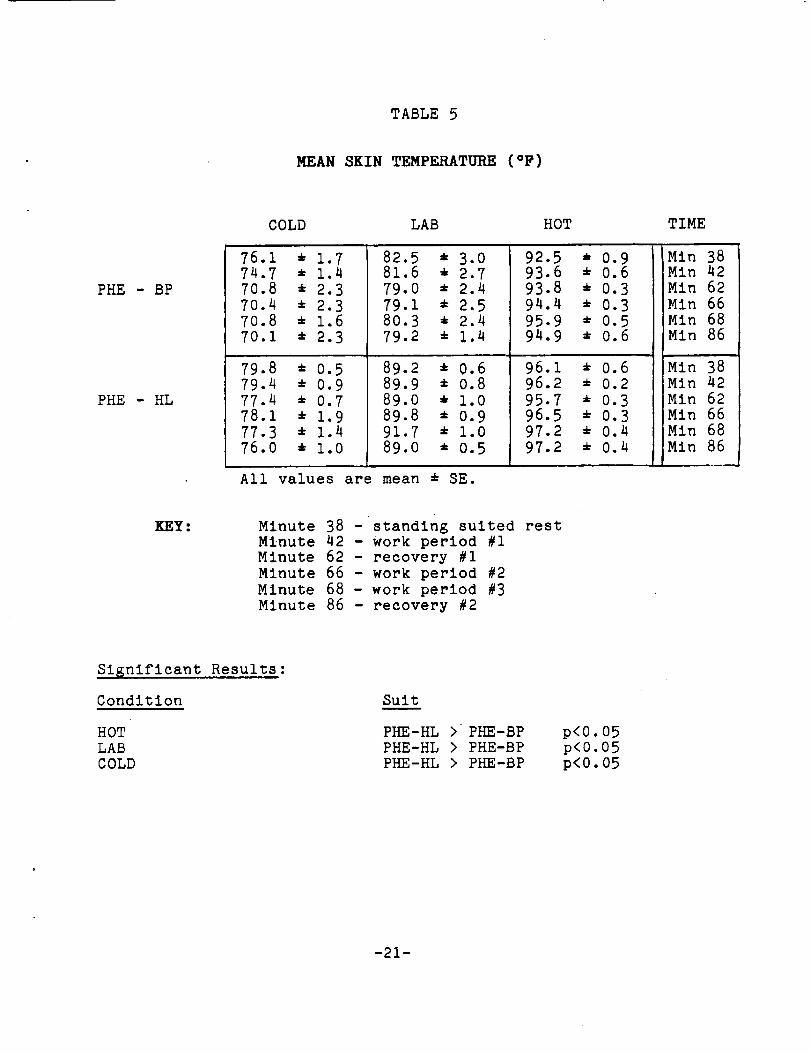
TABLE 5
MEAN SKIN TEMPERATURE (°F)
PHE - BP
PHE - HL
COLD LAB HOT
76.1 • 1.7
74.7 • 1.4
70.8 • 2.3
70.4 * 2.3
70.8 • 1.6
7o.1 * 2.3
79.8 * 0.579.4 * 0.9
77.4 • 0.778.1 * 1.9
77.3 * 1.4
76.0 • 1.0
82.5 • 3.0
81.6 • 2.779.0 • 2.4
79.1 * 2.580.3 • 2.4
79.2 * 1.4
89.2 * 0.6
89.9 * 0.8
89.0 * I.O
89.8 • 0.9
91.7 * i.o
89.0 * 0.5
92.593.6
93.8
94.4
95.9
94.9
96.1
96.2
95.796.5
97.2
97.2
All values are mean * SE.
• O.9•0.6
•0.3
•0.3
•0.5•0.6
*0.6
*0.2
•0.3
*0.3*0.4
*0.4
,. , ..
TIME
Min 38
Min 42
Min 62
Min 66
Min 68
Min 86
Min 38
Min 42Min 62
Min 66
Min 68
Min 86
KEY : Minute 38 - standing suited rest
M_nute 42 - Work period #IMinute 62 - recovery #1
Minute 66 - work period #2
Minute 68 - work period #3
Minute 86 - recovery #2
Sl_nlficant Results:
Condition
HOT
LAB
COLD
Suit
PHE-HL > PHE-BP
PHE-HL > PHE-BPPHE-HL > PHE-BP
p<0.05
p<O.05
p<0.05
-21-
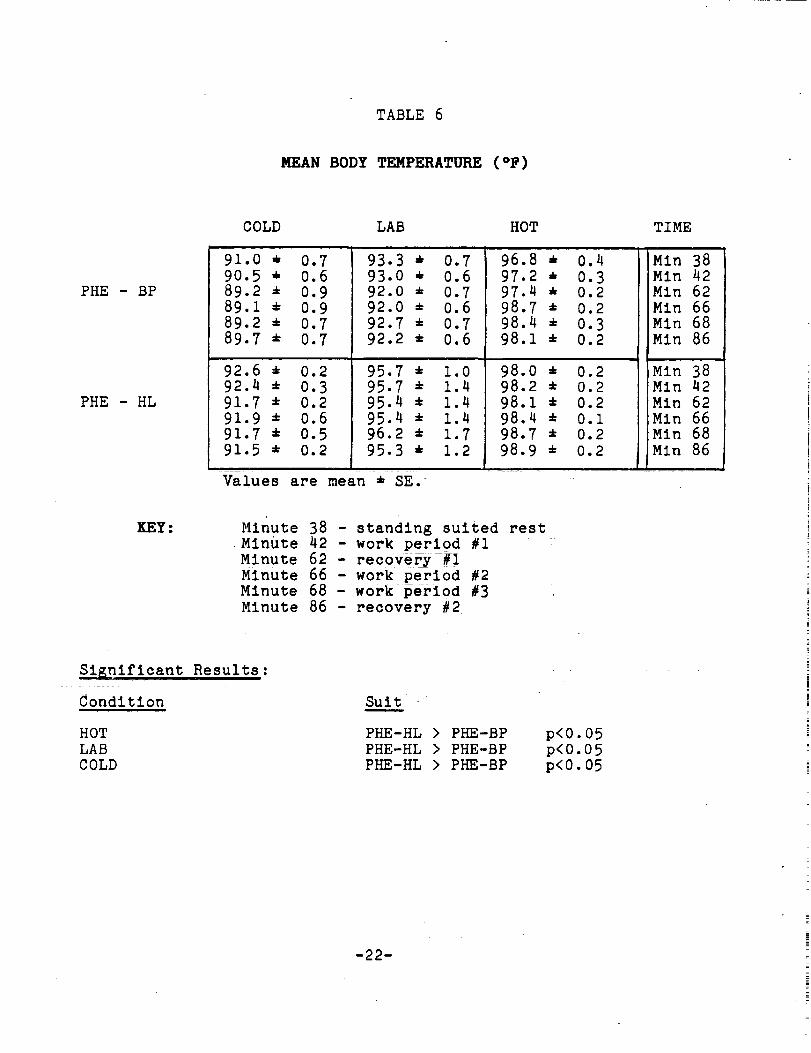
TABLE 6
MEAN BODY TEMPERATURE(oF)
PHE - BP
PHE - HL
COLD LAB HOT TIME
91.0 _, 0.7
90.5 * 0.6
89.2 * 0.989.1 * 0.9
89.2 :_ 0.7
89.7 * 0.7
92.6 * 0.2
92.4 • 0.3
91.7 _ 0.2
91.9 ± 0.6
91.7 ± 0.5
91.5 * 0.2
93.3 * 0.7
93.0 * 0.6
92.0 * 0.792.0 * 0.6
92.7 * 0.7
92.2 * 0.6
95.7 e 1.0
95.7 _ 1.4
95.4 ± 1.4
95.4 ± 1.4
96.2 ± 1.7
95.3 * 1.2
96.8 *
97.2 *97.4
98.7 *
98.4
98.1
98.0 *
98.2 *
98.1 ±
98.498.7 ±
98.9 *
Values are mean *_SE.
0.4
0.30.2
0.2
0.30.2
0.2
0.2
0.2
0.i0.2
0.2
Min 38
ISln 42
ISin 62
ISin 66IMin 68
Min 86
)Min 38
_Min 42
IMln 62IMin 66
_Min 68
Min 86
KEY: Minute 38 - standing suited rest
-Minute 42 - work period #I
Minute 62 - recovery #iMinute 66 - work period #2
Minute 68 - work period #3
Minute 86 - recovery #2
Significant Results:
Condition
HOT
LAB
COLD
Suit _
P_-HL > PHE-BP
PHE-HL > PHE-BP
PHE-HL > PHE'BP
p<0.05
p<0.05p<0.05
-22-
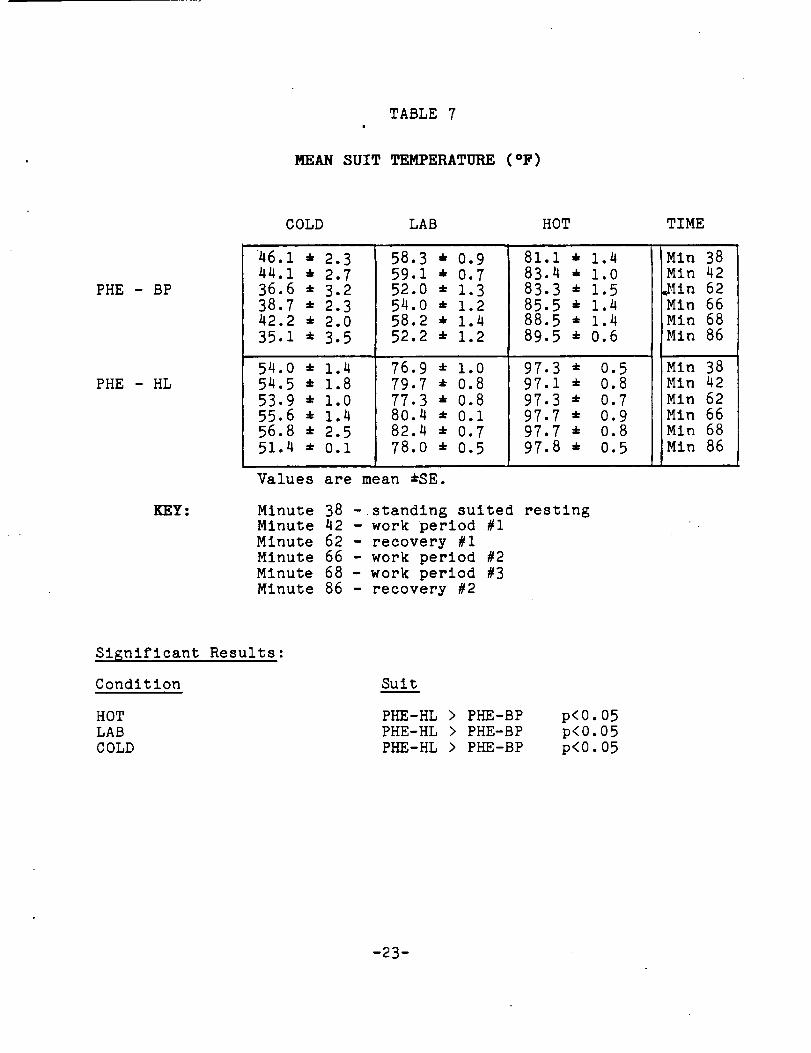
TABLE 7
MEANSUIT TEMPERATURE (oF)
PHE - BP
PHE - HL
KEY:
COLD LAB HOT TIME
46.1 * 2.3
44.1 * 2.736.6 * 3.2
38.7 * 2.342.2 * 2.0
35.1 * 3.5
58.3 * 0.9
59.1 * 0.752.0 • 1.3
54.0 • 1.258.2 • 1.4
52.2 • 1.2
81.1 m 1.4
83.4 m 1.0
83.3 • 1.5
85.5 m 1.488.5 • 1.4
89.5 * 0.6
54.0 • 1.4
54.5 e 1.8
53.9 • 1.0
55.6 • 1.4
56.8 _ 2.5
51.4 _ 0.i
76.9 • 1.079.7 • 0.877.3 * 0.880.4 * 0.I82.4 "_ 0.778.0 * 0.5
97.3 * 0.597.1 * 0.897.3 * 0.797.7 * 0.997.7 " 0.897.8 • 0.5
Values are mean ±SE.
Minute 38 -standing suited restingMinute 42 - work period #I
Minute 62 - recovery #1
Minute 66 - work period #2
Minute 68 - work period #3Minute 86 - recovery #2
Min 38Min 42
_in 62Min 66Min 68
Min 86
Min 38Min 42
Min 62Min 66
Min 68
Min 86
Significant Results:
Condition
HOT
LAB
COLD
Suit
PHE-HL > PHE-BP
PHE-HL > PHE-BP
PHE-HL > PHE-BP
p<0.o5
p<0.05
p<0.05
-23-
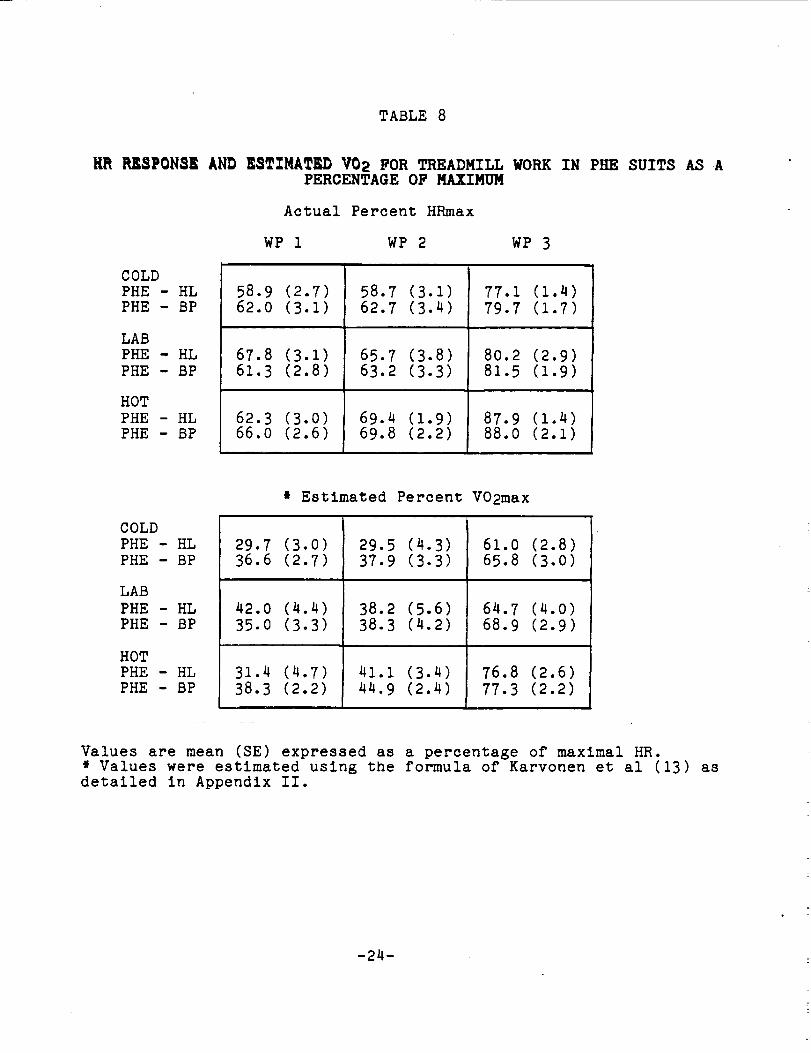
TABLE 8
HR RKSPON_EAND ESTZMATEDV02 FOR TREADMILL WORK IN PHE SUITS AS APERCENTAGE OF MAXIMUM
Actual Percent HRmax
WP 1 WP 2 WP 3
COLD
PHE - HL
PHE - BP
LABPHE - HL
PHE - BP
HOT
PHE - HL
PHE - BP
58.9 (2.7)
62.0 (3.1)
67.8 (3.1)
61.3 (2.8)
62.3 (3.0)66.0 (2.6)
58.7 (3.1)62.7 (3.4)
65.7 (3.8)
63.2 (3.3)
69.4 (1.9)
69.8 (2.2)
77.1 (1.4)79.7 (1.7)
80.2 (2.9)81.5 (1.9)
87.9 (1.4)
88.0 (2.1)
* Estimated Percent VO2max
COLD
PHE - HL
PHE - BP
LAB
PHE - HL
PHE - BP
HOTPHE - HL
PHE - BP
29.7 (3.0)
36.6 (2.7)
42.0 (4.4)
35.0 (3.3)
31.4 (4.7)
38.3 (2.2)
29.5 (4.3)
37.9 (3.3)
38.2 (5.6)
38.3 (4.2)
41.i (3.4)
44.9 (2.4)
61.0 (2.8)
65.8 (3.0)
64.7 (4.0)
68.9 (2.9)
76.8 (2.6)
77.3 (2.2)
Values are mean (SE) expressed as a percentage of maximal HR.* Values were estimated using the formula of Karvonen et al (13) as
detailed in Appendix II.
-24-

TABLE 9A
THE ESTIMATED METABOLIC WORKLOAD (WATTS) OF TREADMILLWALKING IN PHE SUITS
COLD LAB HOT
MEAN SE MEAN SE MEAN SE
PHE - HL
STAGE SSR
WPI
WP3
PHE - BP
STAGE SSRWPI
WP3
128.1
469.3762.1
149.9
543.6881.6
6.2
22.1
36.O
4.1
18.23O.7
128.1
469.5762.2
150.5545.3884.5
6.3
22.5
36.3
4.0
17.8
29.6
128.9
472.1
766.7
149.9543.488O.0
6.924.0
38.9
4.4
19.245.1
Values are mean and standard error in WATTS. SSR - Standing SuitedRest (min 38). WP! = Work Period 1 (min 43). WP3 = Work Period 3
(min 69). Watt values were estimated using the formula of Pandolf
et al (14) detailed in Appendix II.
-25-
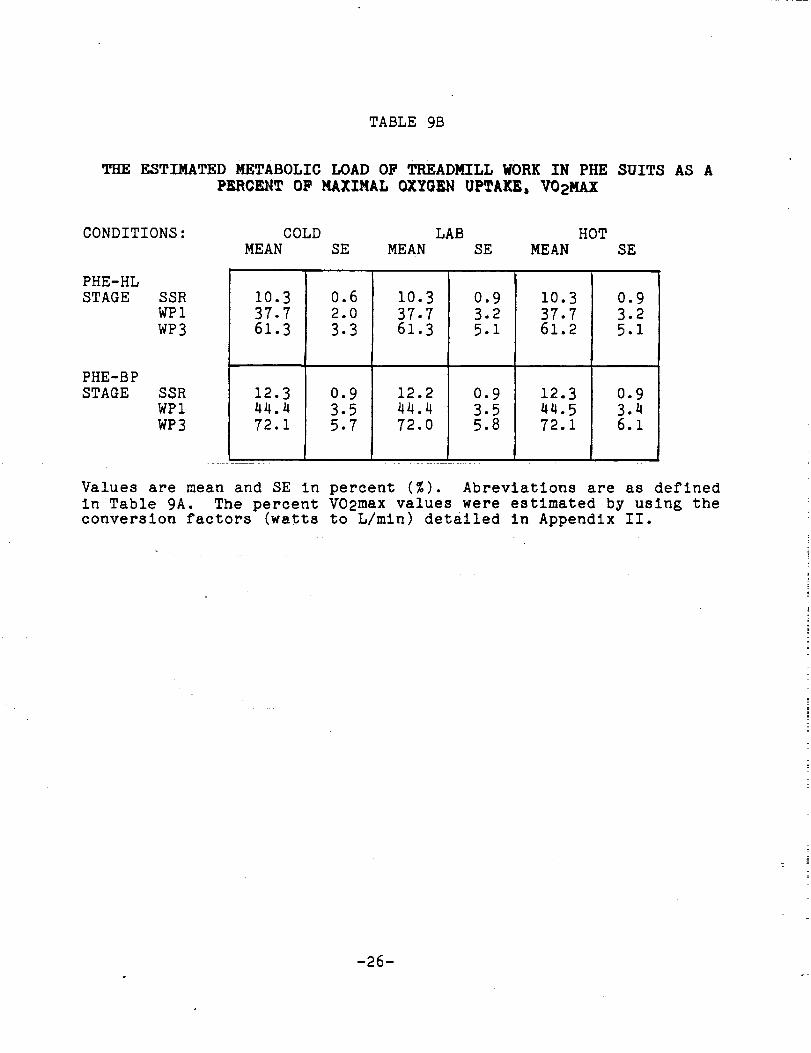
TABLE 9B
THE ESTIMATED METABOLIC LOAD OF TREADMILL WORK IN PHE SUITS AS A
PERCENT OP MAXIMAL OX¥OEN UPTAKE, VO2MAX
CONDITIONS: COLD LAB HOT
MEAN SE MEAN SE MEAN SE
PHE-HLSTAGE
PHE-BP
STAGE
SSR
WP 1
WP3
SSR
WPI
WP3
10.3
37.7
61.3
12.344.4
72.1
0.6
2.0
3.3
0.9
3.5
5.7
10.3 o.9
37.7 3.2
61.3 5.1
12.2 0.9
44.4 3.5
72.0 5.8
10.3
37-761.2
12.3
44.5
72.1
I
0.9
3.25.1
0.9
3.46.1
Values are mean and SE in percent (%). Abreviations are as defined
in Table 9A. The percent VO2max values were estimated by using theconversion factors (watts to L/min) detailed in Appendix II.
-26-
o
<
IN ,, t::_
'1_ 1_e. oJ _ _oc_l _ooJ
• • • •
_ v
ol
II J_ r--I II L, II I_ II _ II
:_ 0.1_ 0 0"_ _-,
o
V
o
o_
_0SCO','4 0
'0'0 _0_) .,-4
•._ .I._ (1)
o
_)
0 Clo_ c_.,.._ _
0>0_ _.,
_o_
-27-
I.I.I
I.I.I
X
,i,=..
--In-Ure
| |U.l I_I
a.i_.
' I ' I ' I " I ' I " I '
" I.I.I,T"
=a.
I.=
ILl
UH X_ %
-28-
I.I.I0
I.U
I.I.I
X
oo
.=I_._m
| |l.l.i I.I.I.I=-I=i_.a.
¢N0
= I.I.In-
=a.
I-
"wr_
' I ' I ' I ' I ' i ' I '
I:IH XV_ %
-29-

I.I.I
I.I.I
X
oo
...I a._'CO
| |LLI LI.I
' I ' I ' I ' I '
o o o o
I:iH XYW %
| • | '
o o
=D.
m
I-CO
"ILl
0
-30-
.,,,J0.,'_'¢0
! iLI..I 1,1,.I
0,. 0..
I,,IJ
<1:
_' ,.,.,I
I,,IJ
(.)"LI.I
"lJ.Io,'
I"--
"LtJ
• I • I • I • I " i • i • I • i ' I "
_00 .-IO NV3_
i
-..'31-
,,,, ,,,,2:2::
i,Li
Iii
N0
"iJJ
-0.
"lJJ
' i I _ I m I _ I ' i ' I ' i ''i"'"1 '
_:00 ::10 NV::IIA!
-32-
...I a.
| I
I.I.I I.I.I
a.D..
l.IJ0
IJ.l
• I ' I ' I ' I ' I ' I ' I ' I ' I '
¢N
= I.I.In-
" l.i.l _
-a.
I--COI.I.IIX
_00 =10 NV31N
-33-

APPENDIX II
-34-
I .
HRsm - HRrest
APPENDIX II
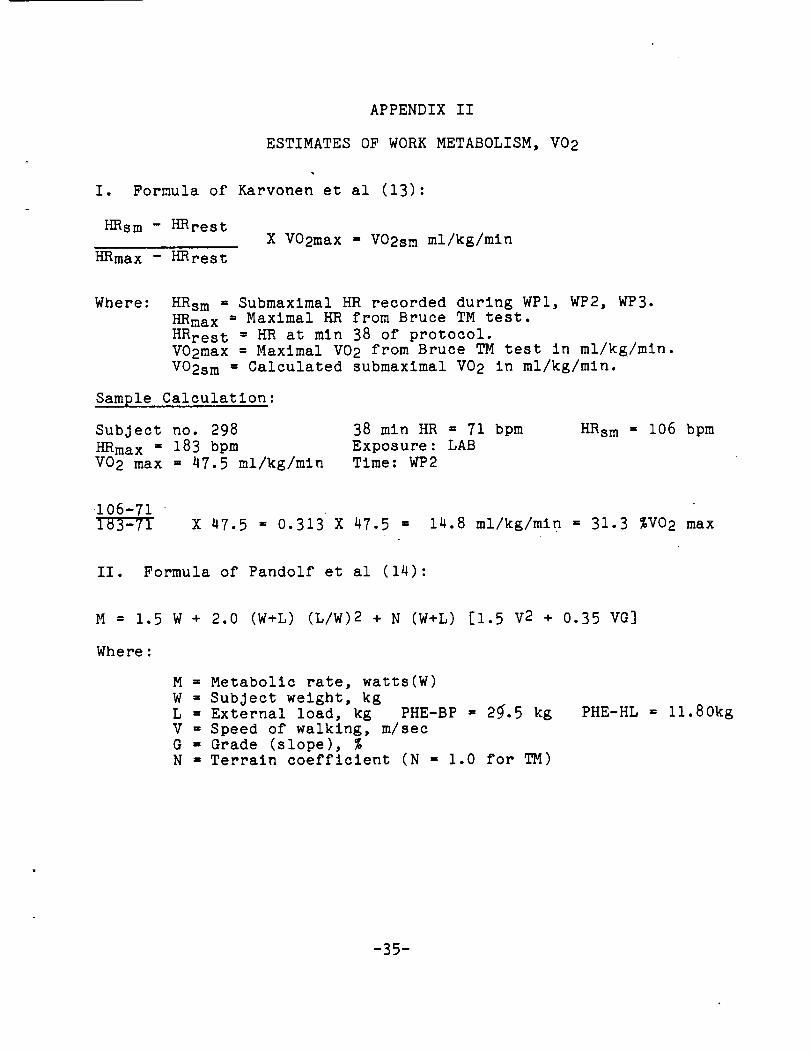
ESTIMATES OF WORK METABOLISM, V02
Formula of Karvonen et al (13):
HRmax - HRrest
X VO2max = VO2sm ml/kg/min
Where: HRsm = Submaximal HR recorded during WPI, WP2, WP3.
HRmax = Maximal HR from Bruce TM test.
HRrest = HR at min 38 of protocol.VO2max = Maximal V02 from Bruce TM test in ml/kg/min.
VO2s m = Calculated submaximal V02 in ml/kg/mln.
Sample Calculation:
Subject no. 298
HRma x - 183 bpm
V02 max = 47.5 ml/kg/min
38 min HR = 71 bpm
Exposure: LAB
Time: WP2
HRsm = 106 bpm
X 47.5 -- 0.313 X 47.5 = 14.8 ml/kg/mln = 31.3 _V02 max
II. Formula of Pandolf et al (14):
M -- 1.5 W + 2.0 (W+L) (L/W)2 + N (W+L) [1.5 V2 + 0.35 VG]
Whe re :
M = Metabolic rate, watts(W)
W = Subject weight, kgL =Exterual load, kg PHE-BP = 2_.5 kg
V = Speed of walking, m/secG = Grade (slope), %N _ Terrain coefficient (N _ 1.0 for TM)
PHE-HL = ll.80kg
-35-
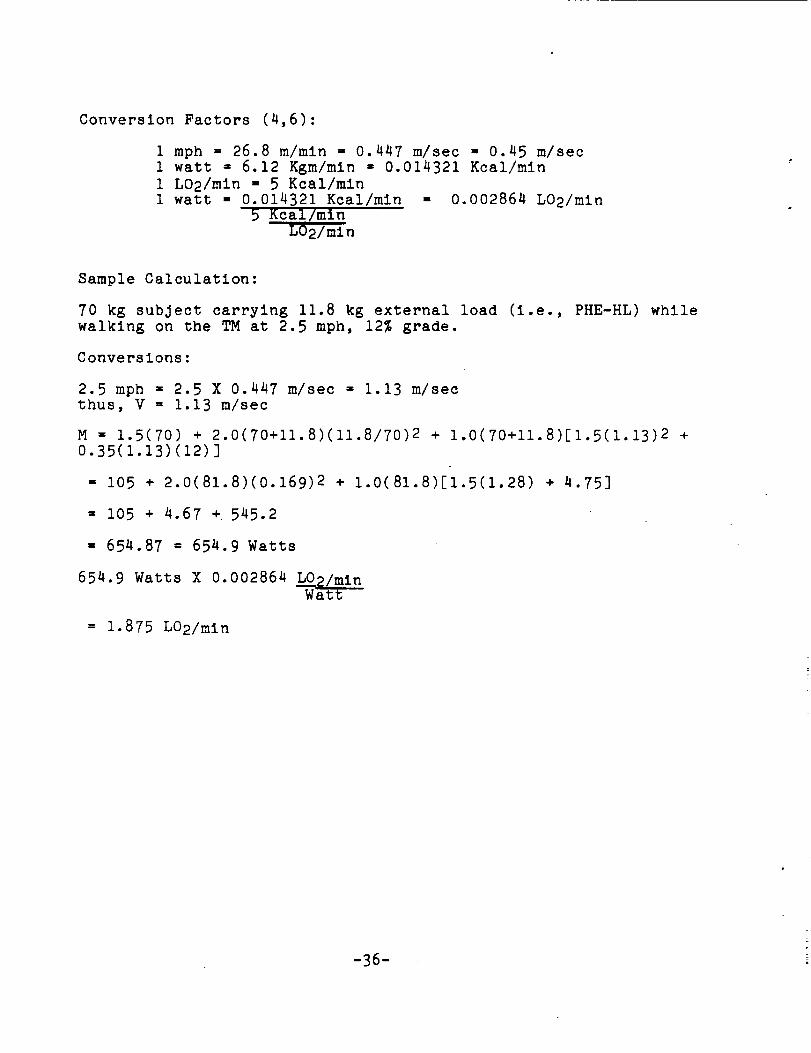
Conversion Factors (4,6):
i mph = 26.8 m/mln _ 0.447 m/sec _ 0.45 m/seni watt _ 6.12 Kgm/min - 0.014321Kcal/min1LO2/min _ 5 Kcal/mln1 watt - 0.014321Kcal/min _ 0.002864 LO2/mln
5 Kcal/m±n
LO2/mln
Sample Calculation:
70 kg subject carrying 11.8 kg external load (i.e., PHE-HL) while
walking on the TM at 2.5 mph, 12% grade.
Conversions:
2.5 mph - 2.5 X 0.447 m/sec - 1.13 m/sec
thus, V _ 1.13 m/sec
M - 1.5(70) + 2.0(70+11.8)(11.8/70)2 + 1.0(70+11.8)[1.5(1.13)2 +
0.35(I.13)(12)]
105 + 2.0(81.8)(0.169)2 + 1.0(81.8)[1.5(1.28) + 4.75]
- 105 + 4.67 + 545.2
- 654.87 = 654.9 Watts
654.9 Watts X 0.002864 LO2/mluWat_
= 1.875 LO2/mln
-36-
NASANa_na _au_S _Soace_taO_
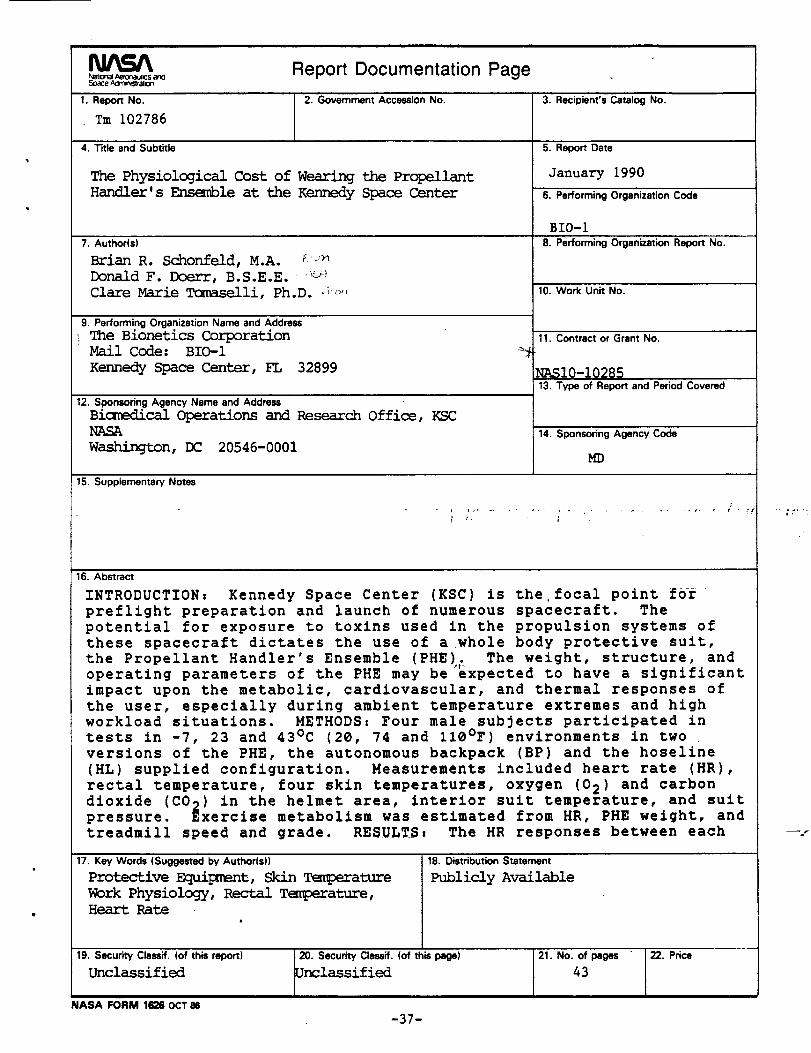
Report Documentation Page
I. Report No.
_ Tm 102786
2. Govemment Accession No.
4. Title and Subtitle
The Physiological Cost of Wearing the Propellant
Handler's Ensemble at the Kennedy Space Center
7. Author(s)
Brian R. Schonfeld, M.A. _
Donald F. Doerr, B. S.E.E. _ _'_
Clare Marie Tc_li, Ph.D. :;......
9. Performing Organization Name and Address
, The Bionetics Corporation
Mail Code: BIO-I
Kennedy Space Center, FL 32899
12. Sponsoring Agency Name and Address
Bic_cal Operations and Research Office, KSC
NASA
Washington, DC 20546-0001
15. Supplementary Notes
3. Recipient's Catalog No.
,5'. Report Data
January 1990
6. Performing Organization Code
BIO-I
8. Performing Organization Report No.
10. Work Unit No.
11. Contract or Grant No.
I¢z_$10-1028513. Type of Report and Period Covered
14. Sponsoring Agency Code
HD
16. A_ract
INTRODUCTION= Kennedy Space Center (KSC) is the focal point fb_-
preflight preparation and launch of numerous spacecraft. The
potential for exposure to toxins used in the propulsion systems of
these spacecraft dictates the use of a whole body protective suit,
the Propellant Handler's Ensemble (PHE); The weight, structure, andoperating parameters of the PHE may be'expected to have a significant
impact upon the metabolic, cardiovascular, and thermal responses of
the user, especially during ambient temperature extremes and high
workload situations. METHODS: Four male subjects participated in
tests in -7, 23 and 43°C (20, 74 and llO°F) environments in two
versions of the PME, the autonomous backpack (BP) and the hoseline
(HL) supplied configuration. Measurements included heart rate (HR),
rectal temperature, four skin temperatures, oxygen (0 2 ) and carbon
dioxide (CO 2) in the helmet area, interior suit temperature, and suit
pressure. Exercise metabolism was estimated from MR, PHE weight, and
treadmill speed and grade. RESULTS. The MR responses between each
17. Key Words (Suggested by Author(a))
Protective Equipment, Skin Tenperature
Work Physiology, Rectal Temperature,
Heart RateI
18. Distribution Statement
Publicly Available
19, S_ur_ Classff. (of th_ report)
Unclassified
NASA FORM 1628 OCT 86
20. Security Classff. (of this page)
Unclassified
-37-
21. No. of pages
43
22. Price
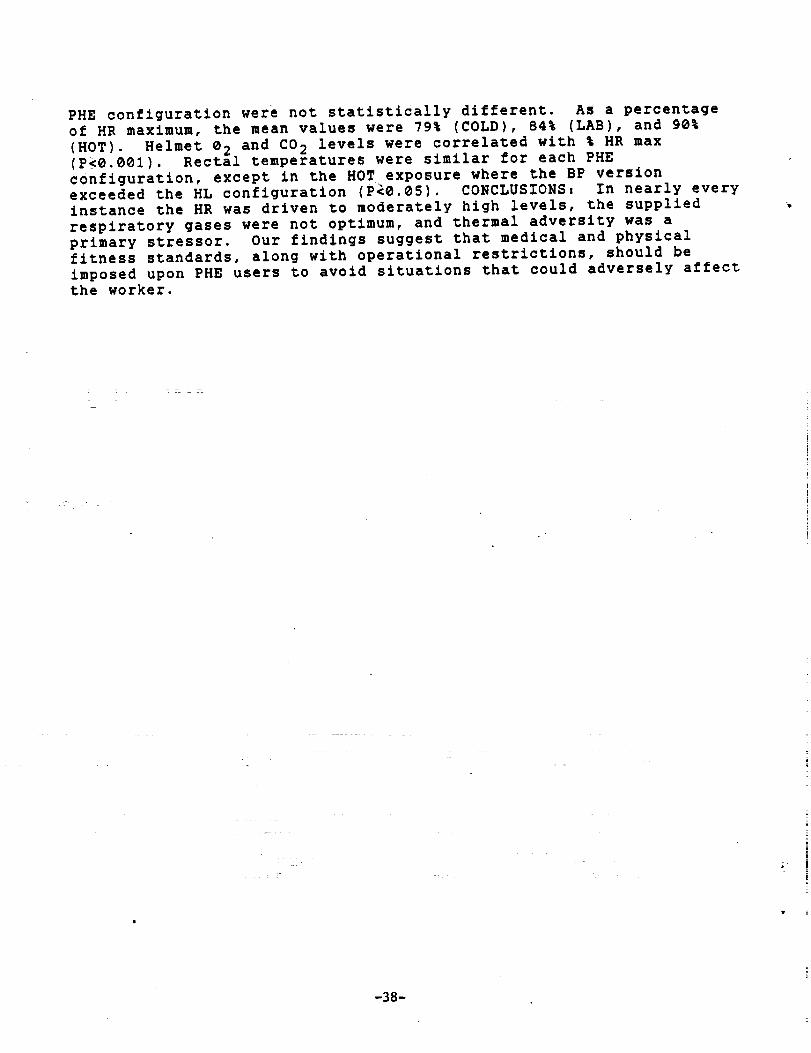
PHE configuration were not statistically different. As a percentage
of HR maximum, the mean values were 79% (COLD), 84% (LAB), and 90%
(HOT). Helmet • 2 and CO 2 levels were correlated with _ HR max(P_O.OO1). Rectal temperatures were similar for each PHE
configuration, except in the HOT exposure where the BP version
exceeded the HL configuration (P_O.05). CONCLUSIONS. In nearly everyinstance the HR was driven to moderately high levels, the supplied
respiratory gases were not optimum, and thermal adversity was a
primary stressor. Our findings suggest that medical and physical
fitness standards, along with operational restrictions, should be
imposed upon PHE users to avoid situations that could adversely affectthe worker.
-38-