Embed Size (px)
Citation preview

The physiological basis of pulmonary gasexchange: implications for clinicalinterpretation of arterial blood gases
Peter D. Wagner
Number 8 in the series “Physiology in respiratory medicine”Edited by R. Naeije, D. Chemla, A. Vonk-Noordegraaf and A.T. Dinh-Xuan
Affiliation: Dept of Medicine, University of California, San Diego, La Jolla, CA, USA.
Correspondence: Peter D. Wagner, Dept of Medicine, University of California, San Diego, 9500 Gilman Drive,La Jolla, CA 92093, USA. E-mail: [email protected]
ABSTRACT The field of pulmonary gas exchange is mature, with the basic principles developed morethan 60 years ago. Arterial blood gas measurements (tensions and concentrations of O2 and CO2)constitute a mainstay of clinical care to assess the degree of pulmonary gas exchange abnormality.However, the factors that dictate arterial blood gas values are often multifactorial and complex, with sixdifferent causes of hypoxaemia (inspiratory hypoxia, hypoventilation, ventilation/perfusion inequality,diffusion limitation, shunting and reduced mixed venous oxygenation) contributing variably to the arterialO2 and CO2 tension in any given patient. Blood gas values are then usually further affected by the body’sabilities to compensate for gas exchange disturbances by three tactics (greater O2 extraction, increasingventilation and increasing cardiac output). This article explains the basic principles of gas exchange inhealth, mechanisms of altered gas exchange in disease, how the body compensates for abnormal gasexchange, and based on these principles, the tools available to interpret blood gas data and, quantitatively,to best understand the physiological state of each patient. This understanding is important becausetherapeutic intervention to improve abnormal gas exchange in any given patient needs to be based on theparticular physiological mechanisms affecting gas exchange in that patient.
@ERSpublicationsUnderstanding the physiological basis of pulmonary gas exchange can help guide therapeuticapproaches to patients http://ow.ly/zNnK5
Copyright ©ERS 2015
Received: Feb 26 2014 | Accepted after revision: July 06 2014 | First published online: Oct 16 2014
Previous articles in this series: No. 1: Naeije R, Vachiery J-L, Yerly P, et al. The transpulmonary pressure gradient forthe diagnosis of pulmonary vascular diseases. Eur Respir J 2013; 41: 217–223. No. 2: Hughes JMB, van der Lee I. TheTL,NO/TL,CO ratio in pulmonary function test interpretation. Eur Respir J 2013; 41: 453–461. No. 3: Vonk-NoordegraafA, Westerhof N. Describing right ventricular function. Eur Respir J 2013; 41: 1419–1423. No. 4: Hamzaoui O, MonnetX, Teboul J-L. Pulsus paradoxus. Eur Respir J 2013; 42: 1696–1705. No. 5: Prisk GK. Microgravity and the respiratorysystem. Eur Respir J 2014; 43: 1459–1471. No. 6: Dempsey JA, Smith CA. Pathophysiology of human ventilatory control.Eur Respir J 2014; 44: 495–512. No. 7: Petersson J, Glenny RW. Gas exchange and ventilation–perfusion relationships inthe lung. Eur Respir J 2014; 44: 1023–1041.
Conflict of interest: None declared.
Eur Respir J 2015; 45: 227–243 | DOI: 10.1183/09031936.00039214 227
SERIESPHYSIOLOGY IN RESPIRATORY MEDICINE

IntroductionThe reason we have a lung is well known: to allow the exchange of gases between the air we breathe andthe pulmonary capillary blood. We are primarily concerned with two gases, O2 and CO2, but what followsapplies in concept to all gases (that are not chemically reactive with tissues). Moreover, it does not matterwhether the gas is being passed from air to blood (e.g. O2) or from blood to gas (e.g. CO2) because theprinciples governing gas exchange apply equally in both directions. By exchanging gases, the lungs formone critical part of the O2/CO2 transport pathway (fig. 1), the rest of which involves the entirecardiovascular system (heart, vasculature and blood) as well as the body tissues. The entire system, not justthe lungs, needs to be considered when interpreting arterial blood gases because each component mayaffect the others (see section on causes of hypoxaemia below).
The lungs are a collection of some 300 million very small gas-filled polyhedrons (alveoli), the walls of whichare made up of little more than a rich capillary network supported by a very thin interstitial matrix. Eachalveolus expands with fresh gas (high in O2 and low in CO2) that has flowed down the bronchial tree fromthe mouth during inspiration. The alveoli then reduce in volume during expiration, returning gas (lower inO2 and higher in CO2) up the bronchial tree to the mouth. This process is of course called ventilation. Thecapillaries in the alveolar wall are fed pulmonary arterial blood returned from the tissues. This blood is lowin O2 and high in CO2, but after the blood has flowed through the alveolus and reaches the pulmonary veins,O2 has been raised and CO2 lowered through the gas exchange process. Normally, all alveoli are bothventilated and perfused. While these statements may be self-evident to most, they become the centralconcept behind how gas exchange occurs and therefore how blood gas numbers can be used clinically.
The structure of the lung has evolved to meet the gas exchange needs on the basis of an overarching,major principle: The exchange of gases between the alveolar gas and the blood occurs by simple, passivediffusion (fig. 1). There is no active transport involved in alveolar gas exchange, and the process ofdiffusion requires no energy expenditure by the organism. Of course, both ventilation and perfusion areconvective processes that do require energy expenditure, and in many common cardiorespiratory diseases,either or both may be compromised.
This article will first explain quantitative aspects of gas exchange based on the above basic principles,starting with the simplest proposition: that of a uniform lung in which all 300 million alveoli are equallyperfused and equally ventilated. Real lungs, even in health, are however far from uniform in this regard[1, 2], and this heterogeneity has negative consequences for gas exchange that will next be discussed. Themultiple possible causes of abnormal gas exchange will then be summarised, and this will lead to a schemefor interpreting gas exchange findings in clinical settings.
Because the principles of gas exchange apply to all non-reactive gases, the focus will be mostly on just onegas, O2. Application to CO2 will also be indicated but without detailed parallel treatment.
Principles of pulmonary gas exchangeBased on the above, pulmonary gas exchange is considered as a continuous process involving:1) ventilation, 2) diffusion (including both physical diffusion across the pulmonary blood:gas barrier and
The O2 transport pathway
Structures:
Lungs
Heart, blood,
circulation
Tissues
Functions:
Ventilation
Diffusion
Perfusion
Capillaries
Capillaries
Diffusion
FIGURE 1 Schematic of the O2
transport pathway showing theprincipal structures and theirphysiological functions. The CO2
transport pathway from the tissues tothe lungs mirrors that for O2.
228 DOI: 10.1183/09031936.00039214
PHYSIOLOGY IN RESPIRATORY MEDICINE | P.D. WAGNER

subsequent chemical reactions (between O2 and haemoglobin (Hb) and for CO2 conversion to bicarbonate),and 3) perfusion. The fundamental principle that brings these three separate physical processes togetherquantitatively is conservation of mass. All that this means is that within the lungs, every O2 molecule that isinhaled but not exhaled diffuses from alveolar gas to blood and can be found in that blood.
In quantitative terms, the product of minute ventilation (V′E, L·min−1) and the difference betweeninspired and mixed expired O2 concentrations (FIO2 and FEO2 respectively) quantifies the amount of O2
(V′O2) that leaves the alveolar gas and enters the pulmonary capillary blood per minute. The O2 enteringthe pulmonary capillaries is quantified by the product of pulmonary blood flow (Q′, L·min−1) and thedifference between pulmonary venous (CpvO2) and pulmonary arterial (Cv̄O2) O2 concentrations. In thissection, it is assumed, as stated above, that the lungs are homogeneous, such that the concentration of O2
in the blood leaving every alveolus is the same, and, passing unchanged into the systemic arterial blood, isthus equal to the systemic arterial O2 concentration (CaO2). This can now all be expressed by the followingsimple mass conservation equations:
V 0O2 ¼ V 0E � ðFIO2 � FEO2Þ ¼ V 0A � ðFIO2 � FAO2Þ ð1Þ
and
V 0O2 ¼ Q 0 � ðCaO2 � C�vO2Þ ð2Þ
In the right hand part of equation 1, it is recognised that the conducting airways do not themselves takepart in air/blood gas exchange. This allows minute ventilation and mixed expired O2 concentration to bereplaced by alveolar ventilation (V′A) and alveolar O2 concentration (FAO2), respectively.
Because the process of diffusional transport described above usually comes to rapid completion well withinthe red cell transit time (at rest at sea level) [3], the PO2 in the alveolar gas (PAO2) and the capillary bloodleaving the alveolus can be considered to be the same. This means that CpvO2 (and thus CaO2 in equation2) is that O2 concentration that can simply be read off the HbO2 dissociation curve at the value of PAO2
(noting that PAO2 = FAO2 × k, where k is a constant equal to (barometric pressure minus saturated watervapour pressure)/100).
More than 60 years ago, RAHN and FENN [4] and RILEY, COURNAND and co-workers [5–7] separately putthese equations together noting that both expressed the same variable, V′O2:
V 0A � ðFIO2 � FAO2Þ ¼ Q0 � ðCaO2 � C�vO2Þ ð3Þ
Rearranging the terms gives:
V 0A=Q0 ¼ 8:63� ðCaO2 � C�vO2Þ=ðPIO2 � PAO2Þ ð4Þ
Here the constant term harmonises the equation when the units used are L·min−1 for both V′A (BTPS)and Q′; mL·dL−1 (STPD) for both CaO2 and Cv̄O2; and mmHg for both PIO2 and PAO2.
In the preceding, some simplifying assumptions have been made. We do assume ventilation and perfusionare continuous processes, implying blood and gas O2 concentrations are constant in time, thus ignoringthe normal, minor fluctuations in alveolar PO2 between inspiration and expiration [8]; we have, for now,assumed the lung is homogenous, with all alveoli having the same V′A/Q′ ratio; we have assumed thatinspired and expired gas volumes are identical, which is true to within 1%; and we have assumed that theblood leaving the alveoli and entering the pulmonary veins reaches the systemic arteries (where it can besampled clinically) without change in O2 concentration—hence the “a” in CaO2 to denote arterial blood.Finally, diffusion equilibration has been assumed as mentioned above, allowing CaO2 to be directlycalculated from the HbO2 dissociation curve, if PAO2 is known. While all theoretically important, theseassumptions are a good way to start understanding gas exchange; if they had to be removed,understanding gas exchange would become an intractable exercise in a short article such as this. Researchhas shown that in health the numerical effect of their combined considerations is mostly trivial, justifyingsetting them aside. In disease, heterogeneity of V′A and Q′ may be severe and then the assumption ofhomogeneity is invalid, as discussed below.
Equation 4 is telling us this: if we know 1) the V′A/Q′ ratio in the lung (total alveolar ventilation to totalpulmonary blood flow); 2) the composition of inspired gas and pulmonary arterial blood (PIO2 and Cv̄O2
in the equation); and 3) the shape and position of the HbO2 dissociation curve (so we can calculate CaO2
DOI: 10.1183/09031936.00039214 229
PHYSIOLOGY IN RESPIRATORY MEDICINE | P.D. WAGNER

from PAO2), then there is but one unknown remaining variable in the equation: PAO2. In other words, PAO2
is uniquely determined by the V′A/Q′ ratio, given the composition of inspired gas and venous blood andthe HbO2 dissociation curve particulars. The relationship between PAO2 and V′A/Q′ derived by solvingequation 4 for homogeneous lungs over a wide range of hypothetical V′A/Q′ ratios is shown in figure 2.
The next step in analysis is that within a given lung, equation 4 can be applied to regions with differentV′A/Q′ ratio, and the results shown in figure 2 still apply, but now to each region, according to thatregion’s V′A/Q′ ratio. Also shown in figure 2 are the corresponding results for CO2. Following through theexact same logic presented for O2, the equation for CO2 is:
V 0A=Q0 ¼ 8:63� ðC�vCO2 � CaCO2Þ=ðPACO2 � PICO2Þ ð5Þ
The terms on the right side for CO2 are reversed (compared to O2) only because CO2 is being eliminatedfrom the blood while O2 is being taken up. This keeps both numerator and denominator for equation 5positive. The curves in figure 2 are different in shape and slope largely because of the different shapes andslopes of the respective dissociation curves of the two gases, and because O2 is taken up while CO2 iseliminated.
Figure 2 is very revealing: When V′A/Q′ is normal (i.e. about 1), PAO2 is 100 mmHg and PACO2 40 mmHg.If a region of lung becomes poorly ventilated, usually due to airway obstruction, but maintains normalperfusion, V′A/Q′ ratio of that region must be reduced, and PAO2 and blood O2 concentration will fall (andPACO2 rise, but by only a small amount). Conversely, as V′A/Q′ rises in a lung region, often due to vascularobstruction, PAO2 rises while PACO2 falls. Because of the differences in the respective dissociation curves,O2 concentration rises only little, but PACO2 and CO2 concentration fall considerably. This is a profoundconclusion: when low V′A/Q′ ratio regions exist, O2 is seriously affected, more so than CO2, but when highV′A/Q′ ratio areas develop, CO2 is the more affected gas.
The alveolar gas equationThe equation for CO2 corresponding to that for equation 1 for O2 is now presented:
V 0CO2 ¼ V 0A � ðFACO2 � FICO2Þ ð6Þ
If equation 6 is simply divided by equation 1, and ignoring FICO2 as negligible, we get:
V 0CO2=V0O2 ¼ R ¼ FACO2=ðFIO2 � FAO2Þ ¼ PACO2=ðPIO2 � PAO2Þ ð7Þ
Here R is by definition the respiratory exchange ratio, and the change from fractional concentration (F)to partial pressure (P) follows Dalton’s law of partial pressures. If we now rearrange equation 7 we have:
PAO2 ¼ PIO2 � PACO2=R ð8Þ
140
120
100
80
60
40
20
0
Alv
eo
lar PO
2 a
nd
PC
O2 m
mH
g
Ventilation/perfusion ratio
0.001 0.01 0.1 1 10 100 1000
Normal
PO2
PCO2
FIGURE 2 Alveolar oxygen and carbondioxide partial pressures (PO2 andPCO2) in homogeneous regions havingthe alveolar ventilation/perfusion ratioindicated on the abscissa. The curvesrepresent the solutions to equations 4(O2) and 5 (CO2).
230 DOI: 10.1183/09031936.00039214
PHYSIOLOGY IN RESPIRATORY MEDICINE | P.D. WAGNER

This is the simple form of the well-known alveolar gas equation that relates alveolar PO2 to alveolar PCO2.If one wishes to be accurate and eliminate the assumption that the inspired and expired ventilation valuesare identical, it can be shown that equation 8 is modified [4]:
PAO2 ¼ PIO2 � PACO2=R þ PACO2 � FIO2 � ð1� RÞ=R ð9Þ
We will return to the application and use of this equation in the last section of this article.
Arterial PCO2 is of course also used, in conjunction with arterial pH, for analysis of blood acid:basebalance. That is itself a large and very important topic and will not be addressed in this article, beingbeyond its scope.
Ventilation/perfusion inequalityEven the normal lung is not homogeneous with respect to ventilation and perfusion of all 300 millionalveoli [1, 2]. The amount of inequality can be described by the dispersion of the frequency distribution ofV′A/Q′ ratios (called LOG SDQ), a number akin to the standard deviation of a normal distribution [9].What does heterogeneity do to gas exchange? Inequality in the distribution of V′A, Q′ and V′A/Q′ impairsgas exchange [9]. Figure 3a shows how increasing inequality (i.e. dispersion) will affect arterial PO2, arterialPCO2, O2 uptake (V′O2), CO2 elimination (V′CO2) and the alveolar-arterial PO2 difference (PA−aO2, seebelow). Arterial PO2 will fall; arterial PCO2 and PA−aO2 will rise (solid lines); V′O2 and V′CO2 will fall(dashed lines), all compared to the perfect lung with no inequality. The calculations shown in the toppanel reflect gas exchange before there has been any change in the O2 and CO2 levels of the venous bloodreturning to the lungs. However, as arterial PO2 falls and PCO2 rises, the tissues will immediately continueto extract the O2 they need and produce the corresponding CO2. This in turn results in a rapid fall invenous PO2 and rise in venous PCO2, and this will then cause a further fall in arterial PO2 (and increase inarterial PCO2). These changes do however allow V′O2 and V′CO2 to be restored to normal, and are shown infigure 3b. The calculations are based on well-established computer algorithms that solve the precedingequations for many different values of V′A/Q′ ratio and sum up their effects according to how muchdispersion is introduced [9]. Figure 3 reveals that both O2 and CO2 are affected by V′A/Q′ inequality evenif the numerical changes are different for the two gases (differences attributable to the different shape andslope of their dissociation curves). The figure also demonstrates the broader principle of how masstransport can be normalised in the face of disease, but at a price. Here, mass transport of O2 and CO2 canbe restored, the price being more severe hypoxaemia and hypercapnia (comparing figure 3a and b). This ismuch like the elevation of blood urea in chronic renal failure, where daily urea excretion by the kidney canbe maintained, but the cost is a high blood urea level.
It does not matter whether the cause of the increased V′A/Q′ ratio dispersion is regional airwayobstruction or regional vascular obstruction: the changes from normal will always be in the same direction.However, if the primary lesion is airway obstruction, O2 will be affected more than will CO2, whilethe reverse holds when vascular obstruction is the primary pathology (as explained above in reference tofigure 2).
Compensatory processesIf V′A/Q′ inequality develops from disease, and pulmonary uptake of O2 (and elimination of CO2) arereduced as above, the tissues will not be able to sustain metabolic rate and if the problem is severe, deathwill ensue unless the body finds a way to compensate. It is critical to understand the existence andimportance of the three innate compensatory processes available to the organism to enable restoration ofO2 and CO2 transport between lungs and tissues under such circumstances.
The first process is for the tissues to simply extract more O2 from the blood they receive to restore O2 flux.Since V′A/Q′ inequality increases PCO2 in the arterial blood that reaches the tissues, PCO2 in the tissues willincrease as CO2 continues to be produced, and thus the venous PCO2 returning to the lungs will also behigher than normal, again returning CO2 elimination towards normal. These changes in O2 and CO2 areboth very rapid, passive, diffusive processes and will occur automatically, before the patient is seen by aclinician. Because blood returns from the tissues with its Hb normally still 75% saturated with O2, itcontains a lot of O2 that is not normally required, and which can be used to support metabolism. Thissimple strategy is often very effective. This may well be all that is required to restore V′O2 to normal evenas the V′A/Q′ problem remains. The price paid is a more severe drop in arterial PO2, as one would predictfrom equation 4 and as shown in figure 3.
The second available process is to increase ventilation (V′A). As ventilation is increased, V′A/Q′ ratiosthroughout the lungs will also be raised, raising PAO2 and hence also arterial PO2. At the same time,
DOI: 10.1183/09031936.00039214 231
PHYSIOLOGY IN RESPIRATORY MEDICINE | P.D. WAGNER

PACO2, and thus arterial PCO2, will be reduced. This compensatory process is also common, and in theabsence of airway obstruction, can be very effective. Hyperventilation is especially effective in returningarterial PCO2 to normal (or even subnormal) because of the almost linear shape of the CO2 dissociationcurve. In contrast, it is usually less effective in mitigating the fall in arterial PO2 due to the non-linearshape of the HbO2 dissociation curve. In patients with airways obstruction (e.g. chronic obstructivepulmonary disease (COPD) and asthma) the effect on work of breathing and thus shortness of breathcan be considerable, and distressing to the patient. Furthermore, persistent obstruction will notmaterially raise ventilation, or thus alveolar PO2, in the alveoli distal to the obstruction, and thiscombines with the non-linear shape of the O2 dissociation curve in limiting the gains in arterial PO2
from increased overall ventilation.
The third available process is to increase cardiac output. This mitigates the fall in arterial PO2 because itallows less O2 extraction in the issues (i.e. allows, via equation 2, a higher venous O2 concentration)thereby raising the PO2 in the venous blood returning to the lungs, and as a result, raising arterial PO2, viaequation 4. Even if overall and regional ratios of V′A/Q′ fall as a result of the increase in Q′, the net resultis beneficial to arterial PO2. In the absence of cardiac disease, this can be an effective compensatoryprocess, and is often observed in younger asthmatics who show sympathetic activation either from anxiety,sympathomimetic drugs, or both. This compensatory tactic will also work to reduce venous PCO2 towardsnormal which, in turn, helps normalise arterial PCO2.
100
a) Mixed venous PO2, PCO2 constant; V'O2, V'CO2 fall
80
60
40
20
0.0 0.5Normal
V'A/Q inequality, log SDQ
Mild Moderate Severe1.0 1.5 2.0
0.0 0.5
V'A/Q inequality, log SDQ
1.0 1.5 2.0
0
Art
eri
al PO
2, PC
O2 a
nd
alv
eo
lar-
art
eri
al PO
2 d
iffe
ren
ce
mm
Hg
100
b) Mixed venous PO2 falls, PCO2 rises; V'O2, V'CO2 maintained
80
60
40
20
0
Art
eri
al PO
2, PC
O2 a
nd
alv
eo
lar-
art
eri
al PO
2 d
iffe
ren
ce
mm
Hg
100
80
60
40
20
0
100
80
60
40
20
0
Arterial PCO2
Alveolar-arterial PO2
difference
Alveolar-arterial PO2
difference
Arterial PO2
Arterial PCO2
Arterial PO2
O2
CO2
V'O2, V'CO2 % normal
V'O2, V'CO2 % normal
FIGURE 3 Arterial oxygen partial pressure (PO2) falls and alveolar-arterial PO2 difference rises as the degree of alveolarventilation/perfusion (V′A/Q′) inequality (LOG SDQ, the second moment of the V′A/Q′ distribution (log scale))becomes more severe. Normal subjects have LOG SDQ values between 0.3 and 0.6. Patients with chronic obstructivepulmonary disease or asthma will usually have values around 1.0, while patients with acute lung injury in the intensivecare unit usually have values between 1.5 and 2.5. a) The effects of V′A/Q′ inequality prior to any fall in mixed venous(pulmonary arterial) PO2 or rise in mixed venous PCO2: O2 uptake and CO2 elimination are reduced. b) The samevariables are reflected when mixed venous PO2 falls and PCO2 rises, which normalises O2 uptake and CO2 elimination:there is, however, more severe hypoxaemia and hypercapnia as a consequence.
232 DOI: 10.1183/09031936.00039214
PHYSIOLOGY IN RESPIRATORY MEDICINE | P.D. WAGNER
Causes of arterial hypoxaemia and hypercapniaArmed with all of the above information, we can now lay out the possible causes of a reduction in arterialPO2 (i.e. arterial hypoxaemia) and increase in arterial PCO2 (i.e. arterial hypercapnia). The statements thatfollow assume that there have been no compensatory mechanisms brought into play in each case.
1) Reduced inspired PO2 (going to altitude, aircraft travel (where cabin altitudes are commonly equivalentto around 6000–8000 feet). This will not cause hypercapnia; indeed, ventilatory stimulation from hypoxiawill reduce arterial PCO2. However, should inspired PCO2 be increased for any reason, arterial hypercapniawill occur.
2) Overall hypoventilation. This will cause both arterial hypoxaemia and hypercapnia.
3) Ventilation/perfusion (V′A/Q′) inequality. This will cause both arterial hypoxaemia and hypercapnia.
4) Diffusion limitation across the alveolar blood:gas barrier. While a common cause of hypoxaemia inexercise and at altitude even in health, it is uncommon in disease, and to date, diffusion limitation has notbeen found to affect overall CO2 exchange.
5) Shunting (the flow of blood from right to left sides of the heart without ever seeing alveolar gas). Whileoften causing profound hypoxaemia, hypercapnia can also occur when shunting is massive.
6) Reduction in pulmonary arterial PO2 (seen when Q′ is low in relation to V′O2). This will causehypoxaemia in lungs with V′A/Q′ inequality. Correspondingly, an increase in pulmonary arterial PCO2 willcause arterial hypercapnia.
Cause 1: reduced inspired PO2
With the fall in barometric pressure with altitude, inspired PO2 (PIO2) falls even as the fractional O2
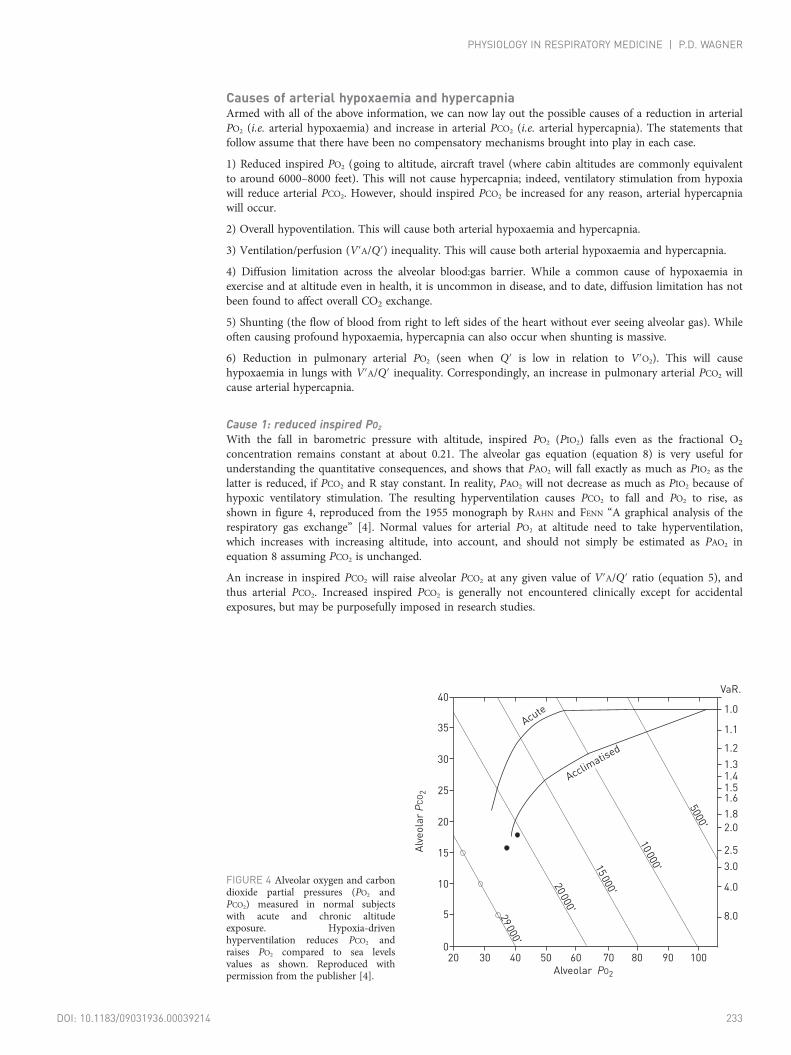
concentration remains constant at about 0.21. The alveolar gas equation (equation 8) is very useful forunderstanding the quantitative consequences, and shows that PAO2 will fall exactly as much as PIO2 as thelatter is reduced, if PCO2 and R stay constant. In reality, PAO2 will not decrease as much as PIO2 because ofhypoxic ventilatory stimulation. The resulting hyperventilation causes PCO2 to fall and PO2 to rise, asshown in figure 4, reproduced from the 1955 monograph by RAHN and FENN “A graphical analysis of therespiratory gas exchange” [4]. Normal values for arterial PO2 at altitude need to take hyperventilation,which increases with increasing altitude, into account, and should not simply be estimated as PAO2 inequation 8 assuming PCO2 is unchanged.
An increase in inspired PCO2 will raise alveolar PCO2 at any given value of V′A/Q′ ratio (equation 5), andthus arterial PCO2. Increased inspired PCO2 is generally not encountered clinically except for accidentalexposures, but may be purposefully imposed in research studies.
FIGURE 4 Alveolar oxygen and carbondioxide partial pressures (PO2 andPCO2) measured in normal subjectswith acute and chronic altitudeexposure. Hypoxia-drivenhyperventilation reduces PCO2 andraises PO2 compared to sea levelsvalues as shown. Reproduced withpermission from the publisher [4].
35
40
Acute
Acclimatis
ed
1.0
VaR.
1.1
1.2
1.31.41.51.6
1.8
2.0
2.5
3.0
4.0
8.0
30
25
15
20
10
5
0
Alv
eo
lar PC
O2
Alveolar PO2
3020 40 50 60 70 80 90 100
29 000'
20 000'
15 000'
10 000'
5000'
DOI: 10.1183/09031936.00039214 233
PHYSIOLOGY IN RESPIRATORY MEDICINE | P.D. WAGNER

Cause 2: overall hypoventilationOverall hypoventilation (reduced alveolar ventilation, V′A) in a patient with normal lungs can occur undermany conditions such as after narcotic drug overdose, in states of severe muscle weakness, or in traumaticinjury to any portion of the respiratory system. It commonly is accompanied by additional causes ofhypoxaemia (especially 3 and 5 below), but will be discussed here assuming it is the only abnormalitypresent. Equations 1 (for O2) and 6 (for CO2) show how maintaining metabolic rate in the face of a fall inV′A has major effects on alveolar PO2 (which falls) and PCO2 (which rises, such that absence ofhypercapnia excludes hypoventilation). Figure 5 shows these effects quantitatively. Normal resting alveolarventilation is about 5 L·min−1. The important point is that as V′A falls even modestly, the effects will bedramatic for both O2 and CO2. Because in this example the lungs are assumed to remain normal, thealveolar arterial difference calculated from the alveolar gas equation (equation 8) remains normal.
Cause 3: ventilation/perfusion inequalityV′A/Q′ inequality occurs normally, but this is of minimal clinical importance as a cause of arterialhypoxaemia: arterial PO2 (at sea level) is usually above 90 mmHg in normal subjects. However, incardiopulmonary diseases, V′A/Q′ inequality can be severe, and lead to very low arterial PO2 values (fig. 3).It may be severe enough to be fatal. Essentially all lung diseases cause significant V′A/Q′ inequality,although the physiological and structural mechanisms can be extremely variable from disease to disease.Inequality affects PO2 no matter whether the primary pathology resides in the blood vessels, theparenchymal tissues, or the airways.
It is very important to recognise that V′A/Q′ inequality impairs the exchange of all gases, not just that ofO2. Thus, in addition to hypoxaemia, arterial hypercapnia will always be an initial result of V′A/Q′inequality. That said, when arterial blood gases are measured in patients with V′A/Q′ inequality, arterialPCO2 may be normal or even below normal. This apparent contradiction is easily understood if the degreeof compensatory hyperventilation (see above) is taken into account. Because of differences in the shapesand slopes of their dissociation curves, O2 and CO2 tensions in blood will respond quite differently to boththe initial V′A/Q′ inequality and to subsequent ventilatory compensation. Arterial PO2 usually falls muchmore than does PCO2 rise when V′A/Q′ inequality develops. In addition, arterial PCO2 is often normalised byeven small compensatory increases in ventilation, but this is not the case for O2, where the increase in PO2
is usually more modest. As a result, V′A/Q′ inequality essentially always results in hypoxaemia, althougharterial PCO2 can be high, normal or low, depending on the amount of compensatory hyperventilation.
A final important point about V′A/Q′ inequality is that while it causes significant hypoxaemia breathingroom air, arterial PO2 increases to levels seen in normal subjects when 100% O2 is breathed. This isbecause, given enough time (it may take 10–30 min), 100% O2 breathing washes out all alveolar nitrogen,leaving only O2 and CO2 in the alveolar gas. This means that even in poorly ventilated regions, alveolarPO2 will rise to above 600 mmHg, just as in normally ventilated regions.
Cause 4: diffusion limitationAs stated, all gases exchange between alveolar gas and pulmonary capillary blood by passive diffusion.Factors that affect the diffusional conductance of a gas include the thickness of the blood:gas barrier, theoverall alveolar–capillary contact surface area, the solubility of the gas in the haemoglobin-free blood:gas
120
140
100
80
60
40
20
0
Alv
eo
lar PO
2 a
nd
PC
O2
mm
Hg
Alveolar ventilation L·min-1
0 5
Normal
10 15 20
PCO2
PO2
FIGURE 5 Alveolar partial pressure ofoxygen (PO2) (from solving equation 1)and PCO2 (from equation 6) as afunction of alveolar ventilation in anormal lung. Note how sensitive bothPO2 and PCO2 are to small decreases inventilation.
234 DOI: 10.1183/09031936.00039214
PHYSIOLOGY IN RESPIRATORY MEDICINE | P.D. WAGNER

barrier, and the molecular weight of the gas. Additional factors that affect the completeness with whichdiffusion equilibration occurs in the alveolar microcirculation include the rate of reaction between the gasand haemoglobin (for gases such as O2, CO and CO2), the capacity of haemoglobin to carry the gas, andthe time a red cell spends in the pulmonary microcirculation exchanging gas. This transit time in turnreflects the ratio of microcirculatory blood volume to blood flow.
This multitude of contributing factors can be brought into a single unifying concept, as shown by PIIPERand SCHEID [10] several years ago. The degree of diffusion equilibration (that is, how close to alveolarpartial pressure the blood partial pressure comes by the end of the capillary transit) depends on the ratioof diffusing capacity (DL) to the product of blood flow (Q′) and β; that is, to DL/(βQ′). Here, β is theoverall “solubility” of the gas in blood. For O2 it is approximated by the ratio of arterial−mixed venous O2
concentration difference to arterial−mixed venous PO2 difference, which indicates the average slope of theO2 dissociation curve. This compound number intrinsically incorporates transit time and capillary volume,as can be seen when one writes down and solves the diffusion equation [10].
In health, at rest at sea level, the red cell requires only about 0.25 s for equilibration—that is, for red cellPO2 to rise from pulmonary arterial to alveolar values [3]. The available transit time is about 0.75 s,implying a three-fold reserve in time available. Failure of equilibration is, therefore, not seen in healthysubjects at rest, and this remains so at rest even at altitude. However, during exercise at sea level, failure ofequilibration is frequently (but not universally) observed, especially in athletes who have high rates ofblood flow and thus lower red cell transit times. At altitude, exercise results in failure of equilibration inessentially everyone [11]. This is due to the reduced PO2 diffusion gradient stemming from inspiratoryhypoxia, especially combined with reduced transit time [12].
In lung diseases, failure of diffusional equilibration is rarely seen. It appears to be consistentlymeasureable only in patients with interstitial lung diseases [13] and is seen most often when theyexercise. It is seen at rest only in severe cases of interstitial lung disease when lung function is at 50% ofnormal or less. It may be a factor contributing to the hypoxaemia in rarer conditions associated withpulmonary arterio-venous malformations and/or vascular dilatation, the most common of which may becirrhosis of the liver. Here the possibility is that the long intravascular distances O2 must travel to reachall flowing red cells prevent complete diffusion equilibration within the red cell transit time. The readeris referred to the review by RODRIGUEZ-ROISIN and KROWKA [14] for a more detailed discussion of thistopic. It has not been found to happen in COPD [15], asthma [16], pulmonary thromboembolic disease[17] or in the critically ill.
Diffusion limitation of CO2 has not so far been documented. The diffusing capacity of CO2 across theblood:gas barrier (quantity of CO2 transported per minute per mmHg partial pressure difference acrossthat barrier) is much greater than for O2. This is because of the approximately 20-fold greater physicalsolubility of CO2 in the blood gas barrier. However, the capacity of the blood to hold CO2 (as bicarbonate,dissolved CO2 and carbamino-Hb), per mmHg PCO2, is approximately 10-fold greater than that of bloodto hold O2 (per mmHg PO2). This acts to partly counterbalance the higher barrier solubility justmentioned such that the time to equilibration for CO2 is not 20 times less than for O2 but more like onlytwo-fold less. Even considering that the chemical reaction steps whereby CO2 is converted to bicarbonateinside the red cell, followed by exchange of bicarbonate for chloride, are relatively slow (half-timecalculated to be about 0.1 s), CO2 appears to equilibrate faster than does O2.
Cause 5: shuntingShunting is defined as blood passing from right to left sides of the heart without ever seeing alveolar gas.This can be through cardiac shunts (atrial, ventricular), in congenital heart diseases, and in lung diseasesassociated with atelectasis or alveolar filling with fluid or cell debris. It may also occur in lung diseasesassociated with large arterio-venous connections, such as cirrhosis and hereditary haemorrhagictelangiectasia [14]. Research has shown that most patients with chronic lung diseases such as COPD andasthma have little if any shunting [15, 16], but that patients with acute lung diseases (pneumonias, acutelung injury, respiratory distress syndromes) typically do have shunts, that can sometimes be severe [18, 19].
Arterial PO2 is usually not very responsive to increases in FIO2 in such patients (in contrast to what is seenwith V′A/Q′ inequality, see above). Thus, shunting is best quantified while the patient breathes 100% O2 inorder to eliminate contributions from, and confusion with, V′A/Q′ inequality that usually co-exists withshunting, and diffusion limitation, if present.
While the effects of shunting on arterial PO2 are dramatic and well-known, shunting can also affect arterialPCO2 (and, as mentioned in the introduction, the exchange of all gases). Arterial PCO2 will increase whenshunts develop (unless compensated by hyperventilation as commonly occurs). This is because shuntedblood, carrying CO2 at high pulmonary arterial levels, mixes with non-shunted blood to form systemic
DOI: 10.1183/09031936.00039214 235
PHYSIOLOGY IN RESPIRATORY MEDICINE | P.D. WAGNER
arterial blood. Small to moderate shunts of 20% or less raise arterial PCO2 by only a mmHg or two, but therelationship between shunt fraction and arterial PCO2 is quite nonlinear, and when shunt is very high, 40–50% of the cardiac output, arterial PCO2 can rise by more than 10 mmHg (again, in the absence ofventilatory compensation).
Cause 6: reduction in pulmonary arterial PO2 (Pv̄O2)This factor was mentioned above in discussing cardiac output as a potential compensating factor reversingarterial hypoxaemia. At the outset it should be mentioned that there is an exception to the rule that a fall inPv̄O2 will cause a fall in arterial PO2: the perfectly homogeneous lung. In this case, PAO2 is governed by havingto fulfil the conditions of equation 1 above, making it dependent only on V′O2, V′A and FIO2 (and thus noton Pv̄O2). Because the lung is homogeneous, PaO2 must equal PAO2 and is thus also unaffected by changes inPv̄O2. Reduction in pulmonary arterial PO2 may however better be thought of as an extrapulmonary modifierof arterial PO2. It comes into play when Q′ is low in relation to V′O2 (equation 2), thereby reducing Pv̄O2. Itseffect is evident from equation 4. Thus, if Pv̄O2 falls, so too will PAO2, and thus arterial PO2 will also fall.Figure 3, described earlier, exemplifies this effect (compare PaO2 between figure 3a and b), and further showsthe effects are greater the more V′A/Q′ inequality there is. It is especially important to understand this causein the critically ill patient receiving inspired gas high in O2. Arterial PO2 in such a patient may changeconsiderably without change in lung function (causes 2–5 above) or in PIO2 (cause 1 above) if cardiac outputchanges in relation to metabolic rate. This is shown in figure 6. Distinguishing the causes of change inarterial PO2 is of obvious therapeutic importance in such circumstances.
In a corresponding manner, if Q′ is low in relation to V′CO2, pulmonary arterial PCO2 must rise, and in theface of unchanged ventilation, must cause alveolar and thus arterial PCO2 to increase.
Importantly, many of the above causes may coexist in a given patient, which can result in complex bloodgas presentations that can be difficult to unravel in the clinical setting, especially when limitedmeasurements are made.
Assessment and interpretation of arterial blood gasesAn orderly, systematic, multi-level approach is recommended, based on the preceding physiologicaldiscussion, perhaps as laid out below. Just how detailed one needs to get (how many levels to pursue) willdepend on the clinical questions at hand; one should ask for what purpose was the blood gas sampleobtained? What was the clinical question that needs to be answered? The suggested system is aphysiologically based construct, and is not designed to provide pathogenetic diagnosis of any particulardisease state. In other words, it is limited to providing quantitative assessment of the severity of gasexchange disturbances, and the physiological factors underlying them. The levels proceed from the simplestto more complex, and, past level 1, require either additional measurements or making assumptions that mayor may not be valid in any given situation. As stated previously, the acid/base component of arterial bloodgas analysis (involving pH–PCO2 relationships) is beyond the scope of this article and is not addressed.
The minimal requirement is an arterial blood gas sample in which the PO2, PCO2, pH, haemoglobin leveland O2 saturation have been measured, although additional measurements will be necessary for some ofthe derived indices described below (indicated in the appropriate sections).
Level 1: simply look at the absolute values of arterial PO2, PCO2, and pH compared to normal (allowing forthe altitude at which measurements are made and age of the patient, which affect the normal range).Allowance for altitude can be performed by use of the alveolar gas equation (equation 8), first by insertingthe correct inspired PO2 (PIO2) value for the particular altitude, and then inserting the actual arterial PCO2
of the patient). In the critically ill breathing gas higher than 21% in O2, analysis may include dividingarterial PO2 by inspired O2 concentration (to yield the PaO2/FIO2 ratio). This is an attempt to correct forFIO2 and is discussed below. Body temperature correction of all numbers should be performed beforeinterpretation. Blood gas electrodes are almost always maintained and calibrated at 37°C, and if a patient isfebrile, in vivo PO2 and PCO2 will be higher than the reported values measured at 37°C, and vice versa ifthe patient is hypothermic. Most analysers have inbuilt algorithms that correct for temperatureautomatically if the patient’s temperature is entered, and it is these corrected values that should be used forinterpretation, and especially in the alveolar gas equation for calculation of the PA−aO2 difference.
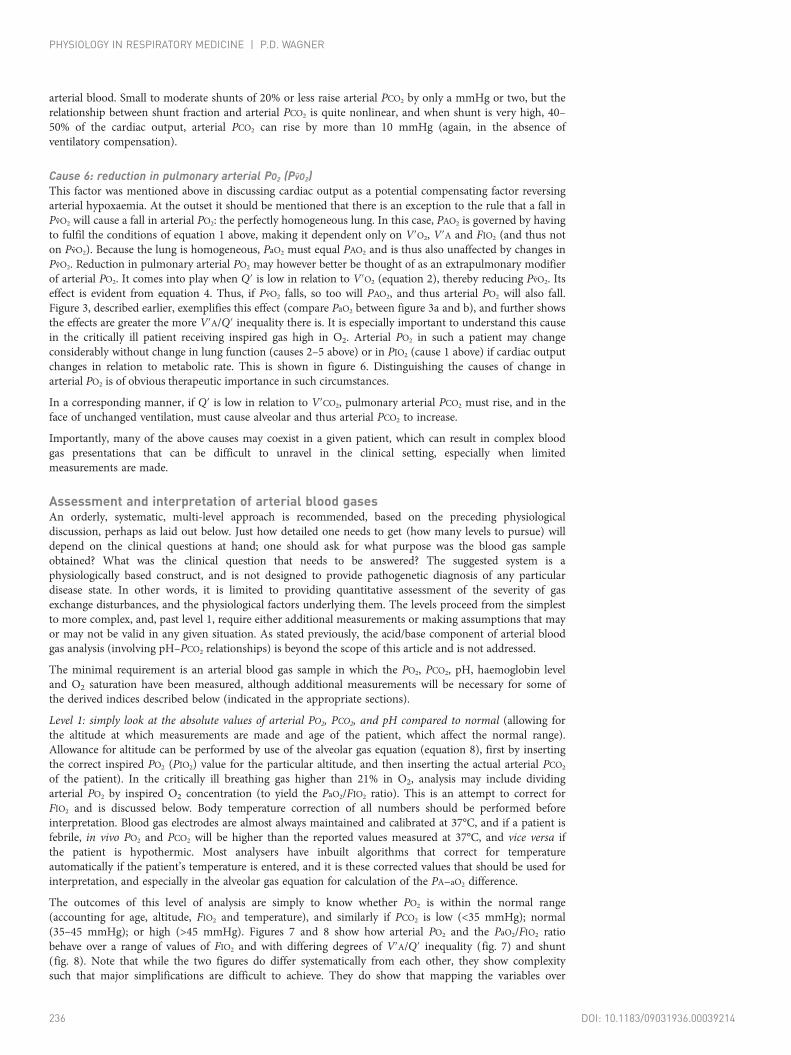
The outcomes of this level of analysis are simply to know whether PO2 is within the normal range(accounting for age, altitude, FIO2 and temperature), and similarly if PCO2 is low (<35 mmHg); normal(35–45 mmHg); or high (>45 mmHg). Figures 7 and 8 show how arterial PO2 and the PaO2/FIO2 ratiobehave over a range of values of FIO2 and with differing degrees of V′A/Q′ inequality (fig. 7) and shunt(fig. 8). Note that while the two figures do differ systematically from each other, they show complexitysuch that major simplifications are difficult to achieve. They do show that mapping the variables over
236 DOI: 10.1183/09031936.00039214
PHYSIOLOGY IN RESPIRATORY MEDICINE | P.D. WAGNER

a range of FIO2 may be helpful in gaining a better understanding of the pathophysiology in individualpatients, but this requires labour-intensive repeated arterial blood gas measurements at each FIO2
selected [20].
Level 2: calculate PA−aO2 from the alveolar gas equation (i.e. equation 8), using the measured arterial PCO2
(PaCO2) in place of alveolar PCO2 (PACO2), and the respiratory exchange ratio (R). If R is not measured, a
reasonable value of 0.80–0.85 can be assumed, but differences between assumed and actual R values caninduce substantial errors in the PA−aO2 as the equation implies. For example, at normal arterial PCO2 (40mmHg) and R = 0.8, PAO2 would be 99 mmHg (room air, sea level). However, if R were 0.7, PAO2 wouldbe 92 mmHg, and if R=1, PAO2 would be 109 mmHg.
Equation 8 yields the alveolar PO2 value, and all that needs to be done is to subtract the measured arterialPO2 to give PA−aO2. In clinical circumstances, the exact form of the alveolar gas equation 9 is not necessarybecause the additional term in equation 9 is small, as substitution of normal values of PaCO2 and R in toequations 8 and 9 will show.
Breathing room air, PA−aO2 is usually 5–10 mmHg in young healthy subjects, but it increases a little withage to up to 20 mmHg or so [21, 22]. Unfortunately, PA−aO2 is a noisy variable because it represents theusually small difference between two large numbers (alveolar and arterial PO2). Also, recall that it is basedon steady state assumptions, as mentioned earlier, and so in a patient whose condition is rapidly changing,PA−aO2 will not be reliable.
What PA−aO2 provides over and above PO2 and PCO2 from level 1 analysis is the power to discriminateamongst some of the causes of hypoxaemia. Thus, if PA−aO2 is normal yet there is hypoxaemia, one of the
400
500a)
300
200
100
0
Art
eri
al PO
2 m
mH
g
Cardiac output L·min-1
Shunt is constant at 20%inspired O2 is 100%
0 2 4 6 8 10
35
40b)
25
30
15
10
20
5
0
Ap
pa
ren
t sh
un
t %
(actu
al
sh
un
t is
20
%)
Cardiac output L·min-1
Assumes venous O2 is that when cardiac output is 6 L·min-1
0 2 4 6 8 10
FIGURE 6 Simulation of a patient with a constant shunt of 20% of the cardiac output who is breathing 100% O2. a)Arterial partial pressure of oxygen (PO2) is very sensitive to cardiac output because as the latter falls, so must pulmonaryarterial PO2 (perfusing the shunt pathway). This highlights the importance of accounting for differences in cardiacoutput from normal (here taken as 6 L·min−1). b) Apparent shunt computed in the same simulation from equation 11based on arterial PO2 values in panel a when cardiac output is not normal (but is assumed to be normal). The trueshunt may thus be over- or under-estimated considerably.
DOI: 10.1183/09031936.00039214 237
PHYSIOLOGY IN RESPIRATORY MEDICINE | P.D. WAGNER

first two causes (reduced PIO2, hypoventilation, respectively) must be the explanation for the reducedarterial PO2. Distinguishing between the first two causes should be self-evident from knowing FIO2 andexamining arterial PCO2, which is always elevated in cause 2, and usually reduced in cause 1.
Examples are shown in figure 9a (for V′A/Q′ inequality) and figure 10a (for shunt).
Level 3: calculate the physiological shunt (Qs/QT) and the physiological deadspace (VD/VT), both definedbelow.
Qs/QT is a simple calculation that yields the percentage of total blood flow through the lungs that wouldhave to be shunted (see shunt definition above) to explain the measured arterial PO2 on the assumptionthat the lungs can be simplified to a two-compartment system: one made up of alveoli that are allnormally ventilated and perfused, and one that is perfused but not ventilated at all. The calculation usesmass conservation as follows:
CaO2 � Q0T ¼ CiO2 � ðQ0
T � Q0SÞ þ C�vO2 � Q0S ð10Þ
Where Q′T is total pulmonary blood flow, Q′S is that portion of total flow passing through the vessels ofthe unventilated compartment (whose emerging blood O2 concentration remains that of the inflowingpulmonary arterial blood, Cv̄O2), CaO2 is measured arterial O2 concentration, and CiO2 is the O2
concentration calculated, using the HbO2 dissociation curve, from the “ideal” PO2 or, in essence, thealveolar PO2 determined from equation 8. Rearranging, we get:
QS=QTðas a %Þ ¼ 100� ðCiO2 � CaO2Þ=ðCiO2 � C�vO2Þ ð11Þ
600
700a)
500
400
300
200
100
0
PaO
2 m
mH
g
FIO2
0.0 0.2 0.4 0.6 0.8 1.0
SDQ 0.3 (normal)
SDQ 1.0 (mild)
SDQ 1.5 (moderate)
SDQ 2.0 (severe)
PaO2 and PaO2/FIO2 in lungs with V'A/Q' inequality
600
700b)
500
400
300
200
100
0
PaO
2/F
IO2 m
mH
g
FIO2
0.0 0.2 0.4 0.6 0.8 1.0
FIGURE 7 a) Arterial partial oxygen pressure (PaO2) and b) PaO2/inspired oxygen fraction (FIO2) ratio as a function ofFIO2 in lungs simulated to have only alveolar ventilation/perfusion (V′A/Q′) inequality and no shunt. Note that withmoderate to severe inequality, PaO2/FIO2 is far from constant as FIO2 changes.
238 DOI: 10.1183/09031936.00039214
PHYSIOLOGY IN RESPIRATORY MEDICINE | P.D. WAGNER

Another form of this equation is:
QS=QT ¼ 100� ðCiO2 � CaO2Þ=ððCiO2 � CaO2Þ þ ðCaO2 � CvO2ÞÞ
Which from equation (2) can be rewritten as:
QS=QT ¼ 100� ðCiO2 � CaO2Þ=ððCiO2 � CaO2Þ þ ð0:1� V 0O2=Q0TÞÞ ð12Þ
Where CiO2, CaO2 and CvO2 are all in mL·dL−1, V′O2 is in mL·min−1 and Q′T is in L·min−1. You will haveto compute CiO2 and CaO2 from measured arterial blood gas values and saturation as follows:
CiO2 = 1.39 × [Hb] × fractional O2 saturation (calculated for the value of PAO2) + 0.003 × PAO2
CaO2 = 1.39 × [Hb] × fractional O2 saturation (measured in arterial blood) + 0.003 × PaO2
Whether you choose to use equation 11 or equation 12 depends on whether you know Cv̄O2 oralternatively V′O2 and Q′T. If you know none of these variables, they will have to be assumed, which willresult in uncertainty in the derived value of QS/QT [23].
The outcome, QS/QT, quantifies what may be called the virtual shunt. It is also called the physiologicalshunt, or sometimes, the venous admixture. At ambient FIO2, most commonly that of sea level room air,QS/QT may contain contributions from causes 3–6 when present: ventilation/perfusion inequality,diffusion limitation, and shunting plus the modulating effects of changes in the V′O2/Q′T relationship ifpresent. It is not possible to separate these potential contributors just from looking at QS/QT itself, but the
600
700a)0% shunt
10% shunt
20% shunt
30% shunt500
400
300
200
100
0
PaO
2 m
mH
g
FIO2
0.0 0.2 0.4 0.6 0.8 1.0
600
700b)
500
400
300
200
100
0
PaO
2/F
IO2 m
mH
g
FIO2
0.0 0.2 0.4 0.6 0.8 1.0
PaO2 and PaO2/FIO2 in lungs with shunt
FIGURE 8 a) Arterial partial oxygen pressure (PaO2) and b) PaO2/inspired oxygen fraction (FIO2) ratio as a function ofFIO2 in lungs simulated to have only shunt and no alveolar ventilation/perfusion ratio inequality. PaO2/FIO2 steadilyincreases with FIO2 when shunt is absent or small, falls and then rises with FIO2 when shunt is moderate, and steadilyfalls when shunt is large.
DOI: 10.1183/09031936.00039214 239
PHYSIOLOGY IN RESPIRATORY MEDICINE | P.D. WAGNER

number obtained is a good overall index of the total gas exchange defect at the FIO2 experienced by thepatient. Its utility beyond that of PA−aO2 is to quantify the gas exchange problem in terms of O2
concentration rather than partial pressure. O2 concentration is a better indicator of the effect on masstransport than is partial pressure, due to the nonlinear nature of the HbO2 dissociation curve. QS/QT willnot normally exceed 5% of the cardiac output from all causes combined.
Examples are shown in figure 9b (for V′A/Q′ inequality) and figure 10b (for shunt).
VD/VT (physiological deadspace) is exactly analogous (and complementary) to QS/QT as follows. Itrepresents a hypothetical CO2-free fraction of the total minute ventilation (V′E, equation 1) that wouldhave to be added to alveolar gas having a PCO2 equal to that measured in arterial blood in order to reachthe measured PCO2 in mixed expired gas. Since the conducting airways (known as the deadspace) do notcontribute to gas exchange, that CO2-free fraction is thought of as deadspace. The equation is as follows,very similar to that for QS/QT as it is also based on a two-compartment construct:
V 0E � PECO2 ¼ ðV 0
E � V 0DÞ � PaCO2 þ V 0
D � zero ð13Þ
Where PECO2 is the PCO2 measured in mixed expired gas, PaCO2 is arterial PCO2, V′E (L·min−1) is minuteventilation, and V′D (L·min−1) is the ventilation associated with the virtual deadspace compartment (PCO2
of zero). Rearranging equation 13 and multiplying by 100 to give the result as a percentage yields:
V 0D=V 0
E ¼ 100� ðPaCO2 � PECO2Þ=PaCO2 ð14Þ
500
600a)
SDQ 1.0
SDQ 1.5
SDQ 2.0
400
300
200
100
0
PA
-aO
2 m
mH
g
FIO2
0.0 0.2 0.4 0.6 0.8 1.0
80b)
60
40
20
0
Qs/Q
T %
of
ca
rdia
c o
utp
ut
FIO2
0.0 0.2 0.4 0.6 0.8 1.0
PA-aO2 and physiological shunt (Qs/QT) in lungs
with V'A/Q' inequality lungs
FIGURE 9 a) Alveolar-arterial oxygen partial pressure difference (PA−aO2) and b) physiological shunt (Qs/QT) as afunction of inspired oxygen fraction (FIO2) in lungs simulated to have only alveolar ventilation/perfusion (V′A/Q′)inequality and no shunt. PA−aO2 peaks at intermediate FIO2 while physiological shunt steadily falls with increasing FIO2
in spite of constant amounts of inequality.
240 DOI: 10.1183/09031936.00039214
PHYSIOLOGY IN RESPIRATORY MEDICINE | P.D. WAGNER
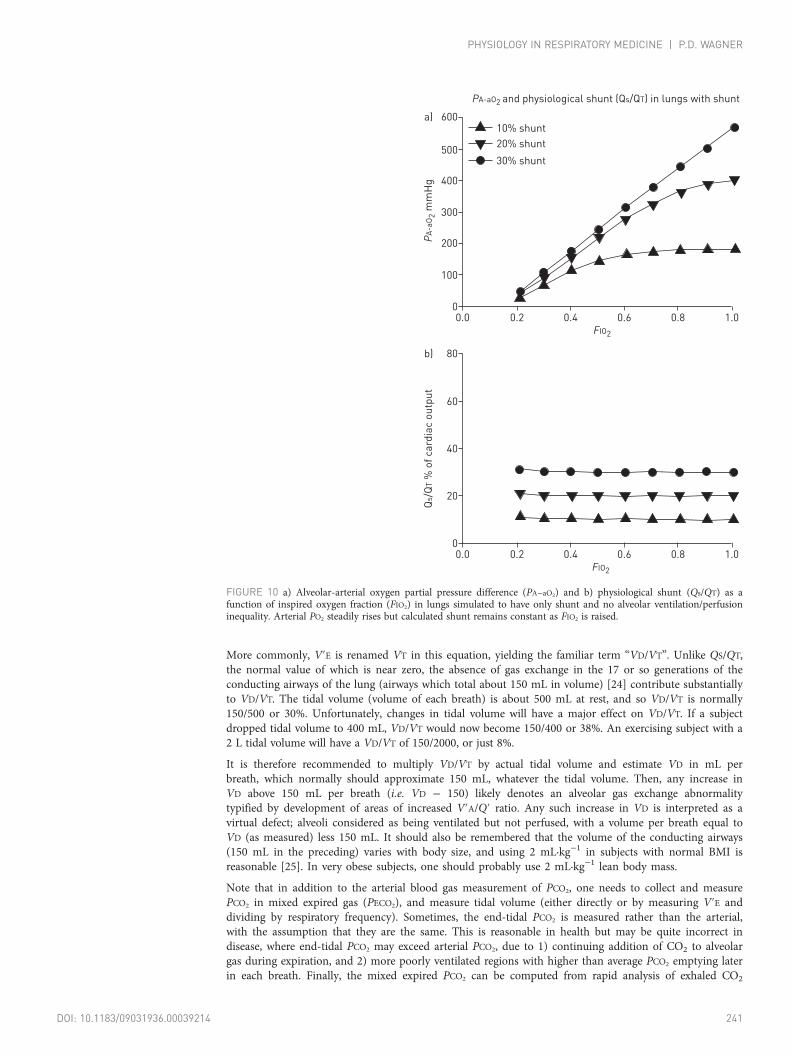
More commonly, V′E is renamed VT in this equation, yielding the familiar term “VD/VT”. Unlike QS/QT,the normal value of which is near zero, the absence of gas exchange in the 17 or so generations of theconducting airways of the lung (airways which total about 150 mL in volume) [24] contribute substantiallyto VD/VT. The tidal volume (volume of each breath) is about 500 mL at rest, and so VD/VT is normally150/500 or 30%. Unfortunately, changes in tidal volume will have a major effect on VD/VT. If a subjectdropped tidal volume to 400 mL, VD/VT would now become 150/400 or 38%. An exercising subject with a2 L tidal volume will have a VD/VT of 150/2000, or just 8%.
It is therefore recommended to multiply VD/VT by actual tidal volume and estimate VD in mL perbreath, which normally should approximate 150 mL, whatever the tidal volume. Then, any increase inVD above 150 mL per breath (i.e. VD − 150) likely denotes an alveolar gas exchange abnormalitytypified by development of areas of increased V′A/Q′ ratio. Any such increase in VD is interpreted as avirtual defect; alveoli considered as being ventilated but not perfused, with a volume per breath equal toVD (as measured) less 150 mL. It should also be remembered that the volume of the conducting airways(150 mL in the preceding) varies with body size, and using 2 mL·kg−1 in subjects with normal BMI isreasonable [25]. In very obese subjects, one should probably use 2 mL·kg−1 lean body mass.
Note that in addition to the arterial blood gas measurement of PCO2, one needs to collect and measurePCO2 in mixed expired gas (PECO2), and measure tidal volume (either directly or by measuring V′E anddividing by respiratory frequency). Sometimes, the end-tidal PCO2 is measured rather than the arterial,with the assumption that they are the same. This is reasonable in health but may be quite incorrect indisease, where end-tidal PCO2 may exceed arterial PCO2, due to 1) continuing addition of CO2 to alveolargas during expiration, and 2) more poorly ventilated regions with higher than average PCO2 emptying laterin each breath. Finally, the mixed expired PCO2 can be computed from rapid analysis of exhaled CO2
500
600a)10% shunt
20% shunt
30% shunt
400
300
200
100
0
PA
-aO
2 m
mH
g
FIO2
0.0 0.2 0.4 0.6 0.8 1.0
80b)
60
40
20
0
Qs/Q
T %
of
ca
rdia
c o
utp
ut
FIO2
0.0 0.2 0.4 0.6 0.8 1.0
PA-aO2 and physiological shunt (Qs/QT) in lungs with shunt
FIGURE 10 a) Alveolar-arterial oxygen partial pressure difference (PA−aO2) and b) physiological shunt (Qs/QT) as afunction of inspired oxygen fraction (FIO2) in lungs simulated to have only shunt and no alveolar ventilation/perfusioninequality. Arterial PO2 steadily rises but calculated shunt remains constant as FIO2 is raised.
DOI: 10.1183/09031936.00039214 241
PHYSIOLOGY IN RESPIRATORY MEDICINE | P.D. WAGNER

during a single breath (avoiding the task of manually collecting expired gas and measuring its PCO2), butfor this, one needs a rapid CO2 analyser connected to a computer and associated software.
Level 4: intervention with 100% O2 to determine the amount of shunting distinct from other factorscontributing to hypoxaemia. The same equations (11 or 12) are used as for QS/QT, and the concept is verysimilar. The only real difference is that in level 3, ambient FIO2 is used, while here one intervenes byhaving the patient breathe 100% O2. If the patient is breathing pure O2, real shunting is the only cause ofhypoxaemia contributing to QS/QT. The value is normally zero, since significant shunting does not occurin normal lungs [1, 26], but due to (random) errors, the calculation may reveal a value of perhaps 2–3%.Of interest, Thebesian venous drainage directly into the cavity of the left ventricle should add poorlysaturated venous blood to arterial and act as a shunt. Based on studies using the multiple inert gaselimination technique [1], such shunting has never been observed, implying that its contribution tolowering arterial PO2 is very small. Usually, the resulting value of QS/QT on 100% O2 is less than thatmeasured at lower FIO2, because contributions from V′A/Q′ inequality and diffusion limitation areeliminated as explained above.
To use this procedure with accuracy, the arterial blood sample should be processed realising that mosterrors cause the reported PO2 to be lower than it really was in the sample when collected. Small air bubblesin the sampling syringe, continuing metabolic use of O2 by white cells in the sample, air contaminationduring measurement and O2 consumption by the blood gas electrodes themselves during measurement allpull the PO2 down. Using bubble-free syringes, keeping the sample iced and making the measurement asquickly as possible, are all key to accurate measurement.
The extreme right hand points in figures 7–10 show how breathing 100% O2 affects indices of arterialoxygenation.
Level 5: assessment of extrapulmonary modifying factors: V′O2, cardiac output (Q′T), Hb concentration,temperature, Hb P50, pulmonary arterial PO2. These ancillary measurements are intended to help determinewhen cause 6 is an important contributor to the level of hypoxaemia. Quick guides are that if the ratio of V′O2 (mL·min−1) to Q′T (L·min−1) exceeds 50, the value of Pv̄O2 would be expected to be lower than normaland contribute to the hypoxaemia over and above the other five causes. An important exclusion to thiseffect of a low Pv̄O2 on arterial PO2 is when the lungs have no V′A/Q′ inequality or diffusion limitation at all.In this case, all alveoli have the same PO2 (alveolar and end-capillary) that is determined, as can be seen byexamining equation 1, only by metabolic rate (V′O2), alveolar ventilation (V′A) and inspired O2 fraction(FIO2). The effect becomes greater with increasing amounts of V′A/Q′ inequality. In health, the amount ofinequality is sufficiently small that a low Pv̄O2 hardly affects arterial PO2.
Figure 6 exemplifies the degree to which this may affect arterial PO2 and the shunt calculation. The effectsmay be considerable. Also, if Hb concentration is very low, Pv̄O2 will be lower than usual. Contributionsfrom alterations in P50 and temperature are generally clinically small and moreover difficult to estimate,although PO2 and PCO2 in blood increase about 6–7% per °C change in temperature [27].
TABLE 1 Separation of physiological causes of hypoxaemia
Cause of hypoxaemia Typical example Arterial PCO2 PA−aO2
differenceArterial PO2 on 100% O2 and
QS/QT
V′O2/Q′ ratio
Low inspired PO2 Altitude ↓ Normal Normal (for altitude) Normal or ↓Hypoventilation Narcotic overdose ↑ Normal Normal NormalV′A/Q′ inequality Most lung diseases ↑ or normal or ↓ ↑ Normal NormalDiffusion limitation Exercise at altitude;
interstitial fibrosisNormal ↑ Normal Normal
Shunts Acute lung injury ↑ or normal or ↓ ↑ PO2 below normal;QS/QT increased
↑ or normal or↓
Extrapulmonary: highV′O2/Q′ ratio (with lungdisease)
Heart failure withpulmonary oedemaor lung disease
↑ or normal or ↓ ↑ Normal (if no shunt) ↑
Cautionary notes Highly dependent onindividual ventilatory
responsiveness
Accuracyrequires R (V′CO2/V′O2) to be known
Potentially large errors ifPv̄O2 is unknown; risk ofmeasurement error in
arterial PO2
Requires V′O2
and Q′ to bemeasured
PCO2: carbon dioxide partial pressure; PO2: oxygen partial pressure; PA−aO2: alveolar−arterial PO2 difference; QS/QT: shunt; V′O2: oxygen uptake;Q′: perfusion; V′A: alveolar ventilation; V′CO2: carbon dioxide elimination; Pv̄O2: pulmonary arterial PO2.
242 DOI: 10.1183/09031936.00039214
PHYSIOLOGY IN RESPIRATORY MEDICINE | P.D. WAGNER

Table 1 brings all of these concepts together in summary form. It is wise to remember, however, thatsummary tables, such as this, depict usual or common situations, and that to every rule there can be anexception. In particular, the interaction between any of the listed causes of hypoxaemia and ventilatoryresponsiveness of the subject plays a large role in the blood gas picture seen in an individual, explainingwhy the arterial PCO2 can be elevated, reduced or normal in many settings.
SummaryWhile gas exchange in the lungs follows straightforward principles which are well understood,assessment of the severity and nature of gas exchange disturbances in patients can be complicated, andin particular, requires not just arterial blood gas data, but a defined set of ancillary variables in order toproperly separate the many causes and modifying factors that combine to ultimately set arterial PO2/PCO2. While this article provides some tools to enable such analysis, the practitioner has to decide ineach case whether the greater understanding afforded by these ancillary measurements is justified byclinical need.
References1 Wagner PD, Laravuso RB, Uhl RR, et al. Continuous distributions of ventilation-perfusion ratios in normal
subjects breathing air and 100% O2. J Clin Invest 1974; 54: 54–68.2 West JB. Ventilation/Bloodflow and Gas Exchange. Oxford, Blackwell, 1970.3 Wagner PD, West JB. Effects of diffusion impairment on O2 and CO2 time courses in pulmonary capillaries. J
Appl Physiol 1972; 33: 62–71.4 Rahn H, Fenn WO. A Graphical Analysis of the Respiratory Gas Exchange. Washington, American Physiological
Society, 1955.5 Riley RL, Cournand A. “Ideal” alveolar air and the analysis of ventilation/perfusion relationships in the lung. J
Appl Physiol 1949; 1: 825–847.6 Riley RL, Cournand A, Donald KW. Analysis of factors affecting partial pressures of oxygen and carbon dioxide in
gas and blood of lungs: methods. J Appl Physiol 1951; 4: 102–120.7 Riley RL, Cournand A. Analysis of factors affecting partial pressures of oxygen and carbon dioxide in gas and
blood of lungs: theory. J Appl Physiol 1951; 4: 77–101.8 Dubois AB. Alveolar CO2 and O2 during breath holding, expiration, and inspiration. J Appl Physiol 1952; 5: 1–12.9 West JB. Ventilation/perfusion inequality and overall gas exchange in computer models of the lung. Respir Physiol
1969; 7: 88–110.10 Piiper J, Scheid P. Model for capillary-alveolar equilibration with special reference to O2 uptake in hypoxia. Respir
Physiol 1981; 46: 193–208.11 Wagner PD, Gale GE, Moon RE, et al. Pulmonary gas exchange in humans exercising at sea level and simulated
altitude. J Appl Physiol 1986; 61: 260–270.12 West JB, Wagner PD. Predicted gas exchange on the summit of Mt. Everest. Respir Physiol 1980; 42: 1–16.13 Agustí AGN, Roca J, Gea J, et al. Mechanisms of gas exchange impairment in idiopathic pulmonary fibrosis. Am
Rev Respir Dis 1991; 143: 219–225.14 Rodriguez-Roisin R, Krowka MJ. Hepatopulmonary syndrome–A liver-induced lung vascular disorder. N Engl J
Med 2008; 358: 2378–2387.15 Wagner PD, Dantzker DR, Dueck R, et al. Ventilation-perfusion inequality in chronic obstructive pulmonary
disease. J Clin Invest 1977; 59: 203–216.16 Wagner PD, Dantzker DR, Iacovoni VE, et al. Ventilation-perfusion inequality in asymptomatic asthma. Am Rev
Respir Dis 1978; 118: 511–524.17 Kapitan KS, Buchbinder M, Wagner PD, et al. Mechanisms of hypoxemia in chronic thromboembolic pulmonary
hypertension. Am Rev Respir Dis 1989; 139: 1149–1154.18 West JB, Wagner PD. Pulmonary gas exchange. In: West JB, ed. Bioengineering Aspects of the Lung. New York,
Marcel Dekker, Inc., 1977; pp. 361–458.19 Lemaire F, Harf A, Teisseire BP. Oxygen exchange across the acutely injured lung. In: Zapol WM, Falke KJ, eds.
Acute Respiratory Failure. New York, Dekker, 1985; pp. 521–552.20 Villar J, Perez-Mendez L, Blanco J, et al. A universal definition of ARDS: the PaO2/FiO2 ratio under a standard
ventilatory setting–a prospective, multicenter validation study. Intensive Care Med 2013; 39: 583–592.21 Raine JM, Bishop JM. A-a difference in O2 tension and physiological dead space in normal man. J Appl Physiol
1963; 18: 284–288.22 Cardús J, Burgos F, Diaz O, et al. Increase in pulmonary ventilation/perfusion inequality with age in healthy
individuals. Am J Respir Crit Care Med 1997; 156: 648–653.23 Wagner PD. Recent Advances in Pulmonary Gas Exchange. International Anesthesiology Clinics. 15th edn.
Boston, Little Brown & Co., 1977; pp. 81–111.24 Weibel ER. Morphometry of The Human Lung. Berlin/New York, Springer-Verlag, 1963.25 Fowler WS. Lung function studies. II. The respiratory dead space. Am J Physiol 1948; 154: 405–416.26 Vogiatzis I, Athanasopoulos D, Boushel R, et al. Contribution of respiratory muscle blood flow to exercise-induced
diaphragmatic fatigue in trained cyclists. J Physiol 2008; 586: 5575–5587.27 Nunn JF, Bergman NA, Bunatyan A, et al. Temperature coefficients for PCO2 and PO2 of blood in vitro. J Appl
Physiol 1965; 20: 23–26.
DOI: 10.1183/09031936.00039214 243
PHYSIOLOGY IN RESPIRATORY MEDICINE | P.D. WAGNER