Embed Size (px)
Citation preview
The Physics of Climate Change
Prof Tom Choularton
Everybody talks about the weather – but nobody does anything about it.Mark Twain
The Physics of Climate Change
Prof Tom Choularton
Why Bother?THE ONLY WAY GOVERNMENTS CAN MAKE
INFORMED DECISIONS ON ENERGY USE, CO2 REDUCTION MITIGATION STRATEGIES IS TO HAVE CONTRETE ASSESSMENTS OF HUMAN
INDUCED CLIMATE CHANGE THAT ARE BASED ON
SOUND PHYSICAL SCIENCE
This talk will cover:
• What science do we need to know?
• What do we know about climate and how it changes?
• How do we know this?
• What remains uncertain?
• What work is going on to reduce these uncertainties?
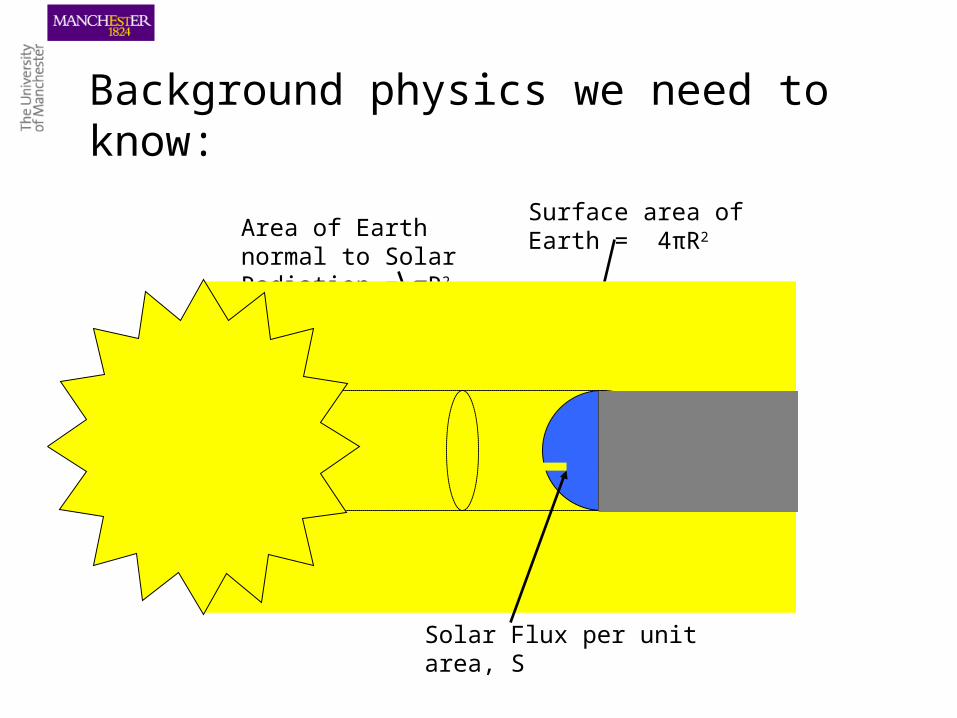
Background physics we need to know:
Area of Earth normal to Solar Radiation = πR2
Surface area of Earth = 4πR2
Solar Flux per unit area, S
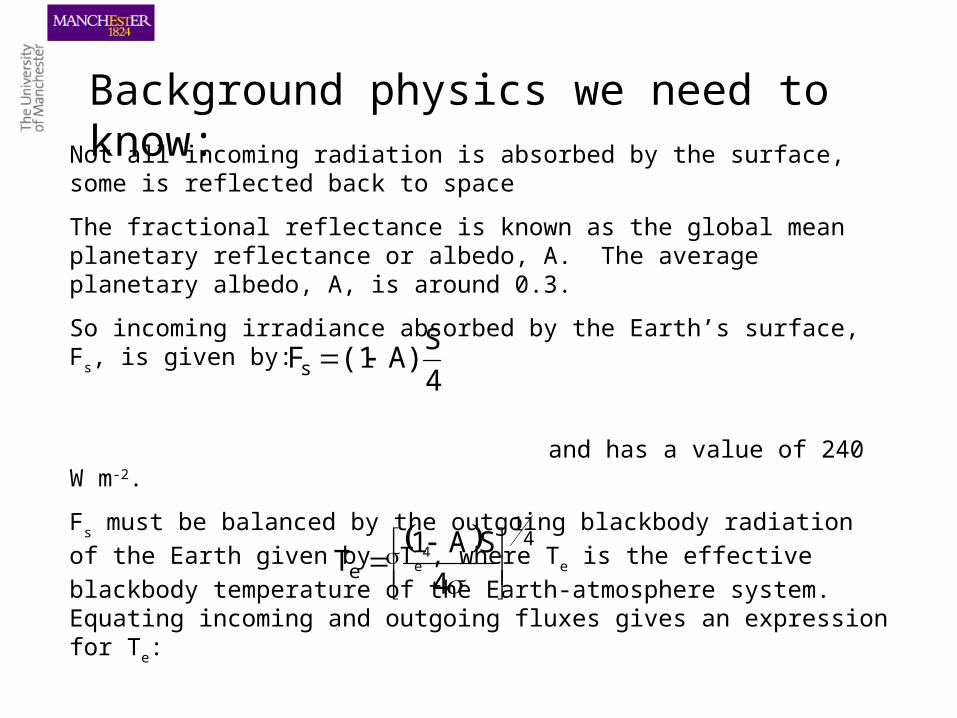
Background physics we need to know:Not all incoming radiation is absorbed by the surface, some is
reflected back to space
The fractional reflectance is known as the global mean planetary reflectance or albedo, A. The average planetary albedo, A, is around 0.3.
So incoming irradiance absorbed by the Earth’s surface, Fs, is given by:
and has a value of 240 W m-2.
Fs must be balanced by the outgoing blackbody radiation of the Earth given by Te
4, where Te is the effective blackbody temperature of the Earth-atmosphere system. Equating incoming and outgoing fluxes gives an expression for Te:
an equilibrium temperature of 255 K, compared to 288 K, the average surface temperature of the Earth.
4
SA)(1Fs
41
e 4
SA1T
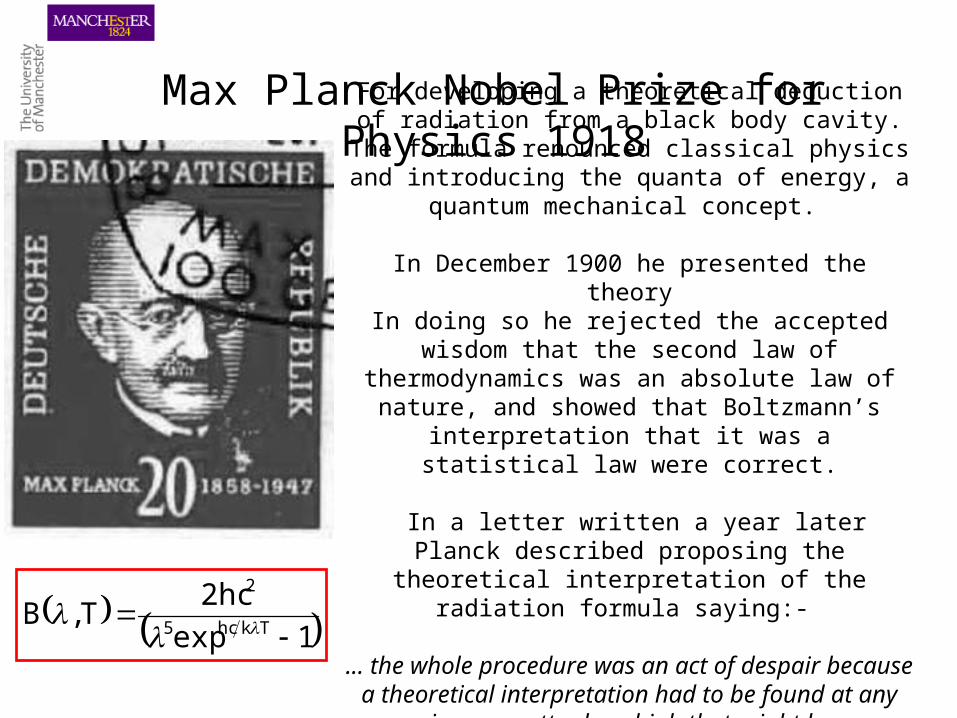
Max Planck Nobel Prize for Physics 1918For developing a theoretical deduction of radiation
from a black body cavity.The formula renounced classical physics and introducing the quanta of energy, a quantum
mechanical concept.
In December 1900 he presented the theoryIn doing so he rejected the accepted wisdom that the second law of thermodynamics was an absolute law
of nature, and showed that Boltzmann’s interpretation that it was a statistical law were correct.
In a letter written a year later Planck described proposing the theoretical interpretation of the
radiation formula saying:-
... the whole procedure was an act of despair because a theoretical interpretation had to be found
at any price, no matter how high that might be.
1exp
2hcT,B
Tkhc5
2
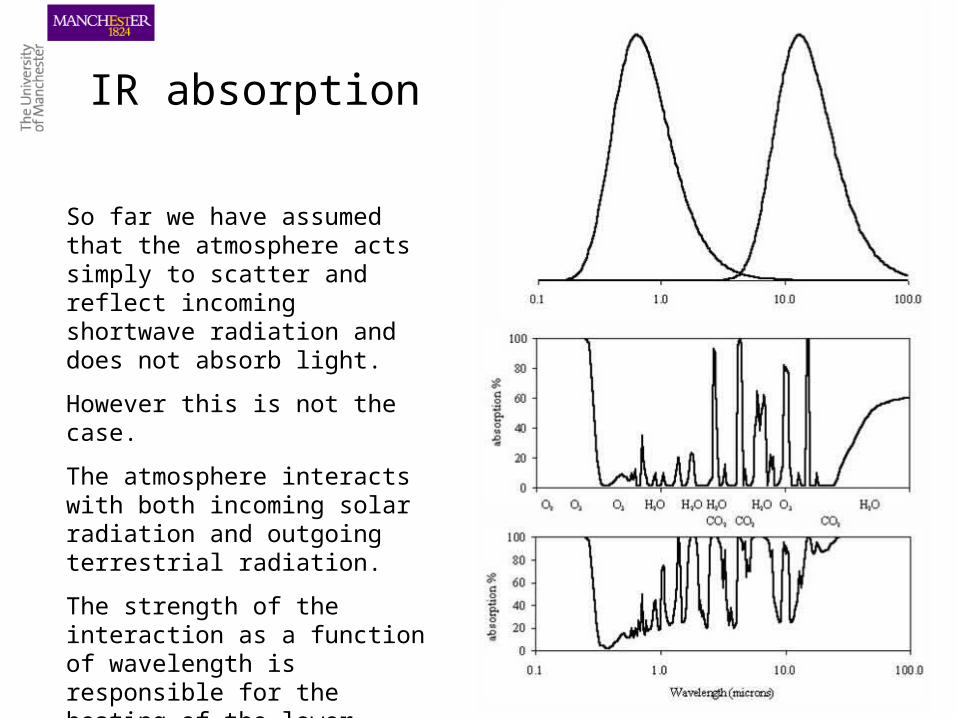
IR absorption
So far we have assumed that the atmosphere acts simply to scatter and reflect incoming shortwave radiation and does not absorb light.
However this is not the case.
The atmosphere interacts with both incoming solar radiation and outgoing terrestrial radiation.
The strength of the interaction as a function of wavelength is responsible for the heating of the lower atmosphere.
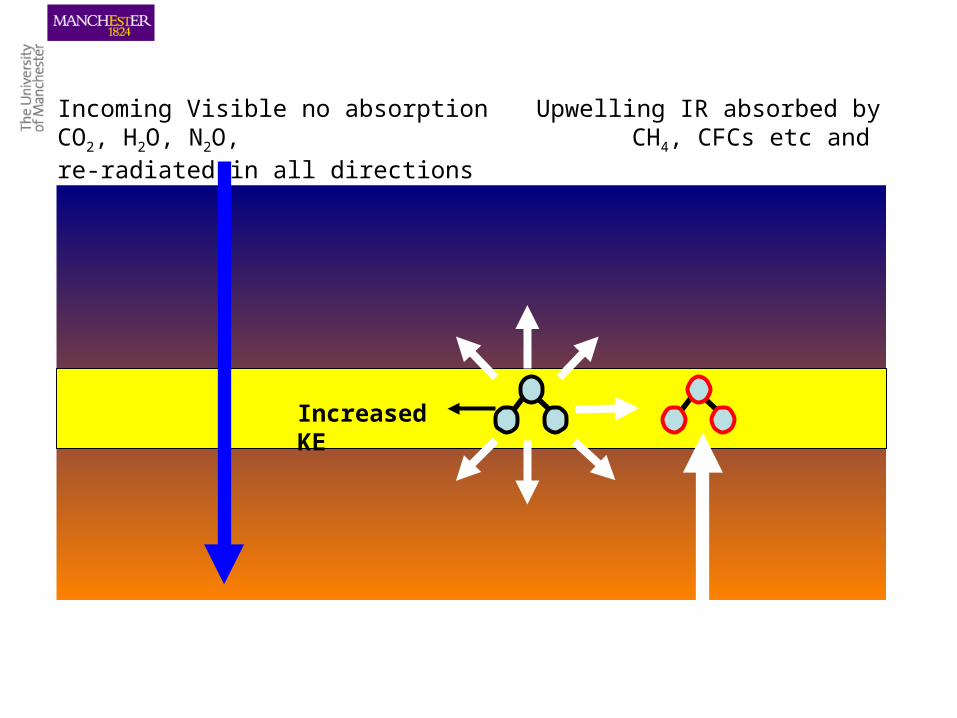
Increased KE
Incoming Visible no absorption Upwelling IR absorbed by CO2, H2O, N2O, CH4, CFCs etc and re-radiated in all directions
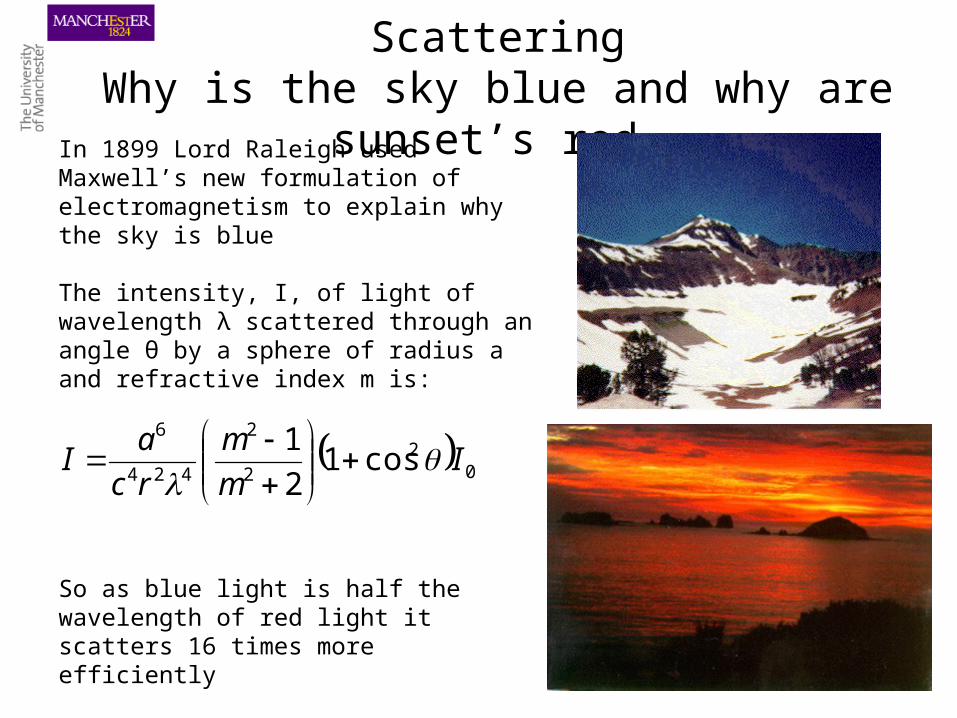
ScatteringWhy is the sky blue and why are sunset’s red
In 1899 Lord Raleigh used Maxwell’s new formulation of electromagnetism to explain why the sky is blue
The intensity, I, of light of wavelength λ scattered through an angle θ by a sphere of radius a and refractive index m is:
02
2
2
424
6
cos12
1I
m
m
rc
aI
So as blue light is half the wavelength of red light it scatters 16 times more efficiently
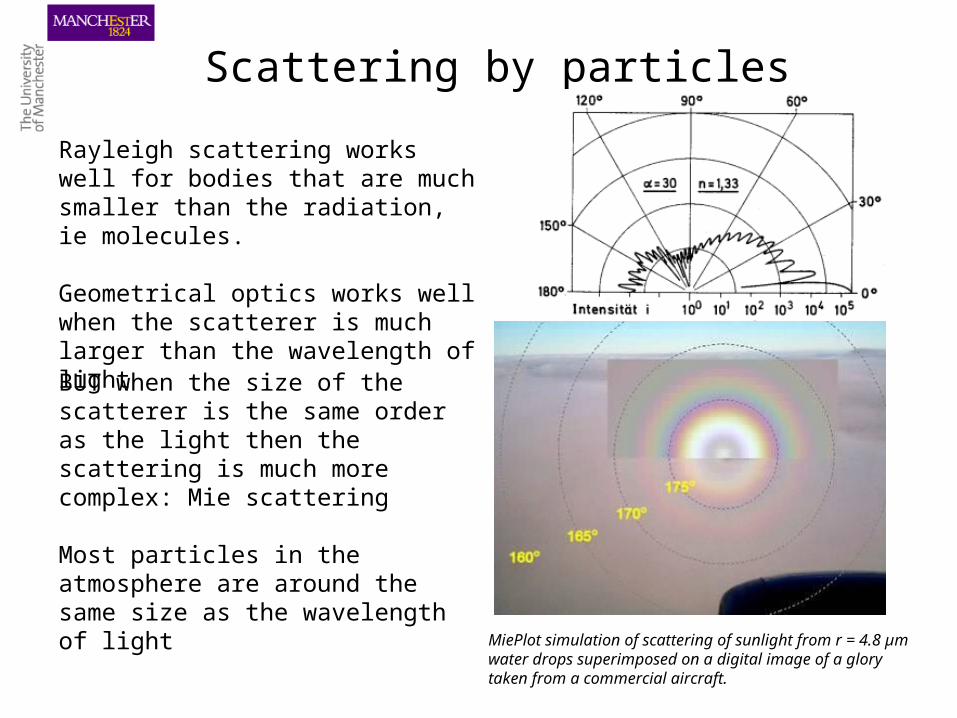
Scattering by particles
Rayleigh scattering works well for bodies that are much smaller than the radiation, ie molecules.
Geometrical optics works well when the scatterer is much larger than the wavelength of light
BUT when the size of the scatterer is the same order as the light then the scattering is much more complex: Mie scattering
Most particles in the atmosphere are around the same size as the wavelength of light
MiePlot simulation of scattering of sunlight from r = 4.8 µm water drops superimposed on a digital image of a glory taken from a commercial aircraft.
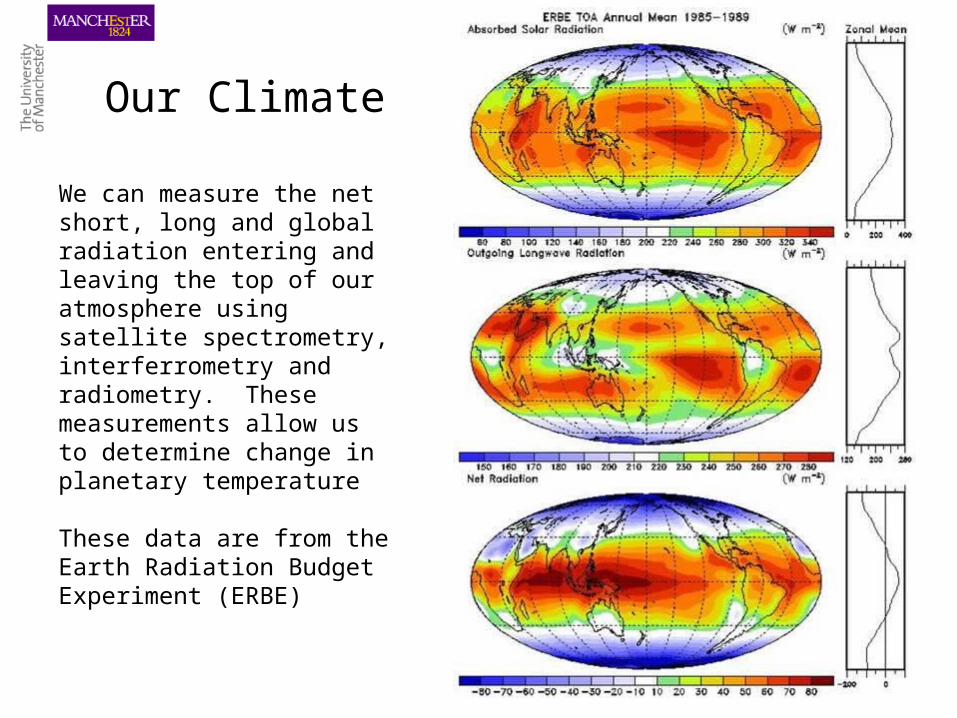
Our Climate
We can measure the net short, long and global radiation entering and leaving the top of our atmosphere using satellite spectrometry, interferrometry and radiometry. These measurements allow us to determine change in planetary temperature
These data are from the Earth Radiation Budget Experiment (ERBE)
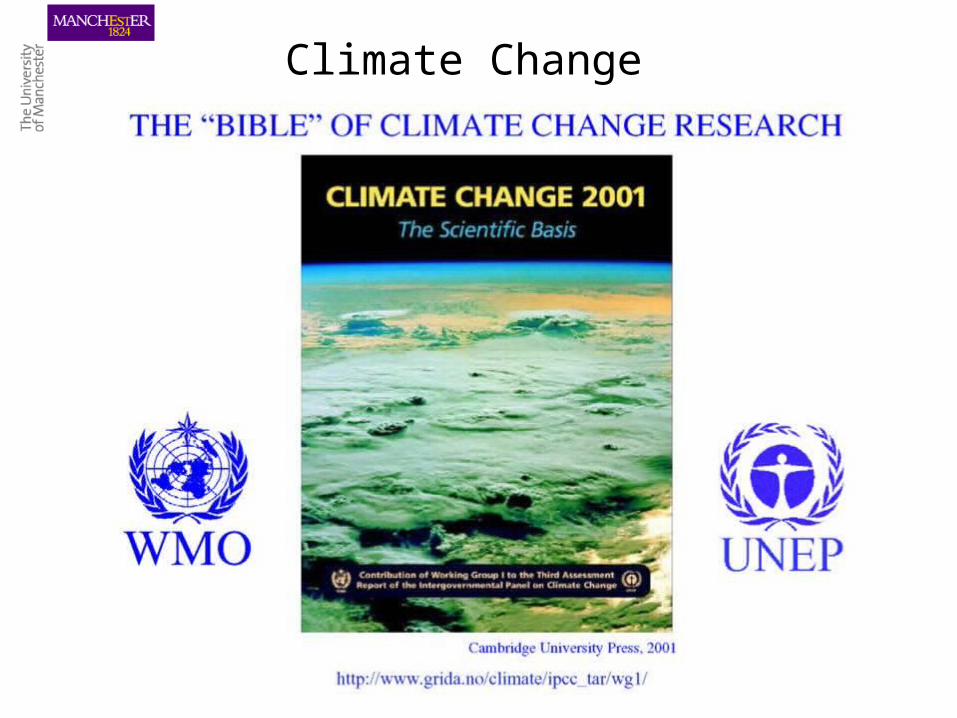
Climate Change
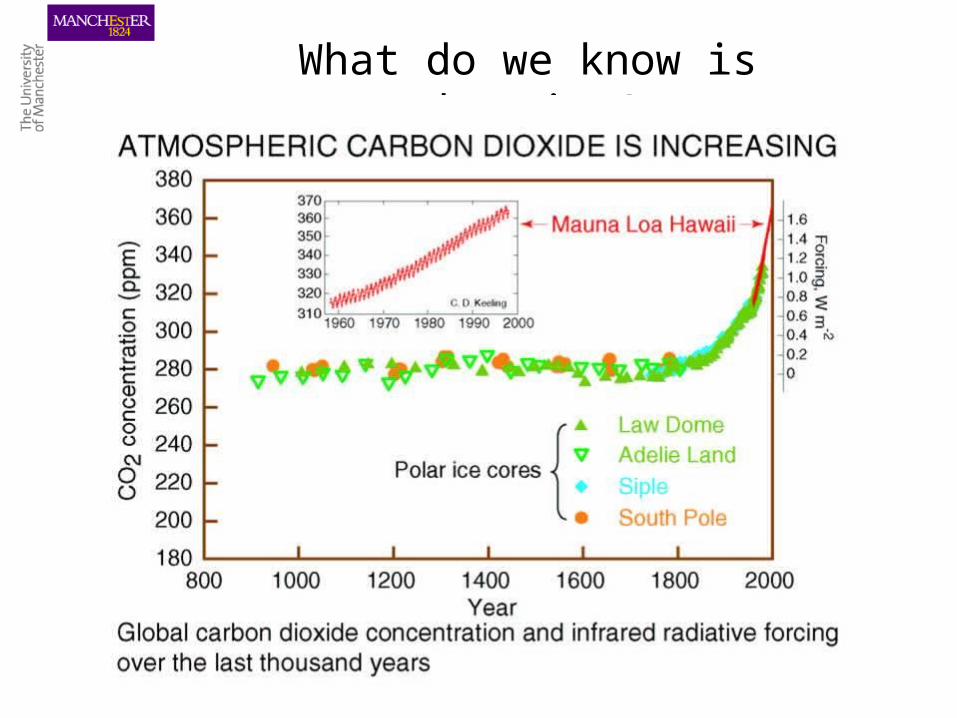
What do we know is changing?
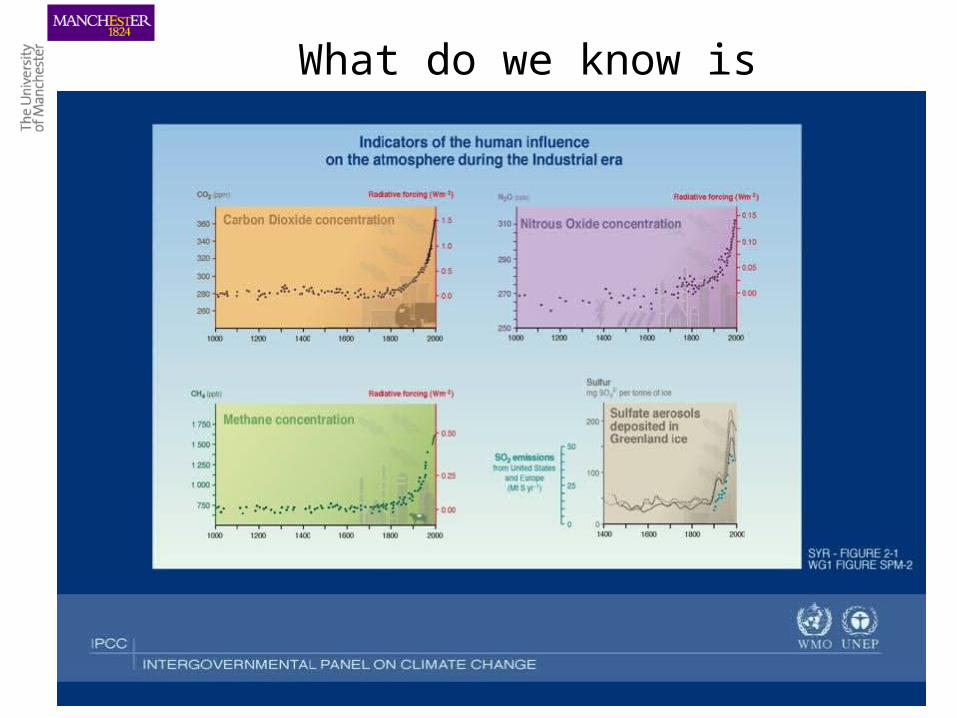
What do we know is changing?
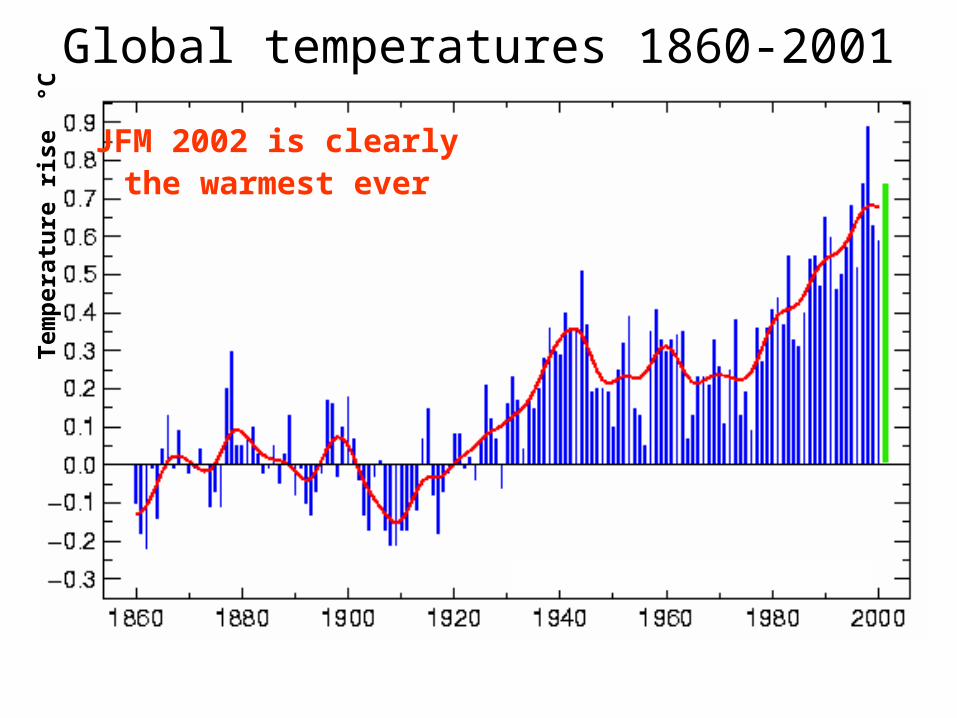
Global temperatures 1860-2001Tem
pera
ture
ris
e °C
JFM 2002 is clearlythe warmest ever
Change in Arctic sea ice extentA
rcti
c se
a ic
e ex
ten
t, m
illio
n k
m2
Hadley Centre
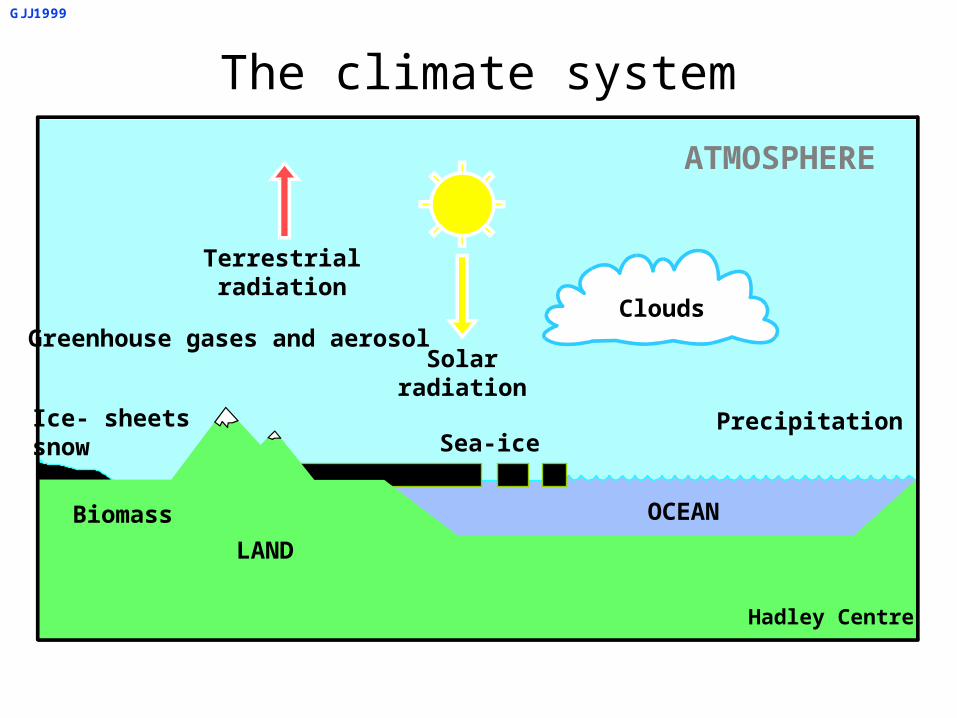
The climate system
GJJ1999
OCEAN
PrecipitationSea-ice
LAND
Ice- sheetssnow
Biomass
Clouds
Solarradiation
Terrestrialradiation
Greenhouse gases and aerosol
ATMOSPHERE
Hadley Centre
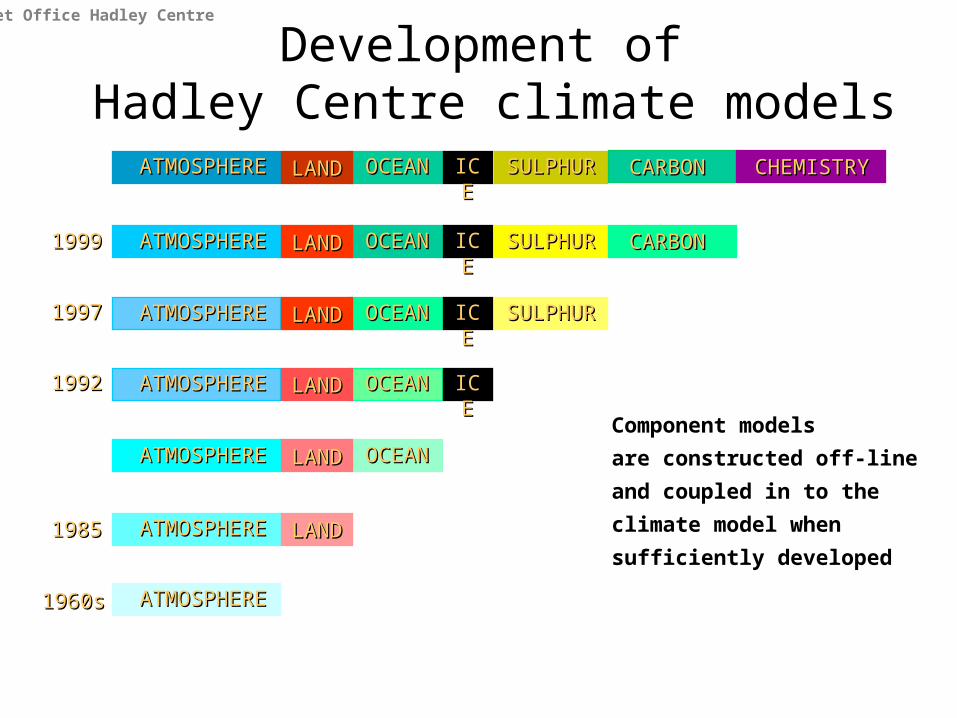
ATMOSPHEREATMOSPHERE LANDLAND OCEANOCEAN ICEICE SULPHURSULPHUR CARBON CARBON CHEMISTRYCHEMISTRY
ATMOSPHEREATMOSPHERE LANDLAND OCEANOCEAN ICEICE SULPHURSULPHUR CARBON CARBON
ATMOSPHEREATMOSPHERE LANDLAND OCEANOCEAN ICEICE SULPHURSULPHUR
ATMOSPHEREATMOSPHERE LANDLAND OCEANOCEAN ICEICE
ATMOSPHEREATMOSPHERE LANDLAND OCEANOCEAN
ATMOSPHEREATMOSPHERE LANDLAND
ATMOSPHEREATMOSPHERE
19991999
19971997
19921992
19851985
Development of Hadley Centre climate models
Component models
are constructed off-line
and coupled in to the
climate model when
sufficiently developed
1960s1960s
Met Office Hadley Centre
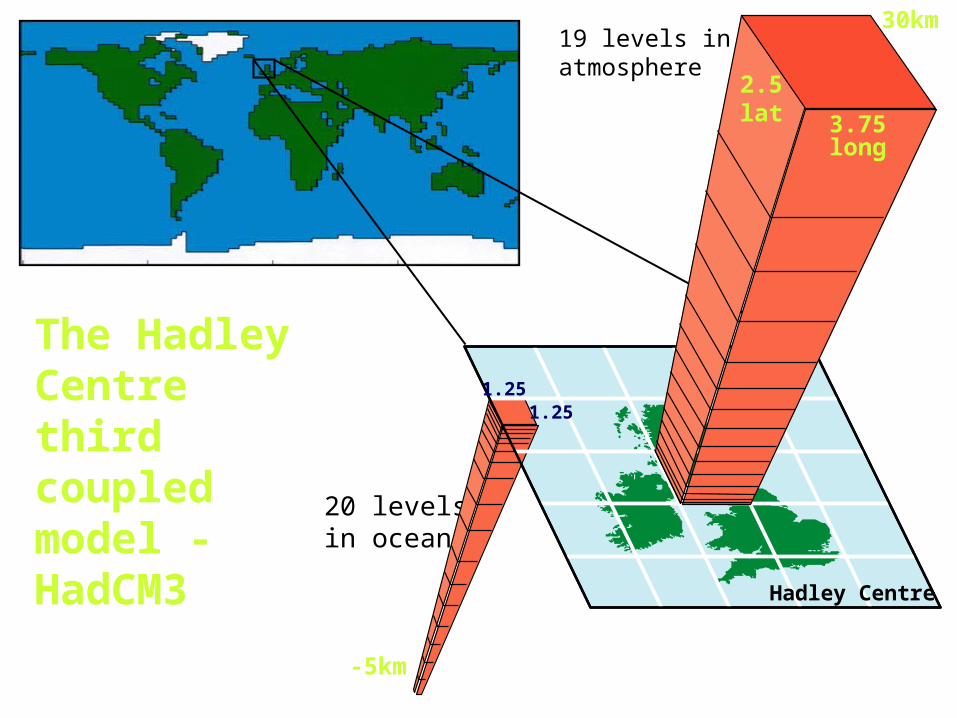
19 levels in atmosphere
20 levelsin ocean
2.5lat 3.75
long
1.251.25
The HadleyCentrethirdcoupledmodel -HadCM3
30km
-5km
Hadley Centre
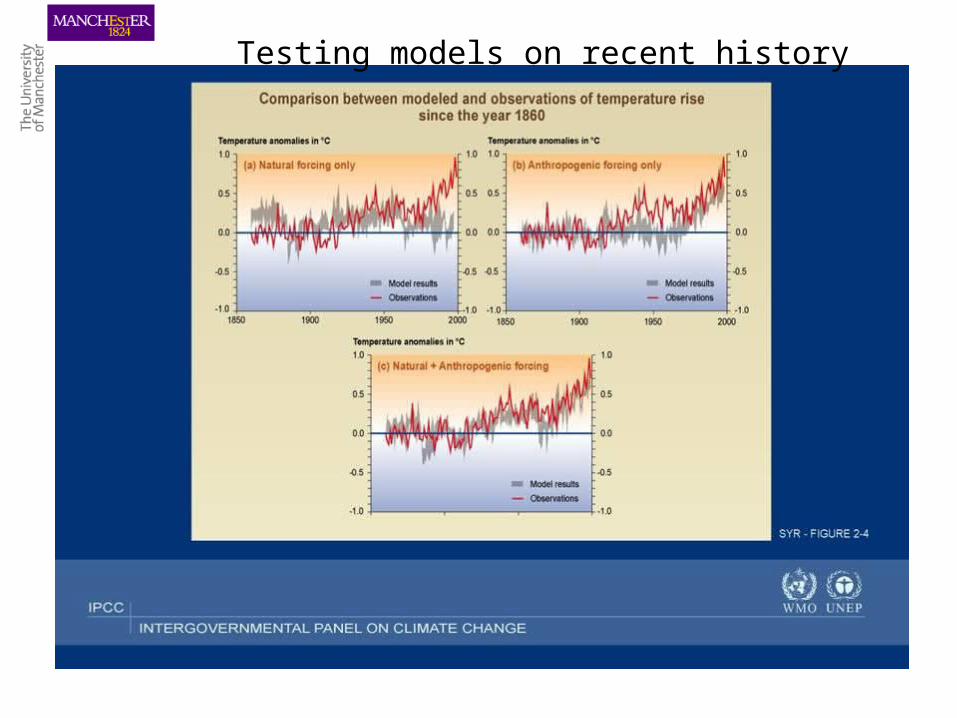
Testing models on recent history
0
50
100
150
200
250
300
350
1990 2000 2010 2020 2030 2040 2050 2060 2070 2080 2090 2100
700
600
500
400
350
CO
2 c
on
cen
trati
on
p
pm
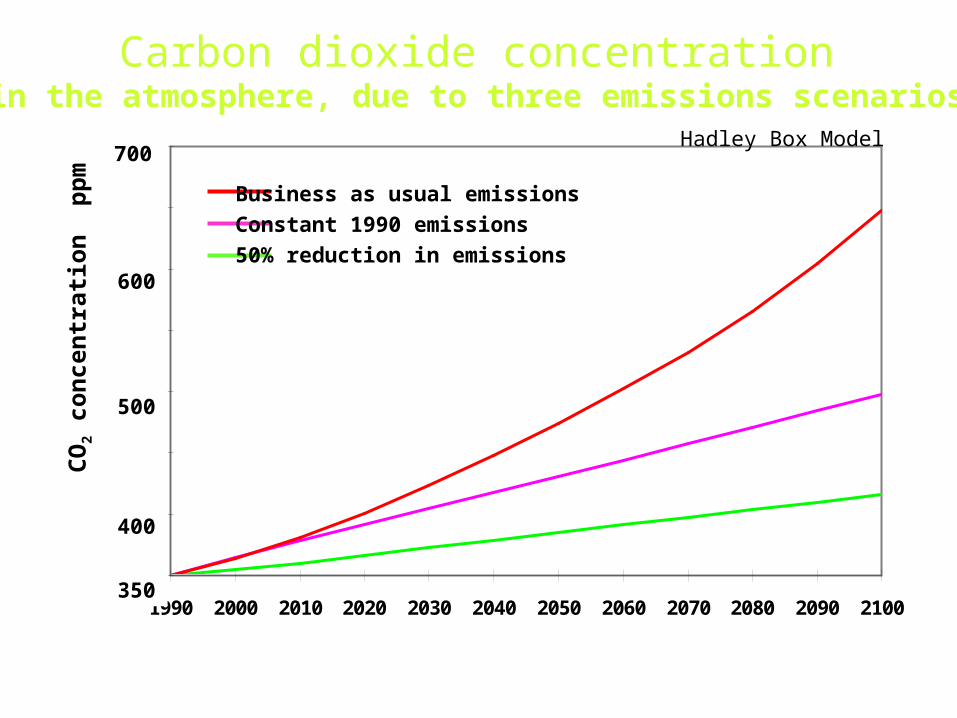
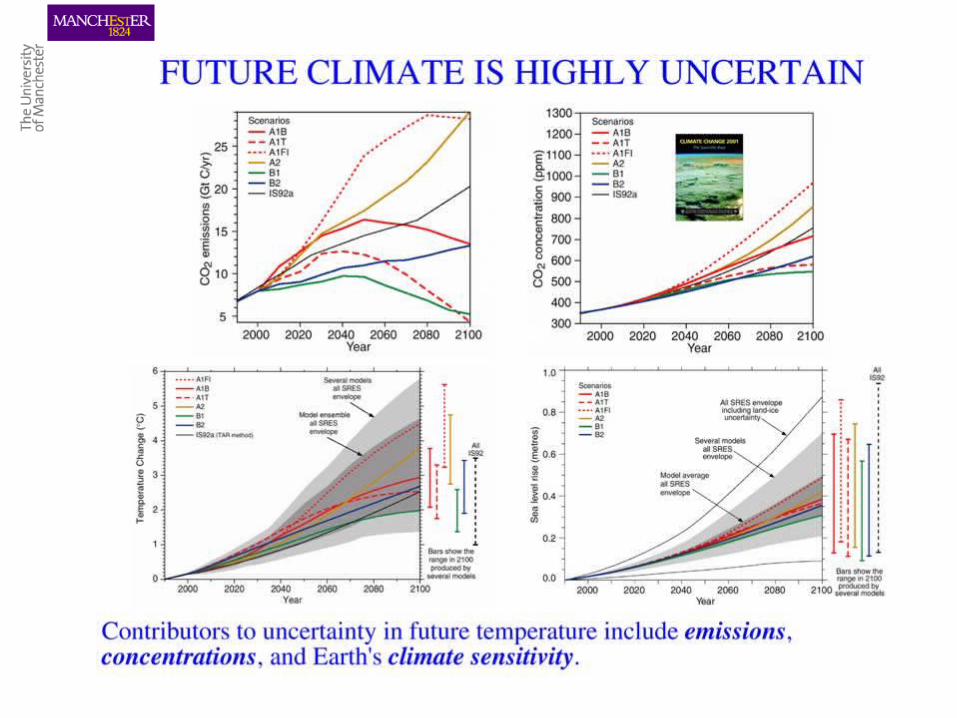
Carbon dioxide concentrationin the atmosphere, due to three emissions scenarios
Hadley Box Model
Business as usual emissionsConstant 1990 emissions50% reduction in emissions
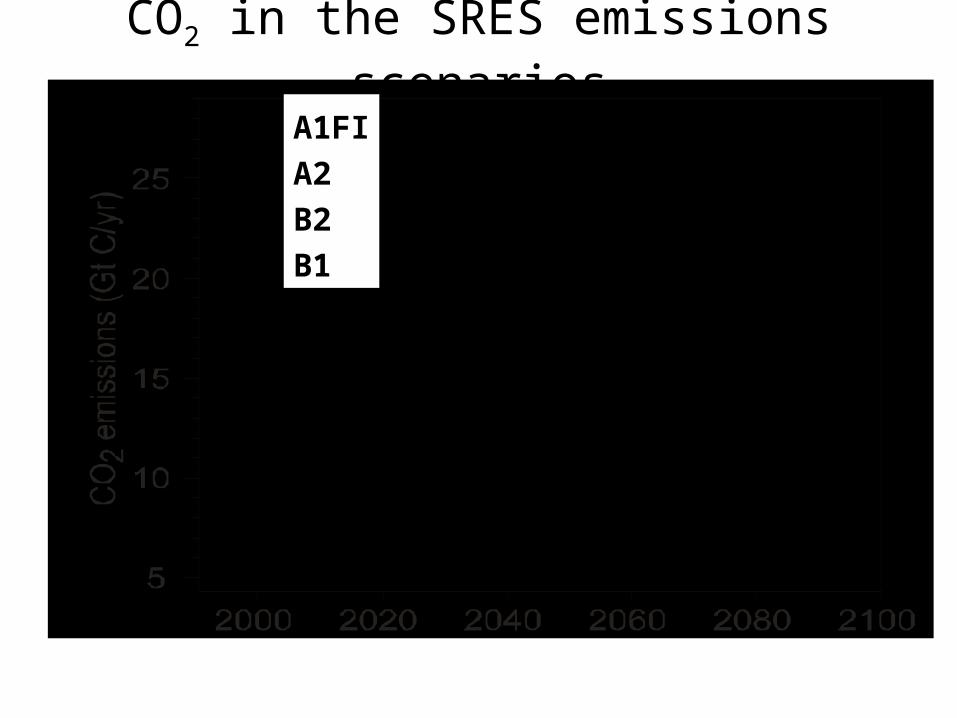
CO2 in the SRES emissions scenarios
A1FIA2B2B1
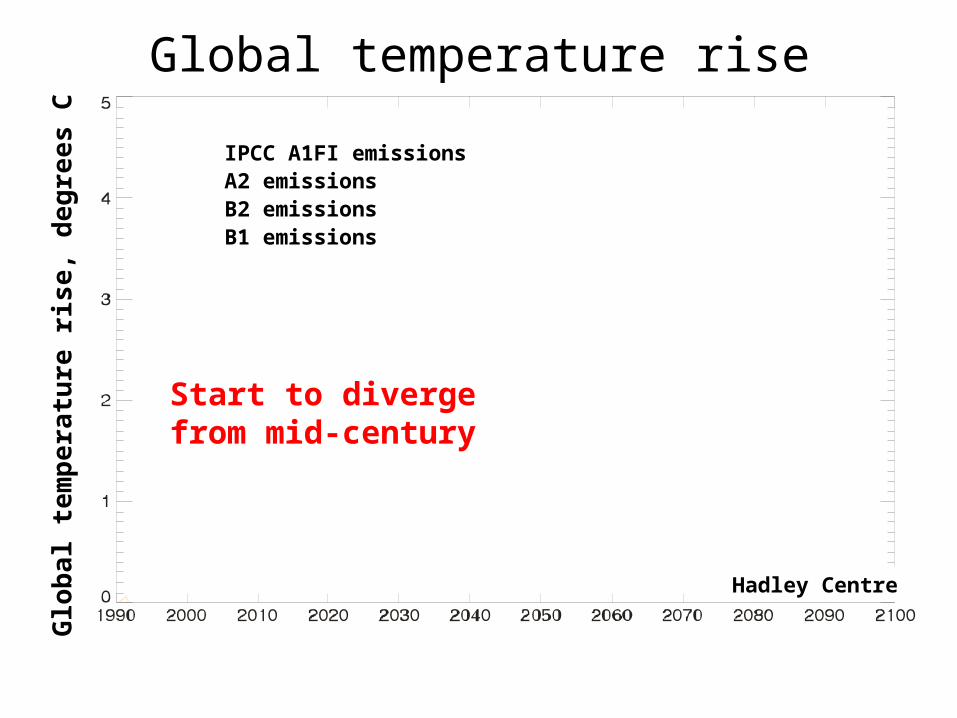
Global temperature riseG
lob
al t
em
pe
ratu
re r
ise,
deg
ree
s C IPCC A1FI emissions
A2 emissionsB2 emissionsB1 emissions
Start to diverge from mid-century
Hadley Centre
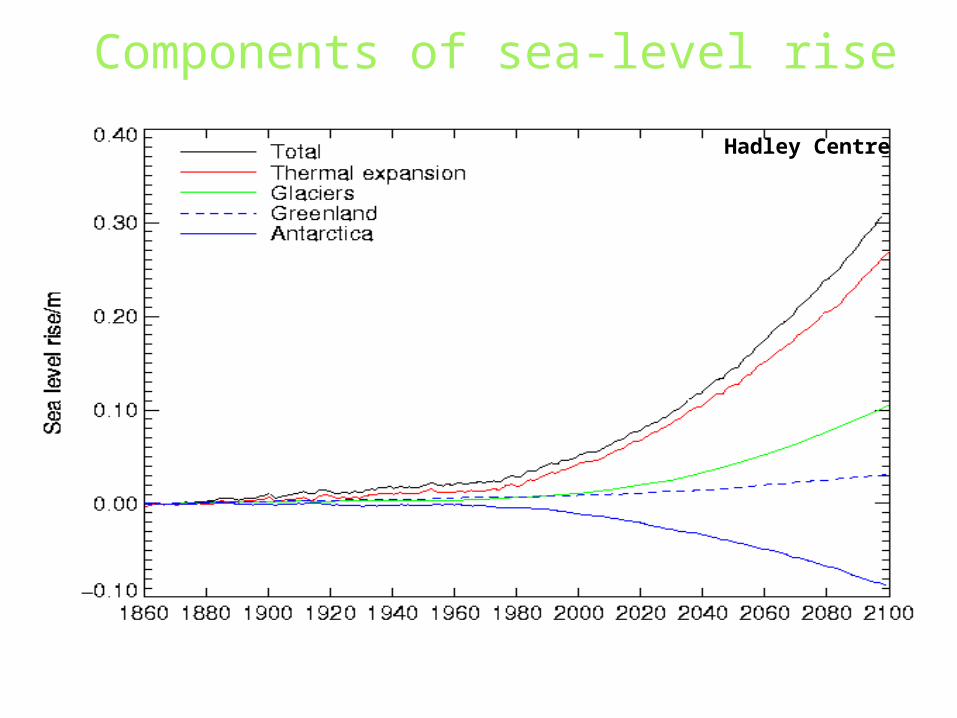
Components of sea-level rise
Hadley Centre
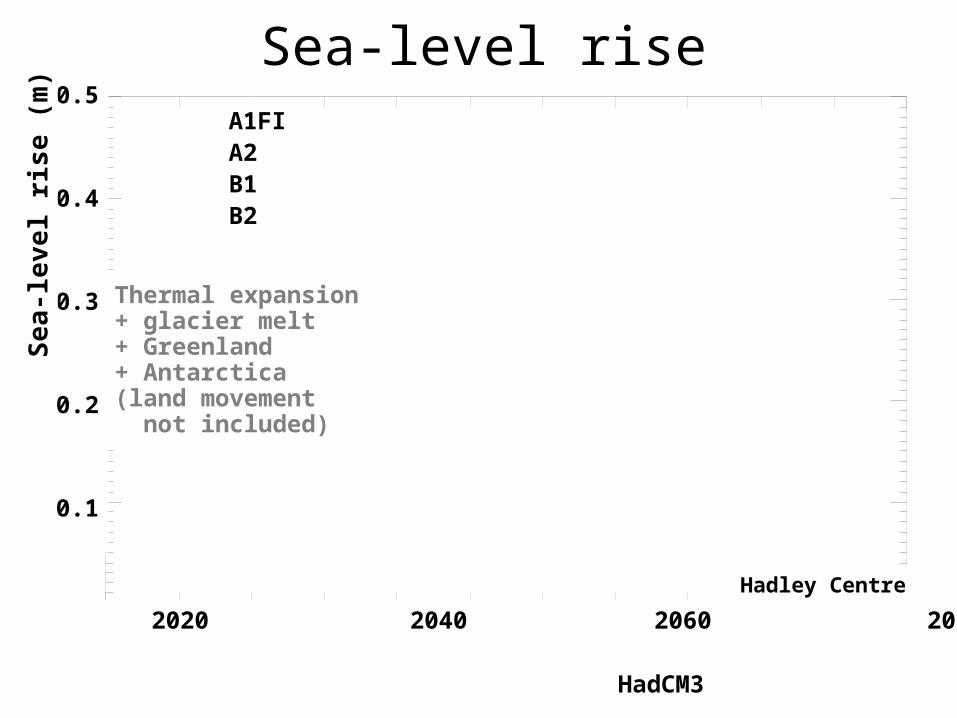
Sea-level rise
HadCM3
0.5
0.4
0.3
0.2
0.1
Se
a-le
vel
ris
e (
m)
1990 2000 2020 2040 2060 2080 2100
Thermal expansion+ glacier melt+ Greenland+ Antarctica(land movement not included)
A1FIA2B1B2
Hadley Centre
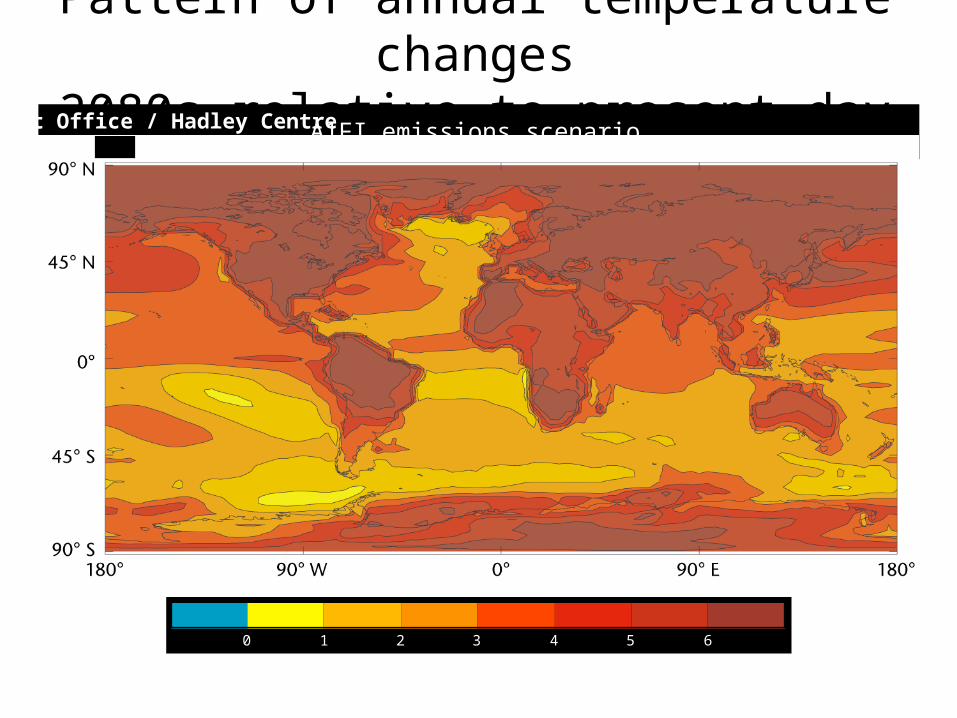
Pattern of annual temperature changes2080s relative to present day
A1FI emissions scenario
0 1 2 3 4 5 6
Met Office / Hadley Centre
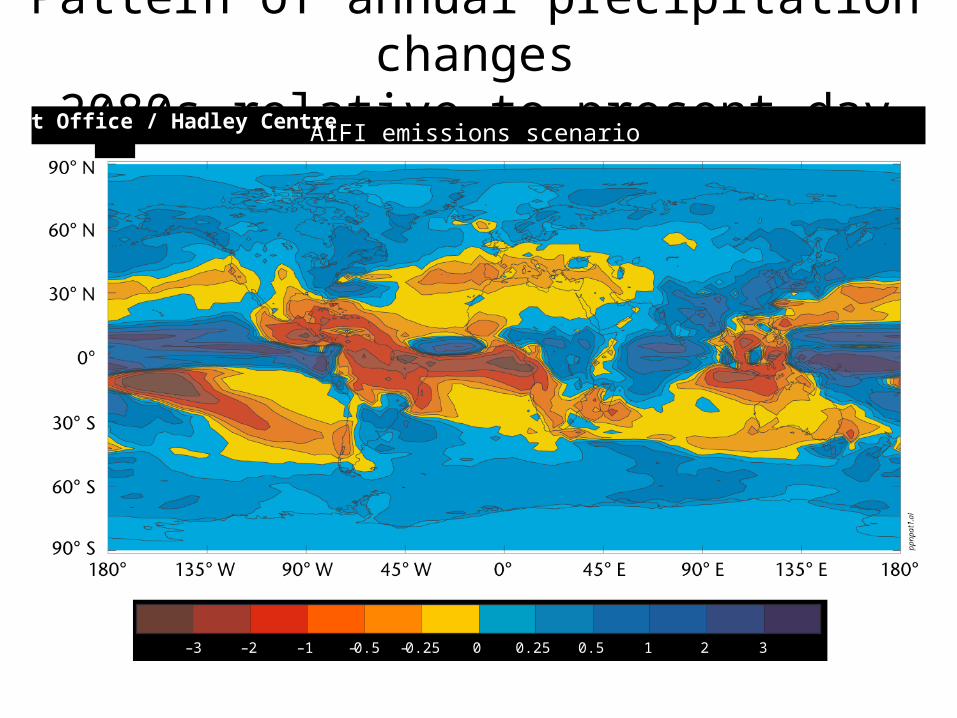
Pattern of annual precipitation changes2080s relative to present day
–3 –2 –1 1 2 3–0.5 0.5–0.25 0.250
A1FI emissions scenarioMet Office / Hadley Centre
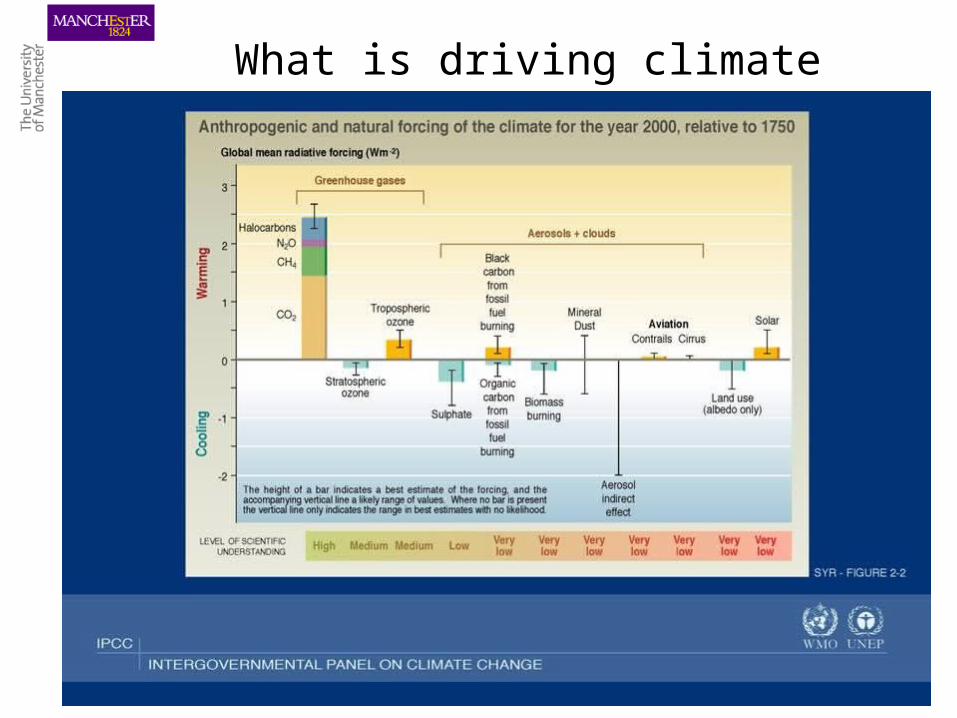
What is driving climate change?
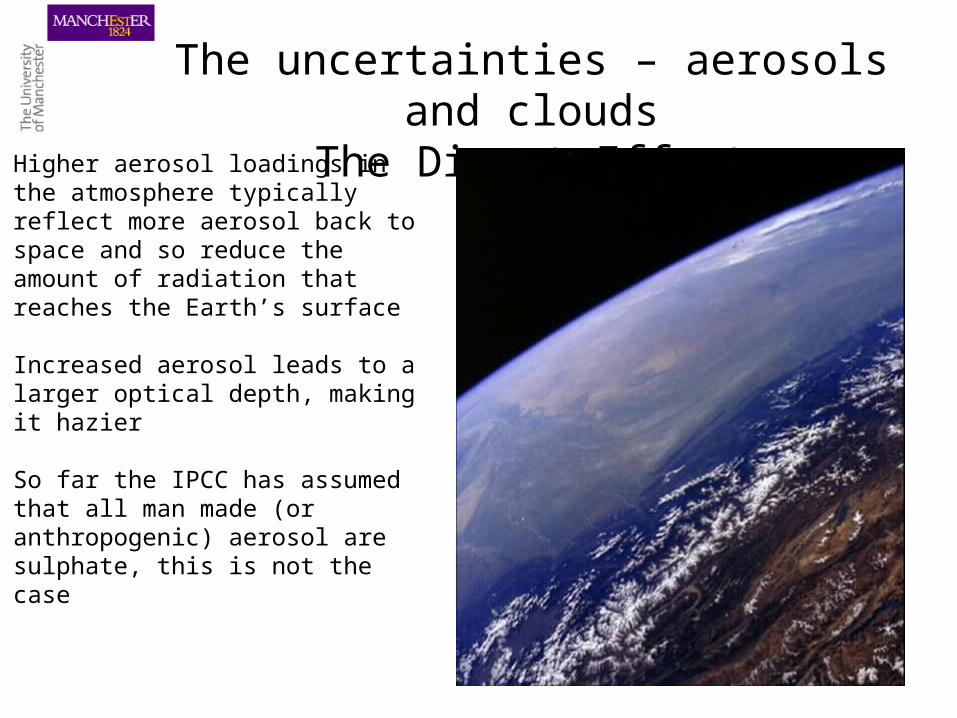
The uncertainties – aerosols and cloudsThe Direct Effect
Higher aerosol loadings in the atmosphere typically reflect more aerosol back to space and so reduce the amount of radiation that reaches the Earth’s surface
Increased aerosol leads to a larger optical depth, making it hazier
So far the IPCC has assumed that all man made (or anthropogenic) aerosol are sulphate, this is not the case
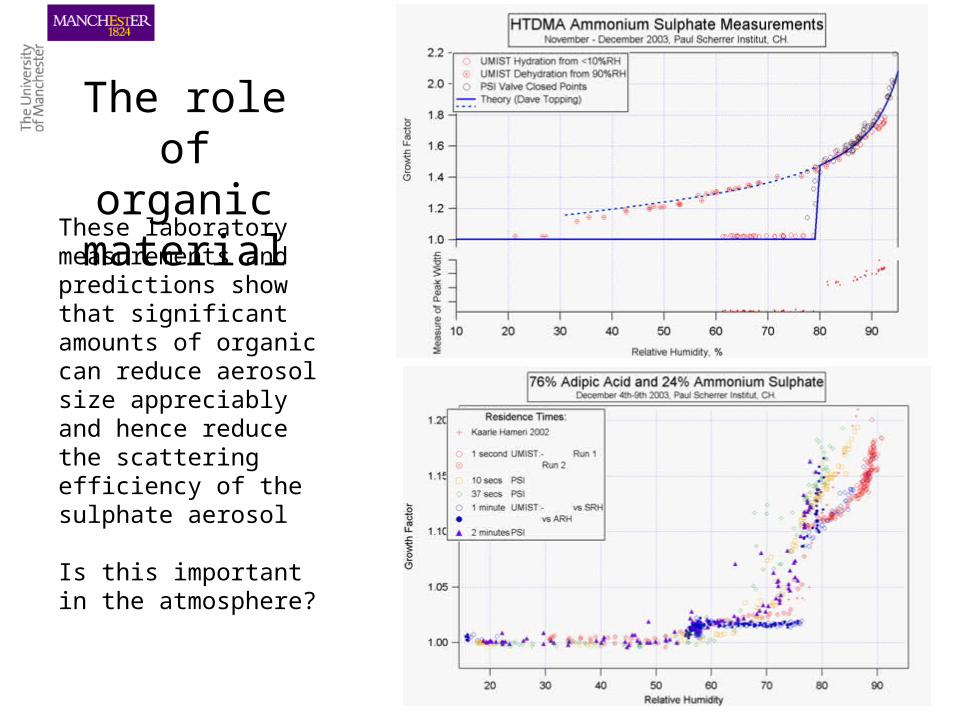
The role of organic material
These laboratory measurements and predictions show that significant amounts of organic can reduce aerosol size appreciably and hence reduce the scattering efficiency of the sulphate aerosol
Is this important in the atmosphere?
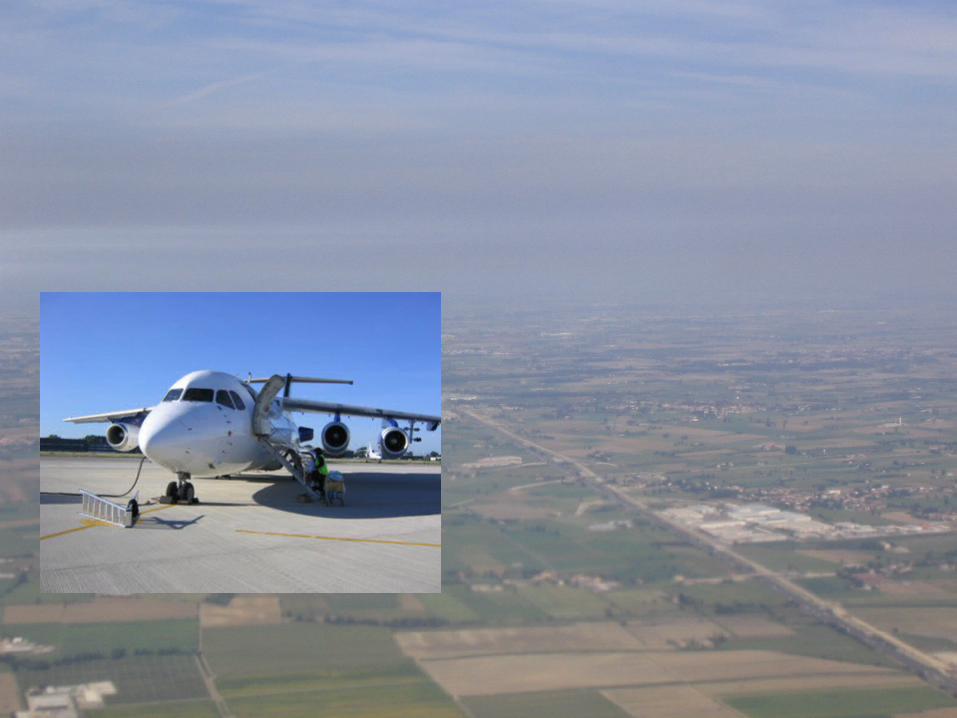
Examples from ADRIEX
(background) A view of the polluted lower Po valley. Polluted stratified layers were observed under anticyclonic conditions. The layers most likely arise from nocturnal inversions cutting off the surface layer from the residual pollution from the previous day. Once the surface warms in the morning, a new polluted layer is formed and begins to fill the boundary layer
The FAAM G-LUXE aircraft on the ground at Treviso airport. The Low Turbulence Inlet is visible above the front right hand side door.
The AMS rack fitted to the G-LUXE aircraft during ADRIEX
Examples from ADRIEXA
B
C
D
E
AB C ED
D
C B A B C D E
D
C B A
14
12
10
8
6
4
2
0
Mas
s C
once
ntra
tion
(µg
m-3
)
08:0029/08/2004
09:00 10:00 11:00 12:00
12x103
8
4
alt (
ft)
09:0001/01/1904
10:00 11:00 12:00 13:00
Ammonium Nitrate Sulphate Organics
The flight track of 29/08/04 is shown. A mapping study of the Po valley was conducted, performing the zigzag pattern twice to observe the boundary layer development.
Time series of mass loadings (at 30 sec resolution) are highly variable and show evidence for very enhanced concentrations of NH4NO3 and organics (> 8 µg m-3) in some plumes.
The plumes are highest in northern side of the valley (C and E) and are larger and more widespread in the later run (10:30 UT) onwards
The data shown can be retrieved every 30 secs in real time on the aircraft via the G-LUXE LAN.
The blue box marked in the time series identifies an example plume close to point E on the second run.
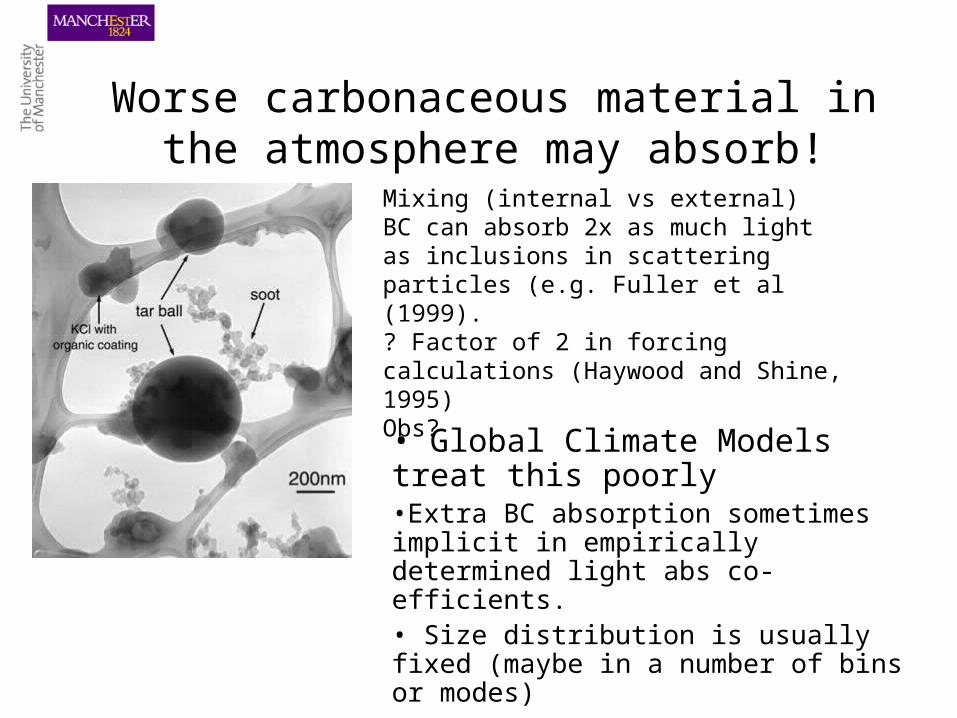
Worse carbonaceous material in the atmosphere may absorb!
Mixing (internal vs external)BC can absorb 2x as much light as inclusions in scattering particles (e.g. Fuller et al (1999). ? Factor of 2 in forcing calculations (Haywood and Shine, 1995)Obs?
• Global Climate Models treat this poorly•Extra BC absorption sometimes implicit in empirically determined light abs co-efficients. • Size distribution is usually fixed (maybe in a number of bins or modes)
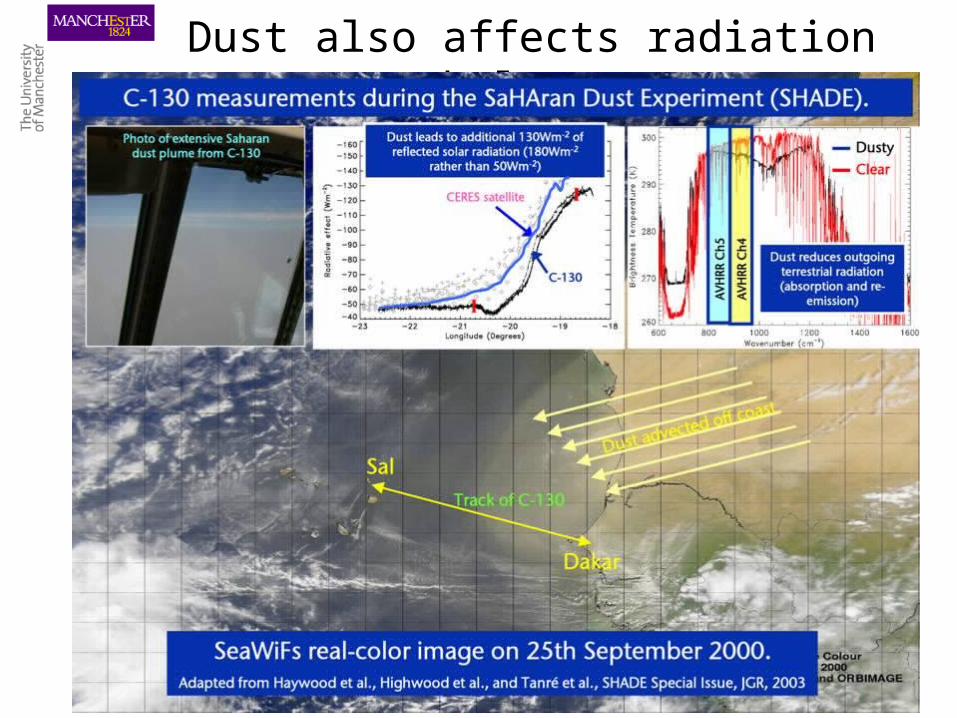
Dust also affects radiation balance
Dust also affects radiation balance
Dust is not simply a natural phenomenon
It may be mixed with biomass burning, changing its absorption efficiency
Its emission may change with desertification and changes in land use, largely brought about through changes in agricultural practices and irrigation
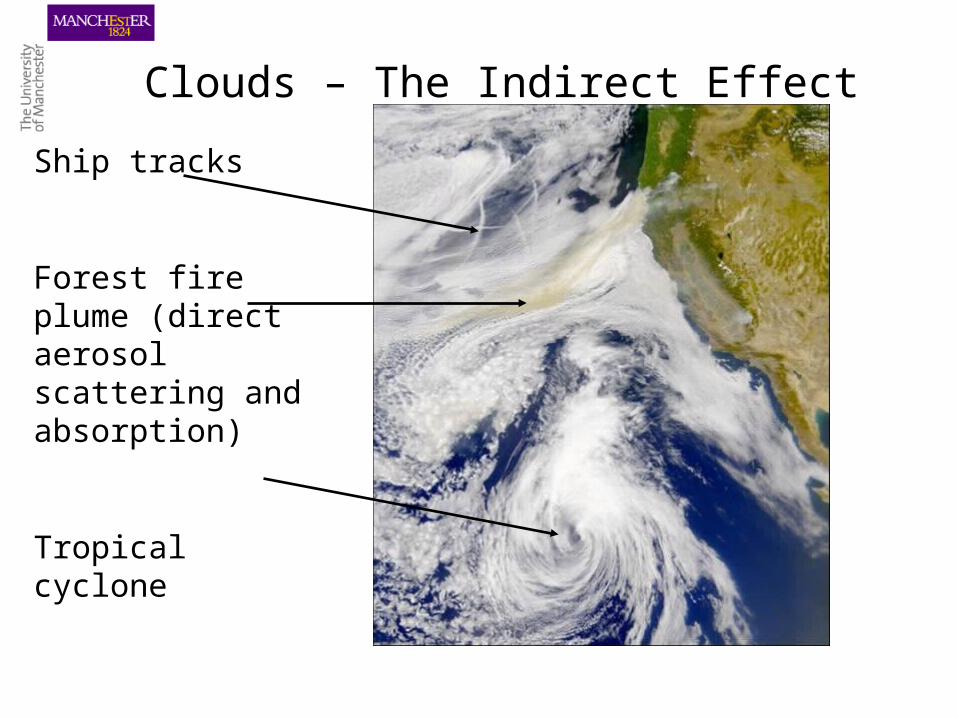
Clouds – The Indirect Effect
Ship tracks
Forest fire plume (direct aerosol scattering and absorption)
Tropical cyclone
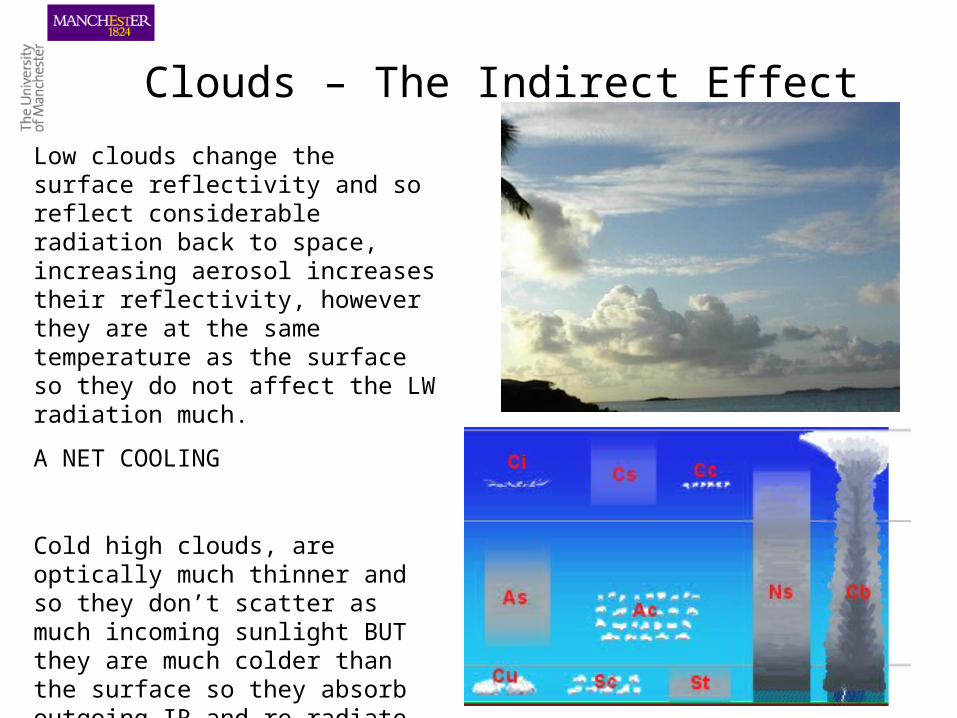
Clouds – The Indirect Effect
Low clouds change the surface reflectivity and so reflect considerable radiation back to space, increasing aerosol increases their reflectivity, however they are at the same temperature as the surface so they do not affect the LW radiation much.
A NET COOLING
Cold high clouds, are optically much thinner and so they don’t scatter as much incoming sunlight BUT they are much colder than the surface so they absorb outgoing IR and re-radiate at a colder temperature.
A NET WARMING
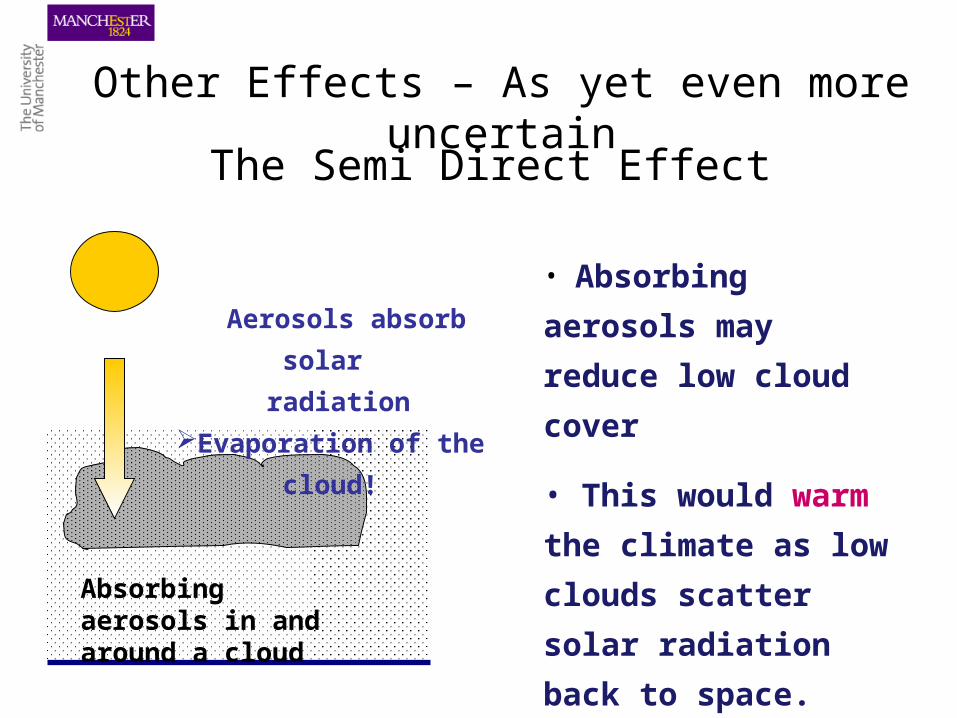
Other Effects – As yet even more uncertain
The Semi Direct Effect
Absorbing aerosols in and around a cloud
Aerosols absorb solar
radiation
Evaporation of the cloud!
• Absorbing aerosols
may reduce low cloud
cover
• This would warm the
climate as low clouds
scatter solar radiation
back to space.
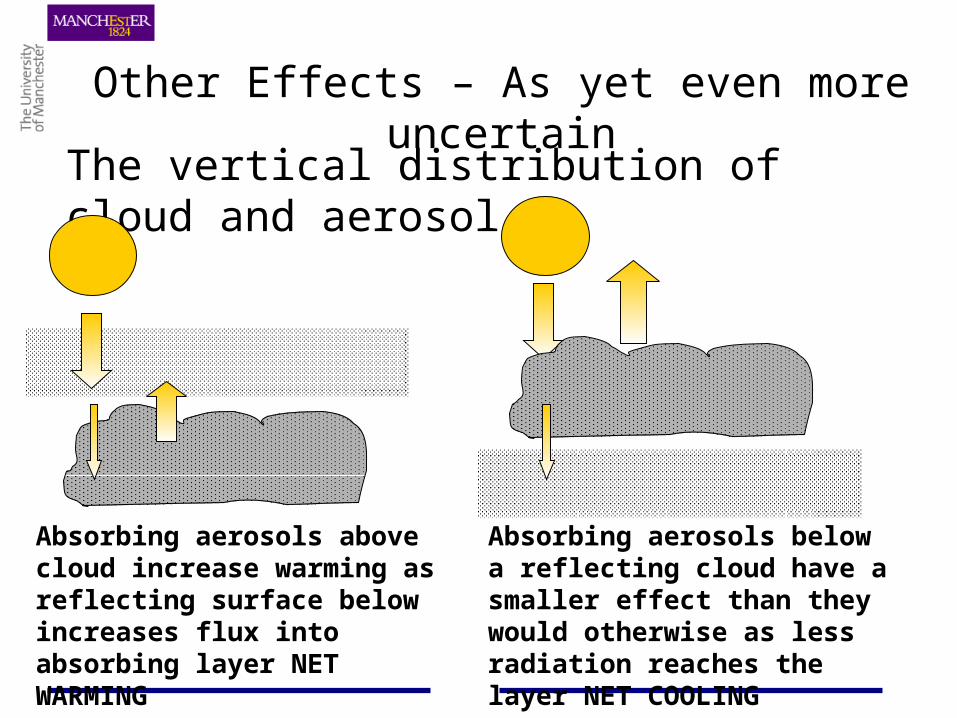
Other Effects – As yet even more uncertain
The vertical distribution of cloud and aerosol
Absorbing aerosols above cloud increase warming as reflecting surface below increases flux into absorbing layer NET WARMING
Absorbing aerosols below a reflecting cloud have a smaller effect than they would otherwise as less radiation reaches the layer NET COOLING
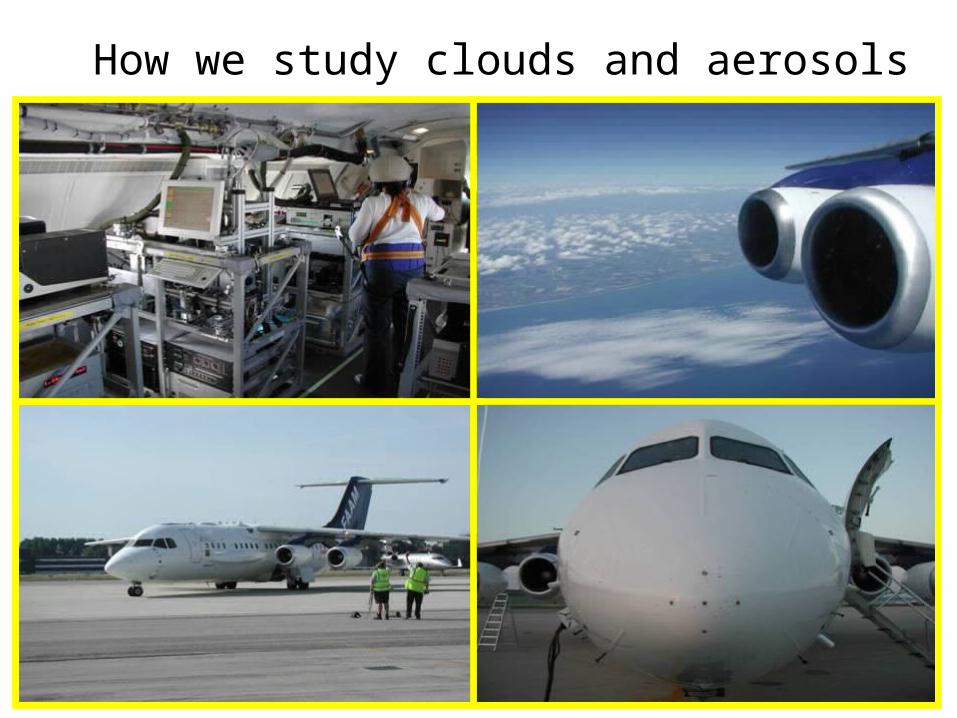
How we study clouds and aerosols
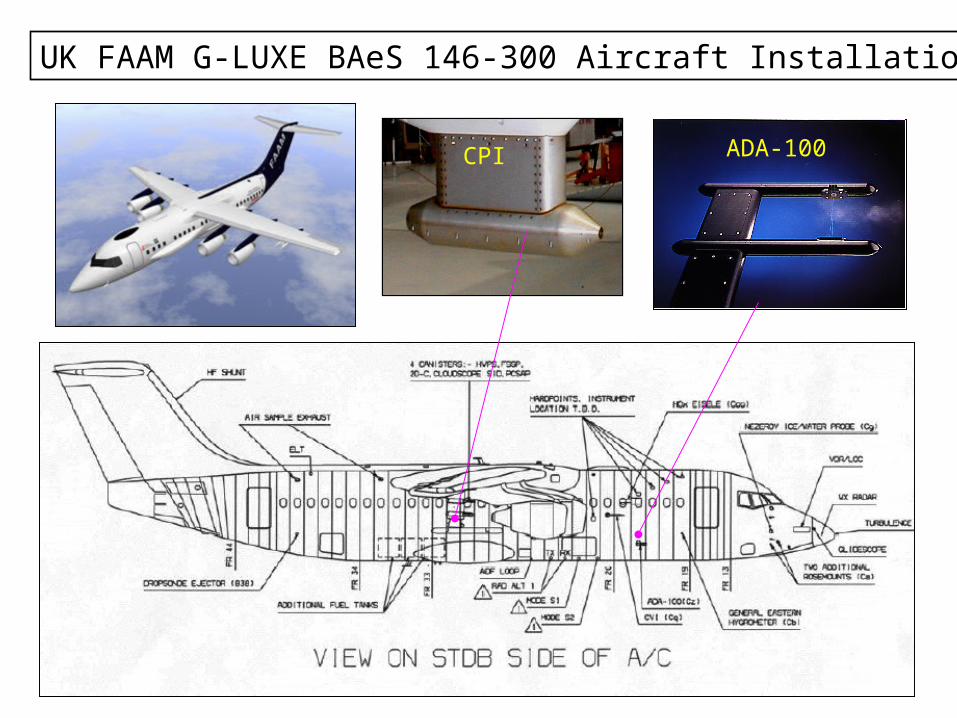
UK FAAM G-LUXE BAeS 146-300 Aircraft Installation
ADA-100CPI
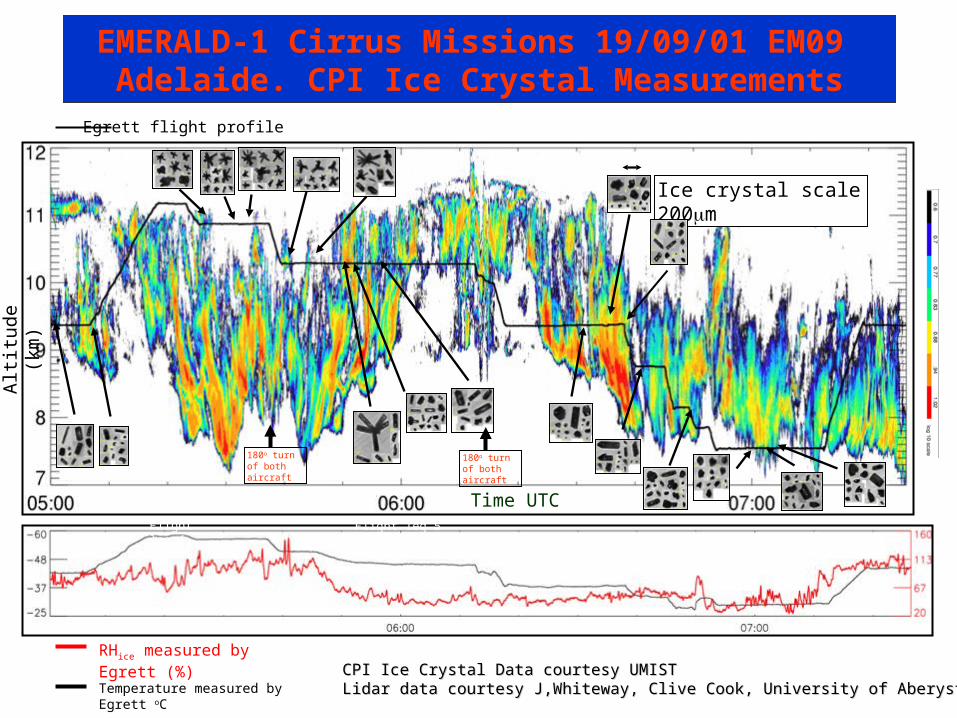
Time UTC
Alti
tude
(km
)
Ice crystal scale 200m
180o turn of both aircraft
180o turn of both aircraft
Temperature measured by Egrett oC
RHice measured by Egrett (%)
Flight leg 4 Flight leg 5
Egrett flight profile
CPI Ice Crystal Data courtesy UMISTCPI Ice Crystal Data courtesy UMISTLidar data courtesy J,Whiteway, Clive Cook, University of AberystwythLidar data courtesy J,Whiteway, Clive Cook, University of Aberystwyth
EMERALD-1 Cirrus Missions 19/09/01 EM09 Adelaide. CPI Ice Crystal Measurements
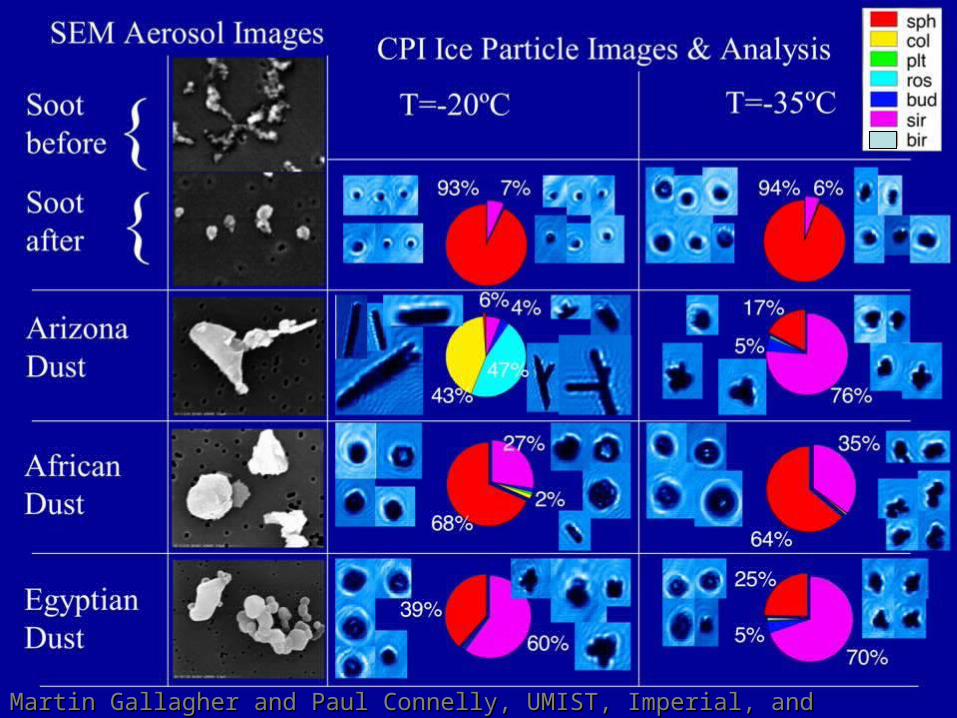
Martin Gallagher and Paul Connelly, UMIST, Imperial, and AberystwythMartin Gallagher and Paul Connelly, UMIST, Imperial, and Aberystwyth
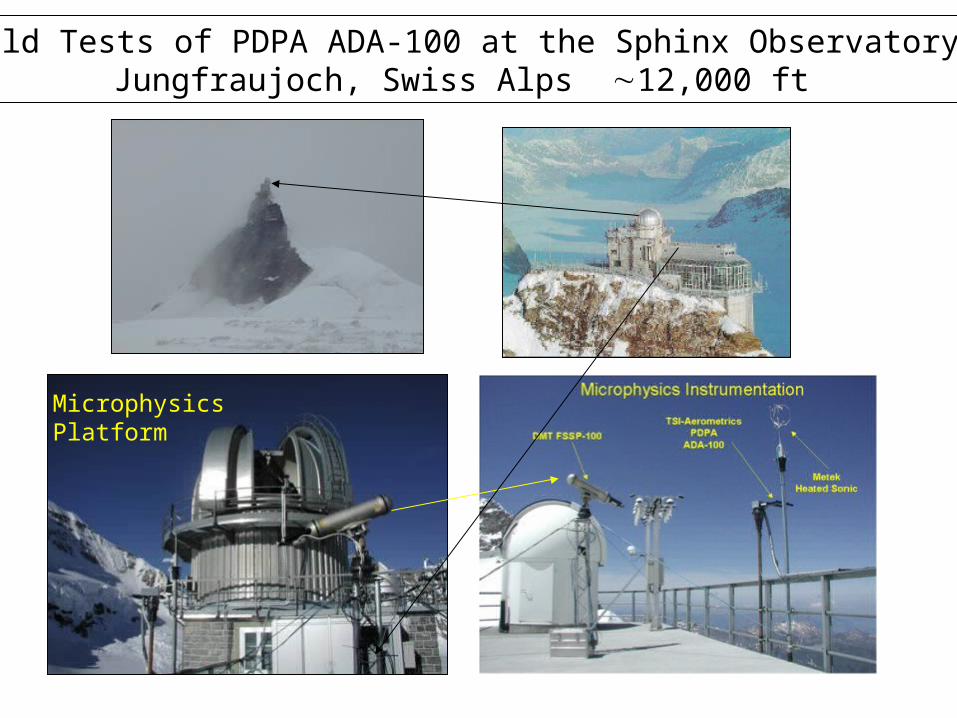
Field Tests of PDPA ADA-100 at the Sphinx Observatory Jungfraujoch, Swiss Alps 12,000 ft
Microphysics Platform
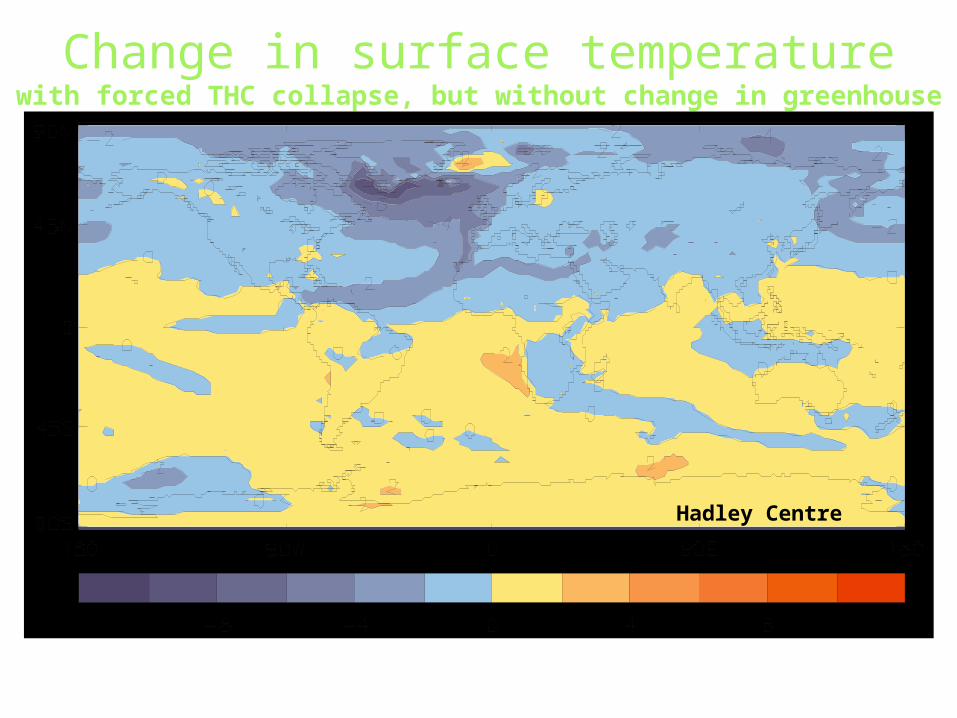
Change in surface temperature with forced THC collapse, but without change in greenhouse
gases
Deg C
Hadley Centre
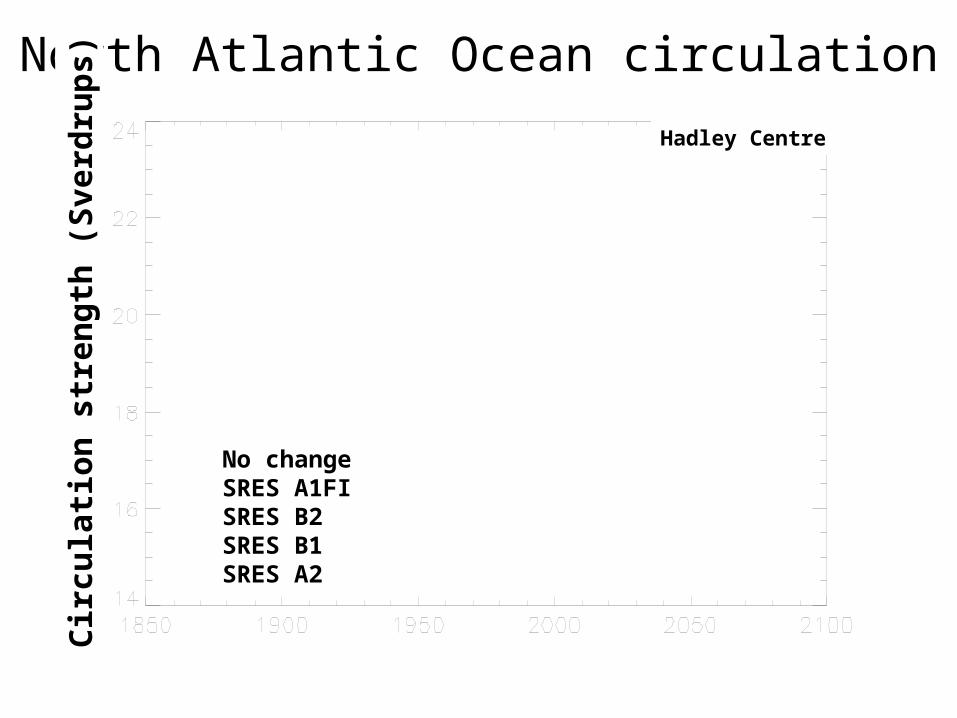
North Atlantic Ocean circulationC
ircu
lati
on
str
eng
th (
Sve
rdru
ps)
No changeSRES A1FISRES B2SRES B1SRES A2
Hadley Centre
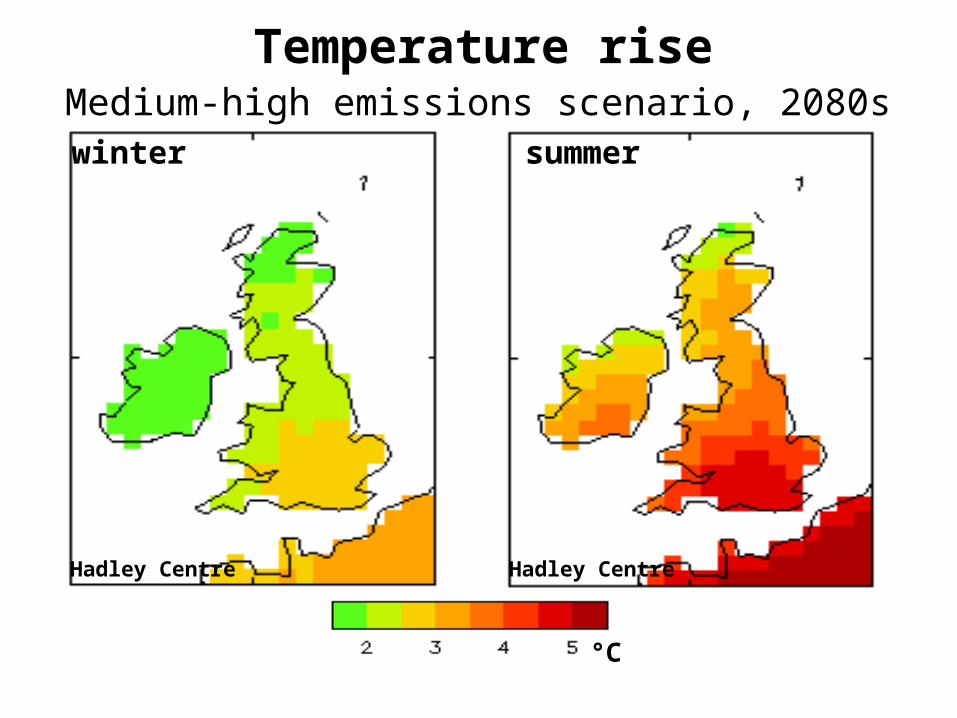
Temperature riseMedium-high emissions scenario, 2080s
winter summer
°C
Hadley Centre Hadley Centre
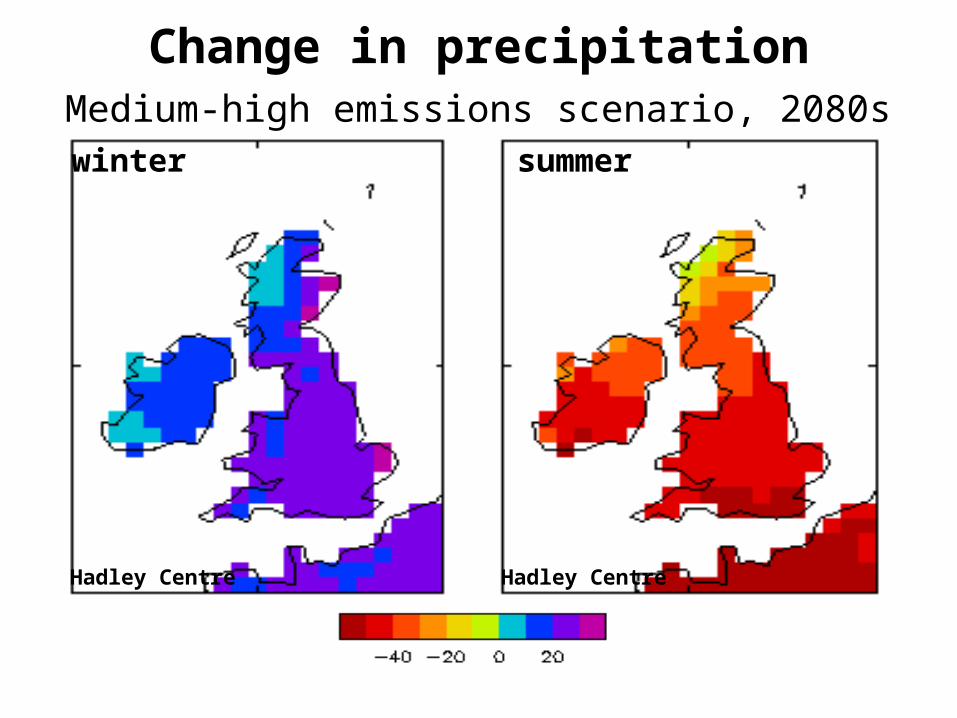
Change in precipitation
%
winter summer
Medium-high emissions scenario, 2080s
Hadley Centre Hadley Centre
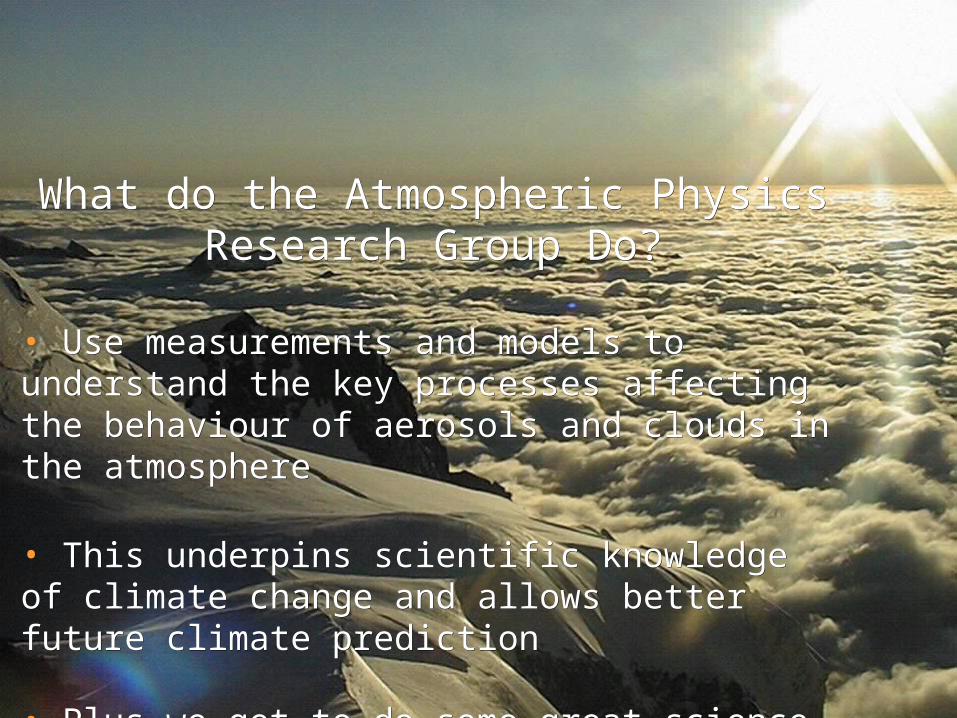
What do the Atmospheric Physics What do the Atmospheric Physics Research Group Do?Research Group Do?
• Use measurements and models to understand the Use measurements and models to understand the key processes affecting the behaviour of aerosols key processes affecting the behaviour of aerosols and clouds in the atmosphereand clouds in the atmosphere
• This underpins scientific knowledge of climate This underpins scientific knowledge of climate change and allows better future climate predictionchange and allows better future climate prediction
• Plus we get to do some great science in fantastic Plus we get to do some great science in fantastic places!places!