Embed Size (px)
Citation preview
Mon. Not. R. Astron. Soc. 354, 851–869 (2004) doi:10.1111/j.1365-2966.2004.08250.x
The photometric properties of isolated early-type galaxies
Fatma M. Reda,1,2� Duncan A. Forbes,1� Michael A. Beasley,1,3�
Ewan J. O’Sullivan4� and Paul Goudfrooij5�1Centre for Astrophysics & Supercomputing, Swinburne University, Hawthorn, VIC 3122, Australia2Astronomy Department, National Research Institute of Astronomy and Geophysics, Helwan, Cairo 11421, Egypt3Lick Observatory, University of California, Santa Cruz, CA 95064, USA4Harvard-Smithsonian Center for Astrophysics, MS-67, 60 Garden Street, Cambridge, MA 02138, USA5Space Telescope Science Institute, 3700 San Martin Drive, Baltimore, MD 21218, USA
Accepted 2004 July 20. Received 2004 July 19; in original form 2004 June 11
ABSTRACTIsolated galaxies are important because they probe the lowest density regimes inhabited bygalaxies. We define a sample of 36 nearby isolated early-type galaxies for further study.Our isolation criteria require them to have no comparable-mass neighbours within 2 B-bandmagnitudes, 0.67 Mpc in the plane of the sky and 700 km s−1 in recession velocity. New wide-field optical imaging of 10 isolated galaxies with the Anglo-Australian Telescope confirms theirearly-type morphology and relative isolation. We also present imaging of four galaxy groupsas a control sample. The isolated galaxies are shown to be more gravitationally isolated thanthe group galaxies. We find that the isolated early-type galaxies have a mean effective colourof (B − R)e = 1.54 ± 0.14, similar to their high-density counterparts. They reveal a similarcolour–magnitude relation slope and small intrinsic scatter to cluster ellipticals. They alsofollow the Kormendy relation of surface brightness versus size for luminous cluster galaxies.Such properties suggest that the isolated galaxies formed at a similar epoch to cluster galaxies,such that the bulk of their stars are very old. However, our galaxy modelling reveals evidencefor dust lanes, plumes, shells, boxy and disc isophotes in four out of nine galaxies. Thus atleast some isolated galaxies have experienced a recent merger/accretion event, which mayhave induced a small burst of star formation. We derive luminosity functions for the isolatedgalaxies and find a faint slope of −1.2, which is similar to the ‘universal’ slope found in awide variety of environments. We examine the number density distribution of galaxies in thefield of the isolated galaxies. Only the very faintest dwarf galaxies (MR � −15.5) appear to beassociated with the isolated galaxies, whereas any intermediate-luminosity galaxies appear tolie in the background. Finally, we discuss possible formation scenarios for isolated early-typegalaxies. Early epoch formation and a merger/accretion of galaxies are possible explanations.The collapse of a large, virialized group is an unlikely explanation, but that of a poor groupremains viable.
Key words: galaxies: elliptical and lenticular, cD – galaxies: luminosity function, mass function– galaxies: photometry – galaxies: structure.
1 I N T RO D U C T I O N
Early-type galaxies are more commonly found in dense environ-ments, such as clusters and groups, than in the field. Within a clus-ter, the dense core regions are richer with early-type galaxies thanthe lower-density outskirts. This distribution of galaxy morphology
�E-mail: [email protected] (FMR); [email protected] (DAF);[email protected] (MAB); [email protected] (EJOS);[email protected] (PG)
with environment is known as the morphology-density relation(Dressler 1980). In all environments, early-type galaxies show mor-phological fine structures such as tidal tails, shells, dust lanes, discyor boxy components, etc. (e.g. Schweizer et al. 1990). Theoreticalmodels often attempt to explain these morphological structures as aresult of past merging in earlier galaxy formation stages or, alterna-tively, of tidal interactions with close neighbours. In dense clusterenvironments, merging was more likely at earlier epochs when thecluster was still forming and velocity dispersions were low enoughto allow outright mergers.
C© 2004 RAS
852 F. M. Reda et al.
Studies of the stellar populations in early-type galaxies in dif-ferent environments suggest that field galaxies tend to be bluer,and have spectral indices indicating slightly younger mean stellarages than their cluster counterparts (e.g. de Carvalho & Djorgovski1992; Terlevich & Forbes 2002; Girardi et al. 2003). For a sampleof 35 field early-type galaxies at a median redshift of 0.9, Kodama,Bower & Bell (1999) found some of them to be redder in theircolour–magnitude relation (CMR) than that for Coma cluster galax-ies. These authors concluded that at least half of the field early-typegalaxies at these redshifts formed their stars at z > 2. The Kodamaet al. sample of high redshift field galaxies shows a greater scatter inthe CMR than that obtained by Stanford, Eisenhardt & Dickinson(1998) for a cluster at z ∼ 0.9. This suggests a slightly more ex-tended star formation period for early-type galaxies in the field thanin clusters.
Isolated galaxies represent the ‘extreme field’ galaxy populationand thus provide additional insight to those environment related pro-cesses. A carefully selected sample of isolated early-type galaxieswill offer a useful tool to tackle many of the outstanding issues ingalaxy formation. For example, in dense environments, separatingthe effects of secular and environmental evolution (‘nature versusnurture’) is challenging. However, in such extremely low-densityenvironments as those of isolated galaxies, one can eliminate theinteraction processes that affect the evolution of galaxies in high-density environments such as ram-pressure stripping (Gunn & Gott1972), strangulation (Balogh & Morris 2000; Fujita 2004), high-speed galaxy–galaxy encounters and tidal interactions with the clus-ter gravitational potential (Moore et al. 1996; 1999; Moore, Lake &Katz 1998). Previous studies such as Karachentseva (1973), Aars,Marcum & Fanelli (2001), Colbert, Mulchaey & Zabludoff (2001),Kuntschner et al. (2002), Smith, Martinez & Graham (2003) andStocke et al. (2004) have introduced samples of early-type galaxiesthat are in low-density environments or are isolated from neigh-bours. Each study has its own advantages and limitations. In thispaper, we define a new sample of 36 candidate isolated early-typegalaxies with strict isolation conditions to ensure the absence of anystrong tidal effects from a massive neighbour. Using the wide fieldimager (WFI) on the 3.9-m Anglo-Australian Telescope (AAT) weobtained imaging in the B and R filters for a wide area surrounding10 galaxies in the sample. This allows us to study the galaxy surfacedensity distribution and photometric parameters of the faint galaxiesin these fields.
In Section 2, we give a summary of the previous studies of iso-lated early-type galaxies stating their selection criterion and brieflymention their results. Our selection criteria and the sample candi-dates are presented in Section 3. Observations and data reductionfor a subsample of 10 isolated galaxies and a comparison sample,are discussed in Section 4, while their photometric measurementsand modelling, residual images and isophotal shape parameters arediscussed in Section 5. The detections of galaxies in the field arepresented in Section 6. Finally, we discuss the results and possibleformation scenarios for isolated early-type galaxies in Section 7.Throughout this paper we assume a Hubble constant of H0 = 75 kms−1 Mpc−1.
2 P R E V I O U S S T U D I E S O FI S O L AT E D G A L A X I E S
Here we briefly review previous studies of galaxies in low-densityenvironments. Each study had its own advantages and limitations.
Karachentseva (1973) – a catalogue of ∼1000 galaxies with mB <
15.7 and declination > −3◦. The catalogue was chosen from the
Zwicky et al. (1957) catalogue, which is known to be biased againstlow surface brightness galaxies. The environment of each galaxywas inspected using the Palomar Observatory Sky Survey (POSS)for large neighbours. Isolation was established as the absence ofcompanions within 20 galaxy diameters that have less than a ±2 magdifference from the primary galaxy (Stocke et al. 2004). As a resultof saturation, poor resolution or other reasons in the POSS plates,one-half of ellipticals in this catalogue appear to be misclassified(Saucedo-Morales & Bieging 2001).
Reduzzi, Longhetti & Rampazzo (1996) – a sample of 61 galaxieswas selected from ‘The Surface Photometry Catalogue’ of the ESO–Uppsala Galaxies survey (Lauberts & Valentijn 1989). The galaxieswere considered as isolated when the average number of galaxies ofany morphology type was �1.5 within a radius of 1◦. The sample of61 galaxies were imaged for 20 min each at the 0.9-m ESO-Dutchtelescope at La Silla, Chile. They noted that 10 of the galaxies (i.e.16 per cent of their galaxy sample) contained spiral arms or bars,indicating they were of late-type morphology. The isolation of thegalaxies was quantified using the ratio of the separation between thetarget and the nearest galaxy in units of the target galaxy diameter,i.e. S/D25. For galaxies with S/D25 � 20, they examined an ad-ditional parameter, i.e. the luminosity ratio between the target andthe nearest galaxy LB/Ln
B. Using these two parameters S/D25 andLB/Ln
B, they suggested that three galaxies had significant compan-ions. One of these was a misclassified spiral. Based on the S/D25
and LB/LnB values given in their paper, we determined that another
seven galaxies have significant companions. This leaves a total of42 galaxies that can be considered isolated and of early type. Fortheir total sample of 61 galaxies, they found approximately 40 percent to have fine structures such as shells, dust, tidal tails, etc. Con-sidering only the 42 isolated early-type galaxies, this percentageincreases to 52 per cent.
Colbert et al. (2001) – a sample of 30 early-type galaxies, se-lected from the Third Reference Catalog (RC3; de Vaucouleurset al. 1991) catalogue. Galaxies were selected to have no cataloguedneighbours within 1 h−1
100 Mpc and ±1000 km s−1. Imaging of fieldssurrounding each galaxy was then used to confirm the lack of largegalaxies within 200 h−1
100 kpc. However, some of the target galaxiesthemselves had luminosities only slightly greater than the cataloguelimit. This means that some candidate isolated galaxies actuallyhave nearby neighbours of quite similar luminosity. Our examina-tion of this sample with the Digitized Sky Survey (DSS) suggeststhat ∼50 per cent of the candidate isolated galaxies have nearbyneighbours.
Aars et al. (2001) – a sample of nine isolated elliptical galaxiesselected from Karachentseva (1973). Two selection criteria wereadopted for the initial identification of the isolated elliptical candi-dates. First, elliptical galaxies were selected from the NASA Ex-tragalactic Data base (NED) that have separations of 2.5 Mpc fromany other galaxy in the RC3. Secondly, the galaxy should have noneighbours with a known redshift (from NED) brighter than MV =−16.5, within a projected separation of 2.5 Mpc. Only one galaxyin the RC3 and 13 in the Karachentseva (1973) catalogue meet theseisolation criteria. From this sample of 14 galaxies, wide-field CCDimages in the V-band were obtained using the 2.1-m telescope atMcDonald Observatory. The one RC3 galaxy was a southern ob-ject that could not be imaged from McDonald Observatory and wastherefore not included in the final sample. The images were usedto check the isolation of these galaxies and to confirm the mor-phological type. This process identified that three were actuallyspiral galaxies and one was an irregular-type galaxy. These wereexcluded from further study leaving a final sample of nine isolated
C© 2004 RAS, MNRAS 354, 851–869
Isolated galaxies 853
elliptical galaxies. Aars et al. defined a characteristic number densityof projected galaxies on the sky for known loose groups and clusters.Comparing the number density of galaxies detected in the field oftheir nine galaxies with these characteristic densities, they identifiedfive galaxies to be in environments similar to those of loose groups.The environments of the remaining four galaxies were confirmed tobe of low density.
Kuntschner et al. (2002) – a sample of nine nearby early-typegalaxies in low-density environments (strictly speaking this is notan isolated galaxy sample). They were selected from the Hydra–Centaurus Catalogue of Raychaudhury (1989, 1990) to be early type(T < −3) with velocities <7000 km s−1 and apparent magnitudes ofbJ � 16.1. Their sample completeness at this magnitude is ∼50 percent. These galaxies were then required to have a maximum of twoneighbours with bJ � 16.7, within a radius of 1.3 Mpc and a velocitydifference 350 km s−1. The result was a sample of 40 E and S0galaxies. Visual inspection of the DSS images revealed that someof the galaxies have late-type morphologies leaving a sample of30 early-type galaxies in low-density environments. Spectroscopicobservations of 24 galaxies of this sample were obtained at the 2.3-mtelescope at the Siding Spring Observatory, Australia. Kuntschneret al. found that five galaxies have emission-line spectra typicalof spiral galaxies, three have redshifts beyond 7000 km s−1 (theadopted redshift limit in their work), four galaxies were classifiedas group/cluster members and two had spectra of poor signal-to-noise ratio. Kuntschner et al. also obtained optical UVR and near-infrared Ks imaging data for their sample with the CTIO 1.5-mtelescope in Chile. By inspecting the model-subtracted images ofthe sample, one galaxy showed clearly visible spiral arms. In theirfinal sample of nine galaxies, six are members of the Arp & Madore(1987) catalogue of peculiar galaxies, i.e. they have indications ofa past merger. The spectra indicate the presence of young stellarpopulations in several of these galaxies.
Smith et al. (2003) – a sample of 32 isolated early-type galaxies(T < −4). The Lyon–Meudon Extragalactic Data Archive (LEDA)catalogue was used to find ellipticals that have velocities<10 000 km s−1, absolute magnitudes MB � −19 and Galactic lat-itudes b > |25◦|. The LEDA data base was also used to identify thefaint neighbours in the field of the selected galaxies. The isolationcriteria include a B-band magnitude difference >0.7 between theprimary galaxy and the neighbouring galaxies within a projecteddistance of 1 Mpc, or >2.2 mag within 500 kpc. They did not in-clude any redshift information in their isolation criteria. They usedthe published data from the UK and Palomar–Schmidt Sky Surveyplates to select all detected dwarf galaxies with absolute magnitudesof MB � −14.6 in the field of the primary galaxies. The sample ofdwarfs brighter than MB = −16.8 or with low surface brightness areincomplete.
Stocke et al. (2004) – a sample of early-type galaxies were se-lected from the Karachentseva (1973) catalogue. 13 galaxies wereeliminated from the initially selected sample after checking thePOSS plates and finding some comparably sized companions missedby Karachentseva (1973). Some of the sample galaxies are too faintand compact to be classified correctly by POSS. So for 80 per centof the E and 86 per cent of the S0 galaxies, the morphology andisolation were examined by Stocke et al. using optical imagingtaken at Mt Hopkins 0.6-m telescope and from images includedin Adams, Jensen & Stocke (1980). That lead to the elimination ofa further seven galaxies. Thus the final sample consists of 62 E and36 S0 galaxies.
Having decided that some of the previous isolated galaxy sampleswere not suitable for our purpose, we have defined a new sample.
3 S A M P L E S E L E C T I O N
Our sample of candidate isolated early-type galaxies was taken fromthe LEDA. This catalogue contains information on ∼100 000 galax-ies, of which ∼40 000 have enough information recorded to be ofuse in this work. From this sample, we selected galaxies that satisfiedthe following criteria:
(i) morphological type T � −3, i.e. early type;(ii) Virgo corrected recession velocity V � 9000 km s−1, i.e.
within 120 Mpc;(iii) apparent magnitude B � 14.0;(iv) galaxy not listed as a member of a Lyon Galaxy Group
(Garcia 1993).
The restrictions on apparent magnitude and recession velocitywere imposed to minimize the effect of incompleteness in the cata-logue. The LEDA catalogue is known to be 90 per cent complete atB = 14.5 (Amendola et al. 1997), so our sample should be close tobeing 100 per cent statistically complete. The selection process pro-duced 330 galaxies that could be considered as potential candidates.These were compared with the rest of the catalogue and accepted asbeing isolated if they had no neighbours that were within:
(i) 700 km s−1 in recession velocity;(ii) 0.67 Mpc in the plane of the sky; and(iii) 2.0 B-band magnitudes of the isolated galaxy.
These criteria were imposed to ensure that the galaxies did not liein groups or clusters and that any neighbouring galaxies were toosmall and too distant to have any significant effect on the primarygalaxy.
To check the results of this process, all galaxies were comparedwith the NED and the DSS. An NED search in the area within0.67 Mpc of the galaxy identified galaxies, which are not listed inLEDA. We also examined the DSS images for galaxies of similarbrightness to the target, which are not listed in either catalogue. Thisprocess produced 36 candidate isolated early-type galaxies. Basicdata for this sample are listed in Table 1. In this paper we presentimaging for 10 of these galaxies. We have also included IC 4320,which is a part of an interacting isolated galaxy pair (with the spiralESO509-G100). They have a B-magnitude difference of 0.88 andrecession velocity difference of 260 km s−1. The projected distancebetween them is 8.2 arcmin or 212 kpc (Soares et al. 1995). We alsoinclude imaging of a few galaxy groups to act as a comparison to ourisolated galaxies. These are the NGC 3557 (LGG 229), NGC 4697(LGG 314) and NGC 5266 (LGG 356) groups. In our comparisongroup sample, we also have included NGC 3528. Although it is notin the Garcia (1993) group catalogue, it has a luminous late-typegalaxy (NGC 3529) at a projected distance of 5 arcmin or 70 kpc withB-band magnitude difference of 1 and recession velocity differenceof 77 km s−1. There is also a galaxy group (USGC S160) locatedat a projected distance of 14.8 arcmin or 207 kpc from NGC 3528,with a recession velocity difference of 30 km s−1. In addition, thereare many intermediate luminosity galaxies in the field of NGC 3528with no published magnitude and/or velocity. The basic data for ourcomparison sample are summarized in Table 2.
4 O B S E RVAT I O N S A N D DATA R E D U C T I O N
For all galaxies in Tables 2 and 3, B- and R-band images wereobtained using the WFI on the 3.9-m Anglo-Australian Telescopeon 2002 February 17–19. WFI is an 8 CCD imaging mosaic, of
C© 2004 RAS, MNRAS 354, 851–869
854 F. M. Reda et al.
Table 1. The sample of 36 isolated galaxies.
Galaxy Type BT Magnitude Dist. Previous(mag) source (Mpc) samples
NGC 682 E/S0 14.36 LEDA 73NGC 821 E 11.33 LEDA 23 SMG03NGC 1041 E/S0 14.28 LEDA 93NGC 1045 E/S0 13.45 LEDA 60NGC 1132 E 13.03 LEDA 92 CMZ01NGC 1162 E 12.88 LEDA 51 SMG03NGC 2110 E/S0 12.21 LEDA 28 CMZ01NGC 2128 E/S0 12.66 NED 44NGC 2271 E/S0 12.52 LEDA 32NGC 2865 E 11.98 LEDA 35 RLR96NGC 3562 E 12.99 LEDA 93NGC 4240 E 13.31 LEDA 26NGC 4271 E/S0 13.48 NED 66NGC 4555 E 13.05 LEDA 90NGC 6172 E 13.75 LEDA 67 CMZ01NGC 6411 E 12.47 LEDA 53 SMG03NGC 6653 E 13.02 LEDA 66 SMG03NGC 6702 E 12.61 LEDA 66 CMZ01NGC 6776 E 12.51 LEDA 70NGC 6799 E 12.98 LEDA 65 RLR96, CMZ01NGC 6849 E/S0 12.93 LEDA 79 CMZ01NGC 7330 E 12.66 NED 74NGC 7796 E 12.08 LEDA 42MCG-01-27-013 E/S0 14.71 LEDA 121MCG-01-03-018 E/S0 14.13 LEDA 77MCG-02-13-009 E 13.04 LEDA 73MCG-03-26-030 E/S0 14.26 LEDA 119ESO 107-G004 E 12.55 LEDA 39ESO 153-G003 E 13.66 NED 84ESO 194-G021 E/S0 13.34 LEDA 41ESO 218-G002 E 13.66 LEDA 54ESO 318-G021 E 13.24 LEDA 62 RLR96ESO 462-G015 E 12.46 LEDA 77IC 1211 E 13.48 LEDA 78UGC 1735 E 13.42 NED 109UGC 2328 E 13.11 NED 68
Notes. Hubble types are from LEDA. BT is the total B magnitude correctedfor Galactic extinction from Schlegel et al. (1998). The sources of theB magnitude are listed in the next column. Distances obtained using theVirgo corrected recession velocities (from LEDA) with H0 = 75 km s−1
Mpc−1. Some galaxies were listed in previous samples such as Reduzziet al. (1996, RLR96), Colbert et al. (2001, CMZ01) and Smith et al. (2003,SMG03).
Table 2. The comparison sample.
Galaxy Type BT Magnitude Dist. Environment(mag) source (Mpc)
IC 4320 S0 13.85 NED 89 Isolated pairNGC 3528 S0 12.88 LEDA 48 GroupNGC 3557 E 10.79 NED 38 GroupNGC 4697 E 10.02 LEDA 17 GroupNGC 5266 E/S0 11.17 LEDA 38 Group
Notes. Same as Table 1 for the comparison sample. The table includes theenvironment of each galaxy.
2048 × 4096 pixels thinned back-illuminated CCDs with a pixelscale of 0.229 arcsec pixel−1 giving a field of view of 30.6 × 30.6arcmin2. Over the three nights there was some partial cloud andtypical seeing conditions of approximately 2.0 arcsec in B and 1.5
Table 3. Observational data of the combined sample.
Galaxy AB AR Exp. time(mag) (mag) (s)
NGC 1045 0.18 0.11 (B) 1 × 240(R) 1 × 120
NGC 1132 0.27 0.17 (B) 1 × 240(R) 1 × 120
NGC 2110 1.62 1.00 (B) 1 × 240(R) 1 × 120
NGC 2865 0.36 0.22 (B) 1 × 240(R) 1 × 120
NGC 4240 0.23 0.15 (B) 1 × 240(R) 1 × 120
NGC 6172 0.51 0.31 (B) 1 × 240(R) 1 × 120
MCG-01-27-013 0.19 0.12 (B) 2 × 240(R) 2 × 120
MCG-03-26-030 0.22 0.14 (B) 1 × 240(R) 1 × 120
ESO218-G002 0.75 0.46 (B) 2 × 120(R) 2 × 60
ESO318-G021 0.35 0.22 (B) 1 × 120(R) 1 × 60
IC 4320 0.26 0.16 (B) 1 × 240(R) 1 × 120
NGC 3528 0.17 0.11 (B) 1 × 240(R) 1 × 120
NGC 3557 0.43 0.26 (B) 1 × 60, 3 × 600(R) 1 × 60, 3 × 420
NGC 4697 0.13 0.08 (B) 1 × 60, 3 × 600(R) 1 × 60, 3 × 420
NGC 5266 0.38 0.24 (B) 2 × 240(R) 2 × 120
Notes. The Galactic extinctions AB and AR are from Schlegel et al. (1998).The table has been divided into three sections based on the environ-ment.
arcsec in R. The exposure times for the galaxies and the number ofobservations are listed in Table 3. In addition to the galaxies, sev-eral standard star fields from Landolt (1992) were obtained. Theseconsisted of 10 s exposures for both B and R bands.
All galaxy and standard star images were reduced in an identicalmanner using IRAF tasks. Six of the WFI CCDs have one or two badcolumns, which were corrected by interpolating the pixel values onboth sides of the bad column. Data reduction included subtraction ofthe overscan regions. These regions were then trimmed before cor-recting the frames by master bias subtraction, dark frame subtractionand flat-fielding using combined dome flats. The final images are flatto �2 per cent. We multiplicatively corrected for the different gainsbetween CCDs using measurements of the mean sky level in eachCCD, relative to the ‘best’ CCD (i.e. CCD6, which is cosmeticallythe cleanest).
After determining an optimal aperture size of 10 pixels (∼2.3 arc-sec), based on a curve-of-growth type analysis, raw magnitudes ofbetween 7 and 25 stars were obtained for each filter using the IRAF
task QPHOT. The zero-point for each filter was determined by a sim-ple linear fit to the stellar raw magnitude versus their colours pub-lished by Landolt (1992) and corrected for airmass. The atmosphericextinction coefficients used were kB = 0.22 and kR = 0.08 mag air-mass−1. The final photometric zero-points are ZB = 25.19 ± 0.06and ZR = 25.93 ± 0.04.
C© 2004 RAS, MNRAS 354, 851–869
Isolated galaxies 855
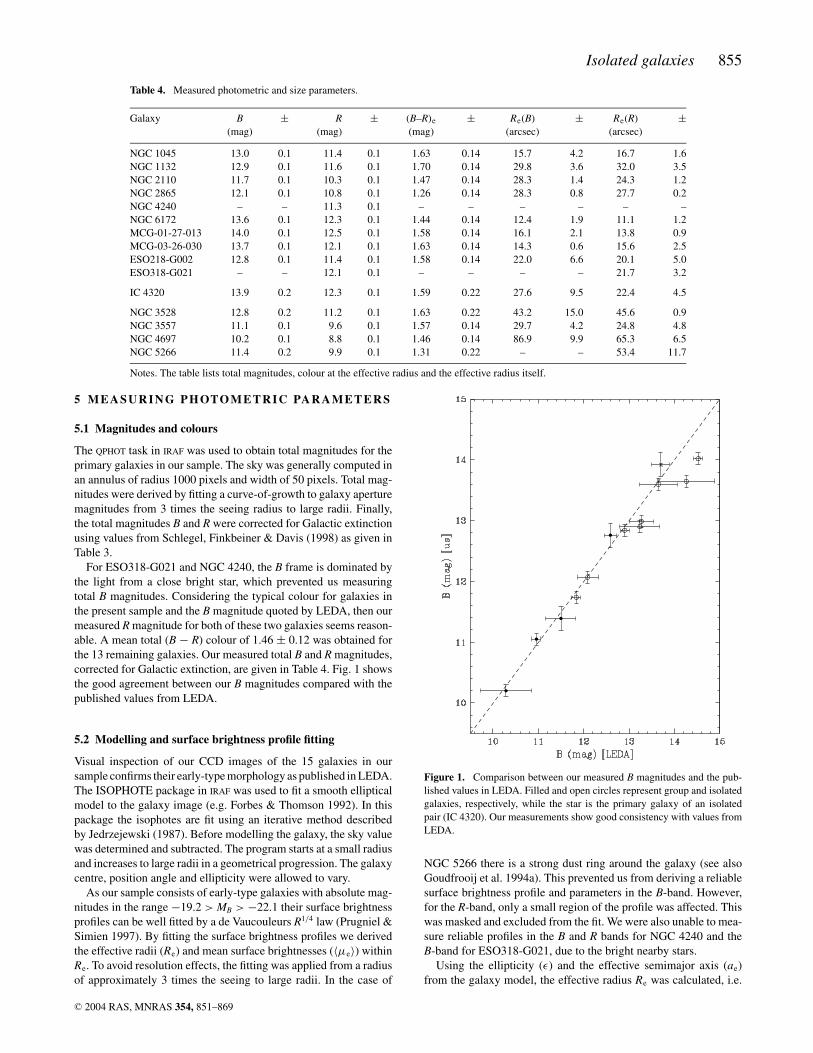
Table 4. Measured photometric and size parameters.
Galaxy B ± R ± (B–R)e ± Re(B) ± Re(R) ±(mag) (mag) (mag) (arcsec) (arcsec)
NGC 1045 13.0 0.1 11.4 0.1 1.63 0.14 15.7 4.2 16.7 1.6NGC 1132 12.9 0.1 11.6 0.1 1.70 0.14 29.8 3.6 32.0 3.5NGC 2110 11.7 0.1 10.3 0.1 1.47 0.14 28.3 1.4 24.3 1.2NGC 2865 12.1 0.1 10.8 0.1 1.26 0.14 28.3 0.8 27.7 0.2NGC 4240 – – 11.3 0.1 – – – – – –NGC 6172 13.6 0.1 12.3 0.1 1.44 0.14 12.4 1.9 11.1 1.2MCG-01-27-013 14.0 0.1 12.5 0.1 1.58 0.14 16.1 2.1 13.8 0.9MCG-03-26-030 13.7 0.1 12.1 0.1 1.63 0.14 14.3 0.6 15.6 2.5ESO218-G002 12.8 0.1 11.4 0.1 1.58 0.14 22.0 6.6 20.1 5.0ESO318-G021 – – 12.1 0.1 – – – – 21.7 3.2
IC 4320 13.9 0.2 12.3 0.1 1.59 0.22 27.6 9.5 22.4 4.5
NGC 3528 12.8 0.2 11.2 0.1 1.63 0.22 43.2 15.0 45.6 0.9NGC 3557 11.1 0.1 9.6 0.1 1.57 0.14 29.7 4.2 24.8 4.8NGC 4697 10.2 0.1 8.8 0.1 1.46 0.14 86.9 9.9 65.3 6.5NGC 5266 11.4 0.2 9.9 0.1 1.31 0.22 – – 53.4 11.7
Notes. The table lists total magnitudes, colour at the effective radius and the effective radius itself.
5 M E A S U R I N G P H OTO M E T R I C PA R A M E T E R S
5.1 Magnitudes and colours
The QPHOT task in IRAF was used to obtain total magnitudes for theprimary galaxies in our sample. The sky was generally computed inan annulus of radius 1000 pixels and width of 50 pixels. Total mag-nitudes were derived by fitting a curve-of-growth to galaxy aperturemagnitudes from 3 times the seeing radius to large radii. Finally,the total magnitudes B and R were corrected for Galactic extinctionusing values from Schlegel, Finkbeiner & Davis (1998) as given inTable 3.
For ESO318-G021 and NGC 4240, the B frame is dominated bythe light from a close bright star, which prevented us measuringtotal B magnitudes. Considering the typical colour for galaxies inthe present sample and the B magnitude quoted by LEDA, then ourmeasured R magnitude for both of these two galaxies seems reason-able. A mean total (B − R) colour of 1.46 ± 0.12 was obtained forthe 13 remaining galaxies. Our measured total B and R magnitudes,corrected for Galactic extinction, are given in Table 4. Fig. 1 showsthe good agreement between our B magnitudes compared with thepublished values from LEDA.
5.2 Modelling and surface brightness profile fitting
Visual inspection of our CCD images of the 15 galaxies in oursample confirms their early-type morphology as published in LEDA.The ISOPHOTE package in IRAF was used to fit a smooth ellipticalmodel to the galaxy image (e.g. Forbes & Thomson 1992). In thispackage the isophotes are fit using an iterative method describedby Jedrzejewski (1987). Before modelling the galaxy, the sky valuewas determined and subtracted. The program starts at a small radiusand increases to large radii in a geometrical progression. The galaxycentre, position angle and ellipticity were allowed to vary.
As our sample consists of early-type galaxies with absolute mag-nitudes in the range −19.2 > MB > −22.1 their surface brightnessprofiles can be well fitted by a de Vaucouleurs R1/4 law (Prugniel &Simien 1997). By fitting the surface brightness profiles we derivedthe effective radii (Re) and mean surface brightnesses (〈µe〉) withinRe. To avoid resolution effects, the fitting was applied from a radiusof approximately 3 times the seeing to large radii. In the case of
Figure 1. Comparison between our measured B magnitudes and the pub-lished values in LEDA. Filled and open circles represent group and isolatedgalaxies, respectively, while the star is the primary galaxy of an isolatedpair (IC 4320). Our measurements show good consistency with values fromLEDA.
NGC 5266 there is a strong dust ring around the galaxy (see alsoGoudfrooij et al. 1994a). This prevented us from deriving a reliablesurface brightness profile and parameters in the B-band. However,for the R-band, only a small region of the profile was affected. Thiswas masked and excluded from the fit. We were also unable to mea-sure reliable profiles in the B and R bands for NGC 4240 and theB-band for ESO318-G021, due to the bright nearby stars.
Using the ellipticity (ε) and the effective semimajor axis (ae)from the galaxy model, the effective radius Re was calculated, i.e.
C© 2004 RAS, MNRAS 354, 851–869
856 F. M. Reda et al.
0 20 40 60 800
20
40
60
80
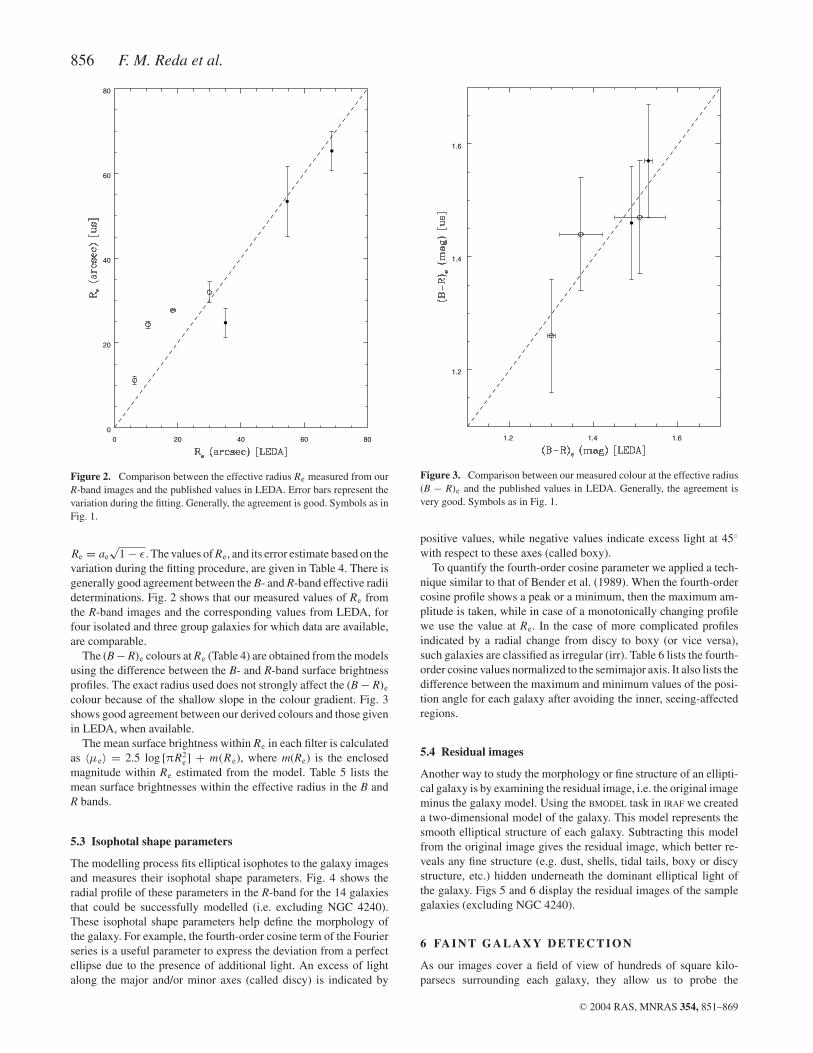
Figure 2. Comparison between the effective radius Re measured from ourR-band images and the published values in LEDA. Error bars represent thevariation during the fitting. Generally, the agreement is good. Symbols as inFig. 1.
Re = ae
√1 − ε. The values of Re, and its error estimate based on the
variation during the fitting procedure, are given in Table 4. There isgenerally good agreement between the B- and R-band effective radiideterminations. Fig. 2 shows that our measured values of Re fromthe R-band images and the corresponding values from LEDA, forfour isolated and three group galaxies for which data are available,are comparable.
The (B − R)e colours at Re (Table 4) are obtained from the modelsusing the difference between the B- and R-band surface brightnessprofiles. The exact radius used does not strongly affect the (B − R)e
colour because of the shallow slope in the colour gradient. Fig. 3shows good agreement between our derived colours and those givenin LEDA, when available.
The mean surface brightness within Re in each filter is calculatedas 〈µe〉 = 2.5 log [πR2
e] + m(R e), where m(Re) is the enclosedmagnitude within Re estimated from the model. Table 5 lists themean surface brightnesses within the effective radius in the B andR bands.
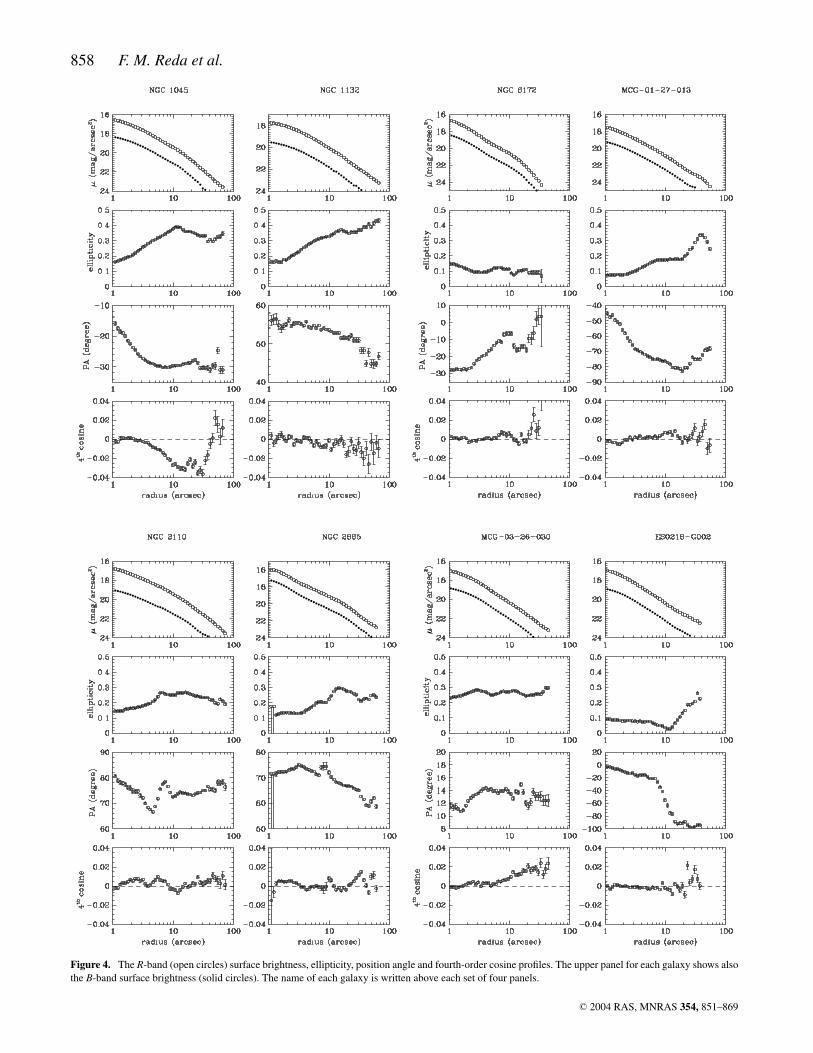
5.3 Isophotal shape parameters
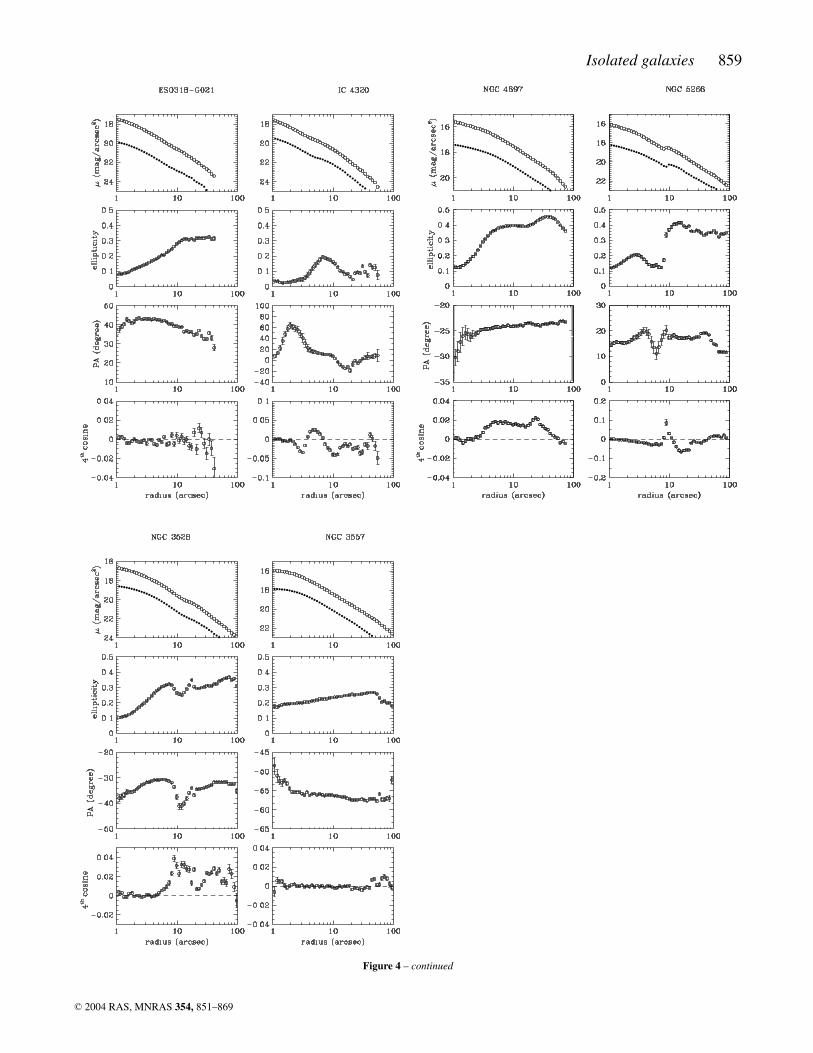
The modelling process fits elliptical isophotes to the galaxy imagesand measures their isophotal shape parameters. Fig. 4 shows theradial profile of these parameters in the R-band for the 14 galaxiesthat could be successfully modelled (i.e. excluding NGC 4240).These isophotal shape parameters help define the morphology ofthe galaxy. For example, the fourth-order cosine term of the Fourierseries is a useful parameter to express the deviation from a perfectellipse due to the presence of additional light. An excess of lightalong the major and/or minor axes (called discy) is indicated by
1.2 1.4 1.6
1.2
1.4
1.6
Figure 3. Comparison between our measured colour at the effective radius(B − R)e and the published values in LEDA. Generally, the agreement isvery good. Symbols as in Fig. 1.
positive values, while negative values indicate excess light at 45◦
with respect to these axes (called boxy).To quantify the fourth-order cosine parameter we applied a tech-
nique similar to that of Bender et al. (1989). When the fourth-ordercosine profile shows a peak or a minimum, then the maximum am-plitude is taken, while in case of a monotonically changing profilewe use the value at Re. In the case of more complicated profilesindicated by a radial change from discy to boxy (or vice versa),such galaxies are classified as irregular (irr). Table 6 lists the fourth-order cosine values normalized to the semimajor axis. It also lists thedifference between the maximum and minimum values of the posi-tion angle for each galaxy after avoiding the inner, seeing-affectedregions.
5.4 Residual images
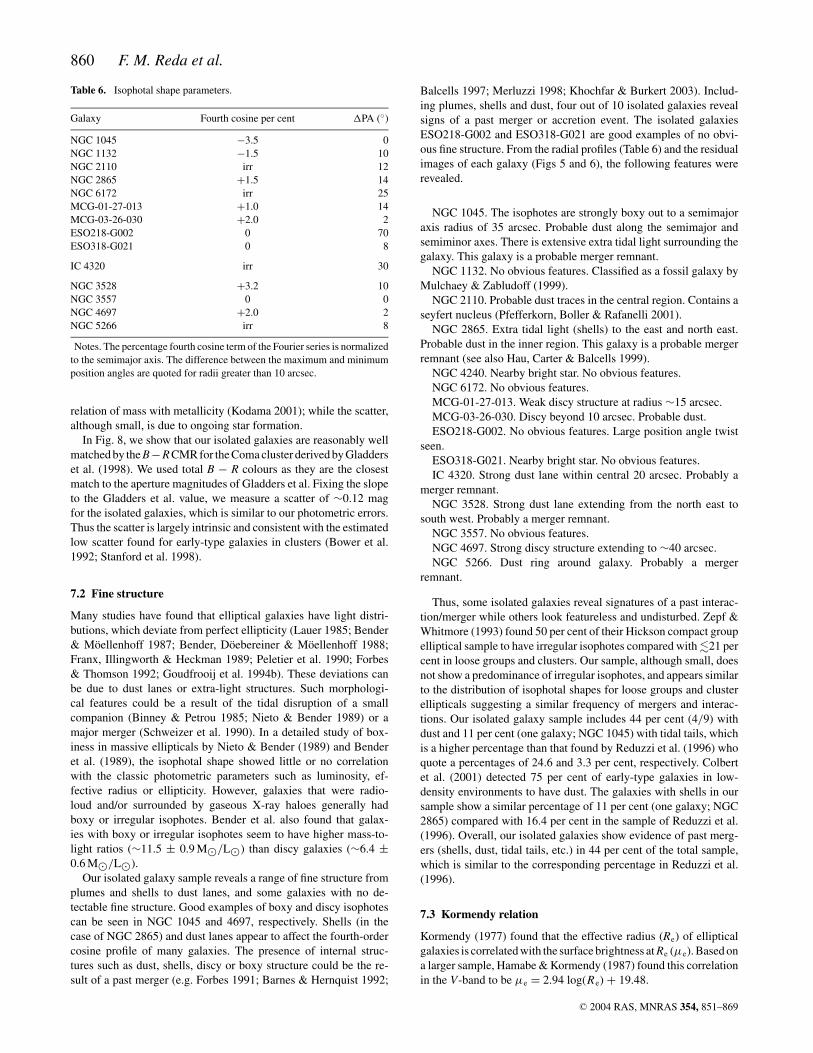
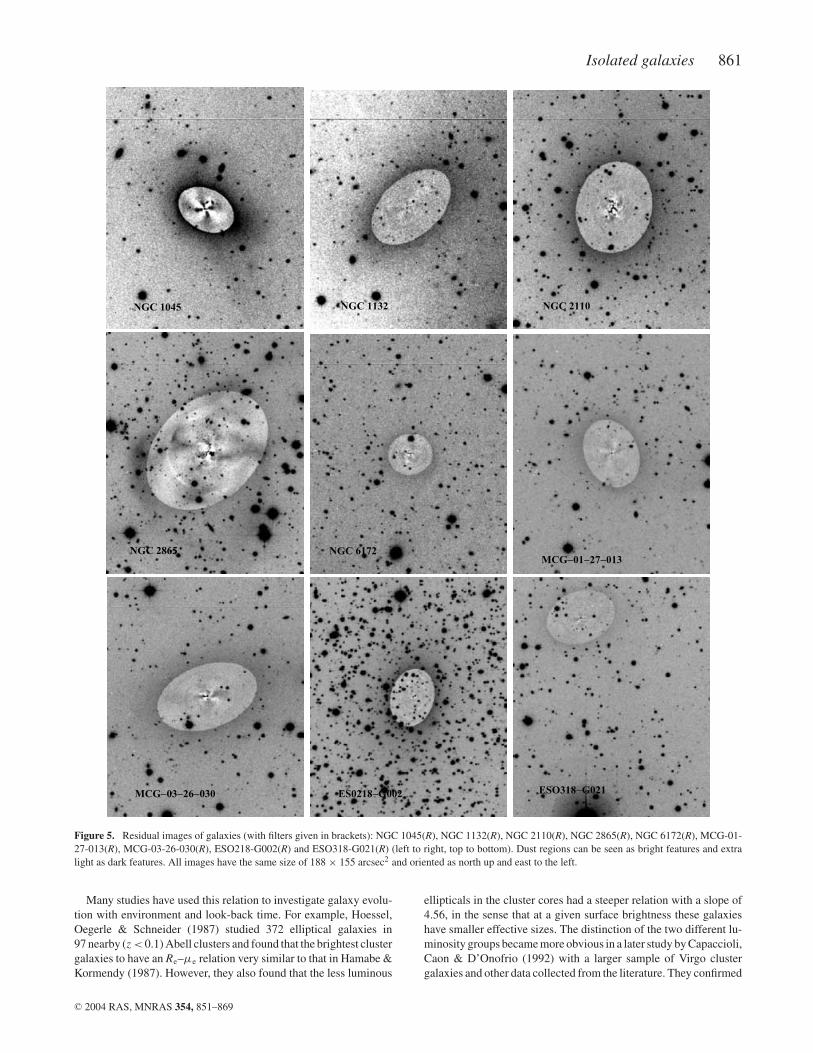
Another way to study the morphology or fine structure of an ellipti-cal galaxy is by examining the residual image, i.e. the original imageminus the galaxy model. Using the BMODEL task in IRAF we createda two-dimensional model of the galaxy. This model represents thesmooth elliptical structure of each galaxy. Subtracting this modelfrom the original image gives the residual image, which better re-veals any fine structure (e.g. dust, shells, tidal tails, boxy or discystructure, etc.) hidden underneath the dominant elliptical light ofthe galaxy. Figs 5 and 6 display the residual images of the samplegalaxies (excluding NGC 4240).
6 FA I N T G A L A X Y D E T E C T I O N
As our images cover a field of view of hundreds of square kilo-parsecs surrounding each galaxy, they allow us to probe the
C© 2004 RAS, MNRAS 354, 851–869
Isolated galaxies 857
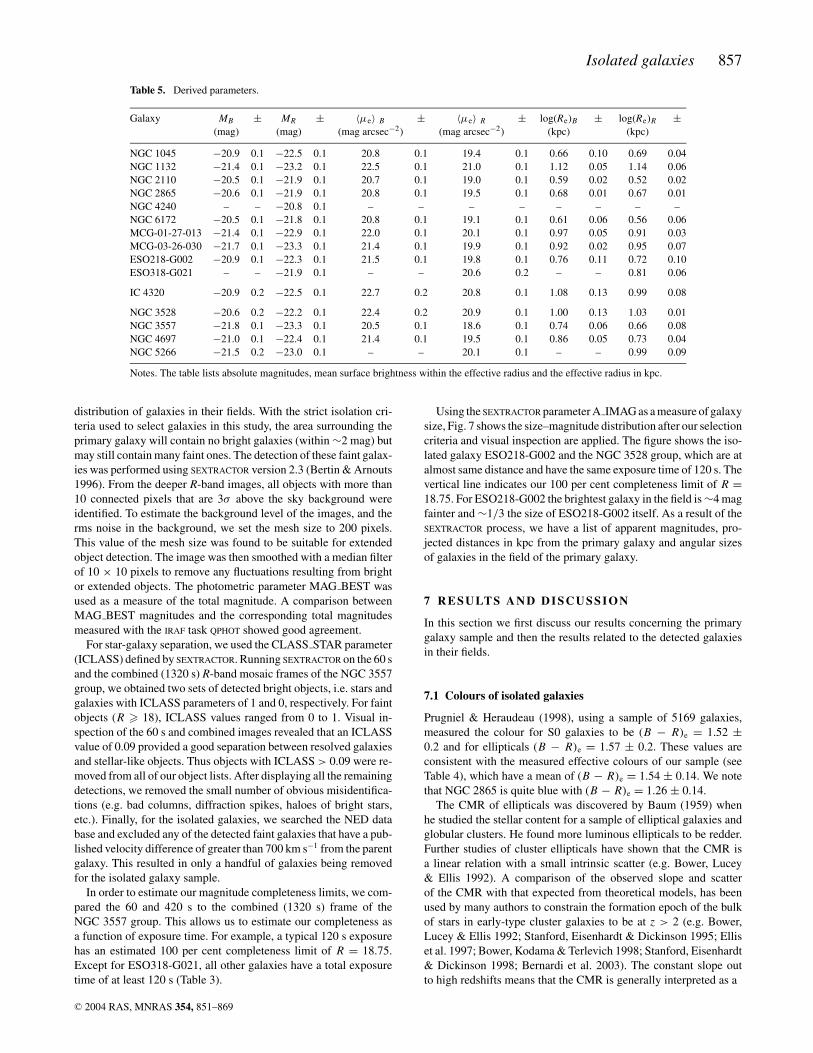
Table 5. Derived parameters.
Galaxy MB ± MR ± 〈µe〉 B ± 〈µe〉 R ± log(Re)B ± log(Re)R ±(mag) (mag) (mag arcsec−2) (mag arcsec−2) (kpc) (kpc)
NGC 1045 −20.9 0.1 −22.5 0.1 20.8 0.1 19.4 0.1 0.66 0.10 0.69 0.04NGC 1132 −21.4 0.1 −23.2 0.1 22.5 0.1 21.0 0.1 1.12 0.05 1.14 0.06NGC 2110 −20.5 0.1 −21.9 0.1 20.7 0.1 19.0 0.1 0.59 0.02 0.52 0.02NGC 2865 −20.6 0.1 −21.9 0.1 20.8 0.1 19.5 0.1 0.68 0.01 0.67 0.01NGC 4240 – – −20.8 0.1 – – – – – – – –NGC 6172 −20.5 0.1 −21.8 0.1 20.8 0.1 19.1 0.1 0.61 0.06 0.56 0.06MCG-01-27-013 −21.4 0.1 −22.9 0.1 22.0 0.1 20.1 0.1 0.97 0.05 0.91 0.03MCG-03-26-030 −21.7 0.1 −23.3 0.1 21.4 0.1 19.9 0.1 0.92 0.02 0.95 0.07ESO218-G002 −20.9 0.1 −22.3 0.1 21.5 0.1 19.8 0.1 0.76 0.11 0.72 0.10ESO318-G021 – – −21.9 0.1 – – 20.6 0.2 – – 0.81 0.06
IC 4320 −20.9 0.2 −22.5 0.1 22.7 0.2 20.8 0.1 1.08 0.13 0.99 0.08
NGC 3528 −20.6 0.2 −22.2 0.1 22.4 0.2 20.9 0.1 1.00 0.13 1.03 0.01NGC 3557 −21.8 0.1 −23.3 0.1 20.5 0.1 18.6 0.1 0.74 0.06 0.66 0.08NGC 4697 −21.0 0.1 −22.4 0.1 21.4 0.1 19.5 0.1 0.86 0.05 0.73 0.04NGC 5266 −21.5 0.2 −23.0 0.1 – – 20.1 0.1 – – 0.99 0.09
Notes. The table lists absolute magnitudes, mean surface brightness within the effective radius and the effective radius in kpc.
distribution of galaxies in their fields. With the strict isolation cri-teria used to select galaxies in this study, the area surrounding theprimary galaxy will contain no bright galaxies (within ∼2 mag) butmay still contain many faint ones. The detection of these faint galax-ies was performed using SEXTRACTOR version 2.3 (Bertin & Arnouts1996). From the deeper R-band images, all objects with more than10 connected pixels that are 3σ above the sky background wereidentified. To estimate the background level of the images, and therms noise in the background, we set the mesh size to 200 pixels.This value of the mesh size was found to be suitable for extendedobject detection. The image was then smoothed with a median filterof 10 × 10 pixels to remove any fluctuations resulting from brightor extended objects. The photometric parameter MAG BEST wasused as a measure of the total magnitude. A comparison betweenMAG BEST magnitudes and the corresponding total magnitudesmeasured with the IRAF task QPHOT showed good agreement.
For star-galaxy separation, we used the CLASS STAR parameter(ICLASS) defined by SEXTRACTOR. Running SEXTRACTOR on the 60 sand the combined (1320 s) R-band mosaic frames of the NGC 3557group, we obtained two sets of detected bright objects, i.e. stars andgalaxies with ICLASS parameters of 1 and 0, respectively. For faintobjects (R � 18), ICLASS values ranged from 0 to 1. Visual in-spection of the 60 s and combined images revealed that an ICLASSvalue of 0.09 provided a good separation between resolved galaxiesand stellar-like objects. Thus objects with ICLASS > 0.09 were re-moved from all of our object lists. After displaying all the remainingdetections, we removed the small number of obvious misidentifica-tions (e.g. bad columns, diffraction spikes, haloes of bright stars,etc.). Finally, for the isolated galaxies, we searched the NED database and excluded any of the detected faint galaxies that have a pub-lished velocity difference of greater than 700 km s−1 from the parentgalaxy. This resulted in only a handful of galaxies being removedfor the isolated galaxy sample.
In order to estimate our magnitude completeness limits, we com-pared the 60 and 420 s to the combined (1320 s) frame of theNGC 3557 group. This allows us to estimate our completeness asa function of exposure time. For example, a typical 120 s exposurehas an estimated 100 per cent completeness limit of R = 18.75.Except for ESO318-G021, all other galaxies have a total exposuretime of at least 120 s (Table 3).
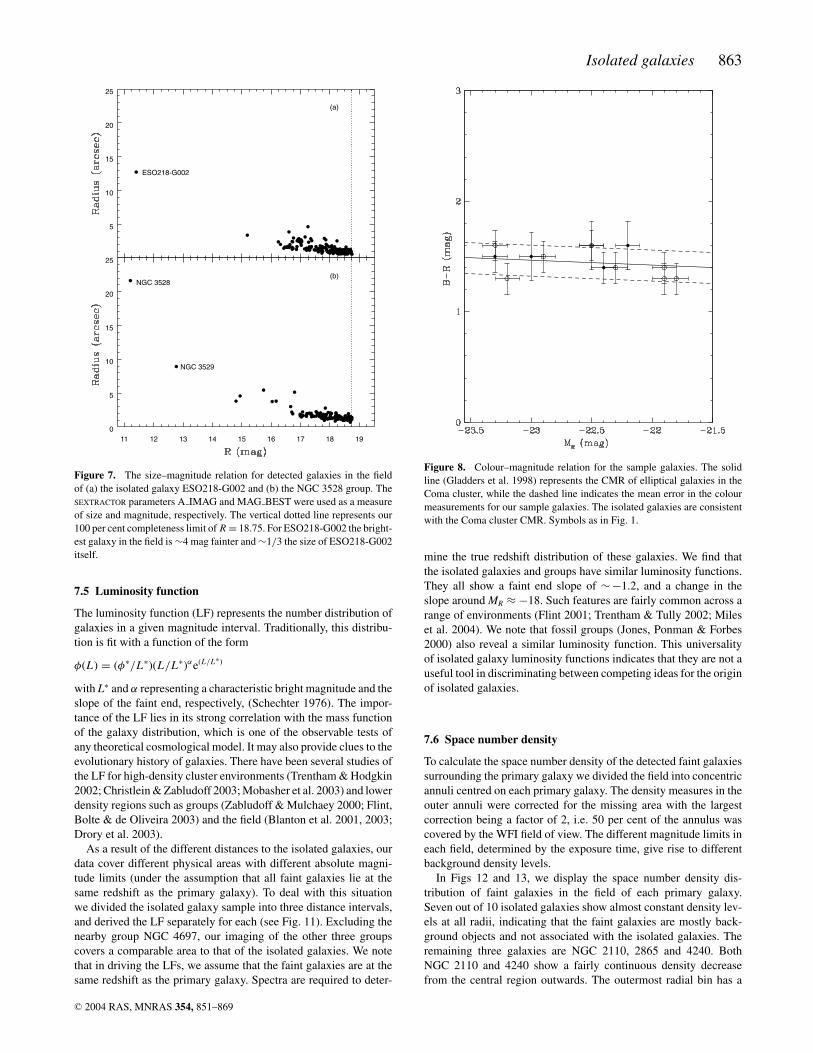
Using the SEXTRACTOR parameter A IMAG as a measure of galaxysize, Fig. 7 shows the size–magnitude distribution after our selectioncriteria and visual inspection are applied. The figure shows the iso-lated galaxy ESO218-G002 and the NGC 3528 group, which are atalmost same distance and have the same exposure time of 120 s. Thevertical line indicates our 100 per cent completeness limit of R =18.75. For ESO218-G002 the brightest galaxy in the field is ∼4 magfainter and ∼1/3 the size of ESO218-G002 itself. As a result of theSEXTRACTOR process, we have a list of apparent magnitudes, pro-jected distances in kpc from the primary galaxy and angular sizesof galaxies in the field of the primary galaxy.
7 R E S U LT S A N D D I S C U S S I O N
In this section we first discuss our results concerning the primarygalaxy sample and then the results related to the detected galaxiesin their fields.
7.1 Colours of isolated galaxies
Prugniel & Heraudeau (1998), using a sample of 5169 galaxies,measured the colour for S0 galaxies to be (B − R)e = 1.52 ±0.2 and for ellipticals (B − R)e = 1.57 ± 0.2. These values areconsistent with the measured effective colours of our sample (seeTable 4), which have a mean of (B − R)e = 1.54 ± 0.14. We notethat NGC 2865 is quite blue with (B − R)e = 1.26 ± 0.14.
The CMR of ellipticals was discovered by Baum (1959) whenhe studied the stellar content for a sample of elliptical galaxies andglobular clusters. He found more luminous ellipticals to be redder.Further studies of cluster ellipticals have shown that the CMR isa linear relation with a small intrinsic scatter (e.g. Bower, Lucey& Ellis 1992). A comparison of the observed slope and scatterof the CMR with that expected from theoretical models, has beenused by many authors to constrain the formation epoch of the bulkof stars in early-type cluster galaxies to be at z > 2 (e.g. Bower,Lucey & Ellis 1992; Stanford, Eisenhardt & Dickinson 1995; Elliset al. 1997; Bower, Kodama & Terlevich 1998; Stanford, Eisenhardt& Dickinson 1998; Bernardi et al. 2003). The constant slope outto high redshifts means that the CMR is generally interpreted as a
C© 2004 RAS, MNRAS 354, 851–869
858 F. M. Reda et al.
Figure 4. The R-band (open circles) surface brightness, ellipticity, position angle and fourth-order cosine profiles. The upper panel for each galaxy shows alsothe B-band surface brightness (solid circles). The name of each galaxy is written above each set of four panels.
C© 2004 RAS, MNRAS 354, 851–869
Isolated galaxies 859
Figure 4 – continued
C© 2004 RAS, MNRAS 354, 851–869
860 F. M. Reda et al.
Table 6. Isophotal shape parameters.
Galaxy Fourth cosine per cent �PA (◦)
NGC 1045 −3.5 0NGC 1132 −1.5 10NGC 2110 irr 12NGC 2865 +1.5 14NGC 6172 irr 25MCG-01-27-013 +1.0 14MCG-03-26-030 +2.0 2ESO218-G002 0 70ESO318-G021 0 8
IC 4320 irr 30
NGC 3528 +3.2 10NGC 3557 0 0NGC 4697 +2.0 2NGC 5266 irr 8
Notes. The percentage fourth cosine term of the Fourier series is normalizedto the semimajor axis. The difference between the maximum and minimumposition angles are quoted for radii greater than 10 arcsec.
relation of mass with metallicity (Kodama 2001); while the scatter,although small, is due to ongoing star formation.
In Fig. 8, we show that our isolated galaxies are reasonably wellmatched by the B−R CMR for the Coma cluster derived by Gladderset al. (1998). We used total B − R colours as they are the closestmatch to the aperture magnitudes of Gladders et al. Fixing the slopeto the Gladders et al. value, we measure a scatter of ∼0.12 magfor the isolated galaxies, which is similar to our photometric errors.Thus the scatter is largely intrinsic and consistent with the estimatedlow scatter found for early-type galaxies in clusters (Bower et al.1992; Stanford et al. 1998).
7.2 Fine structure
Many studies have found that elliptical galaxies have light distri-butions, which deviate from perfect ellipticity (Lauer 1985; Bender& Moellenhoff 1987; Bender, Doebereiner & Moellenhoff 1988;Franx, Illingworth & Heckman 1989; Peletier et al. 1990; Forbes& Thomson 1992; Goudfrooij et al. 1994b). These deviations canbe due to dust lanes or extra-light structures. Such morphologi-cal features could be a result of the tidal disruption of a smallcompanion (Binney & Petrou 1985; Nieto & Bender 1989) or amajor merger (Schweizer et al. 1990). In a detailed study of box-iness in massive ellipticals by Nieto & Bender (1989) and Benderet al. (1989), the isophotal shape showed little or no correlationwith the classic photometric parameters such as luminosity, ef-fective radius or ellipticity. However, galaxies that were radio-loud and/or surrounded by gaseous X-ray haloes generally hadboxy or irregular isophotes. Bender et al. also found that galax-ies with boxy or irregular isophotes seem to have higher mass-to-light ratios (∼11.5 ± 0.9 M�/L�) than discy galaxies (∼6.4 ±0.6 M�/L�).
Our isolated galaxy sample reveals a range of fine structure fromplumes and shells to dust lanes, and some galaxies with no de-tectable fine structure. Good examples of boxy and discy isophotescan be seen in NGC 1045 and 4697, respectively. Shells (in thecase of NGC 2865) and dust lanes appear to affect the fourth-ordercosine profile of many galaxies. The presence of internal struc-tures such as dust, shells, discy or boxy structure could be the re-sult of a past merger (e.g. Forbes 1991; Barnes & Hernquist 1992;
Balcells 1997; Merluzzi 1998; Khochfar & Burkert 2003). Includ-ing plumes, shells and dust, four out of 10 isolated galaxies revealsigns of a past merger or accretion event. The isolated galaxiesESO218-G002 and ESO318-G021 are good examples of no obvi-ous fine structure. From the radial profiles (Table 6) and the residualimages of each galaxy (Figs 5 and 6), the following features wererevealed.
NGC 1045. The isophotes are strongly boxy out to a semimajoraxis radius of 35 arcsec. Probable dust along the semimajor andsemiminor axes. There is extensive extra tidal light surrounding thegalaxy. This galaxy is a probable merger remnant.
NGC 1132. No obvious features. Classified as a fossil galaxy byMulchaey & Zabludoff (1999).
NGC 2110. Probable dust traces in the central region. Contains aseyfert nucleus (Pfefferkorn, Boller & Rafanelli 2001).
NGC 2865. Extra tidal light (shells) to the east and north east.Probable dust in the inner region. This galaxy is a probable mergerremnant (see also Hau, Carter & Balcells 1999).
NGC 4240. Nearby bright star. No obvious features.NGC 6172. No obvious features.MCG-01-27-013. Weak discy structure at radius ∼15 arcsec.MCG-03-26-030. Discy beyond 10 arcsec. Probable dust.ESO218-G002. No obvious features. Large position angle twist
seen.ESO318-G021. Nearby bright star. No obvious features.IC 4320. Strong dust lane within central 20 arcsec. Probably a
merger remnant.NGC 3528. Strong dust lane extending from the north east to
south west. Probably a merger remnant.NGC 3557. No obvious features.NGC 4697. Strong discy structure extending to ∼40 arcsec.NGC 5266. Dust ring around galaxy. Probably a merger
remnant.
Thus, some isolated galaxies reveal signatures of a past interac-tion/merger while others look featureless and undisturbed. Zepf &Whitmore (1993) found 50 per cent of their Hickson compact groupelliptical sample to have irregular isophotes compared with �21 percent in loose groups and clusters. Our sample, although small, doesnot show a predominance of irregular isophotes, and appears similarto the distribution of isophotal shapes for loose groups and clusterellipticals suggesting a similar frequency of mergers and interac-tions. Our isolated galaxy sample includes 44 per cent (4/9) withdust and 11 per cent (one galaxy; NGC 1045) with tidal tails, whichis a higher percentage than that found by Reduzzi et al. (1996) whoquote a percentages of 24.6 and 3.3 per cent, respectively. Colbertet al. (2001) detected 75 per cent of early-type galaxies in low-density environments to have dust. The galaxies with shells in oursample show a similar percentage of 11 per cent (one galaxy; NGC2865) compared with 16.4 per cent in the sample of Reduzzi et al.(1996). Overall, our isolated galaxies show evidence of past merg-ers (shells, dust, tidal tails, etc.) in 44 per cent of the total sample,which is similar to the corresponding percentage in Reduzzi et al.(1996).
7.3 Kormendy relation
Kormendy (1977) found that the effective radius (Re) of ellipticalgalaxies is correlated with the surface brightness at Re (µe). Based ona larger sample, Hamabe & Kormendy (1987) found this correlationin the V-band to be µe = 2.94 log(R e) + 19.48.
C© 2004 RAS, MNRAS 354, 851–869
Isolated galaxies 861
NGC 1045 NGC 1132 NGC 2110
NGC 2865 NGC 6172MCG−01−27−013
MCG−03−26−030 ES0218−G002 ESO318−G021
Figure 5. Residual images of galaxies (with filters given in brackets): NGC 1045(R), NGC 1132(R), NGC 2110(R), NGC 2865(R), NGC 6172(R), MCG-01-27-013(R), MCG-03-26-030(R), ESO218-G002(R) and ESO318-G021(R) (left to right, top to bottom). Dust regions can be seen as bright features and extralight as dark features. All images have the same size of 188 × 155 arcsec2 and oriented as north up and east to the left.
Many studies have used this relation to investigate galaxy evolu-tion with environment and look-back time. For example, Hoessel,Oegerle & Schneider (1987) studied 372 elliptical galaxies in97 nearby (z < 0.1) Abell clusters and found that the brightest clustergalaxies to have an Re–µe relation very similar to that in Hamabe &Kormendy (1987). However, they also found that the less luminous
ellipticals in the cluster cores had a steeper relation with a slope of4.56, in the sense that at a given surface brightness these galaxieshave smaller effective sizes. The distinction of the two different lu-minosity groups became more obvious in a later study by Capaccioli,Caon & D’Onofrio (1992) with a larger sample of Virgo clustergalaxies and other data collected from the literature. They confirmed
C© 2004 RAS, MNRAS 354, 851–869
862 F. M. Reda et al.
IC 4320 NGC 3528 NGC 3557
NGC 4697 NGC 5266
Figure 6. Residual images of IC 4320(B), NGC 3528(B), NGC 3557(R), NGC 4697(R) and NGC 5266(B) (left to right, top to bottom). Orientations and sizesas in Fig. 5.
that, unlike the low luminosity galaxies, the brightest cluster galax-ies fit perfectly on the Hamabe & Kormendy relation. In a recentstudy by Khosroshahi et al. (2004), the Kormendy relation was ex-plored for early-type galaxies in groups that have a range of X-rayluminosities. They found that group early-type galaxies show a sim-ilar relation to those in clusters. Up to redshifts of z ∼ 1.5, ellipticalgalaxies in clusters show a similar relation to cluster galaxies inthe local universe, with no significant change in the slope or scat-ter (Ziegler et al. 1999; Waddington et al. 2002; La Barbera et al.2003).
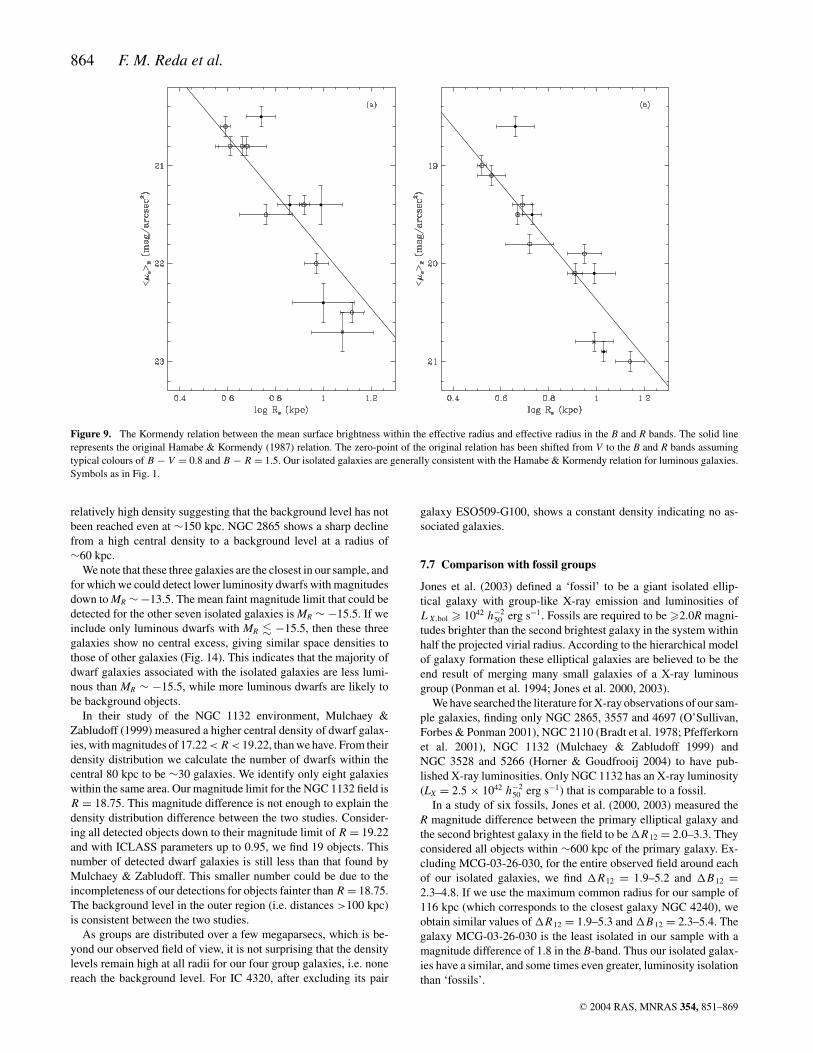
The distribution of our isolated galaxies in the log(R e) – 〈µe〉plane, where 〈µe〉 is the mean surface brightness within Re,is shown in Fig. 9. Using the relation between µe and 〈µe〉(Graham & Colless 1997) and assuming typical colours of B − V =0.8 and B − R = 1.5, we reproduce the Hamabe & Kormendy rela-tion in the B and R bands in Fig. 9. Our isolated galaxies are gener-ally consistent with the Hamabe & Kormendy relation for luminousgalaxies.
7.4 The gravitational effect of faint companions
Here, we have assumed that all detected faint galaxies in the fieldsurrounding a galaxy lie at the same redshift as the primary galaxy(in reality many will be background objects) and have calculatedtheir luminosity LR in the R-band. For an assumed mass-to-light
ratio of M/LR = 10 M�/L�, we estimated the mass M of each faintgalaxy. For all faint galaxies in the field of a primary galaxy, we havecalculated the dynamical friction time-scale using equation (7-27)in Binney & Tremaine (1987). We assumed a velocity dispersion ofσ = 250 km s−1 for the galaxies in the field of the isolated galaxy. Asgalaxies with dynamical friction times that are significantly less thanthe Hubble time should have merged with the primary galaxy, andhence not be visible, their existence suggests that they may actuallylie in the foreground or background. In the case of the four groups,we used the published velocities in NED to remove the non-groupmembers.
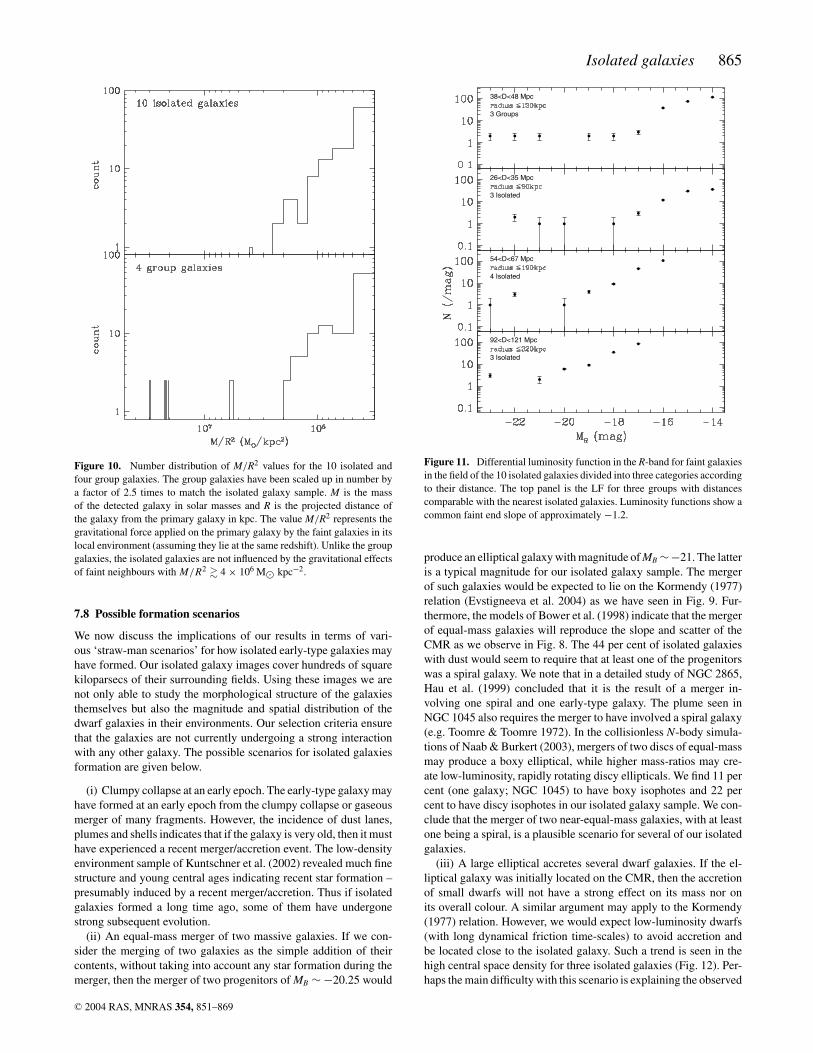
The gravitational effect applied on the primary galaxy by eachof the faint galaxies in its field is proportional to M/R2, where R isthe projected distance of the faint galaxy from the primary galaxy.Except for the faint dwarfs with short dynamical friction times andnon-group members, we calculate the parameter M/R2 for all de-tected galaxies in the field of the 10 isolated and four group galaxies.Fig. 10 shows the number distribution of the M/R2 values for theisolated and the group galaxies. In the case of groups, the distri-bution has been scaled up by a factor of 2.5 times. Comparing thefields of the isolated and group galaxies we note the absence ofgalaxies with M/R2 greater than ∼4 × 10⁶ M� kpc−2 for isolatedgalaxies. This is a further indication that our isolated galaxies areindeed gravitationally isolated.
C© 2004 RAS, MNRAS 354, 851–869
Isolated galaxies 863
11 12 13 14 15 16 17 18 190
5
10
15
20
25
NGC 3528
NGC 3529
(b)
5
10
15
20
25
ESO218-G002
(a)
Figure 7. The size–magnitude relation for detected galaxies in the fieldof (a) the isolated galaxy ESO218-G002 and (b) the NGC 3528 group. TheSEXTRACTOR parameters A IMAG and MAG BEST were used as a measureof size and magnitude, respectively. The vertical dotted line represents our100 per cent completeness limit of R = 18.75. For ESO218-G002 the bright-est galaxy in the field is ∼4 mag fainter and ∼1/3 the size of ESO218-G002itself.
7.5 Luminosity function
The luminosity function (LF) represents the number distribution ofgalaxies in a given magnitude interval. Traditionally, this distribu-tion is fit with a function of the form
φ(L) = (φ∗/L∗)(L/L∗)αe(L/L∗)
with L∗ and α representing a characteristic bright magnitude and theslope of the faint end, respectively, (Schechter 1976). The impor-tance of the LF lies in its strong correlation with the mass functionof the galaxy distribution, which is one of the observable tests ofany theoretical cosmological model. It may also provide clues to theevolutionary history of galaxies. There have been several studies ofthe LF for high-density cluster environments (Trentham & Hodgkin2002; Christlein & Zabludoff 2003; Mobasher et al. 2003) and lowerdensity regions such as groups (Zabludoff & Mulchaey 2000; Flint,Bolte & de Oliveira 2003) and the field (Blanton et al. 2001, 2003;Drory et al. 2003).
As a result of the different distances to the isolated galaxies, ourdata cover different physical areas with different absolute magni-tude limits (under the assumption that all faint galaxies lie at thesame redshift as the primary galaxy). To deal with this situationwe divided the isolated galaxy sample into three distance intervals,and derived the LF separately for each (see Fig. 11). Excluding thenearby group NGC 4697, our imaging of the other three groupscovers a comparable area to that of the isolated galaxies. We notethat in driving the LFs, we assume that the faint galaxies are at thesame redshift as the primary galaxy. Spectra are required to deter-
Figure 8. Colour–magnitude relation for the sample galaxies. The solidline (Gladders et al. 1998) represents the CMR of elliptical galaxies in theComa cluster, while the dashed line indicates the mean error in the colourmeasurements for our sample galaxies. The isolated galaxies are consistentwith the Coma cluster CMR. Symbols as in Fig. 1.
mine the true redshift distribution of these galaxies. We find thatthe isolated galaxies and groups have similar luminosity functions.They all show a faint end slope of ∼ −1.2, and a change in theslope around MR ≈ −18. Such features are fairly common across arange of environments (Flint 2001; Trentham & Tully 2002; Mileset al. 2004). We note that fossil groups (Jones, Ponman & Forbes2000) also reveal a similar luminosity function. This universalityof isolated galaxy luminosity functions indicates that they are not auseful tool in discriminating between competing ideas for the originof isolated galaxies.
7.6 Space number density
To calculate the space number density of the detected faint galaxiessurrounding the primary galaxy we divided the field into concentricannuli centred on each primary galaxy. The density measures in theouter annuli were corrected for the missing area with the largestcorrection being a factor of 2, i.e. 50 per cent of the annulus wascovered by the WFI field of view. The different magnitude limits ineach field, determined by the exposure time, give rise to differentbackground density levels.
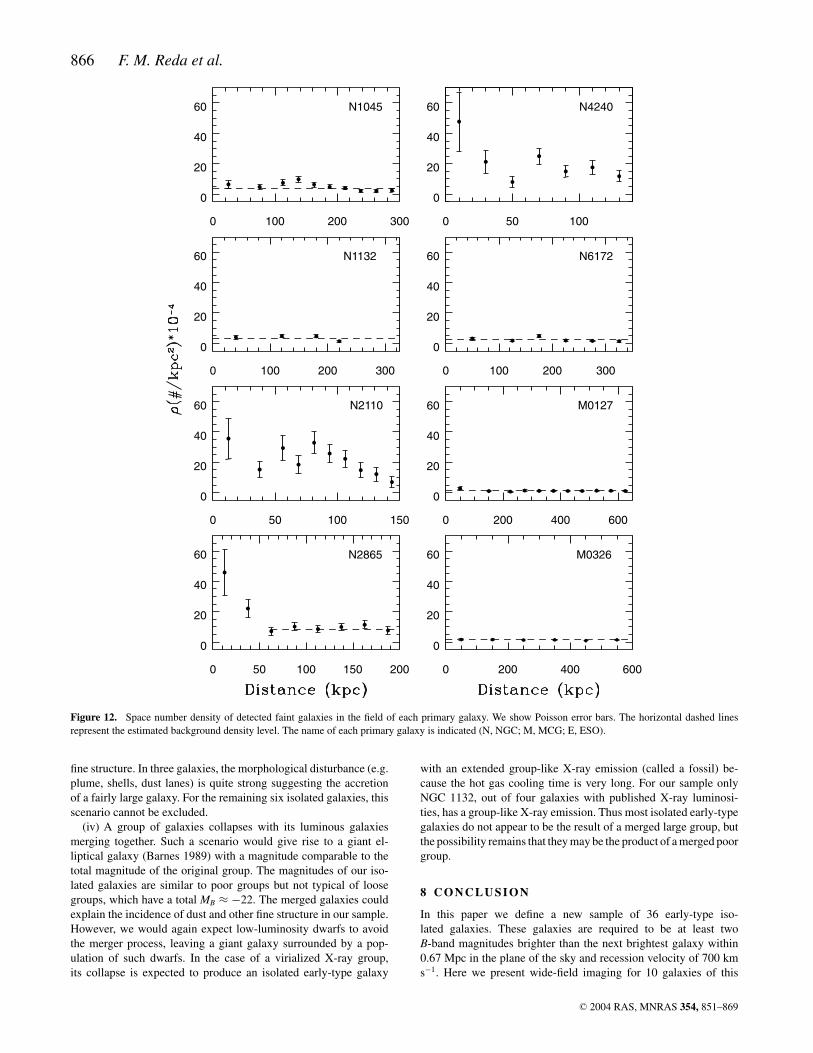
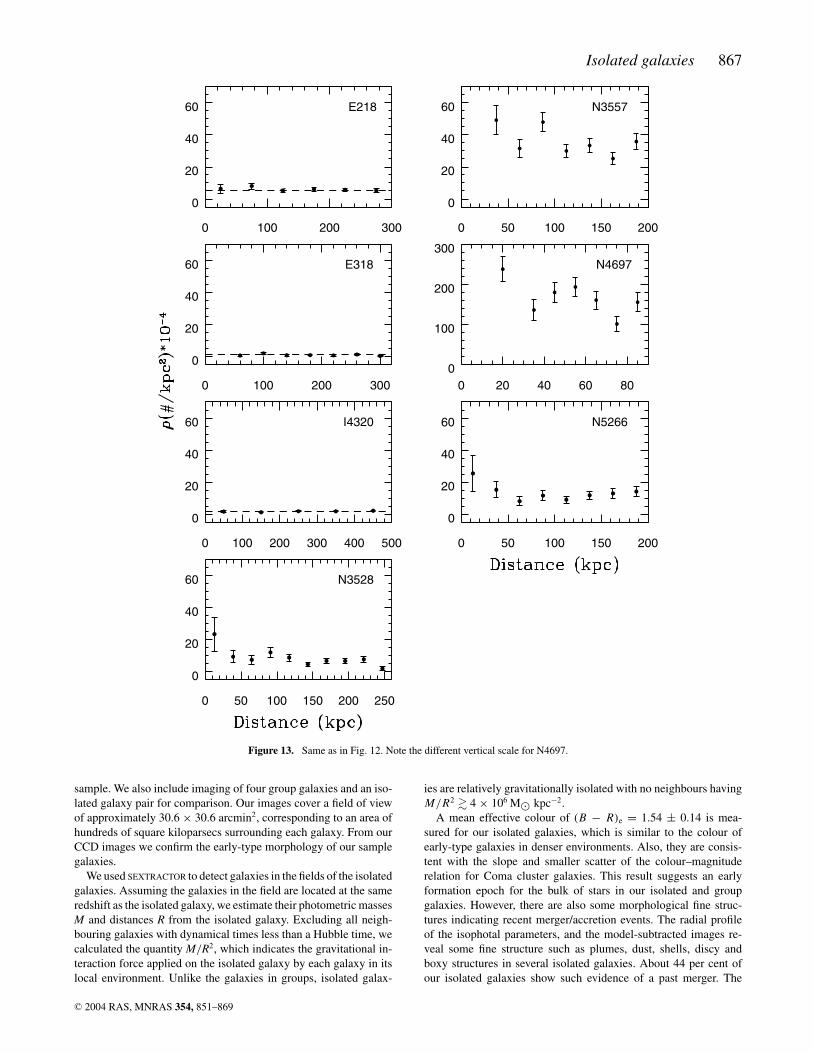
In Figs 12 and 13, we display the space number density dis-tribution of faint galaxies in the field of each primary galaxy.Seven out of 10 isolated galaxies show almost constant density lev-els at all radii, indicating that the faint galaxies are mostly back-ground objects and not associated with the isolated galaxies. Theremaining three galaxies are NGC 2110, 2865 and 4240. BothNGC 2110 and 4240 show a fairly continuous density decreasefrom the central region outwards. The outermost radial bin has a
C© 2004 RAS, MNRAS 354, 851–869
864 F. M. Reda et al.
Figure 9. The Kormendy relation between the mean surface brightness within the effective radius and effective radius in the B and R bands. The solid linerepresents the original Hamabe & Kormendy (1987) relation. The zero-point of the original relation has been shifted from V to the B and R bands assumingtypical colours of B − V = 0.8 and B − R = 1.5. Our isolated galaxies are generally consistent with the Hamabe & Kormendy relation for luminous galaxies.Symbols as in Fig. 1.
relatively high density suggesting that the background level has notbeen reached even at ∼150 kpc. NGC 2865 shows a sharp declinefrom a high central density to a background level at a radius of∼60 kpc.
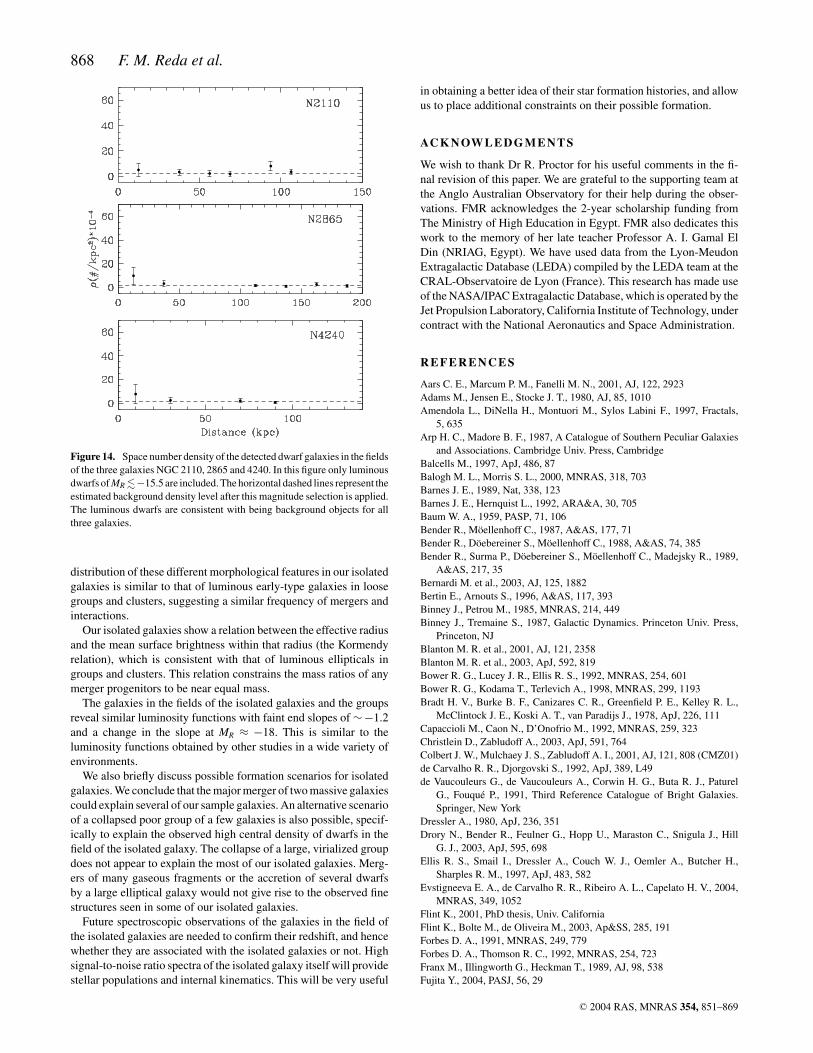
We note that these three galaxies are the closest in our sample, andfor which we could detect lower luminosity dwarfs with magnitudesdown to MR ∼ −13.5. The mean faint magnitude limit that could bedetected for the other seven isolated galaxies is MR ∼ −15.5. If weinclude only luminous dwarfs with MR � −15.5, then these threegalaxies show no central excess, giving similar space densities tothose of other galaxies (Fig. 14). This indicates that the majority ofdwarf galaxies associated with the isolated galaxies are less lumi-nous than MR ∼ −15.5, while more luminous dwarfs are likely tobe background objects.
In their study of the NGC 1132 environment, Mulchaey &Zabludoff (1999) measured a higher central density of dwarf galax-ies, with magnitudes of 17.22 < R < 19.22, than we have. From theirdensity distribution we calculate the number of dwarfs within thecentral 80 kpc to be ∼30 galaxies. We identify only eight galaxieswithin the same area. Our magnitude limit for the NGC 1132 field isR = 18.75. This magnitude difference is not enough to explain thedensity distribution difference between the two studies. Consider-ing all detected objects down to their magnitude limit of R = 19.22and with ICLASS parameters up to 0.95, we find 19 objects. Thisnumber of detected dwarf galaxies is still less than that found byMulchaey & Zabludoff. This smaller number could be due to theincompleteness of our detections for objects fainter than R = 18.75.The background level in the outer region (i.e. distances >100 kpc)is consistent between the two studies.
As groups are distributed over a few megaparsecs, which is be-yond our observed field of view, it is not surprising that the densitylevels remain high at all radii for our four group galaxies, i.e. nonereach the background level. For IC 4320, after excluding its pair
galaxy ESO509-G100, shows a constant density indicating no as-sociated galaxies.
7.7 Comparison with fossil groups
Jones et al. (2003) defined a ‘fossil’ to be a giant isolated ellip-tical galaxy with group-like X-ray emission and luminosities ofL X,bol � 1042 h−2
50 erg s−1. Fossils are required to be �2.0R magni-tudes brighter than the second brightest galaxy in the system withinhalf the projected virial radius. According to the hierarchical modelof galaxy formation these elliptical galaxies are believed to be theend result of merging many small galaxies of a X-ray luminousgroup (Ponman et al. 1994; Jones et al. 2000, 2003).
We have searched the literature for X-ray observations of our sam-ple galaxies, finding only NGC 2865, 3557 and 4697 (O’Sullivan,Forbes & Ponman 2001), NGC 2110 (Bradt et al. 1978; Pfefferkornet al. 2001), NGC 1132 (Mulchaey & Zabludoff 1999) andNGC 3528 and 5266 (Horner & Goudfrooij 2004) to have pub-lished X-ray luminosities. Only NGC 1132 has an X-ray luminosity(LX = 2.5 × 1042 h−2
50 erg s−1) that is comparable to a fossil.In a study of six fossils, Jones et al. (2000, 2003) measured the
R magnitude difference between the primary elliptical galaxy andthe second brightest galaxy in the field to be �R12 = 2.0–3.3. Theyconsidered all objects within ∼600 kpc of the primary galaxy. Ex-cluding MCG-03-26-030, for the entire observed field around eachof our isolated galaxies, we find �R12 = 1.9–5.2 and �B 12 =2.3–4.8. If we use the maximum common radius for our sample of116 kpc (which corresponds to the closest galaxy NGC 4240), weobtain similar values of �R12 = 1.9–5.3 and �B 12 = 2.3–5.4. Thegalaxy MCG-03-26-030 is the least isolated in our sample with amagnitude difference of 1.8 in the B-band. Thus our isolated galax-ies have a similar, and some times even greater, luminosity isolationthan ‘fossils’.
C© 2004 RAS, MNRAS 354, 851–869
Isolated galaxies 865
Figure 10. Number distribution of M/R2 values for the 10 isolated andfour group galaxies. The group galaxies have been scaled up in number bya factor of 2.5 times to match the isolated galaxy sample. M is the massof the detected galaxy in solar masses and R is the projected distance ofthe galaxy from the primary galaxy in kpc. The value M/R2 represents thegravitational force applied on the primary galaxy by the faint galaxies in itslocal environment (assuming they lie at the same redshift). Unlike the groupgalaxies, the isolated galaxies are not influenced by the gravitational effectsof faint neighbours with M/R2 � 4 × 10⁶ M� kpc−2.
7.8 Possible formation scenarios
We now discuss the implications of our results in terms of vari-ous ‘straw-man scenarios’ for how isolated early-type galaxies mayhave formed. Our isolated galaxy images cover hundreds of squarekiloparsecs of their surrounding fields. Using these images we arenot only able to study the morphological structure of the galaxiesthemselves but also the magnitude and spatial distribution of thedwarf galaxies in their environments. Our selection criteria ensurethat the galaxies are not currently undergoing a strong interactionwith any other galaxy. The possible scenarios for isolated galaxiesformation are given below.
(i) Clumpy collapse at an early epoch. The early-type galaxy mayhave formed at an early epoch from the clumpy collapse or gaseousmerger of many fragments. However, the incidence of dust lanes,plumes and shells indicates that if the galaxy is very old, then it musthave experienced a recent merger/accretion event. The low-densityenvironment sample of Kuntschner et al. (2002) revealed much finestructure and young central ages indicating recent star formation –presumably induced by a recent merger/accretion. Thus if isolatedgalaxies formed a long time ago, some of them have undergonestrong subsequent evolution.
(ii) An equal-mass merger of two massive galaxies. If we con-sider the merging of two galaxies as the simple addition of theircontents, without taking into account any star formation during themerger, then the merger of two progenitors of MB ∼ −20.25 would
92<D<121 Mpc
3 Isolated
54<D<67 Mpc
4 Isolated
26<D<35 Mpc
3 Isolated
38<D<48 Mpc
3 Groups
Figure 11. Differential luminosity function in the R-band for faint galaxiesin the field of the 10 isolated galaxies divided into three categories accordingto their distance. The top panel is the LF for three groups with distancescomparable with the nearest isolated galaxies. Luminosity functions show acommon faint end slope of approximately −1.2.
produce an elliptical galaxy with magnitude of MB ∼−21. The latteris a typical magnitude for our isolated galaxy sample. The mergerof such galaxies would be expected to lie on the Kormendy (1977)relation (Evstigneeva et al. 2004) as we have seen in Fig. 9. Fur-thermore, the models of Bower et al. (1998) indicate that the mergerof equal-mass galaxies will reproduce the slope and scatter of theCMR as we observe in Fig. 8. The 44 per cent of isolated galaxieswith dust would seem to require that at least one of the progenitorswas a spiral galaxy. We note that in a detailed study of NGC 2865,Hau et al. (1999) concluded that it is the result of a merger in-volving one spiral and one early-type galaxy. The plume seen inNGC 1045 also requires the merger to have involved a spiral galaxy(e.g. Toomre & Toomre 1972). In the collisionless N-body simula-tions of Naab & Burkert (2003), mergers of two discs of equal-massmay produce a boxy elliptical, while higher mass-ratios may cre-ate low-luminosity, rapidly rotating discy ellipticals. We find 11 percent (one galaxy; NGC 1045) to have boxy isophotes and 22 percent to have discy isophotes in our isolated galaxy sample. We con-clude that the merger of two near-equal-mass galaxies, with at leastone being a spiral, is a plausible scenario for several of our isolatedgalaxies.
(iii) A large elliptical accretes several dwarf galaxies. If the el-liptical galaxy was initially located on the CMR, then the accretionof small dwarfs will not have a strong effect on its mass nor onits overall colour. A similar argument may apply to the Kormendy(1977) relation. However, we would expect low-luminosity dwarfs(with long dynamical friction time-scales) to avoid accretion andbe located close to the isolated galaxy. Such a trend is seen in thehigh central space density for three isolated galaxies (Fig. 12). Per-haps the main difficulty with this scenario is explaining the observed
C© 2004 RAS, MNRAS 354, 851–869
866 F. M. Reda et al.
0 100 200 300
0
20
40
60 N1045
0 100 200 300
0
20
40
60 N1132
0 50 100 150
0
20
40
60 N2110
0 50 100 150 200
0
20
40
60 N2865
0 50 100
0
20
40
60 N4240
0 100 200 300
0
20
40
60 N6172
0 200 400 600
0
20
40
60 M0127
0 200 400 600
0
20
40
60 M0326
Figure 12. Space number density of detected faint galaxies in the field of each primary galaxy. We show Poisson error bars. The horizontal dashed linesrepresent the estimated background density level. The name of each primary galaxy is indicated (N, NGC; M, MCG; E, ESO).
fine structure. In three galaxies, the morphological disturbance (e.g.plume, shells, dust lanes) is quite strong suggesting the accretionof a fairly large galaxy. For the remaining six isolated galaxies, thisscenario cannot be excluded.
(iv) A group of galaxies collapses with its luminous galaxiesmerging together. Such a scenario would give rise to a giant el-liptical galaxy (Barnes 1989) with a magnitude comparable to thetotal magnitude of the original group. The magnitudes of our iso-lated galaxies are similar to poor groups but not typical of loosegroups, which have a total MB ≈ −22. The merged galaxies couldexplain the incidence of dust and other fine structure in our sample.However, we would again expect low-luminosity dwarfs to avoidthe merger process, leaving a giant galaxy surrounded by a pop-ulation of such dwarfs. In the case of a virialized X-ray group,its collapse is expected to produce an isolated early-type galaxy
with an extended group-like X-ray emission (called a fossil) be-cause the hot gas cooling time is very long. For our sample onlyNGC 1132, out of four galaxies with published X-ray luminosi-ties, has a group-like X-ray emission. Thus most isolated early-typegalaxies do not appear to be the result of a merged large group, butthe possibility remains that they may be the product of a merged poorgroup.
8 C O N C L U S I O N
In this paper we define a new sample of 36 early-type iso-lated galaxies. These galaxies are required to be at least twoB-band magnitudes brighter than the next brightest galaxy within0.67 Mpc in the plane of the sky and recession velocity of 700 kms−1. Here we present wide-field imaging for 10 galaxies of this
C© 2004 RAS, MNRAS 354, 851–869
Isolated galaxies 867
0 100 200 300
0
20
40
60 E218
0 100 200 300
0
20
40
60 E318
0 100 200 300 400 500
0
20
40
60 I4320
0 50 100 150 200 250
0
20
40
60 N3528
0 50 100 150 200
0
20
40
60 N3557
0 20 40 60 800
100
200
300N4697
0 50 100 150 200
0
20
40
60 N5266
Figure 13. Same as in Fig. 12. Note the different vertical scale for N4697.
sample. We also include imaging of four group galaxies and an iso-lated galaxy pair for comparison. Our images cover a field of viewof approximately 30.6 × 30.6 arcmin2, corresponding to an area ofhundreds of square kiloparsecs surrounding each galaxy. From ourCCD images we confirm the early-type morphology of our samplegalaxies.
We used SEXTRACTOR to detect galaxies in the fields of the isolatedgalaxies. Assuming the galaxies in the field are located at the sameredshift as the isolated galaxy, we estimate their photometric massesM and distances R from the isolated galaxy. Excluding all neigh-bouring galaxies with dynamical times less than a Hubble time, wecalculated the quantity M/R2, which indicates the gravitational in-teraction force applied on the isolated galaxy by each galaxy in itslocal environment. Unlike the galaxies in groups, isolated galax-
ies are relatively gravitationally isolated with no neighbours havingM/R2 � 4 × 10⁶ M� kpc−2.
A mean effective colour of (B − R)e = 1.54 ± 0.14 is mea-sured for our isolated galaxies, which is similar to the colour ofearly-type galaxies in denser environments. Also, they are consis-tent with the slope and smaller scatter of the colour–magnituderelation for Coma cluster galaxies. This result suggests an earlyformation epoch for the bulk of stars in our isolated and groupgalaxies. However, there are also some morphological fine struc-tures indicating recent merger/accretion events. The radial profileof the isophotal parameters, and the model-subtracted images re-veal some fine structure such as plumes, dust, shells, discy andboxy structures in several isolated galaxies. About 44 per cent ofour isolated galaxies show such evidence of a past merger. The
C© 2004 RAS, MNRAS 354, 851–869
868 F. M. Reda et al.
Figure 14. Space number density of the detected dwarf galaxies in the fieldsof the three galaxies NGC 2110, 2865 and 4240. In this figure only luminousdwarfs of MR �−15.5 are included. The horizontal dashed lines represent theestimated background density level after this magnitude selection is applied.The luminous dwarfs are consistent with being background objects for allthree galaxies.
distribution of these different morphological features in our isolatedgalaxies is similar to that of luminous early-type galaxies in loosegroups and clusters, suggesting a similar frequency of mergers andinteractions.
Our isolated galaxies show a relation between the effective radiusand the mean surface brightness within that radius (the Kormendyrelation), which is consistent with that of luminous ellipticals ingroups and clusters. This relation constrains the mass ratios of anymerger progenitors to be near equal mass.
The galaxies in the fields of the isolated galaxies and the groupsreveal similar luminosity functions with faint end slopes of ∼ −1.2and a change in the slope at MR ≈ −18. This is similar to theluminosity functions obtained by other studies in a wide variety ofenvironments.
We also briefly discuss possible formation scenarios for isolatedgalaxies. We conclude that the major merger of two massive galaxiescould explain several of our sample galaxies. An alternative scenarioof a collapsed poor group of a few galaxies is also possible, specif-ically to explain the observed high central density of dwarfs in thefield of the isolated galaxy. The collapse of a large, virialized groupdoes not appear to explain the most of our isolated galaxies. Merg-ers of many gaseous fragments or the accretion of several dwarfsby a large elliptical galaxy would not give rise to the observed finestructures seen in some of our isolated galaxies.
Future spectroscopic observations of the galaxies in the field ofthe isolated galaxies are needed to confirm their redshift, and hencewhether they are associated with the isolated galaxies or not. Highsignal-to-noise ratio spectra of the isolated galaxy itself will providestellar populations and internal kinematics. This will be very useful
in obtaining a better idea of their star formation histories, and allowus to place additional constraints on their possible formation.
AC K N OW L E D G M E N T S
We wish to thank Dr R. Proctor for his useful comments in the fi-nal revision of this paper. We are grateful to the supporting team atthe Anglo Australian Observatory for their help during the obser-vations. FMR acknowledges the 2-year scholarship funding fromThe Ministry of High Education in Egypt. FMR also dedicates thiswork to the memory of her late teacher Professor A. I. Gamal ElDin (NRIAG, Egypt). We have used data from the Lyon-MeudonExtragalactic Database (LEDA) compiled by the LEDA team at theCRAL-Observatoire de Lyon (France). This research has made useof the NASA/IPAC Extragalactic Database, which is operated by theJet Propulsion Laboratory, California Institute of Technology, undercontract with the National Aeronautics and Space Administration.
R E F E R E N C E S
Aars C. E., Marcum P. M., Fanelli M. N., 2001, AJ, 122, 2923Adams M., Jensen E., Stocke J. T., 1980, AJ, 85, 1010Amendola L., DiNella H., Montuori M., Sylos Labini F., 1997, Fractals,
5, 635Arp H. C., Madore B. F., 1987, A Catalogue of Southern Peculiar Galaxies
and Associations. Cambridge Univ. Press, CambridgeBalcells M., 1997, ApJ, 486, 87Balogh M. L., Morris S. L., 2000, MNRAS, 318, 703Barnes J. E., 1989, Nat, 338, 123Barnes J. E., Hernquist L., 1992, ARA&A, 30, 705Baum W. A., 1959, PASP, 71, 106Bender R., Moellenhoff C., 1987, A&AS, 177, 71Bender R., Doebereiner S., Moellenhoff C., 1988, A&AS, 74, 385Bender R., Surma P., Doebereiner S., Moellenhoff C., Madejsky R., 1989,
A&AS, 217, 35Bernardi M. et al., 2003, AJ, 125, 1882Bertin E., Arnouts S., 1996, A&AS, 117, 393Binney J., Petrou M., 1985, MNRAS, 214, 449Binney J., Tremaine S., 1987, Galactic Dynamics. Princeton Univ. Press,
Princeton, NJBlanton M. R. et al., 2001, AJ, 121, 2358Blanton M. R. et al., 2003, ApJ, 592, 819Bower R. G., Lucey J. R., Ellis R. S., 1992, MNRAS, 254, 601Bower R. G., Kodama T., Terlevich A., 1998, MNRAS, 299, 1193Bradt H. V., Burke B. F., Canizares C. R., Greenfield P. E., Kelley R. L.,
McClintock J. E., Koski A. T., van Paradijs J., 1978, ApJ, 226, 111Capaccioli M., Caon N., D’Onofrio M., 1992, MNRAS, 259, 323Christlein D., Zabludoff A., 2003, ApJ, 591, 764Colbert J. W., Mulchaey J. S., Zabludoff A. I., 2001, AJ, 121, 808 (CMZ01)de Carvalho R. R., Djorgovski S., 1992, ApJ, 389, L49de Vaucouleurs G., de Vaucouleurs A., Corwin H. G., Buta R. J., Paturel
G., Fouque P., 1991, Third Reference Catalogue of Bright Galaxies.Springer, New York
Dressler A., 1980, ApJ, 236, 351Drory N., Bender R., Feulner G., Hopp U., Maraston C., Snigula J., Hill
G. J., 2003, ApJ, 595, 698Ellis R. S., Smail I., Dressler A., Couch W. J., Oemler A., Butcher H.,
Sharples R. M., 1997, ApJ, 483, 582Evstigneeva E. A., de Carvalho R. R., Ribeiro A. L., Capelato H. V., 2004,
MNRAS, 349, 1052Flint K., 2001, PhD thesis, Univ. CaliforniaFlint K., Bolte M., de Oliveira M., 2003, Ap&SS, 285, 191Forbes D. A., 1991, MNRAS, 249, 779Forbes D. A., Thomson R. C., 1992, MNRAS, 254, 723Franx M., Illingworth G., Heckman T., 1989, AJ, 98, 538Fujita Y., 2004, PASJ, 56, 29
C© 2004 RAS, MNRAS 354, 851–869
Isolated galaxies 869
Garcia A. M., 1993, A&AS, 100, 47Girardi M., Mardirossian F., Marinoni C., Mezzetti M., Rigoni E., 2003,
A&A, 410, 461Gladders M. D., Lopez-Cruz O., Yee H. K. C., Kodama T., 1998, ApJ, 501,
571GGoudfrooij P., de Jong T., Hansen L., Nørgaard-Nielsen H. U., 1994a,
MNRAS, 271, 833Goudfrooij P., Hansen L., Jørgensen H. E., Nørgaard-Nielsen H. U., de Jong
T., van den Hoek L. B., 1994b, A&AS, 104, 179Graham A., Colless M., 1997, MNRAS, 287, 221Gunn J. E., Gott J. R., 1972, ApJ, 176, 1Hamabe M., Kormendy J., 1987, in de Zeeuw T., ed., Proc. IAU Symp., 127,
Structure and Dynamics of Elliptical Galaxies. Reidel, Dordrecht, p. 379Hau G. K. T., Carter D., Balcells M., 1999, MNRAS, 306, 437Hoessel J. G., Oegerle W. R., Schneider D. P., 1987, AJ, 94, 1111Horner D., Goudfrooij P. 2004, AJ, submittedJedrzejewski R. I., 1987, MNRAS, 226, 747Jones L. R., Ponman T. J., Forbes D. A., 2000, MNRAS, 312, 139Jones L. R., Ponman T. J., Horton A., Babul A., Ebeling H., Burke D. J.,
2003, MNRAS, 343, 627Karachentseva V. E., 1973, Comm. Spac. Ap. Obs., USSR, 8, 1Khochfar S., Burkert A., 2003, ApJ, 597, 117Khosroshahi H. G., Raychaudhury S., Ponman T. J., Miles T. A., Forbes
D. A., 2004, MNRAS, 349, 527Kodama T., 2001, Ap&SS, 276, 877Kodama T., Bower R. G., Bell E. F., 1999, MNRAS, 306, 561Kormendy J., 1977, ApJ, 218, 333Kuntschner H., Smith R. J., Colless M., Davies R. L., Kaldare R., Vazdekis
A., 2002, MNRAS, 337, 172La Barbera F., Busarello G., Merluzzi P., Massarotti M., Capaccioli M.,
2003, ApJ, 595, 127Landolt A. U., 1992, AJ, 104, 340Lauberts A., Valentijn E. A., 1989, The Surface Photometry Catalogue of
The ESO-Uppsala Galaxies. ESO, GarchingLauer T. R., 1985, MNRAS, 216, 429Merluzzi P., 1998, A&A, 338, 807Miles T. A., Raychaudhury S., Forbes D. A., Goudfrooij P., Ponman T. J.,
2004, MNRAS, submittedMobasher B. et al., 2003, ApJ, 587, 605Moore B., Katz N., Lake G., Dressler A., Oemler A., 1996, Nat, 379, 613Moore B., Lake G., Katz N., 1998, ApJ, 495, 139Moore B., Lake G., Quinn Th., Stadel J., 1999, MNRAS, 304, 465
Mulchaey J. S., Zabludoff A. I., 1999, ApJ, 514, 133Naab T., Burkert A., 2003, ApJ, 597, 893Nieto J.-L., Bender R., 1989, A&A, 215, 266O’Sullivan E., Forbes D. A., Ponman T. J., 2001, MNRAS, 328, 461Peletier R. F., Davies R. L., Illingworth G. D., Davis L. E., Cawson M.,
1990, AJ, 100, 1091Pfefferkorn F., Boller Th., Rafanelli P., 2001, A&A, 368, 797Ponman T. J., Allan D. J., Jones L. R., Merrifield M., McHardy I. M., Lehto
H. J., Luppino G. A., 1994, Nat, 369, 462Prugniel P., Heraudeau P., 1998, A&AS, 128, 299Prugniel P., Simien F., 1997, A&A, 321, 111Raychaudhury S., 1989, Nat, 342, 251Raychaudhury S., 1990, BAAS, 22, 1331Reduzzi L., Longhetti M., Rampazzo R., 1996, MNRAS, 282, 149 (RLR96)Saucedo-Morales J., Bieging J., 2001, ApSSS, 277, 449Schechter P., 1976, ApJ, 203, 297Schlegel D. J., Finkbeiner D. P., Davis M., 1998, ApJ, 500, 525Schweizer F., Seitzer P., Faber S. M., Burstein D., Dalle Ore C. M., Gonzalez
J. J., 1990, ApJ, 364L, 33Smith R. M., Martinez V. J., Graham M. J., 2003, ApJ, submitted (astro-
ph/0311599) (SMG03)Soares D. S. L., de Souza R. E., de Carvalho R. R., Couto de Silva T. C.,
1995, A&AS, 110, 371Stanford S. A., Eisenhardt P. R. M., Dickinson M. E., 1995, ApJ, 450, 512Stanford S. A., Eisenhardt P. R. M., Dickinson M. E., 1998, ApJ, 492, 461Stocke J. T., Keeney B. A., Lewis A. D., Epps H. W., Schild R. E., 2004, AJ,
127, 1336Terlevich A. I., Forbes D. A., 2002, MNRAS, 330, 547Toomre A., Toomre J., 1972, ApJ, 178, 623Trentham N., Hodgkin S., 2002, MNRAS, 333, 423Trentham N., Tully R. B., 2002, MNRAS, 335, 712Waddington I. et al., 2002, MNRAS, 336, 1342Zabludoff A., Mulchaey J., 2000, ApJ, 539, 136Zepf S. E., Whitmore B. C., 1993, ApJ, 418, 72Ziegler B. L., Saglia R. P., Bender R., Belloni P., Greggio L., Seitz S., 1999,
A&A, 346, 13Zwicky F. et al., 1957, Catalog of Galaxies and Clusters of Galaxies,
Vol. 1–6, California Inst. Tech., Pasadena
This paper has been typeset from a TEX/LATEX file prepared by the author.
C© 2004 RAS, MNRAS 354, 851–869