Embed Size (px)
Citation preview
The Philippines
in Figures
2016
Republic of the Philippines PHILIPPINE STATISTICS AUTHORITY
Republic of the Philippines
HIS EXCELLENCY PRESIDENT RODRIGO ROA DUTERTE
Republic of the philippines
PHILIPPINE STATISTICS AUTHORITY
ISSN 1655-2539
DR. LISA GRACE S. BERSALES Ph. D. National Statistician
Philippines in Figures Printed in folded spreadsheet: 1991-1994
Printed in booklet form: 1995-1997, 1999–2003, 2005-2016
CONTENTS iii
Map of the Philippines ivAbbreviations Used v - viPhysiography 1Historical Background 2 – 3Constitution and Government 4Agriculture 5 – 9Banking and Insurance 10 – 14Communications 15 – 17Construction and Housing 18 – 23Crime and Delinquency 24 – 25Demography 26 – 31Domestic Trade and Services 32 – 35Education 36 – 42Energy, Gas, and Water 43 – 45Fishery 46 – 47Foreign Trade 48 – 50Forestry 51 – 52Health and Welfare 53 – 57Income and Prices 58 – 62Labor and Employment 63 – 66Manufacturing 67 – 68Mines and Minerals 69 – 71National Accounts 72 – 74Public Finance 75 – 76Tourism 77 – 80Transportation 81 – 83Vital Statistics 84 – 85International Statistics 86Regions, Provinces, and Cities in the Philippines 87 – 92Regular PSA Publications 93
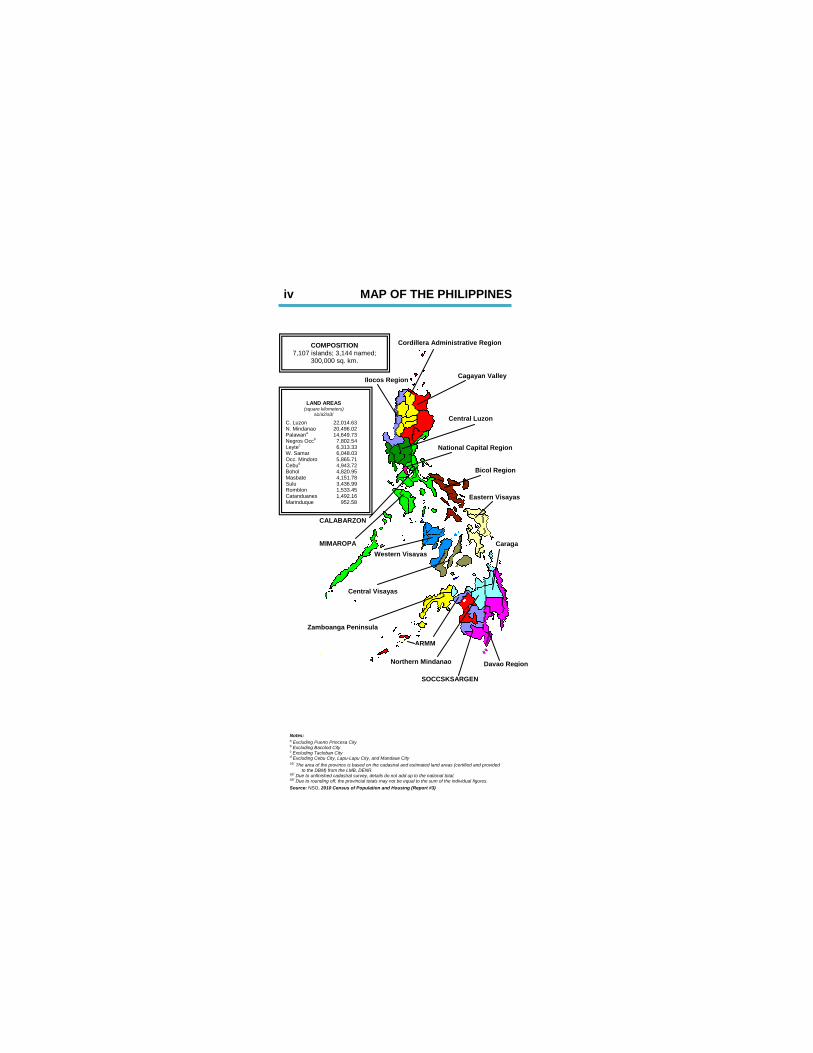
COMPOSITION7,107 islands; 3,144 named;
300,000 sq. km.
CALABARZON MIMAROPA
Cordillera Administrative Region
Cagayan Valley
Central Luzon
Bicol Region
National Capital Region
Western Visayas
Central Visayas
Zamboanga Peninsula
Davao Region
Caraga
Ilocos Region
iv MAP OF THE PHILIPPINES
Northern Mindanao
ARMM
Eastern Visayas
SOCCSKSARGEN
LAND AREAS
(square kilometers) a1/a2/a3/
C. Luzon 22,014.63 N. Mindanao Palawana Negros Occb
20,496.02 14,649.73
7,802.54 Leytec W. Samar
6,313.33 6,048.03
Occ. Mindoro 5,865.71 Cebud 4,943.72 Bohol 4,820.95 Masbate 4,151.78 Sulu 3,436.99 Romblon 1,533.45 Catanduanes Marinduque
1,492.16 952.58
Notes: a Excluding Puerto Princesa City b Excluding Bacolod City c Excluding Tacloban City d Excluding Cebu City, Lapu-Lapu City, and Mandaue City a1/ The area of the province is based on the cadastral and estimated land areas (certified and provided
to the DBM) from the LMB, DENR. a2/ Due to unfinished cadastral survey, details do not add up to the national total. a3/ Due to rounding off, the provincial totals may not be equal to the sum of the individual figures. Source: NSO, 2010 Census of Population and Housing (Report #3)
ABBREVIATIONS USED v
APEC -Asia Pacific Economic CooperationATE -average total employmentASEAN -Association of Southeast Asian NationsASPBI -Annual Survey of Philippine Business and IndustryAY -Academic YearB -billionBFAR -Bureau of Fisheries and Aquatic ResourcesBFP -Bureau of Fire ProtectionBID -Bureau of Immigration and DeportationBOC -Bureau of CustomsBP -billion pesosBSP -
-Bureau of the Treasury-
CFO --Commission on Higher Education
CHR -Commission on Human RightsCY -Calendar YearCPBI Census of Philippine Business and IndustryDA -Department of AgricultureDBM -Department of Budget and Management
-Department of EducationDENR -Department of Environment and Natural ResourcesDILG -Department of the Interior and Local GovernmentDMT -dry metric tonDND -Department of National DefenseDOE -Department of EnergyDOF -Department of FinanceDOH -Department of HealthDOLE -Department of Labor and EmploymentDOT -Department of TourismDOTC -Department of Transportation and CommunicationsDSWD -Department of Social Welfare and DevelopmentEU -European UnionFMB -Forest Management BureauFOB -free-on-boardGK -gross kilogramGSIS -Government Service Insurance SystemGWH -ha -hectareHDMF -Home Development Mutual FundHGC -Home Guaranty CorporationHUDCC -Housing and Urban Development Coordinating Councilkg -kilogram
Bangko Sentral ng PilipinasBTrCalabarzon Cavite, Laguna, Batangas, Rizal, and Quezon
Commision on Filipinos OverseasCHEd
DepEd
gigawatt-hours
vi ABBREVIATIONS USED
km -kilometerLTO -Land Transportation OfficeLRTA -Light Rail Transit AuthorityM -millioncu -cubic metersMERALCO -Manila Electric CompanyMGB -MIAA -Manila International Airport Authority
-
MP -million pesoMT -metric tonMRTA -Metro Rail Transit AuthorityNAMRIA -National Mapping and Resource Information AuthorityNEA -National Electrification AdministrationNEDA -National Economic and Development AuthorityNHA -National Housing AuthorityNHMFC -National Home Mortgage Finance CorporationNIA -National Irrigation AdministrationNPC -National Power CorporationNTC -National Telecommunications Commissionp -preliminary
-PAGASA -Philippine Atmospheric, Geophysical, and Astronomical
Services AdministrationPDIC -Philippine Deposit Insurance CorporationPIA -Philippine Information AgencyPLDT -Philippine Long Distance TelecommunicationPNP -Philippine National PolicePOEA -Philippine Overseas Employment AdministrationPPA -Philippine Ports AuthorityPSA -Philippine Statistics AuthorityPRC -Professional Regulations Commissionr -revisedSDR -special drawing rights
-
sq. m. -square metersSSS -Social Security SystemSY -School YearTESDA -Technical Education and Skills Development AuthorityTh -thousandUSSR -Union of Soviet Socialist Republics… -not available
Mines and Geosciences Bureau
Mimaropa Occidental Mindoro, Oriental Mindoro, Marinduque,Romblon and Palawan
p.a. per annum
Soccsksargen South Cotabato, Cotabato, Cotabato City, SultanKudarat, Kidapawan City, Koronadal City, Tacurong CitySarangani, and General Santos City
he Philippines lies in the southeastern coast of Asia between 4o23’ north and 21o25’ north latitude and 116o east and 127o
east longitude. It is bordered by the waters of Bashi Channel up its north, Sulu and Celebes Seas down its south, the
Pacific Ocean to its east, and South China Sea to its west. Via air travel, the country is just within a few hours ride to Brunei, China, Hong Kong, Japan, Malaysia, Taiwan, and Vietnam.
Stretching to an area of 300,000 square kilometers, the Philippines is composed of 7,107 islands, of which only about 3,144 are named. Luzon, Visayas, and Mindanao are the three largest groups of islands. These groups of islands are further subdivided into regions, the regions into provinces, and the provinces into cities and municipalities. The cities and municipalities are further subdivided into barangays.
The country is subdivided into 17 regions, namely, Regions I-XIII,
the National Capital Region (NCR) or Metro Manila, Cordillera Administrative Region (CAR), and the Autonomous Region in Muslim Mindanao (ARMM). The (NCR) has 16 highly urbanized cities and one urban municipality. As of December 31, 2015, the country had 81 provinces, 145 cities, 1,489 municipalities, and 42,036 barangays.
Two distinct seasons, the wet and the dry, characterize the
climate of the country. During the wet season, (June until November of the year), rains shower all across the land. The dry season, meanwhile, starts from December to May of the succeeding year. These seasons bring about temperatures ranging from a cool of 18.7oC in January to a peak heat of 36.0oC in March. . Sources: NAMRIA, PSA, DILG, and PAGASA
T 1PHYSIOGRAPHY
HISTORICALBACKGROUND2
ifferent foreign races streamed into the country and left traces in the genetics of Filipinos, likewise in their customs, cultures and traditions.
Ferdinand Magellan discovered the Philippines on March 16, 1521. This signaled the start of more than 300 years of Spanish colonial rule and other turning events in the history of the country.
Spain conquered the Philippines in 1565 and named it after the Spanish king Philip. The Filipinos experienced injustice and oppression under the Spanish rule and this sparked massive unrest that eventually turned into revolution, thus weakening the Spanish rule.
Spain declared war against America but was defeated. Following the Spanish-American War, in December 1898, Spain ceded the Philippines to America through the Treaty of Paris. Filipinos resented the new colonizer. An outbreak of Filipino-American War from 1899 to 1902 happened, and the Americans won. Filipinos still held their dream for independence and their sovereignty. Later this dream for sovereignty was recognized, and the Philippines acquired self-government as a Commonwealth of the United States of America (USA) in March 1934.
World War II broke out. The Japanese invaders occupied Manila on January 2, 1942 and consequently the whole country. On October 14, 1943, the Second Republic was inaugurated with Dr. Jose P. Laurel as President. This republic established a puppet government under the Japanese administrators.
Allied forces led by General Douglas Mc Arthur landed in Leyte on October 24, 1944. This herald the historic liberation of the country from Japanese invaders. The Philippines attained full liberation in February 1945, and this set the country’s rebuilding efforts.
Succession of presidents emerged to carry out the task of
rebuilding the Republic - Manuel Roxas (1946-1948), Elpidio Quirino (1948-1953), Ramon Magsaysay (1953-1957), Carlos P. Garcia (1957-1961), Diosdado Macapagal (1962-1965), Ferdinand E. Marcos (1966-1986).
D
HISTORICALBACKGROUND 3
In 1972 because of widespread unrest, President Ferdinand E.
Marcos declared martial law. He stayed in power until People Power Revolution toppled his government on February 1986 and seated Corazon C. Aquino as president (1986-1992). The Aquino administration believed in popular governance and in her administration saw the passage of a new constitution.
Fidel V. Ramos (1992-1998) succeeded President Aquino in
1992. His vision was in the slogan Philippines 2000. His administration believes that by pooling the citizenry to be globally competitive, at the turn of the century, a newly industrialized country would be attained.
In 1998 elections Joseph E. Estrada supported by masses won a
landslide victory and became the 13th President of the Republic. His administration focused on efforts to achieve more equitable distribution of the country’s resources. In the slogan Angat Pinoy was encapsulated the government’s pursuit of achieving economic recovery. Barely two years in his office, he was forced to step down by another people revolution on January 20, 2001. Gloria Macapagal Arroyo took oath and became the 14th President.
President Gloria Macapagal Arroyo badges her slogan Strong
Republic. Her administration set out a 10-Point Agenda of governance to bring about progress and attain poverty reduction.
May 2010 elections, a new president was elected. By an
overwhelming vote, Benigno Simeon C. Aquino III won and seated as the 15th President. His administration was anchored and centered on the slogan Tuwid na Daan, a campaign against corruption which stands to the present. His term of office ends this June 2016.
CONSTITUTIONAND GOVERNMENT
4
A
he Philippine government follows the 1987 Constitution to guide its political and governmental affairs while at the same time safeguarding civil rights and liberties of the citizens. The country advocates for a democratic system of government
wherein powers rest on three governing departments: the executive, the legislative and the judicial. The President heads the Executive branch and he has a Vice-President and 24-member Cabinet to aid him in leadership. Laws limit the President’s term to a period of 6 years.
The Legislative branch is made up of the Congress, a bicameral
body with 24 senators and over two hundred district representatives duly elected by the people. In the last May 2013 national and local elections, congressmen and over 50 members of the party-list were elected. The party-lists are organized lobby groups representing marginalized sectors of society.
The Judicial branch, on the other hand, is made up of the
Supreme Court, the Appellate, the lower courts and the special courts established by law. The Supreme Court is composed of the Chief Justice and 14 Associate Justices. The Court of Appeals, meanwhile, consists of a Presiding Justice and over 60 Associate Justices.
In sharing and mobilizing the resources for countrywide
development, the government is distinctly divided into national and local sectors. Local government sector has officials elected by the people and to serve their constituents for three years. Local autonomy is provided for in the Local Government Code of 1991 in the province, city and municipality. Sources: 1987 Philippine Constitution, DILG, Commission on Election, Supreme Court, House of Representatives
T
AGRICULTURE 5
Farms 1980 1991 2002
3.42 4.61 4.829.73 9.97 9.562.84 2.16 1.98
Aqua farms Number 28,028 - 193,735 Operator 27,280 - 181,561
2013 2014 Total 95,010.3 96,293.3 51,129.9 Agricultural crops 85,739.5 87,008.2 44,007.4
2,507.1 2,532.5 Poultry 2,058.3 2,063.5 Fishery 4,705.4 4,689.1 2,313.7
2013 2014 20151,469,663.2 1,606,583.6 1,536,721.7
Crops 814,630.9 927,314.7 852,161.7233,997.8 247,757.3 252,117.8
Poultry 176,482.8 189,567.8 194,059.0 Fishery 244,551.7 241,943.9 238,383.3
777,008.9 787,835.9 788,698.8 Crops 396,047.3 405,918.5 398,016.2
126,216.3 127,494.6 132,381.0 Poultry 114,833.0 115,143.4 121,754.9 Fishery 139,912.3 139,279.4 136,546.8
2013 2014 20154,746.1 4,739.7 4,656.2
Corn 2,563.7 2,611.4 2,561.9
2012 2013 20143.84 3.89 4.00
Corn 2.86 2.88 2.98
Continued
Number (M) Area (M Ha) Average farm area (Ha)
Volume of production (Th MT) 2015 p
Livestocks 2,627.1p
2,181.7p
Value of production (MP) (At current prices)
Livestocks
(At constant 2000 prices)
Livestocks
Area harvested (Th Ha) Palay
Yield per hectare (MT) Palay
6 AGRICULTURE
2013 2014 201518,439.4 18,967.8 18,149.8
314,760.9 378,218.5 311,632.9153,969.2 158,381.4 151,551.3
Corn7,377.3 7,770.6 7,518.8
90,150.5 100,629.4 92,405.649,059.0 51,674.6 49,999.8
10,335.1 10,740.1 11,062.9 Cattle 22,530.0 23,641.6 24,540.5 Hog 192,484.2 204,104.9 206,944.2 Goat 8,054.9 8,649.1 8,917.2 Dairy 593.7 621.5 653.0
Chicken 131,668.6 142,951.1 144,789.4 Duck 2,662.6 2,807.0 2,827.4 Chicken eggs 38,629.0 40,147.6 42,654.6 Duck eggs 3,522.6 3,662.0 3,787.6
Status of irrigation 2012 2013 2014 (Area in hectares) Total irrigable area 3,126,340 3,019,609 3,019,609
Total service area 1,626,510 1,678,595 1,708,063 National 722,583 740,214 750,168 Communal 534,403 576,419 595,653 Private 200,018 194,620 194,841
55.5 55.6 56.6
Gross value added in agriculture1,054,422 1,093,074 1,226,200
279,467 301,314 362,501 Corn 82,093 78,379 87,725 Coconut, including copra 77,150 77,110 98,709
Continued
Palay Volume of production (Th MT) Value of production (MP) At current prices At constant 2000 prices
Volume of production (Th MT) Value of production (MP) At current prices At constant 2000 prices
Livestock inventory (Th Head) Carabao
Poultry inventory (Th Head)
Irrigation development (%)
At current prices (MP) Palay
AGRICULTURE 7
Gross value added in agriculture 2012 2013 2014
Sugarcane 29,049 28,101 28,541 Banana 87,852 95,586 106,602 Mango 24,903 18,662 18,821 Pineapple 15,962 16,340 18,110 Coffee 5,869 5,350 5,529 Cassava 17,573 18,221 16,802 Rubber 20,369 16,568 10,766 Other crops 65,410 66,307 69,719 Livestock 152,815 167,010 176,828 Poultry 112,708 118,133 129,131 Agricultural activities and services 83,201 85,994 96,416
565,097 570,322 582,064140,737 143,852 147,921
Corn 40,250 40,067 42,162 Coconut, including copra 30,493 29,429 27,987 Sugarcane 16,606 15,454 15,572 Banana 33,774 31,636 32,501 Mango 14,092 14,959 16,179 Pineapple 15,309 15,745 16,086 Coffee 3,298 2,914 2,791 Cassava 8,358 8,881 9,555 Rubber 3,358 3,372 3,434 Other crops 41,208 41,280 41,666 Livestock 93,261 94,915 95,885 Poultry 74,536 77,682 77,930 Agricultural activities and services 49,816 50,137 52,396
186.6 191.7 210.7198.6 209.5 245.1
Corn 204.0 195.6 208.1 Coconut, including copra 253.0 262.0 352.7 Sugarcane 174.9 181.8 183.3 Banana 260.1 302.1 328.0 Mango 176.7 124.8 116.3 Pineapple 104.3 103.8 112.6
Continued
At current prices (MP) - con't.
At constant 2000 prices (MP) Palay
Implicit price index (2000=100) Palay
8 AGRICULTURE
Gross value added in agriculture 2012 2013 2014
Coffee 178.0 183.6 198.1 Cassava 210.2 205.2 175.9 Rubber 606.6 491.4 313.5 Other crops 158.7 160.6 167.3 Livestock 163.9 176.0 184.4 Poultry 151.2 152.1 165.7 Agricultural activities and services 167.0 171.5 184.0
Agriculture, forestry and 2010 2012
Number 744 1,214 1,147 Total employment 127,756 151,719 148,638 Paid employees 127,001 149,769 147,266 Unpaid workers 755 1,950 1,372
16,313 21,199 27,00881,826 129,076 136,73762,624 111,606 109,831
n. a. 132,229 135,39225,927 29,774 36,918
Gross addition to tangible4,797 9,402 10,8071,368 913 1,428
619 3,524 6,294
Number 792 1,247 n. a. Total employment 9,493 12,987 n. a. Paid employees 8,521 12,034 n. a. Unpaid workers 972 953 n. a.
567 986 n. a.5,573 8,951 n. a.4,042 7,766 n. a.
Continued
Implicit price index - con't.
2013 c
fishing establishmentsa
With TE of 20 and over
Total compensation (MP) Total revenue/incomeb (MP) Total cost (MP) Total expenseb (MP) Value added (MP)
fixed assets (MP) Change in inventories (MP) Subsidies (MP)
With TE of less than 20
Total compensation (MP) Total revenue/incomeb (MP) Total cost (MP)
AGRICULTURE 9
Concluded
Agriculture, hunting and 2010 2012 forestry establishments
n. a. 8,430 n. a.1,824 2,356 n. a.
Gross addition to fixed61 645 n. a.69 329 n. a.4 32 n. a.
and forestry.
(Preliminary), Philippine Statistics Authority (PSA)
2013 c
With TE of less than 20 - con't.
Total expenseb (MP) Value added (MP)
assets (MP) Change in inventories (MP) Subsidies (MP)
p Preliminarya Prior to 2010 ASPBI, the sector only covered agriculture, hunting
b Income and expense concept was utilized beginning with the 2012 CPBI.c ASPBI, Preliminary results
Sources: countrystat.psa.gov.ph, 2002 Census of Agriculture, 2009 and 2010 Annual Survey of Philippine Business and Industry, and 2012 Census of Philippine Business and Industry
10 BANKINGAND INSURANCE
2013 2014 2015Number of financial
28,047 28,243 Banks Universal and commercial banks 5,461 5,833 5,901 Thrift banks Savings and mortgage banks 1,199 1,280 Private development banks 432 444 Stock savings and loan associations 168 165
29 31 Rural banks 2,646 2,608 2,628
18,112 17,882
Resources of financial 12,833.6
(end-of-period) Banks Universal and commercial banks 9,300.4 10,398.4 Thrift banks 916.2 Rural and cooperative banks 202.3 218.4 212.8
2,521.8 2,900.3
Gross international
83,187.0 79,540.6 80,692.4 (end-of-period) Reserve positions in the fund 594.0 570.6 437.0 Gold 7,498.4 7,483.6 7,040.8 Foreign investments 72,936.3 69,960.1 71,220.2 Foreign exchange 855.6 300.2 825.9 Special drawing rights 1,302.8 1,226.1 1,168.5
Net international reserves83,185.0 79,538.6 80,664.9
Total assets 83,187.0 79,540.6 80,666.9 Total liabilities 2.0 2.0 2.0
Continued
institutions1 28,342a
1,317a
408a
171a
Microfinance banks 31a
Nonbanks 17,886a
system (BP)2 14,433.4r 14,808.8p
10,670.8p
809.1p 976.6p
Nonbanks 2,945.6b
2015 c
reserves of BSP (M US$)
of the BSP (M US$)
BANKING 11AND INSURANCE
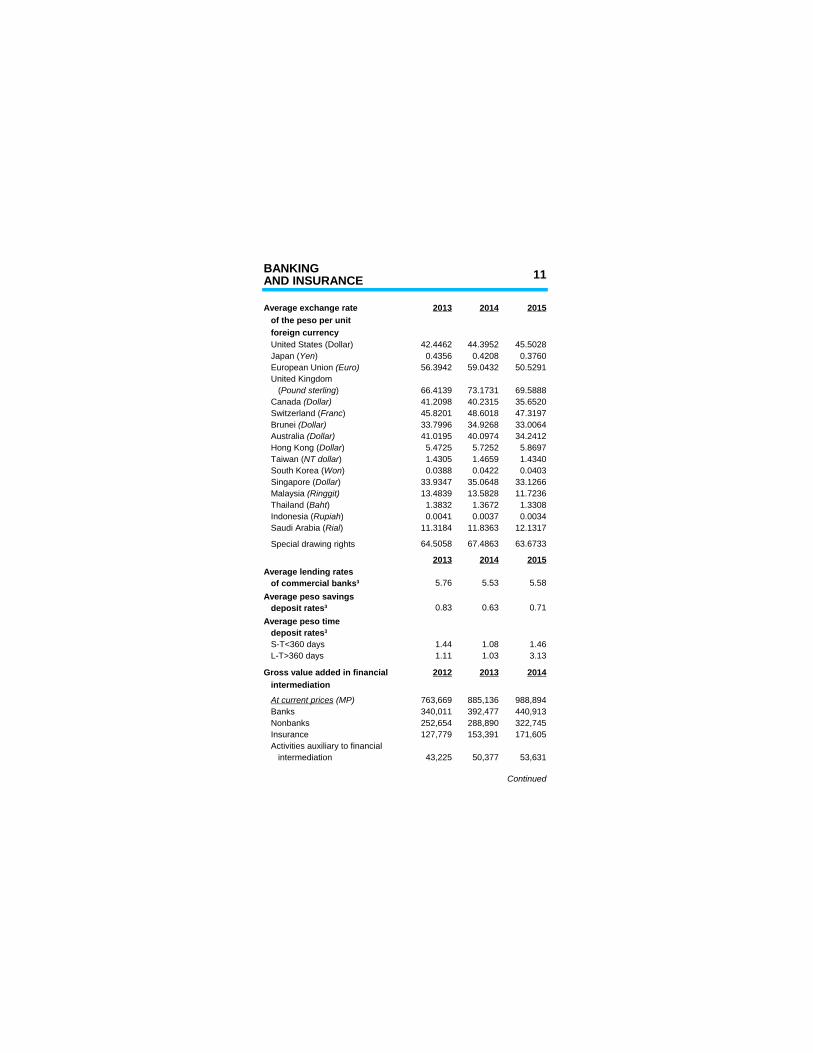
Average exchange rate 2013 2014 2015 of the peso per unit foreign currency United States (Dollar) 42.4462 44.3952 45.5028
0.4356 0.4208 0.376056.3942 59.0432 50.5291
United Kingdom66.4139 73.1731 69.588841.2098 40.2315 35.652045.8201 48.6018 47.319733.7996 34.9268 33.006441.0195 40.0974 34.24125.4725 5.7252 5.86971.4305 1.4659 1.43400.0388 0.0422 0.0403
33.9347 35.0648 33.126613.4839 13.5828 11.72361.3832 1.3672 1.33080.0041 0.0037 0.0034
11.3184 11.8363 12.1317
Special drawing rights 64.5058 67.4863 63.6733
2013 2014 2015Average lending rates
5.76 5.53 5.58Average peso savings
0.83 0.63 0.71Average peso time
S-T<360 days 1.44 1.08 1.46 L-T>360 days 1.11 1.03 3.13
Gross value added in financial 2012 2013 2014
763,669 885,136 988,894 Banks 340,011 392,477 440,913
252,654 288,890 322,745 Insurance 127,779 153,391 171,605 Activities auxiliary to financial
43,225 50,377 53,631
Continued
Japan (Yen) European Union (Euro)
(Pound sterling) Canada (Dollar) Switzerland (Franc) Brunei (Dollar) Australia (Dollar) Hong Kong (Dollar) Taiwan (NT dollar) South Korea (Won) Singapore (Dollar) Malaysia (Ringgit) Thailand (Baht) Indonesia (Rupiah) Saudi Arabia (Rial)
of commercial banks3
deposit rates3
deposit rates3
intermediation
At current prices (MP)
Nonbanks
intermediation
12 BANKINGAND INSURANCE
2012 2013 2014Gross value added in financial
426,787 480,683 515,484 Banks 190,120 213,251 229,945
141,200 156,905 168,248 Insurance 71,315 83,183 89,338 Activities auxiliary to financial
24,152 27,344 27,953
178.9 184.1 191.8 Banks 178.8 184.0 191.7
178.9 184.1 191.8 Insurance 179.2 184.4 192.1 Activities auxiliary to financial
179.0 184.2 191.9
2009 2010Financial and insurance activities establishments
Number 656 648 1,066 Total employment 159,603 162,520 248,227 Paid employees 159,342 162,165 247,267 Unpaid workers 261 355 960
81,368.4 80,648.0 126,821.4717,954.2 864,283.2 963,167.0472,075.6 490,895.0 698,455.7342,342.1 494,136.7 473,130.6
Gross additions to fixed10,645.1 10,019.6 18,567.1
(238.1) 4.9 (2.1)4,732.8 3,138.7 3,997.5
Continued
intermediation - con't.
At constant 2000 prices (MP)
Nonbanks
intermediation
Implicit price index (2000=100)
Nonbanks
intermediation
2012 d
With TE of 20 and over
Total compensation (MP) Total income/revenue (MP) Total cost (MP) Value added (MP)
assets (MP) Change in inventories (MP) Subsidies (MP)
BANKING 13AND INSURANCE
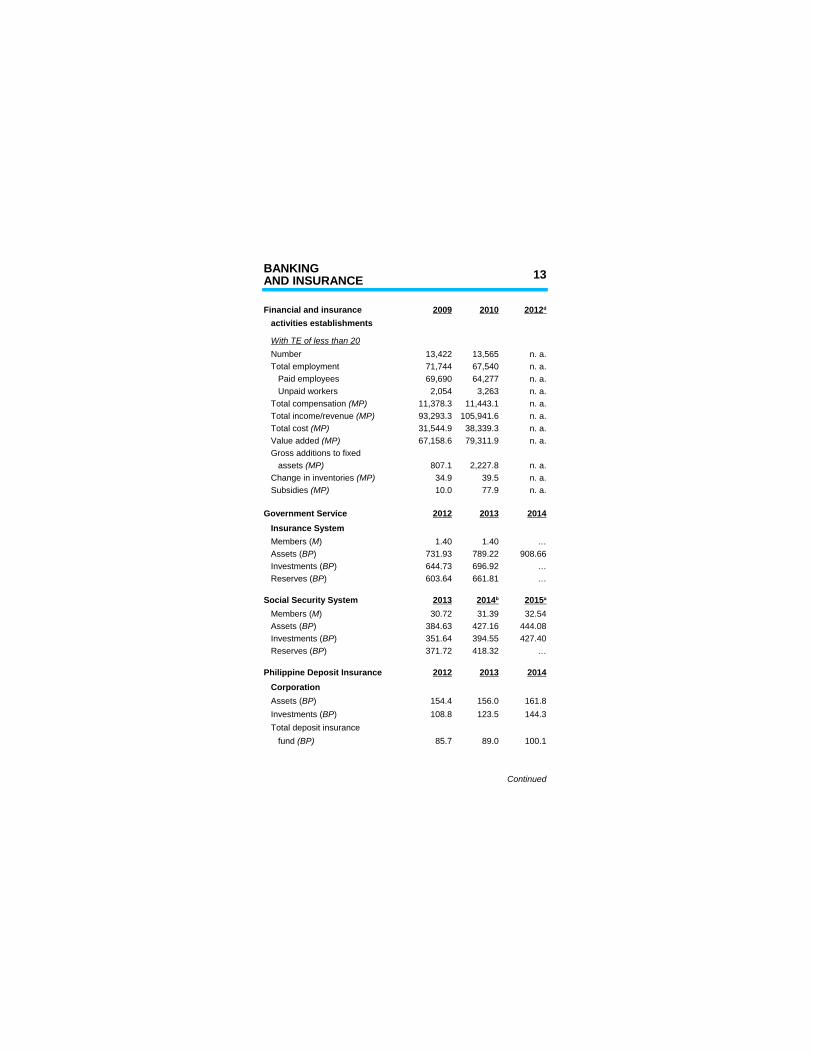
Financial and insurance 2009 2010 activities establishments
Number 13,422 13,565 n. a. Total employment 71,744 67,540 n. a. Paid employees 69,690 64,277 n. a. Unpaid workers 2,054 3,263 n. a.
11,378.3 11,443.1 n. a.93,293.3 105,941.6 n. a.31,544.9 38,339.3 n. a.67,158.6 79,311.9 n. a.
Gross additions to fixed807.1 2,227.8 n. a.34.9 39.5 n. a.10.0 77.9 n. a.
Government Service 2012 2013 2014 Insurance System
1.40 1.40 …731.93 789.22 908.66644.73 696.92 …603.64 661.81 …
Social Security System 201330.72 31.39 32.54
384.63 427.16 444.08351.64 394.55 427.40371.72 418.32 …
Philippine Deposit Insurance 2012 2013 2014 Corporation
154.4 156.0 161.8108.8 123.5 144.3
Total deposit insurance85.7 89.0 100.1
Continued
2012 d
With TE of less than 20
Total compensation (MP) Total income/revenue (MP) Total cost (MP) Value added (MP)
assets (MP) Change in inventories (MP) Subsidies (MP)
Members (M) Assets (BP) Investments (BP) Reserves (BP)
2014 b 2015 a
Members (M) Assets (BP) Investments (BP) Reserves (BP)
Assets (BP) Investments (BP)
fund (BP)
14 BANKINGAND INSURANCE
Concluded
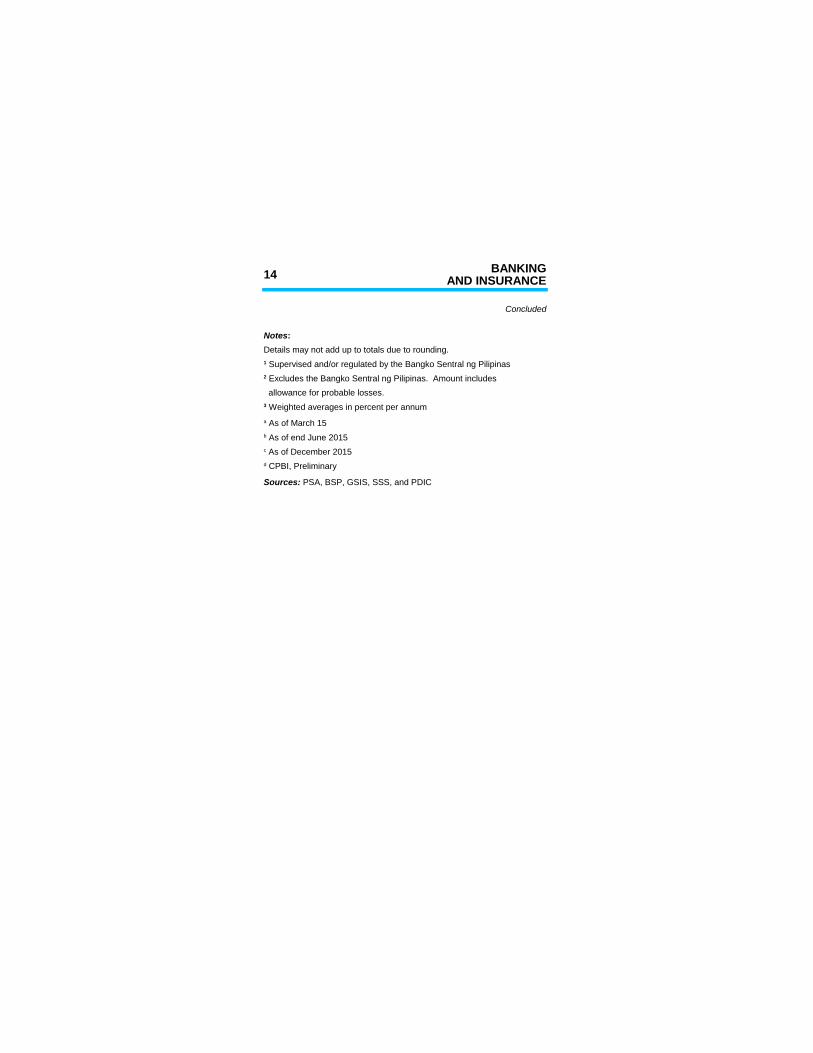
Details may not add up to totals due to rounding.
allowance for probable losses.
Notes:
1 Supervised and/or regulated by the Bangko Sentral ng Pilipinas2 Excludes the Bangko Sentral ng Pilipinas. Amount includes
3 Weighted averages in percent per annuma As of March 15b As of end June 2015c As of December 2015d CPBI, Preliminary
Sources: PSA, BSP, GSIS, SSS, and PDIC
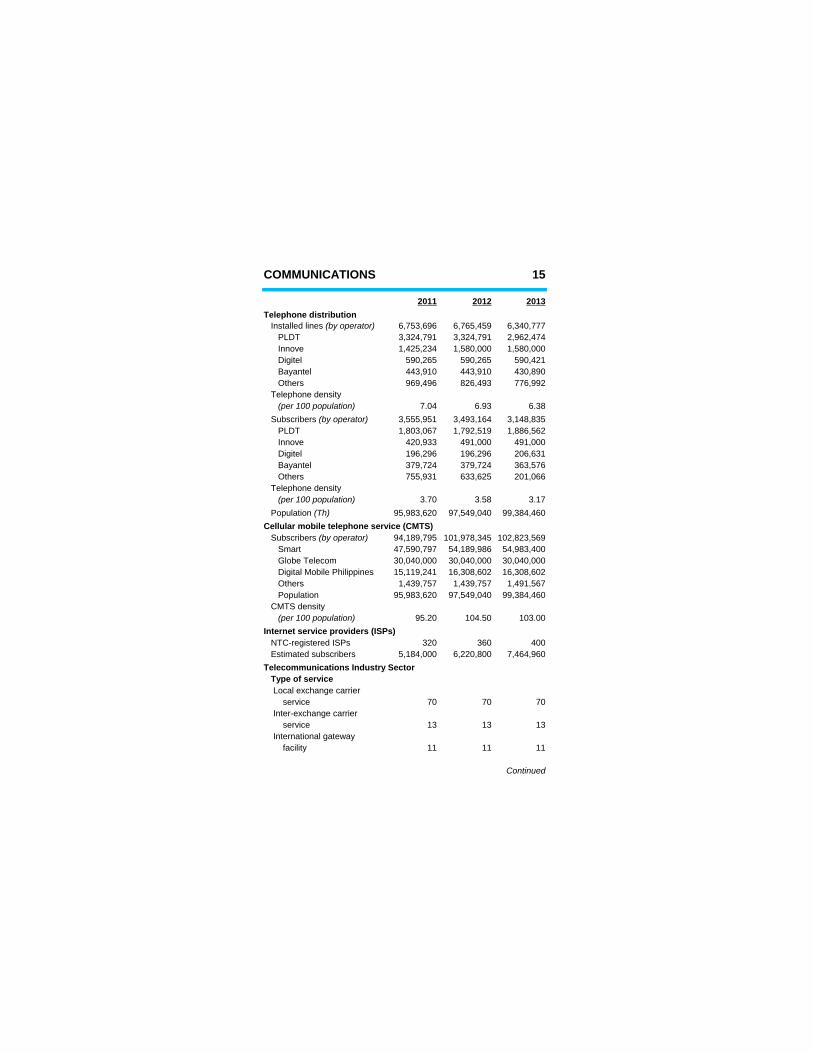
COMMUNICATIONS 15
2011 2012 2013Telephone distribution
6,753,696 6,765,459 6,340,777 PLDT 3,324,791 3,324,791 2,962,474
1,425,234 1,580,000 1,580,000590,265 590,265 590,421443,910 443,910 430,890
Others 969,496 826,493 776,992 Telephone density
7.04 6.93 6.383,555,951 3,493,164 3,148,835
PLDT 1,803,067 1,792,519 1,886,562420,933 491,000 491,000196,296 196,296 206,631379,724 379,724 363,576
Others 755,931 633,625 201,066 Telephone density
3.70 3.58 3.1795,983,620 97,549,040 99,384,460
Cellular mobile telephone service (CMTS)94,189,795 101,978,345 102,823,569
Smart 47,590,797 54,189,986 54,983,40030,040,000 30,040,000 30,040,000
Digital Mobile Philippines 15,119,241 16,308,602 16,308,602 Others 1,439,757 1,439,757 1,491,567 Population 95,983,620 97,549,040 99,384,460 CMTS density
95.20 104.50 103.00
320 360 400 Estimated subscribers 5,184,000 6,220,800 7,464,960Telecommunications Industry Sector Type of service
service 70 70 70
service 13 13 13
facility 11 11 11
Continued
Installed lines (by operator)
Innove Digitel Bayantel
(per 100 population) Subscribers (by operator)
Innove Digitel Bayantel
(per 100 population) Population (Th)
Subscribers (by operator)
Globe Telecom
(per 100 population)Internet service providers (ISPs) NTC-registered ISPs
Local exchange carrier
Inter-exchange carrier
International gateway
16 COMMUNICATIONS
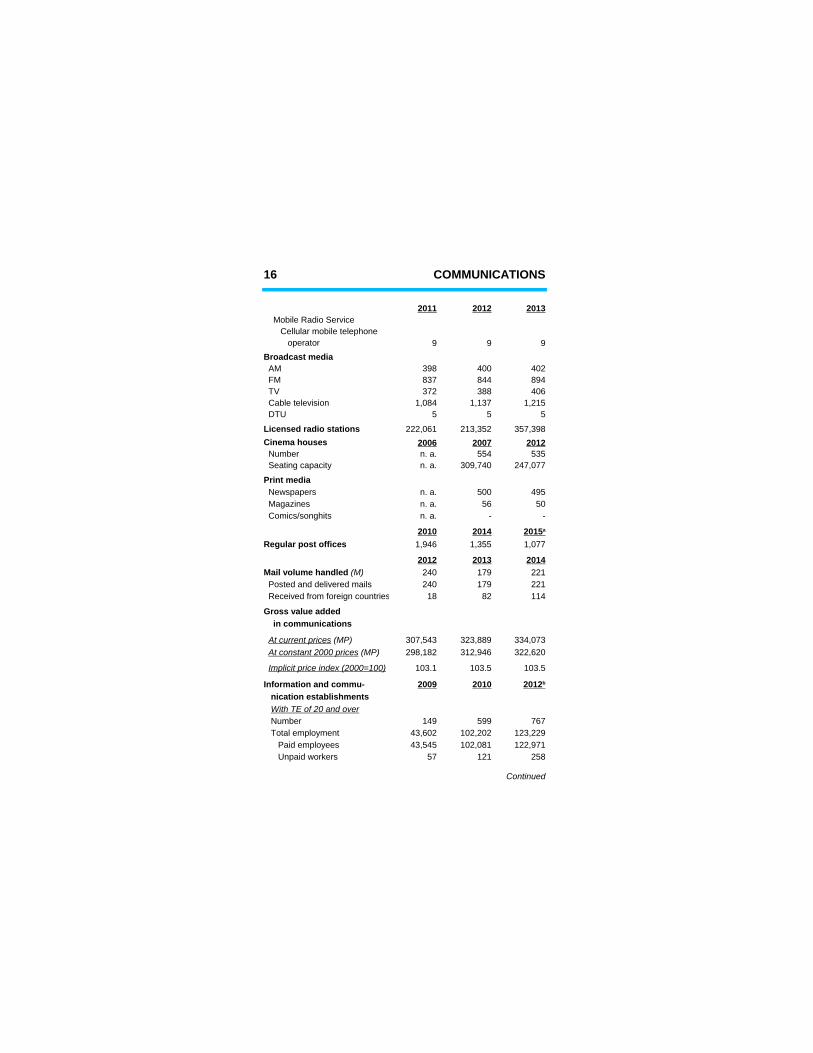
2011 2012 2013
Cellular mobile telephone operator 9 9 9Broadcast media AM 398 400 402 FM 837 844 894 TV 372 388 406 Cable television 1,084 1,137 1,215 DTU 5 5 5
Licensed radio stations 222,061 213,352 357,398Cinema houses 2006 2007 2012 Number n. a. 554 535 Seating capacity n. a. 309,740 247,077
Print media Newspapers n. a. 500 495 Magazines n. a. 56 50
n. a. - -
2010 2014Regular post offices 1,946 1,355 1,077
2012 2013 2014240 179 221
Posted and delivered mails 240 179 221 Received from foreign countries 18 82 114
Gross value added in communications
307,543 323,889 334,073298,182 312,946 322,620
103.1 103.5 103.5
2009 2010
Number 149 599 767 Total employment 43,602 102,202 123,229 Paid employees 43,545 102,081 122,971 Unpaid workers 57 121 258
Continued
Mobile Radio Service
Comics/songhits
2015 a
Mail volume handled (M)
At current prices (MP) At constant 2000 prices (MP)
Implicit price index (2000=100)
Information and commu- 2012 b
nication establishments With TE of 20 and over
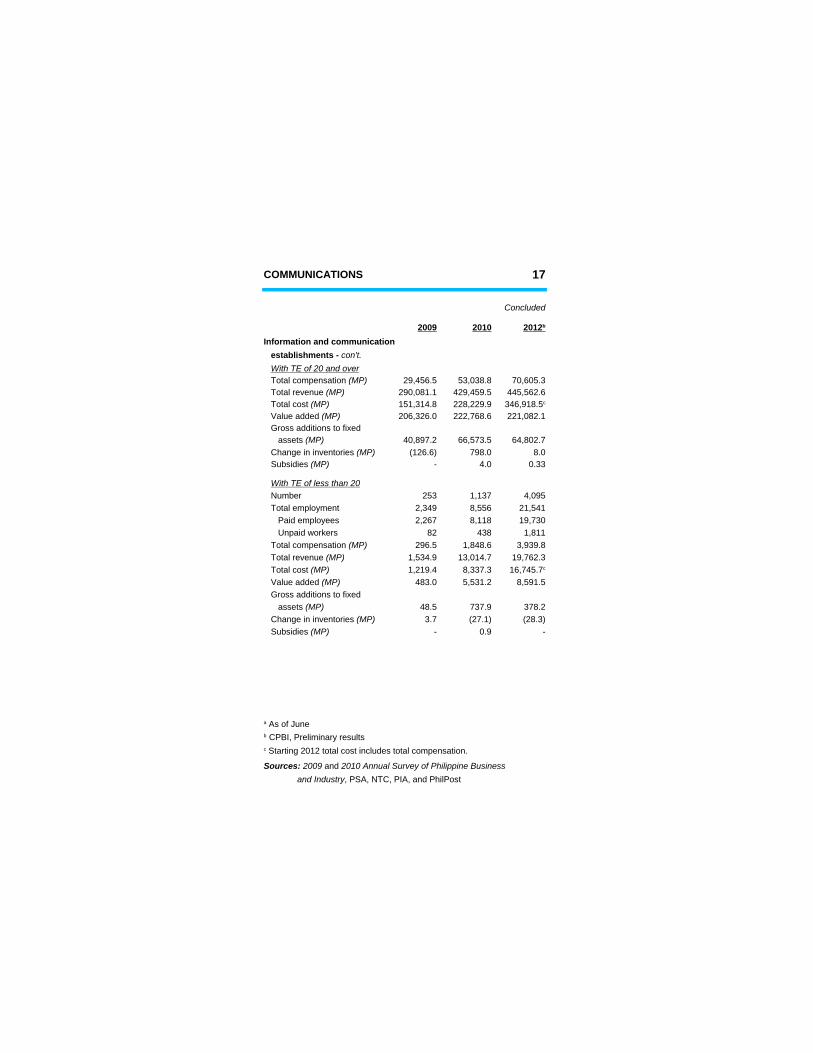
COMMUNICATIONS 17
Concluded
2009 2010Information and communication
29,456.5 53,038.8 70,605.3290,081.1 429,459.5 445,562.6151,314.8 228,229.9206,326.0 222,768.6 221,082.1
Gross additions to fixed40,897.2 66,573.5 64,802.7
(126.6) 798.0 8.0- 4.0 0.33
Number 253 1,137 4,095 Total employment 2,349 8,556 21,541 Paid employees 2,267 8,118 19,730 Unpaid workers 82 438 1,811
296.5 1,848.6 3,939.81,534.9 13,014.7 19,762.31,219.4 8,337.3
483.0 5,531.2 8,591.5 Gross additions to fixed
48.5 737.9 378.23.7 (27.1) (28.3)
- 0.9 -
2012 b
establishments - con't. With TE of 20 and over Total compensation (MP) Total revenue (MP) Total cost (MP) 346,918.5c
Value added (MP)
assets (MP) Change in inventories (MP) Subsidies (MP)
With TE of less than 20
Total compensation (MP) Total revenue (MP) Total cost (MP) 16,745.7c
Value added (MP)
assets (MP) Change in inventories (MP) Subsidies (MP)
a As of Juneb CPBI, Preliminary resultsc Starting 2012 total cost includes total compensation.
Sources: 2009 and 2010 Annual Survey of Philippine Business and Industry, PSA, NTC, PIA, and PhilPost
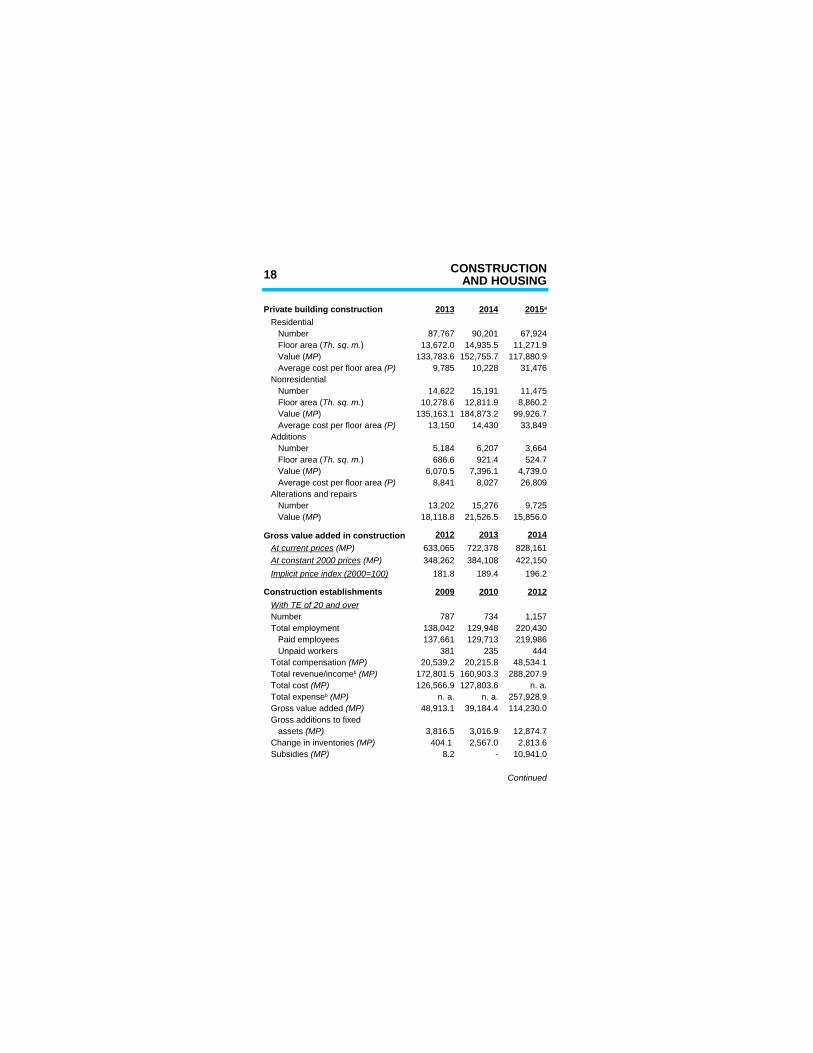
18 CONSTRUCTIONAND HOUSING
Private building construction 2013 2014 Residential Number 87,767 90,201 67,924
13,672.0 14,935.5 11,271.9133,783.6 152,755.7 117,880.9
9,785 10,228 31,476 Nonresidential Number 14,622 15,191 11,475
10,278.6 12,811.9 8,860.2135,163.1 184,873.2 99,926.7
13,150 14,430 33,849 Additions Number 5,184 6,207 3,664
686.6 921.4 524.76,070.5 7,396.1 4,739.0
8,841 8,027 26,809 Alterations and repairs Number 13,202 15,276 9,725
18,118.8 21,526.5 15,856.0
Gross value added in construction 2012 2013 2014633,065 722,378 828,161348,262 384,108 422,150
181.8 189.4 196.2
Construction establishments 2009 2010 2012
Number 787 734 1,157 Total employment 138,042 129,948 220,430 Paid employees 137,661 129,713 219,986 Unpaid workers 381 235 444
20,539.2 20,215.8 48,534.1172,801.5 160,903.3 288,207.9126,566.9 127,803.6 n. a.
n. a. n. a. 257,928.948,913.1 39,184.4 114,230.0
Gross additions to fixed3,816.5 3,016.9 12,874.7404.1 2,567.0 2,813.6
8.2 - 10,941.0
Continued
2015 a
Floor area (Th. sq. m.) Value (MP) Average cost per floor area (P)
Floor area (Th. sq. m.) Value (MP) Average cost per floor area (P)
Floor area (Th. sq. m.) Value (MP) Average cost per floor area (P)
Value (MP)
At current prices (MP) At constant 2000 prices (MP) Implicit price index (2000=100)
With TE of 20 and over
Total compensation (MP) Total revenue/incomeb (MP) Total cost (MP) Total expenseb (MP) Gross value added (MP)
assets (MP) Change in inventories (MP) Subsidies (MP)
CONSTRUCTION 19AND HOUSING
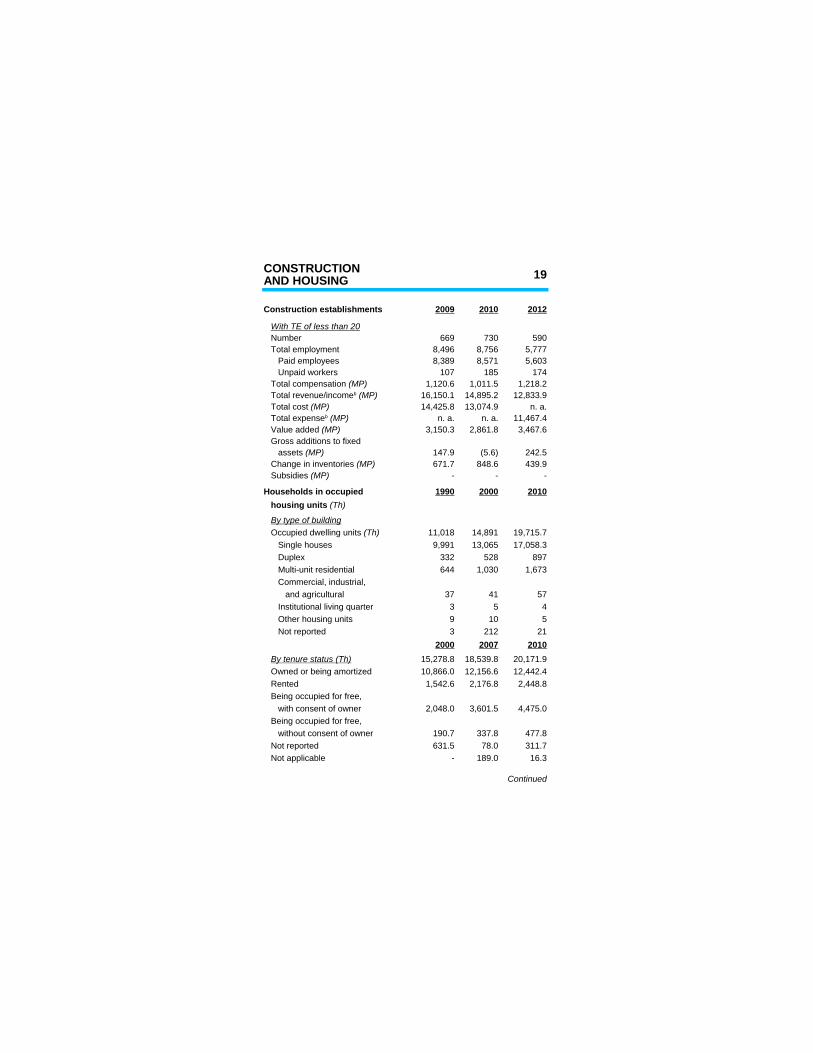
Construction establishments 2009 2010 2012
Number 669 730 590 Total employment 8,496 8,756 5,777 Paid employees 8,389 8,571 5,603 Unpaid workers 107 185 174
1,120.6 1,011.5 1,218.216,150.1 14,895.2 12,833.914,425.8 13,074.9 n. a.
n. a. n. a. 11,467.43,150.3 2,861.8 3,467.6
Gross additions to fixed147.9 (5.6) 242.5671.7 848.6 439.9
- - -
Households in occupied 1990 2000 2010
11,018 14,891 19,715.7 Single houses 9,991 13,065 17,058.3 Duplex 332 528 897
644 1,030 1,673 Commercial, industrial, and agricultural 37 41 57 Institutional living quarter 3 5 4 Other housing units 9 10 5 Not reported 3 212 21
2000 2007 201015,278.8 18,539.8 20,171.9
Owned or being amortized 10,866.0 12,156.6 12,442.4 Rented 1,542.6 2,176.8 2,448.8 Being occupied for free, with consent of owner 2,048.0 3,601.5 4,475.0 Being occupied for free, without consent of owner 190.7 337.8 477.8 Not reported 631.5 78.0 311.7 Not applicable - 189.0 16.3
Continued
With TE of less than 20
Total compensation (MP) Total revenue/incomeb (MP) Total cost (MP) Total expenseb (MP) Value added (MP)
assets (MP) Change in inventories (MP) Subsidies (MP)
housing units (Th)
By type of building Occupied dwelling units (Th)
Multi-unit residential
By tenure status (Th)
20 CONSTRUCTIONAND HOUSING
Households in occupied 1990 2000 2010
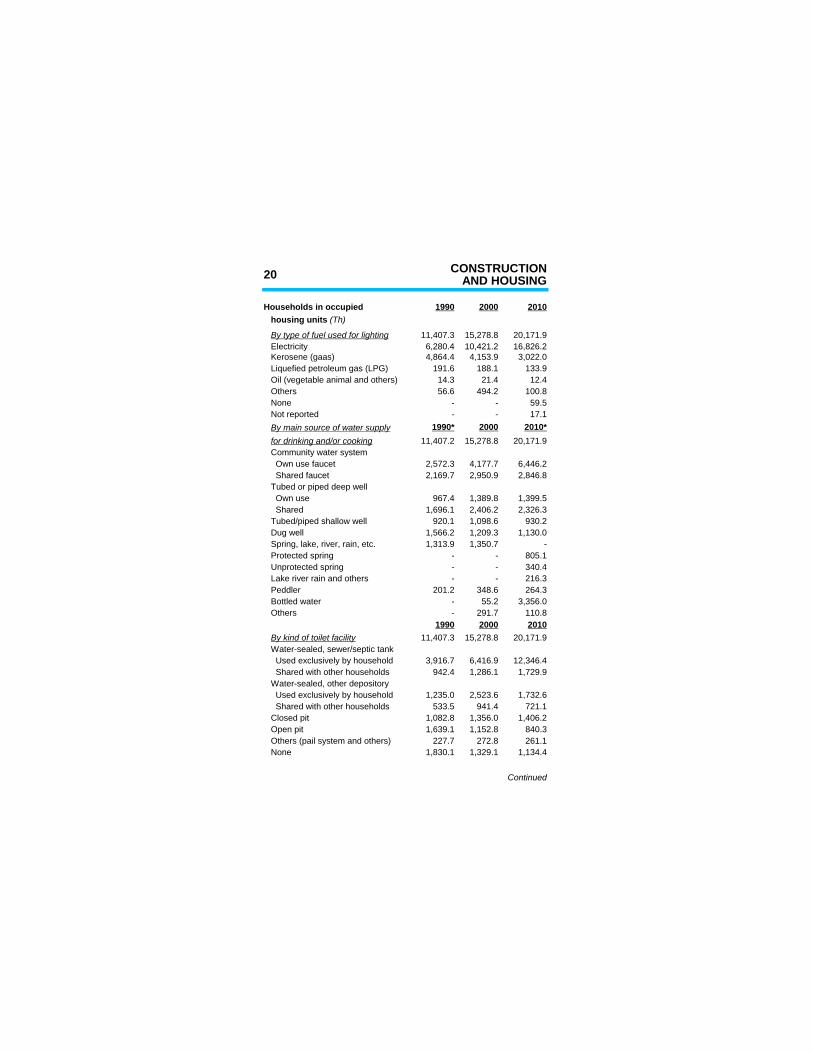
11,407.3 15,278.8 20,171.9 Electricity 6,280.4 10,421.2 16,826.2
4,864.4 4,153.9 3,022.0 Liquefied petroleum gas (LPG) 191.6 188.1 133.9 Oil (vegetable animal and others) 14.3 21.4 12.4 Others 56.6 494.2 100.8 None - - 59.5 Not reported - - 17.1
1990* 2000 2010*11,407.2 15,278.8 20,171.9
Community water system Own use faucet 2,572.3 4,177.7 6,446.2 Shared faucet 2,169.7 2,950.9 2,846.8 Tubed or piped deep well Own use 967.4 1,389.8 1,399.5 Shared 1,696.1 2,406.2 2,326.3 Tubed/piped shallow well 920.1 1,098.6 930.2 Dug well 1,566.2 1,209.3 1,130.0 Spring, lake, river, rain, etc. 1,313.9 1,350.7 - Protected spring - - 805.1 Unprotected spring - - 340.4 Lake river rain and others - - 216.3 Peddler 201.2 348.6 264.3 Bottled water - 55.2 3,356.0 Others - 291.7 110.8
1990 2000 201011,407.3 15,278.8 20,171.9
Water-sealed, sewer/septic tank Used exclusively by household 3,916.7 6,416.9 12,346.4 Shared with other households 942.4 1,286.1 1,729.9 Water-sealed, other depository Used exclusively by household 1,235.0 2,523.6 1,732.6 Shared with other households 533.5 941.4 721.1 Closed pit 1,082.8 1,356.0 1,406.2 Open pit 1,639.1 1,152.8 840.3 Others (pail system and others) 227.7 272.8 261.1 None 1,830.1 1,329.1 1,134.4
Continued
housing units (Th)
By type of fuel used for lighting
Kerosene (gaas)
By main source of water supply for drinking and/or cooking
By kind of toilet facility
CONSTRUCTION 21AND HOUSING
1990 2000 2010
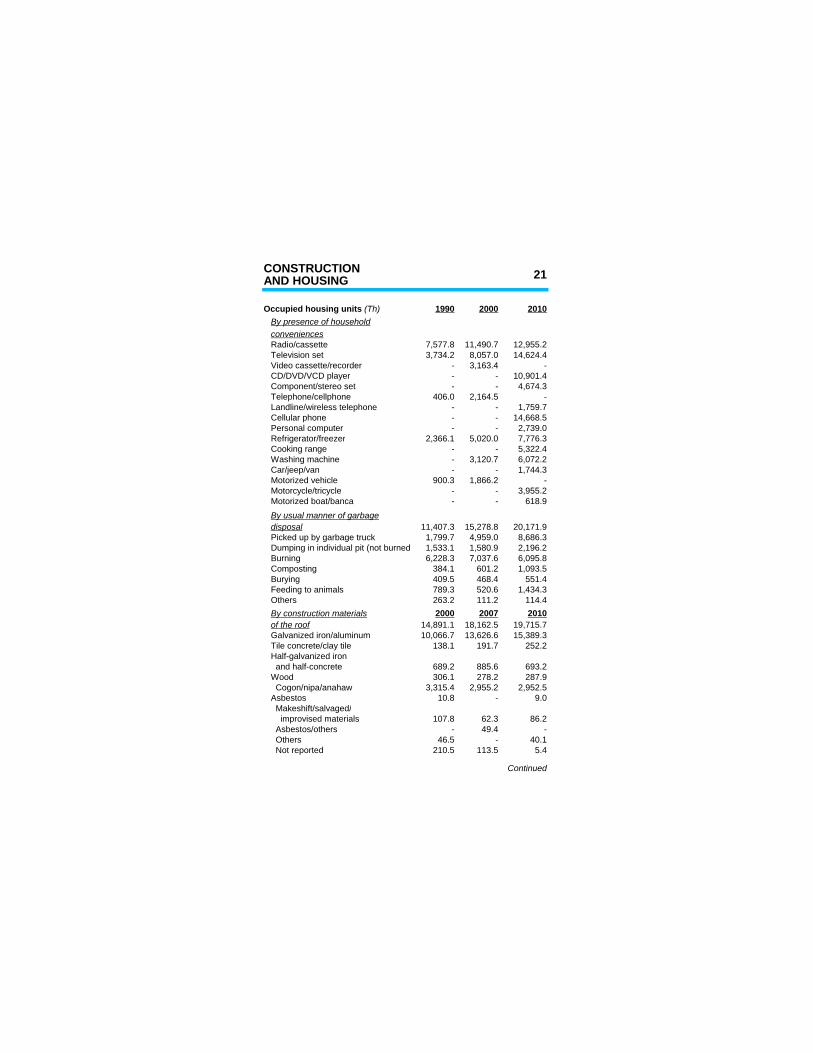
Radio/cassette 7,577.8 11,490.7 12,955.2 Television set 3,734.2 8,057.0 14,624.4 Video cassette/recorder - 3,163.4 - CD/DVD/VCD player - - 10,901.4 Component/stereo set - - 4,674.3 Telephone/cellphone 406.0 2,164.5 -
- - 1,759.7 Cellular phone - - 14,668.5 Personal computer - - 2,739.0 Refrigerator/freezer 2,366.1 5,020.0 7,776.3 Cooking range - - 5,322.4 Washing machine - 3,120.7 6,072.2 Car/jeep/van - - 1,744.3 Motorized vehicle 900.3 1,866.2 - Motorcycle/tricycle - - 3,955.2
- - 618.9
11,407.3 15,278.8 20,171.9 Picked up by garbage truck 1,799.7 4,959.0 8,686.3 Dumping in individual pit (not burned 1,533.1 1,580.9 2,196.2 Burning 6,228.3 7,037.6 6,095.8 Composting 384.1 601.2 1,093.5 Burying 409.5 468.4 551.4 Feeding to animals 789.3 520.6 1,434.3 Others 263.2 111.2 114.4
2000 2007 201014,891.1 18,162.5 19,715.7
Galvanized iron/aluminum 10,066.7 13,626.6 15,389.3 Tile concrete/clay tile 138.1 191.7 252.2 Half-galvanized iron and half-concrete 689.2 885.6 693.2 Wood 306.1 278.2 287.9
3,315.4 2,955.2 2,952.5 Asbestos 10.8 - 9.0 Makeshift/salvaged/ improvised materials 107.8 62.3 86.2 Asbestos/others - 49.4 - Others 46.5 - 40.1 Not reported 210.5 113.5 5.4
Continued
Occupied housing units (Th) By presence of household conveniences
Landline/wireless telephone
Motorized boat/banca By usual manner of garbage disposal
By construction materials of the roof
Cogon/nipa/anahaw
22 CONSTRUCTIONAND HOUSING
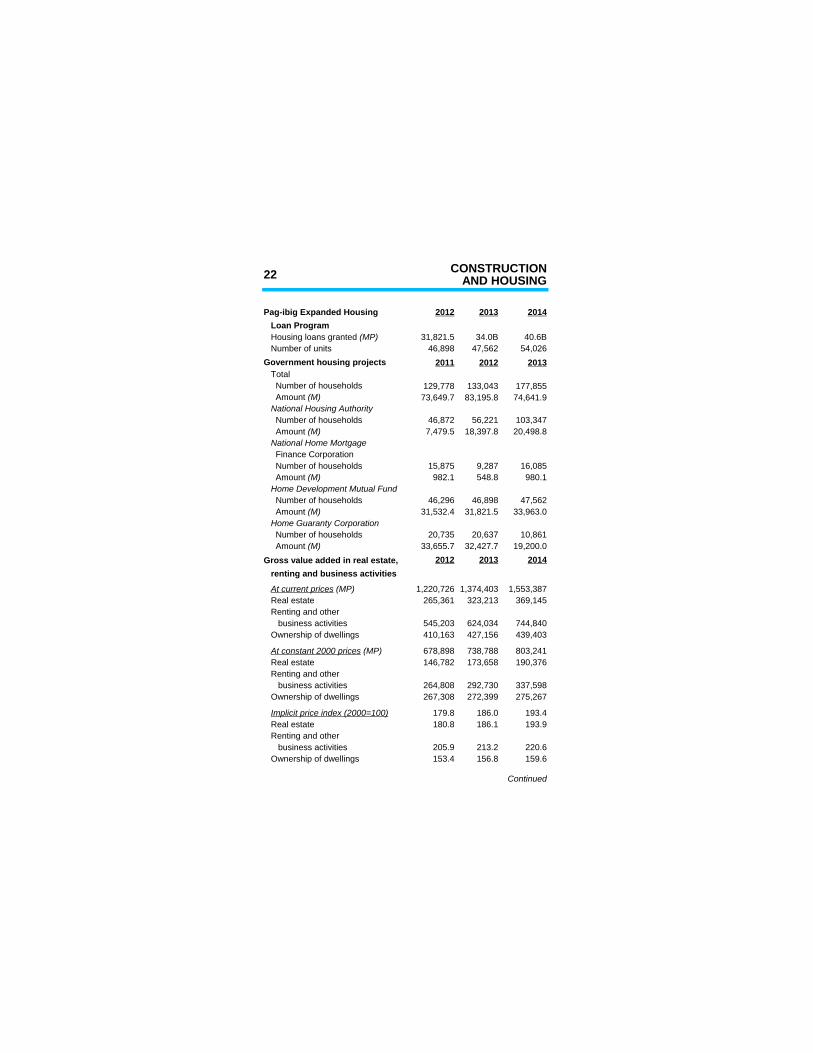
2012 2013 2014 Loan Program
31,821.5 34.0B 40.6B Number of units 46,898 47,562 54,026Government housing projects 2011 2012 2013 Total Number of households 129,778 133,043 177,855
73,649.7 83,195.8 74,641.9
Number of households 46,872 56,221 103,3477,479.5 18,397.8 20,498.8
National Home Mortgage
Number of households 15,875 9,287 16,085982.1 548.8 980.1
Home Development Mutual Fund Number of households 46,296 46,898 47,562
31,532.4 31,821.5 33,963.0 Home Guaranty Corporation Number of households 20,735 20,637 10,861
33,655.7 32,427.7 19,200.0Gross value added in real estate, 2012 2013 2014 renting and business activities
1,220,726 1,374,403 1,553,387 Real estate 265,361 323,213 369,145 Renting and other business activities 545,203 624,034 744,840 Ownership of dwellings 410,163 427,156 439,403
678,898 738,788 803,241 Real estate 146,782 173,658 190,376 Renting and other business activities 264,808 292,730 337,598 Ownership of dwellings 267,308 272,399 275,267
179.8 186.0 193.4 Real estate 180.8 186.1 193.9 Renting and other business activities 205.9 213.2 220.6 Ownership of dwellings 153.4 156.8 159.6
Continued
Pag-ibig Expanded Housing
Housing loans granted (MP)
Amount (M) National Housing Authority
Amount (M)
Finance Corporation
Amount (M)
Amount (M)
Amount (M)
At current prices (MP)
At constant 2000 prices (MP)
Implicit price index (2000=100)
CONSTRUCTION 23AND HOUSING
Concluded
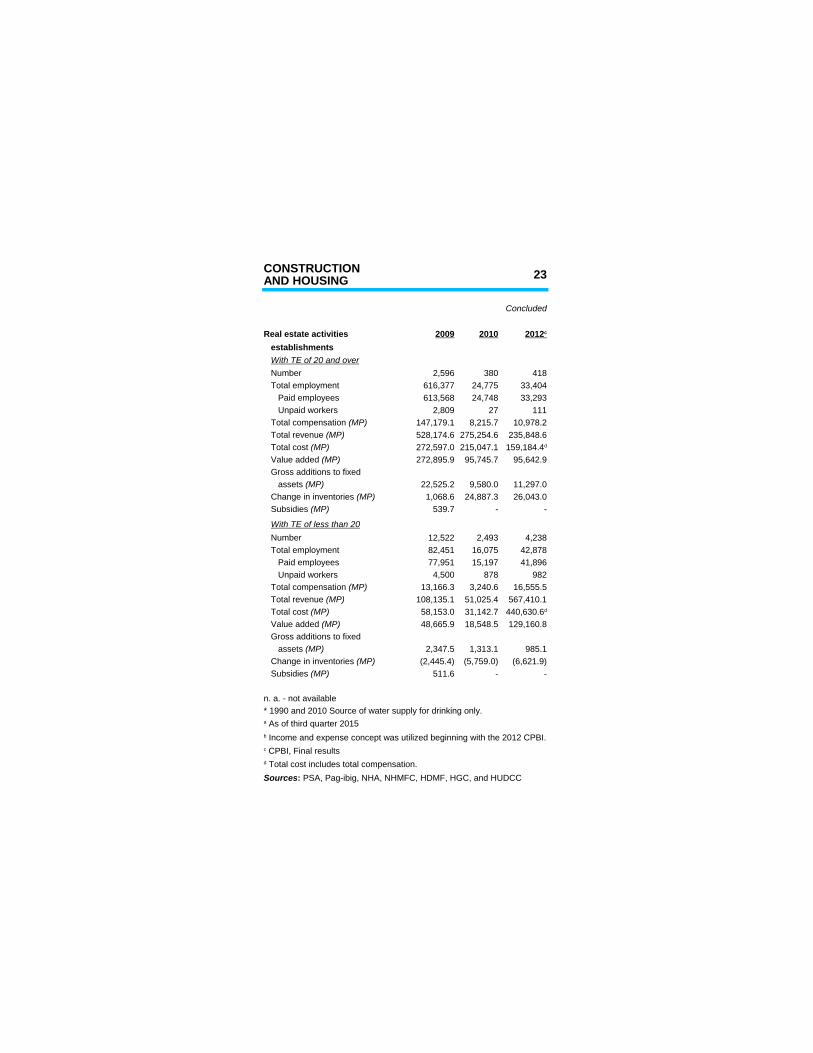
Real estate activities 2009 2010 establishments
Number 2,596 380 418 Total employment 616,377 24,775 33,404 Paid employees 613,568 24,748 33,293 Unpaid workers 2,809 27 111
147,179.1 8,215.7 10,978.2528,174.6 275,254.6 235,848.6272,597.0 215,047.1272,895.9 95,745.7 95,642.9
Gross additions to fixed22,525.2 9,580.0 11,297.01,068.6 24,887.3 26,043.0
539.7 - -
Number 12,522 2,493 4,238 Total employment 82,451 16,075 42,878 Paid employees 77,951 15,197 41,896 Unpaid workers 4,500 878 982
13,166.3 3,240.6 16,555.5108,135.1 51,025.4 567,410.158,153.0 31,142.748,665.9 18,548.5 129,160.8
Gross additions to fixed2,347.5 1,313.1 985.1
(2,445.4) (5,759.0) (6,621.9)511.6 - -
n. a. - not available* 1990 and 2010 Source of water supply for drinking only.
2012 c
With TE of 20 and over
Total compensation (MP) Total revenue (MP) Total cost (MP) 159,184.4d
Value added (MP)
assets (MP) Change in inventories (MP) Subsidies (MP)
With TE of less than 20
Total compensation (MP) Total revenue (MP) Total cost (MP) 440,630.6d
Value added (MP)
assets (MP) Change in inventories (MP) Subsidies (MP)
a As of third quarter 2015b Income and expense concept was utilized beginning with the 2012 CPBI.c CPBI, Final resultsd Total cost includes total compensation.Sources: PSA, Pag-ibig, NHA, NHMFC, HDMF, HGC, and HUDCC
24 CRIMEAND DELINQUENCY
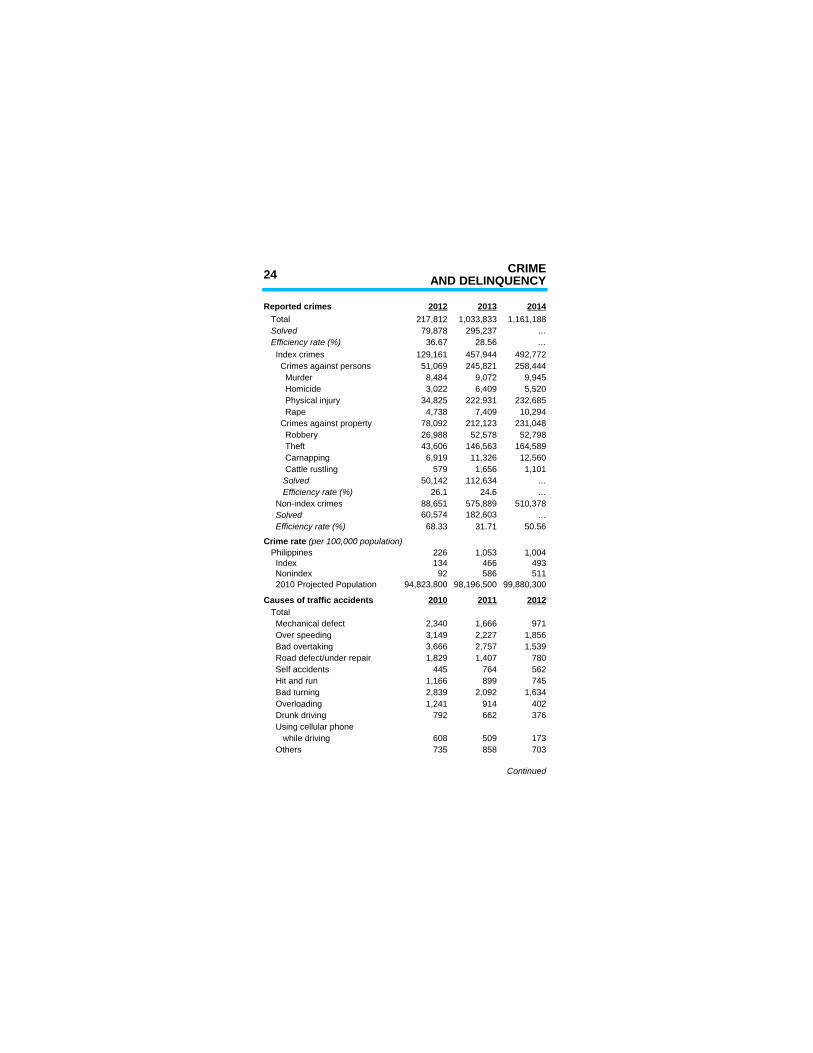
Reported crimes 2012 2013 2014 Total 217,812 1,033,833 1,161,188 Solved 79,878 295,237 … Efficiency rate (%) 36.67 28.56 … Index crimes 129,161 457,944 492,772 Crimes against persons 51,069 245,821 258,444 Murder 8,484 9,072 9,945 Homicide 3,022 6,409 5,520 Physical injury 34,825 222,931 232,685 Rape 4,738 7,409 10,294 Crimes against property 78,092 212,123 231,048 Robbery 26,988 52,578 52,798 Theft 43,606 146,563 164,589
6,919 11,326 12,560 Cattle rustling 579 1,656 1,101 Solved 50,142 112,634 … Efficiency rate (%) 26.1 24.6 … Non-index crimes 88,651 575,889 510,378 Solved 60,574 182,603 … Efficiency rate (%) 68.33 31.71 50.56
Philippines 226 1,053 1,004 Index 134 466 493
92 586 511 2010 Projected Population 94,823,800 98,196,500 99,880,300
Causes of traffic accidents 2010 2011 2012 Total Mechanical defect 2,340 1,666 971 Over speeding 3,149 2,227 1,856 Bad overtaking 3,666 2,757 1,539 Road defect/under repair 1,829 1,407 780 Self accidents 445 764 562 Hit and run 1,166 899 745 Bad turning 2,839 2,092 1,634 Overloading 1,241 914 402 Drunk driving 792 662 376 Using cellular phone while driving 608 509 173 Others 735 858 703
Continued
Carnapping
Crime rate (per 100,000 population)
Nonindex
CRIME 25AND DELINQUENCY
Concluded
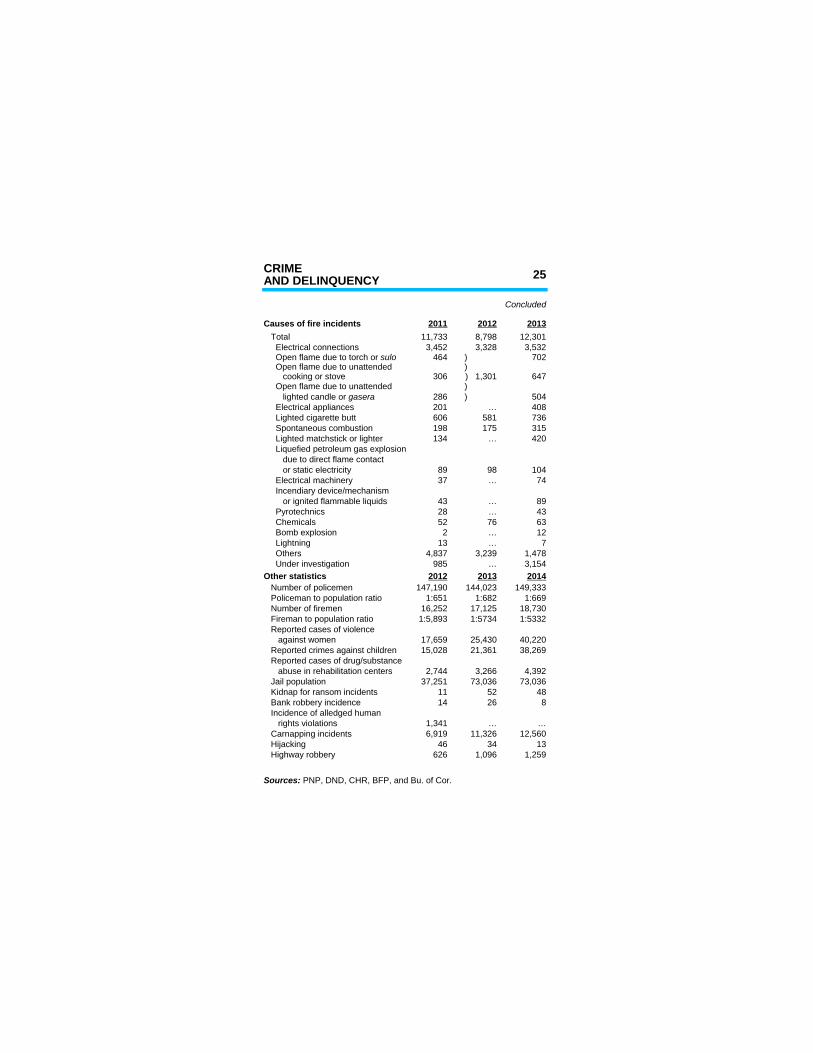
Causes of fire incidents 2011 2012 2013 Total 11,733 8,798 12,301 Electrical connections 3,452 3,328 3,532
464 ) 702 Open flame due to unattended ) cooking or stove 306 ) 1,301 647 Open flame due to unattended )
286 ) 504 Electrical appliances 201 … 408 Lighted cigarette butt 606 581 736 Spontaneous combustion 198 175 315 Lighted matchstick or lighter 134 … 420 Liquefied petroleum gas explosion due to direct flame contact or static electricity 89 98 104 Electrical machinery 37 … 74 Incendiary device/mechanism or ignited flammable liquids 43 … 89 Pyrotechnics 28 … 43 Chemicals 52 76 63 Bomb explosion 2 … 12 Lightning 13 … 7 Others 4,837 3,239 1,478 Under investigation 985 … 3,154Other statistics 2012 2013 2014 Number of policemen 147,190 144,023 149,333 Policeman to population ratio 1:651 1:682 1:669 Number of firemen 16,252 17,125 18,730 Fireman to population ratio 1:5,893 1:5734 1:5332 Reported cases of violence against women 17,659 25,430 40,220 Reported crimes against children 15,028 21,361 38,269 Reported cases of drug/substance abuse in rehabilitation centers 2,744 3,266 4,392 Jail population 37,251 73,036 73,036 Kidnap for ransom incidents 11 52 48 Bank robbery incidence 14 26 8
rights violations 1,341 … …6,919 11,326 12,560
Hijacking 46 34 13 Highway robbery 626 1,096 1,259
Open flame due to torch or sulo
lighted candle or gasera
Incidence of alledged human
Carnapping incidents
Sources: PNP, DND, CHR, BFP, and Bu. of Cor.
26 DEMOGRAPHY
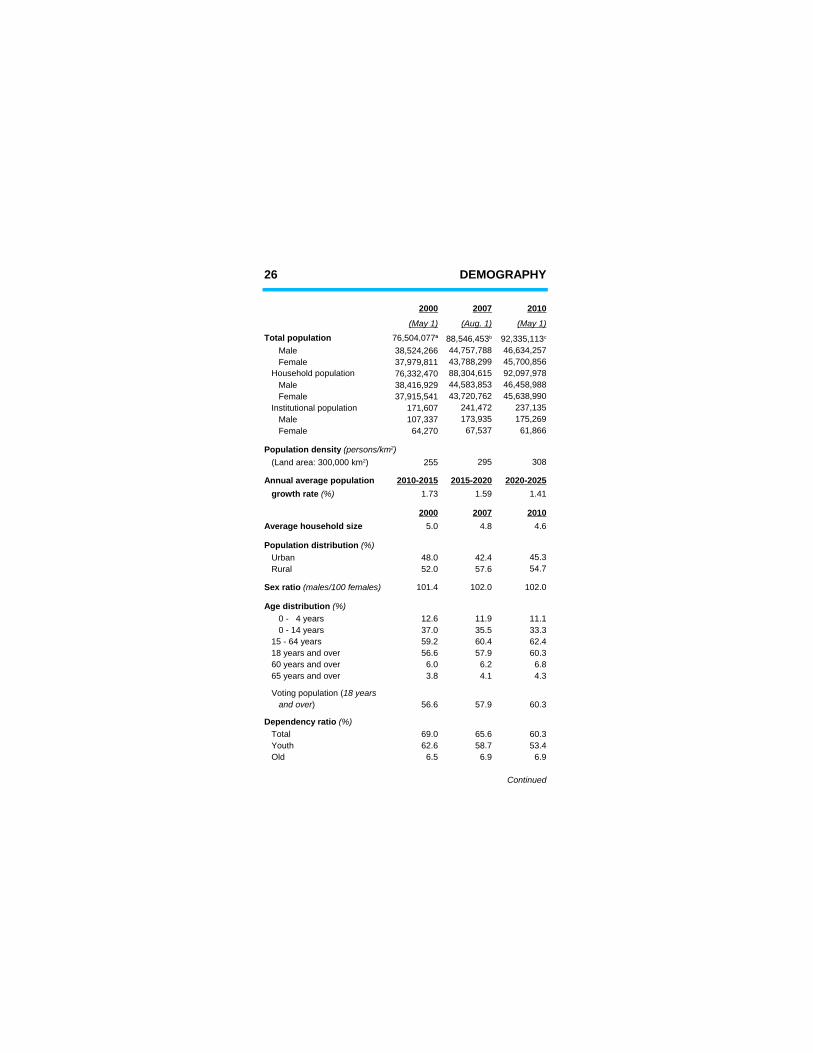
2000 2007 2010
(May 1) (Aug. 1) (May 1)
Total population Male 38,524,266 44,757,788 46,634,257 Female 37,979,811 43,788,299 45,700,856 Household population 76,332,470 88,304,615 92,097,978 Male 38,416,929 44,583,853 46,458,988 Female 37,915,541 43,720,762 45,638,990 Institutional population 171,607 241,472 237,135 Male 107,337 173,935 175,269 Female 64,270 67,537 61,866
255 295 308
Annual average population 2010-2015 2015-2020 2020-20251.73 1.59 1.41
2000 2007 2010Average household size 5.0 4.8 4.6
Urban 48.0 42.4 45.3 Rural 52.0 57.6 54.7
101.4 102.0 102.0
0 - 4 years 12.6 11.9 11.1 0 - 14 years 37.0 35.5 33.3 15 - 64 years 59.2 60.4 62.4 18 years and over 56.6 57.9 60.3 60 years and over 6.0 6.2 6.8 65 years and over 3.8 4.1 4.3
56.6 57.9 60.3
Total 69.0 65.6 60.3 Youth 62.6 58.7 53.4 Old 6.5 6.9 6.9
Continued
76,504,077a 88,546,453b 92,335,113c
Population density (persons/km2) (Land area: 300,000 km2)
growth rate (%)
Population distribution (%)
Sex ratio (males/100 females)
Age distribution (%)
Voting population (18 years and over)
Dependency ratio (%)
DEMOGRAPHY 27
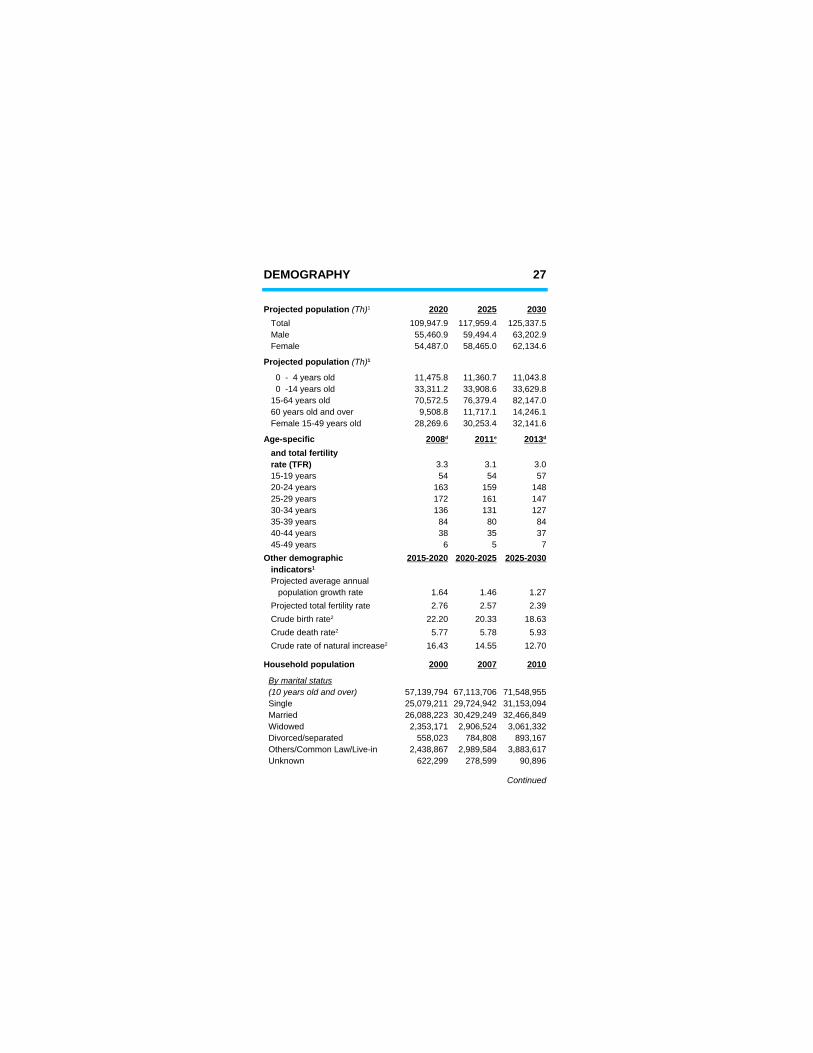
2020 2025 2030 Total 109,947.9 117,959.4 125,337.5 Male 55,460.9 59,494.4 63,202.9 Female 54,487.0 58,465.0 62,134.6
0 - 4 years old 11,475.8 11,360.7 11,043.8 0 -14 years old 33,311.2 33,908.6 33,629.8 15-64 years old 70,572.5 76,379.4 82,147.0 60 years old and over 9,508.8 11,717.1 14,246.1 Female 15-49 years old 28,269.6 30,253.4 32,141.6
Age-specific
rate (TFR) 3.3 3.1 3.0 15-19 years 54 54 57 20-24 years 163 159 148 25-29 years 172 161 147 30-34 years 136 131 127 35-39 years 84 80 84 40-44 years 38 35 37 45-49 years 6 5 7Other demographic 2015-2020 2020-2025 2025-2030
Projected average annual population growth rate 1.64 1.46 1.27 Projected total fertility rate 2.76 2.57 2.39
22.20 20.33 18.635.77 5.78 5.93
16.43 14.55 12.70
Household population 2000 2007 2010
(10 years old and over) 57,139,794 67,113,706 71,548,955 Single 25,079,211 29,724,942 31,153,094 Married 26,088,223 30,429,249 32,466,849 Widowed 2,353,171 2,906,524 3,061,332 Divorced/separated 558,023 784,808 893,167 Others/Common Law/Live-in 2,438,867 2,989,584 3,883,617 Unknown 622,299 278,599 90,896
Continued
Projected population (Th)1
Projected population (Th)1
2008 d 2011 e 2013 d
and total fertility
indicators1
Crude birth rate2
Crude death rate2
Crude rate of natural increase2
By marital status
28 DEMOGRAPHY
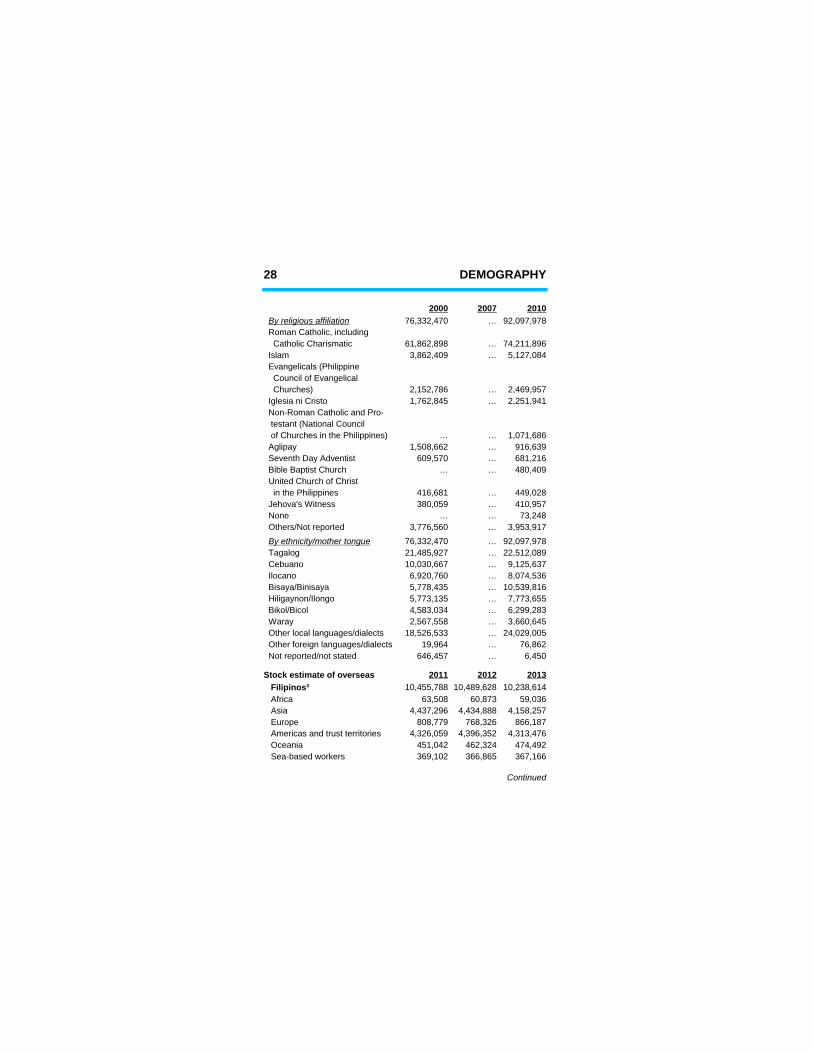
2000 2007 201076,332,470 … 92,097,978
Roman Catholic, including Catholic Charismatic 61,862,898 … 74,211,896 Islam 3,862,409 … 5,127,084 Evangelicals (Philippine Council of Evangelical Churches) 2,152,786 … 2,469,957
1,762,845 … 2,251,941 Non-Roman Catholic and Pro-
of Churches in the Philippines) … … 1,071,6861,508,662 … 916,639
Seventh Day Adventist 609,570 … 681,216 Bible Baptist Church … … 480,409 United Church of Christ in the Philippines 416,681 … 449,028
380,059 … 410,957 None … … 73,248 Others/Not reported 3,776,560 … 3,953,917
76,332,470 … 92,097,978 Tagalog 21,485,927 … 22,512,089 Cebuano 10,030,667 … 9,125,637
6,920,760 … 8,074,5365,778,435 … 10,539,8165,773,135 … 7,773,6554,583,034 … 6,299,2832,567,558 … 3,660,645
Other local languages/dialects 18,526,533 … 24,029,005 Other foreign languages/dialects 19,964 … 76,862 Not reported/not stated 646,457 … 6,450
Stock estimate of overseas 2011 2012 201310,455,788 10,489,628 10,238,614
Africa 63,508 60,873 59,036 Asia 4,437,296 4,434,888 4,158,257 Europe 808,779 768,326 866,187 Americas and trust territories 4,326,059 4,396,352 4,313,476 Oceania 451,042 462,324 474,492 Sea-based workers 369,102 366,865 367,166
Continued
By religious affiliation
Iglesia ni Cristo
testant (National Council
Aglipay
Jehova's Witness
By ethnicity/mother tongue
Ilocano Bisaya/Binisaya Hiligaynon/Ilongo Bikol/Bicol Waray
Filipinos3
DEMOGRAPHY 29
2012 2013 2014Registered Filipino emigrants 83,640 78,228 80,669
United States of America 39,124 38,637 39,594 Canada 24,354 19,041 22,479 Japan 4,759 4,554 4,341 Australia 4,259 4,748 4,467
1,170 888 974 Italy 3,818 4,526 3,275 Spain 808 868 834 United Kingdom 881 829 783 South Korea 1,632 1,419 982 Germany 553 609 578 Other countries 2,282 2,109 2,382
83,640 78,228 80,689 Male 34,076 31,288 32,368 Female 49,564 46,940 48,321
83,640 78,228 80,689 14 years old and below 18,887 17,170 18,014 15-24 years old 17,391 16,338 16,797 25-34 years old 17,714 16,606 18,074 35-44 years old 12,369 11,667 12,482 45-54 years old 6,710 6,321 6,615 55-64 years old 6,136 5,963 5,366 65 years old and over 4,433 4,162 3,341 Not reported/no response - 1 -
83,640 78,228 80,689 Not of schooling age 6,174 5,661 5,842 No formal education 61 69 95 Elementary level 10,089 9,129 9,225 Elementary graduate 2,424 2,066 1,980 High school level 9,303 8,779 8,665 High school graduate 8,707 8,444 8,422 Vocational level 1,414 1,248 1,405 Vocational graduate 4,308 4,062 4,468 College level 14,169 13,472 13,913
Continued
By country of destination
New Zealand
By sex
By age group
By educational attainment prior to migration
30 DEMOGRAPHY
2012 2013 2014
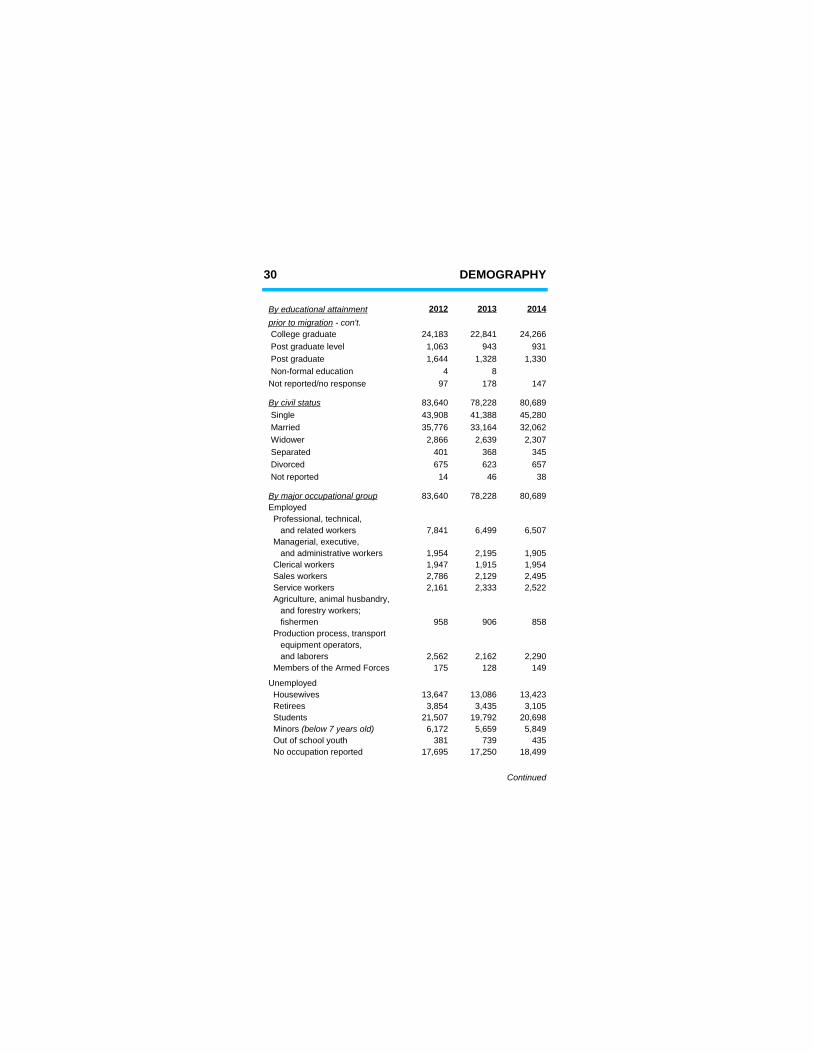
College graduate 24,183 22,841 24,266 Post graduate level 1,063 943 931 Post graduate 1,644 1,328 1,330 Non-formal education 4 8 Not reported/no response 97 178 147
83,640 78,228 80,689 Single 43,908 41,388 45,280 Married 35,776 33,164 32,062 Widower 2,866 2,639 2,307 Separated 401 368 345 Divorced 675 623 657 Not reported 14 46 38
83,640 78,228 80,689 Employed Professional, technical, and related workers 7,841 6,499 6,507 Managerial, executive, and administrative workers 1,954 2,195 1,905 Clerical workers 1,947 1,915 1,954 Sales workers 2,786 2,129 2,495 Service workers 2,161 2,333 2,522 Agriculture, animal husbandry, and forestry workers; fishermen 958 906 858 Production process, transport equipment operators, and laborers 2,562 2,162 2,290 Members of the Armed Forces 175 128 149
Unemployed Housewives 13,647 13,086 13,423 Retirees 3,854 3,435 3,105 Students 21,507 19,792 20,698
6,172 5,659 5,849 Out of school youth 381 739 435 No occupation reported 17,695 17,250 18,499
Continued
By educational attainment prior to migration - con't.
By civil status
By major occupational group
Minors (below 7 years old)
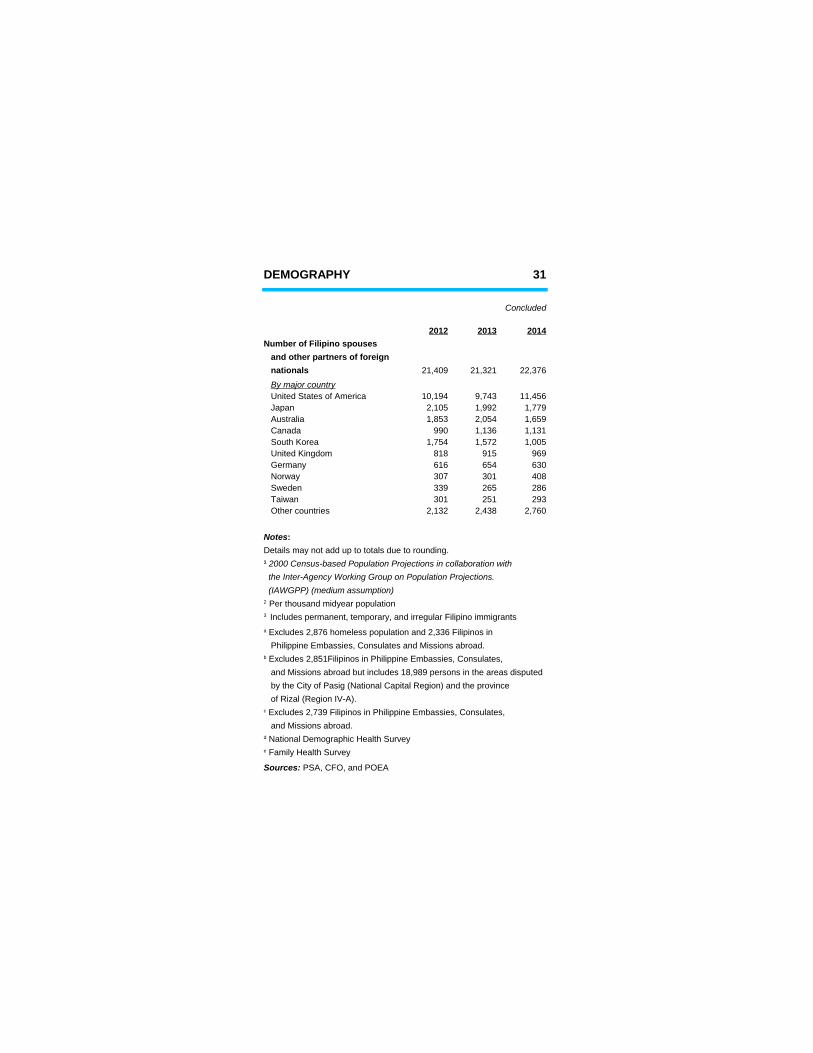
DEMOGRAPHY 31
Concluded
2012 2013 2014Number of Filipino spouses and other partners of foreign nationals 21,409 21,321 22,376
United States of America 10,194 9,743 11,456 Japan 2,105 1,992 1,779 Australia 1,853 2,054 1,659 Canada 990 1,136 1,131 South Korea 1,754 1,572 1,005 United Kingdom 818 915 969 Germany 616 654 630 Norway 307 301 408 Sweden 339 265 286 Taiwan 301 251 293 Other countries 2,132 2,438 2,760
Details may not add up to totals due to rounding.
the Inter-Agency Working Group on Population Projections. (IAWGPP) (medium assumption)
Philippine Embassies, Consulates and Missions abroad.
and Missions abroad but includes 18,989 persons in the areas disputed
of Rizal (Region IV-A).
and Missions abroad.
By major country
Notes:
1 2000 Census-based Population Projections in collaboration with
2 Per thousand midyear population3 Includes permanent, temporary, and irregular Filipino immigrantsa Excludes 2,876 homeless population and 2,336 Filipinos in
b Excludes 2,851Filipinos in Philippine Embassies, Consulates,
by the City of Pasig (National Capital Region) and the province
c Excludes 2,739 Filipinos in Philippine Embassies, Consulates,
d National Demographic Health Surveye Family Health Survey
Sources: PSA, CFO, and POEA
32 DOMESTIC TRADEAND SERVICES
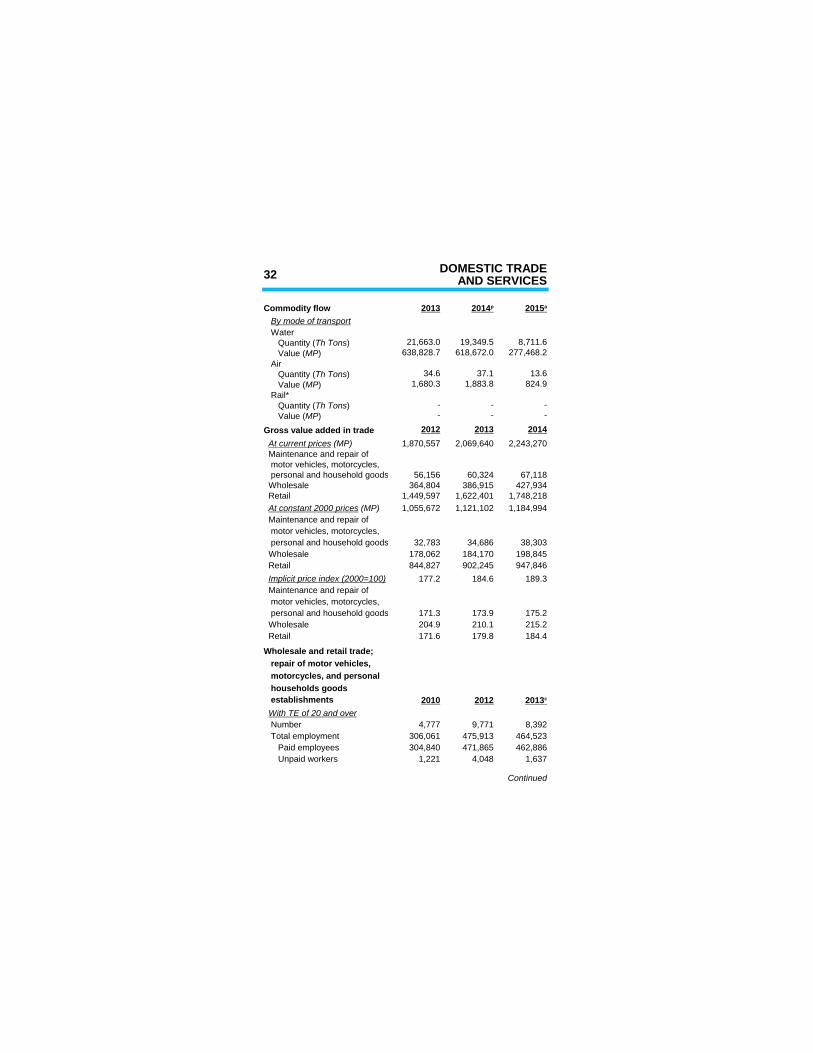
Commodity flow 2013
Water21,663.0 19,349.5 8,711.6
638,828.7 618,672.0 277,468.2 Air
34.6 37.1 13.61,680.3 1,883.8 824.9
Rail*- - -- - -
Gross value added in trade 2012 2013 20141,870,557 2,069,640 2,243,270
Maintenance and repair of motor vehicles, motorcycles, personal and household goods 56,156 60,324 67,118 Wholesale 364,804 386,915 427,934 Retail 1,449,597 1,622,401 1,748,218
1,055,672 1,121,102 1,184,994 Maintenance and repair of motor vehicles, motorcycles, personal and household goods 32,783 34,686 38,303 Wholesale 178,062 184,170 198,845 Retail 844,827 902,245 947,846
177.2 184.6 189.3 Maintenance and repair of motor vehicles, motorcycles, personal and household goods 171.3 173.9 175.2 Wholesale 204.9 210.1 215.2 Retail 171.6 179.8 184.4
Wholesale and retail trade; repair of motor vehicles, motorcycles, and personal households goods establishments 2010 2012
Number 4,777 9,771 8,392 Total employment 306,061 475,913 464,523 Paid employees 304,840 471,865 462,886 Unpaid workers 1,221 4,048 1,637
Continued
2014 p 2015 a
By mode of transport
Quantity (Th Tons) Value (MP)
Quantity (Th Tons) Value (MP)
Quantity (Th Tons) Value (MP)
At current prices (MP)
At constant 2000 prices (MP)
Implicit price index (2000=100)
2013 c
With TE of 20 and over
DOMESTIC TRADE 33AND SERVICES
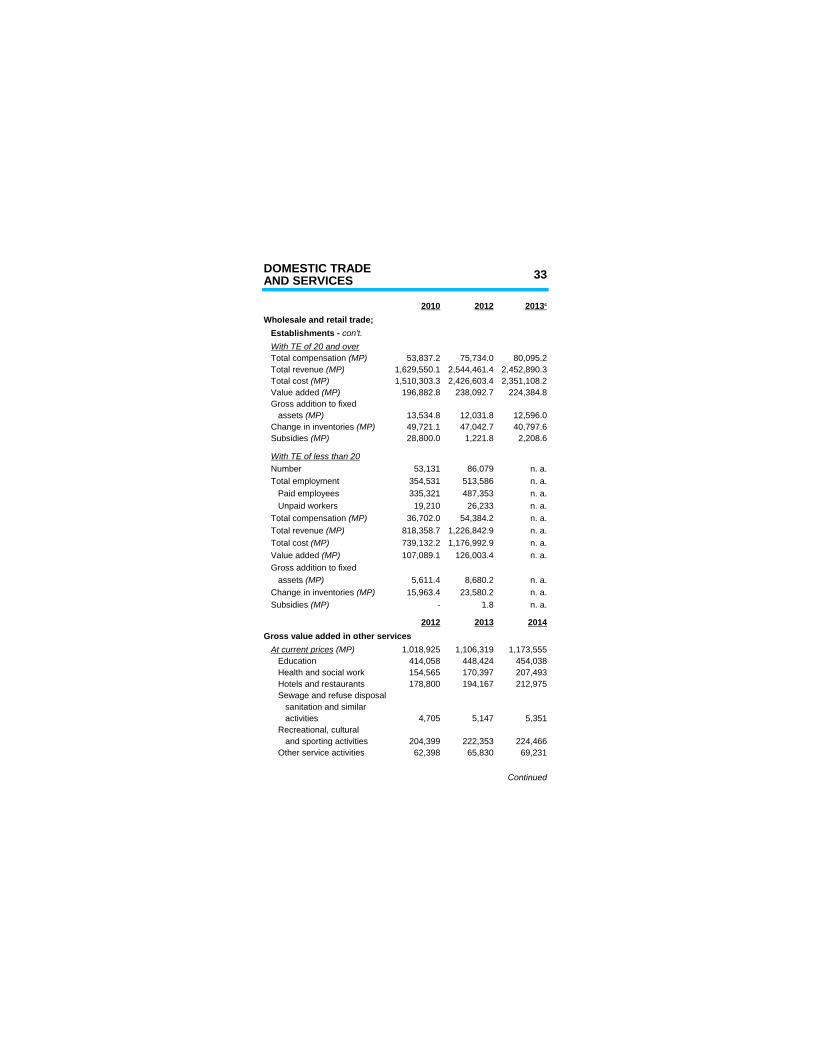
2010 2012Wholesale and retail trade;
53,837.2 75,734.0 80,095.21,629,550.1 2,544,461.4 2,452,890.31,510,303.3 2,426,603.4 2,351,108.2
196,882.8 238,092.7 224,384.8 Gross addition to fixed
13,534.8 12,031.8 12,596.049,721.1 47,042.7 40,797.628,800.0 1,221.8 2,208.6
Number 53,131 86,079 n. a. Total employment 354,531 513,586 n. a. Paid employees 335,321 487,353 n. a. Unpaid workers 19,210 26,233 n. a.
36,702.0 54,384.2 n. a.818,358.7 1,226,842.9 n. a.739,132.2 1,176,992.9 n. a.107,089.1 126,003.4 n. a.
Gross addition to fixed5,611.4 8,680.2 n. a.
15,963.4 23,580.2 n. a.- 1.8 n. a.
2012 2013 2014Gross value added in other services
1,018,925 1,106,319 1,173,555 Education 414,058 448,424 454,038 Health and social work 154,565 170,397 207,493 Hotels and restaurants 178,800 194,167 212,975 Sewage and refuse disposal sanitation and similar activities 4,705 5,147 5,351 Recreational, cultural and sporting activities 204,399 222,353 224,466 Other service activities 62,398 65,830 69,231
Continued
2013 c
Establishments - con't. With TE of 20 and over Total compensation (MP) Total revenue (MP) Total cost (MP) Value added (MP)
assets (MP) Change in inventories (MP) Subsidies (MP)
With TE of less than 20
Total compensation (MP) Total revenue (MP) Total cost (MP) Value added (MP)
assets (MP) Change in inventories (MP) Subsidies (MP)
At current prices (MP)
34 DOMESTIC TRADEAND SERVICES
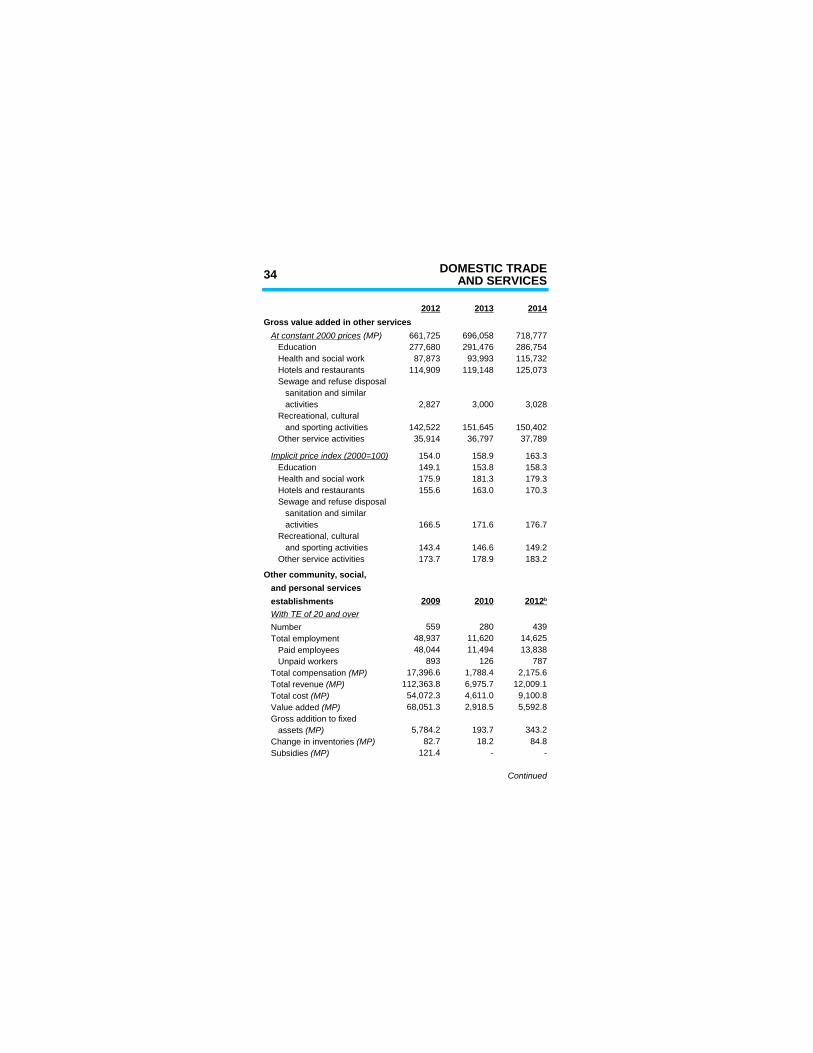
2012 2013 2014Gross value added in other services
661,725 696,058 718,777 Education 277,680 291,476 286,754 Health and social work 87,873 93,993 115,732 Hotels and restaurants 114,909 119,148 125,073 Sewage and refuse disposal sanitation and similar activities 2,827 3,000 3,028 Recreational, cultural and sporting activities 142,522 151,645 150,402 Other service activities 35,914 36,797 37,789
154.0 158.9 163.3 Education 149.1 153.8 158.3 Health and social work 175.9 181.3 179.3 Hotels and restaurants 155.6 163.0 170.3 Sewage and refuse disposal sanitation and similar activities 166.5 171.6 176.7 Recreational, cultural and sporting activities 143.4 146.6 149.2 Other service activities 173.7 178.9 183.2
Other community, social, and personal services establishments 2009 2010
Number 559 280 439 Total employment 48,937 11,620 14,625 Paid employees 48,044 11,494 13,838 Unpaid workers 893 126 787
17,396.6 1,788.4 2,175.6112,363.8 6,975.7 12,009.154,072.3 4,611.0 9,100.868,051.3 2,918.5 5,592.8
Gross addition to fixed5,784.2 193.7 343.2
82.7 18.2 84.8121.4 - -
Continued
At constant 2000 prices (MP)
Implicit price index (2000=100)
2012 b
With TE of 20 and over
Total compensation (MP) Total revenue (MP) Total cost (MP) Value added (MP)
assets (MP) Change in inventories (MP) Subsidies (MP)
DOMESTIC TRADE 35AND SERVICES
Concluded
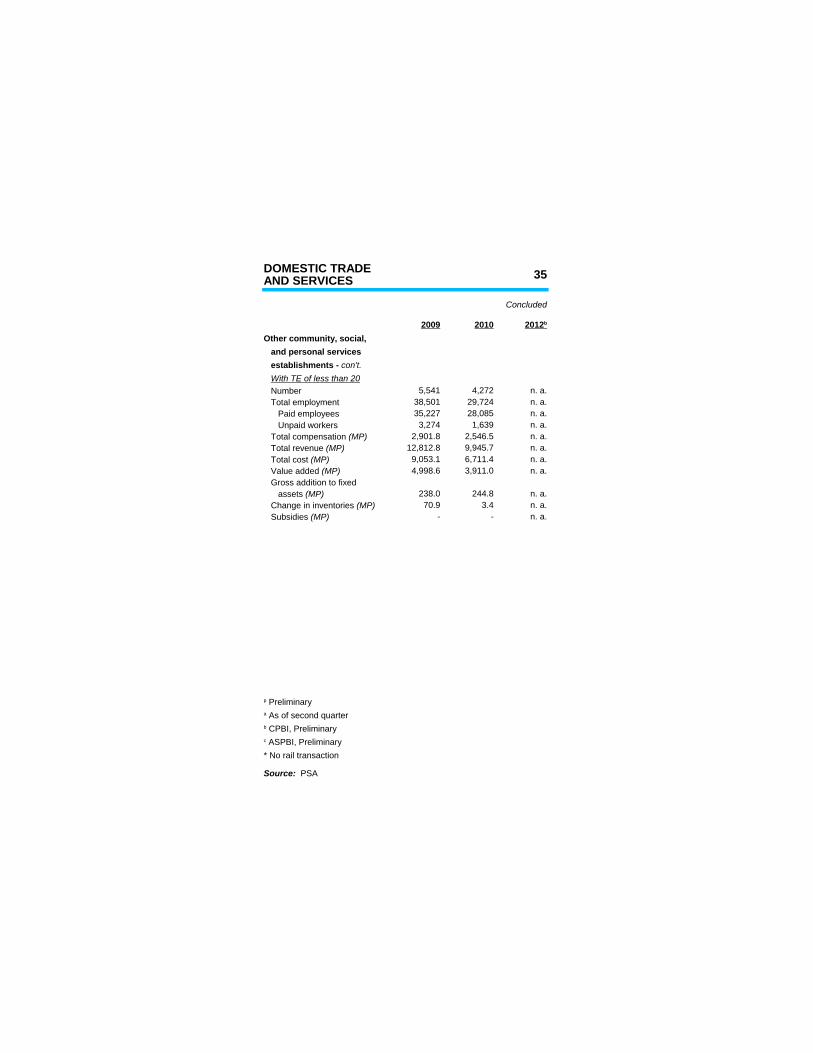
2009 2010Other community, social, and personal services
Number 5,541 4,272 n. a. Total employment 38,501 29,724 n. a. Paid employees 35,227 28,085 n. a. Unpaid workers 3,274 1,639 n. a.
2,901.8 2,546.5 n. a.12,812.8 9,945.7 n. a.9,053.1 6,711.4 n. a.4,998.6 3,911.0 n. a.
Gross addition to fixed238.0 244.8 n. a.70.9 3.4 n. a.
- - n. a.
* No rail transaction
2012 b
establishments - con't. With TE of less than 20
Total compensation (MP) Total revenue (MP) Total cost (MP) Value added (MP)
assets (MP) Change in inventories (MP) Subsidies (MP)
p Preliminarya As of second quarterb CPBI, Preliminaryc ASPBI, Preliminary
Source: PSA
36 EDUCATIONAND LITERACY
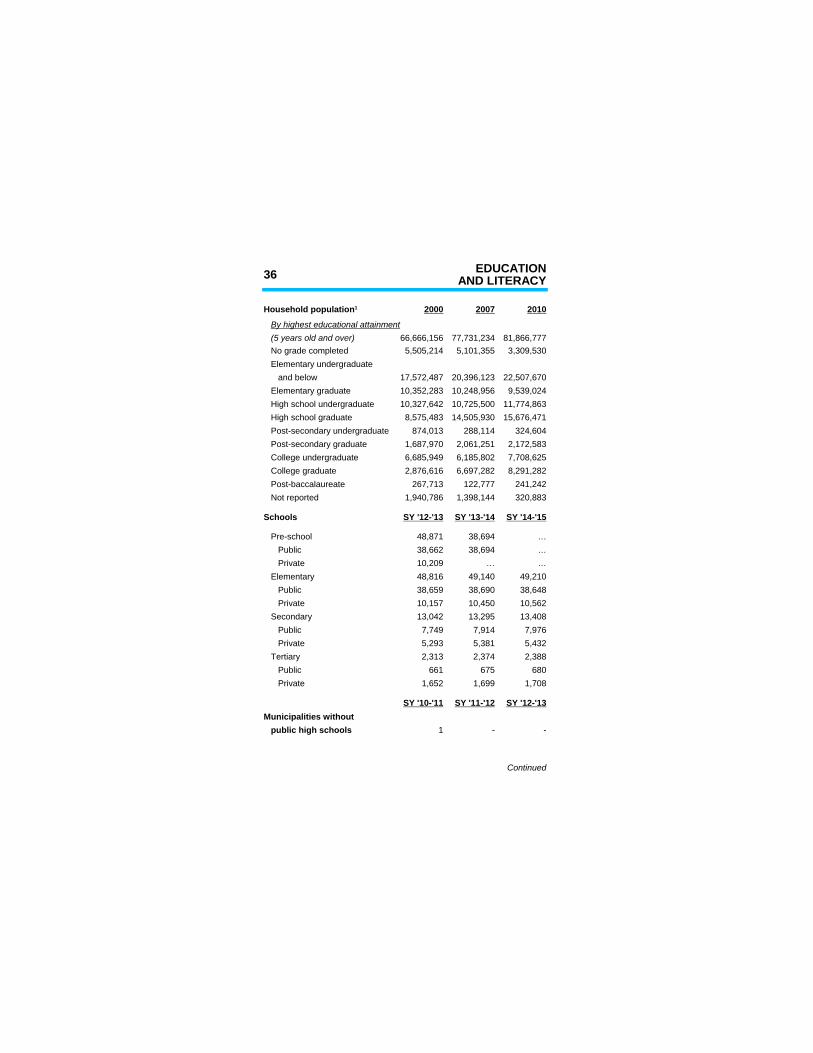
2000 2007 2010
(5 years old and over) 66,666,156 77,731,234 81,866,777 No grade completed 5,505,214 5,101,355 3,309,530 Elementary undergraduate and below 17,572,487 20,396,123 22,507,670 Elementary graduate 10,352,283 10,248,956 9,539,024 High school undergraduate 10,327,642 10,725,500 11,774,863 High school graduate 8,575,483 14,505,930 15,676,471 Post-secondary undergraduate 874,013 288,114 324,604 Post-secondary graduate 1,687,970 2,061,251 2,172,583 College undergraduate 6,685,949 6,185,802 7,708,625 College graduate 2,876,616 6,697,282 8,291,282 Post-baccalaureate 267,713 122,777 241,242 Not reported 1,940,786 1,398,144 320,883
Schools SY '12-'13 SY '13-'14 SY '14-'15
48,871 38,694 … Public 38,662 38,694 … Private 10,209 … … Elementary 48,816 49,140 49,210 Public 38,659 38,690 38,648 Private 10,157 10,450 10,562 Secondary 13,042 13,295 13,408 Public 7,749 7,914 7,976 Private 5,293 5,381 5,432 Tertiary 2,313 2,374 2,388 Public 661 675 680 Private 1,652 1,699 1,708
SY '10-'11 SY '11-'12 SY '12-'13Municipalities without public high schools 1 - -
Continued
Household population1
By highest educational attainment
Pre-school
EDUCATION 37AND LITERACY
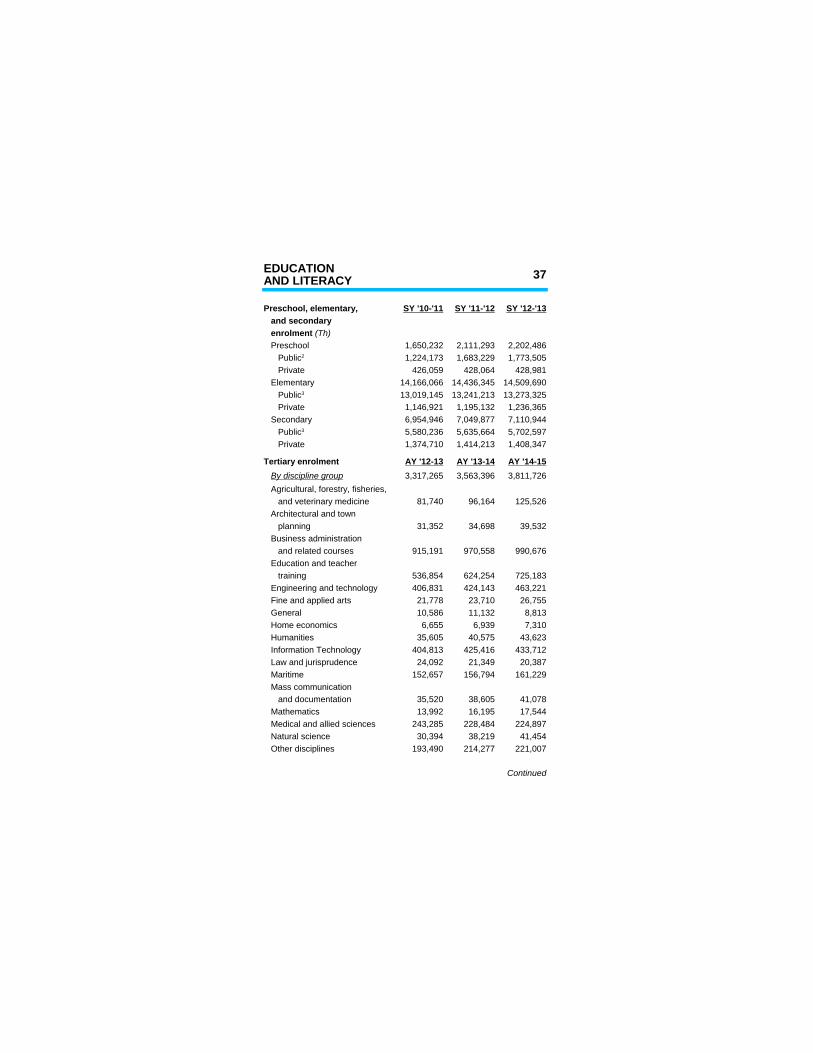
Preschool, elementary, SY '10-'11 SY '11-'12 SY '12-'13 and secondary
Preschool 1,650,232 2,111,293 2,202,4861,224,173 1,683,229 1,773,505
Private 426,059 428,064 428,981 Elementary 14,166,066 14,436,345 14,509,690
13,019,145 13,241,213 13,273,325 Private 1,146,921 1,195,132 1,236,365 Secondary 6,954,946 7,049,877 7,110,944
5,580,236 5,635,664 5,702,597 Private 1,374,710 1,414,213 1,408,347
AY '12-13 AY '13-14 AY '14-153,317,265 3,563,396 3,811,726
Agricultural, forestry, fisheries, and veterinary medicine 81,740 96,164 125,526
planning 31,352 34,698 39,532 Business administration and related courses 915,191 970,558 990,676 Education and teacher training 536,854 624,254 725,183 Engineering and technology 406,831 424,143 463,221 Fine and applied arts 21,778 23,710 26,755 General 10,586 11,132 8,813 Home economics 6,655 6,939 7,310 Humanities 35,605 40,575 43,623 Information Technology 404,813 425,416 433,712 Law and jurisprudence 24,092 21,349 20,387 Maritime 152,657 156,794 161,229 Mass communication and documentation 35,520 38,605 41,078 Mathematics 13,992 16,195 17,544 Medical and allied sciences 243,285 228,484 224,897 Natural science 30,394 38,219 41,454 Other disciplines 193,490 214,277 221,007
Continued
enrolment (Th)
Public2
Public3
Public3
Tertiary enrolment By discipline group
Architectural and town
38 EDUCATIONAND LITERACY
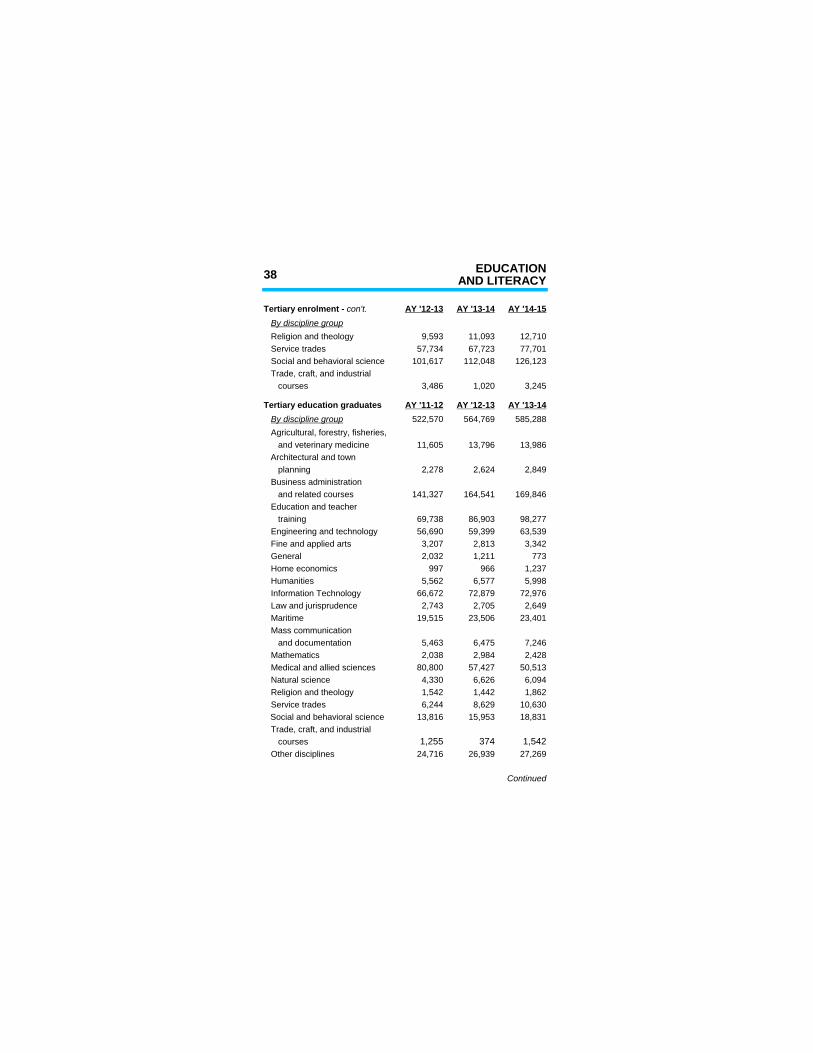
AY '12-13 AY '13-14 AY '14-15
Religion and theology 9,593 11,093 12,710 Service trades 57,734 67,723 77,701 Social and behavioral science 101,617 112,048 126,123 Trade, craft, and industrial courses 3,486 1,020 3,245
Tertiary education graduates AY '11-12 AY '12-13 AY '13-14522,570 564,769 585,288
Agricultural, forestry, fisheries, and veterinary medicine 11,605 13,796 13,986
planning 2,278 2,624 2,849 Business administration and related courses 141,327 164,541 169,846 Education and teacher training 69,738 86,903 98,277 Engineering and technology 56,690 59,399 63,539 Fine and applied arts 3,207 2,813 3,342 General 2,032 1,211 773 Home economics 997 966 1,237 Humanities 5,562 6,577 5,998 Information Technology 66,672 72,879 72,976 Law and jurisprudence 2,743 2,705 2,649 Maritime 19,515 23,506 23,401 Mass communication and documentation 5,463 6,475 7,246 Mathematics 2,038 2,984 2,428 Medical and allied sciences 80,800 57,427 50,513 Natural science 4,330 6,626 6,094 Religion and theology 1,542 1,442 1,862 Service trades 6,244 8,629 10,630
13,816 15,953 18,831 Trade, craft, and industrial courses 1,255 374 1,542 Other disciplines 24,716 26,939 27,269
Continued
Tertiary enrolment - con't. By discipline group
By discipline group
Architectural and town
Social and behavioral science
EDUCATION 39AND LITERACY
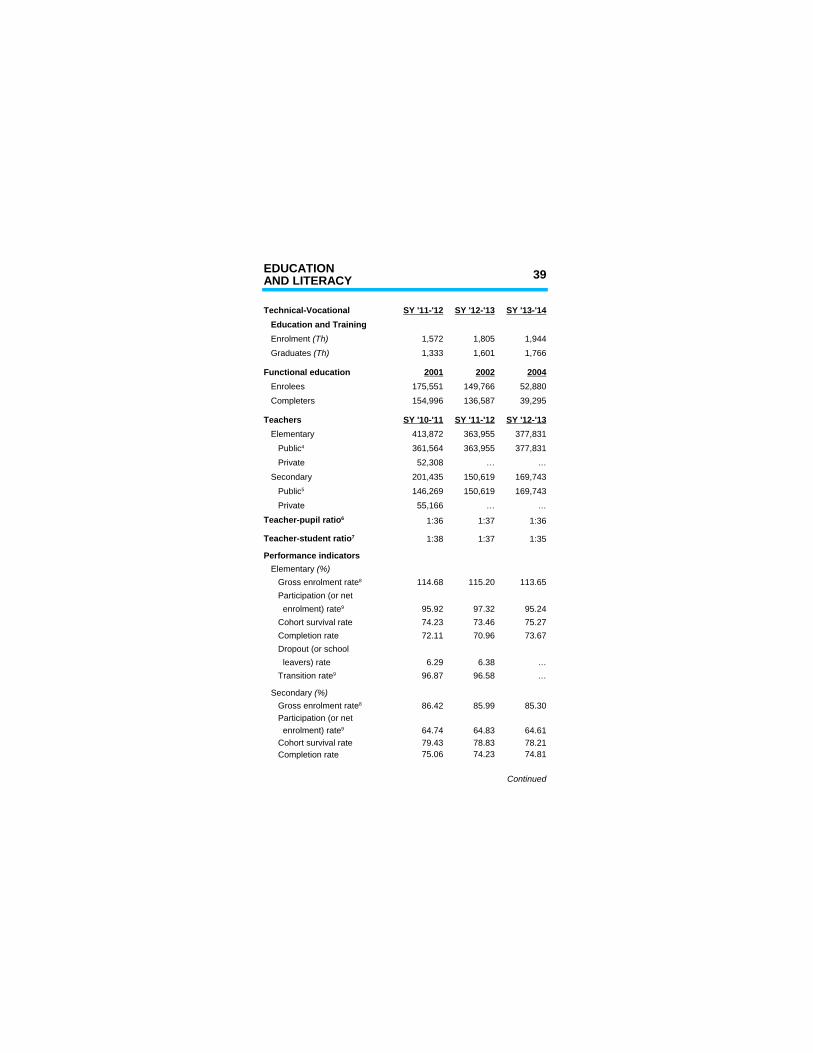
Technical-Vocational SY '11-'12 SY '12-'13 SY '13-'14 Education and Training
1,572 1,805 1,9441,333 1,601 1,766
Functional education 2001 2002 2004175,551 149,766 52,880154,996 136,587 39,295
Teachers SY '10-'11 SY '11-'12 SY '12-'13 Elementary 413,872 363,955 377,831
361,564 363,955 377,831 Private 52,308 … …
Secondary 201,435 150,619 169,743146,269 150,619 169,743
Private 55,166 … …
1:36 1:37 1:36
1:38 1:37 1:35
Performance indicators
114.68 115.20 113.65 Participation (or net
95.92 97.32 95.24 Cohort survival rate 74.23 73.46 75.27 Completion rate 72.11 70.96 73.67 Dropout (or school leavers) rate 6.29 6.38 …
96.87 96.58 …
86.42 85.99 85.30 Participation (or net
64.74 64.83 64.61 Cohort survival rate 79.43 78.83 78.21 Completion rate 75.06 74.23 74.81
Continued
Enrolment (Th)
Graduates (Th)
Enrolees Completers
Public4
Public5
Teacher-pupil ratio6
Teacher-student ratio7
Elementary (%) Gross enrolment rate8
enrolment) rate9
Transition rate9
Secondary (%) Gross enrolment rate8
enrolment) rate9
40 EDUCATIONAND LITERACY
SY '10-'11 SY '11-'12 SY '12-'13
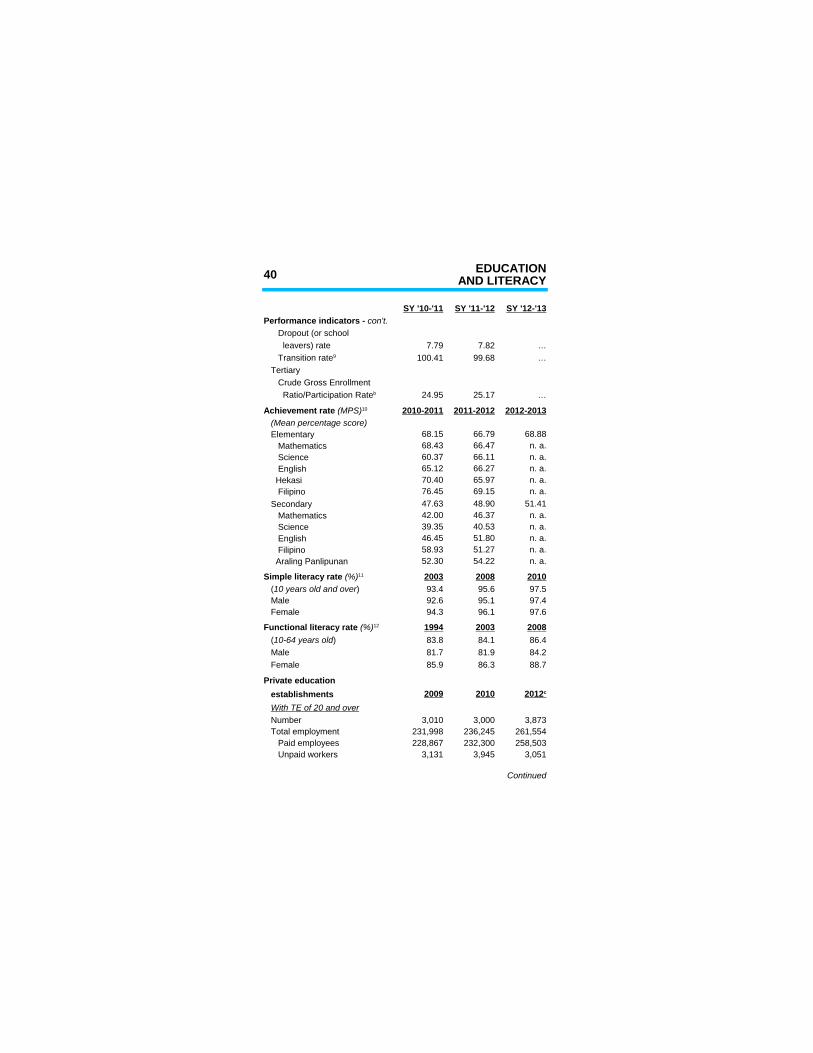
Dropout (or school leavers) rate 7.79 7.82 …
100.41 99.68 … Tertiary Crude Gross Enrollment
24.95 25.17 …
2010-2011 2011-2012 2012-2013
Elementary 68.15 66.79 68.88 Mathematics 68.43 66.47 n. a. Science 60.37 66.11 n. a. English 65.12 66.27 n. a.
70.40 65.97 n. a. Filipino 76.45 69.15 n. a. Secondary 47.63 48.90 51.41 Mathematics 42.00 46.37 n. a. Science 39.35 40.53 n. a. English 46.45 51.80 n. a. Filipino 58.93 51.27 n. a.
52.30 54.22 n. a.
2003 2008 201093.4 95.6 97.5
Male 92.6 95.1 97.4 Female 94.3 96.1 97.6
1994 2003 200883.8 84.1 86.4
Male 81.7 81.9 84.2 Female 85.9 86.3 88.7
Private education establishments 2009 2010
Number 3,010 3,000 3,873 Total employment 231,998 236,245 261,554 Paid employees 228,867 232,300 258,503 Unpaid workers 3,131 3,945 3,051
Continued
Performance indicators - con't.
Transition rate9
Ratio/Participation Rateb
Achievement rate (MPS)10
(Mean percentage score)
Hekasi
Araling Panlipunan
Simple literacy rate (%)11
(10 years old and over)
Functional literacy rate (%)12
(10-64 years old)
2012 c
With TE of 20 and over
EDUCATION 41AND LITERACY
Private education2009 2010
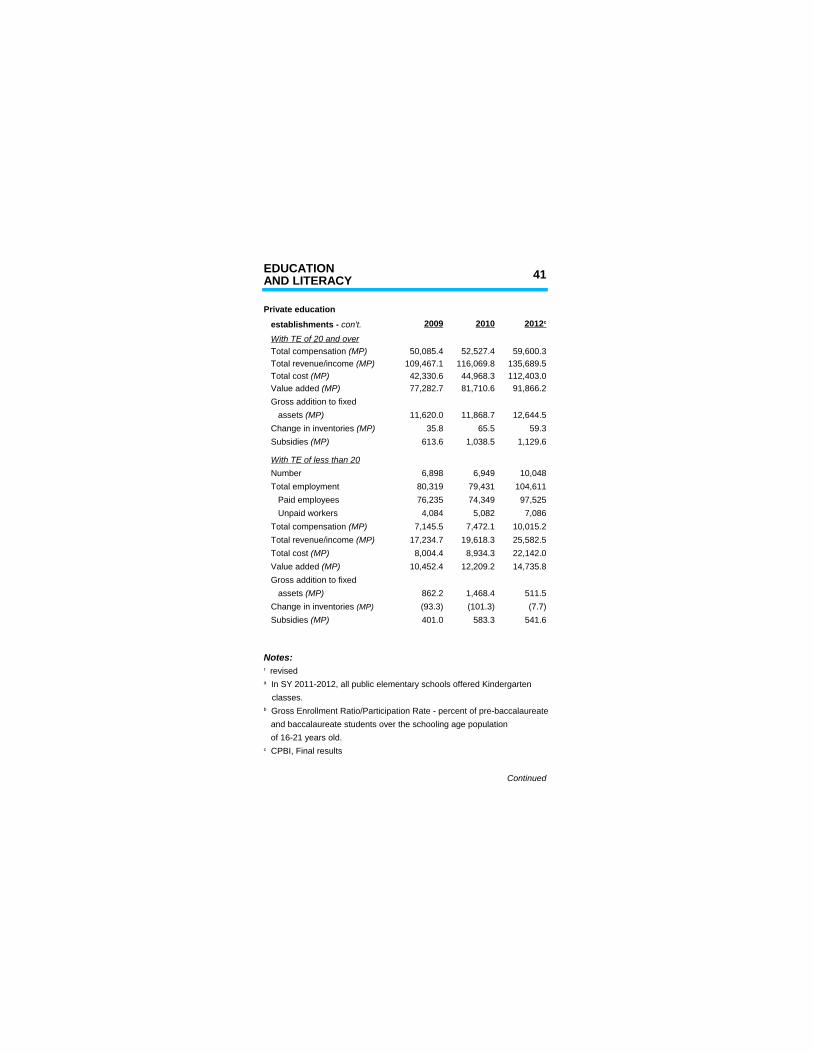
50,085.4 52,527.4 59,600.3109,467.1 116,069.8 135,689.542,330.6 44,968.3 112,403.077,282.7 81,710.6 91,866.2
Gross addition to fixed11,620.0 11,868.7 12,644.5
35.8 65.5 59.3613.6 1,038.5 1,129.6
Number 6,898 6,949 10,048 Total employment 80,319 79,431 104,611 Paid employees 76,235 74,349 97,525 Unpaid workers 4,084 5,082 7,086
7,145.5 7,472.1 10,015.217,234.7 19,618.3 25,582.58,004.4 8,934.3 22,142.0
10,452.4 12,209.2 14,735.8 Gross addition to fixed
862.2 1,468.4 511.5(93.3) (101.3) (7.7)401.0 583.3 541.6
Notes:
and baccalaureate students over the schooling age population of 16-21 years old.
Continued
establishments - con't. 2012 c
With TE of 20 and over Total compensation (MP) Total revenue/income (MP) Total cost (MP) Value added (MP)
assets (MP) Change in inventories (MP) Subsidies (MP)
With TE of less than 20
Total compensation (MP) Total revenue/income (MP) Total cost (MP) Value added (MP)
assets (MP) Change in inventories (MP)
Subsidies (MP)
r reviseda In SY 2011-2012, all public elementary schools offered Kindergarten classes.b Gross Enrollment Ratio/Participation Rate - percent of pre-baccalaureate
c CPBI, Final results
42 EDUCATIONAND LITERACY
Concluded
1 Census of Population and Housing (CPH) results2 Includes enrolment in state universities and colleges (SUCs)3 DepEd and SUC4 Includes SPED Teachers and Teachers for Kinder5 Includes SPED Teachers6 For public elementary schools only.7 For public secondary schools only.8 The official school-age population for elementary and secondary are 6-11 years and 12-15 years, respectively. For SY 2008-2009 to SY 2009-2010, the population used in computing the gross and net enrolment rates is based on the revised population projection based on 2.04% annual growth rate between 2000 and 2007 Censuses. For SY 2010-2011 to SY 2012-2013 population is based on 2010 CPH provided by NSO.9 From primary (Grade IV) to intermediate (Grade V)10 Source: National Achievement Test (NAT), for elementary level, was given in Grade VI from SY 2008-2009 for SY 2012-2013. For secondary level, NAT was administered to Year 2 in SY 2008-2009 to SY 2010-2011 and Year 4 in SY 2011-2012 to SY 2012-2013.11 Basic reading and writing skills.12 Basic reading, writing and numeracy skills.
Sources: DepEd, CHED, TESDA, NSO, 2010 Census of Population and Housing, 2008 Functional Literacy, Education and Mass Media Survey, 2010 Annual Survey of Philippine Business and Industry, and 2012 Census of Philippine Business and Industry
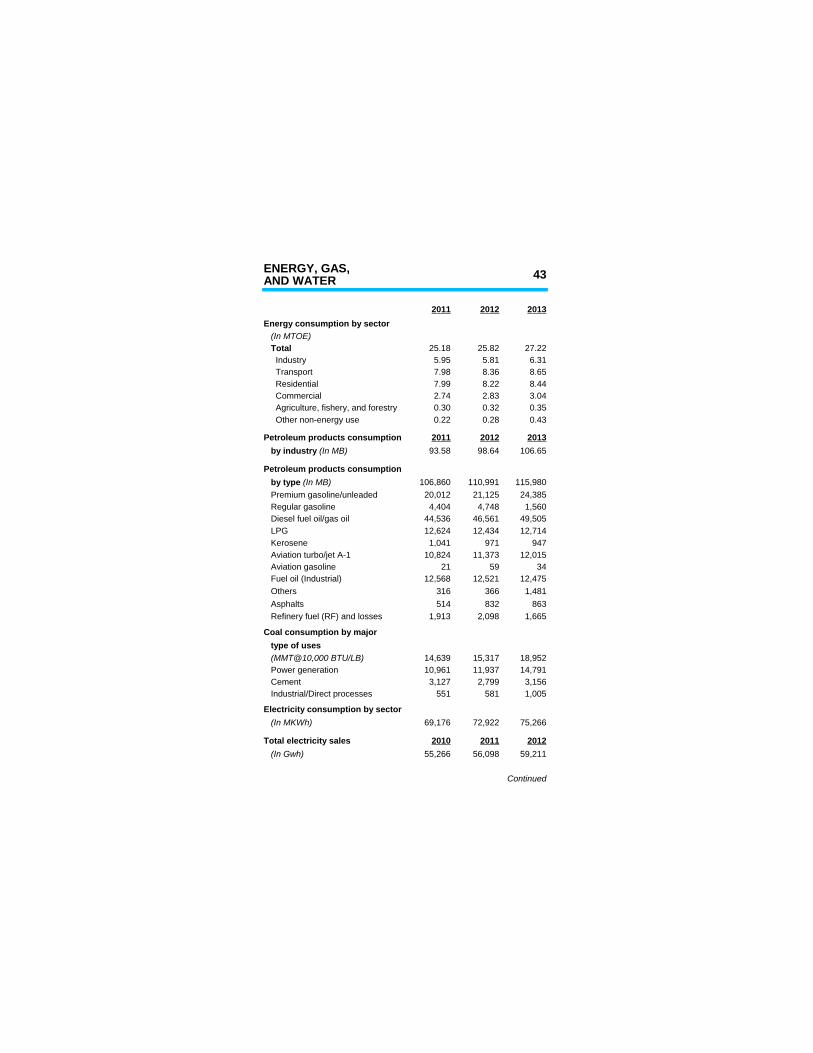
ENERGY, GAS, 43AND WATER
2011 2012 2013Energy consumption by sector
Total 25.18 25.82 27.22 Industry 5.95 5.81 6.31 Transport 7.98 8.36 8.65 Residential 7.99 8.22 8.44 Commercial 2.74 2.83 3.04 Agriculture, fishery, and forestry 0.30 0.32 0.35 Other non-energy use 0.22 0.28 0.43
Petroleum products consumption 2011 2012 201393.58 98.64 106.65
Petroleum products consumption106,860 110,991 115,980
Premium gasoline/unleaded 20,012 21,125 24,385 Regular gasoline 4,404 4,748 1,560 Diesel fuel oil/gas oil 44,536 46,561 49,505 LPG 12,624 12,434 12,714 Kerosene 1,041 971 947 Aviation turbo/jet A-1 10,824 11,373 12,015 Aviation gasoline 21 59 34 Fuel oil (Industrial) 12,568 12,521 12,475 Others 316 366 1,481 Asphalts 514 832 863 Refinery fuel (RF) and losses 1,913 2,098 1,665
Coal consumption by major type of uses
14,639 15,317 18,952 Power generation 10,961 11,937 14,791 Cement 3,127 2,799 3,156 Industrial/Direct processes 551 581 1,005
Electricity consumption by sector69,176 72,922 75,266
Total electricity sales 2010 2011 201255,266 56,098 59,211
Continued
(In MTOE)
by industry (In MB)
by type (In MB)
(MMT@10,000 BTU/LB)
(In MKWh)
(In Gwh)
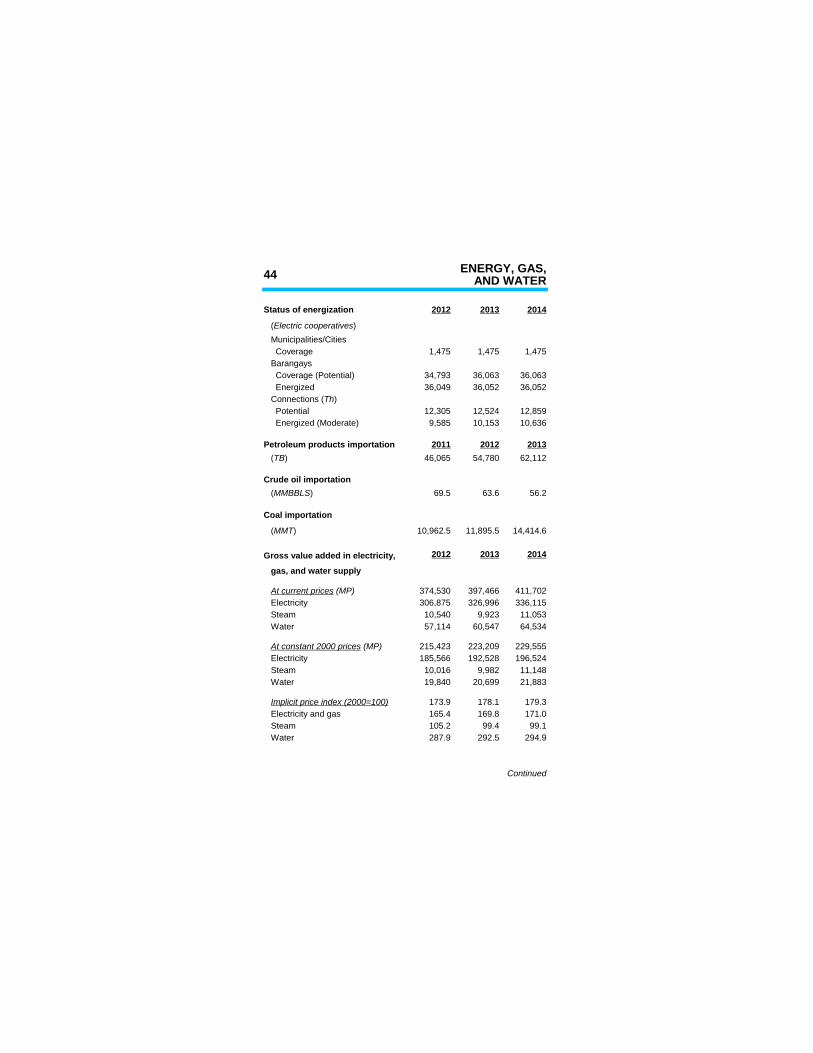
44 ENERGY, GAS,AND WATER
2012 2013 2014
Municipalities/Cities Coverage 1,475 1,475 1,475
Coverage (Potential) 34,793 36,063 36,063 Energized 36,049 36,052 36,052
Potential 12,305 12,524 12,859 Energized (Moderate) 9,585 10,153 10,636
Petroleum products importation 2011 2012 201346,065 54,780 62,112
Crude oil importation69.5 63.6 56.2
Coal importation
10,962.5 11,895.5 14,414.6
Gross value added in electricity, 2012 2013 2014
gas, and water supply
374,530 397,466 411,702 Electricity 306,875 326,996 336,115 Steam 10,540 9,923 11,053 Water 57,114 60,547 64,534
215,423 223,209 229,555 Electricity 185,566 192,528 196,524 Steam 10,016 9,982 11,148 Water 19,840 20,699 21,883
173.9 178.1 179.3 Electricity and gas 165.4 169.8 171.0 Steam 105.2 99.4 99.1 Water 287.9 292.5 294.9
Continued
Status of energization
(Electric cooperatives)
Barangays
Connections (Th)
(TB)
(MMBBLS)
(MMT)
At current prices (MP)
At constant 2000 prices (MP)
Implicit price index (2000=100)
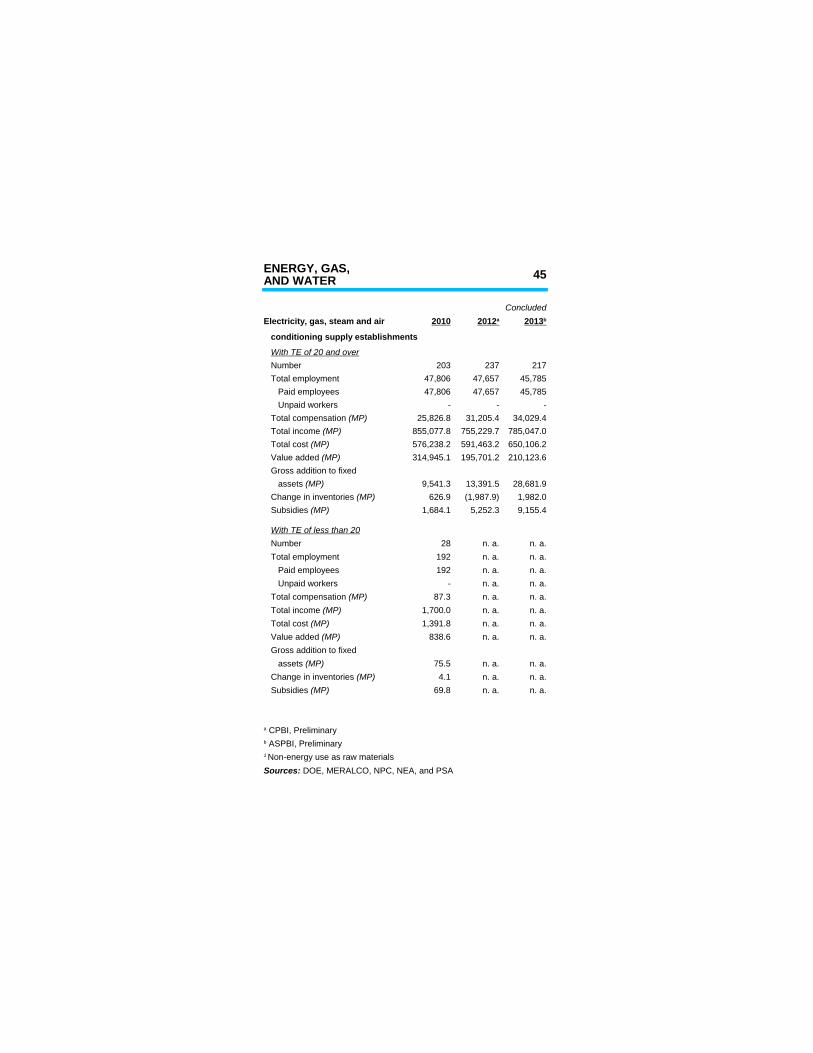
ENERGY, GAS, 45AND WATER
ConcludedElectricity, gas, steam and air 2010
conditioning supply establishments
Number 203 237 217 Total employment 47,806 47,657 45,785 Paid employees 47,806 47,657 45,785 Unpaid workers - - -
25,826.8 31,205.4 34,029.4855,077.8 755,229.7 785,047.0576,238.2 591,463.2 650,106.2314,945.1 195,701.2 210,123.6
Gross addition to fixed9,541.3 13,391.5 28,681.9
626.9 (1,987.9) 1,982.01,684.1 5,252.3 9,155.4
Number 28 n. a. n. a. Total employment 192 n. a. n. a. Paid employees 192 n. a. n. a. Unpaid workers - n. a. n. a.
87.3 n. a. n. a.1,700.0 n. a. n. a.1,391.8 n. a. n. a.
838.6 n. a. n. a. Gross addition to fixed
75.5 n. a. n. a.4.1 n. a. n. a.
69.8 n. a. n. a.
2012 a 2013 b
With TE of 20 and over
Total compensation (MP) Total income (MP) Total cost (MP) Value added (MP)
assets (MP) Change in inventories (MP) Subsidies (MP)
With TE of less than 20
Total compensation (MP) Total income (MP) Total cost (MP) Value added (MP)
assets (MP) Change in inventories (MP) Subsidies (MP)
a CPBI, Preliminaryb ASPBI, Preliminary1 Non-energy use as raw materialsSources: DOE, MERALCO, NPC, NEA, and PSA
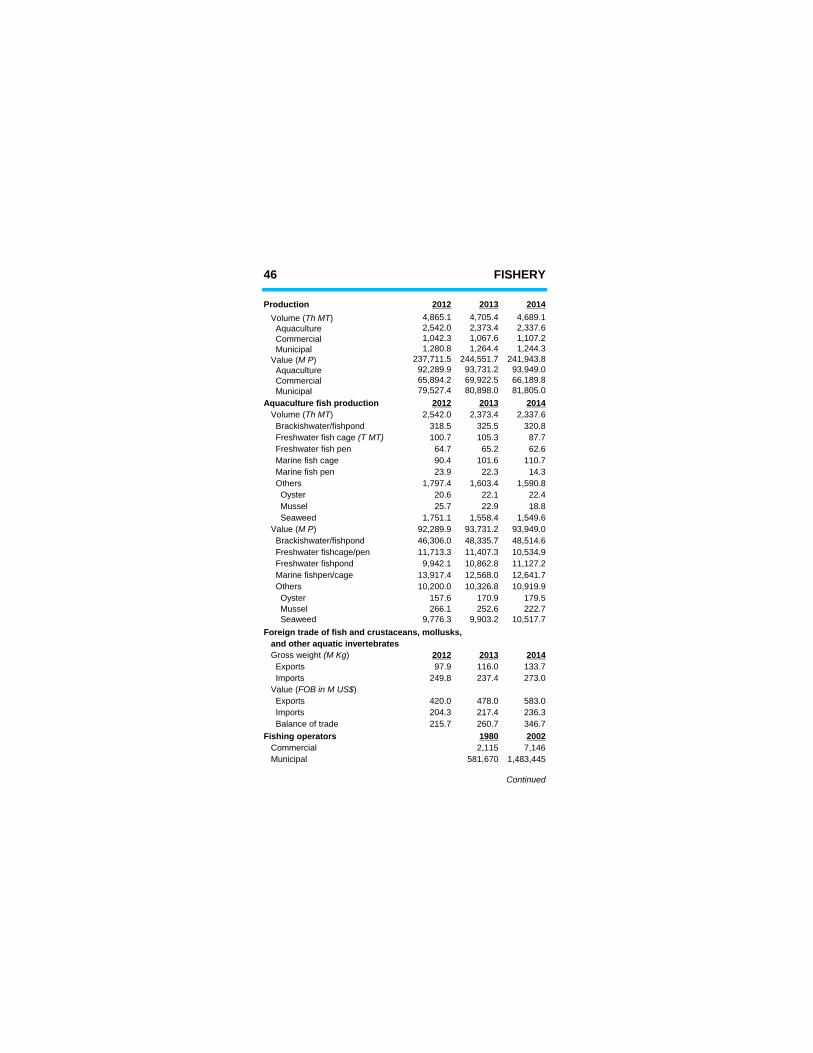
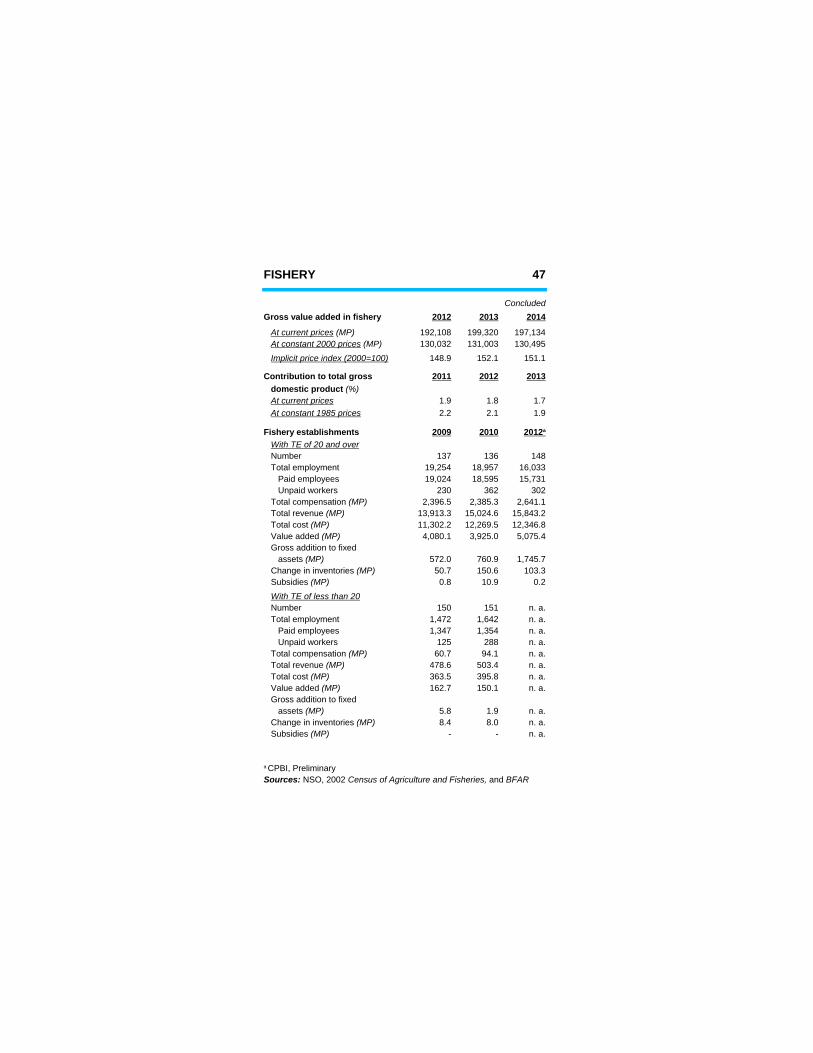
46 FISHERY
Production 2012 2013 20144,865.1 4,705.4 4,689.1
Aquaculture 2,542.0 2,373.4 2,337.6 Commercial 1,042.3 1,067.6 1,107.2 Municipal 1,280.8 1,264.4 1,244.3
237,711.5 244,551.7 241,943.8 Aquaculture 92,289.9 93,731.2 93,949.0 Commercial 65,894.2 69,922.5 66,189.8 Municipal 79,527.4 80,898.0 81,805.0Aquaculture fish production 2012 2013 2014
2,542.0 2,373.4 2,337.6318.5 325.5 320.8100.7 105.3 87.7
Freshwater fish pen 64.7 65.2 62.6 Marine fish cage 90.4 101.6 110.7 Marine fish pen 23.9 22.3 14.3 Others 1,797.4 1,603.4 1,590.8 Oyster 20.6 22.1 22.4 Mussel 25.7 22.9 18.8 Seaweed 1,751.1 1,558.4 1,549.6
92,289.9 93,731.2 93,949.046,306.0 48,335.7 48,514.611,713.3 11,407.3 10,534.9
Freshwater fishpond 9,942.1 10,862.8 11,127.213,917.4 12,568.0 12,641.7
Others 10,200.0 10,326.8 10,919.9 Oyster 157.6 170.9 179.5 Mussel 266.1 252.6 222.7 Seaweed 9,776.3 9,903.2 10,517.7Foreign trade of fish and crustaceans, mollusks, and other aquatic invertebrates
2012 2013 2014 Exports 97.9 116.0 133.7 Imports 249.8 237.4 273.0
Exports 420.0 478.0 583.0 Imports 204.3 217.4 236.3 Balance of trade 215.7 260.7 346.7Fishing operators 1980 2002 Commercial 2,115 7,146 Municipal 581,670 1,483,445
Continued
Volume (Th MT)
Value (M P)
Volume (Th MT) Brackishwater/fishpond Freshwater fish cage (T MT)
Value (M P) Brackishwater/fishpond Freshwater fishcage/pen
Marine fishpen/cage
Gross weight (M Kg)
Value (FOB in M US$)
FISHERY 47
ConcludedGross value added in fishery 2012 2013 2014
192,108 199,320 197,134130,032 131,003 130,495
148.9 152.1 151.1
Contribution to total gross 2011 2012 2013
1.9 1.8 1.72.2 2.1 1.9
Fishery establishments 2009 2010
Number 137 136 148 Total employment 19,254 18,957 16,033 Paid employees 19,024 18,595 15,731 Unpaid workers 230 362 302
2,396.5 2,385.3 2,641.113,913.3 15,024.6 15,843.211,302.2 12,269.5 12,346.84,080.1 3,925.0 5,075.4
Gross addition to fixed572.0 760.9 1,745.750.7 150.6 103.30.8 10.9 0.2
Number 150 151 n. a. Total employment 1,472 1,642 n. a. Paid employees 1,347 1,354 n. a. Unpaid workers 125 288 n. a.
60.7 94.1 n. a.478.6 503.4 n. a.363.5 395.8 n. a.162.7 150.1 n. a.
Gross addition to fixed5.8 1.9 n. a.8.4 8.0 n. a.
- - n. a.
At current prices (MP) At constant 2000 prices (MP)
Implicit price index (2000=100)
domestic product (%) At current prices At constant 1985 prices
2012 a
With TE of 20 and over
Total compensation (MP) Total revenue (MP) Total cost (MP) Value added (MP)
assets (MP) Change in inventories (MP) Subsidies (MP)
With TE of less than 20
Total compensation (MP) Total revenue (MP) Total cost (MP) Value added (MP)
assets (MP) Change in inventories (MP) Subsidies (MP)
a CPBI, PreliminarySources: NSO, 2002 Census of Agriculture and Fisheries, and BFAR
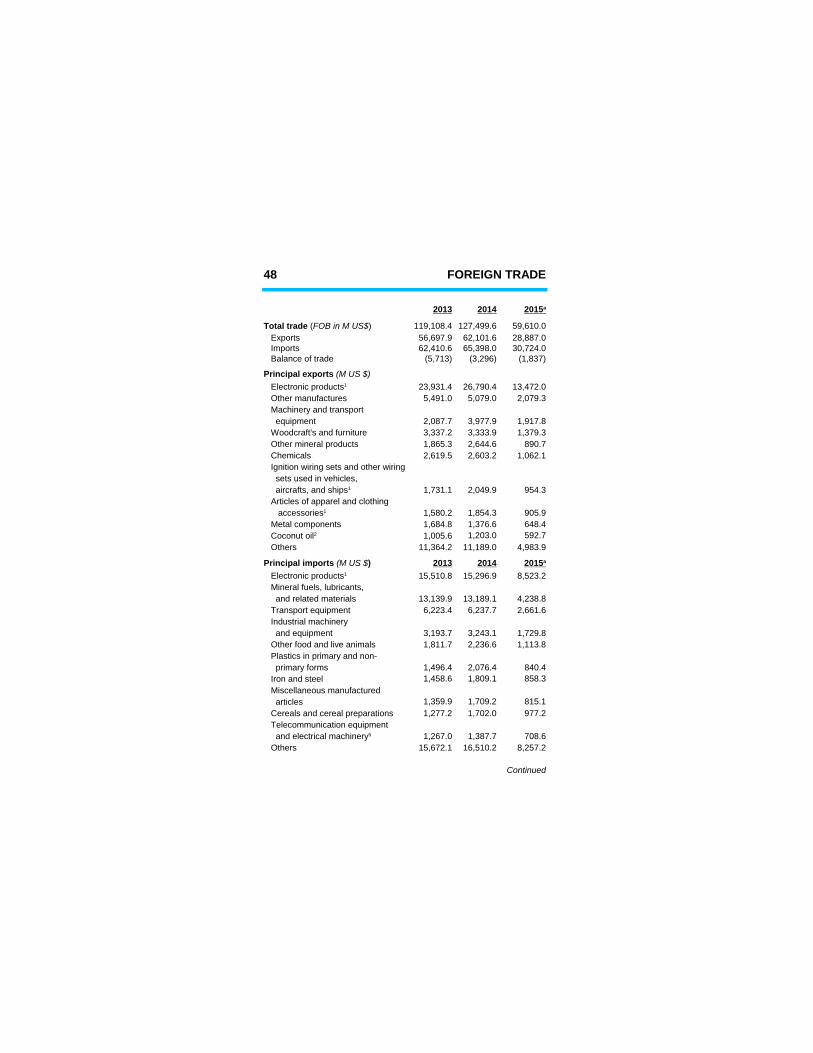
48 FOREIGN TRADE
2013 2014
119,108.4 127,499.6 59,610.0 Exports 56,697.9 62,101.6 28,887.0 Imports 62,410.6 65,398.0 30,724.0 Balance of trade (5,713) (3,296) (1,837)
23,931.4 26,790.4 13,472.0 Other manufactures 5,491.0 5,079.0 2,079.3 Machinery and transport equipment 2,087.7 3,977.9 1,917.8 Woodcraft's and furniture 3,337.2 3,333.9 1,379.3 Other mineral products 1,865.3 2,644.6 890.7 Chemicals 2,619.5 2,603.2 1,062.1 Ignition wiring sets and other wiring sets used in vehicles,
1,731.1 2,049.9 954.3 Articles of apparel and clothing
1,580.2 1,854.3 905.9 Metal components 1,684.8 1,376.6 648.4
1,005.6 1,203.0 592.7 Others 11,364.2 11,189.0 4,983.9
2013 201415,510.8 15,296.9 8,523.2
Mineral fuels, lubricants, and related materials 13,139.9 13,189.1 4,238.8 Transport equipment 6,223.4 6,237.7 2,661.6 Industrial machinery and equipment 3,193.7 3,243.1 1,729.8 Other food and live animals 1,811.7 2,236.6 1,113.8 Plastics in primary and non- primary forms 1,496.4 2,076.4 840.4 Iron and steel 1,458.6 1,809.1 858.3 Miscellaneous manufactured articles 1,359.9 1,709.2 815.1 Cereals and cereal preparations 1,277.2 1,702.0 977.2 Telecommunication equipment
1,267.0 1,387.7 708.6 Others 15,672.1 16,510.2 8,257.2
Continued
2015 a
Total trade (FOB in M US$)
Principal exports (M US $) Electronic products1
aircrafts, and ships1
accessories1
Coconut oil2
Principal imports (M US $) 2015 a
Electronic products1
and electrical machinery5
FOREIGN TRADE 49
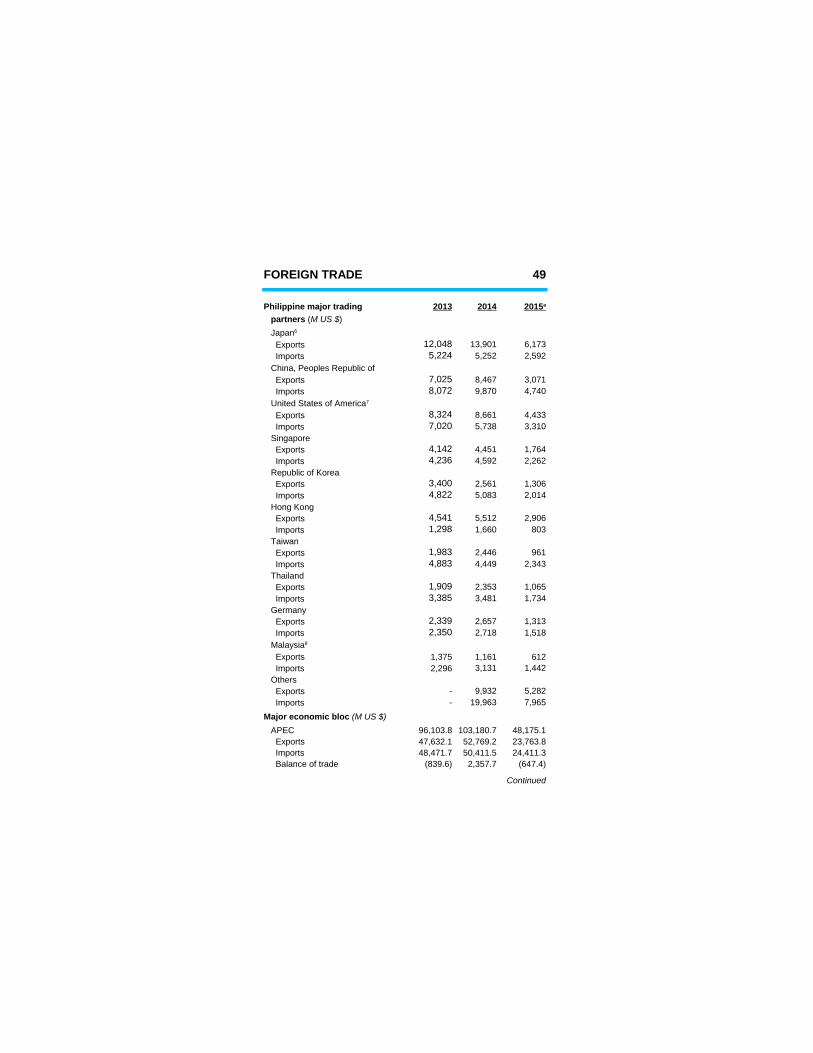
Philippine major trading 2013 2014
Exports 12,048 13,901 6,173 Imports 5,224 5,252 2,592 China, Peoples Republic of Exports 7,025 8,467 3,071 Imports 8,072 9,870 4,740
Exports 8,324 8,661 4,433 Imports 7,020 5,738 3,310 Singapore Exports 4,142 4,451 1,764 Imports 4,236 4,592 2,262 Republic of Korea Exports 3,400 2,561 1,306 Imports 4,822 5,083 2,014
Exports 4,541 5,512 2,906 Imports 1,298 1,660 803 Taiwan Exports 1,983 2,446 961 Imports 4,883 4,449 2,343 Thailand Exports 1,909 2,353 1,065 Imports 3,385 3,481 1,734 Germany Exports 2,339 2,657 1,313 Imports 2,350 2,718 1,518
Exports 1,375 1,161 612 Imports 2,296 3,131 1,442 Others Exports - 9,932 5,282 Imports - 19,963 7,965
APEC 96,103.8 103,180.7 48,175.1 Exports 47,632.1 52,769.2 23,763.8 Imports 48,471.7 50,411.5 24,411.3 Balance of trade (839.6) 2,357.7 (647.4)
Continued
2015 a
partners (M US $) Japan6
United States of America7
Hong Kong
Malaysia8
Major economic bloc (M US $)
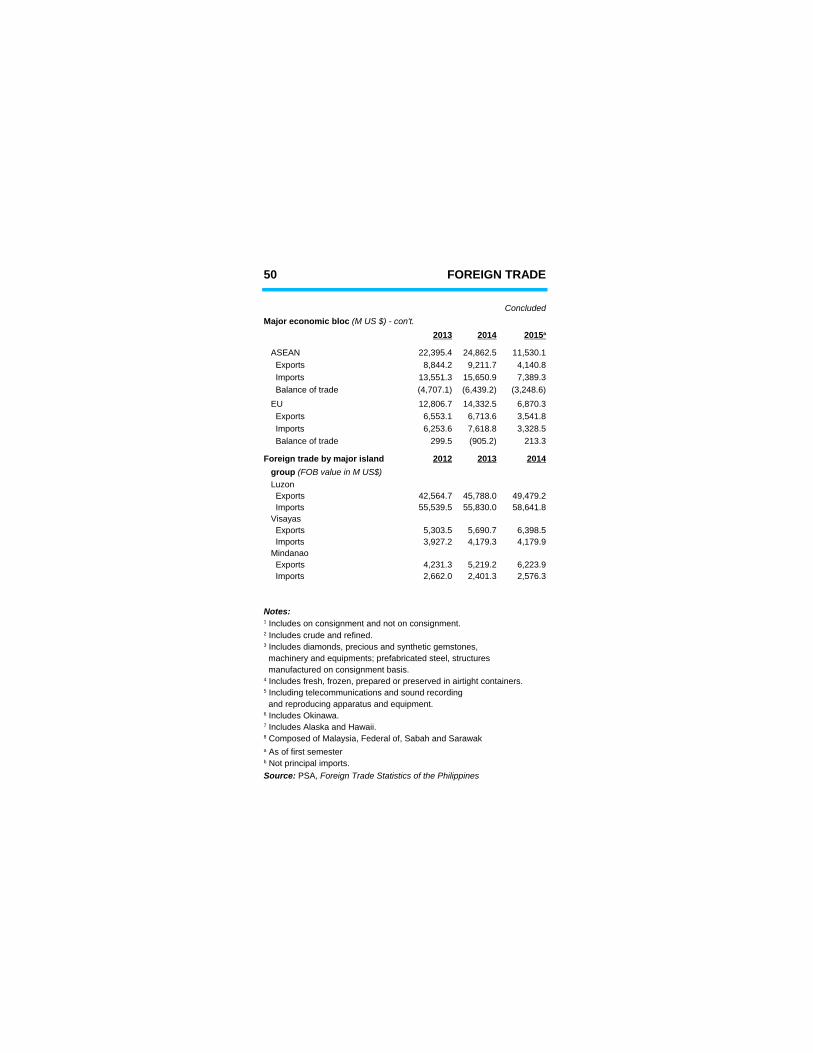
50 FOREIGN TRADE
Concluded
2013 2014
ASEAN 22,395.4 24,862.5 11,530.1 Exports 8,844.2 9,211.7 4,140.8 Imports 13,551.3 15,650.9 7,389.3 Balance of trade (4,707.1) (6,439.2) (3,248.6) EU 12,806.7 14,332.5 6,870.3 Exports 6,553.1 6,713.6 3,541.8 Imports 6,253.6 7,618.8 3,328.5 Balance of trade 299.5 (905.2) 213.3
Foreign trade by major island 2012 2013 2014
Luzon Exports 42,564.7 45,788.0 49,479.2 Imports 55,539.5 55,830.0 58,641.8
Exports 5,303.5 5,690.7 6,398.5 Imports 3,927.2 4,179.3 4,179.9 Mindanao Exports 4,231.3 5,219.2 6,223.9 Imports 2,662.0 2,401.3 2,576.3
Notes:
machinery and equipments; prefabricated steel, structures manufactured on consignment basis.
and reproducing apparatus and equipment.
Major economic bloc (M US $) - con't.2015 a
group (FOB value in M US$)
Visayas
1 Includes on consignment and not on consignment.2 Includes crude and refined.3 Includes diamonds, precious and synthetic gemstones,
4 Includes fresh, frozen, prepared or preserved in airtight containers.5 Including telecommunications and sound recording
6 Includes Okinawa.7 Includes Alaska and Hawaii.8 Composed of Malaysia, Federal of, Sabah and Sarawaka As of first semesterb Not principal imports.Source: PSA, Foreign Trade Statistics of the Philippines
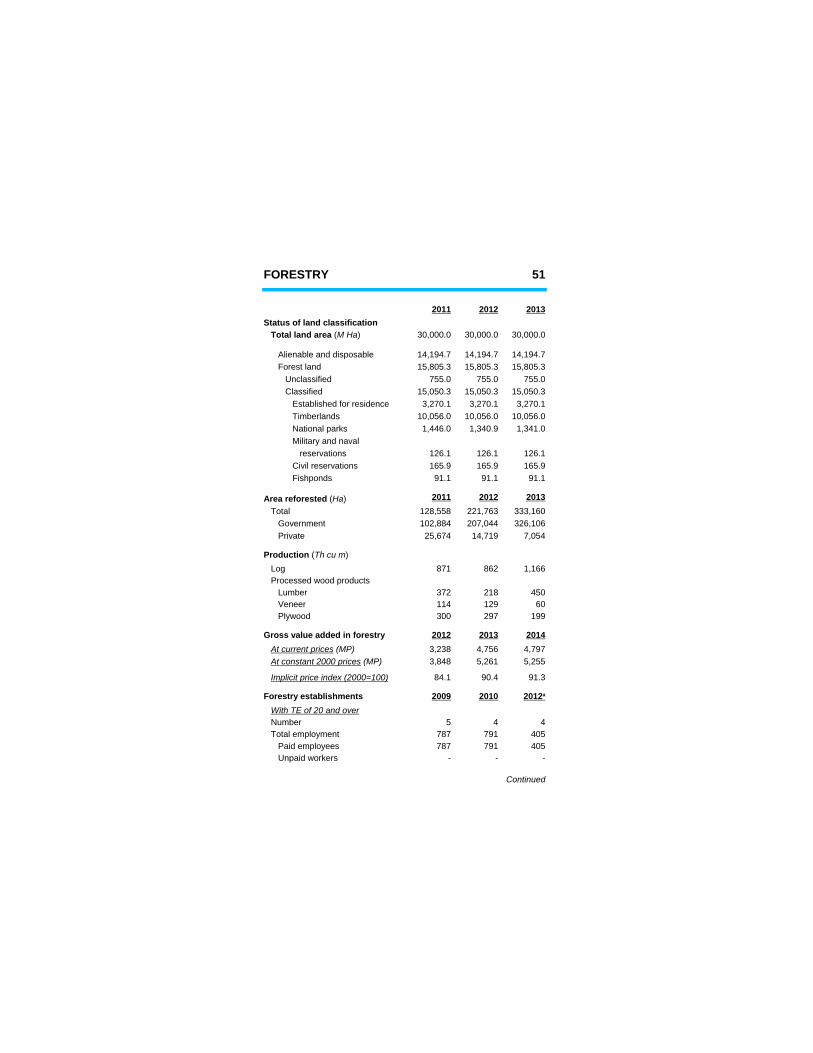
FORESTRY 51
2011 2012 2013Status of land classification
30,000.0 30,000.0 30,000.0
Alienable and disposable 14,194.7 14,194.7 14,194.7 Forest land 15,805.3 15,805.3 15,805.3 Unclassified 755.0 755.0 755.0 Classified 15,050.3 15,050.3 15,050.3 Established for residence 3,270.1 3,270.1 3,270.1
10,056.0 10,056.0 10,056.0 National parks 1,446.0 1,340.9 1,341.0 Military and naval reservations 126.1 126.1 126.1 Civil reservations 165.9 165.9 165.9 Fishponds 91.1 91.1 91.1
2011 2012 2013 Total 128,558 221,763 333,160 Government 102,884 207,044 326,106 Private 25,674 14,719 7,054
Log 871 862 1,166 Processed wood products Lumber 372 218 450 Veneer 114 129 60 Plywood 300 297 199
Gross value added in forestry 2012 2013 20143,238 4,756 4,7973,848 5,261 5,255
84.1 90.4 91.3
Forestry establishments 2009 2010
Number 5 4 4 Total employment 787 791 405 Paid employees 787 791 405 Unpaid workers - - -
Continued
Total land area (M Ha)
Timberlands
Area reforested (Ha)
Production (Th cu m)
At current prices (MP) At constant 2000 prices (MP)
Implicit price index (2000=100)
2012 a
With TE of 20 and over
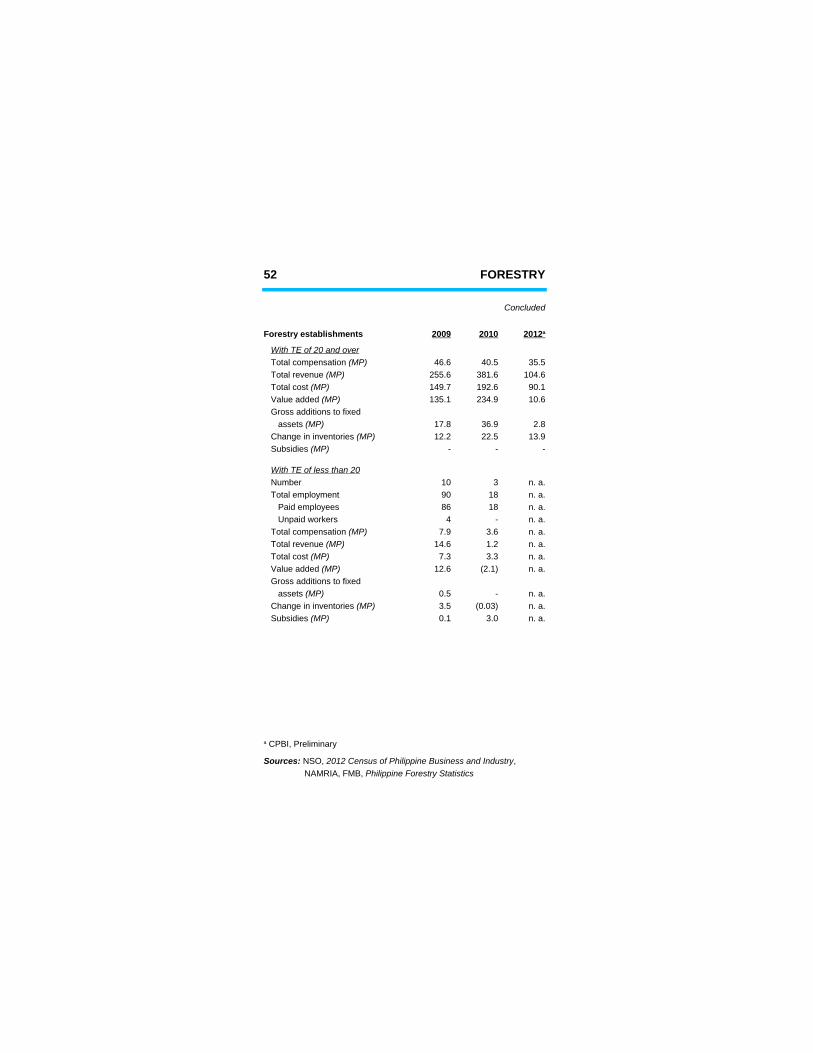
52 FORESTRY
Concluded
Forestry establishments 2009 2010
46.6 40.5 35.5255.6 381.6 104.6149.7 192.6 90.1135.1 234.9 10.6
Gross additions to fixed17.8 36.9 2.812.2 22.5 13.9
- - -
Number 10 3 n. a. Total employment 90 18 n. a. Paid employees 86 18 n. a. Unpaid workers 4 - n. a.
7.9 3.6 n. a.14.6 1.2 n. a.7.3 3.3 n. a.
12.6 (2.1) n. a. Gross additions to fixed
0.5 - n. a.3.5 (0.03) n. a.0.1 3.0 n. a.
2012 a
With TE of 20 and over Total compensation (MP) Total revenue (MP) Total cost (MP) Value added (MP)
assets (MP) Change in inventories (MP) Subsidies (MP)
With TE of less than 20
Total compensation (MP) Total revenue (MP) Total cost (MP) Value added (MP)
assets (MP) Change in inventories (MP) Subsidies (MP)
a CPBI, Preliminary
Sources: NSO, 2012 Census of Philippine Business and Industry, NAMRIA, FMB, Philippine Forestry Statistics
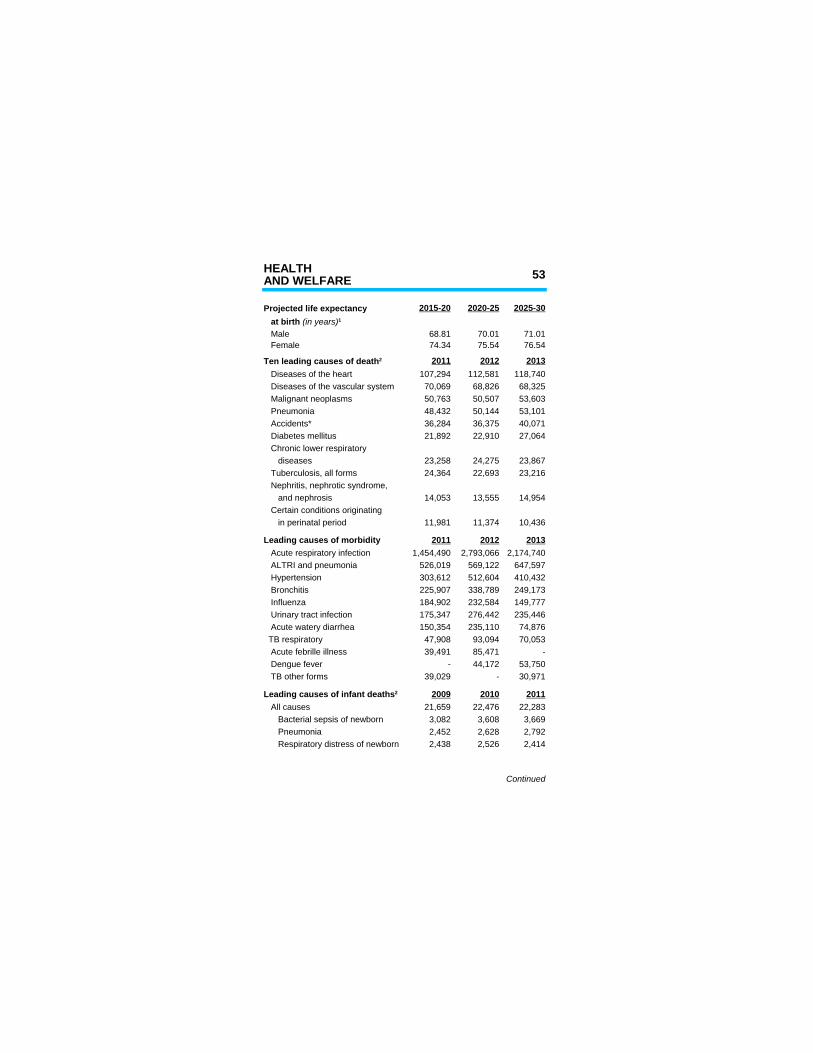
HEALTH 53AND WELFARE
Projected life expectancy 2015-20 2020-25 2025-30
Male 68.81 70.01 71.01 Female 74.34 75.54 76.54
2011 2012 2013 Diseases of the heart 107,294 112,581 118,740 Diseases of the vascular system 70,069 68,826 68,325 Malignant neoplasms 50,763 50,507 53,603 Pneumonia 48,432 50,144 53,101 Accidents* 36,284 36,375 40,071
21,892 22,910 27,064 Chronic lower respiratory diseases 23,258 24,275 23,867 Tuberculosis, all forms 24,364 22,693 23,216
14,053 13,555 14,954 Certain conditions originating in perinatal period 11,981 11,374 10,436
Leading causes of morbidity 2011 2012 2013 Acute respiratory infection 1,454,490 2,793,066 2,174,740 ALTRI and pneumonia 526,019 569,122 647,597 Hypertension 303,612 512,604 410,432 Bronchitis 225,907 338,789 249,173 Influenza 184,902 232,584 149,777 Urinary tract infection 175,347 276,442 235,446 Acute watery diarrhea 150,354 235,110 74,876 TB respiratory 47,908 93,094 70,053
39,491 85,471 - Dengue fever - 44,172 53,750 TB other forms 39,029 - 30,971
2009 2010 2011 All causes 21,659 22,476 22,283 Bacterial sepsis of newborn 3,082 3,608 3,669 Pneumonia 2,452 2,628 2,792 Respiratory distress of newborn 2,438 2,526 2,414
Continued
at birth (in years)1
Ten leading causes of death2
Diabetes mellitus
Nephritis, nephrotic syndrome, and nephrosis
Acute febrille illness
Leading causes of infant deaths2
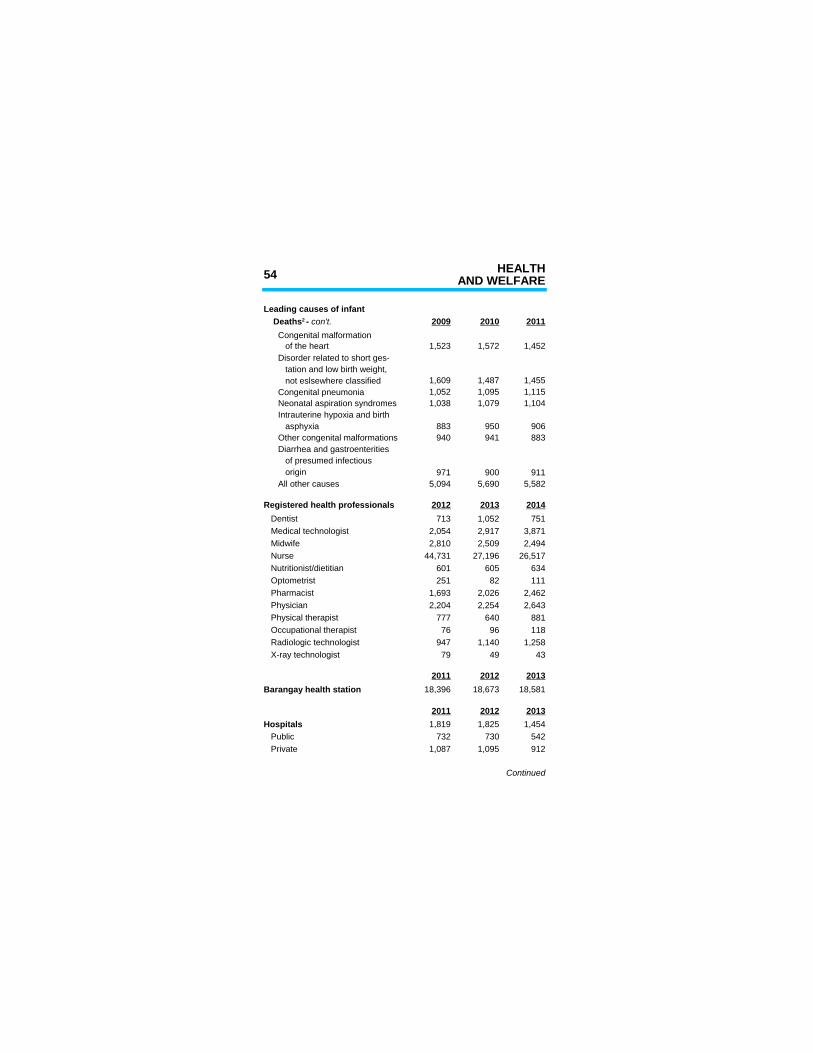
54 HEALTHAND WELFARE
Leading causes of infant2009 2010 2011
Congenital malformation of the heart 1,523 1,572 1,452
1,609 1,487 1,455 Congenital pneumonia 1,052 1,095 1,115 Neonatal aspiration syndromes 1,038 1,079 1,104 Intrauterine hypoxia and birth asphyxia 883 950 906 Other congenital malformations 940 941 883
of presumed infectious origin 971 900 911 All other causes 5,094 5,690 5,582
Registered health professionals 2012 2013 2014 Dentist 713 1,052 751 Medical technologist 2,054 2,917 3,871 Midwife 2,810 2,509 2,494 Nurse 44,731 27,196 26,517 Nutritionist/dietitian 601 605 634 Optometrist 251 82 111 Pharmacist 1,693 2,026 2,462 Physician 2,204 2,254 2,643 Physical therapist 777 640 881 Occupational therapist 76 96 118
947 1,140 1,258 X-ray technologist 79 49 43
2011 2012 201318,396 18,673 18,581
2011 2012 2013Hospitals 1,819 1,825 1,454 Public 732 730 542 Private 1,087 1,095 912
Continued
Deaths2 - con't.
Disorder related to short ges- tation and low birth weight, not eslsewhere classified
Diarrhea and gastroenterities
Radiologic technologist
Barangay health station
HEALTH 55AND WELFARE
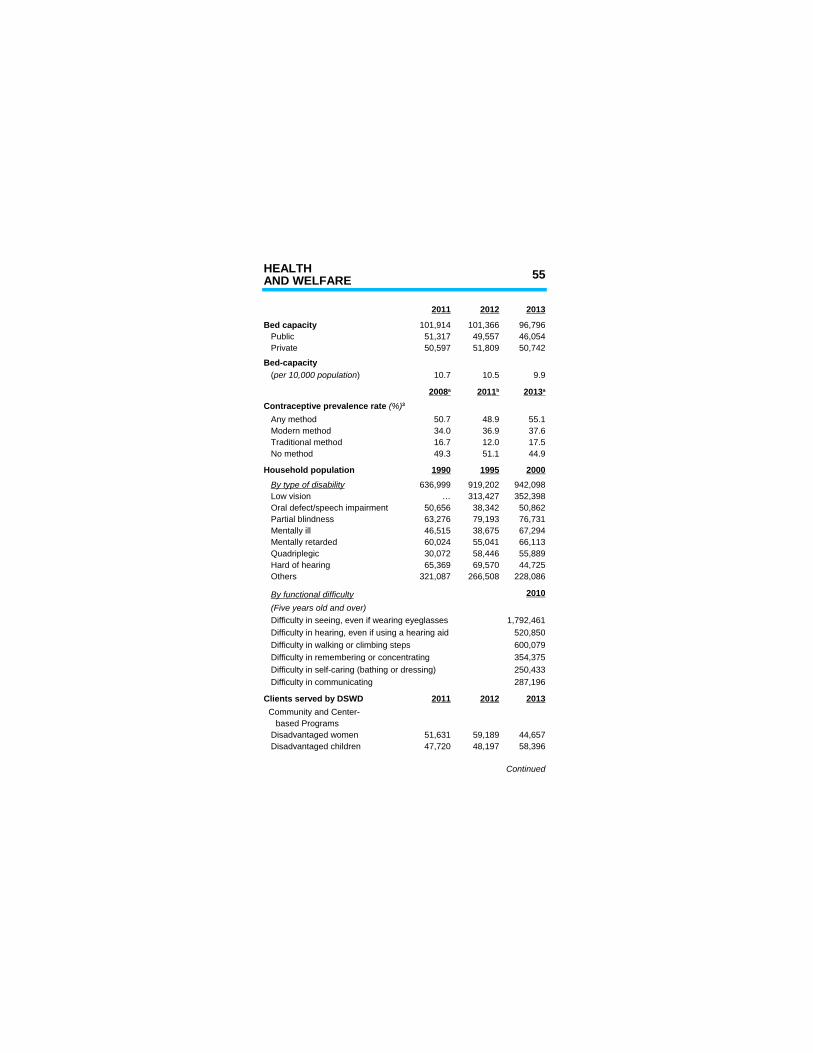
2011 2012 2013
Bed capacity 101,914 101,366 96,796 Public 51,317 49,557 46,054 Private 50,597 51,809 50,742
Bed-capacity10.7 10.5 9.9
Any method 50.7 48.9 55.1 Modern method 34.0 36.9 37.6 Traditional method 16.7 12.0 17.5 No method 49.3 51.1 44.9
Household population 1990 1995 2000636,999 919,202 942,098
Low vision … 313,427 352,398 Oral defect/speech impairment 50,656 38,342 50,862 Partial blindness 63,276 79,193 76,731 Mentally ill 46,515 38,675 67,294 Mentally retarded 60,024 55,041 66,113 Quadriplegic 30,072 58,446 55,889 Hard of hearing 65,369 69,570 44,725 Others 321,087 266,508 228,086
2010
Difficulty in seeing, even if wearing eyeglasses 1,792,461 Difficulty in hearing, even if using a hearing aid 520,850 Difficulty in walking or climbing steps 600,079 Difficulty in remembering or concentrating 354,375 Difficulty in self-caring (bathing or dressing) 250,433 Difficulty in communicating 287,196
Clients served by DSWD 2011 2012 2013 Community and Center- based Programs Disadvantaged women 51,631 59,189 44,657 Disadvantaged children 47,720 48,197 58,396
Continued
(per 10,000 population)
2008 a 2011 b 2013 a
Contraceptive prevalence rate (%)3
By type of disability
By functional difficulty (Five years old and over)
56 HEALTHAND WELFARE
2011 2012 2013 Disadvantaged youth 9,798 9,666 12,374 Disadvantaged disabled 2,384 2,980 2,135 Older persons 10,416 14,998 11,721
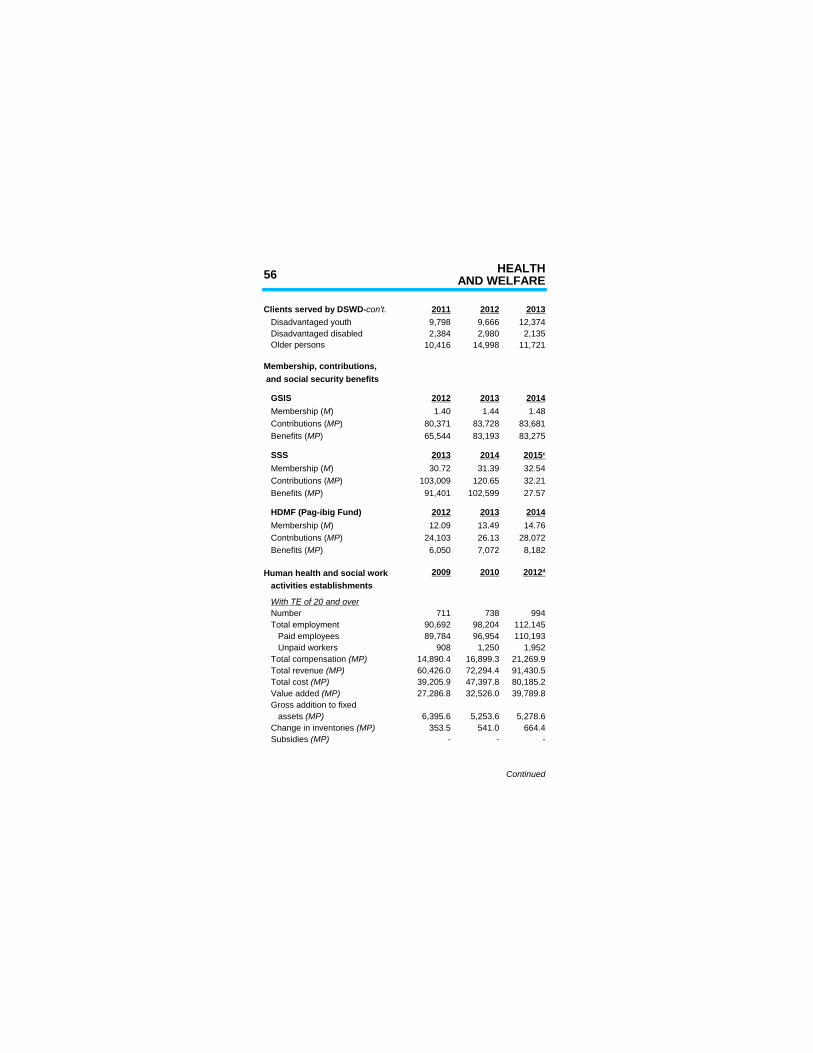
Membership, contributions, and social security benefits
GSIS 2012 2013 20141.40 1.44 1.48
80,371 83,728 83,68165,544 83,193 83,275
SSS 2013 201430.72 31.39 32.54
103,009 120.65 32.2191,401 102,599 27.57
2012 2013 201412.09 13.49 14.76
24,103 26.13 28,0726,050 7,072 8,182
Human health and social work 2009 2010 activities establishments
Number 711 738 994 Total employment 90,692 98,204 112,145 Paid employees 89,784 96,954 110,193 Unpaid workers 908 1,250 1,952
14,890.4 16,899.3 21,269.960,426.0 72,294.4 91,430.539,205.9 47,397.8 80,185.227,286.8 32,526.0 39,789.8
Gross addition to fixed6,395.6 5,253.6 5,278.6
353.5 541.0 664.4- - -
Continued
Clients served by DSWD-con't.
Membership (M) Contributions (MP) Benefits (MP)
2015 c
Membership (M) Contributions (MP) Benefits (MP)
HDMF (Pag-ibig Fund) Membership (M) Contributions (MP) Benefits (MP)
2012 d
With TE of 20 and over
Total compensation (MP) Total revenue (MP) Total cost (MP) Value added (MP)
assets (MP) Change in inventories (MP) Subsidies (MP)
HEALTH 57AND WELFARE
Concluded
Human health and social work 2009 2010
Number 3,769 3,713 5,441 Total employment 25,136 24,612 28,293 Paid employees 23,711 22,550 24,908 Unpaid workers 1,425 2,062 3,385
2,384.0 2,565.4 2,945.09,844.1 12,031.5 15,486.86,701.5 7,934.3 11,587.13,850.8 5,186.3 7,639.1
Gross addition to fixed484.0 4,878.8 378.9 (6.4) 95.4 130.1
- - -
Notes:
* External causes of mortality.
and HDMF
2012 d
activities establishments - con't. With TE of less than 20
Total compensation (MP) Total revenue (MP) Total cost (MP) Value added (MP)
assets (MP) Change in inventories (MP) Subsidies (MP)
1 2000 Census-based Population Projections2 Based on civil registration. Not adjusted for underregistration.3 Based on currently married women 15-49 years.
a National Demographic and Health Surveyb Family Health Surveyc As of Marchd CPBI, Final results
Sources: PSA, Family Planning Survey, National Demographic
and Health Survey, DOH, PRC, DSWD, GSIS, SSS,
58 INCOMEAND PRICES
Total 2006 2009 2012
Family income 3,006 3,804 5,027 Family expenditure 2,561 3,239 4,125 Family savings 445 565 902
2003 2006 2009 Family income 2,009 2,180 2,378 Family expenditure 1,681 1,857 2,024 Family savings 329 323 353
Annual average 2006 2009 2012
Family income 173 208 235 Family expenditure 147 177 193 Family savings 26 31 42
Family income 125 179 180 Family expenditure 107 153 148 Family savings 19 26 32
17,403 18,452 21,426
100.00 100.00 100.00 Under P 40,000 8.0 4.1 3.2 40,000 - 59,999 13.5 8.7 6.5 60,000 - 99,999 23.7 22.2 18.9 100,000 - 249,999 36.0 41.0 42.3 250,000 and over 18.8 23.9 29.1
3,006 3,804 5,027100.00 100.00 100.00
Under P 40,000 1.4 0.6 0.4 40,000 - 59,999 3.9 2.1 1.5 60,000 - 99,999 10.8 8.6 7.2 100,000 - 249,999 32.8 31.7 30.7 250,000 and over 51.1 56.9 60.2
Continued
At current prices (BP)
At constant prices (BP)
At current prices (Th P)
At constant prices (Th P)
Number of families (Th)
By income class (%)
Total family income (BP) By income class (%)
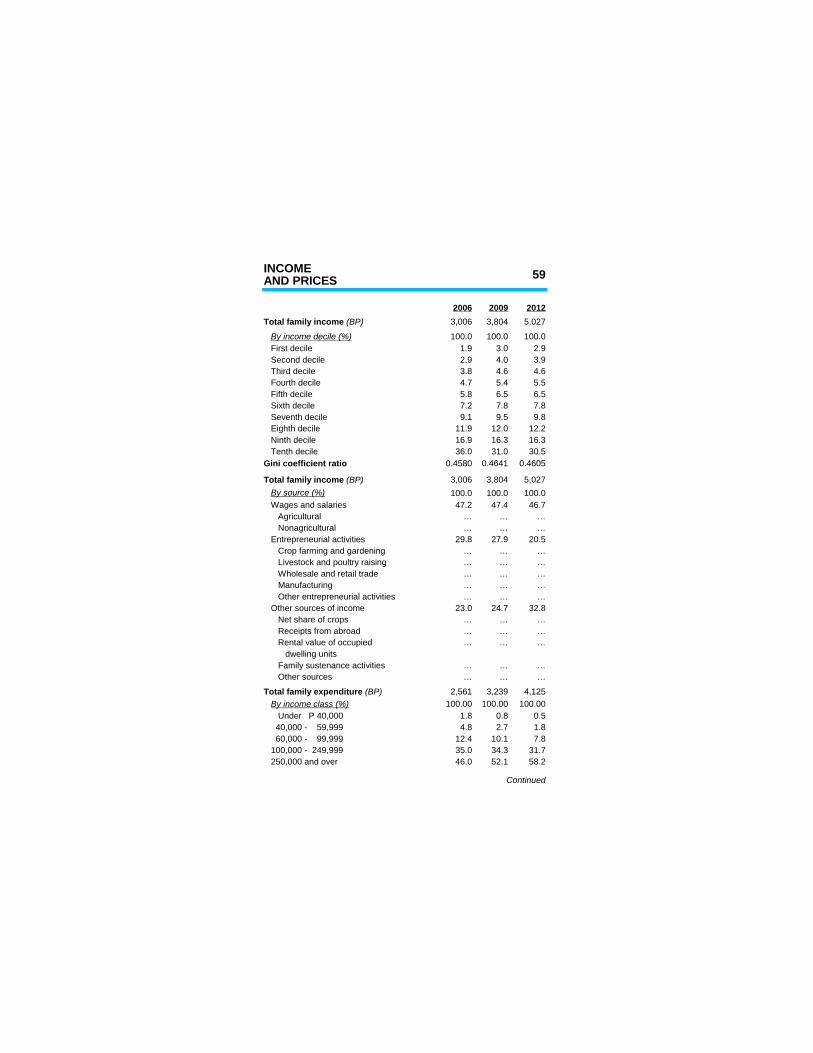
INCOME 59AND PRICES
2006 2009 20123,006 3,804 5,027
100.0 100.0 100.01.9 3.0 2.92.9 4.0 3.93.8 4.6 4.64.7 5.4 5.55.8 6.5 6.57.2 7.8 7.89.1 9.5 9.8
11.9 12.0 12.216.9 16.3 16.336.0 31.0 30.5
0.4580 0.4641 0.4605
3,006 3,804 5,027100.0 100.0 100.0
Wages and salaries 47.2 47.4 46.7 Agricultural … … …
… … … Entrepreneurial activities 29.8 27.9 20.5 Crop farming and gardening … … … Livestock and poultry raising … … … Wholesale and retail trade … … … Manufacturing … … … Other entrepreneurial activities … … … Other sources of income 23.0 24.7 32.8 Net share of crops … … … Receipts from abroad … … … Rental value of occupied … … … dwelling units Family sustenance activities … … … Other sources … … …
2,561 3,239 4,125100.00 100.00 100.00
Under P 40,000 1.8 0.8 0.5 40,000 - 59,999 4.8 2.7 1.8 60,000 - 99,999 12.4 10.1 7.8 100,000 - 249,999 35.0 34.3 31.7 250,000 and over 46.0 52.1 58.2
Continued
Total family income (BP)
By income decile (%) First decile Second decile Third decile Fourth decile Fifth decile Sixth decile Seventh decile Eighth decile Ninth decile Tenth decileGini coefficient ratio
Total family income (BP) By source (%)
Nonagricultural
Total family expenditure (BP) By income class (%)
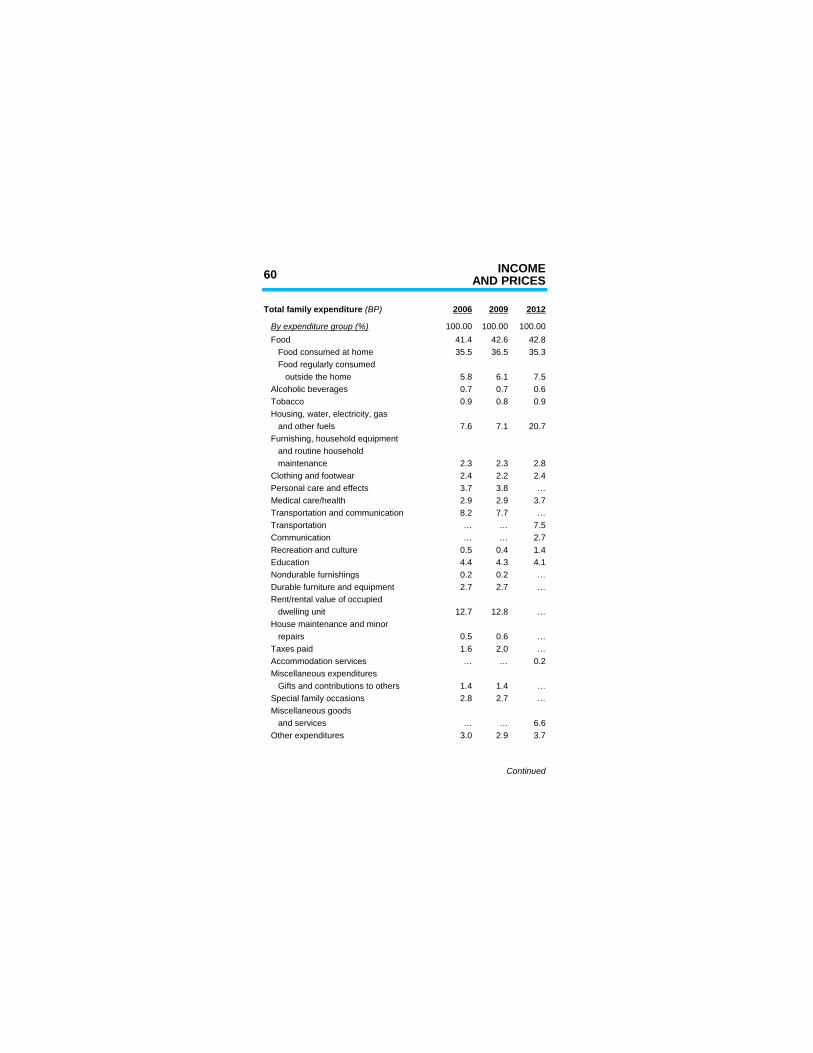
60 INCOMEAND PRICES
2006 2009 2012
100.00 100.00 100.00 Food 41.4 42.6 42.8 Food consumed at home 35.5 36.5 35.3 Food regularly consumed outside the home 5.8 6.1 7.5 Alcoholic beverages 0.7 0.7 0.6 Tobacco 0.9 0.8 0.9 Housing, water, electricity, gas and other fuels 7.6 7.1 20.7 Furnishing, household equipment and routine household maintenance 2.3 2.3 2.8 Clothing and footwear 2.4 2.2 2.4 Personal care and effects 3.7 3.8 … Medical care/health 2.9 2.9 3.7 Transportation and communication 8.2 7.7 … Transportation … … 7.5 Communication … … 2.7 Recreation and culture 0.5 0.4 1.4 Education 4.4 4.3 4.1
0.2 0.2 … Durable furniture and equipment 2.7 2.7 … Rent/rental value of occupied dwelling unit 12.7 12.8 … House maintenance and minor repairs 0.5 0.6 … Taxes paid 1.6 2.0 … Accommodation services … … 0.2 Miscellaneous expenditures Gifts and contributions to others 1.4 1.4 … Special family occasions 2.8 2.7 … Miscellaneous goods and services … … 6.6 Other expenditures 3.0 2.9 3.7
Continued
Total family expenditure (BP)
By expenditure group (%)
Nondurable furnishings
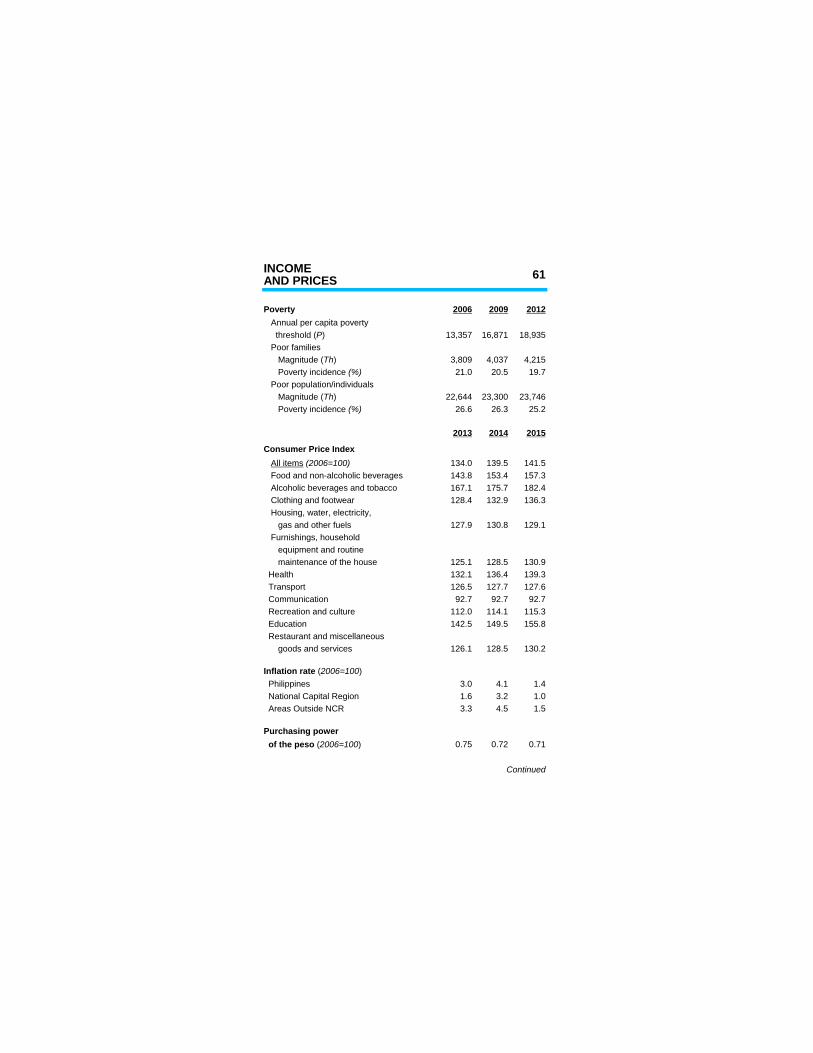
INCOME 61AND PRICES
Poverty 2006 2009 2012
13,357 16,871 18,935 Poor families
3,809 4,037 4,21521.0 20.5 19.7
Poor population/individuals22,644 23,300 23,746
26.6 26.3 25.2
2013 2014 2015
Consumer Price Index134.0 139.5 141.5
Food and non-alcoholic beverages 143.8 153.4 157.3 Alcoholic beverages and tobacco 167.1 175.7 182.4 Clothing and footwear 128.4 132.9 136.3 Housing, water, electricity, gas and other fuels 127.9 130.8 129.1 Furnishings, household equipment and routine maintenance of the house 125.1 128.5 130.9 Health 132.1 136.4 139.3 Transport 126.5 127.7 127.6 Communication 92.7 92.7 92.7 Recreation and culture 112.0 114.1 115.3 Education 142.5 149.5 155.8 Restaurant and miscellaneous goods and services 126.1 128.5 130.2
Philippines 3.0 4.1 1.4 National Capital Region 1.6 3.2 1.0 Areas Outside NCR 3.3 4.5 1.5
Purchasing power 0.75 0.72 0.71
Continued
Annual per capita poverty threshold (P)
Magnitude (Th) Poverty incidence (%)
Magnitude (Th) Poverty incidence (%)
All items (2006=100)
Inflation rate (2006=100)
of the peso (2006=100)
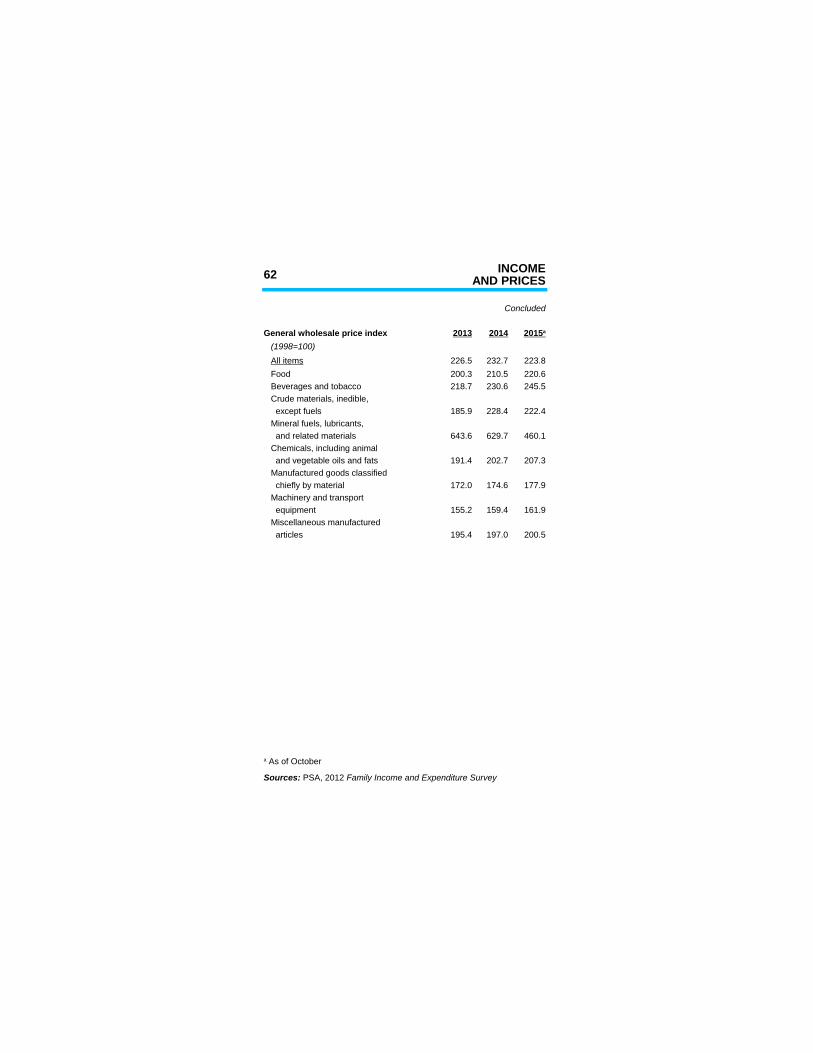
62 INCOMEAND PRICES
Concluded
General wholesale price index 2013 2014
226.5 232.7 223.8 Food 200.3 210.5 220.6 Beverages and tobacco 218.7 230.6 245.5 Crude materials, inedible, except fuels 185.9 228.4 222.4 Mineral fuels, lubricants, and related materials 643.6 629.7 460.1 Chemicals, including animal and vegetable oils and fats 191.4 202.7 207.3 Manufactured goods classified chiefly by material 172.0 174.6 177.9 Machinery and transport equipment 155.2 159.4 161.9 Miscellaneous manufactured articles 195.4 197.0 200.5
2015 a
(1998=100) All items
a As of October
Sources: PSA, 2012 Family Income and Expenditure Survey
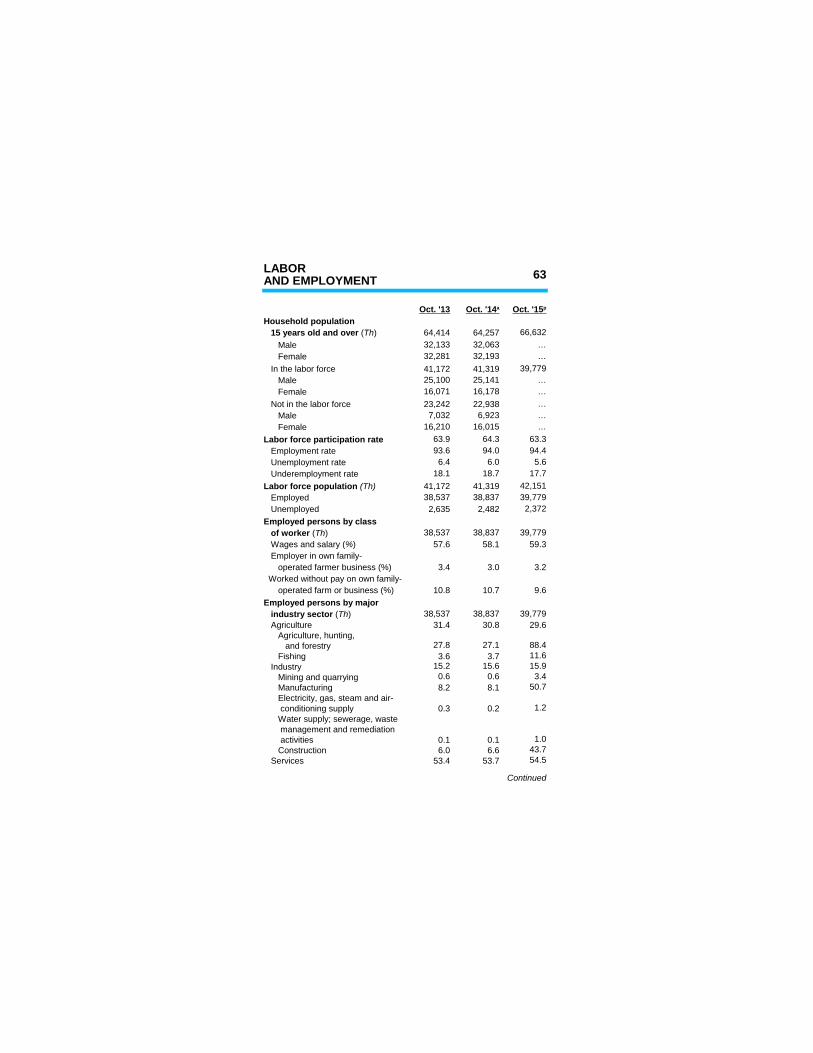
LABOR 63AND EMPLOYMENT
Oct. '13Household population
64,414 64,257 66,632 Male 32,133 32,063 … Female 32,281 32,193 … In the labor force 41,172 41,319 39,779 Male 25,100 25,141 … Female 16,071 16,178 … Not in the labor force 23,242 22,938 … Male 7,032 6,923 … Female 16,210 16,015 …Labor force participation rate 63.9 64.3 63.3 Employment rate 93.6 94.0 94.4 Unemployment rate 6.4 6.0 5.6 Underemployment rate 18.1 18.7 17.7
41,172 41,319 42,151 Employed 38,537 38,837 39,779 Unemployed 2,635 2,482 2,372Employed persons by class
38,537 38,837 39,77957.6 58.1 59.3
Employer in own family- operated farmer business (%) 3.4 3.0 3.2 Worked without pay on own family- operated farm or business (%) 10.8 10.7 9.6Employed persons by major
38,537 38,837 39,779 Agriculture 31.4 30.8 29.6 Agriculture, hunting, and forestry 27.8 27.1 88.4 Fishing 3.6 3.7 11.6 Industry 15.2 15.6 15.9 Mining and quarrying 0.6 0.6 3.4 Manufacturing 8.2 8.1 50.7 Electricity, gas, steam and air- conditioning supply 0.3 0.2 1.2 Water supply; sewerage, waste management and remediation activities 0.1 0.1 1.0 Construction 6.0 6.6 43.7 Services 53.4 53.7 54.5
Continued
Oct. '14 a Oct. '15 p
15 years old and over (Th)
Labor force population (Th)
of worker (Th) Wages and salary (%)
industry sector (Th)
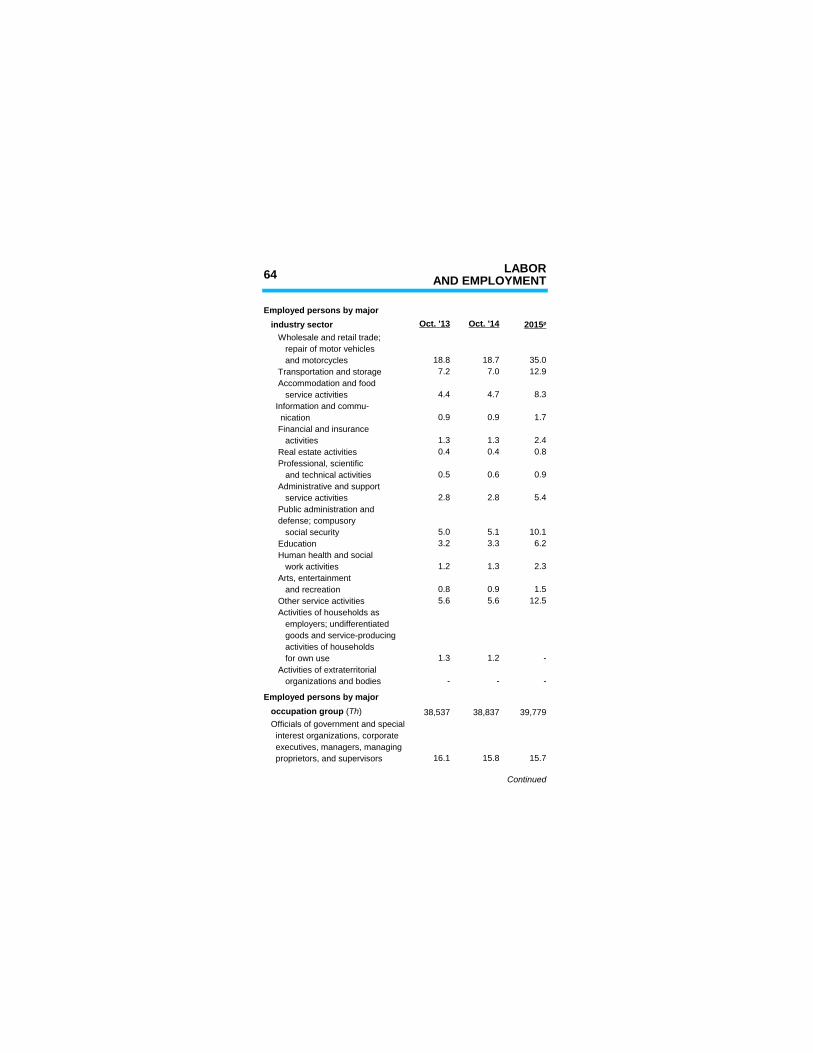
64 LABORAND EMPLOYMENT
Employed persons by major industry sector Oct. '13 Oct. '14 Wholesale and retail trade; repair of motor vehicles and motorcycles 18.8 18.7 35.0 Transportation and storage 7.2 7.0 12.9 Accommodation and food service activities 4.4 4.7 8.3
0.9 0.9 1.7 Financial and insurance activities 1.3 1.3 2.4 Real estate activities 0.4 0.4 0.8 Professional, scientific and technical activities 0.5 0.6 0.9 Administrative and support service activities 2.8 2.8 5.4 Public administration and
social security 5.0 5.1 10.1 Education 3.2 3.3 6.2 Human health and social work activities 1.2 1.3 2.3 Arts, entertainment and recreation 0.8 0.9 1.5 Other service activities 5.6 5.6 12.5 Activities of households as employers; undifferentiated goods and service-producing activities of households for own use 1.3 1.2 - Activities of extraterritorial organizations and bodies - - -
Employed persons by major
38,537 38,837 39,779 Officials of government and special interest organizations, corporate executives, managers, managing proprietors, and supervisors 16.1 15.8 15.7
Continued
2015 p
Information and commu- nication
defense; compusory
occupation group (Th)
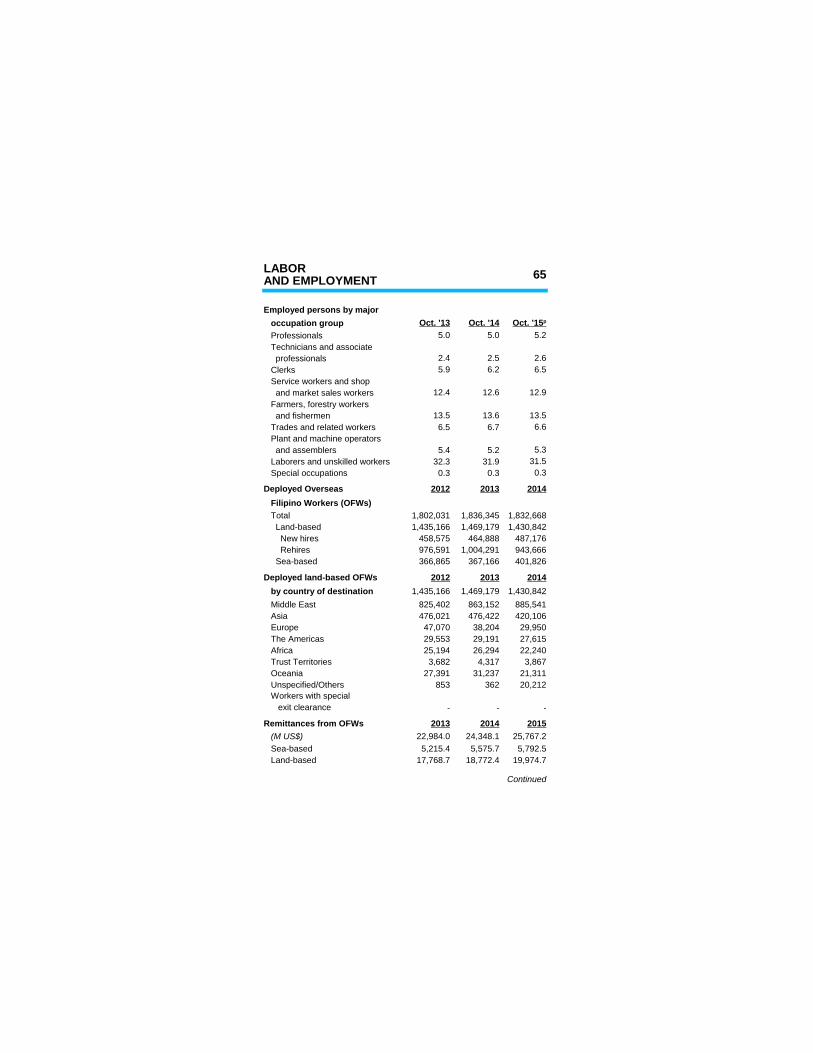
LABOR 65AND EMPLOYMENT
Employed persons by major occupation group Oct. '13 Oct. '14 Professionals 5.0 5.0 5.2 Technicians and associate professionals 2.4 2.5 2.6 Clerks 5.9 6.2 6.5 Service workers and shop and market sales workers 12.4 12.6 12.9 Farmers, forestry workers and fishermen 13.5 13.6 13.5 Trades and related workers 6.5 6.7 6.6 Plant and machine operators and assemblers 5.4 5.2 5.3 Laborers and unskilled workers 32.3 31.9 31.5 Special occupations 0.3 0.3 0.3
Deployed Overseas 2012 2013 2014
Total 1,802,031 1,836,345 1,832,668 Land-based 1,435,166 1,469,179 1,430,842 New hires 458,575 464,888 487,176 Rehires 976,591 1,004,291 943,666 Sea-based 366,865 367,166 401,826
2012 2013 2014 by country of destination 1,435,166 1,469,179 1,430,842 Middle East 825,402 863,152 885,541 Asia 476,021 476,422 420,106 Europe 47,070 38,204 29,950 The Americas 29,553 29,191 27,615 Africa 25,194 26,294 22,240 Trust Territories 3,682 4,317 3,867 Oceania 27,391 31,237 21,311 Unspecified/Others 853 362 20,212 Workers with special exit clearance - - -
2013 2014 201522,984.0 24,348.1 25,767.2
Sea-based 5,215.4 5,575.7 5,792.5 Land-based 17,768.7 18,772.4 19,974.7
Continued
Oct. '15 p
Filipino Workers (OFWs)
Deployed land-based OFWs
Remittances from OFWs (M US$)
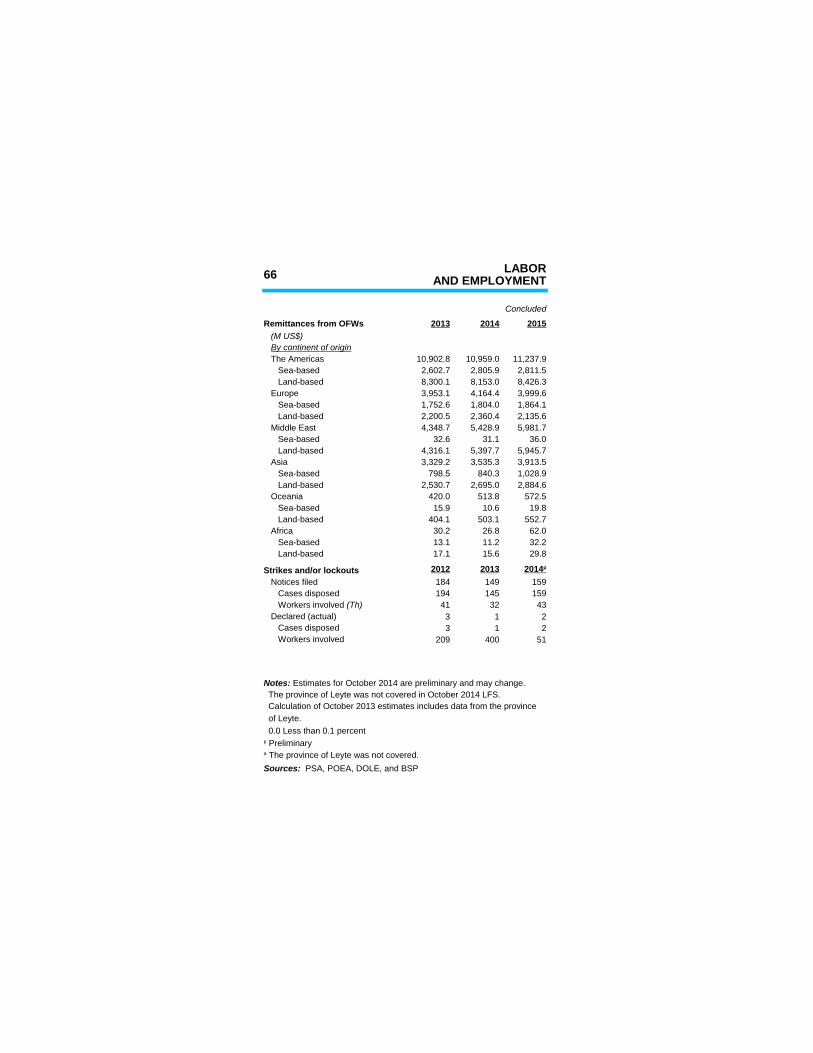
66 LABORAND EMPLOYMENT
Concluded
2013 2014 2015
The Americas 10,902.8 10,959.0 11,237.9 Sea-based 2,602.7 2,805.9 2,811.5 Land-based 8,300.1 8,153.0 8,426.3 Europe 3,953.1 4,164.4 3,999.6 Sea-based 1,752.6 1,804.0 1,864.1 Land-based 2,200.5 2,360.4 2,135.6 Middle East 4,348.7 5,428.9 5,981.7 Sea-based 32.6 31.1 36.0 Land-based 4,316.1 5,397.7 5,945.7 Asia 3,329.2 3,535.3 3,913.5 Sea-based 798.5 840.3 1,028.9 Land-based 2,530.7 2,695.0 2,884.6 Oceania 420.0 513.8 572.5 Sea-based 15.9 10.6 19.8 Land-based 404.1 503.1 552.7 Africa 30.2 26.8 62.0 Sea-based 13.1 11.2 32.2 Land-based 17.1 15.6 29.8
Strikes and/or lockouts 2012 2013 Notices filed 184 149 159 Cases disposed 194 145 159
41 32 43 Declared (actual) 3 1 2 Cases disposed 3 1 2 Workers involved 209 400 51
Calculation of October 2013 estimates includes data from the province
0.0 Less than 0.1 percent
Remittances from OFWs (M US$) By continent of origin
2014 p
Workers involved (Th)
Notes: Estimates for October 2014 are preliminary and may change. The province of Leyte was not covered in October 2014 LFS.
of Leyte.
p Preliminarya The province of Leyte was not covered.Sources: PSA, POEA, DOLE, and BSP
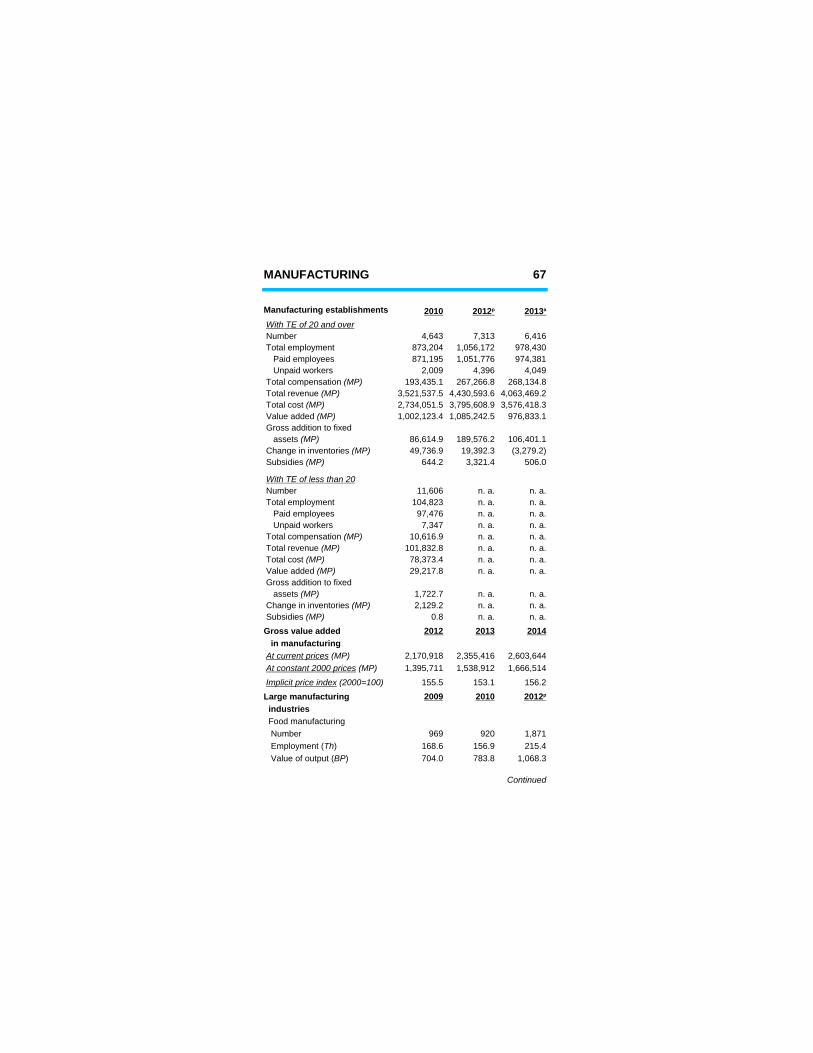
MANUFACTURING 67
Manufacturing establishments 2010
Number 4,643 7,313 6,416 Total employment 873,204 1,056,172 978,430 Paid employees 871,195 1,051,776 974,381 Unpaid workers 2,009 4,396 4,049
193,435.1 267,266.8 268,134.83,521,537.5 4,430,593.6 4,063,469.22,734,051.5 3,795,608.9 3,576,418.31,002,123.4 1,085,242.5 976,833.1
Gross addition to fixed86,614.9 189,576.2 106,401.149,736.9 19,392.3 (3,279.2)
644.2 3,321.4 506.0
Number 11,606 n. a. n. a. Total employment 104,823 n. a. n. a. Paid employees 97,476 n. a. n. a. Unpaid workers 7,347 n. a. n. a.
10,616.9 n. a. n. a.101,832.8 n. a. n. a.78,373.4 n. a. n. a.29,217.8 n. a. n. a.
Gross addition to fixed1,722.7 n. a. n. a.2,129.2 n. a. n. a.
0.8 n. a. n. a.Gross value added 2012 2013 2014 in manufacturing
2,170,918 2,355,416 2,603,6441,395,711 1,538,912 1,666,514
155.5 153.1 156.2Large manufacturing 2009 2010 industries Food manufacturing Number 969 920 1,871
168.6 156.9 215.4704.0 783.8 1,068.3
Continued
2012 p 2013 a
With TE of 20 and over
Total compensation (MP) Total revenue (MP) Total cost (MP) Value added (MP)
assets (MP) Change in inventories (MP) Subsidies (MP)
With TE of less than 20
Total compensation (MP) Total revenue (MP) Total cost (MP) Value added (MP)
assets (MP) Change in inventories (MP) Subsidies (MP)
At current prices (MP) At constant 2000 prices (MP)
Implicit price index (2000=100)2012 p
Employment (Th) Value of output (BP)
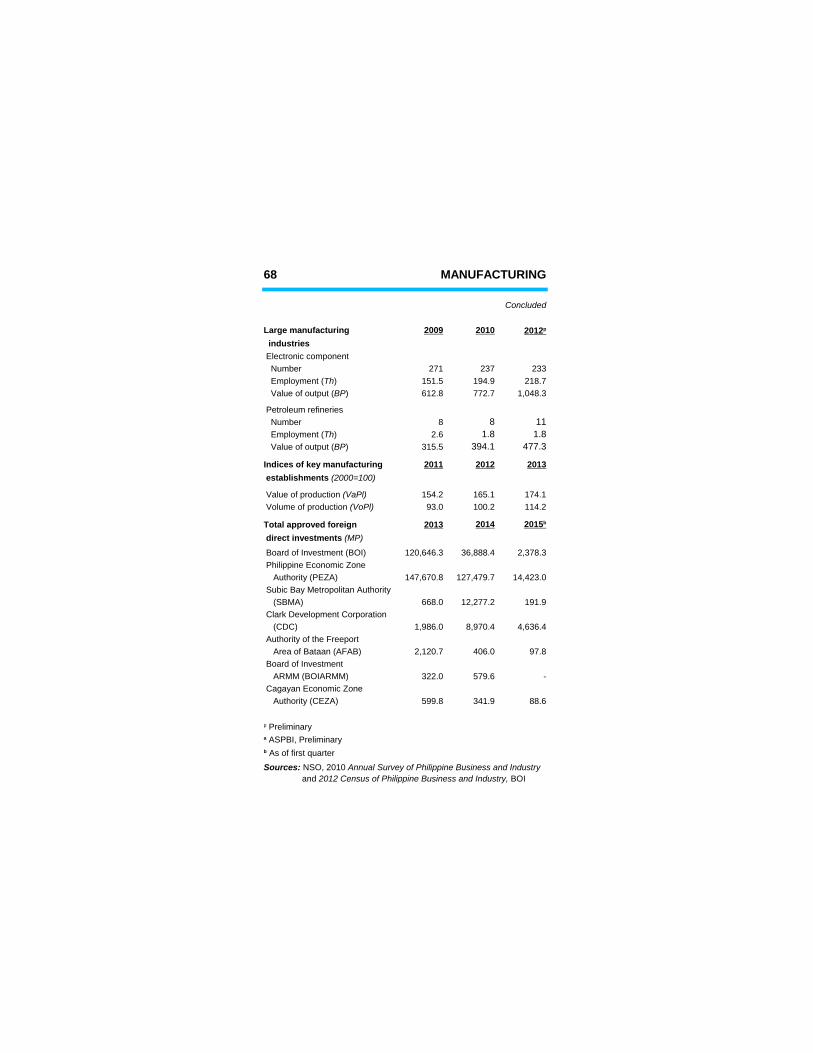
68 MANUFACTURING
Concluded
Large manufacturing 2009 2010 industries Electronic component Number 271 237 233
151.5 194.9 218.7612.8 772.7 1,048.3
Petroleum refineries Number 8 8 11
2.6 1.8 1.8315.5 394.1 477.3
2011 2012 2013
154.2 165.1 174.193.0 100.2 114.2
Total approved foreign 2013 2014
Board of Investment (BOI) 120,646.3 36,888.4 2,378.3 Philippine Economic Zone Authority (PEZA) 147,670.8 127,479.7 14,423.0
(SBMA) 668.0 12,277.2 191.9 Clark Development Corporation (CDC) 1,986.0 8,970.4 4,636.4
Area of Bataan (AFAB) 2,120.7 406.0 97.8 Board of Investment ARMM (BOIARMM) 322.0 579.6 -
Authority (CEZA) 599.8 341.9 88.6
2012 p
Employment (Th) Value of output (BP)
Employment (Th) Value of output (BP)
Indices of key manufacturing establishments (2000=100)
Value of production (VaPl) Volume of production (VoPl)
2015 b
direct investments (MP)
Subic Bay Metropolitan Authority
Authority of the Freeport
Cagayan Economic Zone
p Preliminarya ASPBI, Preliminaryb As of first quarterSources: NSO, 2010 Annual Survey of Philippine Business and Industry and 2012 Census of Philippine Business and Industry, BOI
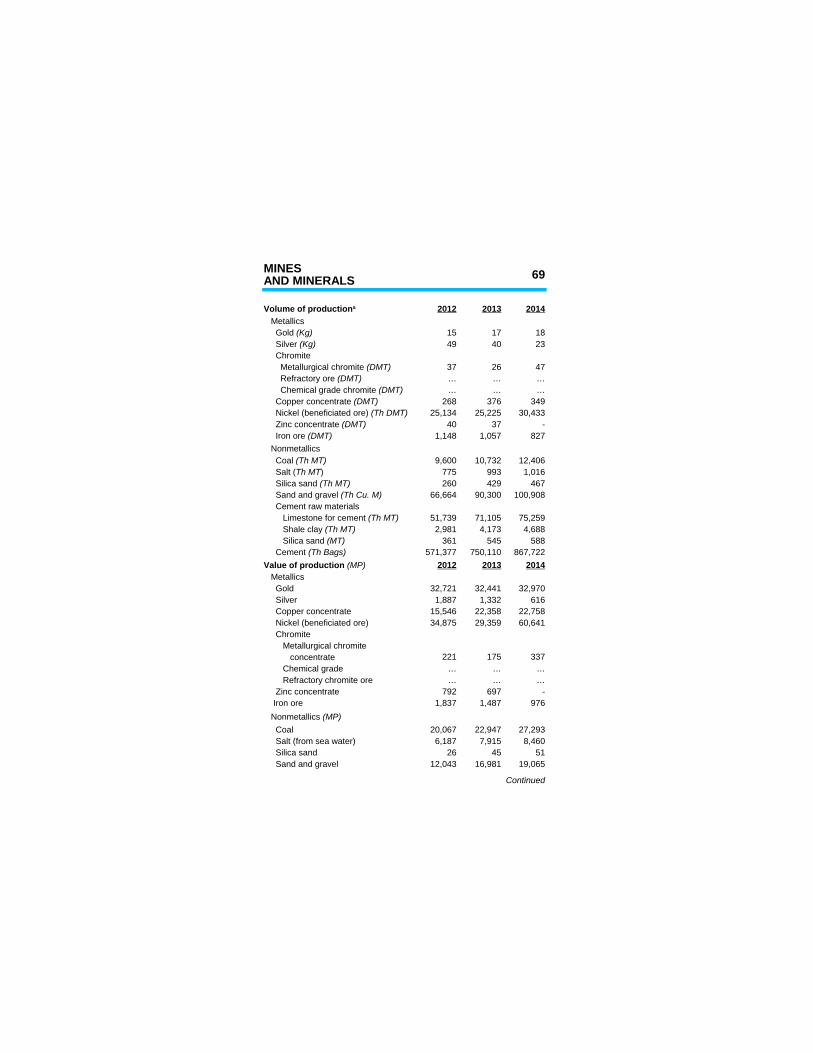
MINES 69AND MINERALS
2012 2013 2014
15 17 1849 40 23
Chromite37 26 47… … …… … …
268 376 34925,134 25,225 30,433
40 37 -1,148 1,057 827
9,600 10,732 12,406775 993 1,016260 429 467
66,664 90,300 100,908 Cement raw materials
51,739 71,105 75,2592,981 4,173 4,688
361 545 588571,377 750,110 867,722
2012 2013 2014
Gold 32,721 32,441 32,970 Silver 1,887 1,332 616 Copper concentrate 15,546 22,358 22,758
34,875 29,359 60,641 Chromite Metallurgical chromite concentrate 221 175 337 Chemical grade … … … Refractory chromite ore … … … Zinc concentrate 792 697 - Iron ore 1,837 1,487 976
Coal 20,067 22,947 27,293 Salt (from sea water) 6,187 7,915 8,460 Silica sand 26 45 51 Sand and gravel 12,043 16,981 19,065
Continued
Volume of productiona
Metallics Gold (Kg) Silver (Kg)
Metallurgical chromite (DMT) Refractory ore (DMT) Chemical grade chromite (DMT) Copper concentrate (DMT) Nickel (beneficiated ore) (Th DMT) Zinc concentrate (DMT) Iron ore (DMT) Nonmetallics Coal (Th MT) Salt (Th MT) Silica sand (Th MT) Sand and gravel (Th Cu. M)
Limestone for cement (Th MT) Shale clay (Th MT) Silica sand (MT) Cement (Th Bags)Value of production (MP) Metallics
Nickel (beneficiated ore)
Nonmetallics (MP)
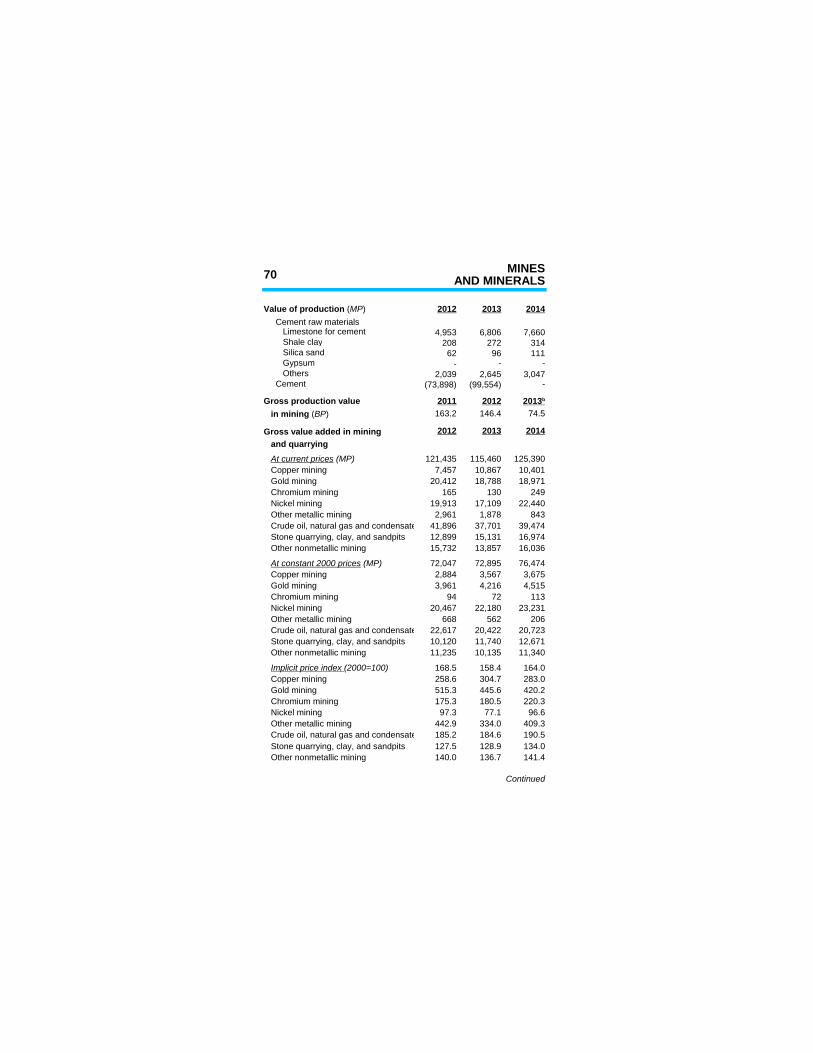
70 MINESAND MINERALS
2012 2013 2014 Cement raw materials Limestone for cement 4,953 6,806 7,660 Shale clay 208 272 314 Silica sand 62 96 111 Gypsum - - - Others 2,039 2,645 3,047 Cement (73,898) (99,554) -
Gross production value 2011 2012163.2 146.4 74.5
Gross value added in mining 2012 2013 2014 and quarrying
121,435 115,460 125,390 Copper mining 7,457 10,867 10,401 Gold mining 20,412 18,788 18,971 Chromium mining 165 130 249 Nickel mining 19,913 17,109 22,440 Other metallic mining 2,961 1,878 843 Crude oil, natural gas and condensate 41,896 37,701 39,474 Stone quarrying, clay, and sandpits 12,899 15,131 16,974 Other nonmetallic mining 15,732 13,857 16,036
72,047 72,895 76,474 Copper mining 2,884 3,567 3,675 Gold mining 3,961 4,216 4,515 Chromium mining 94 72 113 Nickel mining 20,467 22,180 23,231 Other metallic mining 668 562 206 Crude oil, natural gas and condensate 22,617 20,422 20,723 Stone quarrying, clay, and sandpits 10,120 11,740 12,671 Other nonmetallic mining 11,235 10,135 11,340
168.5 158.4 164.0 Copper mining 258.6 304.7 283.0 Gold mining 515.3 445.6 420.2 Chromium mining 175.3 180.5 220.3 Nickel mining 97.3 77.1 96.6 Other metallic mining 442.9 334.0 409.3 Crude oil, natural gas and condensate 185.2 184.6 190.5 Stone quarrying, clay, and sandpits 127.5 128.9 134.0 Other nonmetallic mining 140.0 136.7 141.4
Continued
Value of production (MP)
2013 b
in mining (BP)
At current prices (MP)
At constant 2000 prices (MP)
Implicit price index (2000=100)
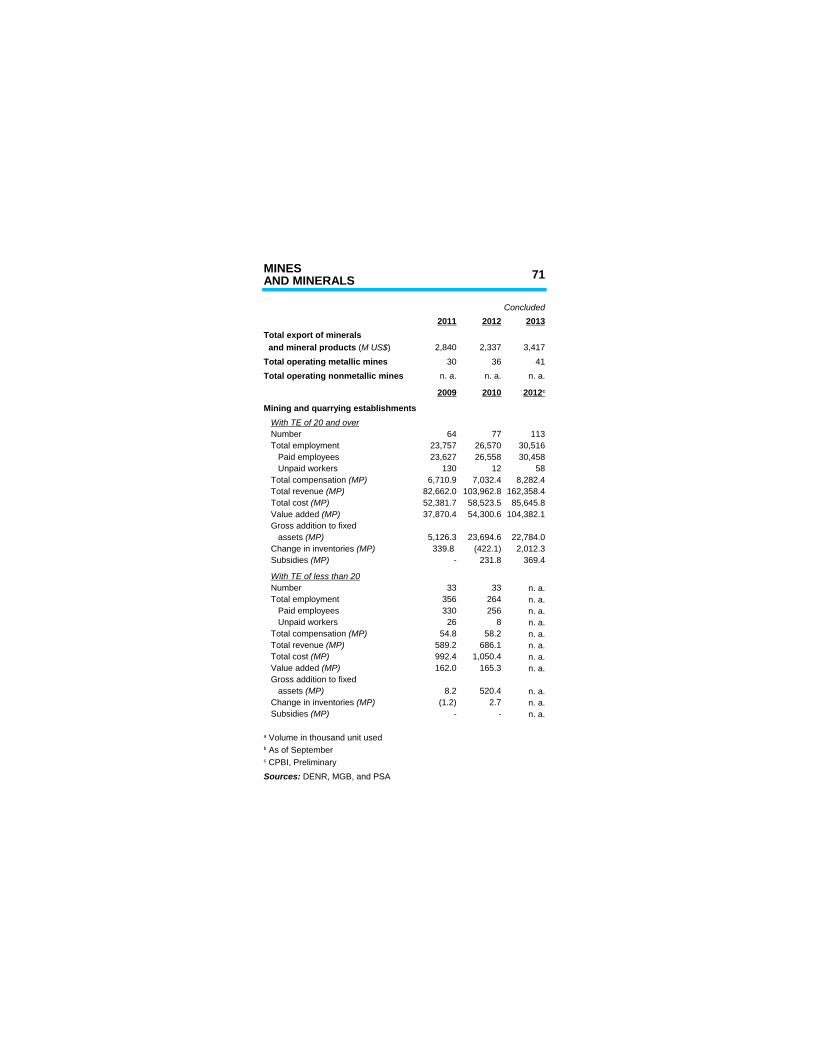
MINES 71AND MINERALS
Concluded2011 2012 2013
Total export of minerals2,840 2,337 3,417
Total operating metallic mines 30 36 41Total operating nonmetallic mines n. a. n. a. n. a.
2009 2010
Mining and quarrying establishments
Number 64 77 113 Total employment 23,757 26,570 30,516 Paid employees 23,627 26,558 30,458 Unpaid workers 130 12 58
6,710.9 7,032.4 8,282.482,662.0 103,962.8 162,358.452,381.7 58,523.5 85,645.837,870.4 54,300.6 104,382.1
Gross addition to fixed5,126.3 23,694.6 22,784.0339.8 (422.1) 2,012.3
- 231.8 369.4
Number 33 33 n. a. Total employment 356 264 n. a. Paid employees 330 256 n. a. Unpaid workers 26 8 n. a.
54.8 58.2 n. a.589.2 686.1 n. a.992.4 1,050.4 n. a.162.0 165.3 n. a.
Gross addition to fixed8.2 520.4 n. a.
(1.2) 2.7 n. a.- - n. a.
and mineral products (M US$)
2012 c
With TE of 20 and over
Total compensation (MP) Total revenue (MP) Total cost (MP) Value added (MP)
assets (MP) Change in inventories (MP) Subsidies (MP)
With TE of less than 20
Total compensation (MP) Total revenue (MP) Total cost (MP) Value added (MP)
assets (MP) Change in inventories (MP) Subsidies (MP)
a Volume in thousand unit used b As of Septemberc CPBI, PreliminarySources: DENR, MGB, and PSA
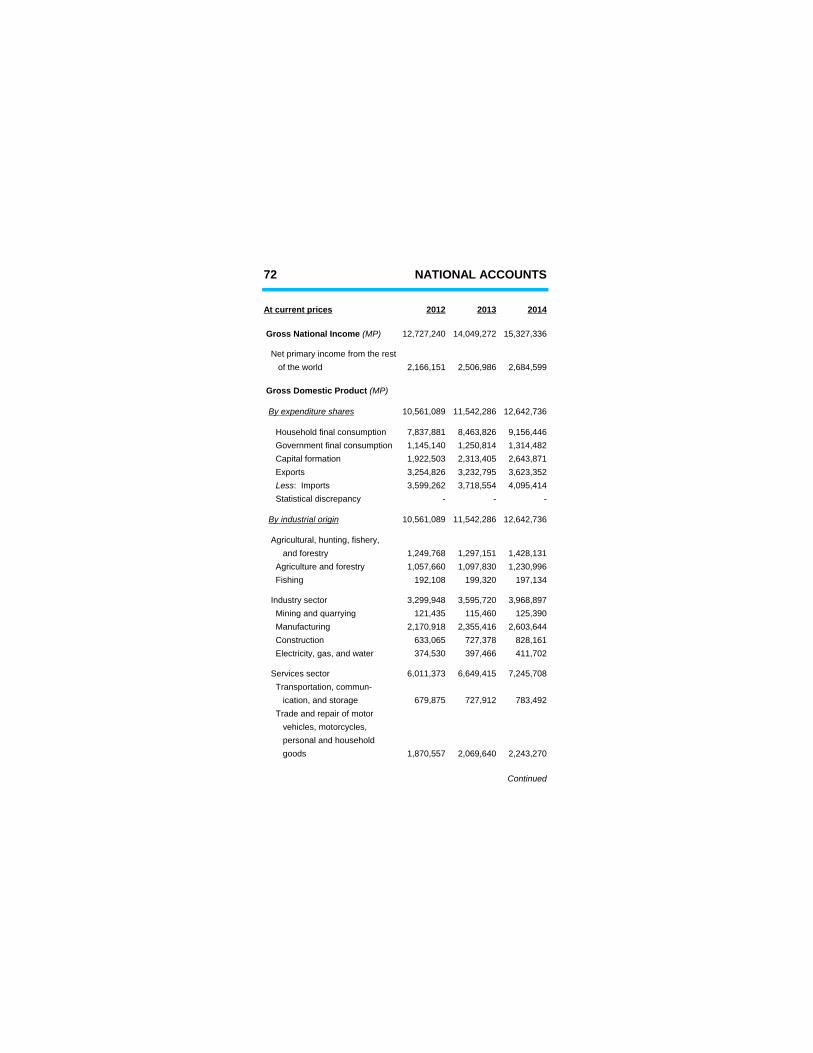
72 NATIONAL ACCOUNTS
At current prices 2012 2013 2014
12,727,240 14,049,272 15,327,336
Net primary income from the rest of the world 2,166,151 2,506,986 2,684,599
10,561,089 11,542,286 12,642,736
Household final consumption 7,837,881 8,463,826 9,156,446 Government final consumption 1,145,140 1,250,814 1,314,482 Capital formation 1,922,503 2,313,405 2,643,871 Exports 3,254,826 3,232,795 3,623,352
3,599,262 3,718,554 4,095,414 Statistical discrepancy - - -
10,561,089 11,542,286 12,642,736
Agricultural, hunting, fishery,1,249,768 1,297,151 1,428,1311,057,660 1,097,830 1,230,996
192,108 199,320 197,134
Industry sector 3,299,948 3,595,720 3,968,897121,435 115,460 125,390
2,170,918 2,355,416 2,603,644633,065 727,378 828,161374,530 397,466 411,702
Services sector 6,011,373 6,649,415 7,245,708
679,875 727,912 783,492
1,870,557 2,069,640 2,243,270
Continued
Gross National Income (MP)
Gross Domestic Product (MP)
By expenditure shares
Less: Imports
By industrial origin
and forestry Agriculture and forestry Fishing
Mining and quarrying Manufacturing Construction Electricity, gas, and water
Transportation, commun- ication, and storage Trade and repair of motor vehicles, motorcycles, personal and household goods
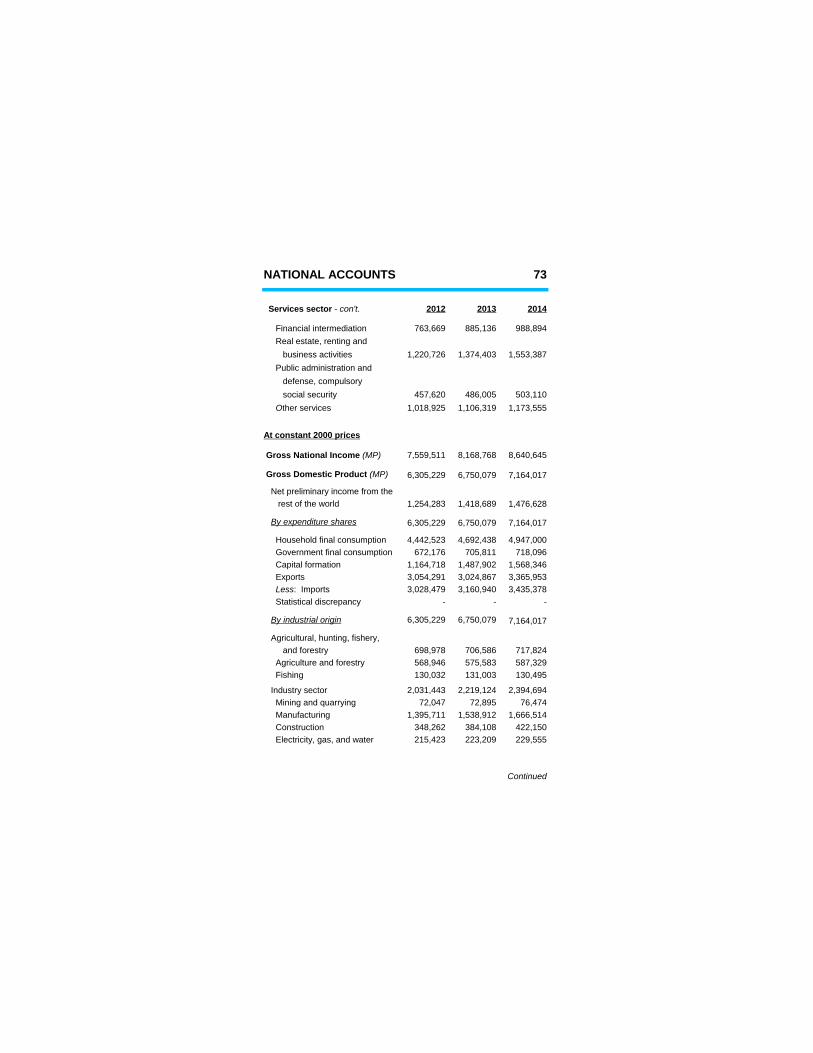
NATIONAL ACCOUNTS 73
2012 2013 2014
763,669 885,136 988,894
1,220,726 1,374,403 1,553,387
457,620 486,005 503,1101,018,925 1,106,319 1,173,555
At constant 2000 prices
7,559,511 8,168,768 8,640,645
6,305,229 6,750,079 7,164,017
Net preliminary income from the rest of the world 1,254,283 1,418,689 1,476,628
6,305,229 6,750,079 7,164,017
Household final consumption 4,442,523 4,692,438 4,947,000 Government final consumption 672,176 705,811 718,096 Capital formation 1,164,718 1,487,902 1,568,346 Exports 3,054,291 3,024,867 3,365,953
3,028,479 3,160,940 3,435,378 Statistical discrepancy - - -
6,305,229 6,750,079 7,164,017
698,978 706,586 717,824568,946 575,583 587,329130,032 131,003 130,495
Industry sector 2,031,443 2,219,124 2,394,69472,047 72,895 76,474
1,395,711 1,538,912 1,666,514348,262 384,108 422,150215,423 223,209 229,555
Continued
Services sector - con't.
Financial intermediation Real estate, renting and business activities Public administration and defense, compulsory social security Other services
Gross National Income (MP)
Gross Domestic Product (MP)
By expenditure shares
Less: Imports
By industrial origin
Agricultural, hunting, fishery, and forestry Agriculture and forestry Fishing
Mining and quarrying Manufacturing Construction Electricity, gas, and water
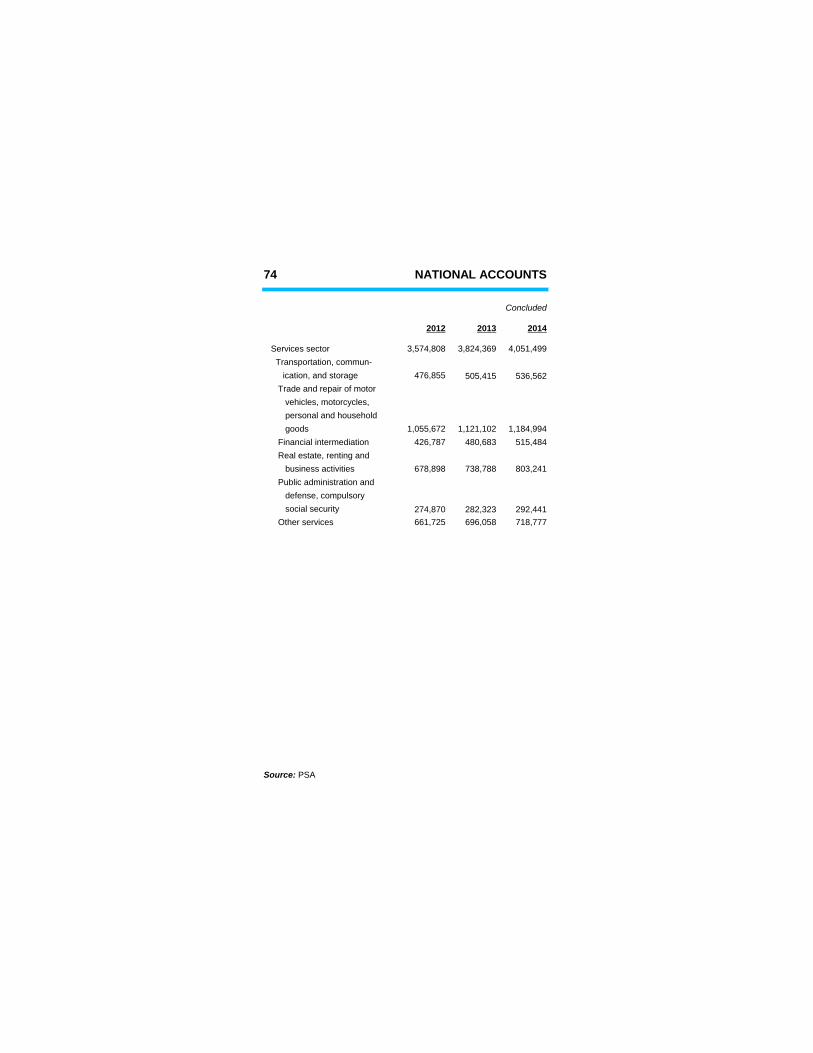
74 NATIONAL ACCOUNTS
Concluded
2012 2013 2014
Services sector 3,574,808 3,824,369 4,051,499
476,855 505,415 536,562
1,055,672 1,121,102 1,184,994426,787 480,683 515,484
678,898 738,788 803,241
274,870 282,323 292,441 Other services 661,725 696,058 718,777
Transportation, commun- ication, and storage Trade and repair of motor vehicles, motorcycles, personal and household goods Financial intermediation Real estate, renting and business activities Public administration and defense, compulsory social security
Source: PSA
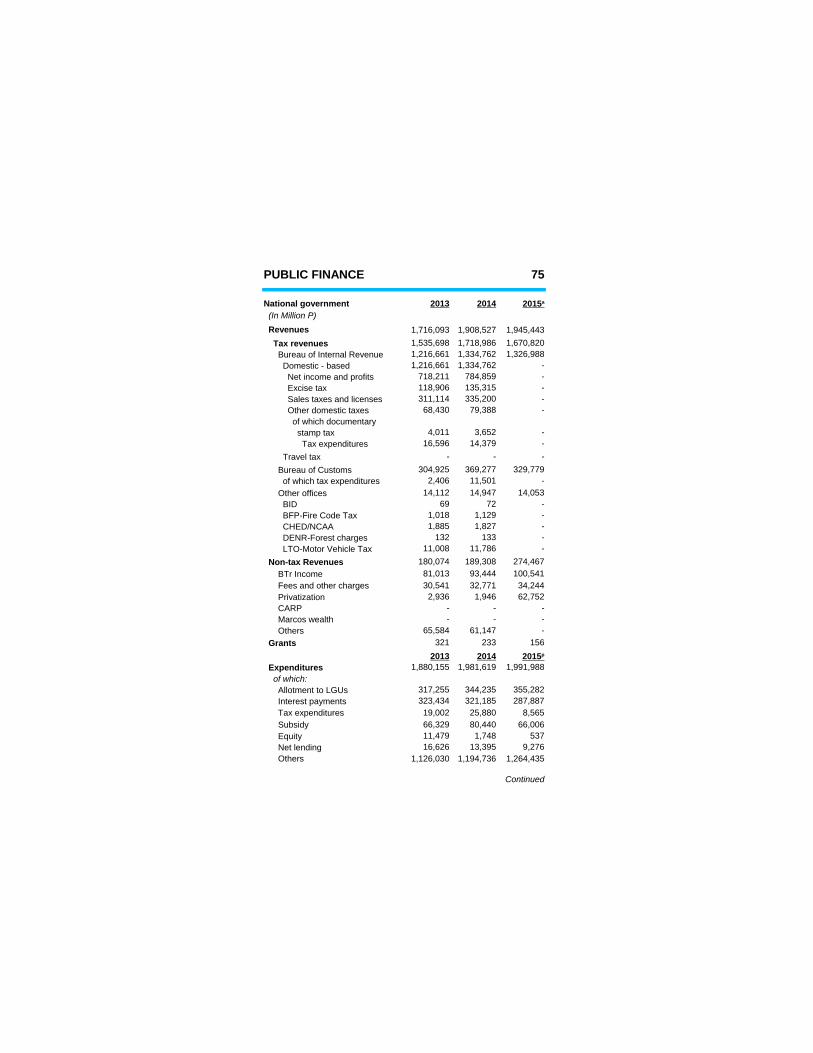
PUBLIC FINANCE 75
National government 2013 2014
Revenues 1,716,093 1,908,527 1,945,443 Tax revenues 1,535,698 1,718,986 1,670,820 Bureau of Internal Revenue 1,216,661 1,334,762 1,326,988 Domestic - based 1,216,661 1,334,762 - Net income and profits 718,211 784,859 - Excise tax 118,906 135,315 - Sales taxes and licenses 311,114 335,200 - Other domestic taxes 68,430 79,388 - of which documentary stamp tax 4,011 3,652 - Tax expenditures 16,596 14,379 - Travel tax - - - Bureau of Customs 304,925 369,277 329,779 of which tax expenditures 2,406 11,501 - Other offices 14,112 14,947 14,053 BID 69 72 - BFP-Fire Code Tax 1,018 1,129 - CHED/NCAA 1,885 1,827 - DENR-Forest charges 132 133 - LTO-Motor Vehicle Tax 11,008 11,786 - Non-tax Revenues 180,074 189,308 274,467
81,013 93,444 100,541 Fees and other charges 30,541 32,771 34,244 Privatization 2,936 1,946 62,752 CARP - - - Marcos wealth - - - Others 65,584 61,147 - Grants 321 233 156
2013 2014 Expenditures 1,880,155 1,981,619 1,991,988 of which:
317,255 344,235 355,282 Interest payments 323,434 321,185 287,887 Tax expenditures 19,002 25,880 8,565 Subsidy 66,329 80,440 66,006 Equity 11,479 1,748 537 Net lending 16,626 13,395 9,276 Others 1,126,030 1,194,736 1,264,435
Continued
2015 a (In Million P)
BTr Income
2015 p
Allotment to LGUs
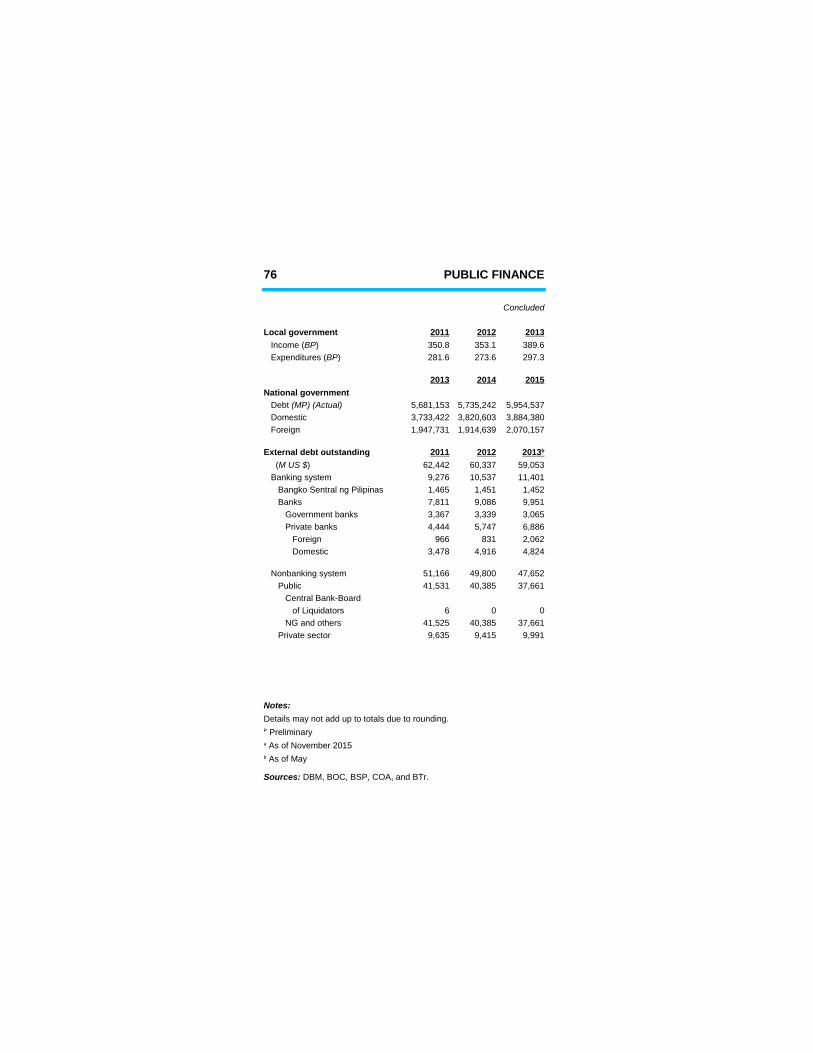
76 PUBLIC FINANCE
Concluded
Local government 2011 2012 2013350.8 353.1 389.6281.6 273.6 297.3
2013 2014 2015National government
5,681,153 5,735,242 5,954,537 Domestic 3,733,422 3,820,603 3,884,380 Foreign 1,947,731 1,914,639 2,070,157
External debt outstanding 2011 201262,442 60,337 59,053
Banking system 9,276 10,537 11,4011,465 1,451 1,452
Banks 7,811 9,086 9,951 Government banks 3,367 3,339 3,065 Private banks 4,444 5,747 6,886 Foreign 966 831 2,062 Domestic 3,478 4,916 4,824
51,166 49,800 47,652 Public 41,531 40,385 37,661 Central Bank-Board of Liquidators 6 0 0 NG and others 41,525 40,385 37,661 Private sector 9,635 9,415 9,991
Details may not add up to totals due to rounding.
Income (BP) Expenditures (BP)
Debt (MP) (Actual)
2013 b
(M US $)
Bangko Sentral ng Pilipinas
Nonbanking system
Notes:
P Preliminarya As of November 2015b As of May
Sources: DBM, BOC, BSP, COA, and BTr.
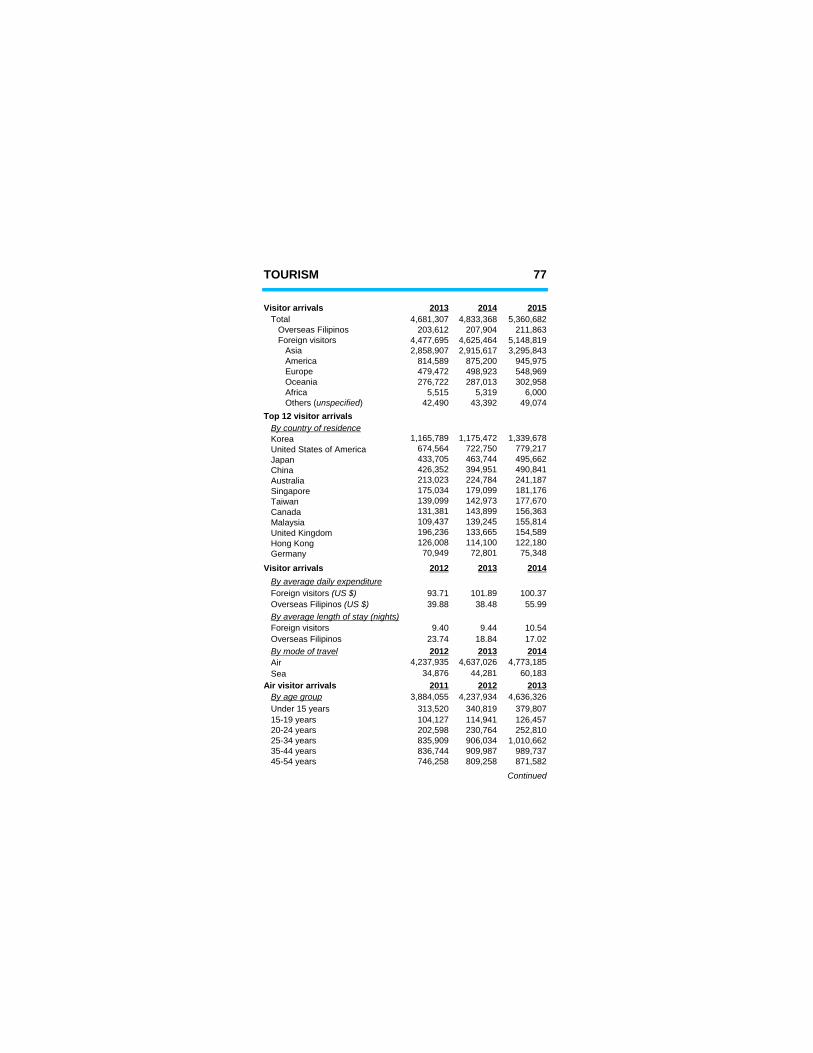
TOURISM 77
Visitor arrivals 2013 2014 2015 Total 4,681,307 4,833,368 5,360,682 Overseas Filipinos 203,612 207,904 211,863 Foreign visitors 4,477,695 4,625,464 5,148,819 Asia 2,858,907 2,915,617 3,295,843 America 814,589 875,200 945,975 Europe 479,472 498,923 548,969 Oceania 276,722 287,013 302,958 Africa 5,515 5,319 6,000
42,490 43,392 49,074Top 12 visitor arrivals
Korea 1,165,789 1,175,472 1,339,678 United States of America 674,564 722,750 779,217 Japan 433,705 463,744 495,662 China 426,352 394,951 490,841 Australia 213,023 224,784 241,187 Singapore 175,034 179,099 181,176 Taiwan 139,099 142,973 177,670 Canada 131,381 143,899 156,363 Malaysia 109,437 139,245 155,814 United Kingdom 196,236 133,665 154,589
126,008 114,100 122,180 Germany 70,949 72,801 75,348
Visitor arrivals 2012 2013 2014
93.71 101.89 100.3739.88 38.48 55.99
Foreign visitors 9.40 9.44 10.54 Overseas Filipinos 23.74 18.84 17.02
2012 2013 2014 Air 4,237,935 4,637,026 4,773,185 Sea 34,876 44,281 60,183Air visitor arrivals 2011 2012 2013
3,884,055 4,237,934 4,636,326 Under 15 years 313,520 340,819 379,807 15-19 years 104,127 114,941 126,457 20-24 years 202,598 230,764 252,810 25-34 years 835,909 906,034 1,010,662 35-44 years 836,744 909,987 989,737 45-54 years 746,258 809,258 871,582
Continued
Others (unspecified)
By country of residence
Hong Kong
By average daily expenditure Foreign visitors (US $) Overseas Filipinos (US $) By average length of stay (nights)
By mode of travel
By age group
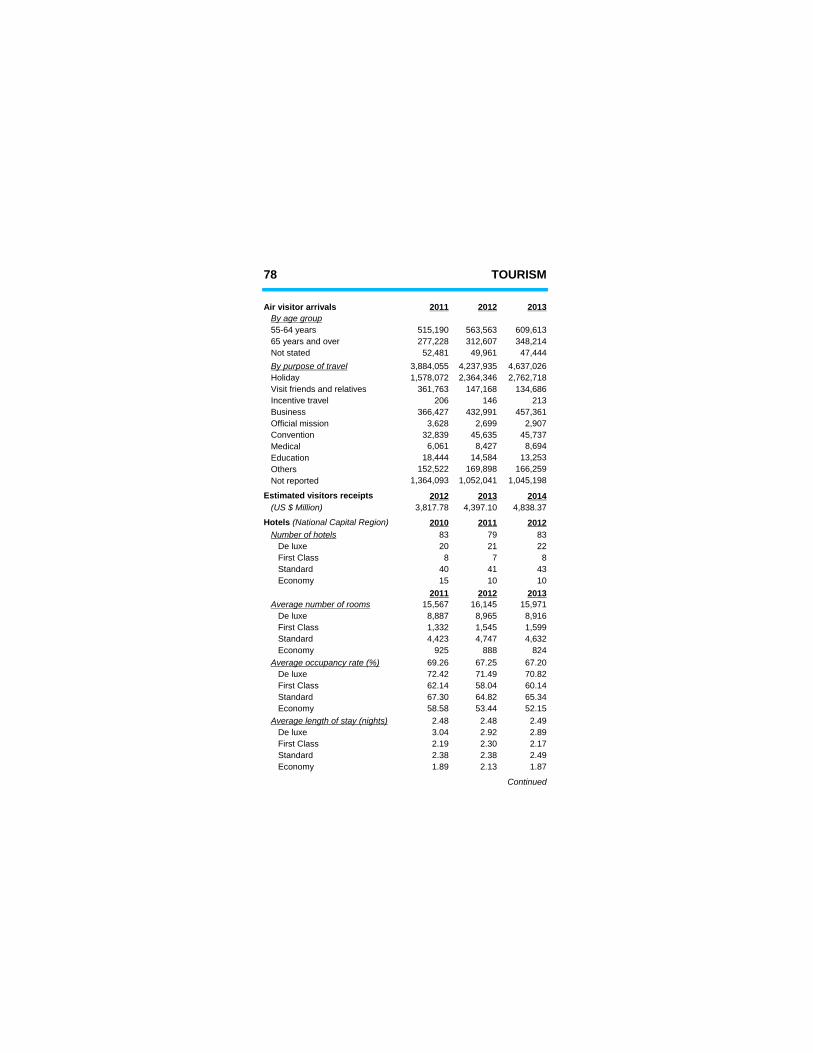
78 TOURISM
Air visitor arrivals 2011 2012 2013
55-64 years 515,190 563,563 609,613 65 years and over 277,228 312,607 348,214 Not stated 52,481 49,961 47,444
3,884,055 4,237,935 4,637,026 Holiday 1,578,072 2,364,346 2,762,718 Visit friends and relatives 361,763 147,168 134,686 Incentive travel 206 146 213 Business 366,427 432,991 457,361 Official mission 3,628 2,699 2,907 Convention 32,839 45,635 45,737 Medical 6,061 8,427 8,694 Education 18,444 14,584 13,253 Others 152,522 169,898 166,259 Not reported 1,364,093 1,052,041 1,045,198
Estimated visitors receipts 2012 2013 2014 (US $ Million) 3,817.78 4,397.10 4,838.37
2010 2011 201283 79 8320 21 22
First Class 8 7 8 Standard 40 41 43 Economy 15 10 10
2011 2012 201315,567 16,145 15,9718,887 8,965 8,916
First Class 1,332 1,545 1,599 Standard 4,423 4,747 4,632 Economy 925 888 824
69.26 67.25 67.2072.42 71.49 70.82
First Class 62.14 58.04 60.14 Standard 67.30 64.82 65.34 Economy 58.58 53.44 52.15
2.48 2.48 2.493.04 2.92 2.89
First Class 2.19 2.30 2.17 Standard 2.38 2.38 2.49 Economy 1.89 2.13 1.87
Continued
By age group
By purpose of travel
Hotels (National Capital Region) Number of hotels De luxe
Average number of rooms De luxe
Average occupancy rate (%) De luxe
Average length of stay (nights) De luxe
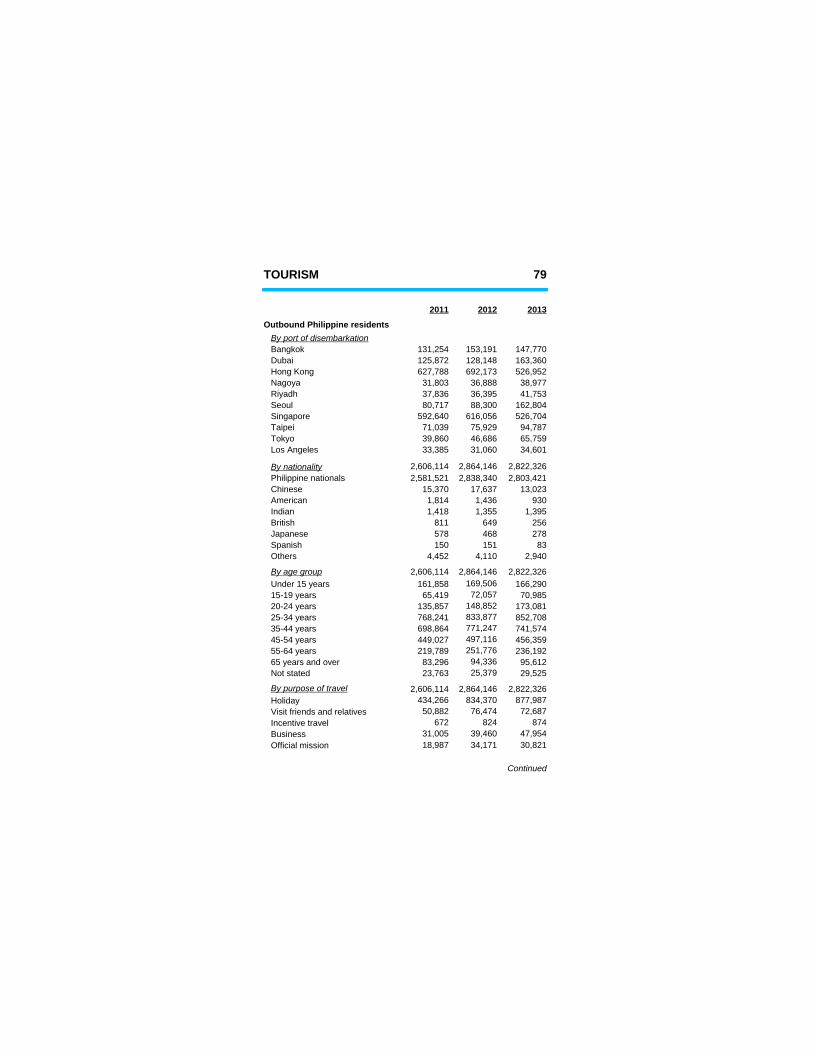
TOURISM 79
2011 2012 2013
Outbound Philippine residents
Bangkok 131,254 153,191 147,770 Dubai 125,872 128,148 163,360
627,788 692,173 526,952 Nagoya 31,803 36,888 38,977 Riyadh 37,836 36,395 41,753 Seoul 80,717 88,300 162,804 Singapore 592,640 616,056 526,704 Taipei 71,039 75,929 94,787 Tokyo 39,860 46,686 65,759
33,385 31,060 34,601
2,606,114 2,864,146 2,822,326 Philippine nationals 2,581,521 2,838,340 2,803,421 Chinese 15,370 17,637 13,023 American 1,814 1,436 930 Indian 1,418 1,355 1,395 British 811 649 256 Japanese 578 468 278 Spanish 150 151 83 Others 4,452 4,110 2,940
2,606,114 2,864,146 2,822,326 Under 15 years 161,858 169,506 166,290 15-19 years 65,419 72,057 70,985 20-24 years 135,857 148,852 173,081 25-34 years 768,241 833,877 852,708 35-44 years 698,864 771,247 741,574 45-54 years 449,027 497,116 456,359 55-64 years 219,789 251,776 236,192 65 years and over 83,296 94,336 95,612 Not stated 23,763 25,379 29,525
2,606,114 2,864,146 2,822,326 Holiday 434,266 834,370 877,987 Visit friends and relatives 50,882 76,474 72,687 Incentive travel 672 824 874 Business 31,005 39,460 47,954 Official mission 18,987 34,171 30,821
Continued
By port of disembarkation
Hong Kong
Los Angeles
By nationality
By age group
By purpose of travel
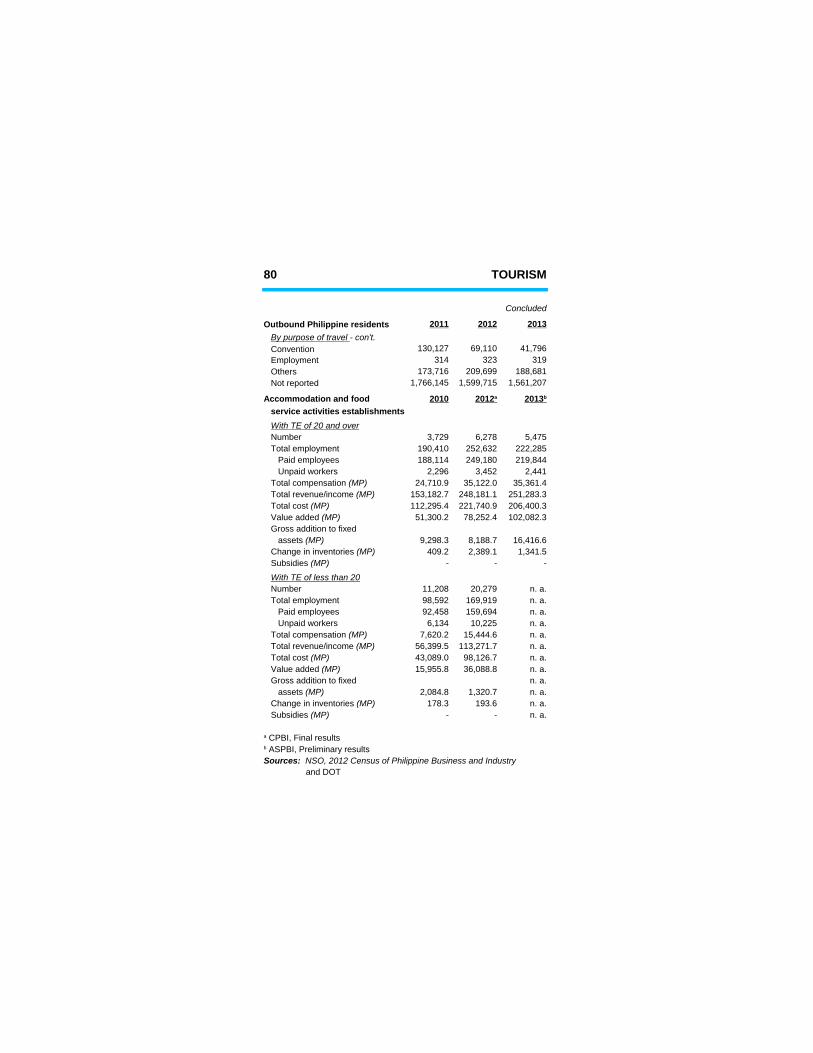
80 TOURISM
Concluded
Outbound Philippine residents 2011 2012 2013
Convention 130,127 69,110 41,796 Employment 314 323 319 Others 173,716 209,699 188,681 Not reported 1,766,145 1,599,715 1,561,207
Accommodation and food 2010 service activities establishments
Number 3,729 6,278 5,475 Total employment 190,410 252,632 222,285 Paid employees 188,114 249,180 219,844 Unpaid workers 2,296 3,452 2,441
24,710.9 35,122.0 35,361.4153,182.7 248,181.1 251,283.3112,295.4 221,740.9 206,400.351,300.2 78,252.4 102,082.3
Gross addition to fixed9,298.3 8,188.7 16,416.6
409.2 2,389.1 1,341.5- - -
Number 11,208 20,279 n. a. Total employment 98,592 169,919 n. a. Paid employees 92,458 159,694 n. a. Unpaid workers 6,134 10,225 n. a.
7,620.2 15,444.6 n. a.56,399.5 113,271.7 n. a.43,089.0 98,126.7 n. a.15,955.8 36,088.8 n. a.
Gross addition to fixed n. a.2,084.8 1,320.7 n. a.
178.3 193.6 n. a.- - n. a.
By purpose of travel - con't.
2012 a 2013 b
With TE of 20 and over
Total compensation (MP) Total revenue/income (MP) Total cost (MP) Value added (MP)
assets (MP) Change in inventories (MP) Subsidies (MP)
With TE of less than 20
Total compensation (MP) Total revenue/income (MP) Total cost (MP) Value added (MP)
assets (MP) Change in inventories (MP) Subsidies (MP)
a CPBI, Final resultsb ASPBI, Preliminary resultsSources: NSO, 2012 Census of Philippine Business and Industry and DOT
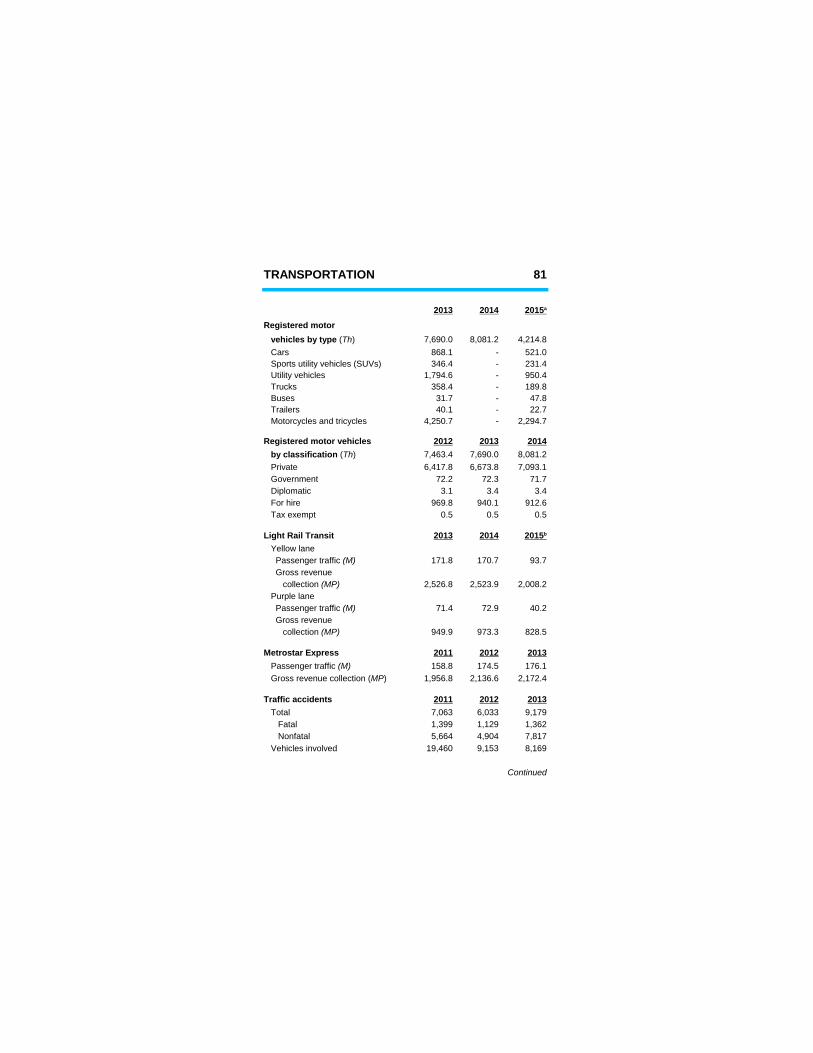
TRANSPORTATION 81
2013 2014
Registered motor 7,690.0 8,081.2 4,214.8
Cars 868.1 - 521.0346.4 - 231.4
Utility vehicles 1,794.6 - 950.4 Trucks 358.4 - 189.8 Buses 31.7 - 47.8 Trailers 40.1 - 22.7 Motorcycles and tricycles 4,250.7 - 2,294.7
Registered motor vehicles 2012 2013 20147,463.4 7,690.0 8,081.2
Private 6,417.8 6,673.8 7,093.1 Government 72.2 72.3 71.7 Diplomatic 3.1 3.4 3.4 For hire 969.8 940.1 912.6 Tax exempt 0.5 0.5 0.5
Light Rail Transit 2013 2014 Yellow lane
171.8 170.7 93.7 Gross revenue
2,526.8 2,523.9 2,008.2 Purple lane
71.4 72.9 40.2 Gross revenue
949.9 973.3 828.5
2011 2012 2013158.8 174.5 176.1
1,956.8 2,136.6 2,172.4
Traffic accidents 2011 2012 2013 Total 7,063 6,033 9,179 Fatal 1,399 1,129 1,362 Nonfatal 5,664 4,904 7,817 Vehicles involved 19,460 9,153 8,169
Continued
2015 a
vehicles by type (Th)
Sports utility vehicles (SUVs)
by classification (Th)
2015 b
Passenger traffic (M)
collection (MP)
Passenger traffic (M)
collection (MP)
Metrostar Express Passenger traffic (M) Gross revenue collection (MP)
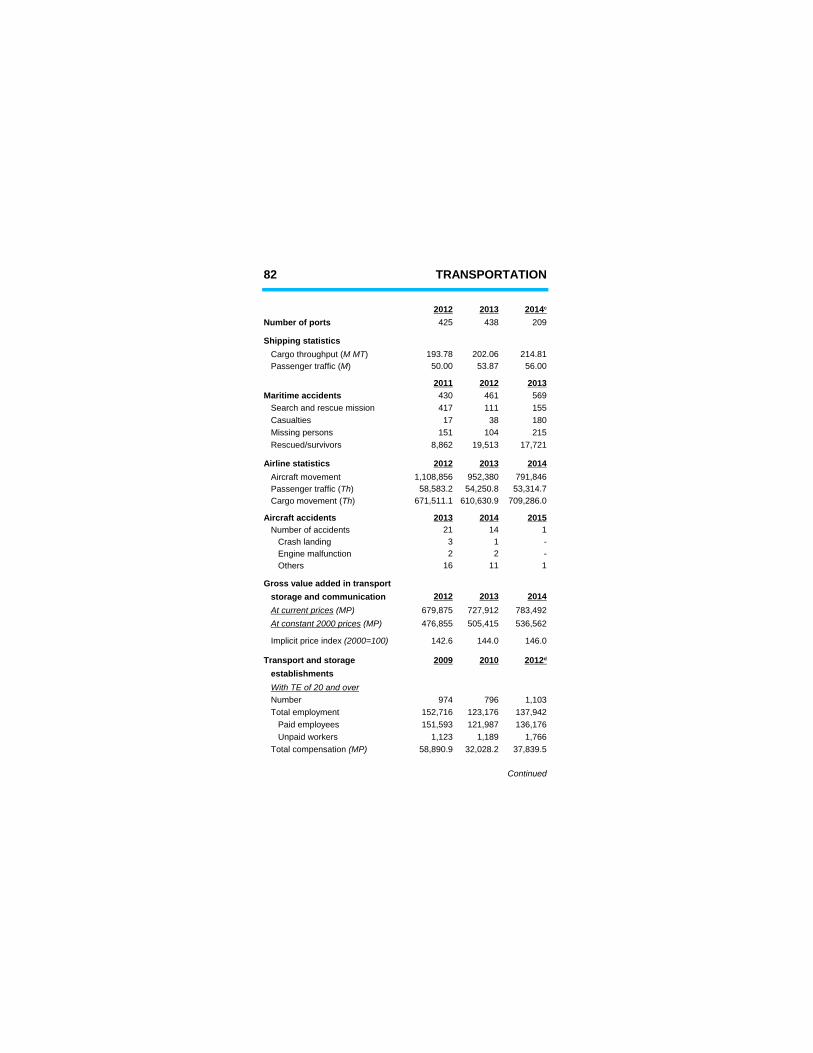
82 TRANSPORTATION
2012 2013Number of ports 425 438 209
Shipping statistics193.78 202.06 214.8150.00 53.87 56.00
2011 2012 2013Maritime accidents 430 461 569 Search and rescue mission 417 111 155 Casualties 17 38 180 Missing persons 151 104 215 Rescued/survivors 8,862 19,513 17,721
Airline statistics 2012 2013 2014 Aircraft movement 1,108,856 952,380 791,846
58,583.2 54,250.8 53,314.7671,511.1 610,630.9 709,286.0
Aircraft accidents 2013 2014 2015 Number of accidents 21 14 1 Crash landing 3 1 - Engine malfunction 2 2 - Others 16 11 1
Gross value added in transport storage and communication 2012 2013 2014
679,875 727,912 783,492476,855 505,415 536,562
142.6 144.0 146.0
Transport and storage 2009 2010 establishments
Number 974 796 1,103 Total employment 152,716 123,176 137,942 Paid employees 151,593 121,987 136,176 Unpaid workers 1,123 1,189 1,766
58,890.9 32,028.2 37,839.5
Continued
2014 c
Cargo throughput (M MT) Passenger traffic (M)
Passenger traffic (Th) Cargo movement (Th)
At current prices (MP) At constant 2000 prices (MP)
Implicit price index (2000=100)
2012 d
With TE of 20 and over
Total compensation (MP)
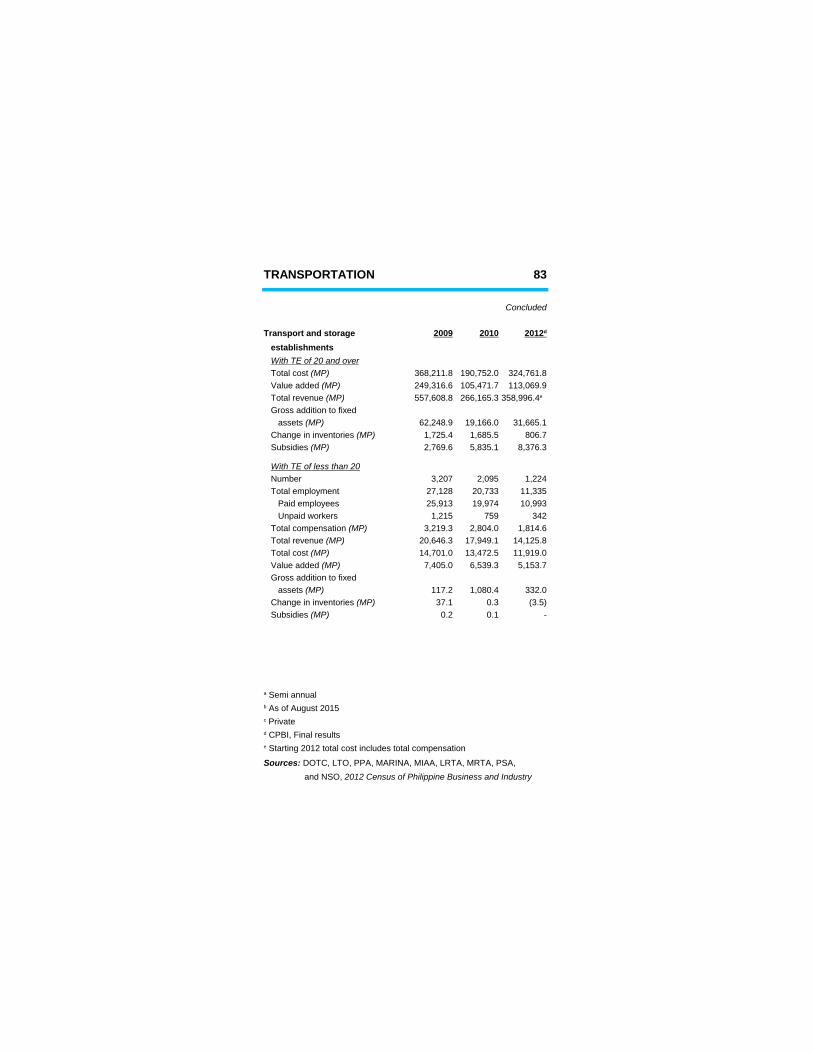
TRANSPORTATION 83
Concluded
Transport and storage 2009 2010 establishments
368,211.8 190,752.0 324,761.8249,316.6 105,471.7 113,069.9557,608.8 266,165.3
Gross addition to fixed62,248.9 19,166.0 31,665.11,725.4 1,685.5 806.72,769.6 5,835.1 8,376.3
Number 3,207 2,095 1,224 Total employment 27,128 20,733 11,335 Paid employees 25,913 19,974 10,993 Unpaid workers 1,215 759 342
3,219.3 2,804.0 1,814.620,646.3 17,949.1 14,125.814,701.0 13,472.5 11,919.07,405.0 6,539.3 5,153.7
Gross addition to fixed117.2 1,080.4 332.037.1 0.3 (3.5)0.2 0.1 -
2012 d
With TE of 20 and over Total cost (MP) Value added (MP) Total revenue (MP) 358,996.4e
assets (MP) Change in inventories (MP) Subsidies (MP)
With TE of less than 20
Total compensation (MP) Total revenue (MP) Total cost (MP) Value added (MP)
assets (MP) Change in inventories (MP) Subsidies (MP)
a Semi annualb As of August 2015c Privated CPBI, Final resultse Starting 2012 total cost includes total compensation
Sources: DOTC, LTO, PPA, MARINA, MIAA, LRTA, MRTA, PSA, and NSO, 2012 Census of Philippine Business and Industry
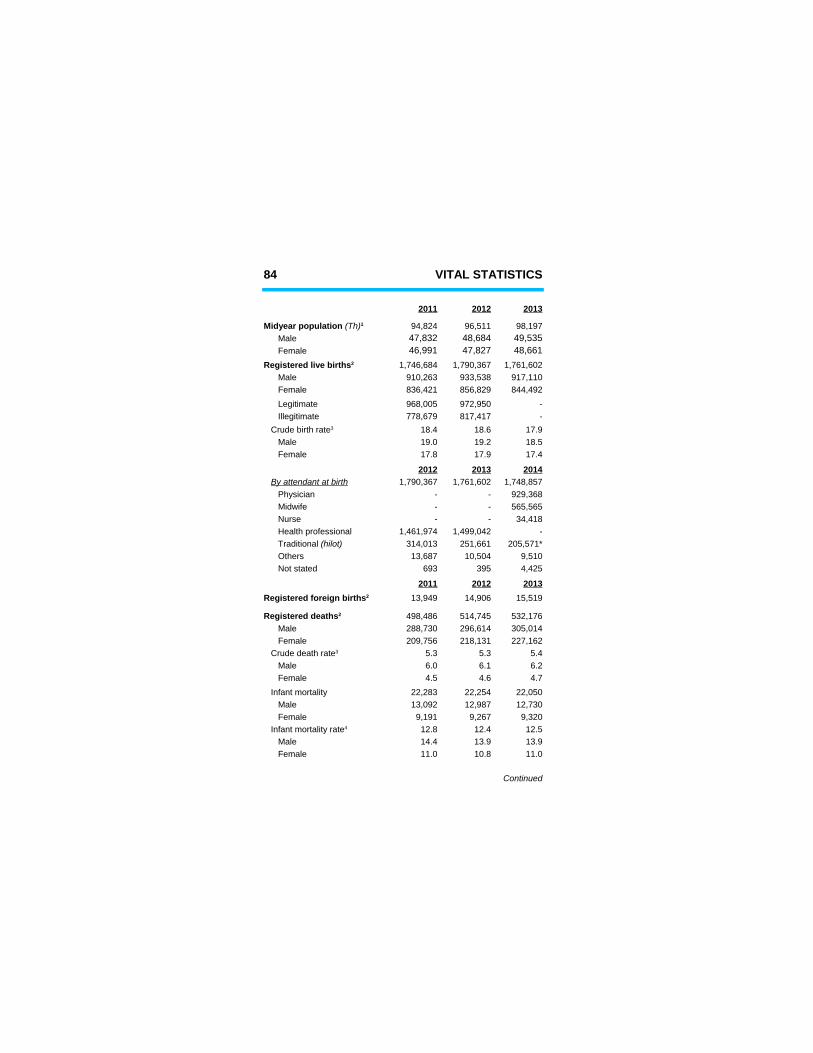
84 VITAL STATISTICS
2011 2012 2013
94,824 96,511 98,197 Male 47,832 48,684 49,535 Female 46,991 47,827 48,661
1,746,684 1,790,367 1,761,602 Male 910,263 933,538 917,110 Female 836,421 856,829 844,492 Legitimate 968,005 972,950 - Illegitimate 778,679 817,417 -
18.4 18.6 17.9 Male 19.0 19.2 18.5 Female 17.8 17.9 17.4
2012 2013 20141,790,367 1,761,602 1,748,857
Physician - - 929,368 Midwife - - 565,565 Nurse - - 34,418 Health professional 1,461,974 1,499,042 -
314,013 251,661 205,571* Others 13,687 10,504 9,510 Not stated 693 395 4,425
2011 2012 201313,949 14,906 15,519
498,486 514,745 532,176 Male 288,730 296,614 305,014 Female 209,756 218,131 227,162
5.3 5.3 5.4 Male 6.0 6.1 6.2 Female 4.5 4.6 4.7 Infant mortality 22,283 22,254 22,050 Male 13,092 12,987 12,730 Female 9,191 9,267 9,320
12.8 12.4 12.5 Male 14.4 13.9 13.9 Female 11.0 10.8 11.0
Continued
Midyear population (Th)1
Registered live births2
Crude birth rate3
By attendant at birth
Traditional (hilot)
Registered foreign births2
Registered deaths2
Crude death rate3
Infant mortality rate4
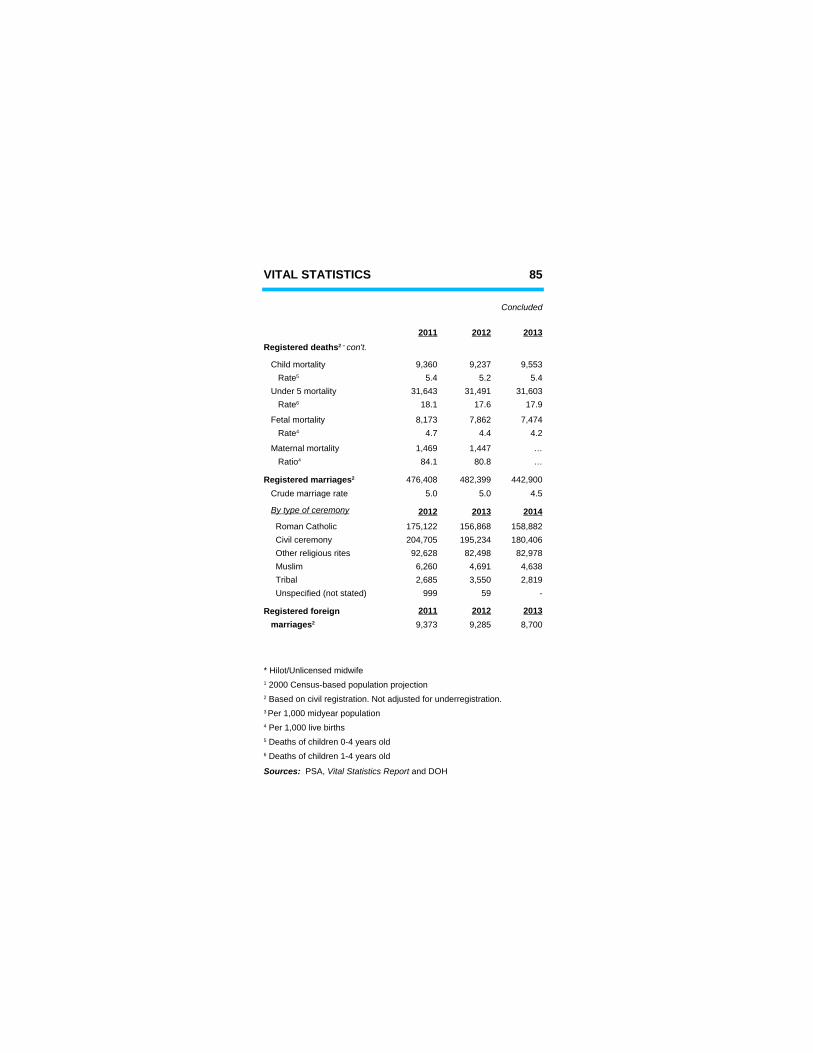
VITAL STATISTICS 85
Concluded
2011 2012 2013
Child mortality 9,360 9,237 9,5535.4 5.2 5.4
Under 5 mortality 31,643 31,491 31,60318.1 17.6 17.9
Fetal mortality 8,173 7,862 7,4744.7 4.4 4.2
Maternal mortality 1,469 1,447 …84.1 80.8 …
476,408 482,399 442,900 Crude marriage rate 5.0 5.0 4.5
2012 2013 2014 Roman Catholic 175,122 156,868 158,882 Civil ceremony 204,705 195,234 180,406 Other religious rites 92,628 82,498 82,978 Muslim 6,260 4,691 4,638 Tribal 2,685 3,550 2,819 Unspecified (not stated) 999 59 -
Registered foreign 2011 2012 20139,373 9,285 8,700
Registered deaths2 – con't.
Rate5
Rate6
Rate4
Ratio4
Registered marriages2
By type of ceremony
marriages2
* Hilot/Unlicensed midwife1 2000 Census-based population projection2 Based on civil registration. Not adjusted for underregistration.3 Per 1,000 midyear population4 Per 1,000 live births5 Deaths of children 0-4 years old6 Deaths of children 1-4 years old
Sources: PSA, Vital Statistics Report and DOH
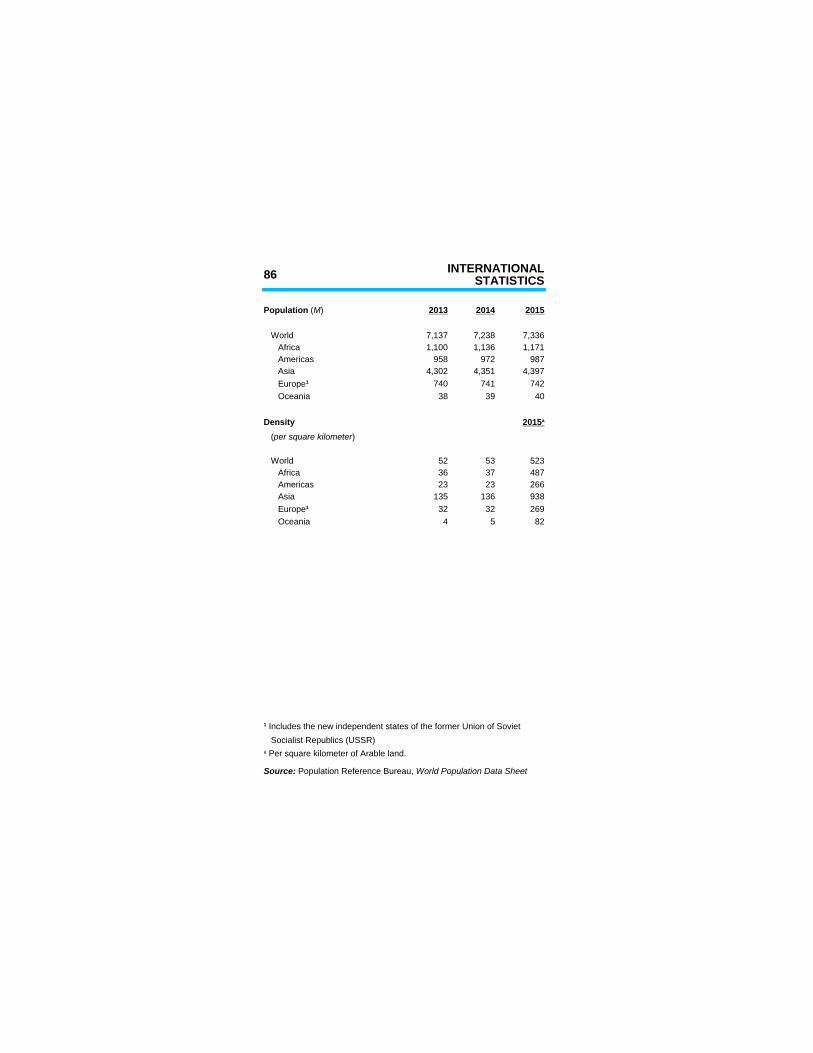
86 INTERNATIONALSTATISTICS
2013 2014 2015
World 7,137 7,238 7,336 Africa 1,100 1,136 1,171 Americas 958 972 987 Asia 4,302 4,351 4,397
740 741 742 Oceania 38 39 40
Density
World 52 53 523 Africa 36 37 487 Americas 23 23 266 Asia 135 136 938
32 32 269 Oceania 4 5 82
Socialist Republics (USSR)
Population (M)
Europe1
2015 a
(per square kilometer)
Europe1
1 Includes the new independent states of the former Union of Soviet
a Per square kilometer of Arable land.
Source: Population Reference Bureau, World Population Data Sheet
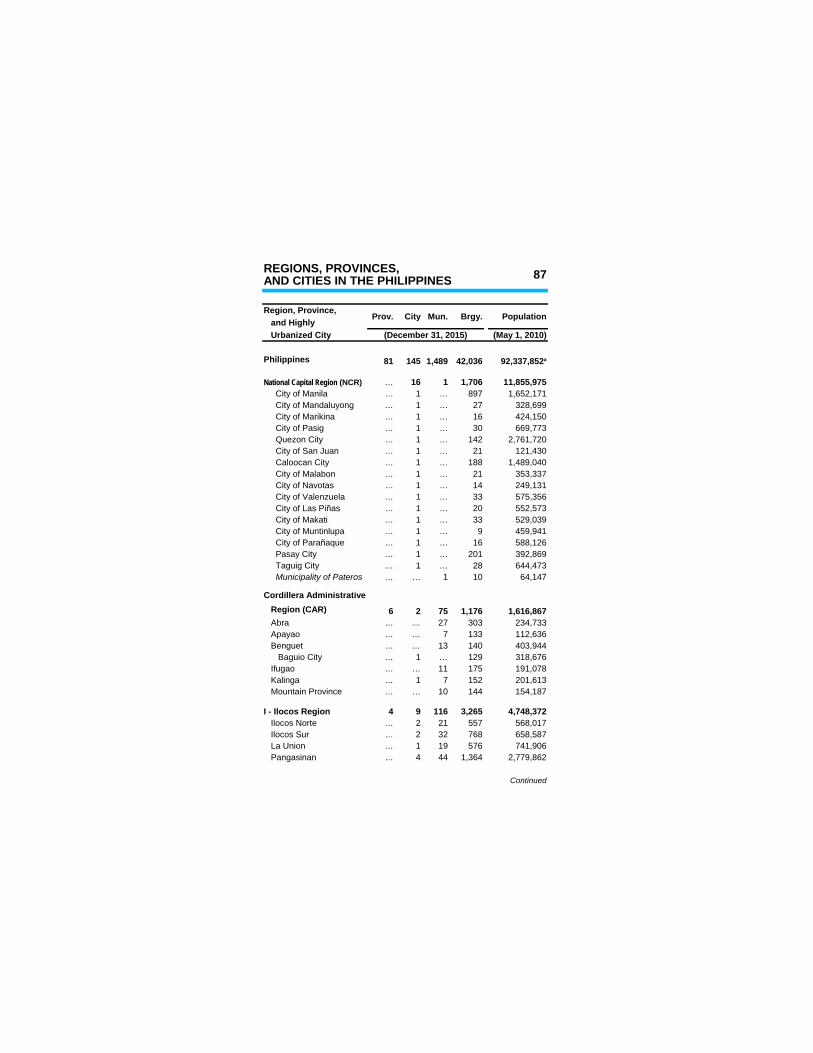
REGIONS, PROVINCES, 87AND CITIES IN THE PHILIPPINES
Region, Province,Prov. City Mun. Population
and Highly Urbanized City (December 31, 2015) (May 1, 2010)
Philippines 81 145 1,489 42,036
… 16 1 1,706 11,855,975 City of Manila … 1 … 897 1,652,171
… 1 … 27 328,699… 1 … 16 424,150… 1 … 30 669,773
Quezon City … 1 … 142 2,761,720 City of San Juan … 1 … 21 121,430 Caloocan City … 1 … 188 1,489,040
… 1 … 21 353,337… 1 … 14 249,131
City of Valenzuela … 1 … 33 575,356… 1 … 20 552,573… 1 … 33 529,039… 1 … 9 459,941… 1 … 16 588,126… 1 … 201 392,869… 1 … 28 644,473… … 1 10 64,147
Cordillera Administrative
6 2 75 1,176 1,616,867… … 27 303 234,733… … 7 133 112,636… … 13 140 403,944
Baguio City … 1 … 129 318,676… … 11 175 191,078… 1 7 152 201,613
Mountain Province … … 10 144 154,187
4 9 116 3,265 4,748,372… 2 21 557 568,017… 2 32 768 658,587
La Union … 1 19 576 741,906… 4 44 1,364 2,779,862
Continued
Brgy.
92,337,852a
National Capital Region (NCR)
City of Mandaluyong City of Marikina City of Pasig
City of Malabon City of Navotas
City of Las Piñas City of Makati City of Muntinlupa City of Parañaque Pasay City Taguig City Municipality of Pateros
Region (CAR) Abra Apayao Benguet
Ifugao Kalinga
I - Ilocos Region Ilocos Norte Ilocos Sur
Pangasinan
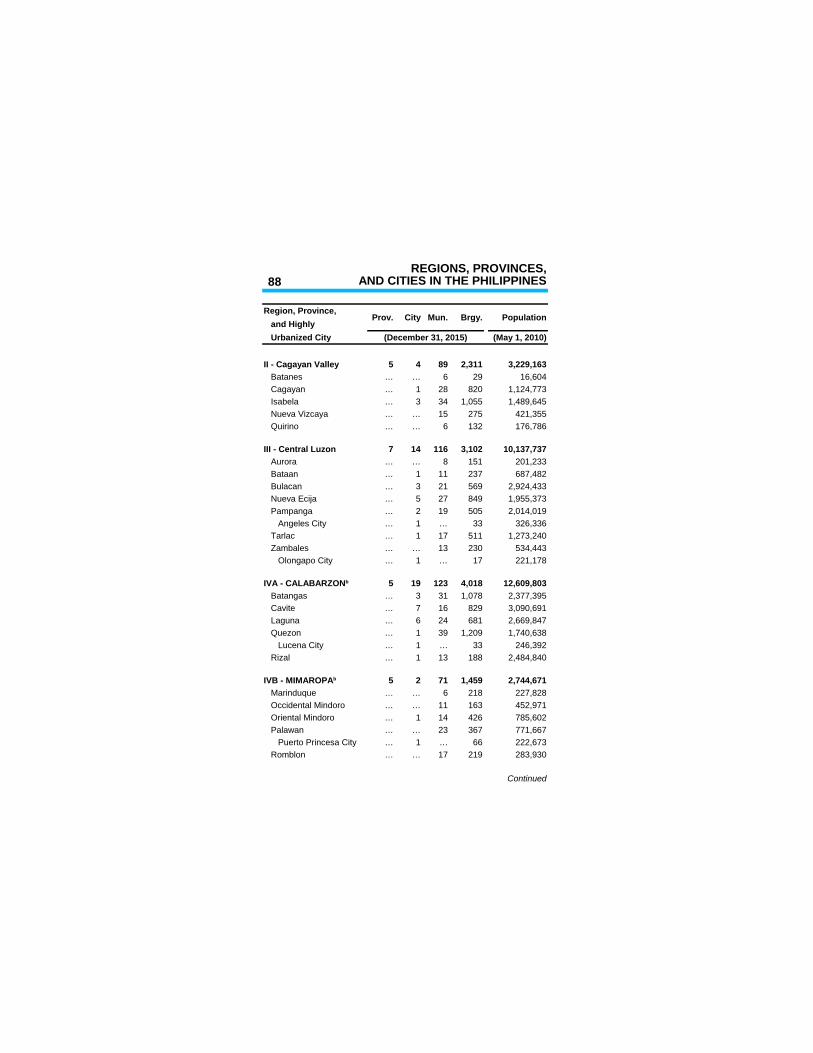
REGIONS, PROVINCES,AND CITIES IN THE PHILIPPINES
Region, Province,Prov. City Mun. Population
and Highly Urbanized City (December 31, 2015) (May 1, 2010)
5 4 89 2,311 3,229,163… … 6 29 16,604… 1 28 820 1,124,773… 3 34 1,055 1,489,645… … 15 275 421,355… … 6 132 176,786
III - Central Luzon 7 14 116 3,102 10,137,737 Aurora … … 8 151 201,233 Bataan … 1 11 237 687,482
… 3 21 569 2,924,433… 5 27 849 1,955,373… 2 19 505 2,014,019… 1 … 33 326,336… 1 17 511 1,273,240… … 13 230 534,443… 1 … 17 221,178
5 19 123 4,018 12,609,803… 3 31 1,078 2,377,395… 7 16 829 3,090,691… 6 24 681 2,669,847
Quezon … 1 39 1,209 1,740,638… 1 … 33 246,392
Rizal … 1 13 188 2,484,840
5 2 71 1,459 2,744,671… … 6 218 227,828
Occidental Mindoro … … 11 163 452,971 Oriental Mindoro … 1 14 426 785,602
… … 23 367 771,667… 1 … 66 222,673… … 17 219 283,930
Continued
Brgy.
II - Cagayan Valley Batanes Cagayan Isabela Nueva Vizcaya Quirino
Bulacan Nueva Ecija Pampanga Angeles City Tarlac Zambales Olongapo City
IVA - CALABARZONb
Batangas Cavite Laguna
Lucena City
IVB - MIMAROPAb
Marinduque
Palawan Puerto Princesa City Romblon
88
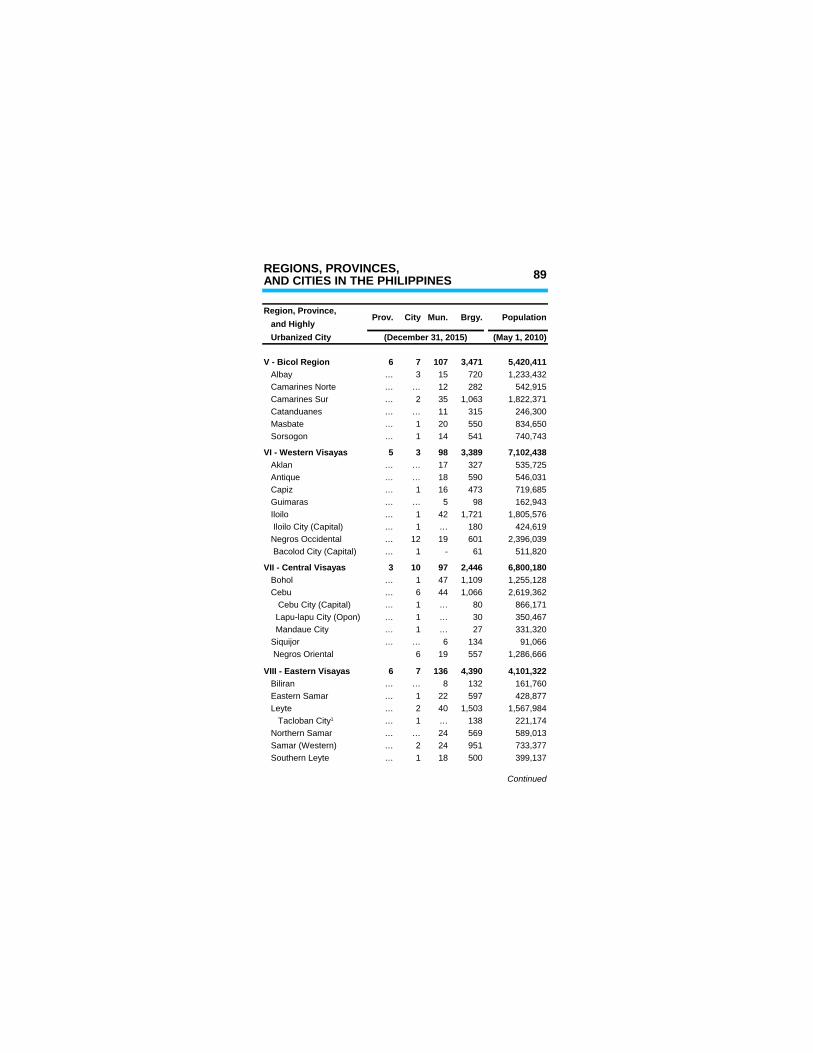
REGIONS, PROVINCES, 89AND CITIES IN THE PHILIPPINES
Region, Province,Prov. City Mun. Population
and Highly Urbanized City (December 31, 2015) (May 1, 2010)
6 7 107 3,471 5,420,411… 3 15 720 1,233,432… … 12 282 542,915… 2 35 1,063 1,822,371… … 11 315 246,300… 1 20 550 834,650… 1 14 541 740,743
5 3 98 3,389 7,102,438… … 17 327 535,725
Antique … … 18 590 546,031… 1 16 473 719,685… … 5 98 162,943… 1 42 1,721 1,805,576… 1 … 180 424,619
Negros Occidental … 12 19 601 2,396,039… 1 - 61 511,820
3 10 97 2,446 6,800,180… 1 47 1,109 1,255,128
Cebu … 6 44 1,066 2,619,362 Cebu City (Capital) … 1 … 80 866,171
… 1 … 30 350,467… 1 … 27 331,320… … 6 134 91,066
Negros Oriental 6 19 557 1,286,666
6 7 136 4,390 4,101,322… … 8 132 161,760
Eastern Samar … 1 22 597 428,877… 2 40 1,503 1,567,984… 1 … 138 221,174
Northern Samar … … 24 569 589,013 Samar (Western) … 2 24 951 733,377
… 1 18 500 399,137
Continued
Brgy.
V - Bicol Region Albay Camarines Norte Camarines Sur Catanduanes Masbate Sorsogon
VI - Western Visayas Aklan
Capiz Guimaras Iloilo Iloilo City (Capital)
Bacolod City (Capital)
VII - Central Visayas Bohol
Lapu-lapu City (Opon) Mandaue City Siquijor
VIII - Eastern Visayas Biliran
Leyte Tacloban City1
Southern Leyte
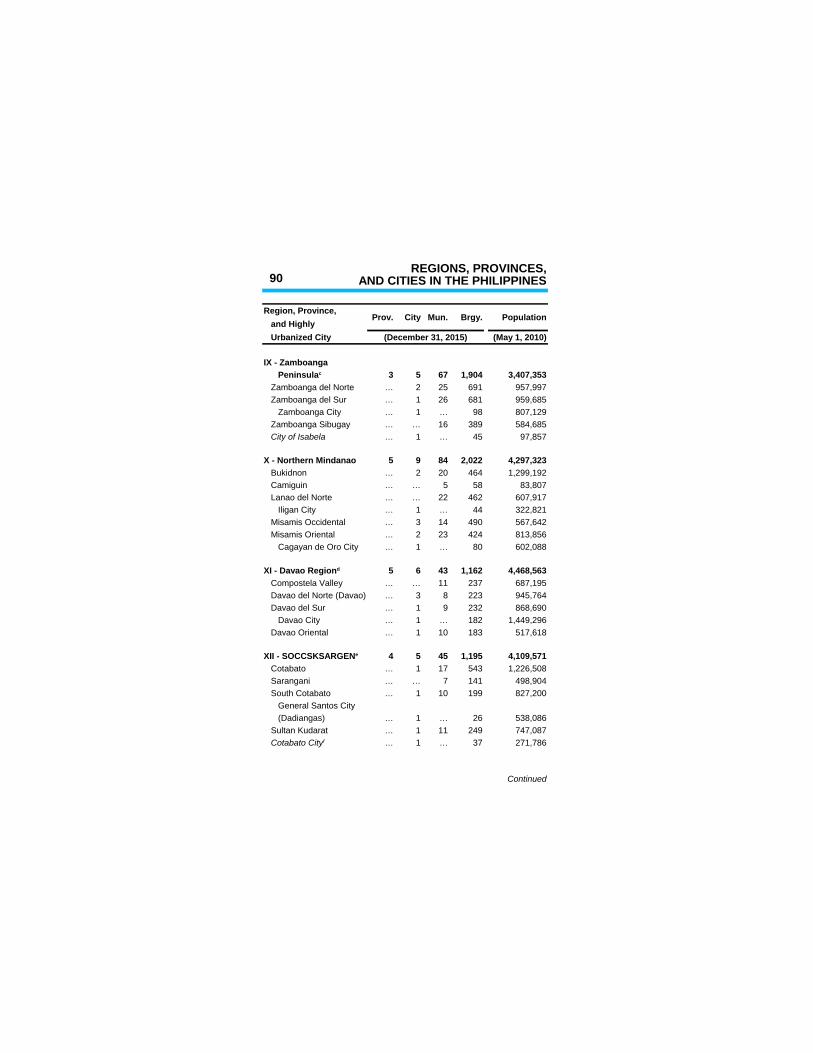
REGIONS, PROVINCES,AND CITIES IN THE PHILIPPINES
Region, Province,Prov. City Mun. Population
and Highly Urbanized City (December 31, 2015) (May 1, 2010)
3 5 67 1,904 3,407,353… 2 25 691 957,997… 1 26 681 959,685… 1 … 98 807,129… … 16 389 584,685… 1 … 45 97,857
X - Northern Mindanao 5 9 84 2,022 4,297,323… 2 20 464 1,299,192… … 5 58 83,807… … 22 462 607,917… 1 … 44 322,821… 3 14 490 567,642… 2 23 424 813,856… 1 … 80 602,088
5 6 43 1,162 4,468,563… … 11 237 687,195… 3 8 223 945,764… 1 9 232 868,690
Davao City … 1 … 182 1,449,296 Davao Oriental … 1 10 183 517,618
4 5 45 1,195 4,109,571… 1 17 543 1,226,508… … 7 141 498,904… 1 10 199 827,200
General Santos City… 1 … 26 538,086… 1 11 249 747,087… 1 … 37 271,786
Continued
Brgy.
IX - Zamboanga Peninsulac
Zamboanga del Norte Zamboanga del Sur Zamboanga City Zamboanga Sibugay City of Isabela
Bukidnon Camiguin Lanao del Norte Iligan City Misamis Occidental Misamis Oriental Cagayan de Oro City
XI - Davao Regiond
Compostela Valley Davao del Norte (Davao) Davao del Sur
XII - SOCCSKSARGENe
Cotabato Sarangani South Cotabato
(Dadiangas) Sultan Kudarat Cotabato Cityf
90
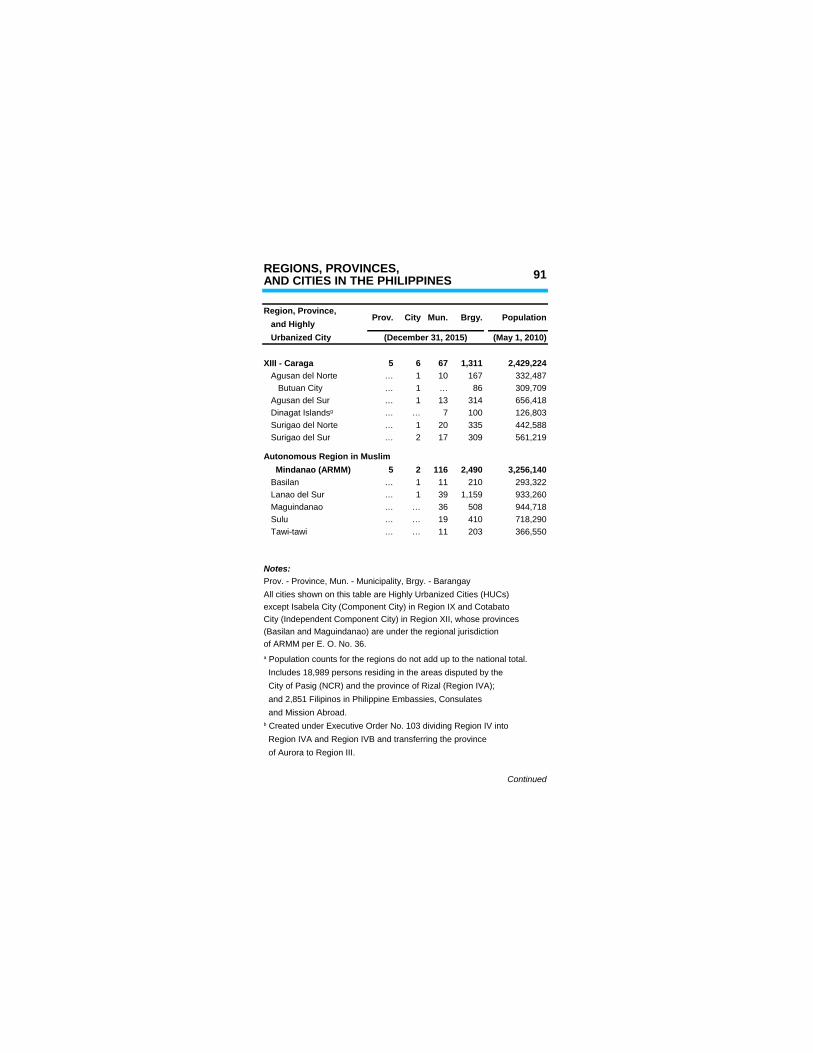
REGIONS, PROVINCES, 91AND CITIES IN THE PHILIPPINES
Region, Province,Prov. City Mun. Population
and Highly Urbanized City (December 31, 2015) (May 1, 2010)
5 6 67 1,311 2,429,224… 1 10 167 332,487… 1 … 86 309,709… 1 13 314 656,418… … 7 100 126,803… 1 20 335 442,588… 2 17 309 561,219
Autonomous Region in Muslim Mindanao (ARMM) 5 2 116 2,490 3,256,140
… 1 11 210 293,322… 1 39 1,159 933,260… … 36 508 944,718… … 19 410 718,290… … 11 203 366,550
Notes:
City (Independent Component City) in Region XII, whose provinces
of ARMM per E. O. No. 36.
Includes 18,989 persons residing in the areas disputed by the
and 2,851 Filipinos in Philippine Embassies, Consulates and Mission Abroad.
Region IVA and Region IVB and transferring the province of Aurora to Region III.
Continued
Brgy.
XIII - Caraga Agusan del Norte Butuan City Agusan del Sur Dinagat Islandsg
Surigao del Norte Surigao del Sur
Basilan Lanao del Sur Maguindanao Sulu Tawi-tawi
Prov. - Province, Mun. - Municipality, Brgy. - BarangayAll cities shown on this table are Highly Urbanized Cities (HUCs)except Isabela City (Component City) in Region IX and Cotabato
(Basilan and Maguindanao) are under the regional jurisdiction
a Population counts for the regions do not add up to the national total.
City of Pasig (NCR) and the province of Rizal (Region IVA);
b Created under Executive Order No. 103 dividing Region IV into
REGIONS, PROVINCES,AND CITIES IN THE PHILIPPINES
Region, Province,Prov. City Mun. Population
and Highly Urbanized City (December 31, 2015) (May 1, 2010)
Concluded
Davao Region.
as SOCCSKSARGEN.
Region on May 29, 2015.
Proclamation No. 1637; ratified on December 18, 2008.
Brgy.
c As per Executive Order No. 36 reorganizing Region IX to be Zamboanga Peninsula.d As per Executive Order No. 36 reorganizing Region XI to be known
e As per Executive Order No. 36 reorganizing Region XII to be known
f Not a provinceg As of December 2, 2006 – RA 9355h As per Executive Order No. 183 establishment of Negros Island
1 Converted into a highly urbanized city under Presidential
Sources: NSO, 2010 Census of Population and DILG, National Barangay Operations Office
92
PSA CONTACT INFORMATION
LOOKINGLOOKINGFOR PSAFOR PSAON THE WEB?ON THE WEB?VISIT US ONVISIT US ON
INTERESTEDINTERESTED KNOWLEDGE MANAGEMENTIN OURIN OUR AND COMMUNICATIONS DIVISIONPUBLICATIONS?PUBLICATIONS?WRITE OR CALLWRITE OR CALL
TEL. NO. (632) 462-6600 LOCAL 839TELEFAX: 462-6600 LOCAL 833
DOING SOMEDOING SOME PSA LIBRARYRESEARCH WORK?RESEARCH WORK?VISIT OR CALLVISIT OR CALL EAST AVENUE, DILIMAN
QUEZON CITY 1101TEL.: 462-6600 LOCAL 839
ASKING ABOUTASKING ABOUT CIVIL REGISTRATION AND CENTRALBIRTH, MARRIAGEBIRTH, MARRIAGE SUPPORT SERVICESOR DEATHOR DEATH VIBAL BUILDING, TIMES STREETCERTIFICATES?CERTIFICATES? CORNER EDSA, QUEZON CITY 1104
TEL. NOS.: (632) 926-7294 (632) 926-7204
VISIT OR CONTACTVISIT OR CONTACT PSA HELPLINE PLUSTEL.: (632) 737-1111
Philippine Statistics Authority
WANT UPDATESWANT UPDATES PSA ON THE AIRAND THE LATESTAND THE LATESTNEWS ON PSA?NEWS ON PSA? PSA SERBILIS SA RADYO
DZRB-RADYO NG BAYAN (738 KHZ)EVERY SATURDAY, 6:15-7:00 AM
VERITAS SERBILIS SA BATASDZRV-RADIO VERITAS (846 KHZ)EVERY WEDNESDAY, 4:00-5:00 PM (WITH THE PUBLIC ATTORNEY'S OFFICE)
FACEBOOK:FACEBOOK:TWITTER:TWITTER:
http://www.psa.gov.ph
Email: [email protected]
5th/F PSA CVEA BLDG.
http://www.e-census.com.ph
https://www.facebook.com/PhilStatAuthorityhttps://twitter.com/PSAgovph

NOTES

![Scaling Law of Seismic Spectrum · et al. [1953], Asada [1953], Aki [1956], Kasa- hara [1957], Matumoto [1960], and others have shown that the period of the spectral peak for P waves,](https://img.pdfslide.us/doc/110x75/5ed776fd970471602179ce0d/scaling-law-of-seismic-et-al-1953-asada-1953-aki-1956-kasa-hara-1957.jpg)